Evaluation of Seasonal Groundwater Quality Changes Associated with Groundwater Pumping and Level Fluctuations in an Agricultural Area, Korea


 and
and
Abstract
1. Introduction
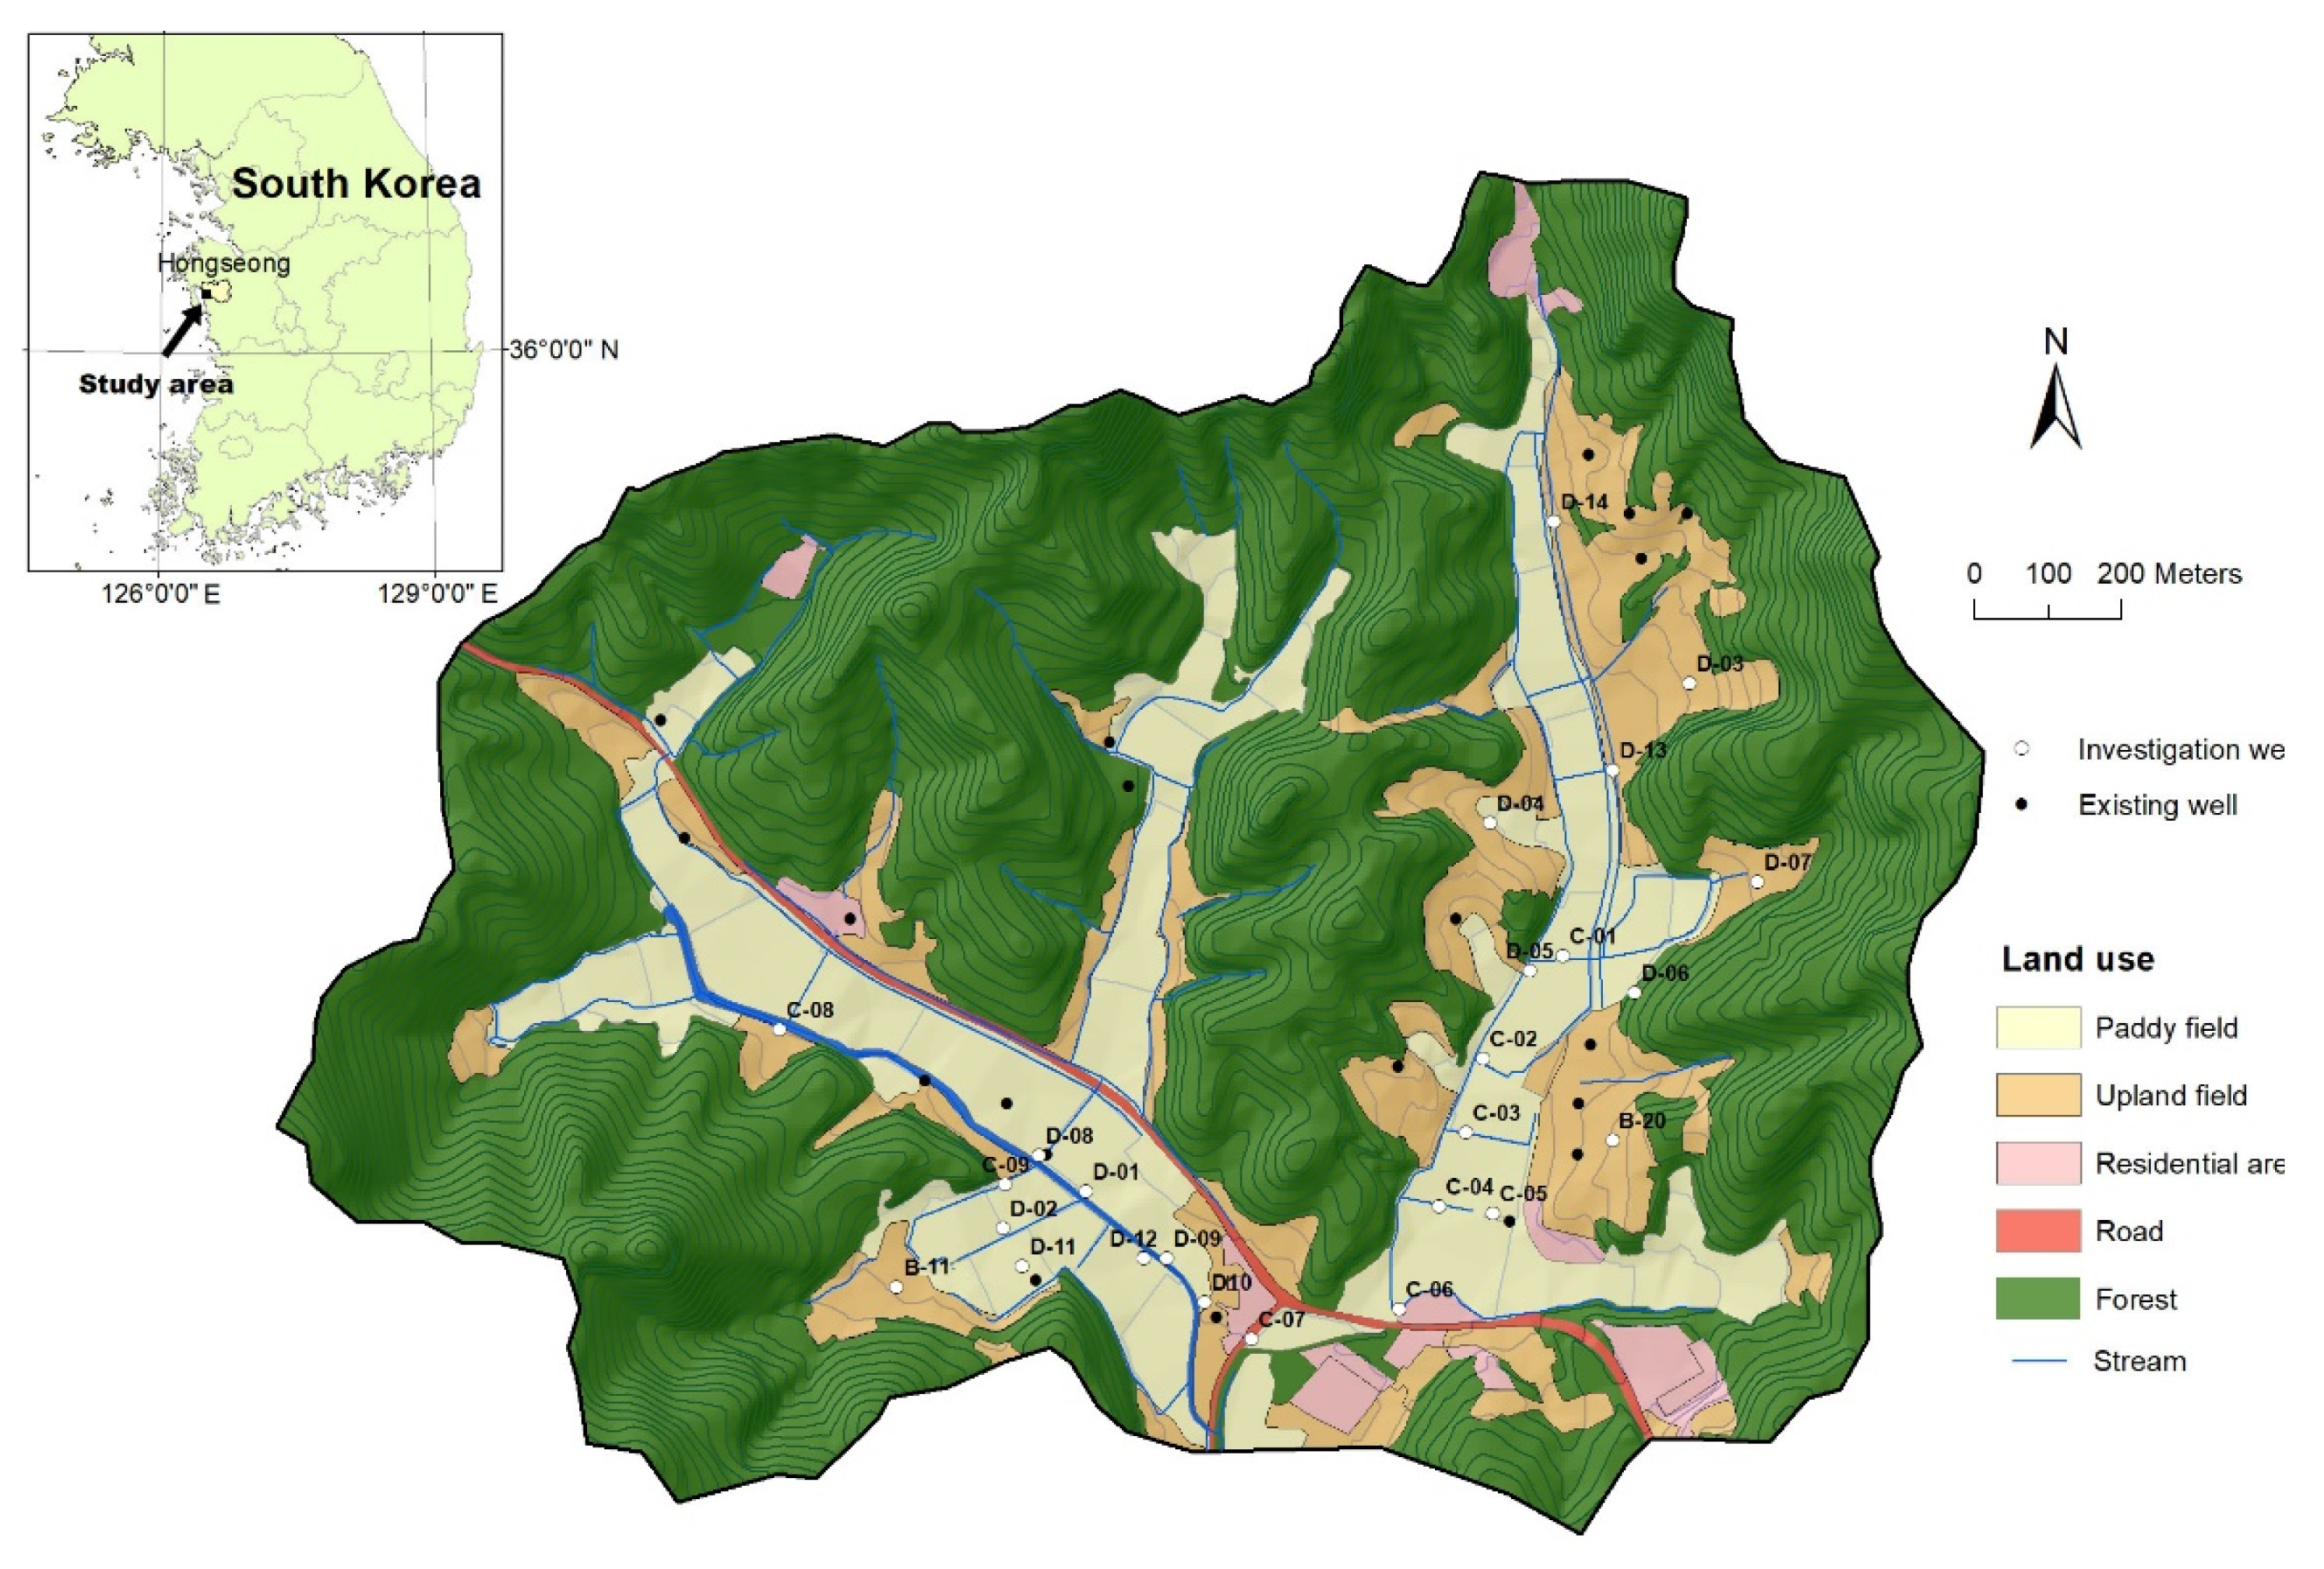
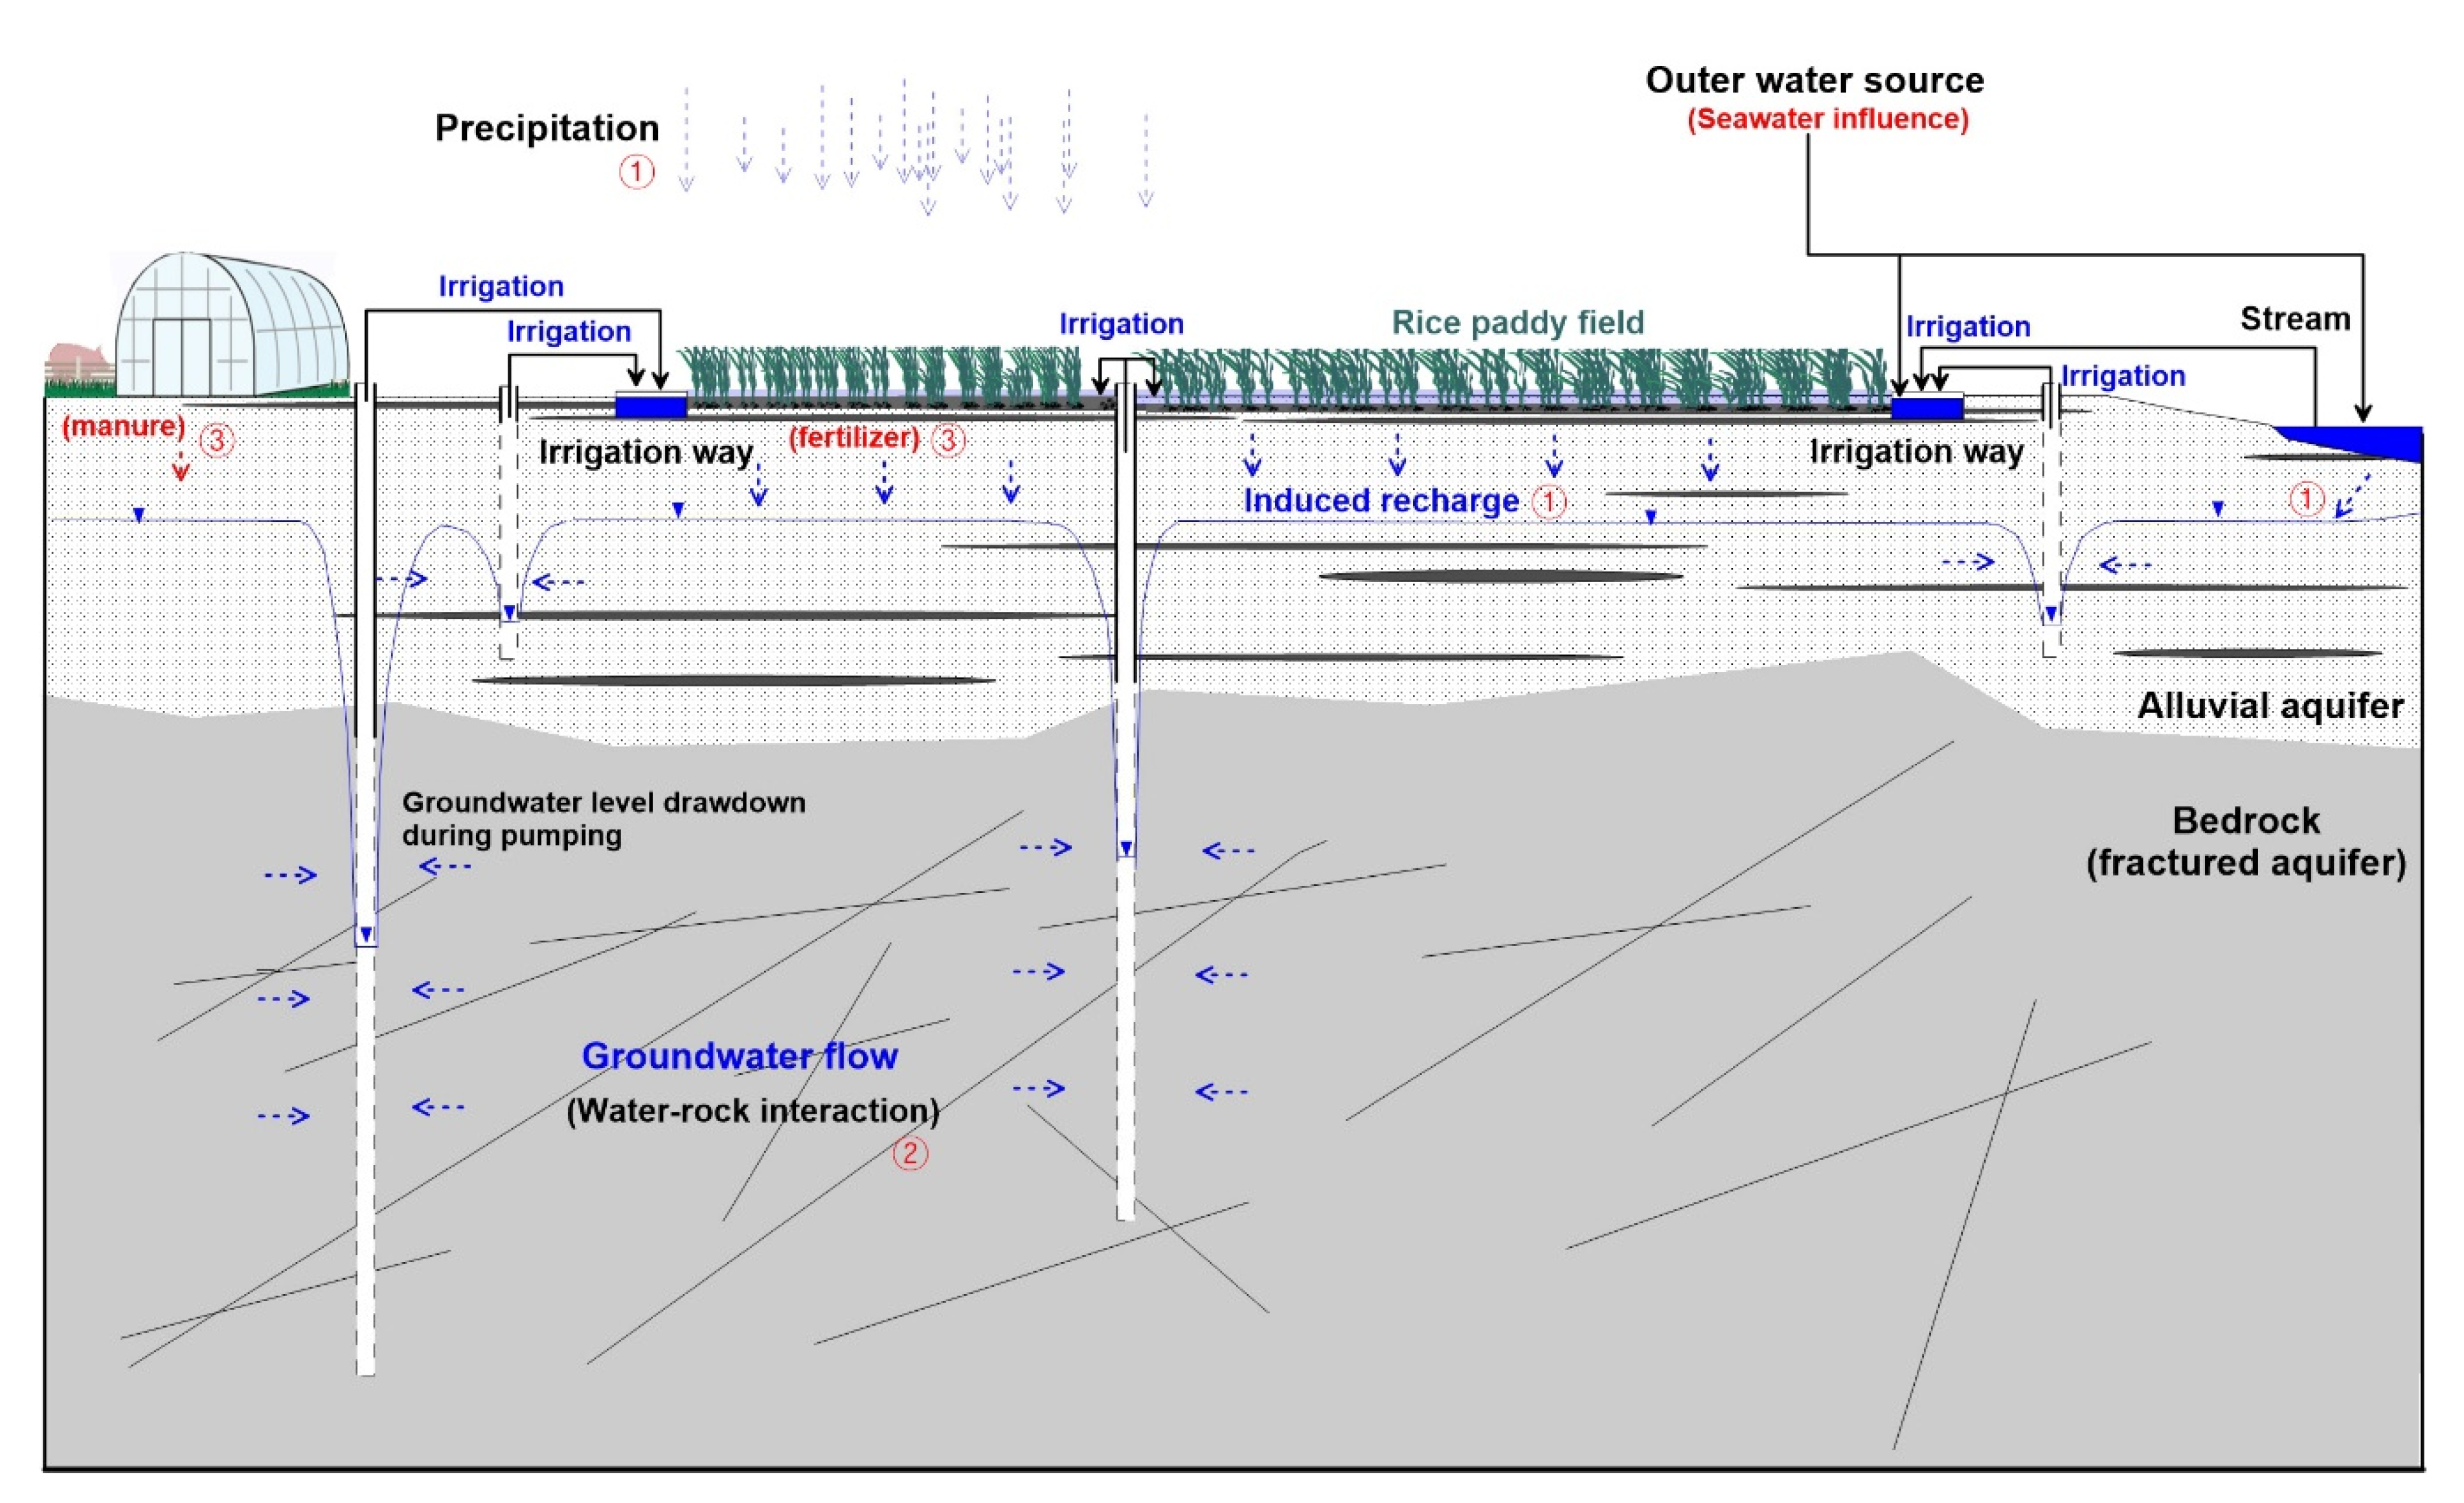
2. Study Area
3. Materials and Methods
3.1. Monitoring and Estimation of Seasonal Groundwater Use
3.2. Hydrochemical Analysis
3.3. Multivariate Statistical Analysis
4. Results and Discussion
4.1. Groundwater Level Monitoring and Groundwater Use
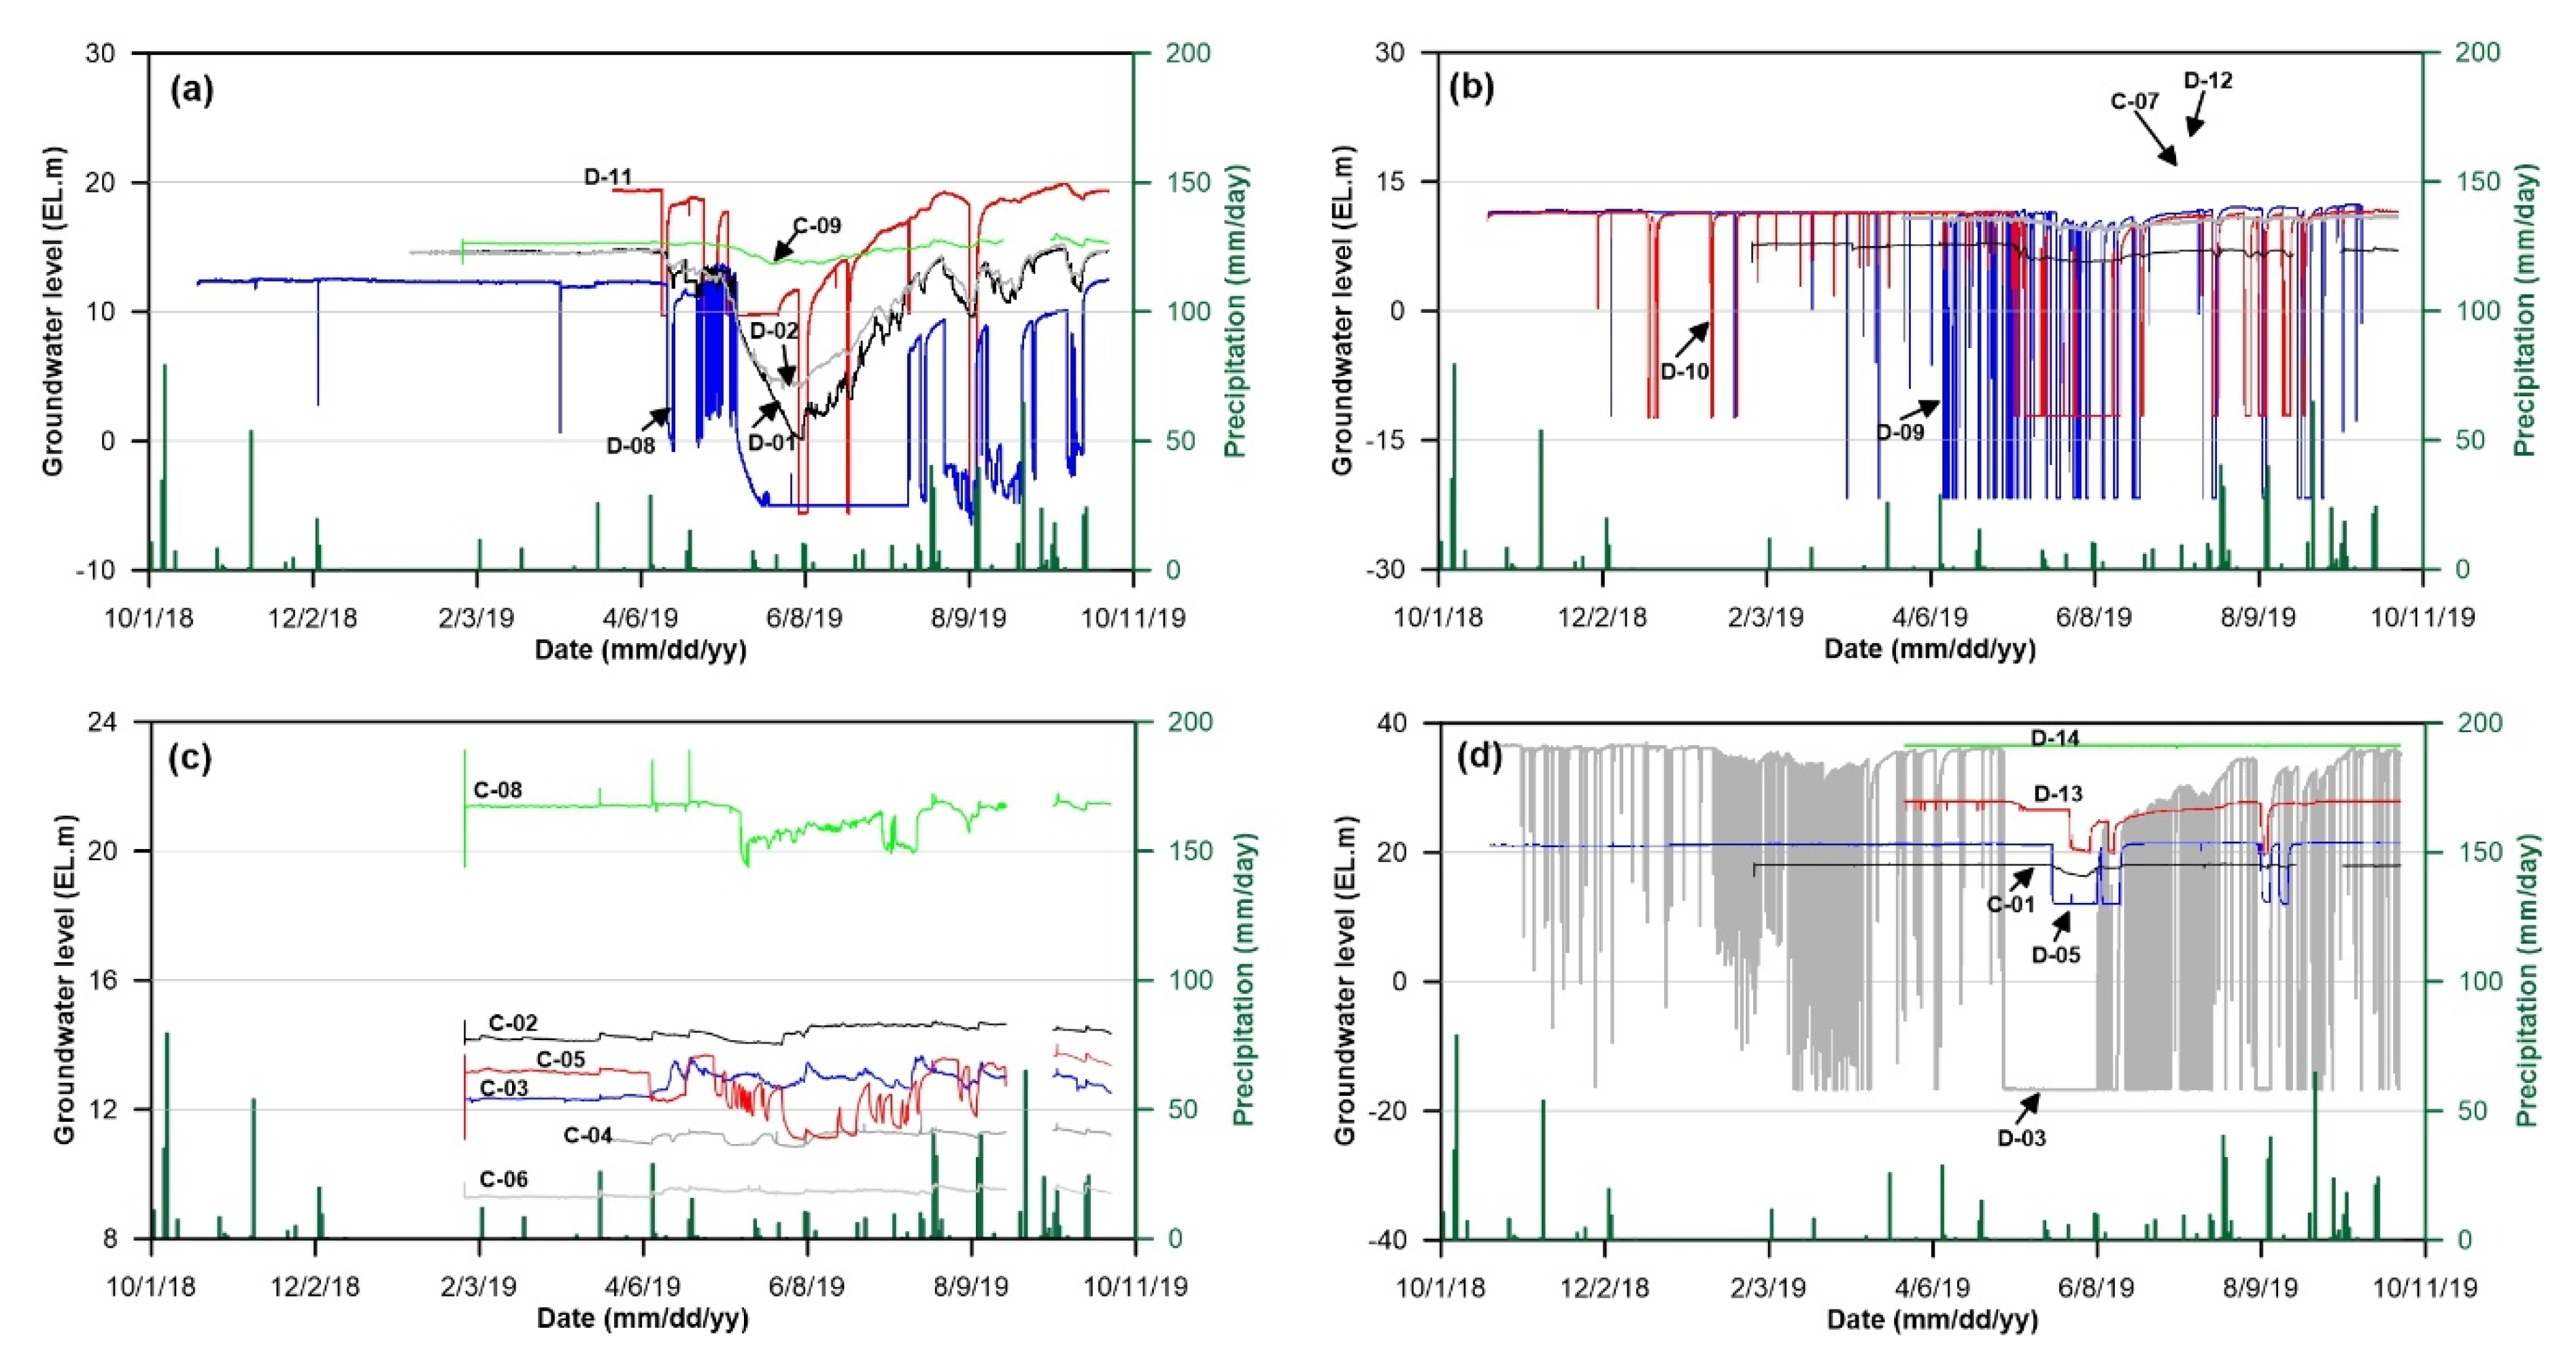
4.1.1. Groundwater Level Fluctuations
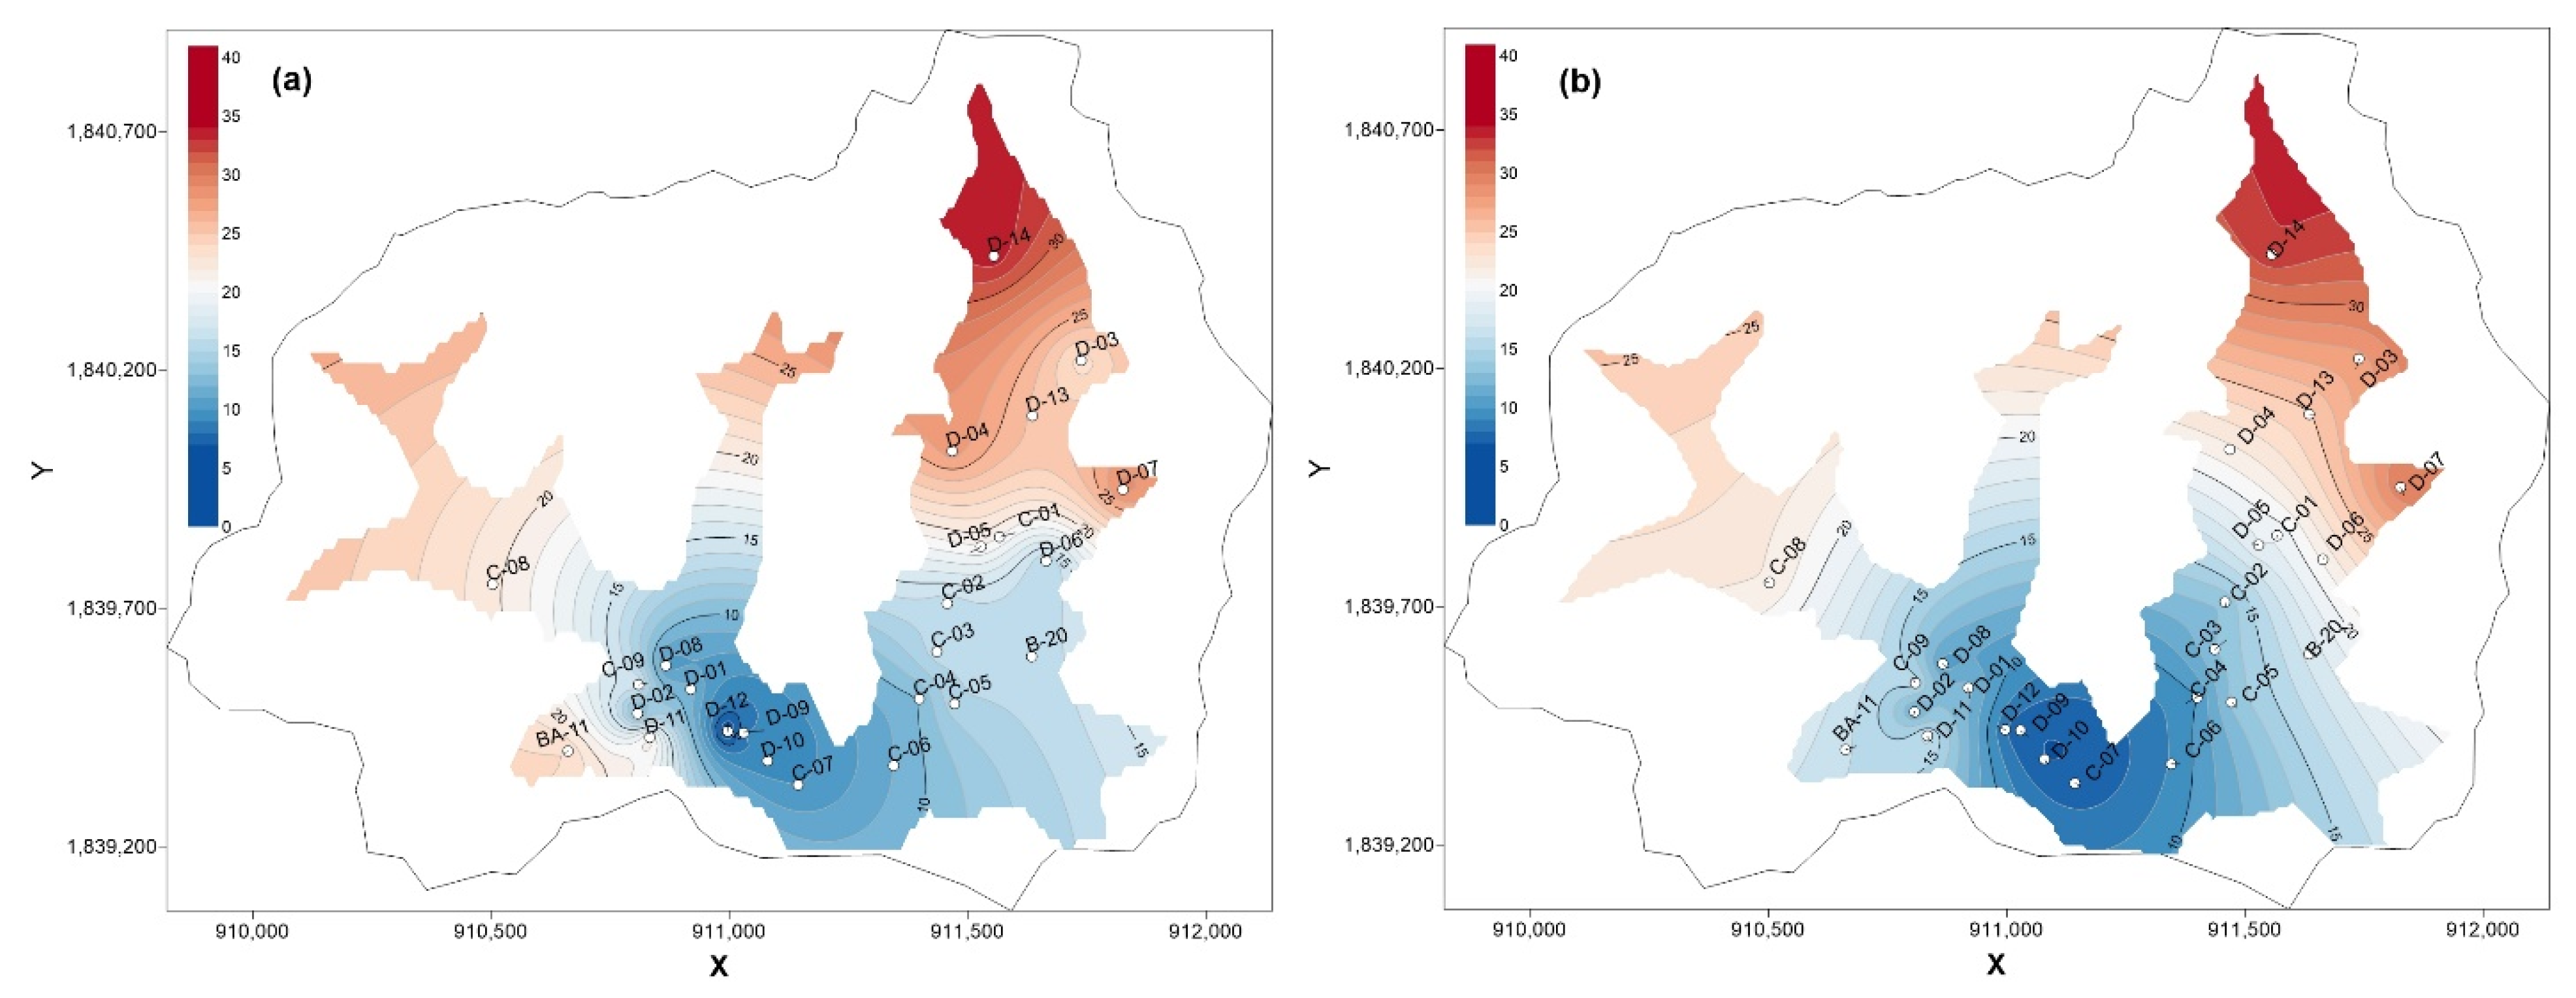
4.1.2. Spatial Distribution and Factors for Groundwater Level Changes
4.2. Monthly Groundwater Use
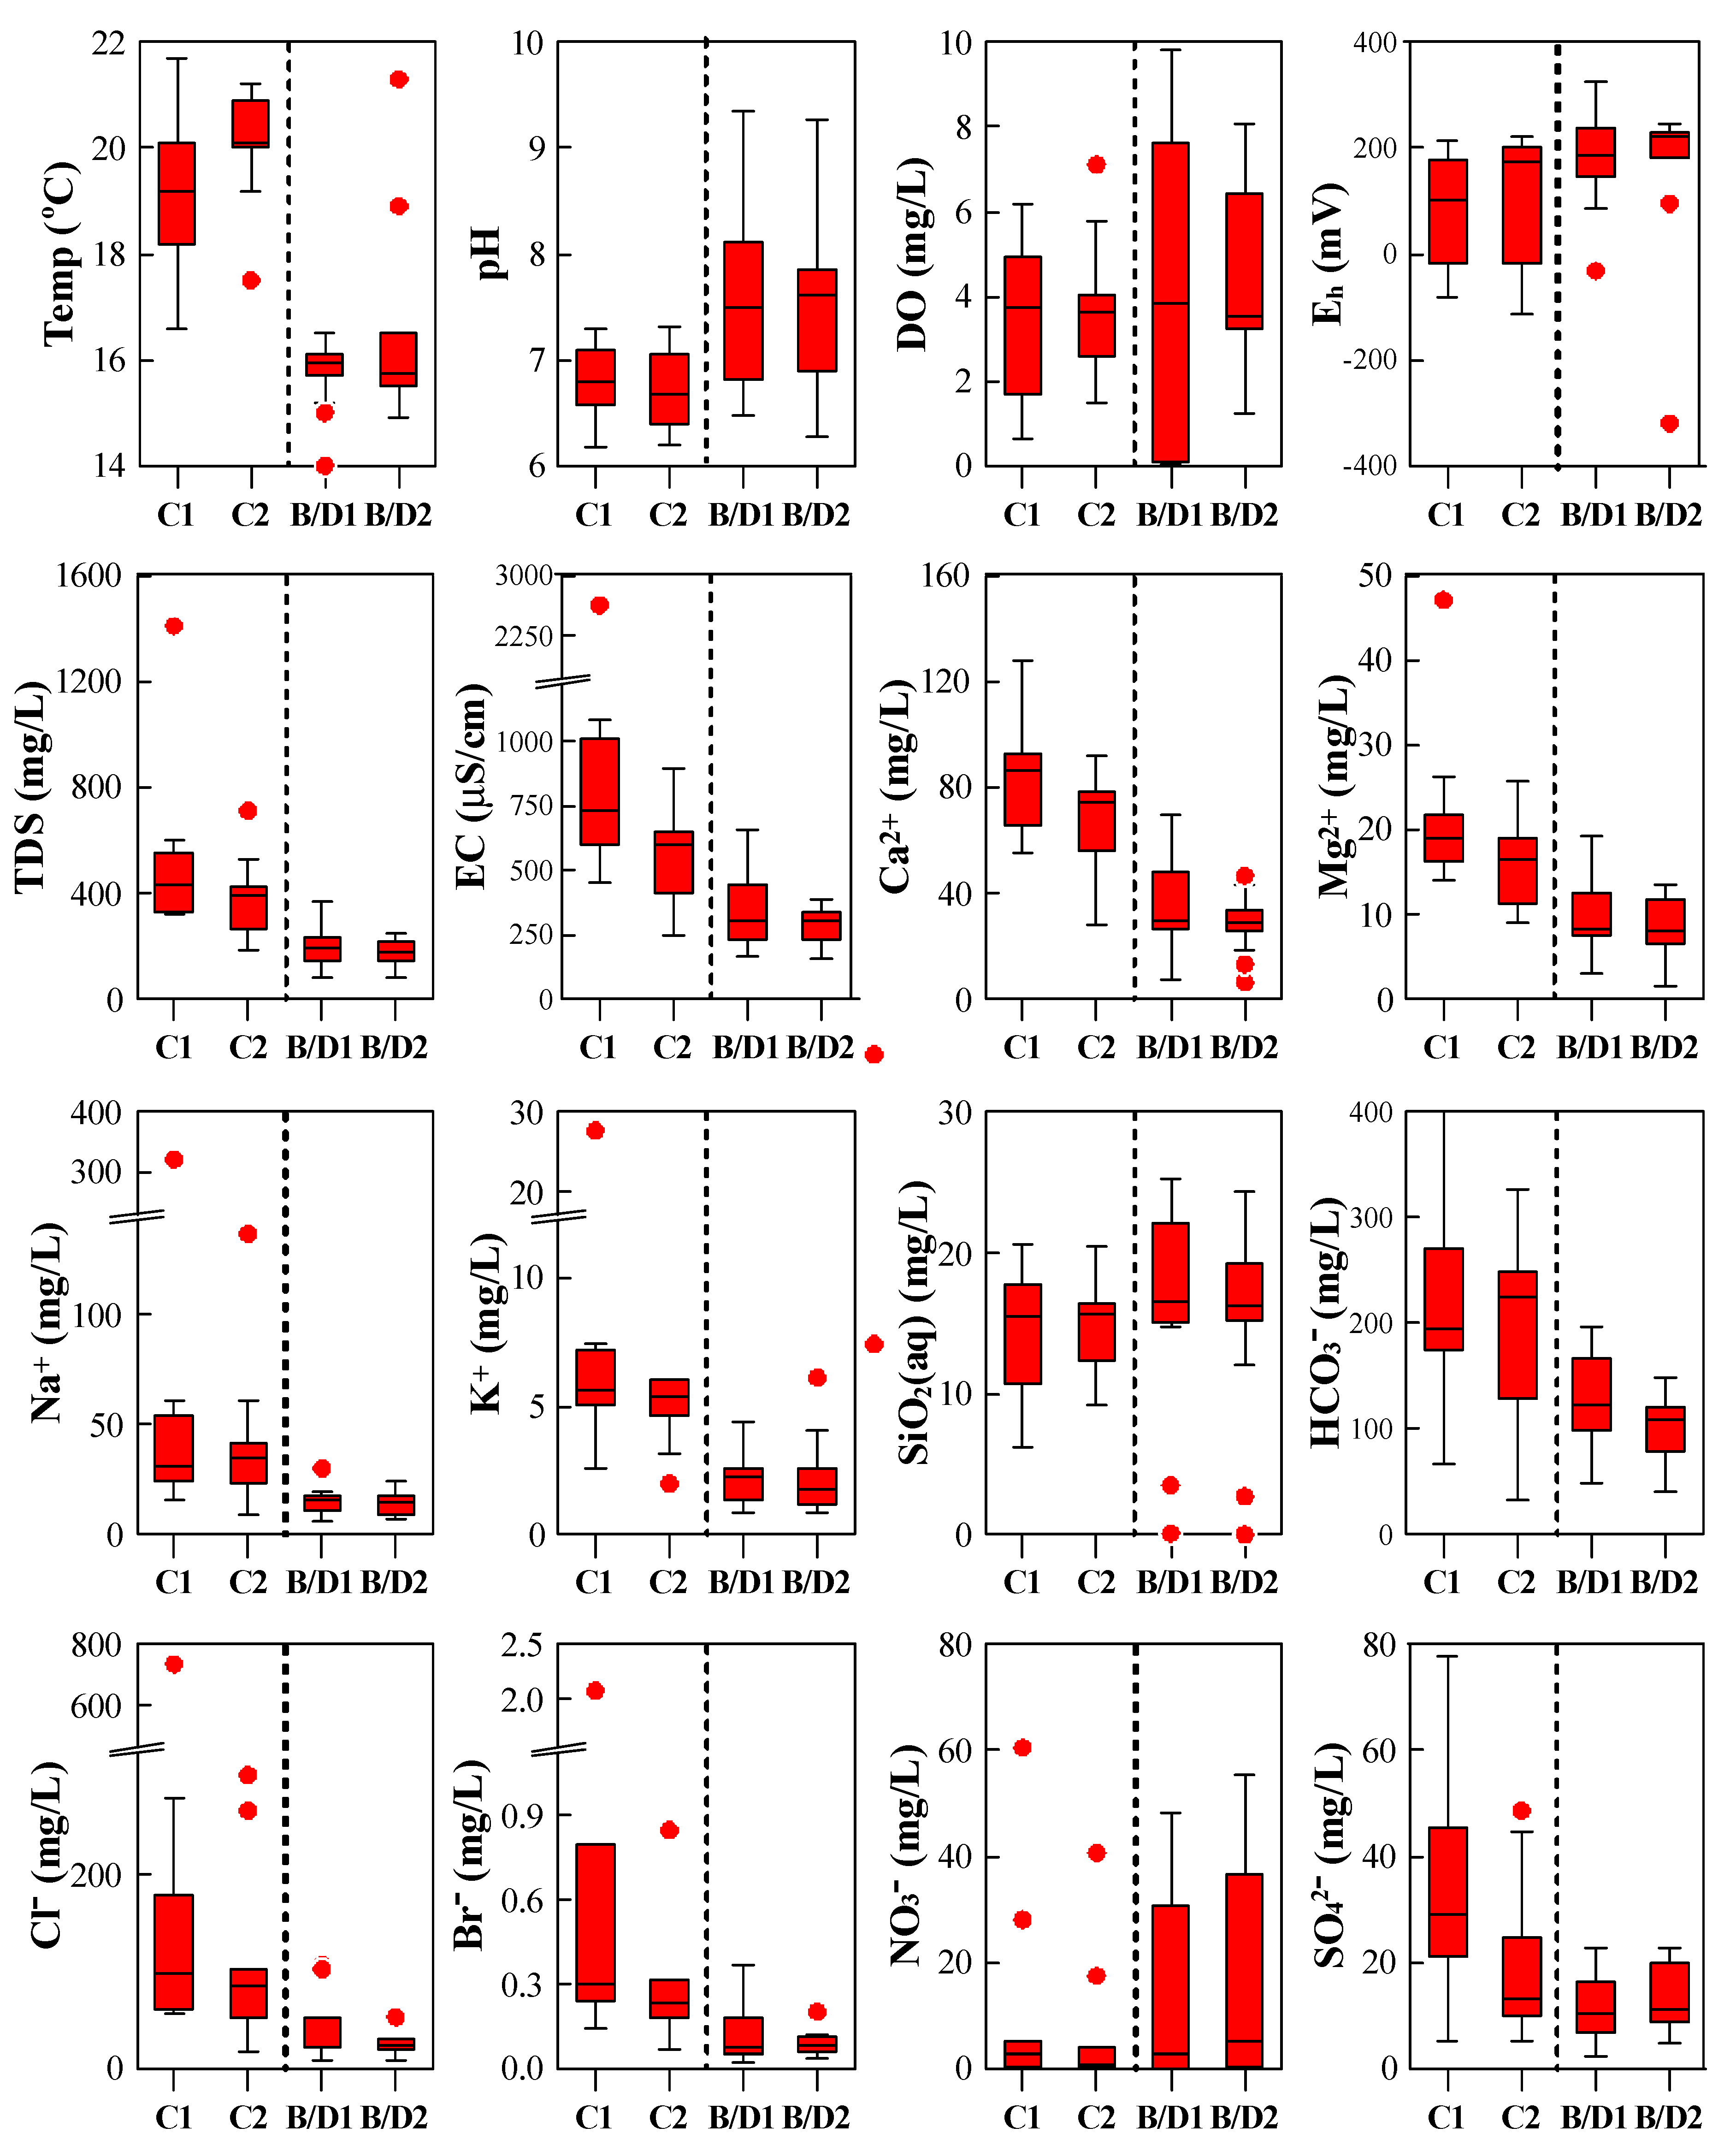
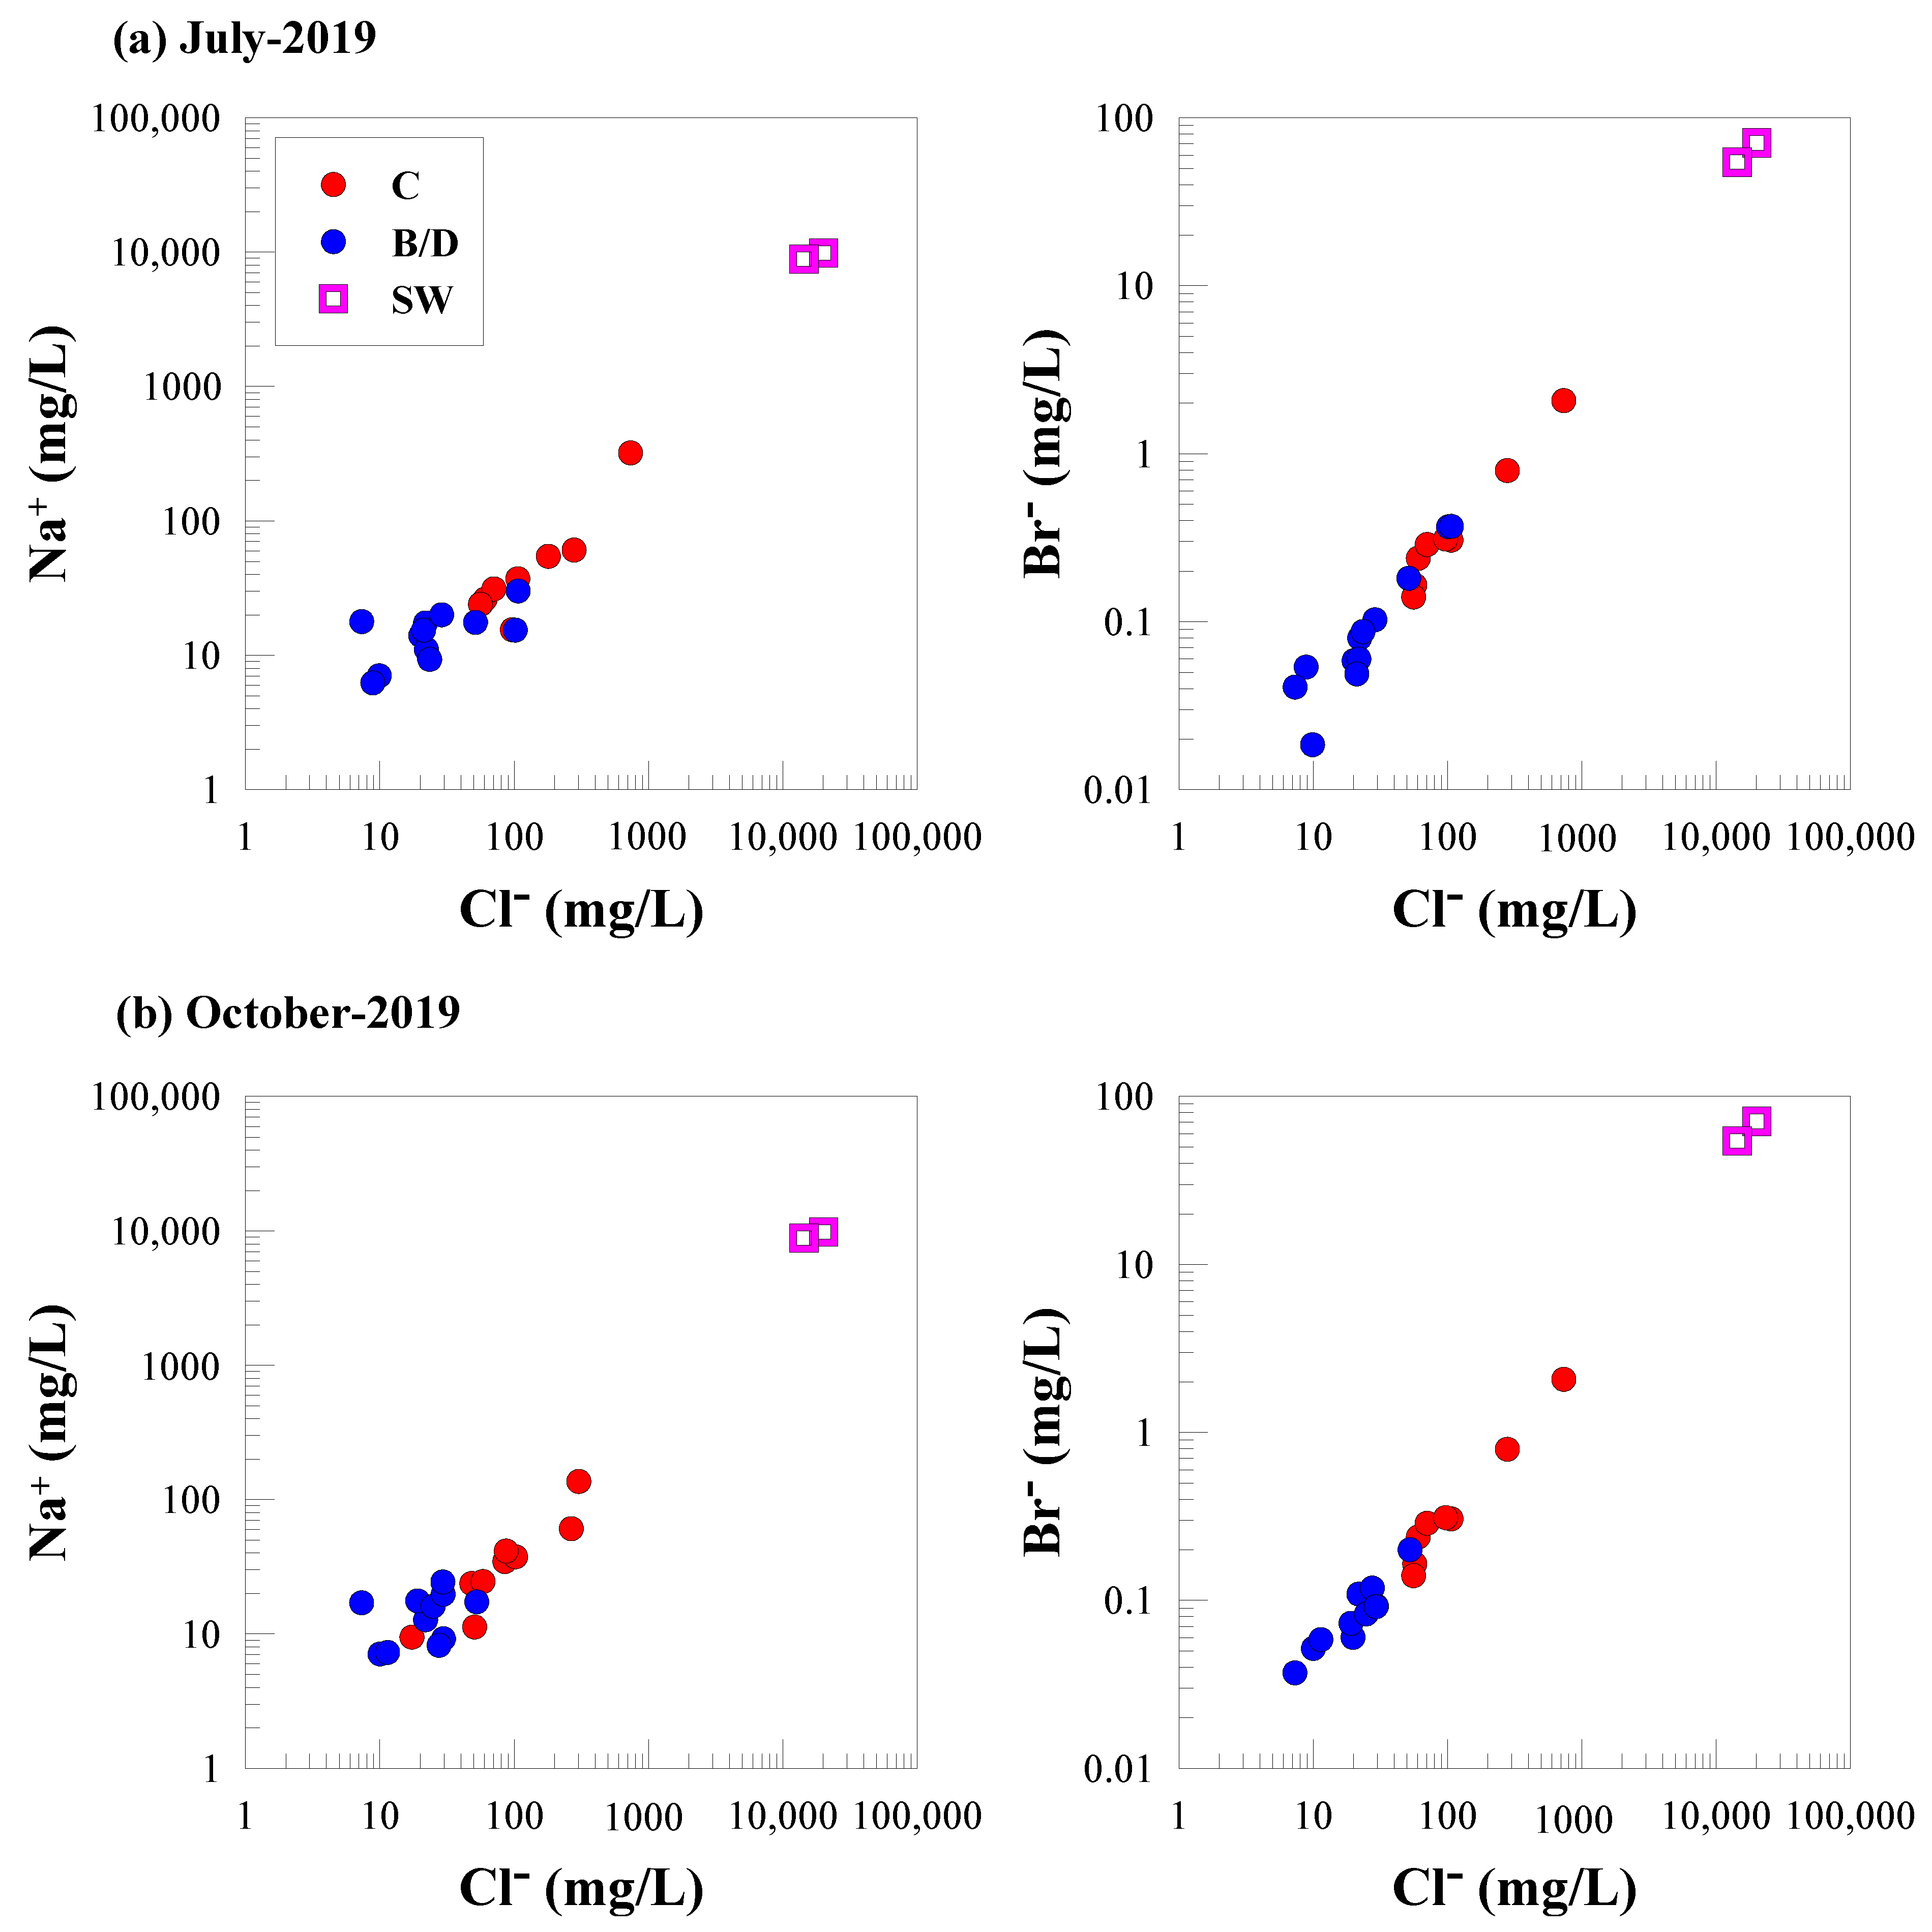
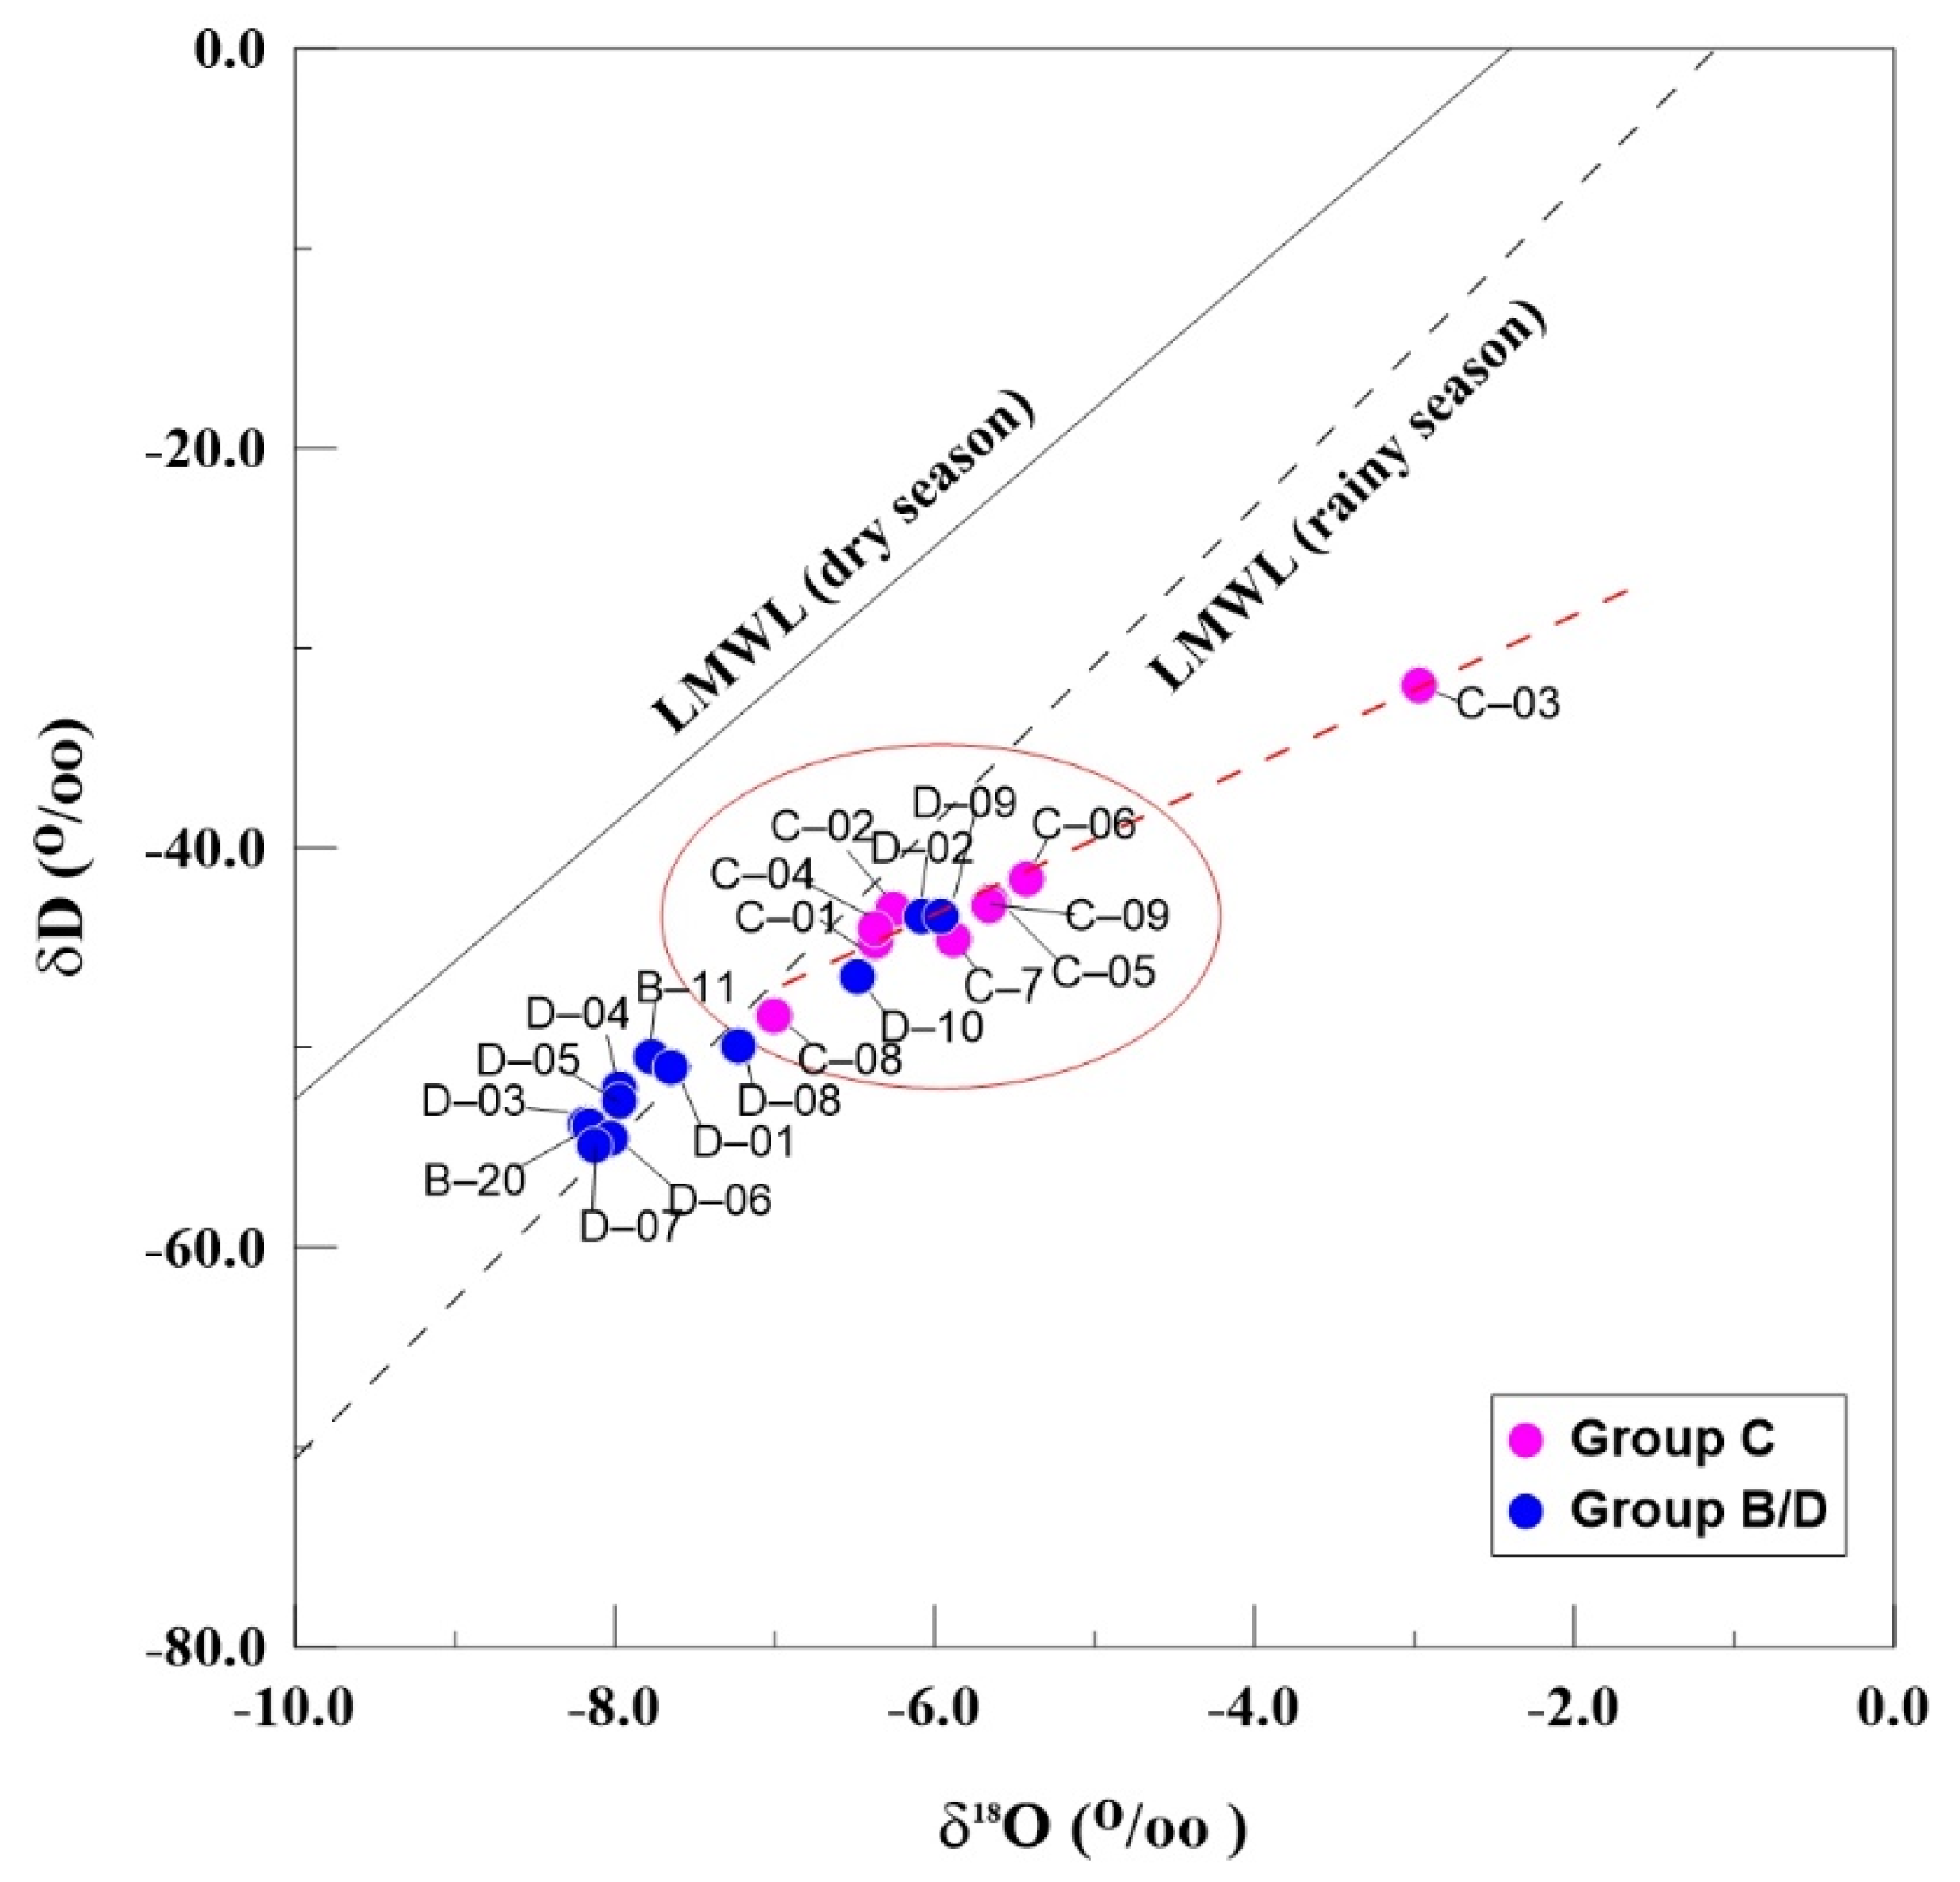
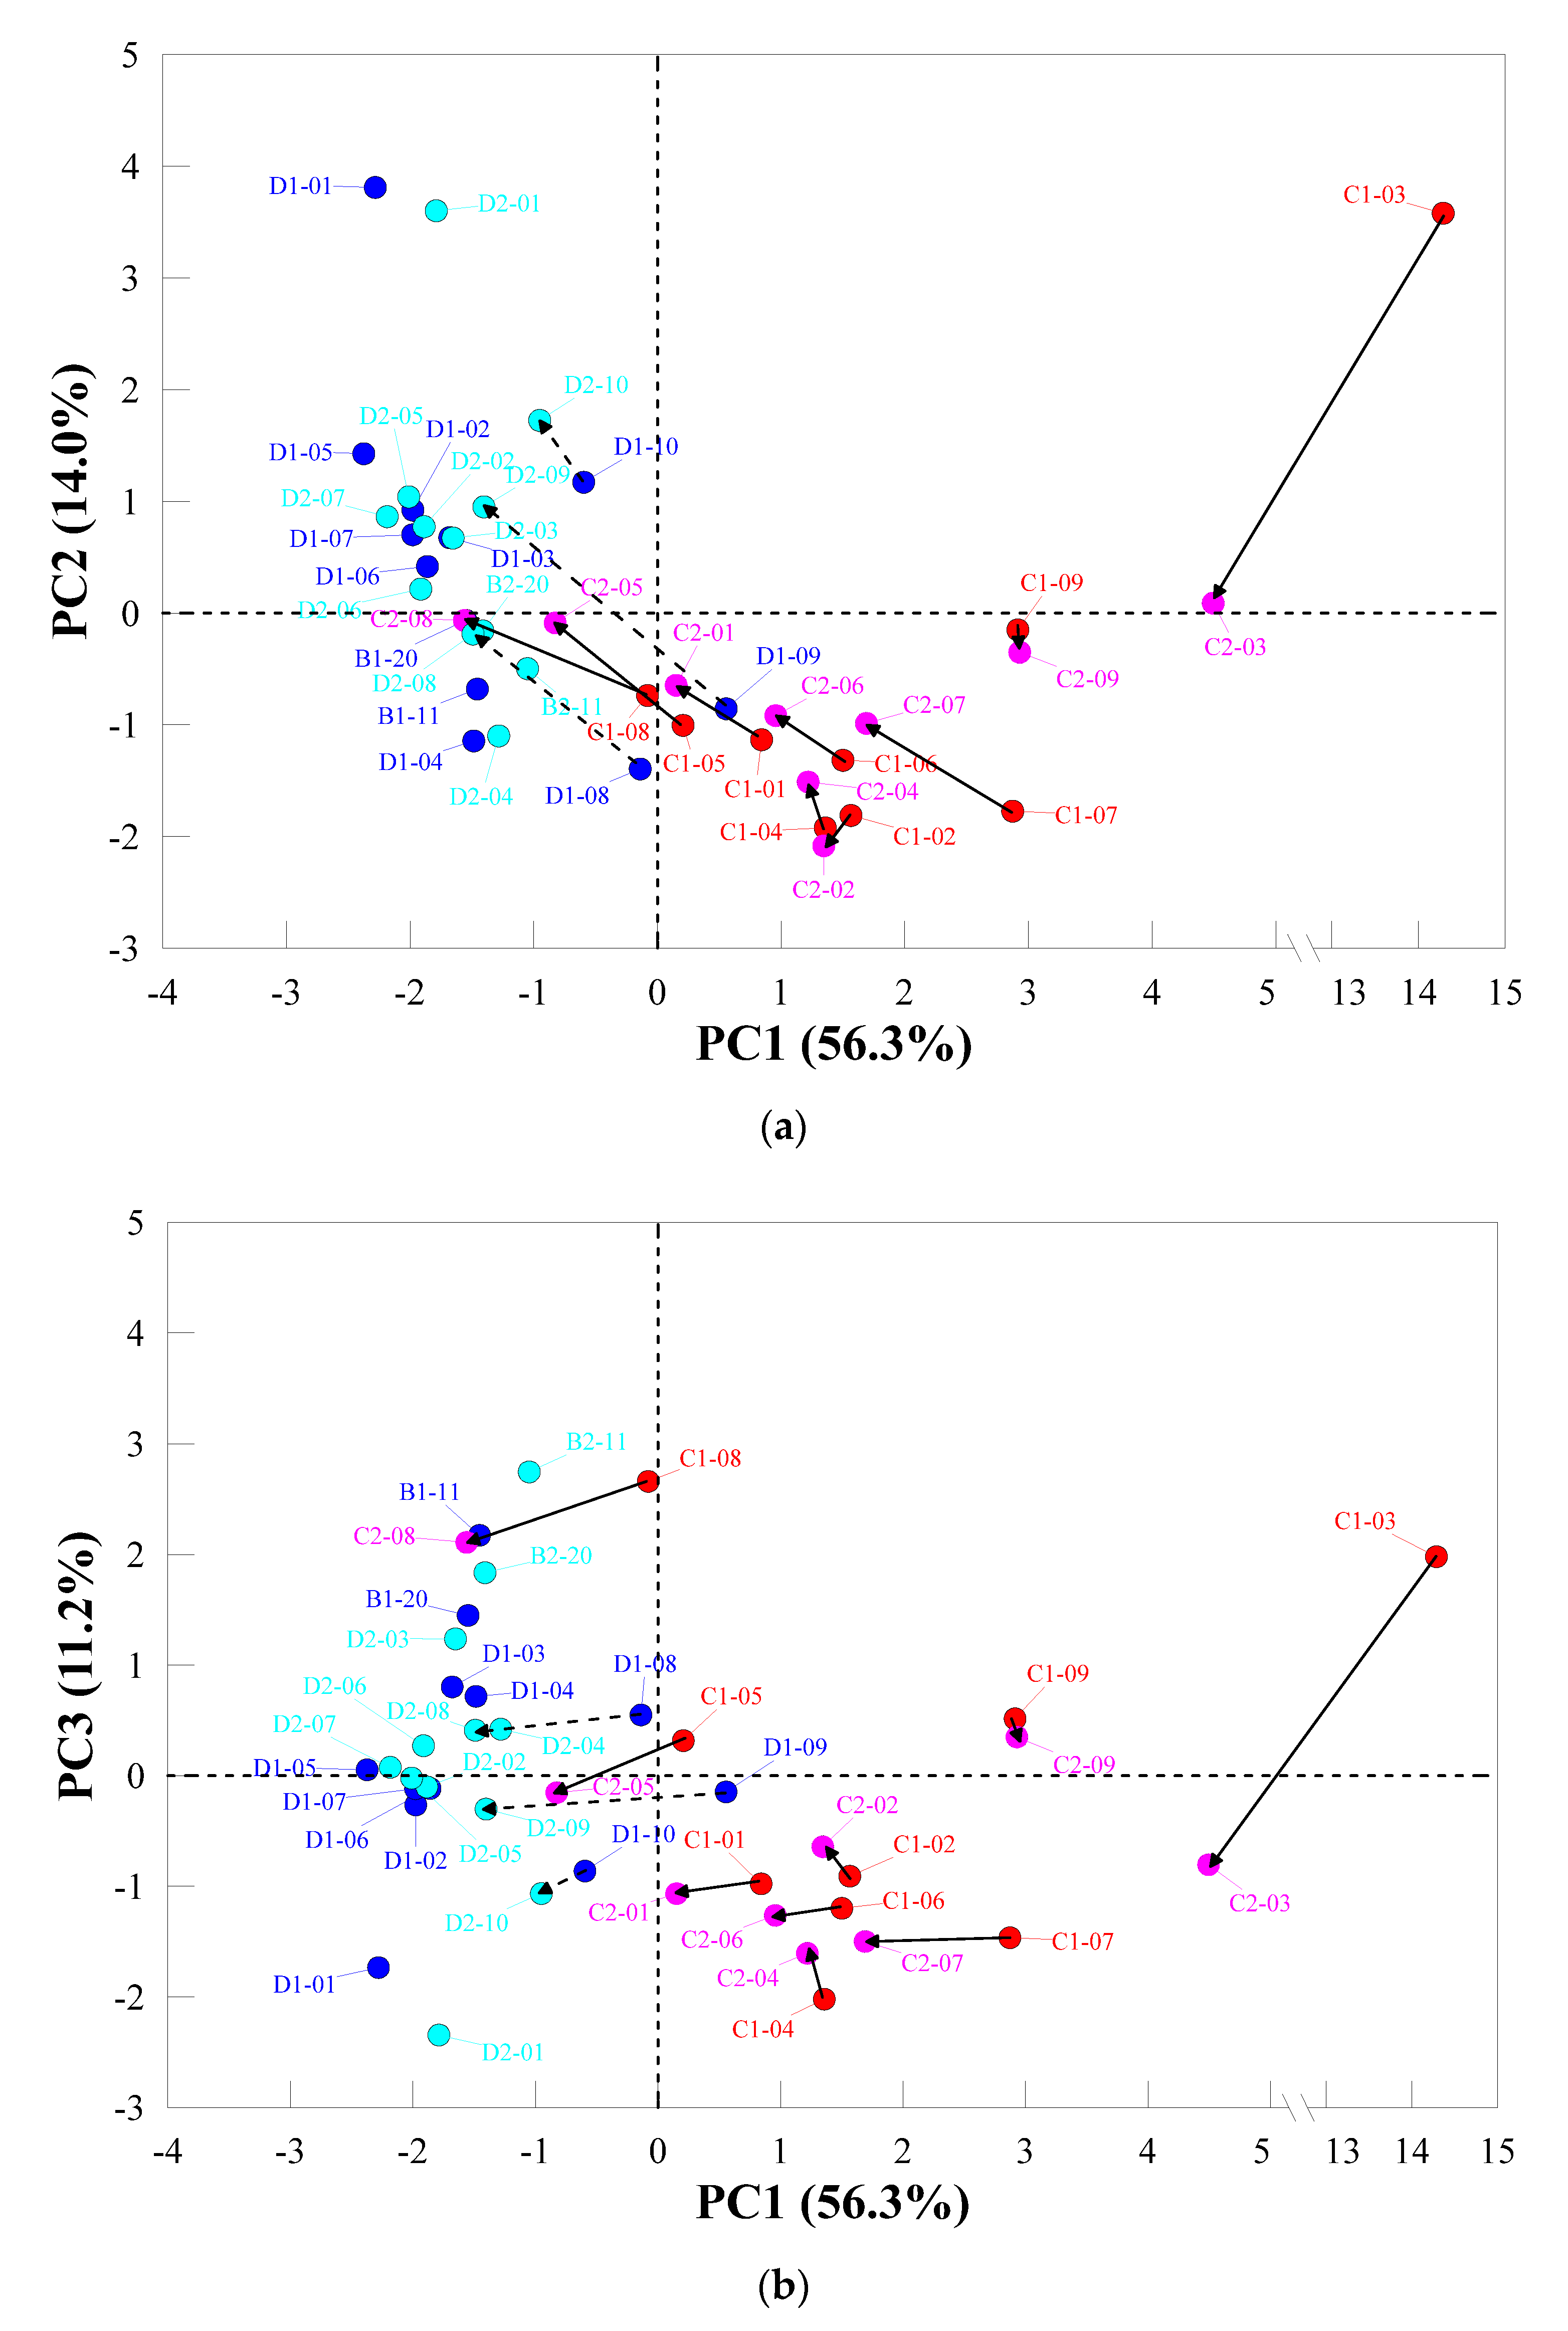
4.3. Hydrochemical Analysis and Groundwater Quality Evaluation
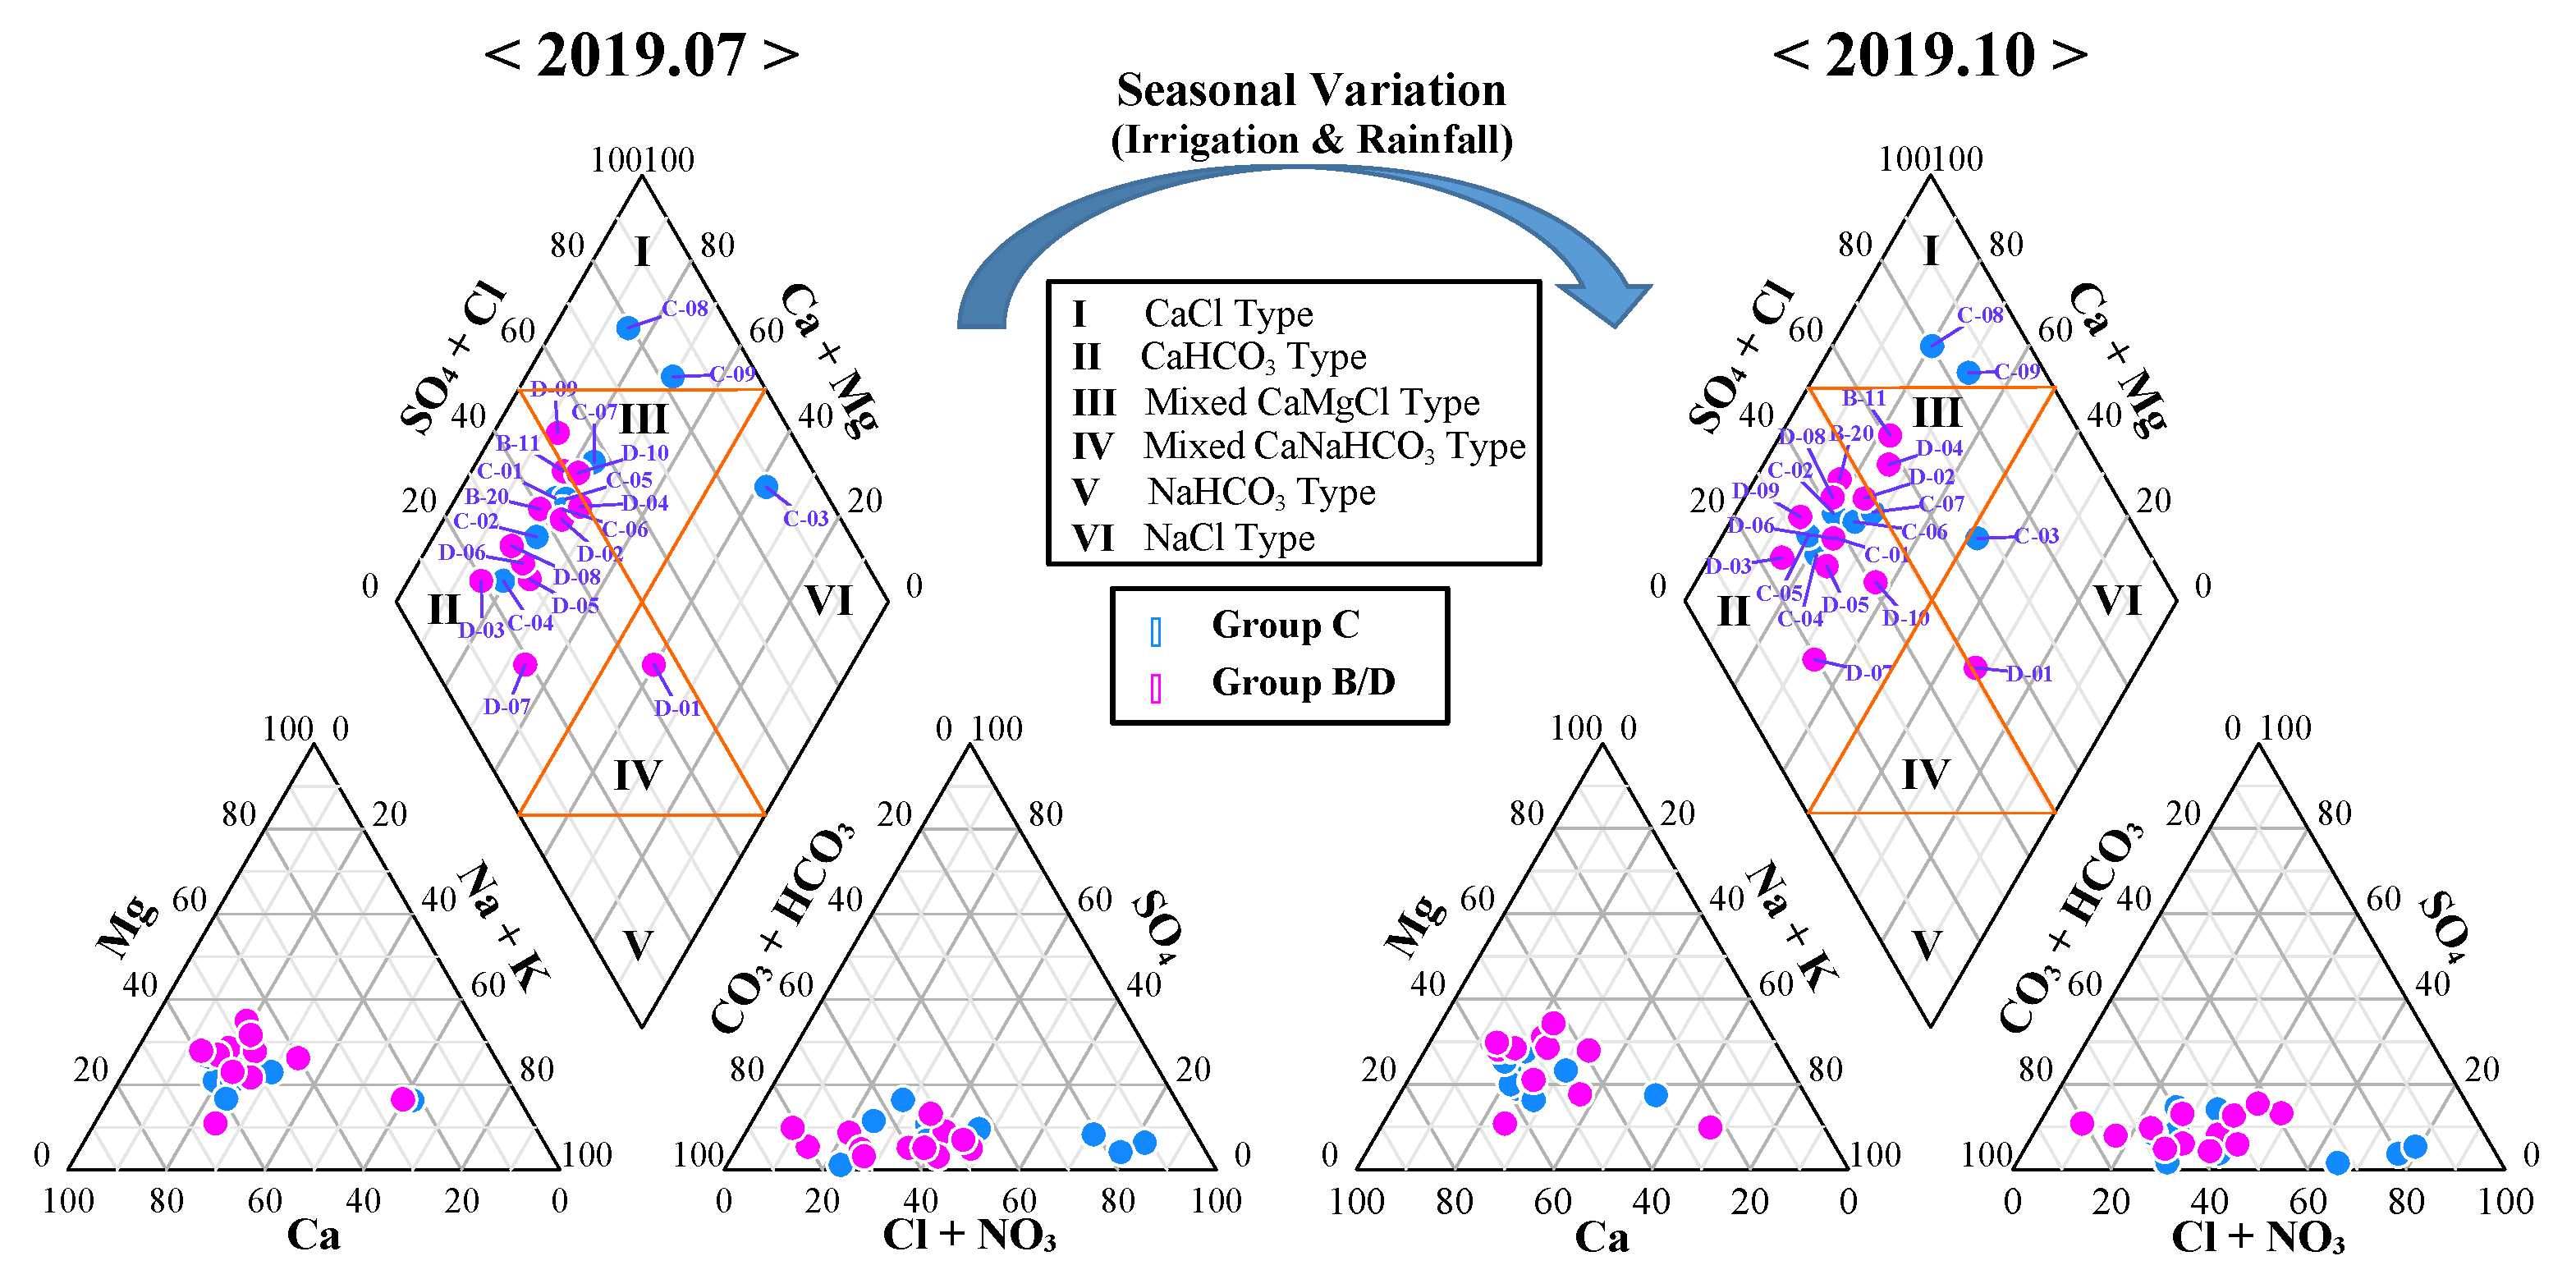
4.3.1. Groundwater Quality Changes and Water Types
4.3.2. Evaluation of Characteristics of Groundwater Quality
5. Conclusions
Author Contributions
Funding
Institutional Review Board Statement
Informed Consent Statement
Data Availability Statement
Conflicts of Interest
References
- Afsin, M. Hydrochemical evolution and water quality along the groundwater flow path in the Sandikli plain, Afyon. Turk. Environ. Geol. 1996, 31, 221–230. [Google Scholar]
- Ayotte, J.D.; Szabo, Z.; Focazio, M.J.; Eberts, S.M. Effects of human-induced alteration of groundwater flow on concentrations of naturally-occurring trace elements at water-supply wells. Appl. Geochem. 2011, 26, 747–762. [Google Scholar] [CrossRef]
- Ki, M.; Koh, D.-C.; Yoon, H.; Kim, H.-S. Temporal variability of nitrate concentration in groundwater affected by intensive agricultural activities in a rural area of Hongseong, South Korea. Environ. Earth Sci. 2015, 74, 6147–6161. [Google Scholar] [CrossRef]
- Kwon, H.-I.; Koh, D.-C.; Jung, Y.-Y.; Kim, D.-H.; Ha, K. Evaluating the impacts of intense seasonal groundwater pumping interactions in agricultural riparian zones using a multiparameter approach. J. Hydrol. 2020, 584, 1–15. [Google Scholar] [CrossRef]
- Alfarrah, N.; Walraevens, K. Groundwater overexploitation and seawater intrusion in coastal areas of arid and semi-arid regions. Water 2018, 10, 143. [Google Scholar] [CrossRef]
- Custodio, E. Effects of human activities on salt–fresh water relationships in coastal aquifers. In Studies and Reports in Hydrology: Groundwater Problems in Coastal Areas; Custodio, E., Bruggeman, G.A., Eds.; UNESCO: Paris, France, 1987; Chapter 4; pp. 97–117. [Google Scholar]
- Werner, A.D.; Bakker, M.; Post, V.E.A.; Vandenbohede, A.; Lu, C.; Ataie-Ashtiani, B.; Simmons, C.T.; Barry, D.A. Seawater intrusion processes, investigation and management: Recent advances and future challenges. Adv. Water Resour. 2013, 51, 3–26. [Google Scholar] [CrossRef]
- Kwon, H.-I.; Koh, D.-C.; Jung, B.; Ha, K. Quantification of seasonally variable water flux between aquifer and stream in the riparian zones with water curtain cultivation activities using numerical simulation. J. Geol. Soc. Korea 2017, 53, 277–290. [Google Scholar] [CrossRef]
- Maila, Y.A.; El-Nahal, I.; Al-Agha, M.R. Seasonal variations and mechanisms of groundwater nitrate pollution in the Gaza Strip. Environ. Geol. 2004, 47, 84–90. [Google Scholar] [CrossRef]
- Ritter, A.; Muñoz-Carpena, R.; Bosch, D.D.; Schaffer, B.; Potter, T.L. Agricultural land use and hydrology affect variability of shallow groundwater nitrate concentration in South Florida. Hydrol. Process 2007, 21, 2464–2473. [Google Scholar] [CrossRef]
- Rotiroti, M.; Bonomi, T.; Sacchi, E.; McArthur, J.M.; Stefania, G.A.; Zanotti, C.; Taviani, S.; Patelli, M.; Nava, V.; Soler, V.; et al. The effects of irrigation on groundwater quality and quantity in a human-modified hydro-system: The Oglio River basin, Po Plain, northern Italy. Sci. Total Environ. 2019, 672, 342–356. [Google Scholar] [CrossRef]
- Zhang, B.; Zhao, D.; Zhou, P.; Qu, S.; Liao, F.; Wang, G. Hydrochemical Characteristics of Groundwater and Dominant Water–Rock Interactions in the Delingha Area, Qaidam Basin, Northwest China. Water 2020, 12, 836. [Google Scholar] [CrossRef]
- Hiroshiro, Y.; Jinno, K.; Berndtsson, R. Hydrogeochemical properties of a salinity-affected coastal aquifer in western Japan. Hydrol. Process 2006, 20, 1425–1435. [Google Scholar] [CrossRef]
- Troudi, N.; Hamzaoui, F.; Zammouri, M.; Tzoraki, O. Assessment of groundwater quality for drinking purpose with special emphasis on salinity and nitrate contamination in the shallow aquifer of Guenniche (Northern Tunisia). Environ. Monit. Assess. 2020, 192, 641. [Google Scholar] [CrossRef] [PubMed]
- Kim, S.W.; Park, S.-I.; Ko, K.; Lee, H.-J.; Kihm, Y.H.; Lee, S.R. 1:100,000 Tectonostratigraphic Map of the Hongseong Area, Map 1: Solid Geology Interpretation; Korea Institute of Geoscience and Mineral Resources: Daejeon, Korea, 2014. [Google Scholar]
- Lee, B.J.; Kim, S.S. Explanatory Text of the Geological Map of Hong Seong Sheet (1:50,000); Geological Survey of Korea: Daejeon, Korea, 1963. (In Korean) [Google Scholar]
- Jung, Y.-Y.; Koh, D.-C.; Lee, J.; Ko, K.-S. Applications of Isotope Ratio Infrared Spectroscopy (IRIS) to Analysis of Stable Isotopic Compositions of Liquid Water. Econ. Environ. Geol. 2013, 46, 495–508. [Google Scholar] [CrossRef]
- Kiriyama, T.; Ichikawa, T. Preservation of groundwater basin recharging by paddy field. Proc. Hydraul. Eng. 2004, 48, 373–378. [Google Scholar] [CrossRef][Green Version]
- Tanaka, K.; Funakoshi, Y.; Hokamura, T.; Yamada, F. The role of paddy rice in recharging urban groundwater in the Shira River Basin. Paddy Water Environ. 2010, 8, 217–226. [Google Scholar] [CrossRef]
- Adarsh, S.; Thomas, G. Artificial groundwater recharge through rice (Oryza sativa L.) cultivation: A systematic review. Int. J. Chem. Stud. 2019, 7, 1856–1860. [Google Scholar]
- Kim, R.-H.; Kim, J.-H.; Ryu, J.-S.; Koh, D.-C. Hydrogeochemical characteristics of groundwater influenced by reclamation, seawater intrusion, and land use in the coastal area of Yeonggwang, Korea. Geosci. J. 2019, 23, 603–619. [Google Scholar] [CrossRef]
- Lee, K.-S.; Wenner, D.B.; Lee, I. Using H- and O-isotopic data for estimating the relative contributions of rainy and dry season precipitation to groundwater: Example from Cheju Island, Korea. J. Hydrol. 1999, 222, 65–74. [Google Scholar] [CrossRef]


| Well ID | X | Y | Elevation (m.a.s.l.) | * Usage | ** Main Aquifer | Well Depth (m) | Pump Permit (m3/day) | Automatic Monitoring | Hydrochemical Analysis |
|---|---|---|---|---|---|---|---|---|---|
| B-20 | 911,634 | 1,839,600 | 29.8 | A | B | 30 | 50 | × | ○ |
| B-11 | 910,662 | 1,839,400 | 29.5 | A | B | 75 | 50 | × | ○ |
| C-01 | 911,567 | 1,839,850 | 20.0 | M | Al | 13 | - | ○ | ○ |
| C-02 | 911,458 | 1,839,710 | 15.4 | M | Al | 23 | - | ○ | ○ |
| C-03 | 911,436 | 1,839,610 | 15.0 | M | Al | 15 | - | ○ | ○ |
| C-04 | 911,399 | 1,839,510 | 11.6 | M | Al | 16 | - | ○ | ○ |
| C-05 | 911,472 | 1,839,500 | 15.0 | M | Al | 18 | - | ○ | ○ |
| C-06 | 911,345 | 1,839,370 | 10.6 | M | B + Al | 52 | - | ○ | ○ |
| C-07 | 911,144 | 1,839,330 | 10.0 | M | B + Al | 52 | - | ○ | ○ |
| C-08 | 910,503 | 1,839,750 | 25.3 | M | Al | 20 | - | ○ | ○ |
| C-09 | 910,809 | 1,839,540 | 19.2 | M | Al | 18 | - | ○ | ○ |
| D-01 | 910,919 | 1,839,530 | 14.2 | M | B | 151 | - | ○ | ○ |
| D-02 | 910,807 | 1,839,480 | 20.0 | M | B | 151 | - | ○ | ○ |
| D-03 | 911,739 | 1,840,220 | 35.6 | A | B | 335 | 200 | ○ | ○ |
| D-04 | 911,468 | 1,840,030 | 31.3 | A | B | 40 | 30 | × | ○ |
| D-05 | 911,522 | 1,839,830 | 20.0 | A | B | 90 | 90 | ○ | ○ |
| D-06 | 911,664 | 1,839,800 | 25.5 | A | B | 90 | 140 | × | ○ |
| D-07 | 911,831 | 1,839,950 | 36.8 | A | B | 175 | 90 | × | ○ |
| D-08 | 910,855 | 1,839,579 | 15.0 | A | B | 103 | 220 | ○ | ○ |
| D-09 | 911,029 | 1,839,440 | 10.0 | A | B | 50 | 60 | ○ | ○ |
| D-10 | 911,080 | 1,839,380 | 10.3 | A | B | 100 | 135 | ○ | ○ |
| D-11 | 910,833 | 1,839,429 | 22.1 | M | B | >10 | - | ○ | × |
| D-12 | 910,997 | 1,839,442 | 10.3 | A | B | >10 | - | ○ | × |
| D-13 | 911,635 | 1,840,104 | 25.0 | M | Al | >10 | - | ○ | × |
| D-14 | 911,555 | 1,840,439 | 34.3 | M | Al | >10 | - | ○ | × |
| Date | D-03 | D-05 | D-08 | D-09 | D-10 |
|---|---|---|---|---|---|
| 18 October | 54 | - | - | - | - |
| 18 November | 118 | - | - | - | 23 |
| 18 December | 77 | - | 3 | 1 | 364 |
| 19 January | 469 | - | - | 2 | 172 |
| 19 February | 924 | - | - | 1 | 40 |
| 19 March | 597 | - | 2 | 11 | 28 |
| 19 April | 324 | - | 854 | 395 | 41 |
| 19 May | 8648 | 689 | 5322 | 460 | 5351 |
| 19 June | 1294 | 629 | 7440 | 614 | 580 |
| 19 July | 704 | 603 | 5042 | 141 | 225 |
| 19 August | 2035 | - | 5998 | 486 | 1613 |
| 19 September | 328 | - | 1755 | 114 | 53 |
| 19 October | 2 | - | - | - | - |
| Sum | 15574 | 1921 | 26417 | 2223 | 8490 |
| Survey | Well | Temp | pH | DO | Eh | EC | TDS | Ca2+ | Mg2+ | Na+ | K+ | Fe | Mn | SiO2 (aq) | Sr2+ | HCO3− | F− | Cl− | Br− | NO2− | NO3− | PO43− | SO42− | CBE |
|---|---|---|---|---|---|---|---|---|---|---|---|---|---|---|---|---|---|---|---|---|---|---|---|---|
| °C | mg/L | mV | μS/cm | mg/L | mg/L | mg/L | mg/L | mg/L | mg/L | mg/L | mg/L | mg/L | mg/L | mg/L | mg/L | mg/L | mg/L | mg/L | mg/L | mg/L | (%) | |||
| 17 July 2019 | B-11 | 16.1 | 6.48 | 5.05 | 179 | 309 | 201 | 26.9 | 12.4 | 11.1 | 2.5 | ND | ND | 22.1 | 0.17 | 99 | 0.1 | 22.2 | 0.1 | ND | 41.1 | ND | 13.9 | (4.8) |
| B-20 | 16.1 | 7.70 | 6.89 | 210 | 367 | 234 | 38.1 | 12.5 | 14.0 | 1.9 | ND | ND | 19.7 | 0.29 | 141 | 0.1 | 20.2 | 0.1 | ND | 48.1 | 0.1 | 9.7 | (3.6) | |
| C-01 | 20.5 | 6.74 | 3.73 | 94 | 595 | 319 | 65.2 | 13.9 | 24.2 | 2.6 | 0.1 | 1.5 | 14.2 | 0.65 | 194 | 0.1 | 57.1 | 0.2 | ND | 0.2 | ND | 45.4 | (2.0) | |
| C-02 | 19.9 | 6.57 | 1.90 | −17 | 728 | 381 | 70.8 | 17.8 | 26.1 | 7.4 | 8.6 | 4.6 | 17.7 | 0.44 | 271 | 0.1 | 60.7 | 0.2 | ND | 0.1 | ND | 38.4 | (2.5) | |
| C-03 | 21.7 | 6.79 | 4.92 | 151 | 2630 | 1409 | 103.9 | 47.1 | 320.6 | 27.6 | ND | 0.3 | 6.2 | 0.72 | 175 | 1.4 | 735.5 | 2.1 | ND | 2.6 | ND | 77.7 | (3.3) | |
| C-04 | 19.1 | 7.30 | 1.70 | −83 | 797 | 440 | 92.3 | 19.6 | 31.2 | 5.5 | 2.5 | 1.8 | 15.9 | 1.30 | 399 | 0.1 | 70.7 | 0.3 | ND | 0.0 | ND | 5.0 | (5.1) | |
| C-05 | 20.1 | 7.27 | 5.48 | 197 | 450 | 324 | 55.1 | 15.6 | 23.9 | 5.0 | ND | ND | 20.6 | 0.53 | 185 | 0.1 | 56.0 | 0.1 | ND | 28.0 | ND | 29.0 | (4.2) | |
| C-06 | 19.2 | 7.10 | 4.70 | −45 | 654 | 430 | 86.2 | 19.0 | 37.1 | 5.7 | 1.3 | 2.1 | 15.5 | 1.33 | 268 | 0.1 | 106.4 | 0.3 | ND | 0.2 | ND | 26.4 | (1.8) | |
| C-07 | 18.20 | 6.97 | 0.66 | 102 | 1008 | 600 | 127.8 | 21.8 | 54.5 | 7.2 | ND | ND | 10.0 | 0.72 | 291 | ND | 179.6 | ND | ND | 5.2 | ND | 50.6 | (1.1) | |
| C-08 | 17.6 | 6.33 | 6.19 | 213 | 569 | 324 | 58.7 | 16.3 | 15.5 | 3.4 | ND | ND | 18.6 | 0.28 | 66 | 0.1 | 97.0 | 0.3 | ND | 60.5 | ND | 21.0 | (2.0) | |
| C-09 | 16.6 | 6.17 | 1.65 | 177 | 1081 | 549 | 89.0 | 26.3 | 60.7 | 6.8 | ND | ND | 10.7 | ND | 107 | ND | 279.5 | 0.8 | ND | 2.8 | ND | 20.4 | (3.4) | |
| D-01 | 16.3 | 9.34 | 0.11 | 84 | 160 | 81 | 6.9 | 2.9 | 17.4 | 4.4 | ND | ND | 0.1 | ND | 50 | 0.2 | 21.9 | 0.1 | ND | ND | ND | 2.2 | (1.2) | |
| D-02 | 15.0 | 8.11 | 2.60 | −32 | 442 | 195 | 33.3 | 11.7 | 17.6 | 2.6 | ND | 0.2 | 3.5 | 0.20 | 132 | 0.1 | 51.6 | 0.2 | ND | 0.1 | ND | 9.6 | (5.1) | |
| D-03 | 16.1 | 7.65 | 7.34 | 266 | 219 | 141 | 26.3 | 7.7 | 7.0 | 1.3 | ND | ND | 15.7 | 0.22 | 125 | 0.1 | 9.9 | 0.0 | ND | 5.2 | ND | 6.7 | (5.5) | |
| D-04 | 14.0 | 6.68 | 9.81 | 327 | 290 | 188 | 29.0 | 7.3 | 15.4 | 2.5 | ND | ND | 15.1 | 0.16 | 97 | 0.1 | 21.1 | 0.0 | ND | 30.6 | ND | 19.5 | (5.0) | |
| D-05 | 15.7 | 7.93 | 0.04 | 148 | 353 | 226 | 47.7 | 4.9 | 20.0 | 1.3 | ND | 0.2 | 25.3 | 1.30 | 166 | 0.0 | 28.9 | 0.1 | ND | ND | ND | 16.2 | (2.4) | |
| D-06 | 16.5 | 7.34 | 7.60 | 196 | 164 | 87 | 12.9 | 5.3 | 6.2 | 0.8 | ND | ND | 14.8 | 0.15 | 59 | 0.1 | 8.9 | 0.1 | ND | 6.2 | ND | 3.2 | (0.3) | |
| D-07 | 16.0 | 8.24 | 8.74 | 237 | 227 | 139 | 19.1 | 7.6 | 17.8 | 0.9 | ND | ND | 16.9 | 2.29 | 117 | 0.3 | 7.3 | 0.0 | 0.026 | 0.3 | ND | 11.2 | 0.1 | |
| D-08 | 15.2 | 6.65 | 1.82 | 157 | 260 | 162 | 29.3 | 8.6 | 9.3 | 1.4 | ND | ND | 19.5 | 0.15 | 122 | 0.1 | 23.5 | 0.1 | ND | 6.1 | ND | 4.4 | (4.4) | |
| D-09 | 15.7 | 6.82 | 0.08 | 111 | 590 | 329 | 66.3 | 19.1 | 15.4 | 2.5 | ND | 0.7 | 23.3 | 0.43 | 175 | 0.0 | 102.0 | 0.4 | ND | ND | ND | 14.5 | (3.7) | |
| D-10 | 15.9 | 7.07 | 0.05 | 211 | 659 | 363 | 69.8 | 17.7 | 30.1 | 3.0 | ND | 0.3 | 7.6 | 0.98 | 196 | 0.1 | 107.0 | 0.4 | ND | ND | ND | 22.8 | (3.0) | |
| 1 October 2019 | B-11 | 16.1 | 6.28 | 5.26 | 224 | 335 | 214 | 29.7 | 12.0 | 12.8 | 6.1 | ND | ND | 20.0 | 0.15 | 75 | 0.1 | 21.9 | 0.1 | ND | 55.2 | 0.1 | 20.0 | 0.5 |
| B-20 | 15.7 | 7.58 | 6.40 | 229 | 388 | 245 | 43.0 | 13.5 | 14.4 | 2.0 | ND | ND | 19.2 | 0.39 | 128 | 0.0 | 19.8 | 0.1 | ND | 55.3 | 0.1 | 15.2 | 0.9 | |
| C-01 | 20.9 | 6.63 | 3.93 | 109 | 409 | 265 | 56.0 | 11.1 | 23.8 | 3.1 | ND | 0.9 | 12.4 | 0.50 | 180 | 0.1 | 48.3 | 0.2 | ND | 0.6 | ND | 20.7 | 0.7 | |
| C-02 | 21.2 | 6.39 | 1.50 | −17 | 601 | 357 | 69.3 | 16.4 | 24.6 | 5.3 | 3.2 | 4.9 | 20.5 | 0.40 | 231 | 0.1 | 58.6 | 0.2 | ND | 0.1 | ND | 44.8 | (2.0) | |
| C-03 | 20.1 | 6.78 | 2.33 | −113 | 1361 | 709 | 73.8 | 25.6 | 136.6 | 14.0 | 3.3 | 2.9 | 11.0 | 0.50 | 266 | 1.0 | 303.3 | 0.9 | ND | 0.2 | ND | 9.8 | (3.8) | |
| C-04 | 19.2 | 7.30 | 3.33 | −54 | 648 | 420 | 91.6 | 19.0 | 34.6 | 6.1 | 0.1 | 1.7 | 16.4 | 1.23 | 326 | 0.1 | 85.2 | 0.3 | ND | 0.2 | ND | 6.4 | (0.6) | |
| C-05 | 20.5 | 7.06 | 5.79 | 174 | 281 | 186 | 35.5 | 9.5 | 9.5 | 5.0 | ND | ND | 15.7 | 0.27 | 129 | 0.3 | 17.3 | 0.1 | ND | 17.3 | ND | 12.7 | (1.2) | |
| C-06 | 20.0 | 7.30 | 3.63 | 223 | 597 | 390 | 75.3 | 17.5 | 37.5 | 4.6 | 0.7 | 2.1 | 16.0 | 1.58 | 248 | 0.1 | 102.5 | 0.3 | ND | 0.4 | ND | 13.2 | (1.9) | |
| C-07 | 21.2 | 6.67 | 2.60 | 189 | 639 | 395 | 78.1 | 13.8 | 41.5 | 5.4 | ND | 1.7 | 9.2 | 0.70 | 224 | 0.1 | 87.3 | 0.2 | ND | 0.7 | ND | 48.6 | (1.3) | |
| C-08 | 17.5 | 6.19 | 7.10 | 220 | 243 | 180 | 27.6 | 8.9 | 11.3 | 2.0 | ND | ND | 17.9 | 0.14 | 33 | 0.1 | 50.8 | 0.2 | 0.0 | 40.7 | 0.1 | 4.9 | (1.5) | |
| C-09 | 20.1 | 6.29 | 4.05 | 203 | 898 | 529 | 83.1 | 25.6 | 60.8 | 6.0 | ND | 0.1 | 13.9 | 0.40 | 91 | 0.0 | 266.5 | 0.8 | 0.2 | 3.8 | ND | 24.8 | (2.9) | |
| D-01 | 21.3 | 9.26 | 3.59 | 94 | 153 | 78 | 6.0 | 1.6 | 17.6 | 4.1 | ND | ND | ND | 0.11 | 42 | 0.2 | 19.1 | 0.1 | ND | 0.1 | ND | 8.5 | (4.0) | |
| D-02 | 15.8 | 7.82 | 2.22 | −320 | 336 | 182 | 31.5 | 11.6 | 17.3 | 2.6 | ND | 0.2 | 2.7 | 0.27 | 109 | 0.1 | 52.7 | 0.2 | ND | 0.1 | ND | 9.9 | (2.0) | |
| D-03 | 15.3 | 7.59 | 4.40 | 228 | 228 | 139 | 26.7 | 8.0 | 7.1 | 1.3 | ND | ND | 15.4 | 0.22 | 110 | 0.0 | 10.0 | 0.1 | ND | 7.6 | ND | 9.1 | (1.5) | |
| D-04 | 16.5 | 6.64 | 8.07 | 247 | 313 | 197 | 32.2 | 7.7 | 16.1 | 2.6 | ND | ND | 15.2 | 0.17 | 80 | 0.1 | 24.9 | 0.1 | ND | 36.5 | ND | 22.8 | (1.2) | |
| D-05 | 18.9 | 7.85 | 3.50 | 225 | 352 | 216 | 46.4 | 4.7 | 19.7 | 1.2 | ND | ND | 24.4 | 1.28 | 148 | 0.1 | 29.6 | 0.1 | ND | 0.2 | ND | 16.9 | (0.3) | |
| D-06 | 14.9 | 6.90 | 7.35 | 229 | 160 | 100 | 12.9 | 6.3 | 7.3 | 1.1 | ND | ND | 17.3 | 0.12 | 59 | 0.1 | 11.4 | 0.1 | ND | 10.3 | ND | 4.6 | (1.7) | |
| D-07 | 15.5 | 8.08 | 3.21 | 217 | 222.5 | 138 | 17.9 | 7.8 | 17.1 | 0.9 | ND | 0.1 | 16.6 | 2.41 | 117 | 0.4 | 7.3 | 0.0 | ND | ND | ND | 12.3 | (2.1) | |
| D-08 | 15.2 | 6.54 | 1.25 | 95 | 238 | 145 | 25.9 | 8.3 | 9.2 | 1.2 | ND | 0.1 | 18.8 | 0.12 | 85 | 0.2 | 29.8 | ND | ND | 4.6 | ND | 5.0 | (0.3) | |
| D-09 | 15.7 | 7.68 | 2.60 | 201 | 289 | 168 | 33.1 | 10.6 | 8.2 | 1.6 | ND | ND | 15.9 | 0.38 | 121 | 0.1 | 27.6 | 0.1 | ND | 4.2 | ND | 7.0 | (0.9) | |
| D-10 | 16.2 | 7.64 | 3.29 | 180 | 332 | 188 | 28.0 | 6.5 | 24.4 | 2.2 | ND | ND | 12.0 | 0.82 | 119 | 0.3 | 29.5 | 0.1 | ND | 5.6 | ND | 20.7 | (4.1) |
| Change of Water Type | Groundwater Wells | |
|---|---|---|
| 19 July | 19 October | |
| CaCl (I) | CaCl (I) | C-08, C-09 |
| CaHCO3 (II) | CaHCO3 (II) | B-20, C-01, C-02, C-04, C-05, C-06, D-02, D-03, D-05, D-06, D-07, D-08 |
| CaHCO3 (II) | Mixed CaMgCl (III) | B-11, D-04 |
| Mixed CaMgCl (III) | CaHCO3 (II) | C-07, D-09, D-10 |
| Mixed CaNaHCO3 (IV) | NaCl (VI) | D-01 |
| NaCl (VI) | NaCl (VI) | C-03 |
| Variables | T | pH | DO | EC | Ca2+ | Mg2+ | Na+ | K+ | SiO2 (aq) | HCO3− | Cl− | NO3− | SO42− | Br− |
|---|---|---|---|---|---|---|---|---|---|---|---|---|---|---|
| T | 1.000 | |||||||||||||
| pH | –0.160 | 1.000 | ||||||||||||
| DO | 0.280 | –0.086 | 1.000 | |||||||||||
| EC | 0.492 | –0.329 | 0.766 | 1.000 | ||||||||||
| Ca2+ | 0.494 | –0.520 | 0.286 | 0.712 | 1.000 | |||||||||
| Mg2+ | 0.461 | –0.483 | 0.643 | 0.916 | 0.815 | 1.000 | ||||||||
| Na+ | 0.427 | –0.201 | 0.895 | 0.931 | 0.520 | 0.818 | 1.000 | |||||||
| K+ | 0.552 | –0.224 | 0.817 | 0.927 | 0.585 | 0.845 | 0.951 | 1.000 | ||||||
| SiO2 (aq) | –0.275 | –0.411 | –0.219 | –0.282 | 0.008 | –0.112 | –0.308 | –0.330 | 1.000 | |||||
| HCO3- | 0.429 | –0.266 | 0.037 | 0.415 | 0.770 | 0.484 | 0.245 | 0.340 | 0.097 | 1.000 | ||||
| Cl− | 0.416 | –0.311 | 0.816 | 0.950 | 0.629 | 0.902 | 0.959 | 0.920 | –0.291 | 0.232 | 1.000 | |||
| NO3− | –0.220 | –0.129 | –0.063 | –0.198 | –0.233 | –0.102 | –0.188 | –0.132 | 0.340 | –0.388 | –0.184 | 1.000 | ||
| SO42− | 0.516 | –0.416 | 0.591 | 0.665 | 0.632 | 0.633 | 0.626 | 0.648 | –0.109 | 0.337 | 0.621 | –0.087 | 1.000 | |
| Br− | 0.411 | –0.329 | 0.809 | 0.909 | 0.553 | 0.880 | 0.931 | 0.891 | –0.250 | 0.195 | 0.969 | –0.182 | 0.537 | 1.000 |
| Variable | PC1 | PC2 | PC3 | PC4 | PC5 |
|---|---|---|---|---|---|
| Eigenvalue | 7.887 | 1.957 | 1.566 | 0.775 | 0.527 |
| Variability (%) | 56.338 | 13.980 | 11.187 | 5.536 | 3.762 |
| Cumulative (%) | 56.338 | 70.319 | 81.506 | 87.042 | 90.803 |
| Factor Loadings | |||||
| T | 0.575 | –0.125 | –0.389 | 0.594 | –0.016 |
| pH | –0.380 | 0.667 | –0.392 | 0.024 | 0.409 |
| DO | 0.787 | 0.396 | 0.263 | –0.051 | 0.010 |
| EC | 0.972 | 0.052 | 0.020 | –0.064 | 0.067 |
| Ca2+ | 0.752 | –0.544 | –0.195 | –0.030 | 0.094 |
| Mg2+ | 0.935 | –0.170 | 0.099 | –0.086 | 0.105 |
| Na+ | 0.938 | 0.266 | 0.100 | –0.087 | 0.040 |
| K+ | 0.946 | 0.178 | 0.037 | 0.066 | 0.124 |
| SiO2 (aq) | –0.257 | –0.653 | 0.497 | –0.199 | 0.106 |
| HCO3− | 0.447 | –0.620 | –0.502 | –0.111 | 0.312 |
| Cl− | 0.956 | 0.174 | 0.124 | –0.123 | –0.022 |
| NO3− | –0.227 | –0.057 | 0.769 | 0.430 | 0.359 |
| SO42− | 0.743 | –0.175 | 0.050 | 0.342 | –0.280 |
| Br− | 0.923 | 0.188 | 0.157 | –0.160 | –0.037 |
| Group | Sample | PC1 | PC2 | PC3 |
|---|---|---|---|---|
| C | C-01 | ▼ 0.691 | ▲ 0.487 | ▼ 0.089 |
| C-02 | ▼ 0.220 | ▼ 0.272 | ▲ 0.266 | |
| C-03 | ▼ 9.792 | ▼ 3.490 | ▼ 2.785 | |
| C-04 | ▼ 0.139 | ▲ 0.411 | ▲ 0.414 | |
| C-05 | ▼ 1.034 | ▲ 0.917 | ▼ 0.471 | |
| C-06 | ▼ 0.543 | ▲ 0.400 | ▼ 0.064 | |
| C-07 | ▼ 1.182 | ▲ 0.786 | ▼ 0.034 | |
| C-08 | ▼ 1.482 | ▲ 0.672 | ▼ 0.551 | |
| C-09 | ▲ 0.015 | ▼ 0.201 | ▼ 0.165 | |
| B/D | B-20 | ▲ 0.138 | ▼ 0.095 | ▲ 0.386 |
| B-11 | ▲ 0.405 | ▲ 0.183 | ▲ 0.573 | |
| D-01 | ▲ 0.493 | ▼ 0.209 | ▼ 0.610 | |
| D-02 | ▲ 0.090 | ▼ 0.148 | ▲0.163 | |
| D-03 | ▲ 0.027 | ▼ 0.004 | ▲ 0.435 | |
| D-04 | ▲ 0.202 | ▲ 0.045 | ▼ 0.297 | |
| D-05 | ▲ 0.363 | ▼ 0.386 | ▼ 0.075 | |
| D-06 | ▼ 0.054 | ▼ 0.203 | ▲ 0.387 | |
| D-07 | ▼ 0.206 | ▲ 0.162 | ▲ 0.192 | |
| D-08 | ▼ 1.352 | ▲ 1.209 | ▼ 0.138 | |
| D-09 | ▼ 1.959 | ▲ 1.807 | ▼ 0.155 | |
| D-10 | ▼ 0.356 | ▲ 0.553 | ▼ 0.203 |
Publisher’s Note: MDPI stays neutral with regard to jurisdictional claims in published maps and institutional affiliations. |
© 2020 by the authors. Licensee MDPI, Basel, Switzerland. This article is an open access article distributed under the terms and conditions of the Creative Commons Attribution (CC BY) license (http://creativecommons.org/licenses/by/4.0/).
Share and Cite
Ha, K.; Lee, E.; An, H.; Kim, S.; Park, C.; Kim, G.-B.; Ko, K.-S. Evaluation of Seasonal Groundwater Quality Changes Associated with Groundwater Pumping and Level Fluctuations in an Agricultural Area, Korea. Water 2021, 13, 51. https://doi.org/10.3390/w13010051
Ha K, Lee E, An H, Kim S, Park C, Kim G-B, Ko K-S. Evaluation of Seasonal Groundwater Quality Changes Associated with Groundwater Pumping and Level Fluctuations in an Agricultural Area, Korea. Water. 2021; 13(1):51. https://doi.org/10.3390/w13010051
Chicago/Turabian StyleHa, Kyoochul, Eunhee Lee, Hyowon An, Sunghyun Kim, Changhui Park, Gyoo-Bum Kim, and Kyung-Seok Ko. 2021. "Evaluation of Seasonal Groundwater Quality Changes Associated with Groundwater Pumping and Level Fluctuations in an Agricultural Area, Korea" Water 13, no. 1: 51. https://doi.org/10.3390/w13010051
APA StyleHa, K., Lee, E., An, H., Kim, S., Park, C., Kim, G.-B., & Ko, K.-S. (2021). Evaluation of Seasonal Groundwater Quality Changes Associated with Groundwater Pumping and Level Fluctuations in an Agricultural Area, Korea. Water, 13(1), 51. https://doi.org/10.3390/w13010051