Article

Spatiotemporal Characteristics of the Carbon and Water FootPrints of Maize Production in Jilin Province, China

Key Laboratory of Geographical Processes and Ecological Security in Changbai Mountains, Ministry of Education, School of Geographical Sciences, Northeast Normal University, Changchun 130024, China
*
Author to whom correspondence should be addressed.
Water 2021, 13(1), 17; https://doi.org/10.3390/w13010017
Submission received: 30 November 2020 / Revised: 19 December 2020 / Accepted: 21 December 2020 / Published: 24 December 2020
(This article belongs to the Section Water Resources Management, Policy and Governance)

Abstract

:
Greenhouse gas (GHG) emissions and freshwater scarcity are central environmental concerns that are closely linked to crop production. The carbon footprint (CF) and water footprint (WF) of a crop can reflect the effects of crop production on GHG emissions and water use (WU), respectively. Studying the CFs and WFs associated with crop production will be conducive to understanding the environmental changes caused by agricultural activities, and exploring the relationship between CFs and WFs can provide a basis for strategies that reduce environmental pressures. We estimated the CF and WF of maize production in Jilin Province from 2004 to 2017 and analyzed their spatiotemporal characteristics. The results showed that the average CF and WF were 0.177 kg CO2eq/kg and 0.806 m3/kg from 2004 to 2017, respectively; 69% of the GHG emissions were due to the manufacture; transportation and application of fertilizer; and 84% of the water use was attributed to the green WF. The relationship between the CF and WF of maize production was significantly positive and indicated the possibility of simultaneous mitigation. Potential practices such as the optimization of fertilization and of agricultural machinery use and the incorporation of no-till technologies with the straw return are recommended to mitigate both GHG emissions and water use and achieve triple-win agriculture with low carbon use and water and energy savings.

1. Introduction

Climate change and water scarcity are two crucial environmental issues faced by humanity [1]. The climate is rapidly changing, mainly due to increasing anthropogenic greenhouse gas (GHG) emissions [2], and water availability has become a resource constraint due to increasing demands from multiple sectors experiencing economic development [3,4]. The agriculture industry is a major contributor to GHG emissions and water use [5,6]. The development of agricultural modernization, mechanization and chemicalization has made agriculture an important source of GHG emissions, and agriculture may be one of the largest sources of GHG emissions by 2050, although agricultural emissions are currently much lower than those from transportation and energy supplies [7]. A large amount of water is consumed during agricultural production, and water quality is degrading due to agricultural production [8]. Crop production is a major component of agriculture and is an important source of GHG emissions and water use [9]. Current crop production is strongly dependent on the application of fertilizers, pesticides, diesel and irrigation; however, excessive use of these inputs leads to increasing GHG emissions [10,11], water consumption and water pollution [12]. Therefore, quantifying GHG emissions, water consumption and water pollution; identifying the sources of GHG emissions and water use during the growth periods of crops: formulating strategies to achieve low carbon emissions and water and energy savings have become urgent issues.
At present, footprint research has become one of the most important tools used to evaluate the environmental pressures caused by agricultural production [13]. The carbon footprint (CF) and water footprint (WF) are used to evaluate GHG emissions and water use in crop production. CF refers to the total amount of direct and indirect GHG emissions associated with a certain activity or life stage of a certain product, reflecting the greenhouse effect of human activity [14]. The CF of crop production refers to the amount of GHGs emitted directly and indirectly from human activities during the growth period of a crop and is measured with CO2 equivalents [15]. The sources of GHG emissions in crop production include (1) CO2 emissions from the manufacture and transportation of agricultural inputs such as seeds, fertilizers, pesticides and diesel; (2) CO2 emissions from the use of energy such as diesel; (3) soil N2O emissions from the use of nitrogen fertilizers; and (4) CH4 emissions from rice fields. The CF of crop production includes indirect CF, referring to (1) above, and direct CF, referring to (2), (3) and (4) above. To calculate the CF, the system boundary and emission factors should be defined first. There have been great differences in the accounting boundaries reported among different scholars. Some scholars calculated the direct and indirect CFs of crops from planting to harvesting, including the carbon emissions from the manufacture and transportation of agricultural inputs and N2O emissions from the field [16,17]; some only studied the indirect CF from planting to harvesting [18], calculating carbon emissions from agricultural inputs; and some calculated the CF of the whole life cycle of crop production from agricultural inputs to consumers [19], including GHG emissions from planting, transportation, processing, and products. In addition, some scholars analyzed the composition and influencing factors of the CF of crop production and reported their belief that fertilizer inputs and electricity used for irrigation were the main contributors to the CF of crop production [20,21].
The WF was proposed by Hoekstra in 2002 and is an indicator that evaluates the use of freshwater during crop production [22]. The WF of crop production includes the blue, green and gray WFs. The blue WF refers to the volume of surface and groundwater consumed for crop growth and usually refers to irrigation water; the green WF measures the volume of rainwater consumed that is stored in the soil during crop growth, and the gray WF is the amount of freshwater required to dilute pollutants during crop growth to meet water quality standards [23]. Currently, many studies have calculated the WFs of crop production at global [24,25], national [26] and regional scales [27,28] and analyzed their temporal and spatial patterns [29] and impact factors [30,31].
Most previous studies focused on CF or WF separately; however, a single indicator, CF or WF, can only analyze GHG emissions or water consumption, respectively, and cannot completely reflect the environmental pressure caused by human activities. As environmental problems become increasingly serious and involve several aspects, the use of individual indicators is insufficient. Therefore, a more comprehensive analysis with a combination of multiple indicators is desirable [32]. Nicola Casolani et al. analyzed the CF and WF of durum wheat production in Italy and found that the spatial distributions of the CF and WF were the same [33]. Girija Page et al. estimated the CF and WF of tomato production in Sydney, Australia [34], and the results indicated that the impacts of climate change were most important in all cases; as such, the vegetable industry’s priority of reducing GHG emissions was confirmed. However, systematic studies aimed at finding the relationship between the CF and WF of product production are not common in the literature. Most previous studies have focused on integrated assessments of the CF and WF at the national level, with less research performed at the provincial and municipal levels. Therefore, we analyzed the CF and WF of maize production in Jilin Province at the county level, which is conducive to reducing the regional environmental pressures caused by carbon emissions and water use and to achieving regional development goals, including low-carbon development and the sustainable use of water resources.
Jilin Province is located in one of the three major golden corn belts in the world, and the natural conditions in the province are suitable for maize growth; thus, Jilin Province is the main area of maize production in China. The sown area of maize accounts for 75% of the sown area of all crops in Jilin Province, and the maize yield accounted for approximately 78% of the total crop yield in Jilin Province in 2017. However, increases in agricultural inputs and the excessive use of fertilizer and pesticides have led to many environmental pressures, such as increases in GHG emissions and water demand [35]. Therefore, to explore the effects of maize production on carbon emissions and water use, we use two indicators, the CF and WF, to analyze the spatial and temporal patterns of carbon emissions and water use and reveal the relationship between the CF and WF and the potential for reducing both the CF and WF simultaneously. This study could provide valuable information for designing and implementing effective measures to mitigate carbon emissions and water use in crop production.

2. Material and Methods
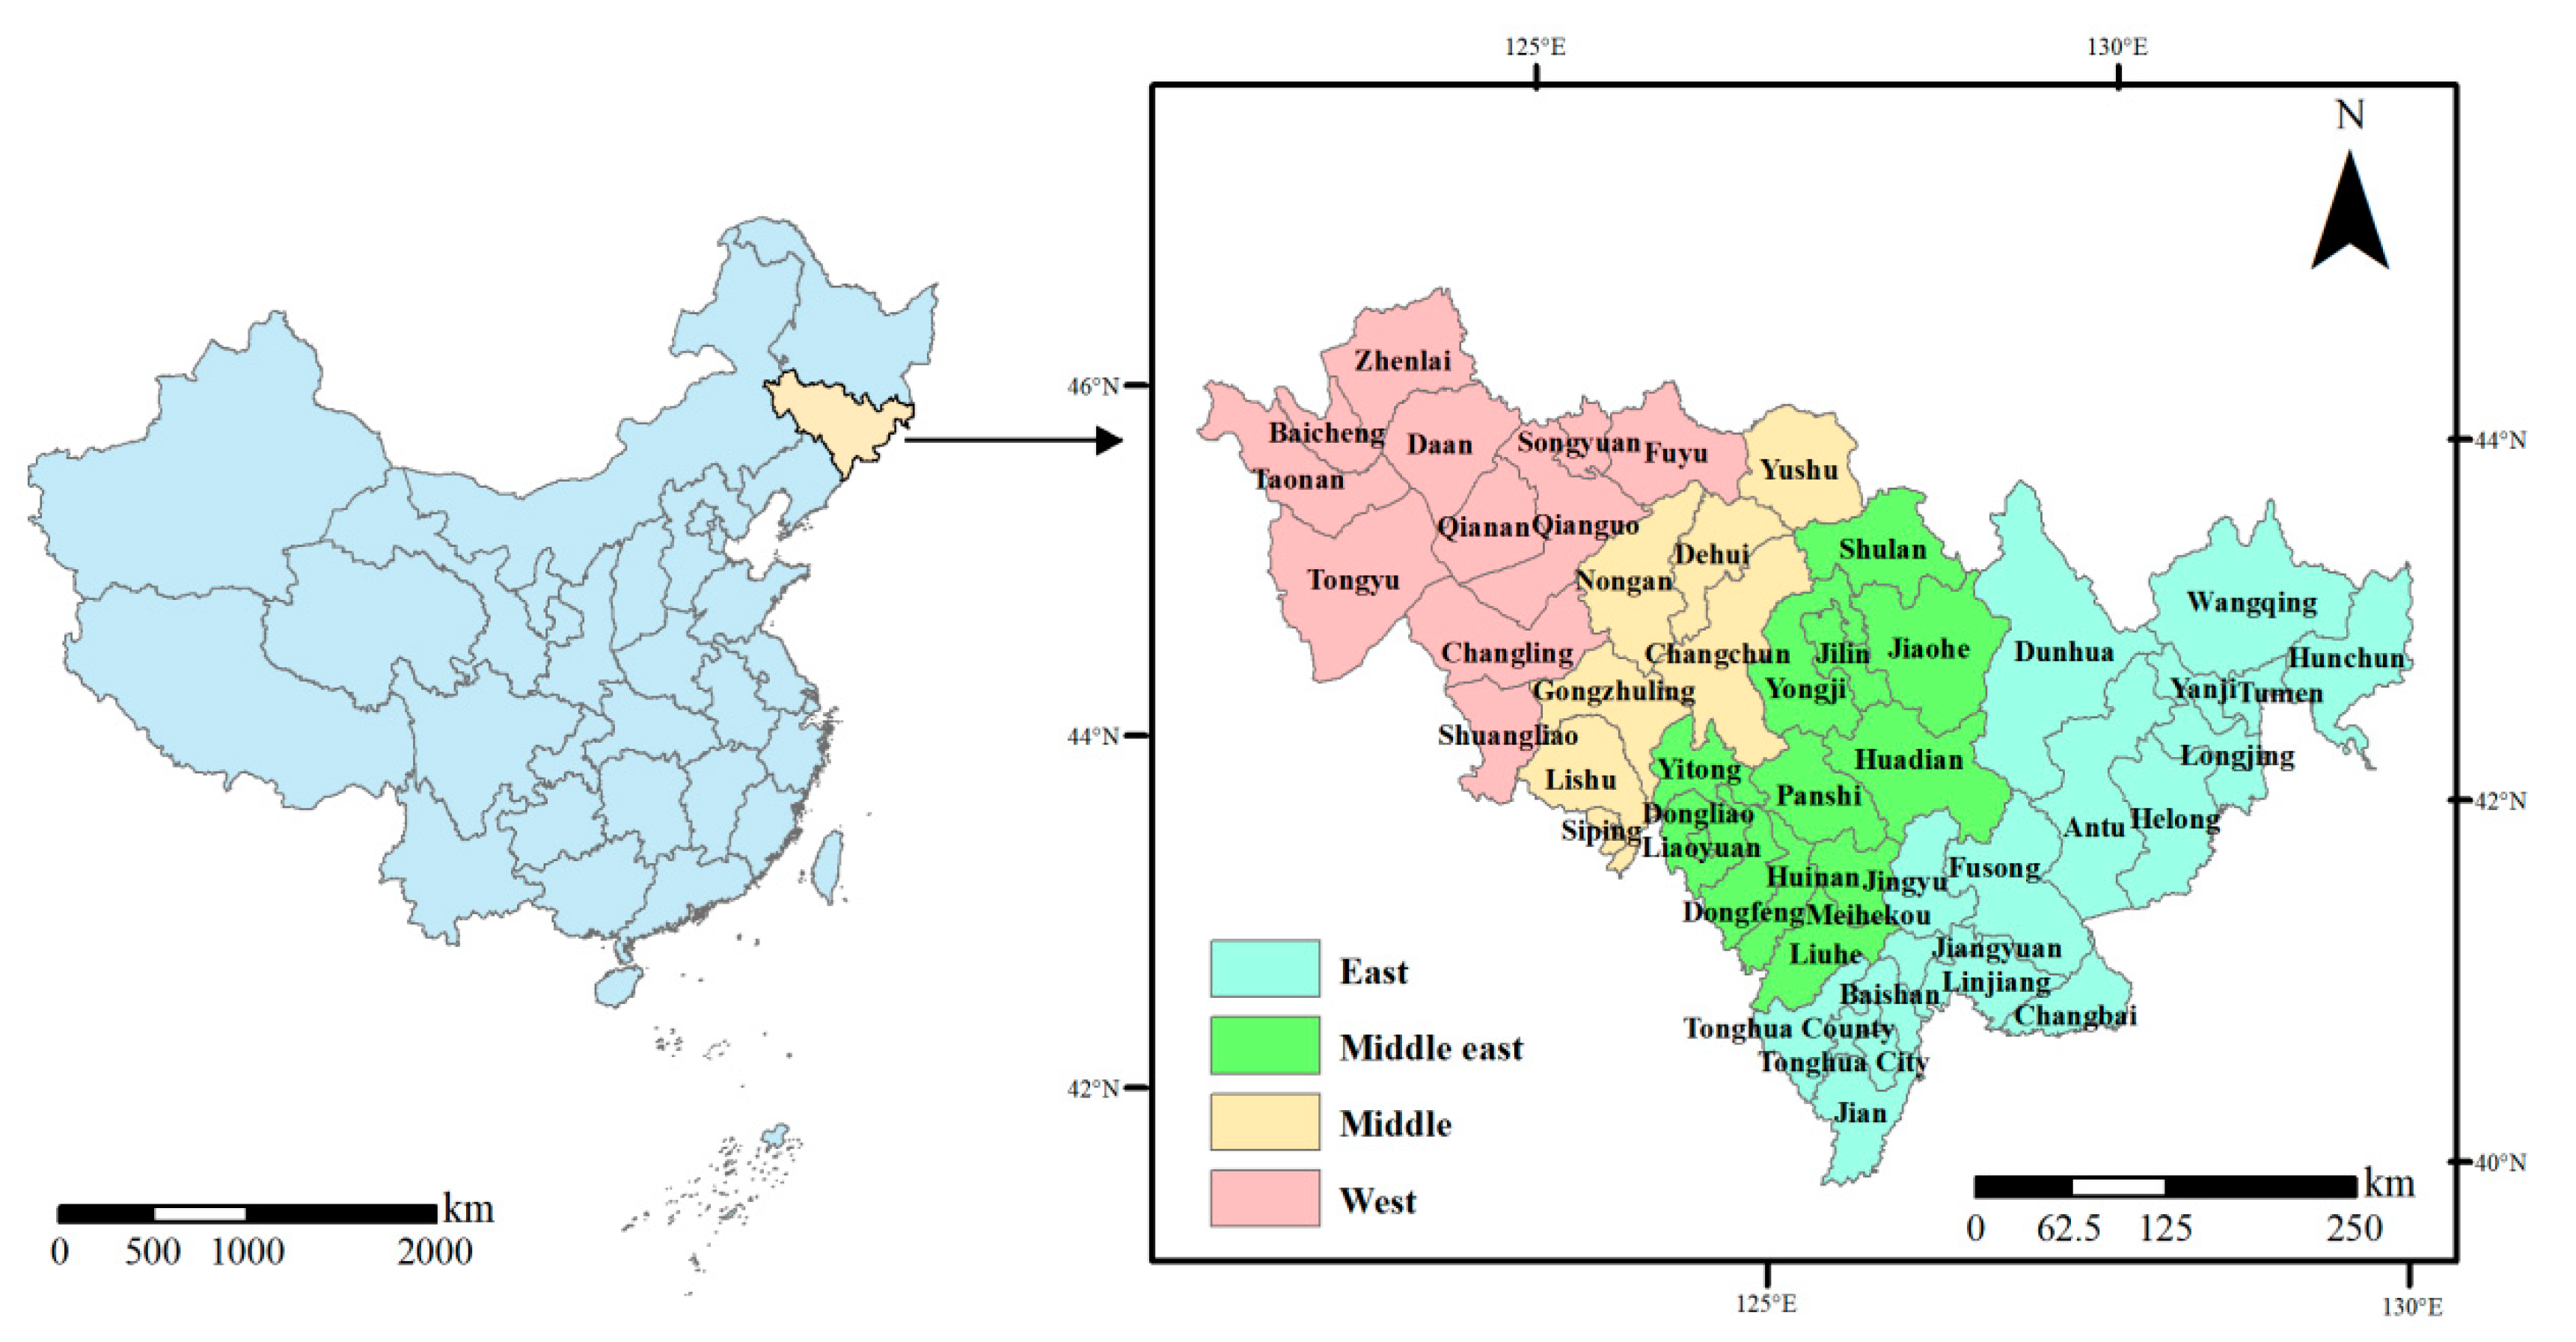
2.1. Study Area

Jilin Province is located in Northeast China (40°52′–46°18′ N, 121°38′–131°19′ E) and is divided into 48 counties (Figure 1). This province has a temperate monsoon climate. The annual average temperature is 5.9 °C. The annual precipitation is 608.3 mm, of which summer rain contributes >80%, and the precipitation decreases gradually from east to west across the province. Based on the characteristics of its diverse climate and landforms, Jilin Province is divided into four regions, namely, the east, middle east, middle and west regions (Figure 1). The general characteristics of these regions are listed in Table 1 [36].

2.2. System Boundaries

When accounting for CF and WF, the system boundaries of GHG emissions and water use, from planting to harvesting, compose the basis and are key factors. The CF in this study was composed of (1) indirect CO2 emissions, including the manufacturing and transportation of agricultural inputs (fertilizer, pesticide, seeds and diesel), and (2) direct emissions, including soil N2O emissions and CO2 emissions from diesel combustion associated with agricultural machinery use. During the maize growth period, the WF was estimated based on the consumption of rainfall and irrigation water (green and blue WFs) and the amount of fresh water required to assimilate the load of pollutants to meet the ambient water quality standards (gray WF) (Figure 2).

2.3. CF Calculation

At present, the methods used to calculate CF mainly include the life cycle assessment (LCA), input–output method (EIO) and input–output–life cycle evaluation model (Hybrid-IO-LCA Model). This study used the LCA method to calculate the CF of maize production. According to the life cycle inventory, the CF (kg CO2eq/kg) was calculated using the following formulas:
C E = C E i n p u t + C E N 2 O
C E i n p u t = i ( Q u s e d i × ε i )
C E N 2 O = F N × α i × 44 28 × 298
C F = C E Y
where CE is the total GHG emission (kg CO2eq/hm2); CEinput is the GHG emissions from the manufacture and transportation of agricultural inputs (kg CO2eq/hm2), such as fertilizers, pesticides, seeds and diesel; CEN2O is the N2O emission of the soil (kg CO2eq/hm2); Qusedi is the amount of agricultural inputs (kg/hm2), and εi is its emission factor; FN is the amount of N fertilizer applied (kg/hm2); αi is the emission factor of N2O; 44/28 is the molecular weight ratios of N2O to N in N2O; 298 is the global warming potential of N2O relative to CO2 over a 100-year horizon, and Y is the maize yield (kg/hm2).

2.4. WF Calculation

The total WF was calculated as follows:
W F = W F b l u e + W F g r e e n + W F g r a y
where WFblue, WFgreen and WFgray are the blue, green and gray water footprints (m3/kg), respectively.
Due to the large planting area of maize in Jilin Province, the limited water resources cannot adequately satisfy the irrigation requirements. The maize irrigation mode is sowing with water, in which the maize seed is irrigated with a small quantity of water at the sowing time, creating a microenvironment with sufficient soil water to ensure germination and seedling establishment [37]; no irrigation is conducted during other growth stages. Thus, the consumed volume of blue water comprised only the water use on the day of sowing. The blue WF and green WF were calculated using the following formulas:
W F b l u e = I U Y
W F g r e e n = 10 × E T c I U Y
where IU is the amount of irrigation water used (m3/hm2), which is presented in Table 2, and ETc is the water requirement of maize growth (mm), which can be calculated by the CROPWAT.
The gray WF was calculated using the following formula:
W F g r a y = ( α × A R ) / ( C max C n a t ) Y
where AR is the amount of N fertilizer applied (kg/hm2); α is the N fertilizer leaching rate; Cmax is the maximum acceptable concentration of the pollutant, and Cnat is the natural concentration of the pollutant (kg/m3).

2.5. Data Sources

The obtained data comprised meteorological and agricultural data as well as emission factors. The meteorological data (2004–2017) for Jilin Province were obtained from the China Meteorological data sharing service system and included the monthly average minimum temperature, maximum temperature, relative humidity, wind speed, number of sunshine hours and precipitation. The agricultural data, including the sow areas and maize yields and the amounts of agricultural inputs (fertilizer, pesticide, diesel, and seeds), were collected from the Jilin Province Statistical Yearbook from 2005 to 2018, the National Cost-Benefit Compilation of Agricultural Products and surveys of farmers. The emission factors of GHGs for all agriculture inputs (e.g., fertilizers, pesticides, diesel and seeds) were obtained from eBalance v4.0, including the Chinese life cycle database (CLCD) and the Ecoinvent database, of which CLCD is the only available Chinese life cycle database; its value represents the Chinese average level [38]. The emission factors of N2O were gathered from the Intergovernmental Panel on Climate Change (IPCC) [39] (Table 3).

3. Results

3.1. Spatiotemporal Characteristics of CFs

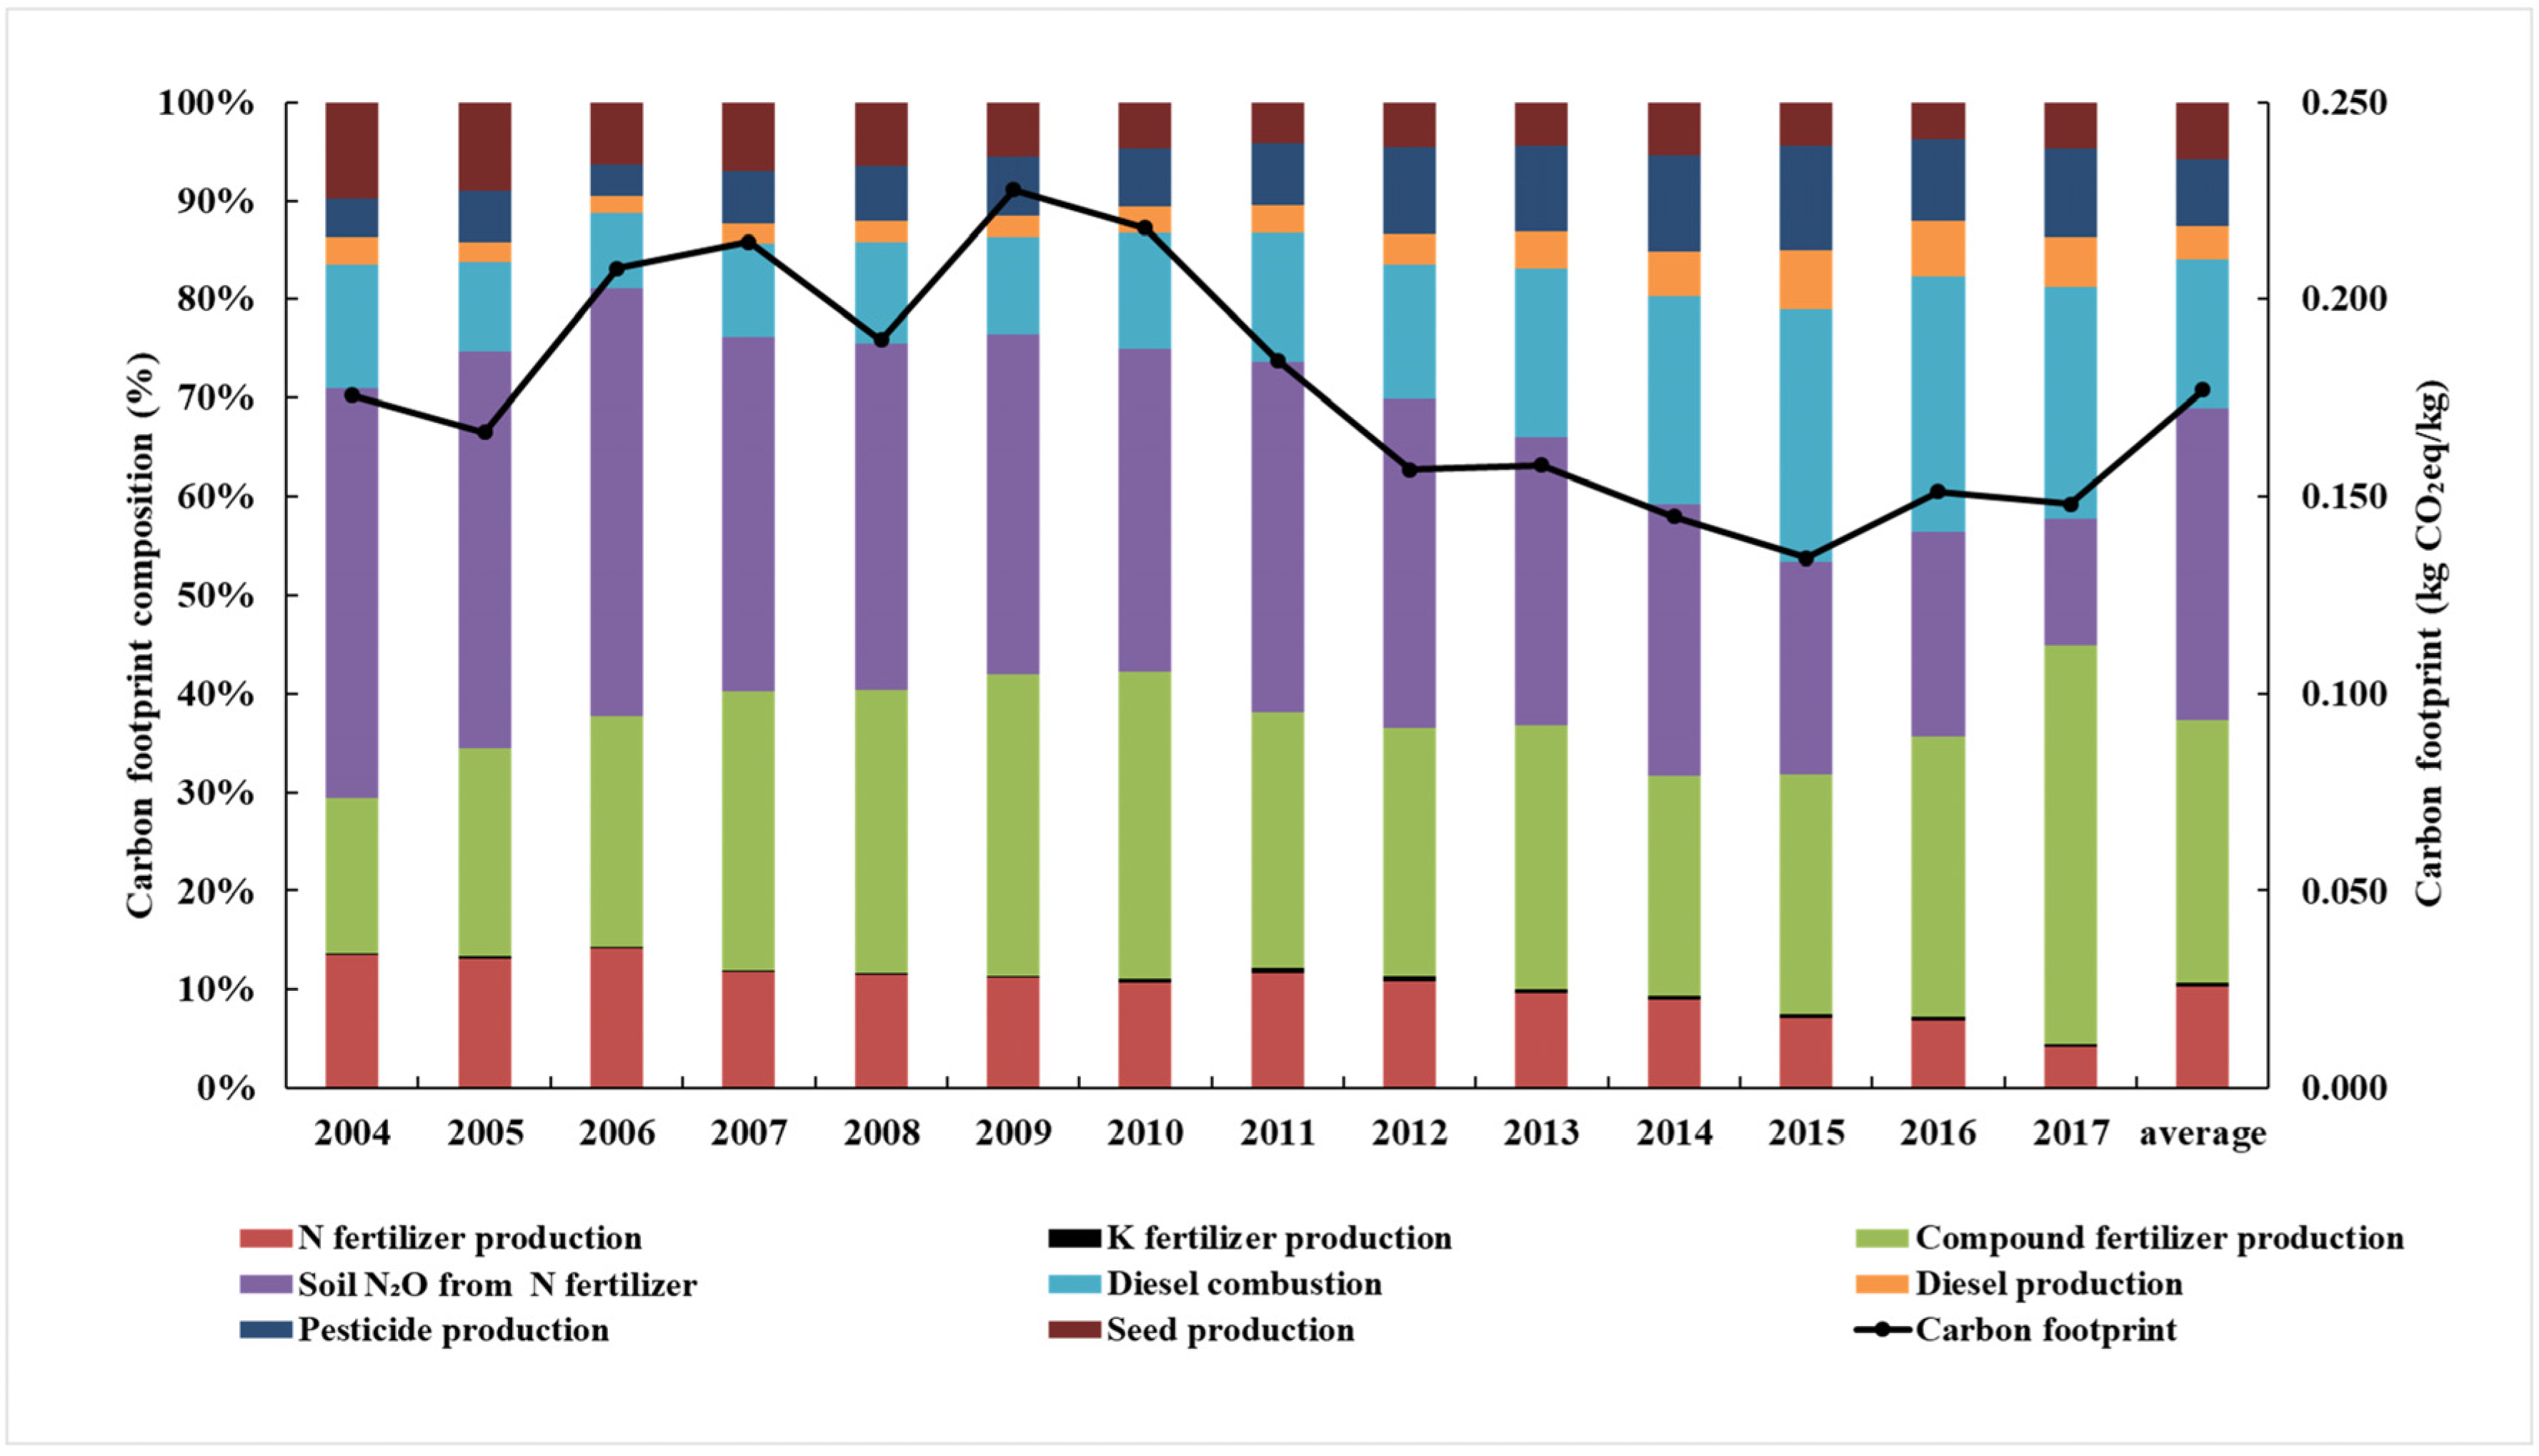
3.1.1. Temporal Variation of CFs

The CFs of maize production in Jilin Province showed a fluctuating downward trend from 2004 to 2017 (Figure 3). The average CF was 0.177 kg CO2eq/kg, and the highest CF (0.228 kg CO2eq/kg) was found in 2009, while the lowest CF (0.134 kg CO2eq/kg) appeared in 2015. CF declined significantly due to the increase in yield in 2008. The CFs were affected by both agricultural inputs and yield; higher agricultural inputs and lower yields resulted in higher CFs. In 2009, more nitrogen and compound fertilizers were invested, which resulted in a higher CF.
In the composition of the CF of maize production, the CFs associated with the production and transportation of fertilizer accounted for the largest share (37.28%), of which compound fertilizer accounted for 26.60%, N fertilizer accounted for 10.36%, and K fertilizer accounted for 0.32% (Figure 3); followed by the CF of the emission of N2O due to N fertilizer application, which accounted for 31.72% of the total CF. The CF of diesel combustion from agricultural machinery accounted for 15.06% of the total, and the CF of diesel production associated with transportation accounted for 3.30%. Pesticide input caused 6.89% of the total CF, and that caused by seed input was 5.75%. The CFs caused by compound fertilizer production, diesel combustion and pesticide input presented an increasing trend from 2004 to 2017, and the CFs from N fertilizer production, field N2O emissions and seed input decreased over the same period.

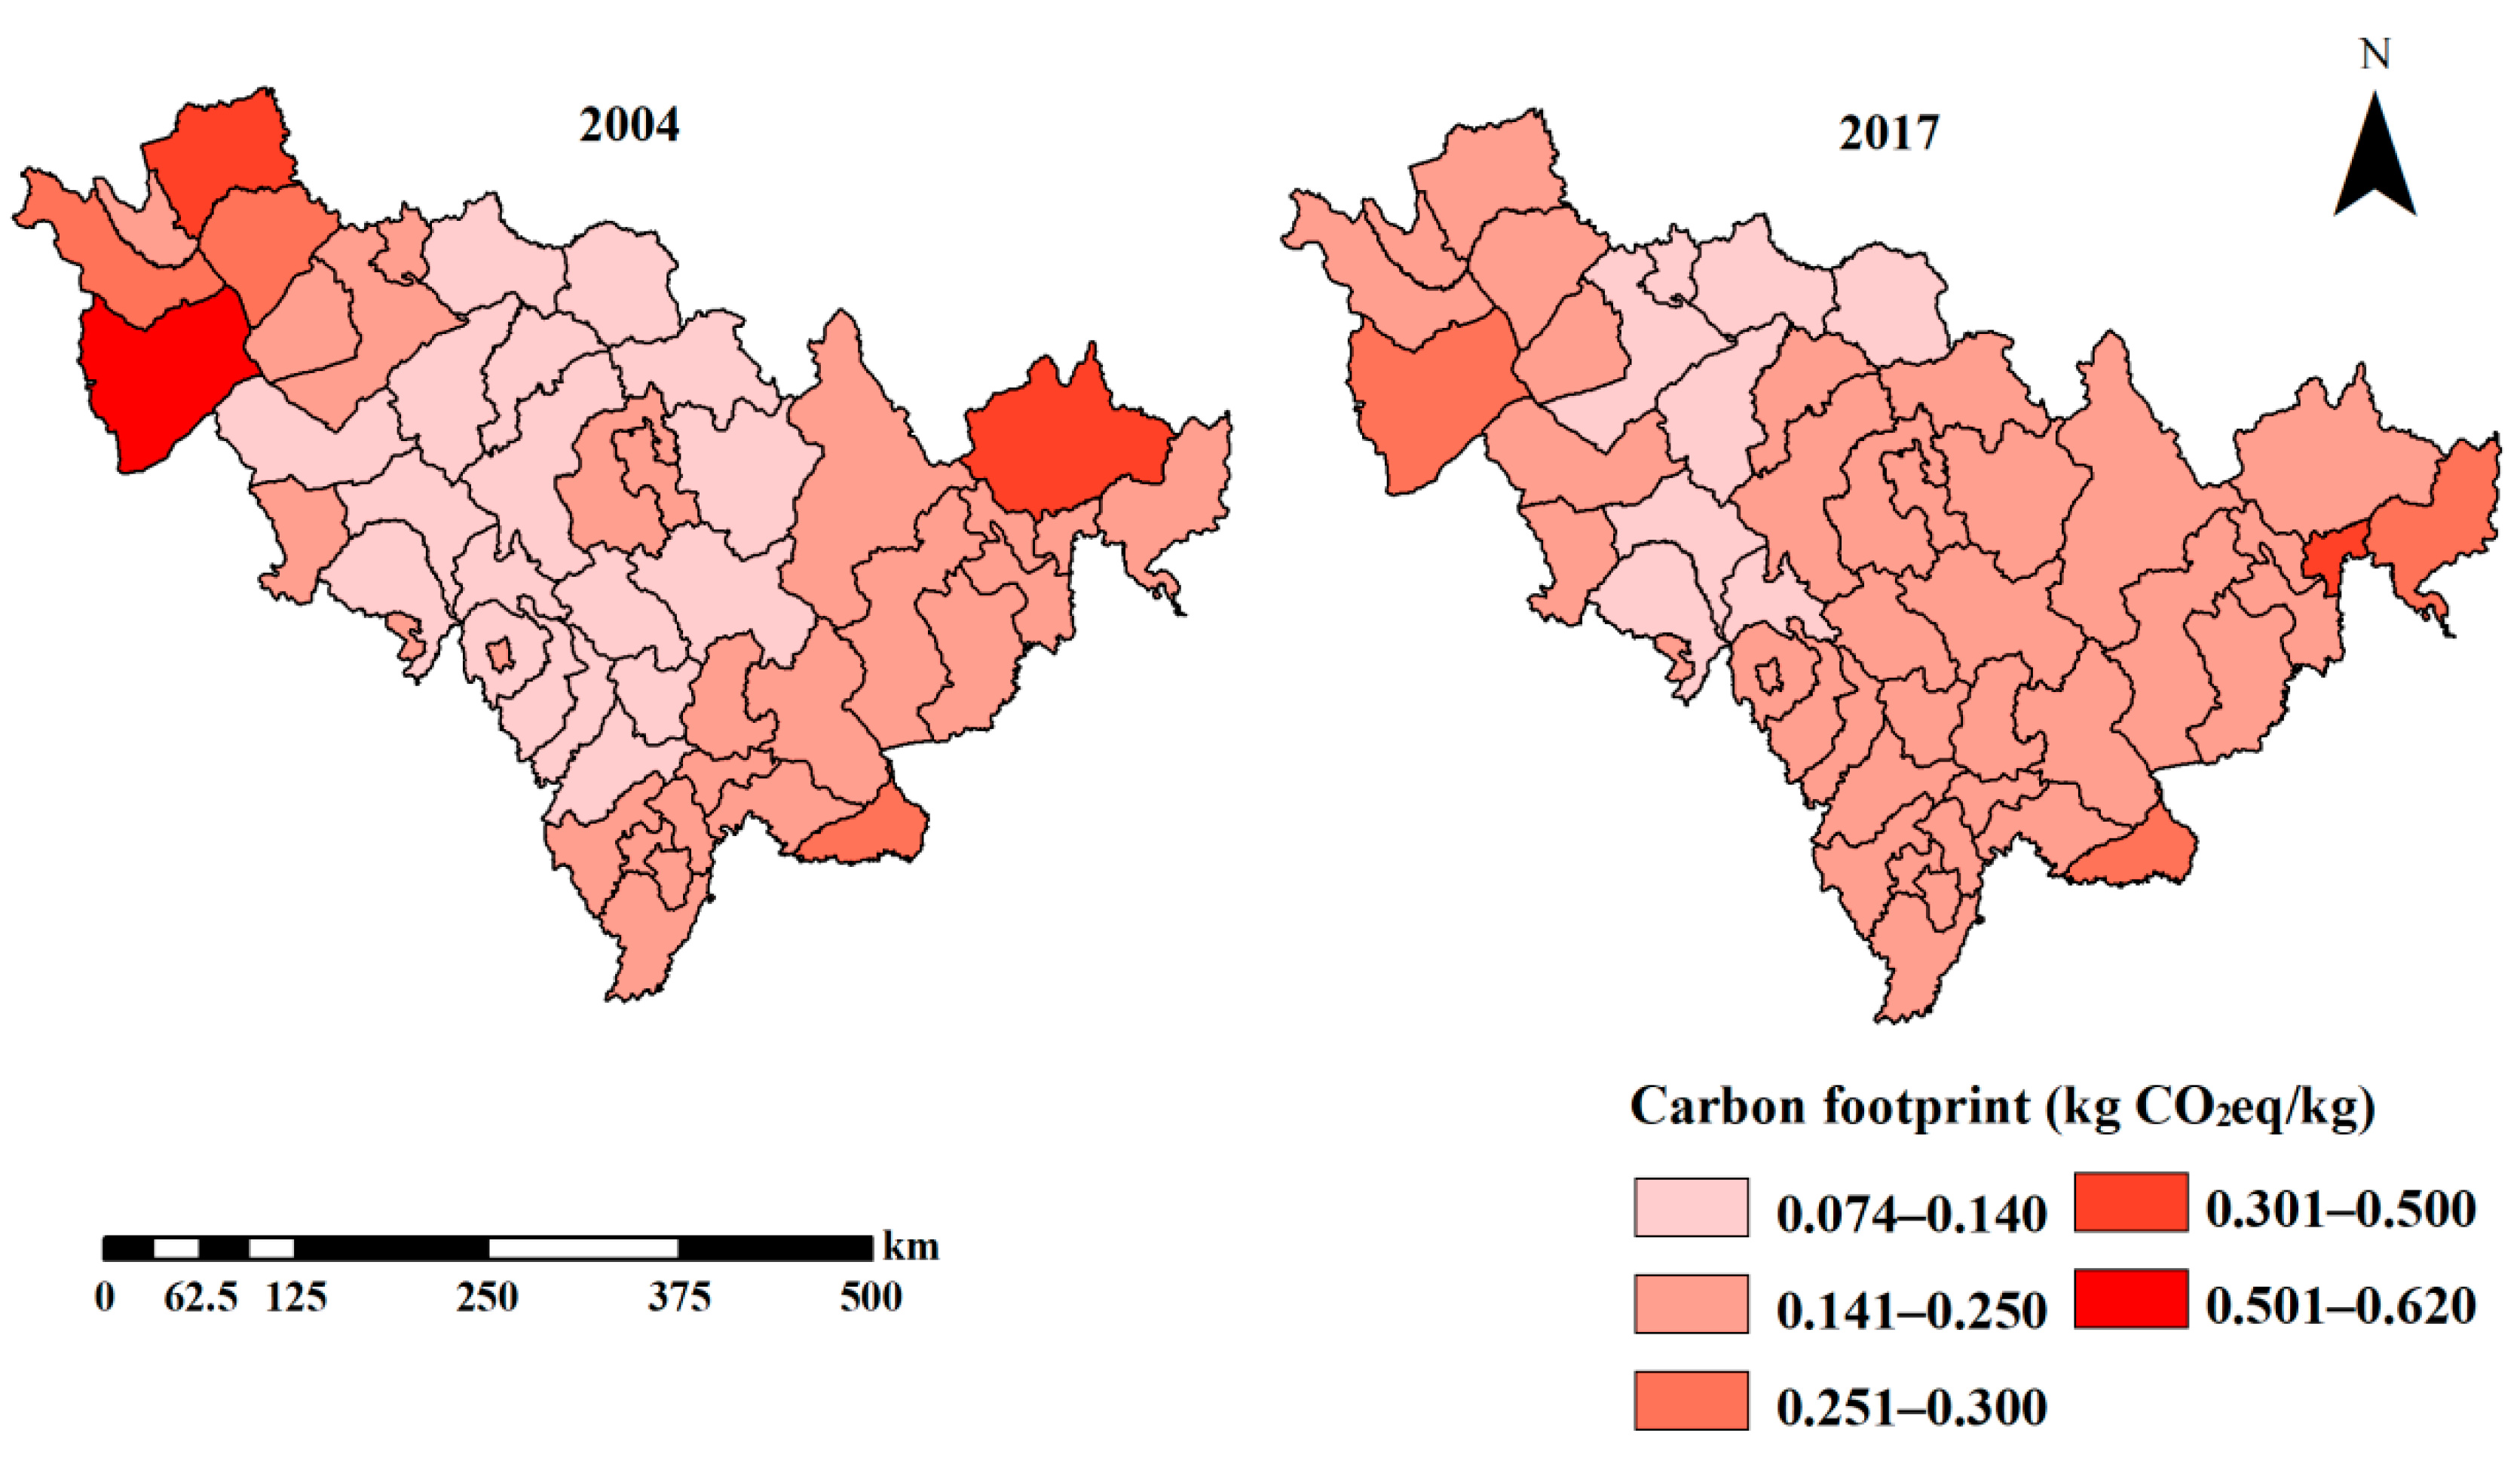
3.1.2. Spatial Distribution of CFs

The distributions of the CFs of maize production in Jilin Province in 2004 and 2017 are shown in Figure 4. In 2004, the areas with high CF values were mainly distributed in the western and eastern regions. The average CF was 0.182 kg CO2eq/kg, and the highest CF appeared in Tongyu (located in western Jilin Province), with a value of 0.619 kg CO2eq/kg. In 2017, the areas with high CF values were mainly concentrated in the western, middle eastern and eastern regions, the average CF was 0.177 kg CO2eq/kg, and the highest CF was 0.322 kg CO2eq/kg, which appeared in Tumen, located in eastern Jilin Province. The highest CF calculated in 2017 was not as high as that in 2004, but the areas with high values expanded, and the CFs in the middle east region of Jilin Province obviously increased.
The constitutions of the CF of maize production were different among the regions in 2004 and 2017 (Figure 5). In 2004, the CF from N2O emissions was the highest in each region, especially in the western region, and the largest N2O emission was 0.076 kg CO2eq/kg. The CF caused by compound fertilizer production ranked second in its contribution to the overall CF of maize production. The CF due to diesel use was also high, and pesticide and seed production caused lower CFs. In 2017, compound fertilizer production became the largest emission source; CF caused by compound fertilizer production was 0.072 kg CO2eq/kg, followed by diesel combustion. Compared with 2004, the constitutions of the CFs changed greatly in 2017; the N2O emissions decreased obviously, while the carbon emissions caused by compound fertilizer production and diesel combustion increased greatly. This discrepancy is mainly due to the agricultural machine and compound fertilizer inputs increasing greatly in Jilin Province, especially in the middle east region of Jilin Province, which resulted in the CFs increasing significantly in the middle east region of Jilin Province in 2017.

3.2. Spatiotemporal Characteristics of WFs

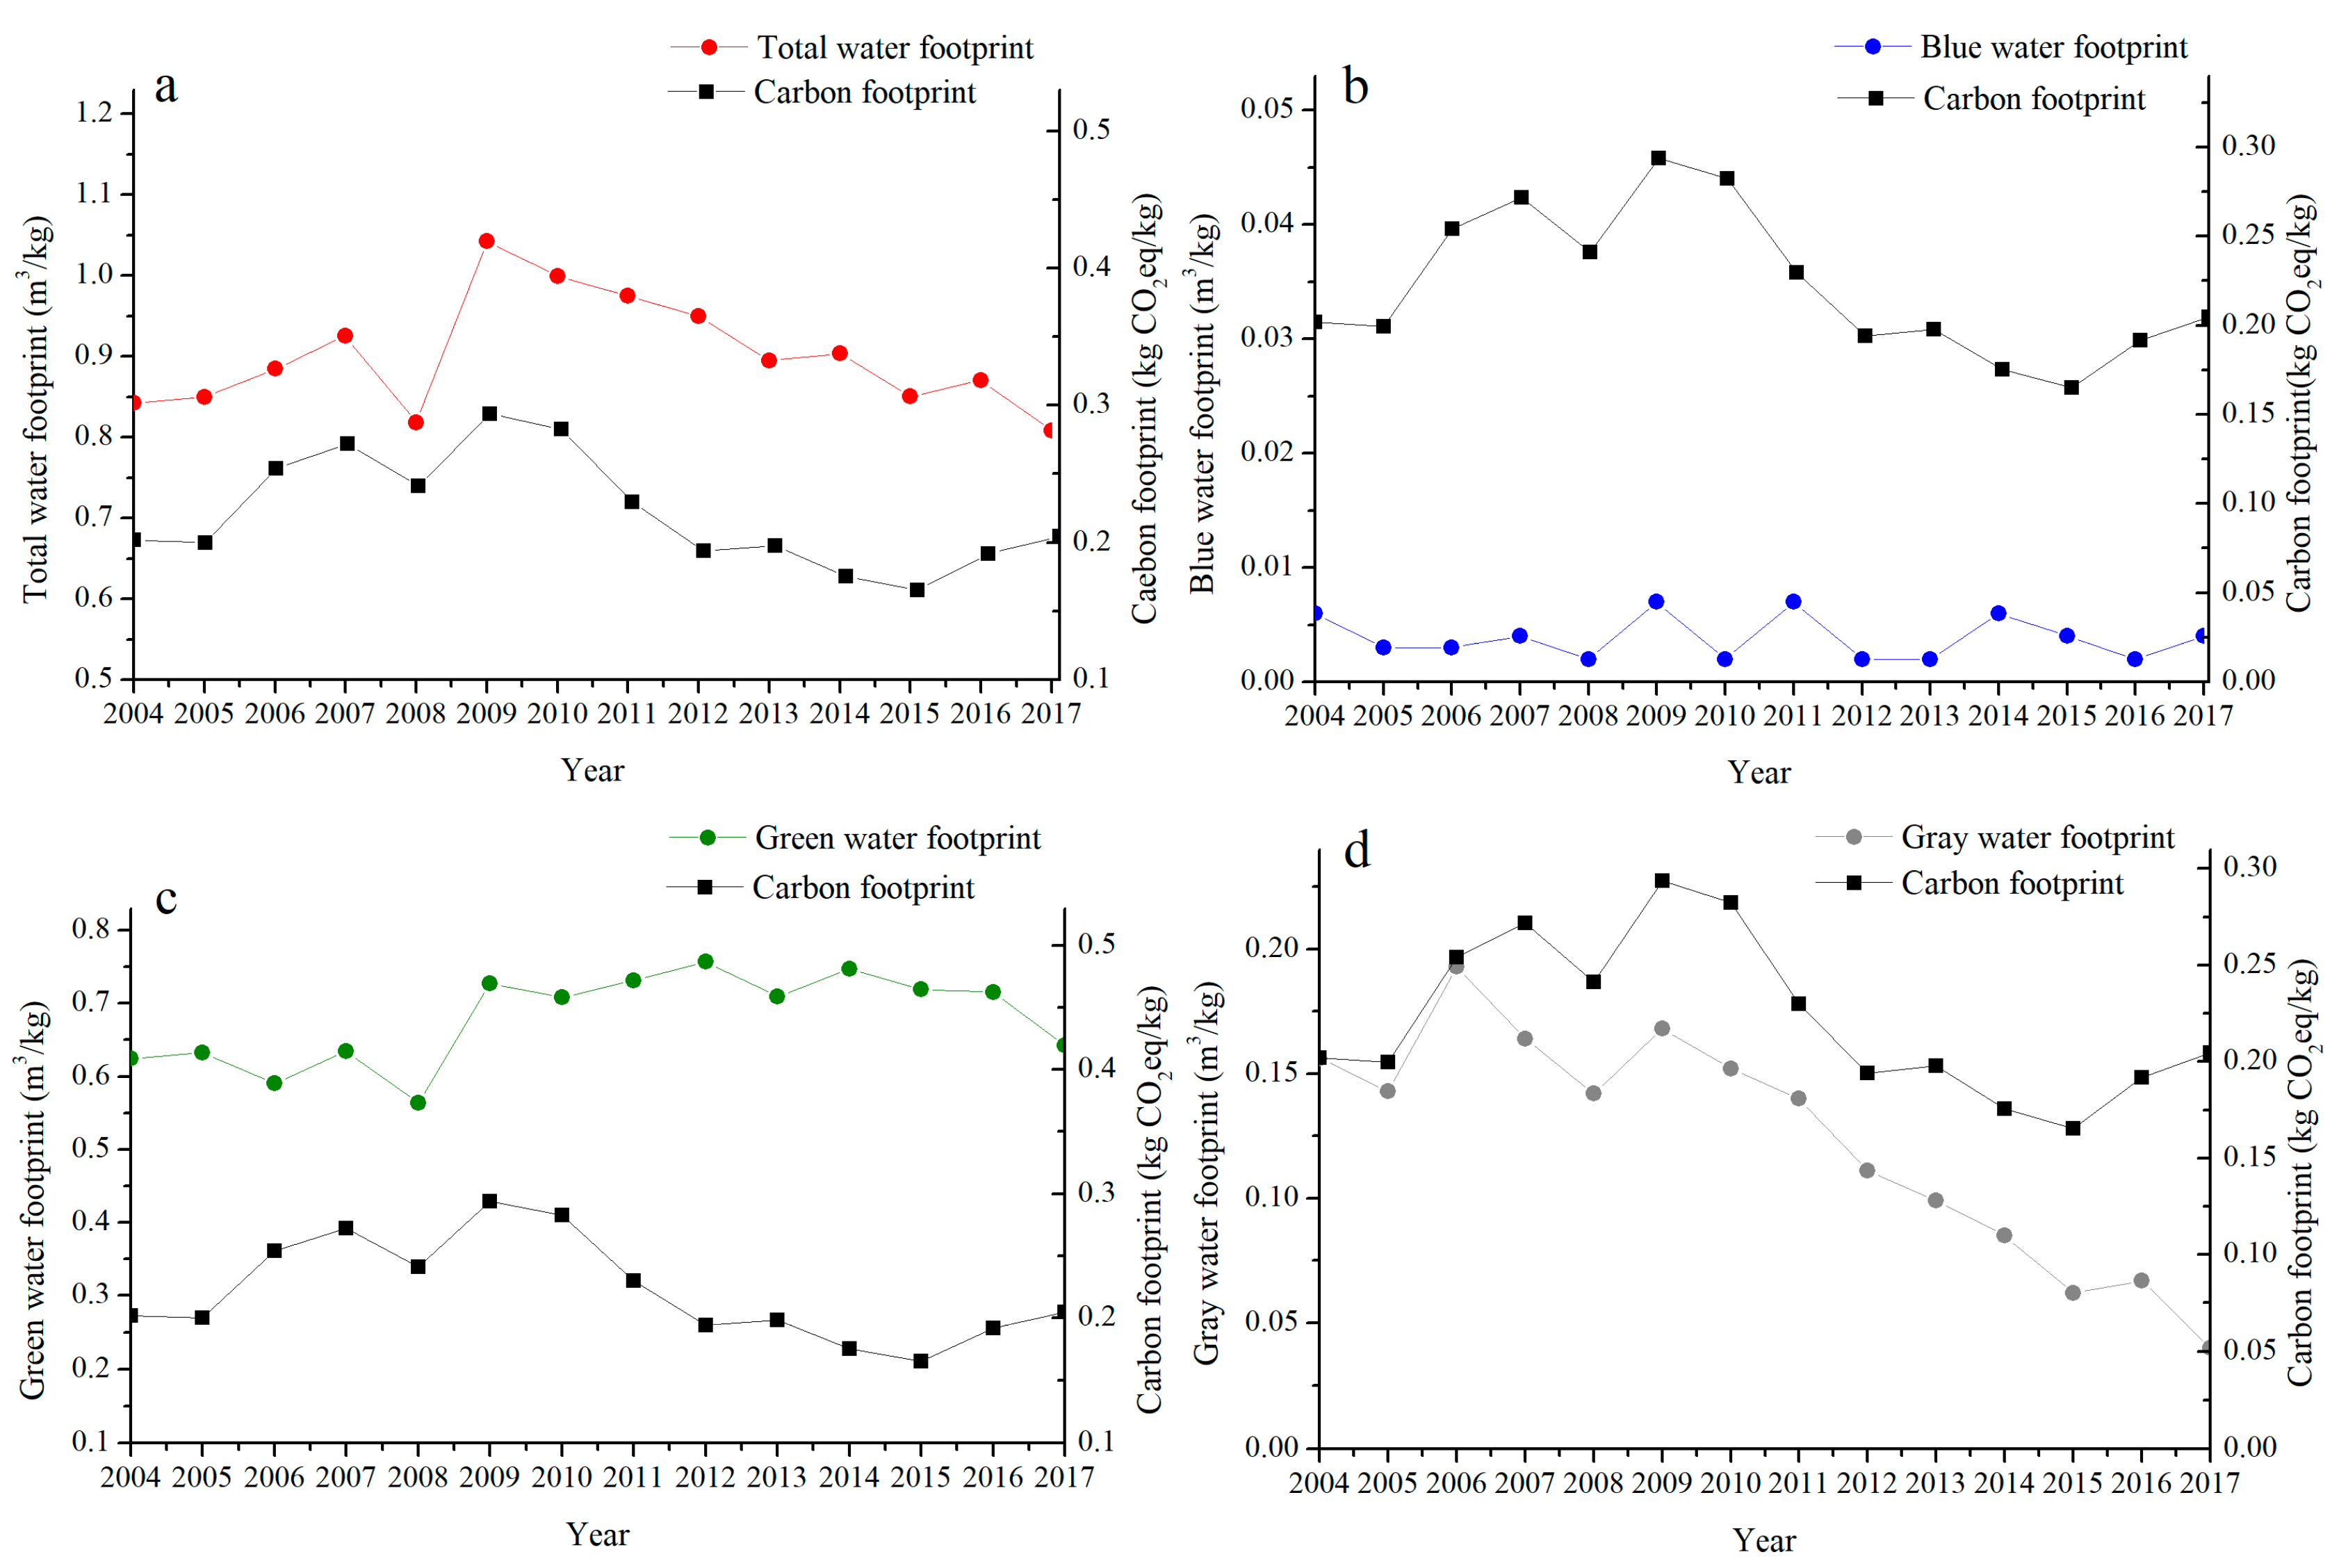
3.2.1. Temporal Variation of WFs

The total WF consists of the green, blue and gray WFs and is a comprehensive indicator that reflects the types and quantities of water consumption. The total WF of maize production in Jilin Province presented a fluctuating trend from 2004 to 2017 (Figure 6). The average WF was 0.806 m3/kg, the maximum value, 0.901 m3/kg, appeared in 2009, and the minimum value was found in 2017 with a value of 0.687 m3/kg. Of the total WF, the green WF accounted for the largest proportion, 84.24%, followed by the gray WF with 15.26%; the blue WF contributed the least at only 0.5% (Figure 6). Maize production in Jilin Province was rainfed, and rainfall was the main water source during the growing period. Therefore, green water was the main type of water consumed during maize production. Moreover, the maize production was sowing with water, which was irrigated with a small quantity of water at the sowing time, resulting in the least blue water.
The blue WF of maize production fluctuated greatly during 2004–2017. The largest blue WF appeared in 2009, with a value of 0.007 m3/kg, because the effective precipitation in 2009 was 289.4 mm, the lowest value during the study period; thus, the maize required more irrigation water in this year, resulting in the highest blue WF. The lowest blue WF was found in 2012, with a value of 0.002 m3/kg, because the precipitation was highest in 2012 and, thus, less irrigation water was required.
However, the green WF of maize production showed an increasing trend. The maximum value, 0.757 m3/kg, appeared in 2012, and the minimum value appeared in 2008, which was approximately 0.564 m3/kg. The green WF of maize production was closely related to the effective precipitation and the yield, and the greater the effective precipitation was, and the lower the yield was, the higher the green WF was. The precipitation was highest in 2012, resulting in the highest green WF. Moreover, the yield increased significantly in 2008, resulting in a decrease in green WF.
The gray WF of maize production presented a clearly declining trend from 2004 to 2017. The highest gray WF was 0.193 m3/kg in 2006, and the lowest gray WF was found in 2017, with a value of 0.040 m3/kg. The gray WF of maize production was closely related to the application of N fertilizer and to the yield. The higher the application of N fertilizer was, and the lower the yield was, the higher the gray WF was. During the study period, the yields of maize increased obviously, resulting in a decrease in the gray WF.

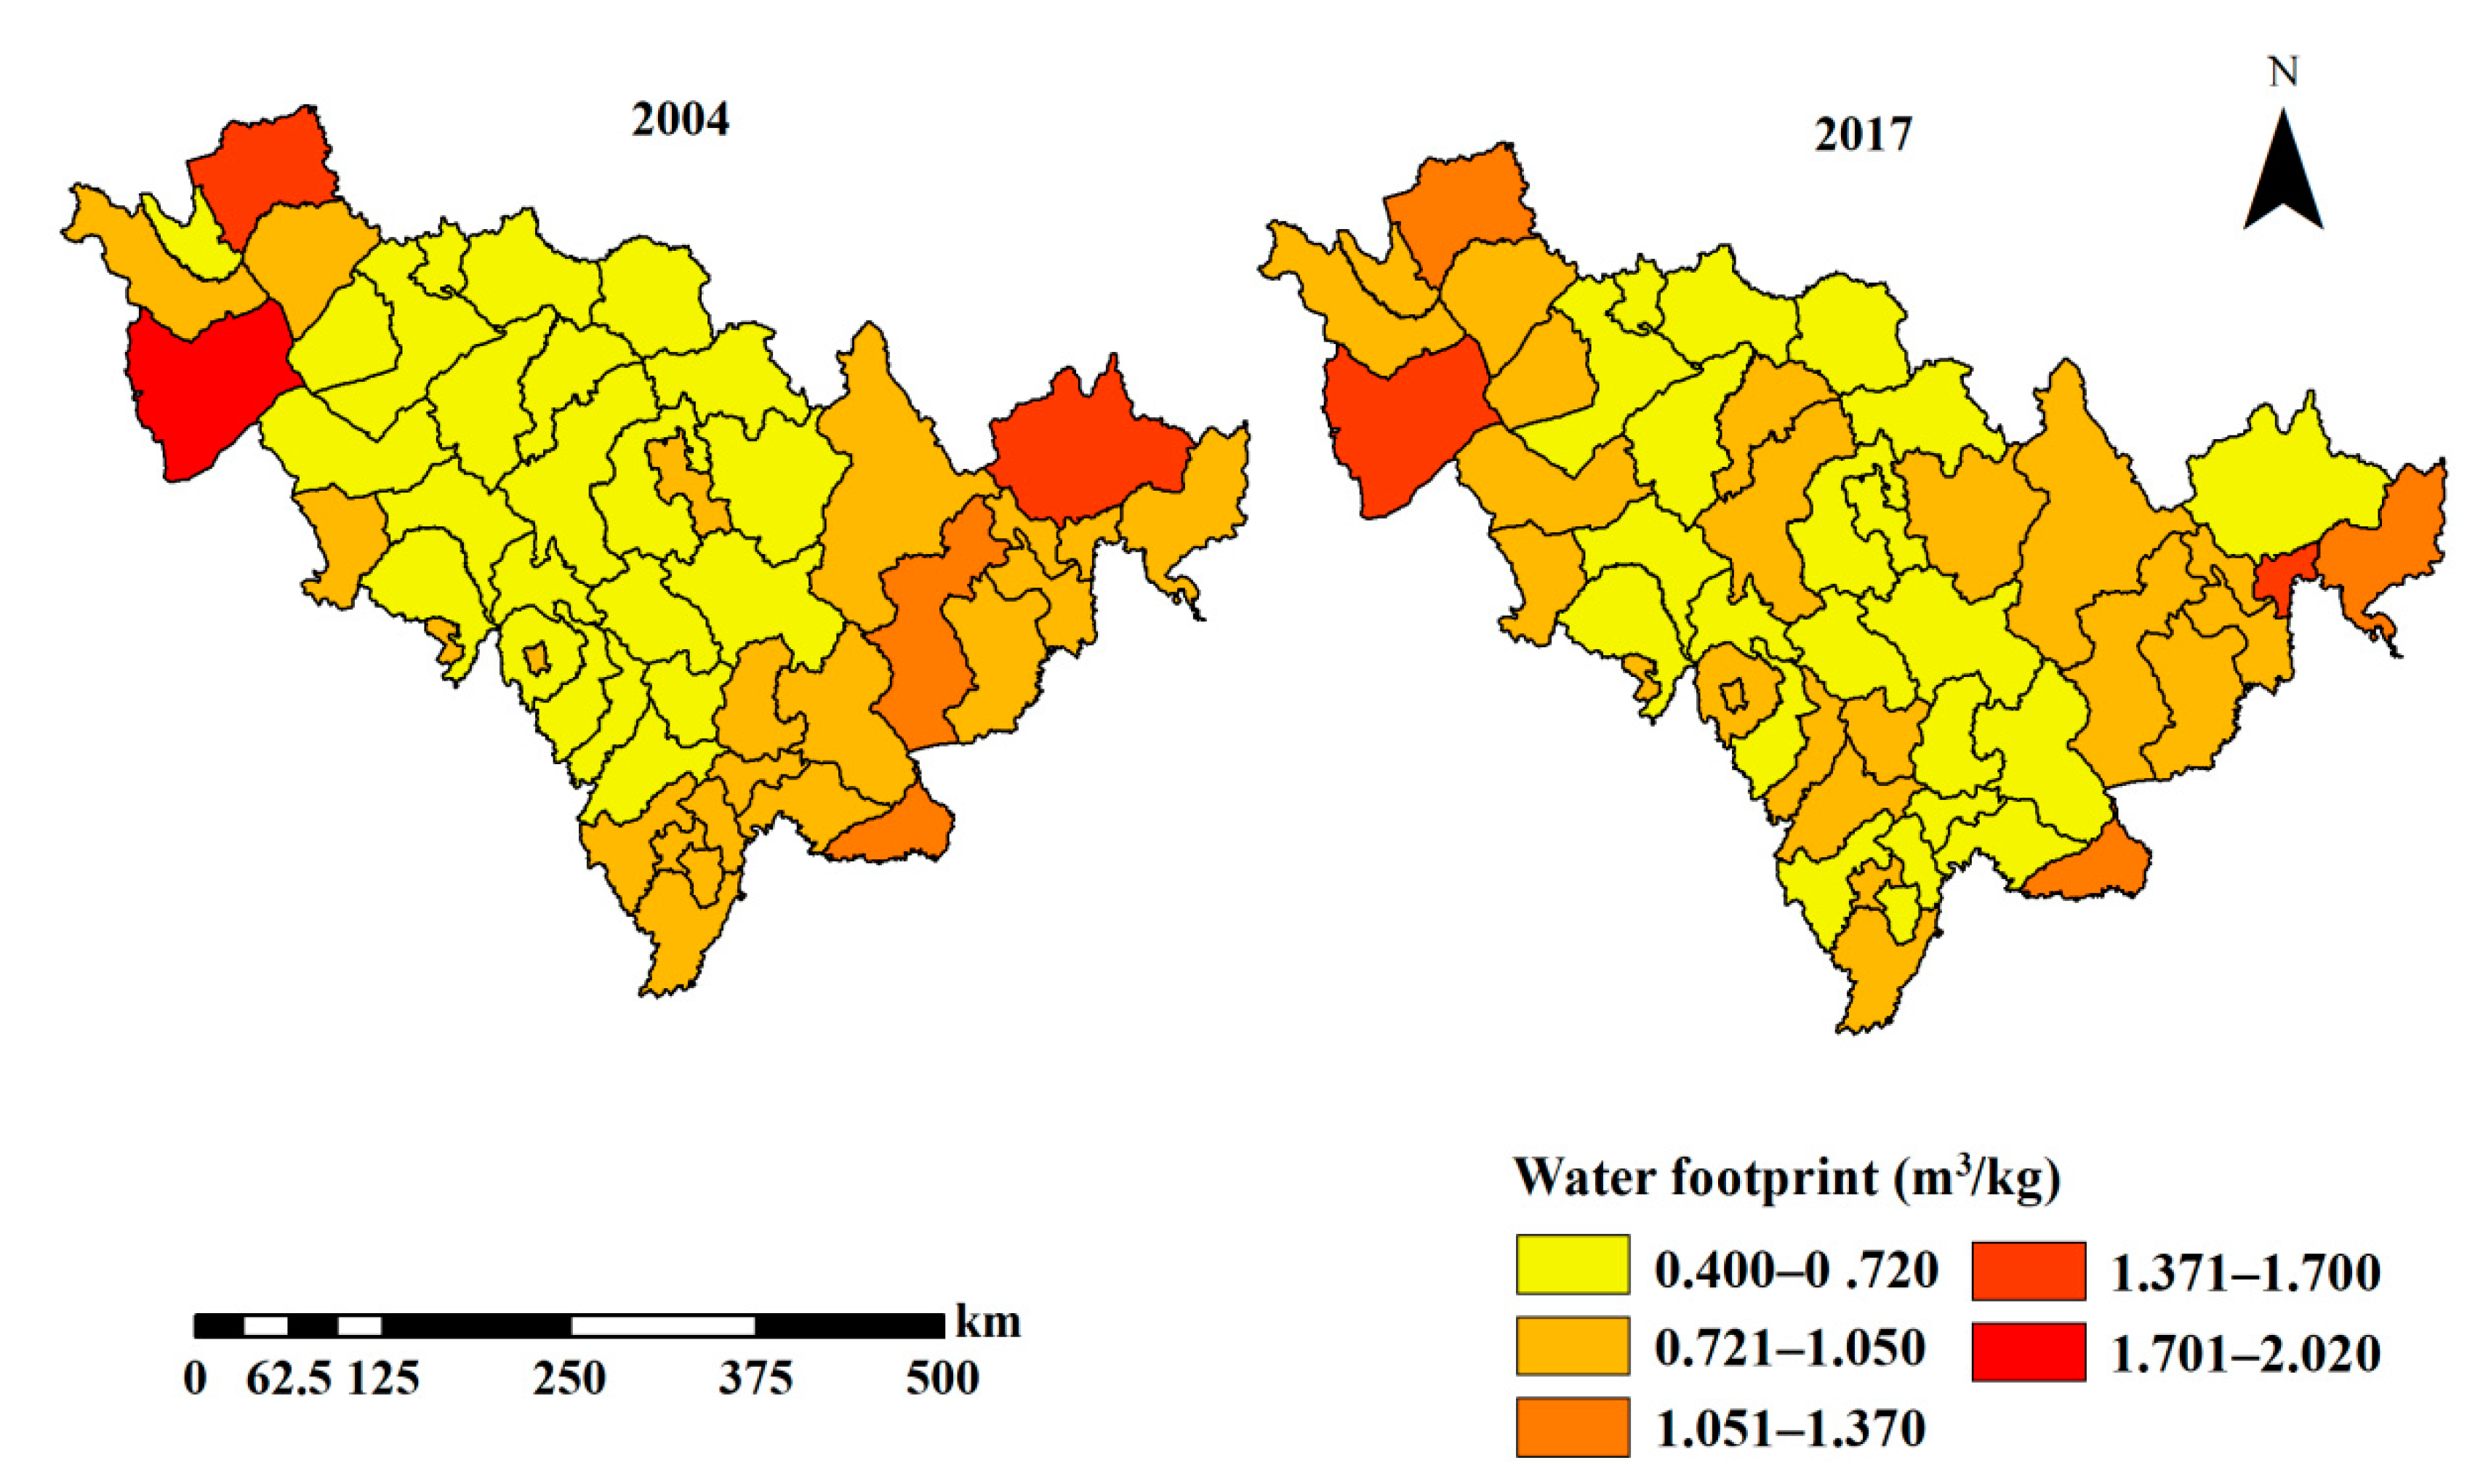
3.2.2. Spatial Distribution of WFs

The spatial distributions of the total WFs of maize production in Jilin Province in 2004 and 2017 are shown in Figure 7. In 2004, the areas with high total WFs were mainly distributed in the western and eastern regions of Jilin Province. The average WF of maize production in Jilin Province was 0.795 m3/kg, and the highest WF appeared in Tongyu, with a value of 2.02 m3/kg. In 2017, the areas with high total WFs were mainly distributed in the western region and the north of the eastern region. The average WF was 0.818 m3/kg, and the highest WF was again found in Tongyu, with a value of 1.693 m3/kg. Compared with 2004, the WFs in the south of the eastern region decreased obviously, while the WFs in the middle and middle east regions of Jilin Province increased in 2017.
The total WF of maize production in Jilin Province was mainly composed of the green WF, followed by the gray WF; the blue WF contributed the least to the total WF (Figure 8). In 2004, the areas with high values of blue WFs were mainly distributed in western Jilin Province because there was less rainfall in the west, and the region thus required more irrigation water. The blue WF values decreased from west to east, and there was no irrigation in the eastern region because of the abundant precipitation. The green WFs were related to the local precipitation and yield; thus, high green WFs were mainly distributed in the east. The gray WFs were higher in the eastern and western regions than in the middle east and middle regions. The gray WF of maize production was mainly affected by the amount of N fertilizer used and the yield. The amount of fertilizer used in maize production in Jilin Province differed among the regions, decreasing gradually from west to east; therefore, higher gray WFs appeared in western Jilin Province. Although the smallest amount of fertilizer was used in the eastern region, the gray WFs in this region were also higher, which was due to the maize yields in this region being the lowest, resulting in higher gray WFs. In 2017, the spatial distributions of the blue and green WFs were the same as those in 2004, while the values of the blue WFs decreased and the green WFs increased compared with those in 2004 because the precipitation in 2017 was greater than that in 2004. In 2017, the maize yields increased, and the amount of N fertilizer used decreased compared with the corresponding values in 2004; thus, thegray WFs decreased evidently in each region in 2017 compared with those in 2004.

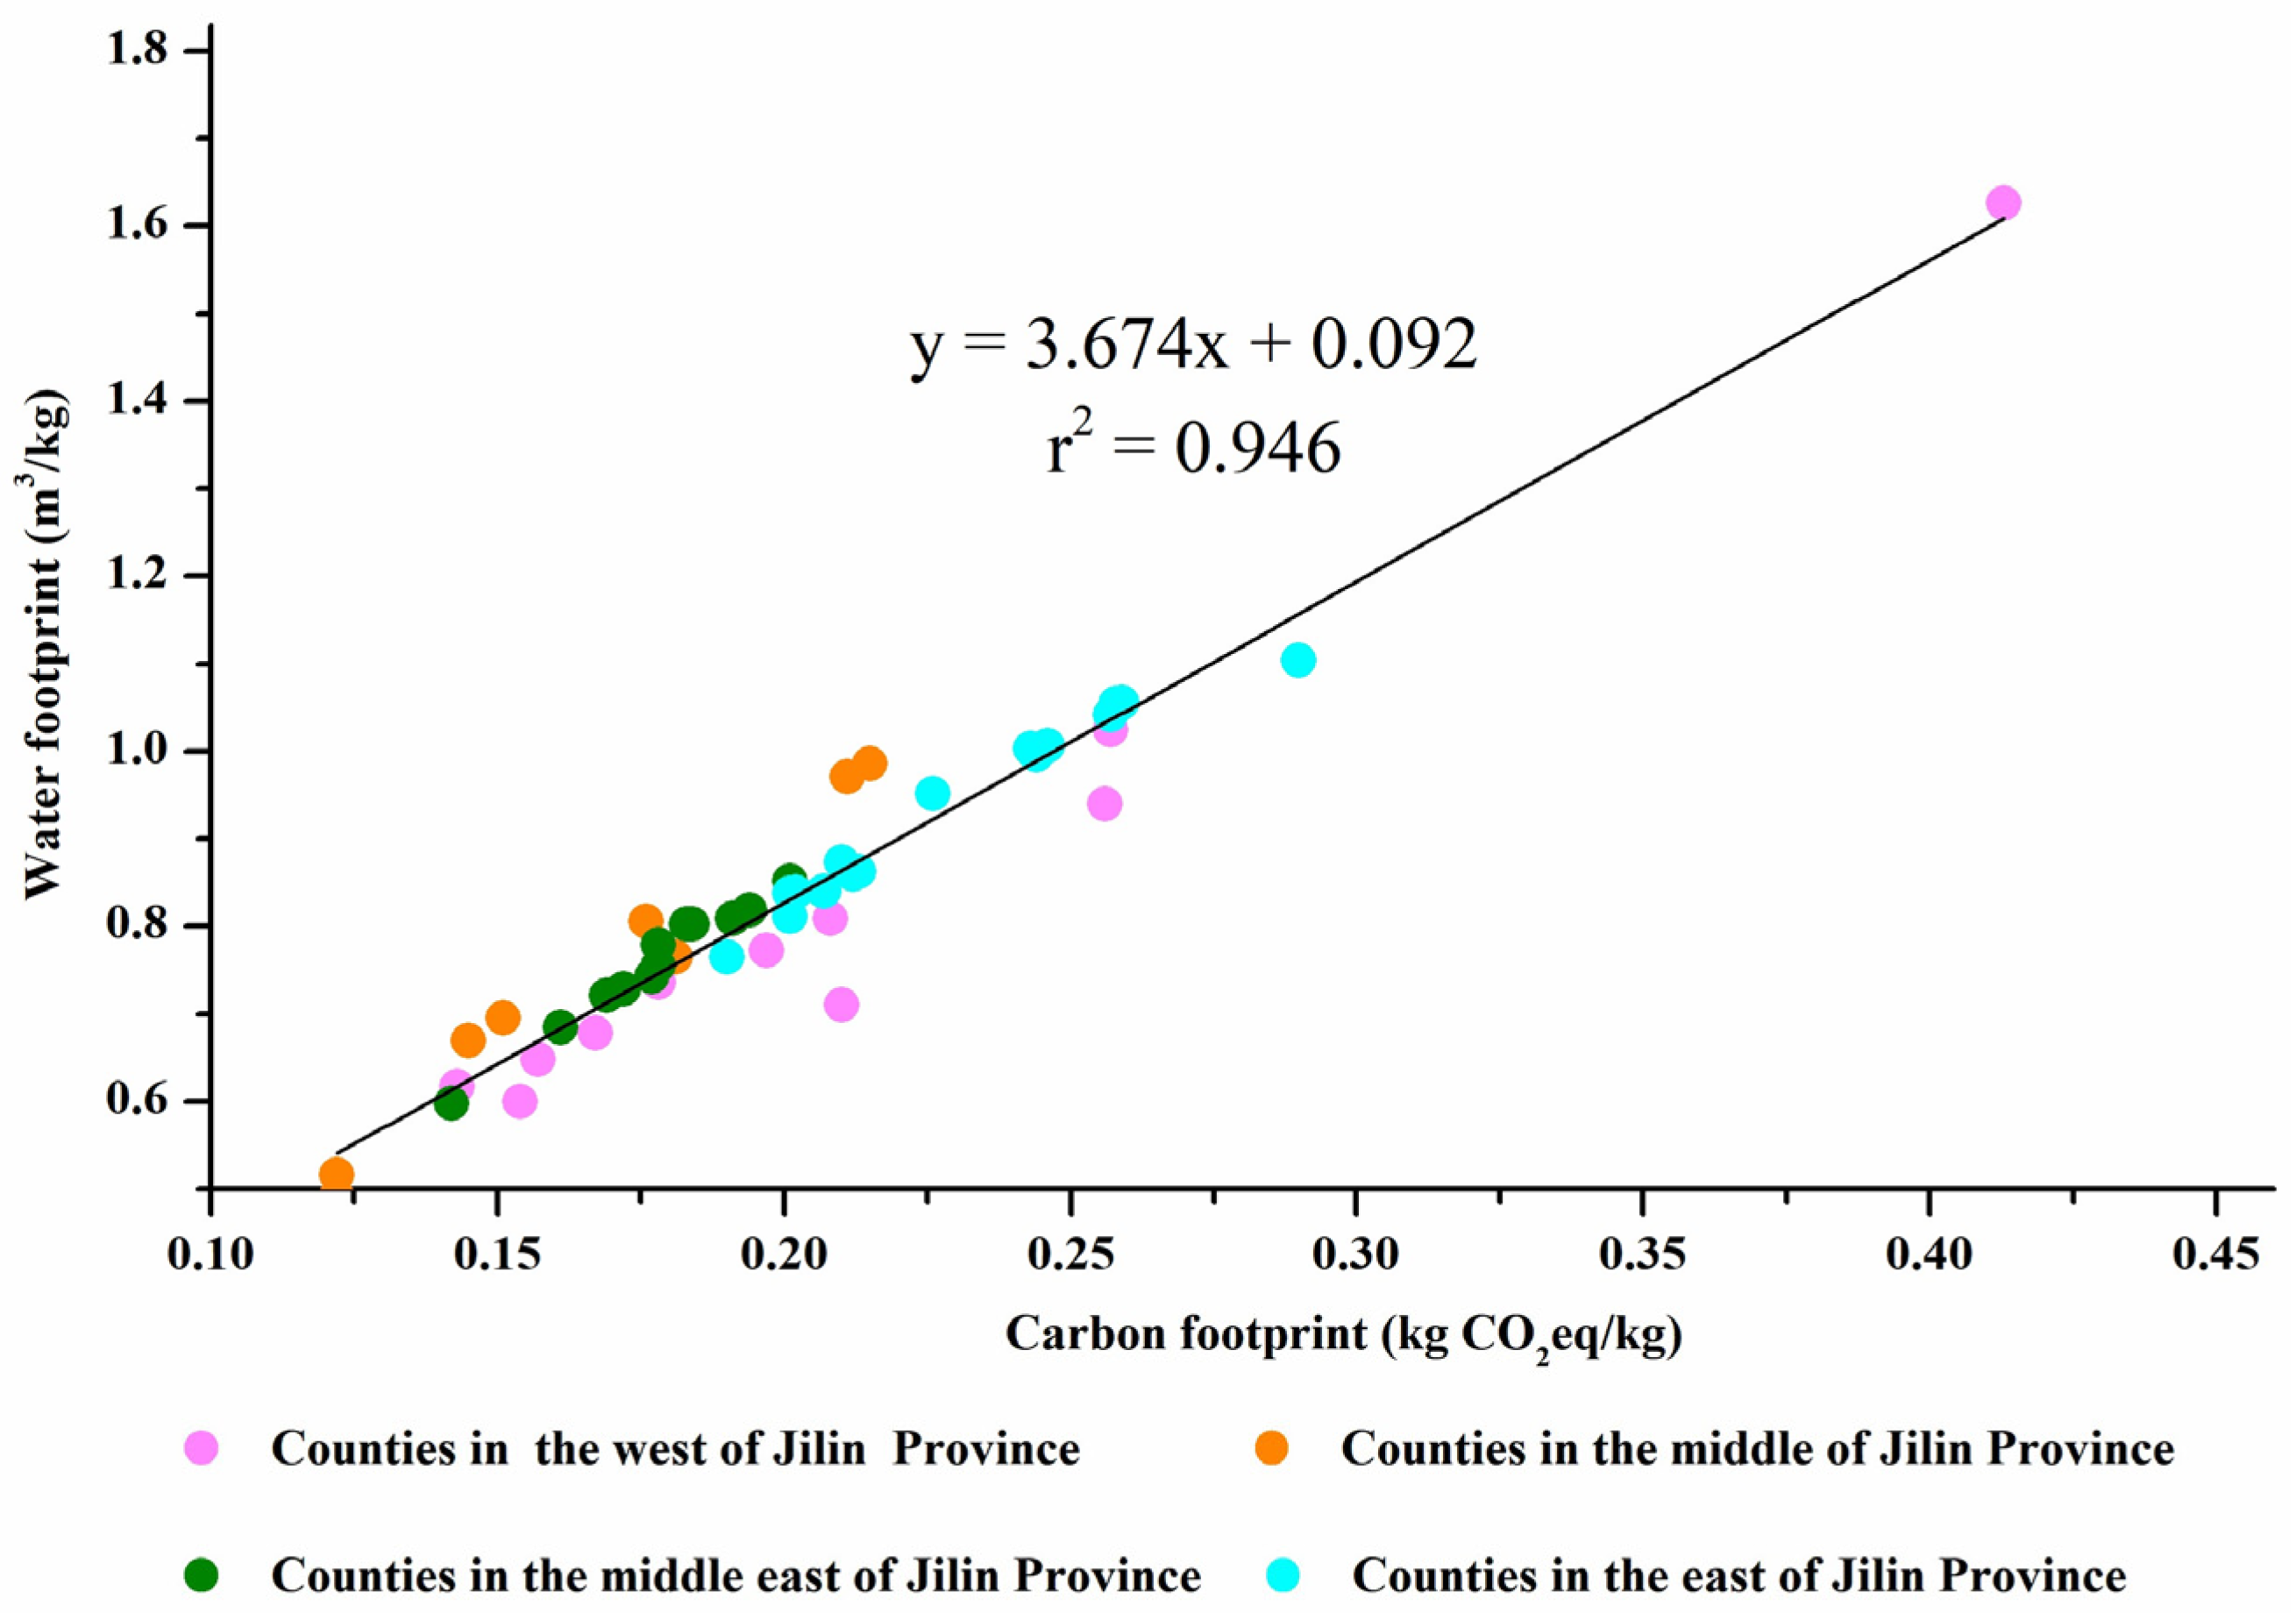
3.3. Relationship of CFs and WFs

The CFs and WFs of maize production in Jilin Province exhibited a significant positive relationship in spatial distribution (Figure 9), and the correlation coefficient was 0.946. That is, in the regions where the CF was high, the WF was also high. Moreover, the higher CF and WF values were distributed in eastern and western Jilin Province. The highest CF and WF were 0.437 kg CO2eq/kg and 1.625 m3/kg, respectively, and were found in Tongyu county located in the west of Jilin Province. The lowest CF and WF appeared in Lishu County, located in the middle of Jilin Province, with values of 0.122 kgCO2eq/kg and 0.492 m3/kg, respectively.
In addition, in terms of annual changes in CFs and WFs, both generally exhibited consistent trends (Figure 10), especially the CFs and gray WFs. The gray WF was caused by the application of N fertilizer, and GHG emissions were also associated with the use of N fertilizers; for example, N2O emissions from N fertilizer were responsible for 32% of the total CF during 2004–2017. This result was motivated by the fact that fertilizer had a common impact on CF and WF, especially the gray WF.

4. Discussion

The carbon and water footprints are two indicators used to evaluate GHG emissions and water consumption, respectively; these indicators provide new ways to comprehensively evaluate the impacts of agricultural production on the environment. Therefore, the simultaneous assessment of both the CF and WF of crop production is desirable to provide better insights into the key environmental issues than those provided using either indicator in isolation [40]. Exploring the relationship between CFs and WFs is helpful for proposing strategies to relieve environmental pressures.
Nicola Casolani considered that there were several similarities among the possible strategies that could be implemented to reduce the CF and WF of durum wheat production in Italy, such as a reduction in fertilizer because the CFs and WFs exhibited the same spatial distributions [33]. Zhang et al. also found the same conclusion regarding the significantly positive relationship between CFs and WFs and showed the potential for their simultaneous mitigation in regions with high agricultural inputs [41]. The relationship between WFs and CFs in this study was the same. This study indicated there existed synergies between the CFs and WFs from the perspective of time and space, which was conducive to explore common influencing factors and formulate the simultaneous mitigation, achieving triple-win agriculture with low carbon use and water and energy savings.
While the drivers that influence the water consumption and GHG emissions of crop production are numerous, the main factors include the use of fertilizer, agricultural machinery and some natural factors (temperature, precipitation) [42,43,44]. Fertilizers can improve soil fertility, which is an effective measure to increase yield per unit area, but they are also the main source of water pollution and GHG emissions. In other work, there was a significant positive correlation between the WF and fertilizer use [45], and fertilizer was the largest contributor to the CF of maize production in Northeast China [46]. In addition, agricultural machinery is also an important factor affecting the WFs and CFs. The use of agricultural machinery greatly increased the yield and decreased the WF [45], while increases in the use of agricultural machinery increased the diesel input, resulting in an increase in GHG emissions; there was a significant positive correlation between the diesel input amount and the CF [47].
In this study, there were some common influencing factors between the CF and WF of maize production in Jilin Province. A first common element was fertilization; therefore, the optimization of fertilizer use in maize production would drastically reduce the CF (due to lower GHG emissions from the production and use of fertilizers) and preserve the quality of surface and groundwater to reduce the gray WF. Some farmers in Jilin Province fertilized according to traditional experience, which was associated with great uncertainty and randomness. This practice not only wastes fertilizer and makes it difficult to achieve maximum yields but also generates a large amount of carbon emissions and water pollution in the production process. Therefore, farmers in Jilin Province should pay attention to the combined application of base fertilizer and top dressing, reduce the proportion of base fertilizer application, and increase the frequency of top dressing. In addition, the technologies of soil testing and formula fertilization have certain effects on improving maize yield and fertilizer utilization [48]. The government should encourage and guide farmers to use soil testing and formula fertilization technologies to achieve high yields. Then, the CF and WF will be simultaneously reduced, and low-carbon and low-pollution agriculture will be achieved.
Improvements in agricultural mechanization have played an important role in sustainable agricultural development. Therefore, improving the level of mechanization and improving the efficient use of agricultural machinery would be conducive to reducing the CF and WF of crop production. The use of agricultural machinery has greatly increased agricultural productivity, while the increase in diesel combustion causes an increase in CO2 emissions in the process of crop production. Therefore, the promotion of fuel-saving technology can reduce diesel use and improve the efficiency of agricultural machinery [49], which are conducive to achieving the goals of low-carbon agriculture and environmental protection.
In addition to optimized fertilization and agricultural mechanization, no-till technology with a straw return is also a good method for decreasing the CFs and WFs of crop production. This technology cannot only increase yield and reduce fertilizer use but can also increase soil water holding capacity, reduce soil evapotranspiration and nutrient loss, and increase soil organic carbon [50,51], which can alleviate carbon emissions and freshwater consumption and thus decrease CF and WF simultaneously.

5. Conclusions

Maize is the principal cereal crop in Jilin Province, and maize growth has impacts on freshwater consumption and GHG emissions. This study estimated the maize CF and WF from 2004 to 2017 in Jilin Province and analyzed their spatiotemporal characteristics and the relationship between them. The results showed that the average CF and WF were 0.177 kg CO2eq/kg and 0.806 m3/kg from 2004 to 2017, respectively; 69% of the GHG emissions were due to the manufacture, transportation and application of fertilizer, and 84% of the water use was attributed to the green WF. Moreover, the counties with higher CFs and WFs were distributed in eastern and western Jilin Province from 2004 to 2017. While the areas with high CFs and WFs expanded to the middle of Jilin Province in 2017 because the increase in machinery and fertilizer inputs led to a higher CF, and the increase in rainfall led to a higher green WF. Furthermore, the significantly positive relationships between CFs and WFs indicated that there is an opportunity for the simultaneous mitigation of the CF and WF. The implementation of strategies aimed at reducing the CF could also have positive effects on the WF, such as suitable fertilization, fuel-saving technology, and no-till technology with a straw return, which can be captured to simultaneously mitigate GHG emissions and the water consumption of maize production in Jilin Province. Therefore, understanding the interrelationship between the CF and WF is essential for achieving consistency among different environmental strategies, which is conducive to achieving the goals of low-carbon agriculture and the sustainable use of water resources for crop production.

Author Contributions

L.J.: data curation, formal analysis and writing—original draft; L.Q.: conceptualization, supervision and writing—review and editing; and H.Z., J.W., B.L. and Y.D.: writing—review and editing. All authors have read and agreed to the published version of the manuscript.

Funding

This work was funded by the National Key R&D Program of China (2019YFC0409101), the National Natural Science Foundation of China (41571526), and the Key Project of the National Natural Science Foundation of China (41630749).

Conflicts of Interest

The authors declare no conflict of interest.

References

  1. Davis, K.F.; Rulli, M.C.; Seveso, A. Increased food production and reduced water use through optimized crop distribution. Nat. Geosci. 2017, 10, 919–924. [Google Scholar] [CrossRef]
  2. Ruddiman, W.F. The anthropogenic greenhouse era began thousands of years ago. Nat. Clim. Chang. 2003, 61, 261–293. [Google Scholar] [CrossRef]
  3. Huang, F.; Liu, Z.; Ridoutt, B.G.; Huang, J.; Li, B. China’s water for food under growing water scarcity. Food Secur. 2015, 7, 933–949. [Google Scholar] [CrossRef]
  4. Piao, S.L.; Ciais, P.; Huang, Y.; Shen, Z.; Peng, S.; Li, J.; Zhou, L.; Liu, H.; Ma, Y.; Ding, Y.; et al. The impacts of climate change on water resources and agriculture in China. Nature 2010, 467, 43–51. [Google Scholar] [CrossRef] [PubMed]
  5. Rodriguez, C.I.; de Galarreta, V.R.; Kruse, E.E. Analysis of water footprint of potato production in the pampean region of Argentina. J. Clean. Prod. 2015, 90, 91–96. [Google Scholar] [CrossRef]
  6. Janzen, H.H.; Beauchemin, K.A.; Bruinsma, Y.; Campbell, C.A.; Desjardins, R.L.; Ellert, B.H.; Smith, E.G. The fate of nitrogen in agroecosystems: An illustration using Canadian estimates. Nutr. Cycl. Agroecosyst. 2003, 67, 85–102. [Google Scholar] [CrossRef]
  7. Farming Needs a ‘Revolution’ for UK to Meet Climate Goals [EB/OL]. Available online: https://www.Carbonbrief.org/ccc-farming-needs-revolution-for-uk-meet-climate-goals (accessed on 20 January 2019).
  8. Yang, X.L.; Lu, Y.L.; Ding, Y.; Yin, X.F. Optimising nitrogen fertilization: A key to improving nitrogen-use efficiency and minimising nitrate leaching losses in an intensive wheat/maize rotation (2008–2014). Filed Crops Res. 2017, 206, 1–10. [Google Scholar] [CrossRef]
  9. Khan, S.; Hanjra, M.A. Footprints of water and energy inputs in food production-global perspectives. Food Policy 2009, 34, 130–140. [Google Scholar] [CrossRef]
  10. Zhang, G.; Lu, F.; Huang, Z. Estimations of application dosage and greenhouse gas emission of chemical pesticides in staple crops in China. China J. Appl. Ecol. 2016, 27, 2875–2883. [Google Scholar]
  11. Zhang, G.; Wang, X.; Sun, B. Status of mineral nitrogen fertilization and net mitigation potential of the state fertilization recommendation in Chinese cropland. Agric. Syst. 2016, 146, 1–10. [Google Scholar] [CrossRef]
  12. Mekonnen, M.M.; Hoekstra, A.Y. Global gray water footprint and water pollution levels related to anthropogenic nitrogen loads to fresh water. Environ. Sci. Technol. 2015, 49, 12860–12868. [Google Scholar] [CrossRef] [PubMed]
  13. Fang, K. Footprint family: Concept/type, theoretical framework and integration model. Acta Ecol. Sin. 2015, 36, 1647–1659. (In Chinese) [Google Scholar]
  14. Wiedmann, T.; Minx, J. A definition of carbon footprint. Ecol. Econ. Res. 2008, 1, 1–11. [Google Scholar]
  15. Hammod, G. Time to give due weight to the ‘carbon footprint’ issue. Nature 2007, 445, 256. [Google Scholar] [CrossRef] [PubMed] [Green Version]
  16. Yi, Y.; Sangwon, S. Changes in environmental impacts of major crops in the US. Environ. Res. Lett. 2015, 10, 094016. [Google Scholar]
  17. Visser, F.; Dargusch, P.; Smith, C.; Grace, P.R. A comparative analysis of relevant crop carbon footprint calculators, with reference to cotton production in Australia. Agoecol. Sustain. Food 2014, 38, 962–992. [Google Scholar] [CrossRef]
  18. Liu, J.J.; Chen, H. Assessment of carbon footprint of rice production in Heilongjiang Province. J. South. Agric. 2018, 49, 1667–1673. (In Chinese) [Google Scholar]
  19. Liu, X.K.; Huang, H.X.; Han, W.W. Study on evaluation Method rice carbon footprint and development of carbon footprint calculator. J. JiangXi Agric. 2018, 30, 105–109. (In Chinese) [Google Scholar]
  20. Liu, S.; Wang, X.Q.; Cui, L.L. Carbon footprint and its impact factors of feed crops in Guanzhong Plain. Acta. Sci. Circ. 2017, 37, 1201–1208. (In Chinese) [Google Scholar]
  21. Wang, Z.B.; Wang, M.; Chen, F. Carbon footprint analysis of crop production in north China Plain. Sci. Agric. Sin. 2015, 48, 83–92. (In Chinese) [Google Scholar]
  22. Hoeksrra, A.Y. Virtual Water Trade: Proceeding of international Expert Meeting on Virtual Water Trade (NO.12); IHE Delft: Delft, The Netherlands, 2003; Available online: www.waterfootprint.org/Reports/Report12.pdf (accessed on 24 December 2020).
  23. Hoekstra, A.Y.; Chapagain, A.K. The Water Footprint Assessment Manual: Setting the Global Standard; Earthscan: London, UK, 2011; pp. 40–45. [Google Scholar]
  24. Chapagain, A.K.; Hoekstra, A.Y. The blue, green, grey footprint of rice from production and consumption perspective. Ecol. Econ. 2011, 70, 749–758. [Google Scholar] [CrossRef]
  25. Mekonnen, M.M.; Gerbens-Leenes, W. The water footprint of global food production. Water 2020, 12, 2696. [Google Scholar] [CrossRef]
  26. Ewaid, S.H.; Abed, S.A.; Al-Ansari, N. Water footprint of wheat in Iraq. Water 2019, 11, 535. [Google Scholar] [CrossRef] [Green Version]
  27. He, H.; Huang, J.; Tong, W.J. The Water footprint and its temporal change characteristics of rice in Hunan. Chin. Agri. Sci. Bull. 2010, 32, 294–298. (In Chinese) [Google Scholar]
  28. Cao, L.H.; Wu, P.T.; Zhao, X.N. Evaluation of grey water footprint of grain production in Hetao irrigation district, inner Moreongolia. Chin. Agri. Eng. 2014, 30, 63–72. (In Chinese) [Google Scholar]
  29. Li, H.Y.; Qin, L.J.; He, H.S. Characteristics of the water footprint of rice production under different rainfall years in Jilin Province, China. J. Sci. Food. Agric. 2018, 98, 3001–3013. [Google Scholar] [CrossRef] [PubMed]
  30. Lovarelli, D.; Ingrao, C.; Fiala, M.; Bacenetti, J. Beyond the water footprint: A new framework proposal to assess freshwater environmental impact and consumption. J. Clean. Prod. 2018, 172, 4189–4199. [Google Scholar] [CrossRef]
  31. Darre, E.; Cadenazzi, M.; Mazzilli, S.R.; Rosas, J.F.; Picasso, V.D. Environmental impacts on water resources from summer crops in rainfed and irrigated systems. J. Environ. Manag. 2019, 232, 514–522. [Google Scholar] [CrossRef]
  32. Galli, A.; Wiedmann, T.; Ercin, E. Integrating ecological, carbon and water footprint into a “Footprint Family” of indicators: Definition and role in tracking human pressure on the planet. Ecol. Indic. 2012, 16, 100–112. [Google Scholar] [CrossRef]
  33. Nicola, C.; Claudio, P.; Lolita, L. Water and carbon footprint perspective in Italian durum wheat production. Land Use Policy 2016, 58, 394–402. [Google Scholar]
  34. Page, G.; Ridoutt, B.; Bellotti, B. Carbon and water footprint tradeoffs in fresh tomato production. J. Clean. Prod. 2012, 32, 219–226. [Google Scholar] [CrossRef]
  35. Dong, W.H. Analysis of problems existing in the process of maize production in Northeast China. Agric. Dev. Equip. 2017, 11, 44. (In Chinese) [Google Scholar]
  36. Li, C.G.; Dong, H.H. Geography of Jilin Province; Beijing Normal University Publishing Group: Beijing, China, 2010. (In Chinese) [Google Scholar]
  37. Yin, G.H.; Chen, W.F.; Liu, Z.X. Study on irrigating-sowing with machine in semiarid area of north of China. Res. Agric. Mod. 2007, 2, 238–240. (In Chinese) [Google Scholar]
  38. Liu, X.L.; Wang, H.T.; Chen, J. Method and basic model for development of Chinese reference life cycle database of fundamental industries. Acta Sci. Circumstantiae 2010, 30, 2136–2144. [Google Scholar]
  39. IPCC. 2006 IPCC Guidelines for National Greenhouse Gas Inventories, Prepared by the National Greenhouse Gas Inventories Programme; IGES: Tokyo, Japan, 2006. [Google Scholar]
  40. Eros, B.; Paolo, T.; Francesco, M. Sustainable patterns of main agricultural products combining different footprint parameters. J. Clean. Prod. 2018, 170, 357–367. [Google Scholar]
  41. Zhang, G.; Wang, X.K.; Zhang, L. Carbon and water footprint of major cereal crops production in China. J. Clean. Prod. 2018, 194, 613–623. [Google Scholar] [CrossRef]
  42. Arunrat, N.; Pumijumnong, N.; Sereenonchai, S.; Chareonwong, U.; Wang, C. Assessment of climate change impact on rice yield and water footprint of large-scale and individual farming in Thailand. Sci. Total Environ. 2020, 726, 137864. [Google Scholar] [CrossRef]
  43. Duan, P.L.; Qin, L.J.; Wang, Y.Q.; He, H.S. Spatiotemporal correlations between water footprint and agricultural inputs: A case study of maize production in Northeast China. Water 2015, 7, 4026–4040. [Google Scholar] [CrossRef] [Green Version]
  44. Gan, Y.T.; Liang, C.; Chai, Q.; Lemke, R.L. Improving farming practices reduces the carbon footprint of spring wheat production. Nat. Commun. 2014, 5, 5012. [Google Scholar] [CrossRef] [Green Version]
  45. Zhang, X.D.; Wu, D.; Hao, D.; Sun, S.J.; Shi, R.Q. Influencing factors and spatial clustering of maize production water footprint in Liaoning Province. Water Sav. Irrig. 2019, 12, 83–87. (In Chinese) [Google Scholar]
  46. Huang, X.M.; Chen, C.Q.; Chen, M.Z. Carbon footprints of major staple grain crops production in three provinces of Northeast China during 2004–2013. Chin. J. Appl. Ecol. 2016, 27, 3307–3315. (In Chinese) [Google Scholar]
  47. Xu, X.M.; Lan, Y. Spatial and temporal patterns of carbon footprints of grain crops in China. J. Clean. Prod. 2017, 146, 218–227. [Google Scholar] [CrossRef]
  48. Deng, T.T. Application status and measures of soil testing and formula fertilization technology for maize production. Model. Agric. Technol. 2020, 18, 42–44. (In Chinese) [Google Scholar]
  49. Guo, W.Y. Analysis on the popularization and development of Oil-saving Technology. Agric. Mech. Use Main. 2020, 4, 41. (In Chinese) [Google Scholar]
  50. Wang, J.; Lu, G.; Guo, X.; Wang, Y.; Ding, S.; Wang, D. Conservation tillage and optimized fertilization reduce winter runoff losses of nitrogen and phosphorus from farmland in the Chaohu Lake region, China. Nutr. Cycl. Agroecosyst. 2015, 101, 93–105. [Google Scholar] [CrossRef]
  51. Yadav, G.S.; Babu, S.; Das, A. No-till and mulching enhance energy use efficiency and reduce carbon footprint of a direct-seeded upland rice production system. J. Clean. Prod. 2020, 271, 122700. [Google Scholar] [CrossRef]
Figure 1. Location of Jilin province and its counties.
Water 13 00017 g001
Figure 2. System boundaries of the carbon footprint (CF) and water footprint (WF) of maize production.
Water 13 00017 g002
Figure 3. CFs and its composition of maize production in Jilin Province from 2004 to 2017.
Water 13 00017 g003
Figure 4. Spatial distributions of the CFs of maize production in 2004 and 2017.
Water 13 00017 g004
Figure 5. Constitutions of the CFs of maize production in Jilin Province in 2004 and 2017.
Water 13 00017 g005
Figure 6. Blue, green and gray WFs of maize production from 2004 to 2017.
Water 13 00017 g006
Figure 7. Spatial distributions of the total WFs of maize production in 2004 and 2017.
Water 13 00017 g007
Figure 8. Spatial distributions of the blue, green and gray WFs in Jilin Province in 2004 and 2017.
Water 13 00017 g008
Figure 9. Relationship between the spatial distributions of the CF and WF.
Water 13 00017 g009
Figure 10. Relationships between the time series of the CF and the WF: (a) the CF and the total WF; (b) the CF and the blue WF; (c) the CF and the green WF; (d) the CF and the gray WF.
Water 13 00017 g010
Table 1. General characteristics of different regions in Jilin Province.
RegionLandformsAverage Temperature (°C)>10 °C Accumulated
Temperature (°C)
Average Annual
Precipitation (mm)
EastMountains2.7–6.41900–2800700–900
Middle eastLow mountains and hills3.5–4.92700–2900650–700
MiddlePlains3.7–5.92900–3000500–600
WestPlains4.4–5.32900–3050400–500
Table 2. Irrigation water used in different regions in Jilin Province under different rainfall years (m3/hm2).
EastMiddle EastMiddleWest
Wet year0203040
Normal year0304050
Dry year0506070
Table 3. Greenhouse gas (GHG) emission factors of different inputs and soils used for maize production in Jilin Province.
Emission SourceEmission FactorReference
N fertilizer1.53 kg CO2eq/kgCLCD0.7
K fertilizer0.65 kg CO2eq/kgCLCD0.7
Compound fertilizer1.77 kg CO2eq/kgCLCD0.7
Diesel fuel0.89 kg CO2eq/kgCLCD0.7
Diesel combustion4.10 kg CO2eq/kgCLCD0.7
Insecticide16.60 kg CO2eq/kgCLCD0.7
Bactericide10.57 kg CO2eq/kgCLCD0.7
Herbicide10.15 kg CO2eq/kgCLCD0.7
Seeds1.93 kg CO2eq/kgEcoinvent2.2
N2O emissions from fields0.01 kg CO2eq/kgIPCC
Publisher’s Note: MDPI stays neutral with regard to jurisdictional claims in published maps and institutional affiliations.

