Article

Dynamic Hydraulics in a Drinking Water Distribution System Influence Suspended Particles and Turbidity, But Not Microbiology

by
Emmanuelle I. Prest
1,*,
Peter G. Schaap
2,3,
Michael D. Besmer
4 and
Frederik Hammes
5
1
PWNT, 1991 AS Velserbroek, The Netherlands
2
PWN Water Supply Company North-Holland, 1991 AS Velserbroek, The Netherlands
3
Spatial Insight BV, 2011 ND Haarlem, The Netherlands
4
onCyt Microbiology AG, 8038 Zürich, Switzerland
5
Department of Environmental Microbiology, Eawag—Swiss Federal Institute of Aquatic Science and Technology, 8600 Dübendorf, Switzerland
*
Author to whom correspondence should be addressed.
Water 2021, 13(1), 109; https://doi.org/10.3390/w13010109
Submission received: 19 November 2020 / Revised: 18 December 2020 / Accepted: 29 December 2020 / Published: 5 January 2021
(This article belongs to the Section Hydraulics and Hydrodynamics)

Abstract

:
Spatial and short-term temporal changes in water quality as a result of water age and fluctuating hydraulic conditions were investigated in a drinking water distribution system. Online measurements of total and intracellular adenosine tri-phosphate (ATP), total and intact cell concentrations measured with flow cytometry (FCM), turbidity, and particle counts were performed over five weeks at five subsequent locations of the distribution system. The high number of parallel FCM and ATP measurements revealed the combined effect of water age and final disinfection on spatial changes in microbiology in the system. The results underlined that regular daily dynamics in flow velocities are normal and inevitable in drinking water distribution systems, and significantly impact particle counts and turbidity. However, hydraulic conditions had no detectable impact on the concentration of suspended microbial cells. A weak correlation between flow velocity and ATP concentrations suggests incidental resuspension of particle-bound bacteria, presumably caused by either biofilm detachment or resuspension from sediment when flow velocities increase. The highly dynamic hydraulic conditions highlight the value of online monitoring tools for the meaningful description of short-term dynamics (day-scale) in drinking water distribution systems.

1. Introduction

Drinking water quality can change during water distribution as a result of both increased residence time and hydraulic changes. Drinking water distribution systems (DWDSs) are complex networks of interconnected pipes of various diameters. Typically, drinking water flows from the treatment plant through large transport mains (400 to 1000 mm in diameter) towards distribution areas with smaller distribution pipes (40 to 300 mm in diameter). In some cases, reservoirs and pumping stations are located at intermediate locations in the DWDS [1,2,3]. Flow conditions through reservoirs, transport mains, and distribution pipes are dependent on the network configuration, pipe diameters, water demand, and water consumption profile of consumers [1,3,4]. Water consumption profiles lead to varying flow rates and velocities, with the highest velocities typically in the morning and in the evening, when the water consumption in residential areas is highest [1,5]. At a given flow rate, a small diameter pipe is subject to a higher flow velocity and higher shear stress than larger pipes; as a consequence of the network layout, small distribution pipes, typically at the end of the network, receive lower flow rates and are subject to low flow velocities or even stagnant periods. The demand pattern, flow, and shear conditions are more variable when going deeper in the system [3].
The complex hydraulic conditions resulting from the system configuration and varying water consumption have a direct impact on water quality. Turbidity, for example, is directly influenced by flow velocity variations impacting particle deposition and resuspension, as well as shear stress on pipe walls [4,6,7]. The impact of varying flow velocities on microbial parameters in the drinking water is, however, less understood. Microbial communities in DWDSs are located in different phases: in the bulk water, attached to suspended particles, attached to loose sediments, and in biofilms [8,9,10]. These phases harbor different microbial communities and varying bacterial abundances, with the highest densities reported in loose deposits and sediments [9,11]. The different phases interact with each other through bacterial attachment and detachment from particles, sediment resuspension, or biofilm detachment [12]. In fact, several studies have shown increased bacterial shearing and detachment from biofilms as a consequence of increased flow velocities [13,14]. It is, therefore, reasonable to infer that intermittently increased flow velocities in distribution systems would affect detachment and resuspension of bacteria and particle-associated bacteria from sediments and biofilms, resulting in a change in microbial water quality.
Grab sampling is conventionally used to assess water quality in distribution systems. However, such labor-intensive sampling strategies do not suffice to adequately capture high-frequency dynamics in water systems [15,16]. Given the short time scales (daily variations) of hydraulic variations in the DWDS [5], monitoring with high temporal resolution is essential. While online tools for particles and turbidity are widely used, quantitative tools for online microbial monitoring are relatively new [17]. Online FCM has been applied for the study of different water systems (e.g., treated spring or ground water [15,16]), but has not been deployed extensively to investigate operational DWDSs to date. Hence, spatio-temporal changes in microbial water quality in the presence of fluctuating hydraulic conditions remain poorly characterized. In addition, comparison of hydraulic and microbiological dynamics at different locations throughout the DWDS is needed due to the complexity of the distribution infrastructure (pipe diameters, pipe material, service reservoirs, etc.).
The objective of the study was to investigate spatial and short-term temporal changes in water quality as a result of water age and hydraulic fluctuations in a large DWDS. The temporal and spatial variations were studied with online measurements of microbial parameters, including total and intracellular adenosine tri-phosphate (ATP), total and intact cell concentrations (based on flow cytometry), and abiotic parameters (turbidity, particle counts) over a period of five weeks in five subsequent locations of a DWDS. The novelty of this study is the extensive and simultaneous use of two recently emerging online microbiological sensors in a system on both temporal and spatial scales.

2. Materials and Methods

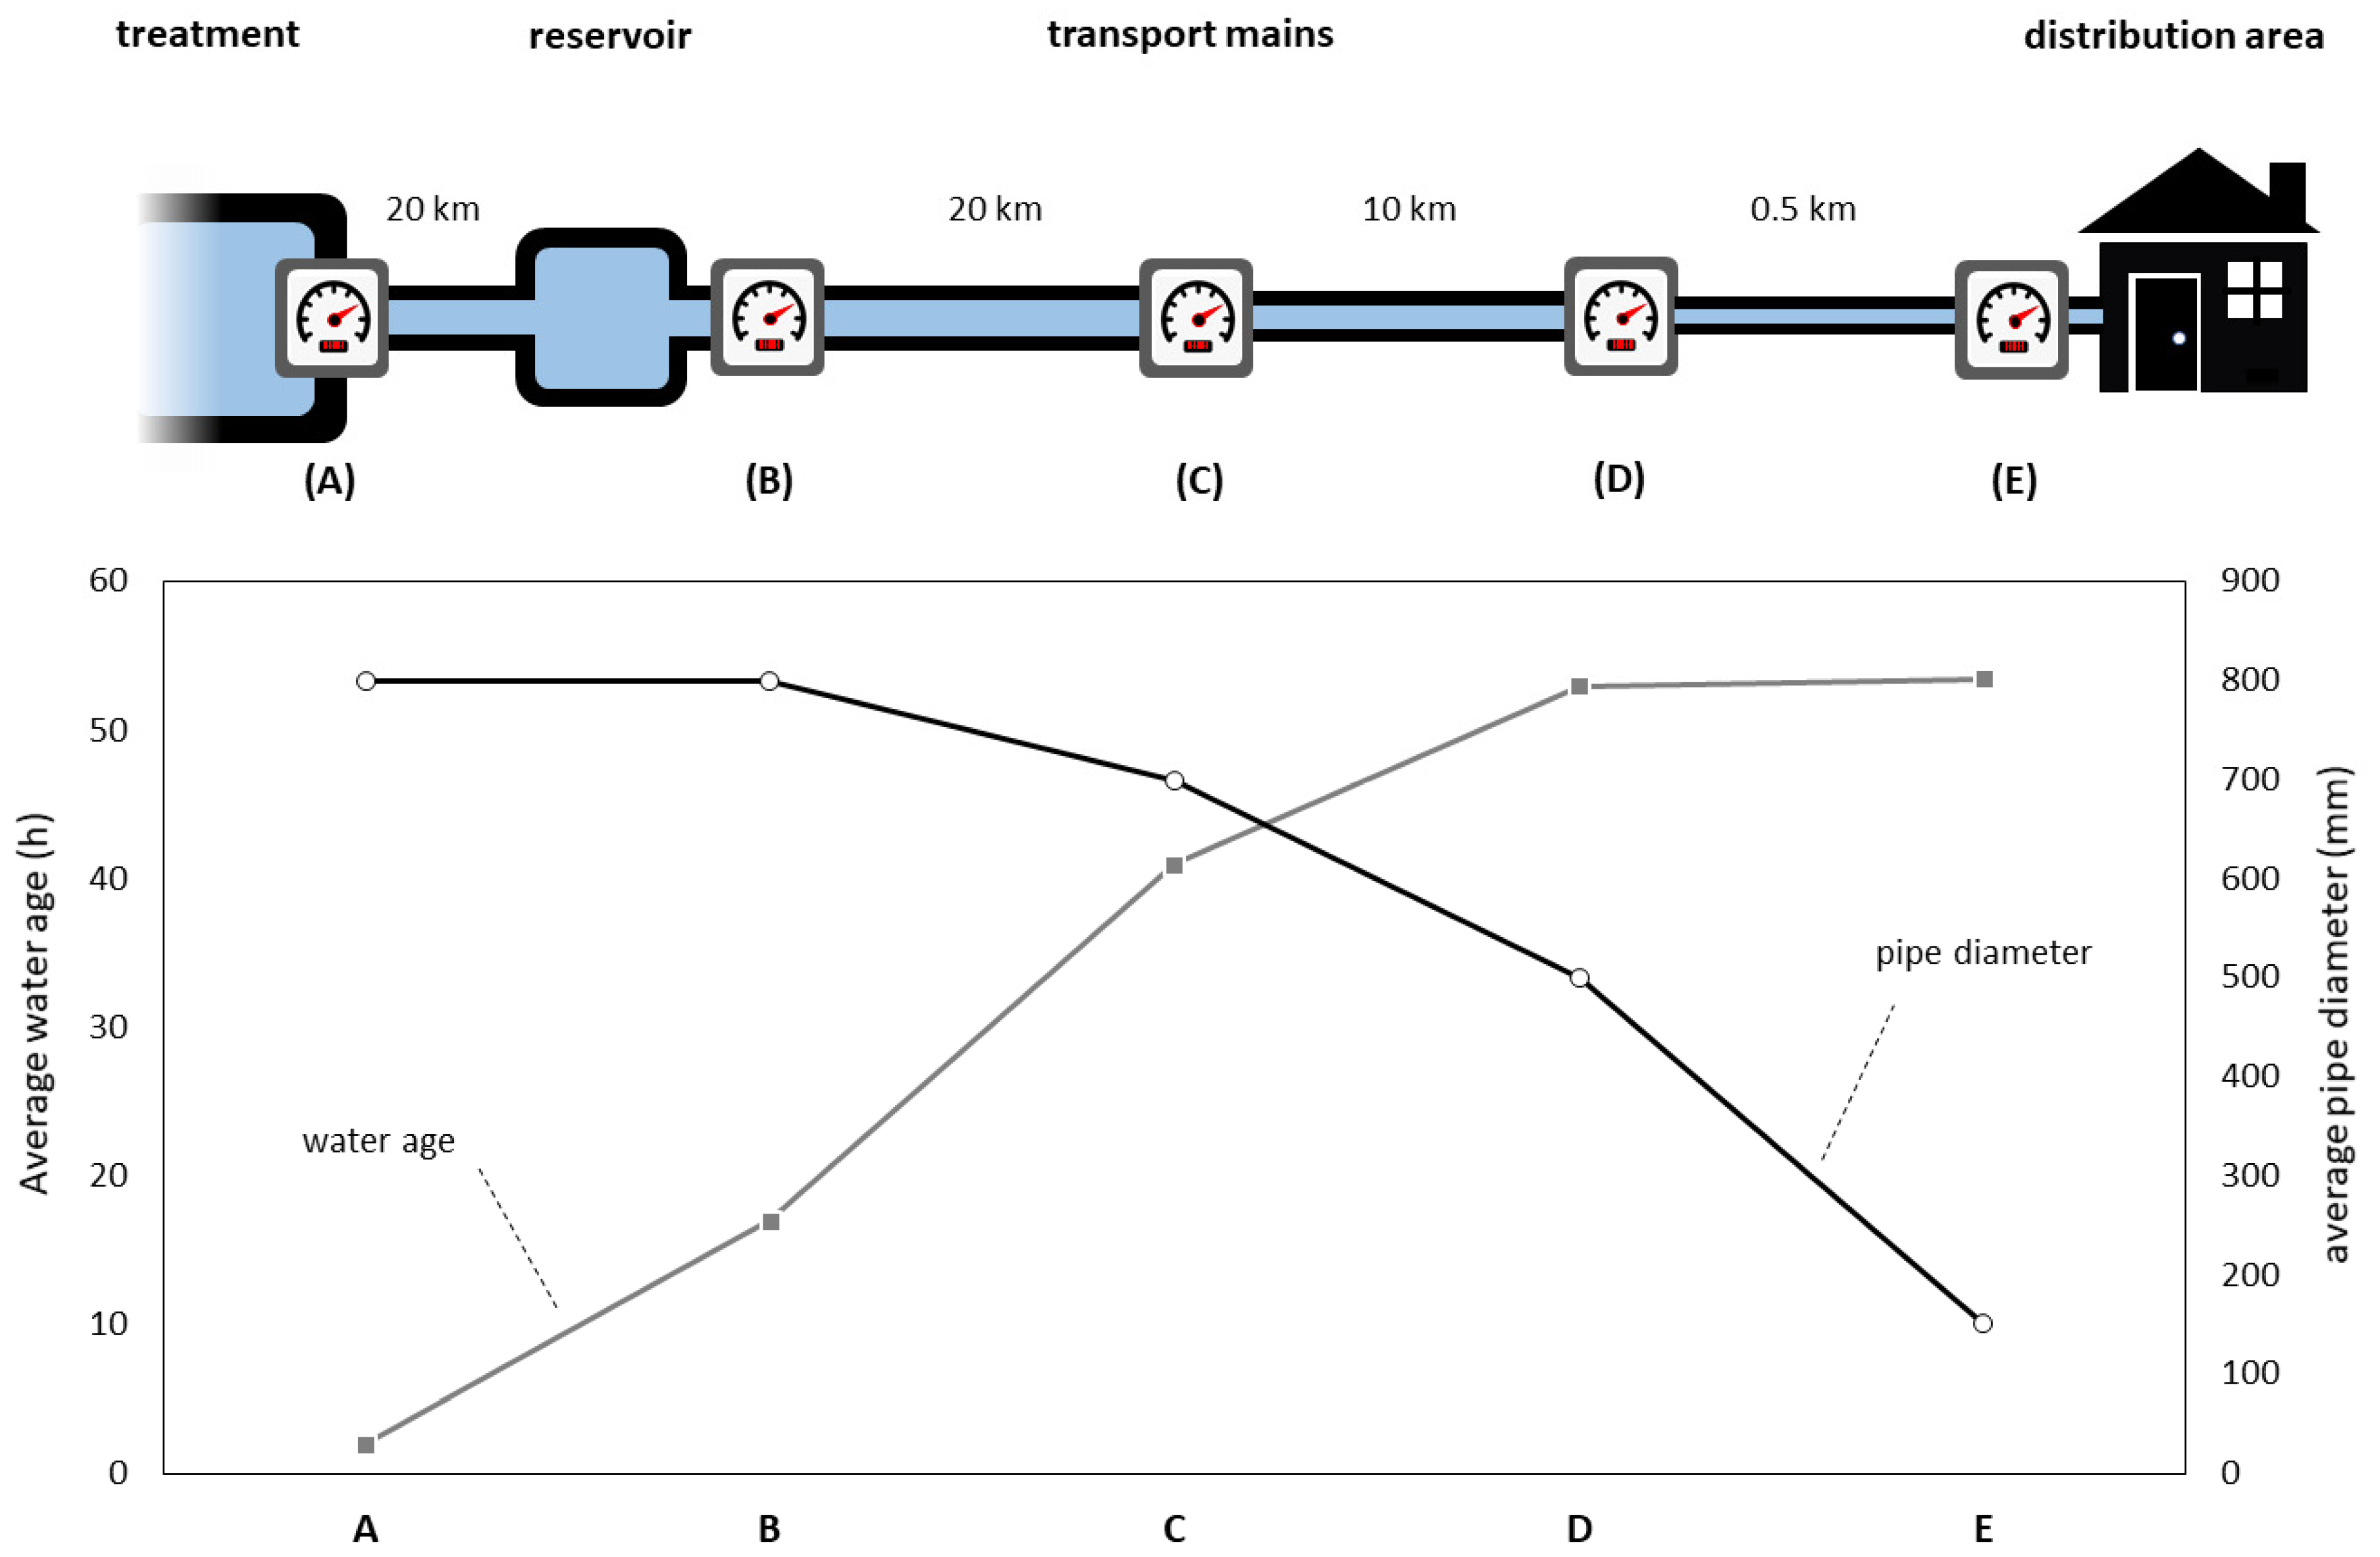
2.1. Study Locations

The study has been performed at an operating large-scale drinking water treatment plant (Andijk, The Netherlands) and in the corresponding DWDS. Surface water is treated at this location by coagulation, sedimentation, and sand filtration, followed by advanced oxidation and activated carbon filtration. Chlorine dioxide is dosed before the drinking water storage reservoir, resulting in a free chlorine residual after the reservoir in the range of 0.01–0.03 mg/L. Free chlorine concentrations decrease to below the detection limit (0.01 mg/L) after the first transport section, and drinking water is further transported and distributed without maintaining any residual disinfectant.
Five sampling locations were selected along a water trajectory from the treatment plant to a residential neighborhood (Figure 1): effluent of the drinking water reservoir at the treatment plant (A), effluent of a pumping station and reservoir located after a first transport section (B), tap points in two transport pipes (C and D), and one tap point from a distribution pipe (E). Water was collected at points C, D, and E via measure lances, i.e., small stainless steel pipes inserted through the pipe, enabling the collection of water from the middle of the pipe. Figure 1 provides information on pipe lengths and diameters and average residence time of the water at each studied location.

2.2. Measurement Scheme

Online turbidity and particle count measurements were recorded at all locations for the total study period of five weeks. In addition, an online detector for ATP was placed consecutively at each study location for one week. Two online flow cytometers (FCMs) were used for parallel measurements at two consecutive locations for one week, and thereafter moved further along the water trajectory, following the sampling scheme described in Table 1.

2.3. Online Turbidity, Particle Counts, and Flow Measurements

Turbidity was measured online at all locations (sc200 controller, sc100 controller, and Ultraturb sc, Hach) at a measurement time resolution of 1 min. The different turbidity meters used in this study had different baselines, therefore, the results were corrected based on measurements in parallel of all instruments on the same water for one week. Particle counters (WaterViewer, PAMAS) were used at all locations to record every 10 min the number of particles of eight particle size ranges (1 to 2 µm, 2 to 3 µm, 3 to 5 µm, 5 to 10 µm, 10 to 15 µm, 15 to 25 µm, 25 to 35 µm, >35 µm). Particle count data at location D is not shown due to malfunctioning of the instrument during the period of measurement. Flow rates at locations A and B were measured with electromagnetic flow meters (Magneto Flow Copa-X and Copa-XM, Fisher & Porter). The flow rates at locations C and D were modelled based on flow rates at the treatment plant and on the consumption profiles of the corresponding distribution areas. Flow rates at location E were measured with a portable ultrasonic flowmeter (UFP-20) at a frequency of six measurements per minute.

2.4. Online Flow Cytometry (FCM) Measurements

For online FCM, water was sampled from a continuously flowing bypass with an automated sampling, staining, and incubation module connected to an Accuri C6 flow cytometer (BD Accuri, San Jose CA, USA), as described previously [18]. In short, water samples were drawn discretely every 10 min and mixed with a fluorescent stain (SYBR Green I (Life Technologies, Eugene OR, USA); final concentration 1:10,000). This mixture was incubated for 10 min at 37 °C before transfer to the flow cytometer for measurement at a flow rate of 66 µL min−1 for 90 s with a lower threshold on the green fluorescence (FL1-H) channel of 1000. After each sampling and measurement cycle, the staining module was rinsed with nanopure water (deionized, 0.22 µm filtered). In addition, an extended cleaning cycle with hypochlorite and detergent was performed after every 100 samples. For data analysis, files were exported for batch processing with custom software. Fixed gates were applied to separate bacteria from background signals [19].

2.5. Online ATP Measurements

Online ATP analysis was done with an EZ-ATP analyzer (AppliTek) using EZ-ATP Water-Glo Reagents (Promega). In short, water was sampled directly from a bypass at 13 min intervals and directly measured for extracellular ATP. A sub-sample was then sonicated (120 s) and measured for total ATP. Intracellular ATP was calculated as the difference between the two obtained values. Relative light units (RLUs) were converted to ATP concentrations based on instrument calibration with ATP solutions of known concentrations (EZ-ATP Standards, 0 and 200 pg/mL). Four data points out of 264 collected at location B were not taken into account due to instrument error.

3. Results

3.1. Spatial Changes in Water Quality

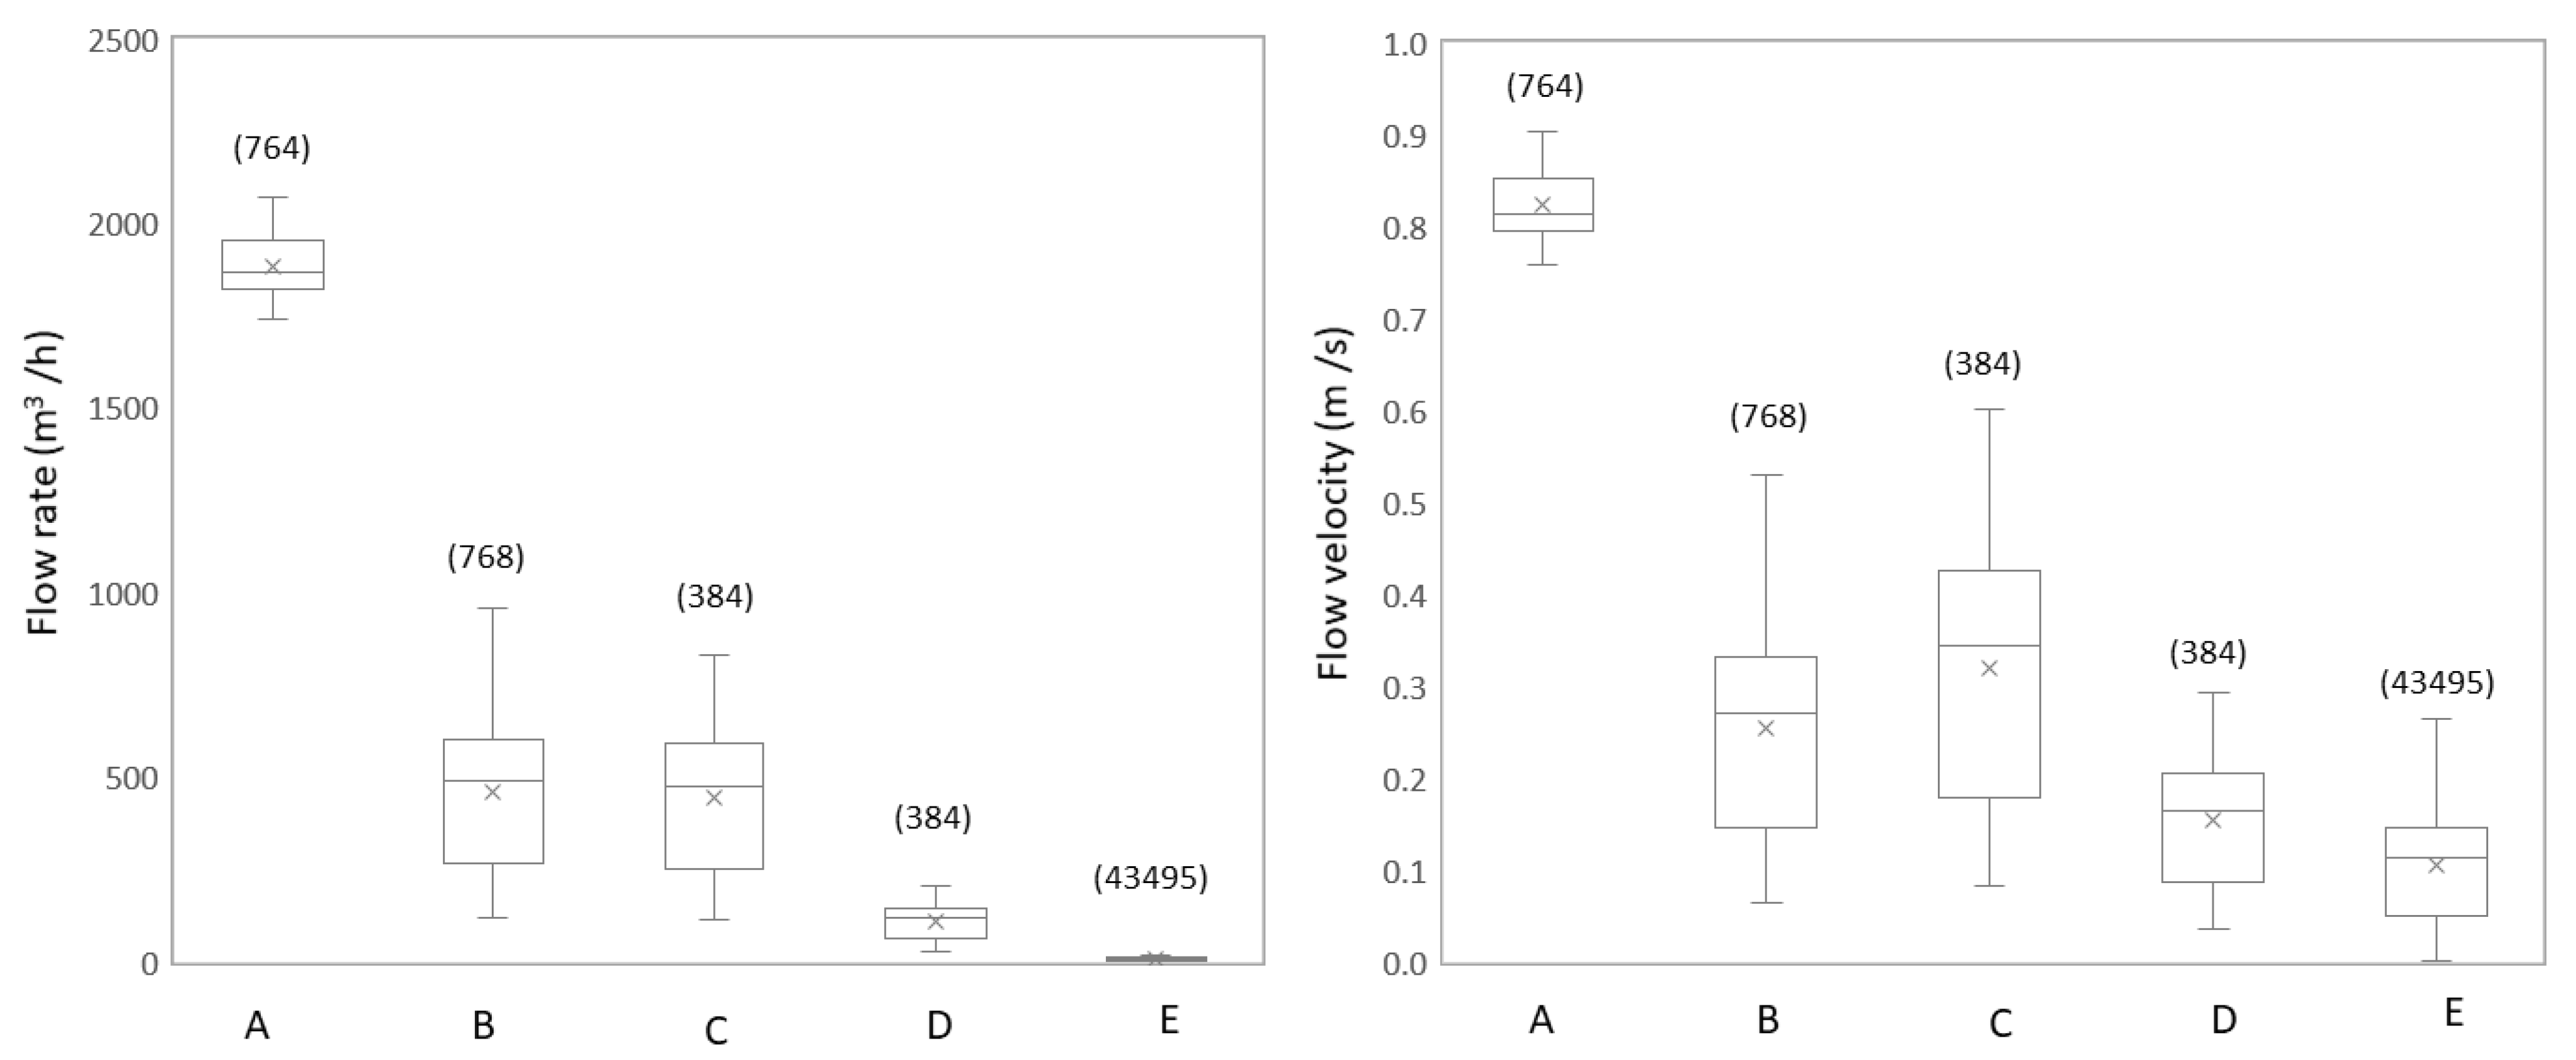
3.1.1. Flow Rate and Flow Velocity Change Due to Network Configuration

The distribution network configuration had a clear impact on hydraulic conditions in the pipes. Flow rates decreased considerably from the treatment plant (1883 ± 80 m3/h, location A) to downstream distribution locations (7 ± 4 m3/h, location E), as the total water produced at the treatment plant spread through the different transport mains and distribution area (Figure 2). As a consequence, flow velocity dropped towards downstream distribution locations (from 0.82 ± 0.03 m/s at location A to 0.10 ± 0.06 m/s at location E). However, the decrease in flow velocity between large transport mains (locations B and C) and downstream locations (locations D and E) was less dramatic than the decrease in flow rate due to decreasing pipe diameters in the latter parts of the distribution system (Figure 1).

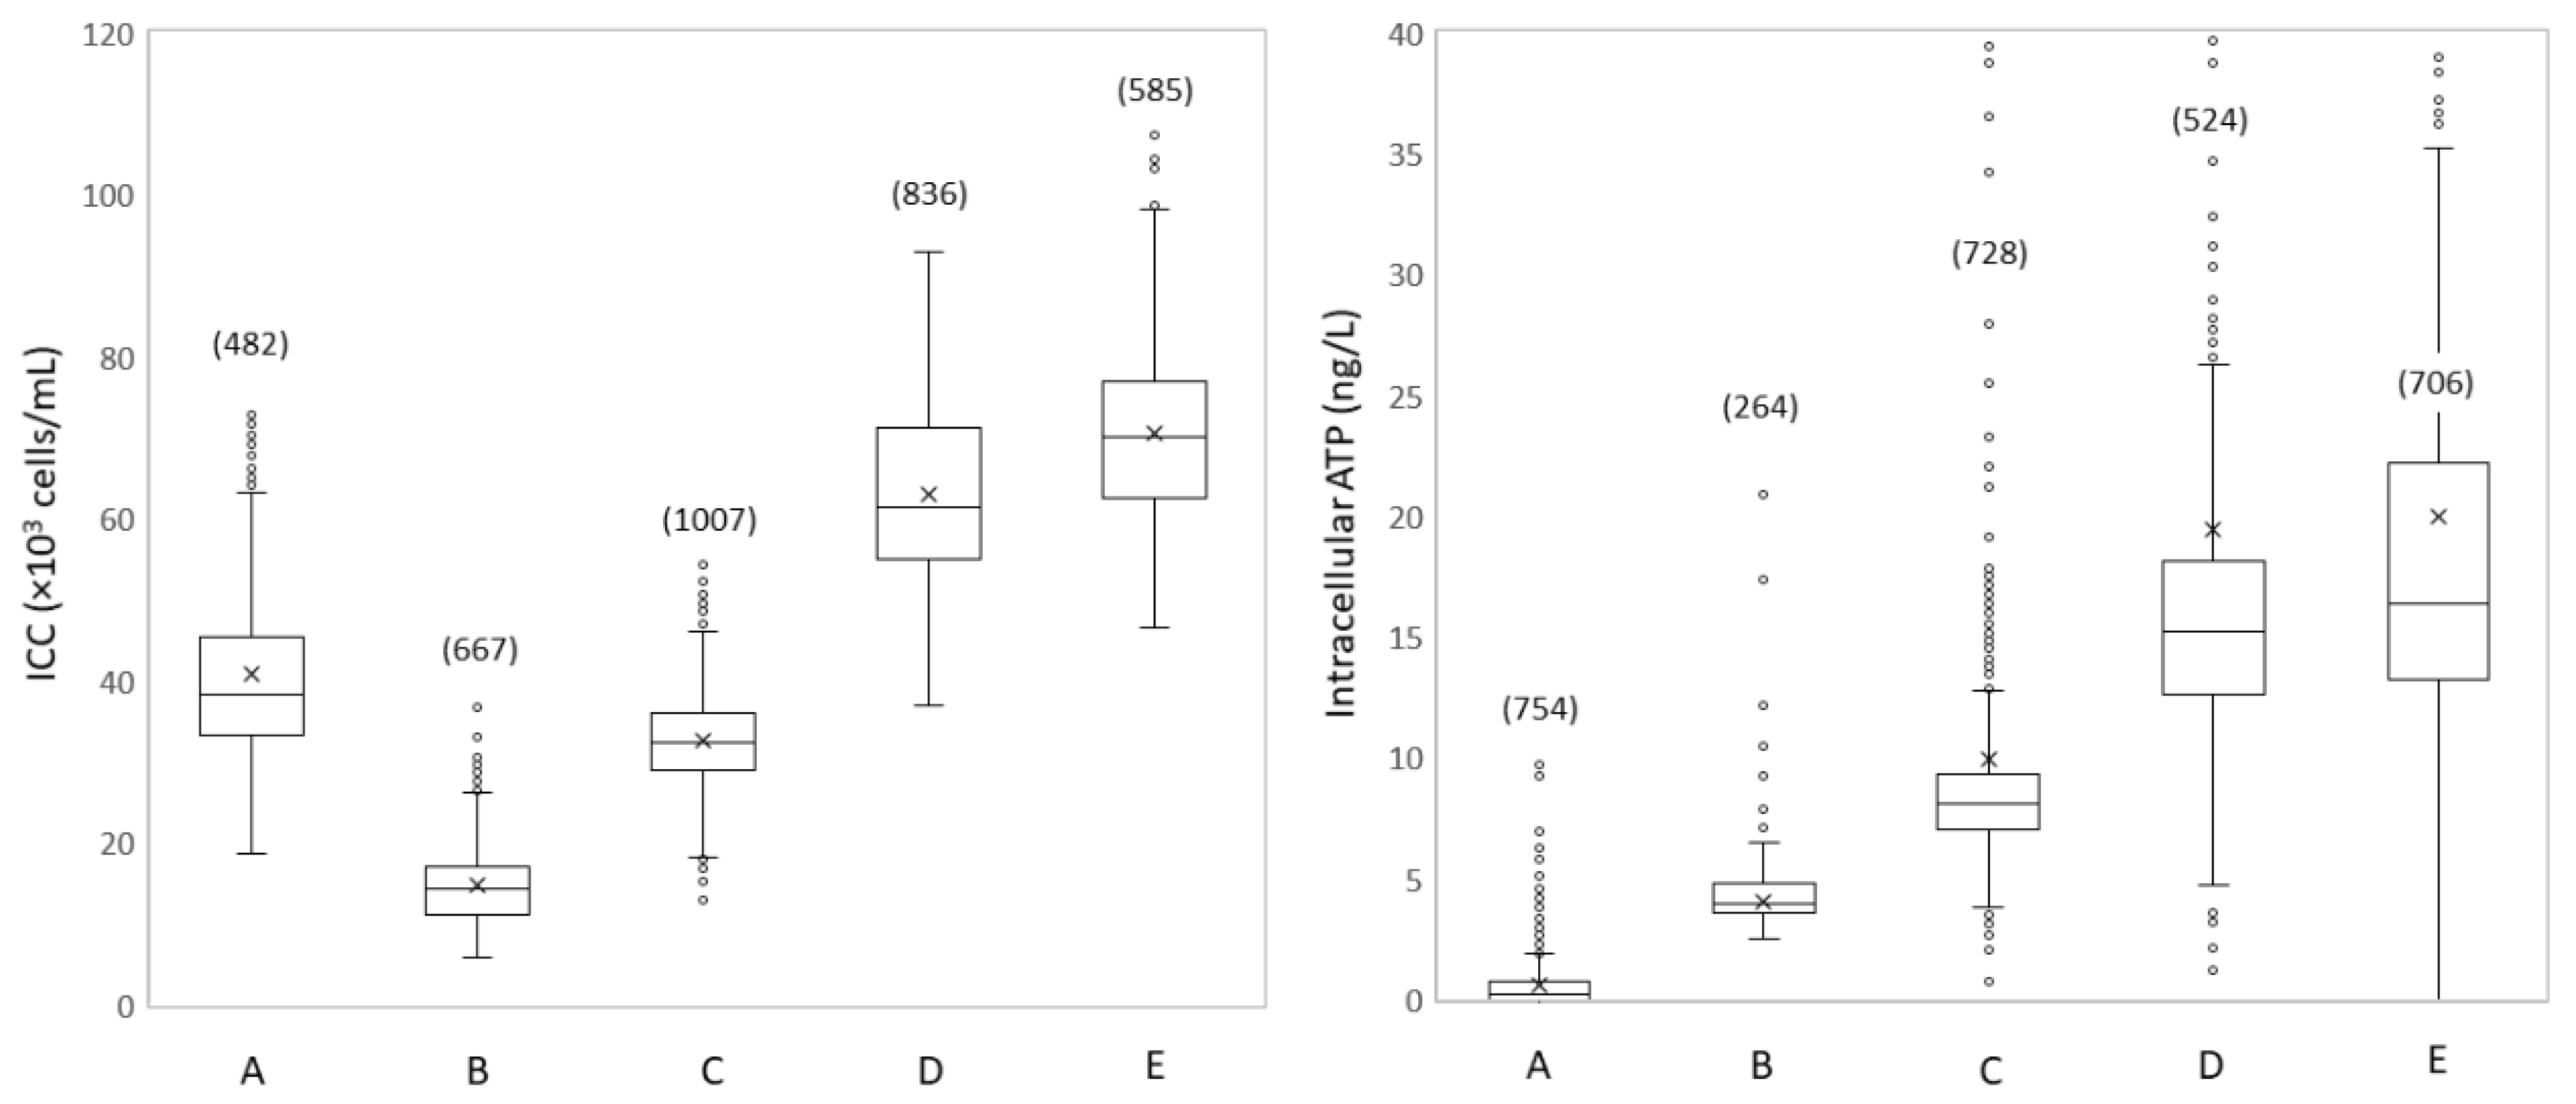
3.1.2. Spatial Microbial Dynamics Show Disinfection and Growth

High-frequency FCM and ATP measurements at each location during one to two weeks revealed the occurrence of both disinfection and growth along the DWDS (Figure 3; supplementary material Figure S1 and Table S1). Average FCM intact cell concentrations (ICCs) decreased significantly from (4.1 ± 1.1) × 104 cells/mL (n = 499) to (1.5 ± 0.5) × 104 cells/mL (n = 674) during the first transport section (A–B). This is attributed to membrane damage caused by chlorine dioxide dosed at the treatment plant. A gradual increase in ICC from locations B to C and D and E (up to (7.0 ± 1.3) × 104 cells/mL at location E) indicated microbial growth in the subsequent transport and distribution sections. The differences in ICCs between two consecutive locations were significant for all study sections based on the two-sample t-test (supplementary information Table S1). Average FCM total cell concentrations (TCCs) gradually decreased during water transport from location B ((5.5 ± 0.8) × 105 cells/mL (n = 732)) to D ((3.6 ± 0.4) × 105 cells/mL (n = 885), supplementary information Figure S1). The differences in TCCs between two consecutive locations were significant (supplementary information Table S1). The gradual decrease in TCC along the transport sections suggested that dead cells measured in the treatment effluent as a result of chlorine dioxide addition (93% of damaged cells on average at location A) potentially disintegrated, settled, or attached to biofilm in the transport pipes, and were thus no longer detected. This was also illustrated by the percentage of intact cells that decreased from 6.7 ± 1.9% ICC (n = 498) to 2.7 ± 0.8% ICC (n = 653) between locations A and B, thereafter followed by a gradual increase up to a percentage of intact cells of 17.7 ± 3.4% ICC (n = 597) at location E, suggesting microbial growth.
Interestingly, ATP measurements showed a slightly different trend than FCM, particularly in the early stages of water treatment and transport (Figure 3). Intracellular ATP concentrations were extremely low at the treatment effluent (0.6 ± 1.1 ng/L), and increased already in the first transport section up to 4.2 ± 1.1 ng/L at location B. Similarly to intact cell concentrations, intracellular ATP gradually increased thereafter from locations B to E (up to 21.4 ± 35.0 ng/L), presumably as a consequence of microbial growth. Total ATP concentrations increased as well all along the water trajectory, from 7.6 ± 1.3 ng/L in location A up to 35.5 ± 52.6 ng/L in location E (supplementary information Figure S1). The percentage of intracellular ATP consequently increased from 6.2 ± 10.2% (n = 754) at location A up to 67.0 ± 13.9% (n = 698) at location E. The differences between two consecutive locations in total ATP and in intracellular ATP were significant, with the exception of the last distribution section (D to E) (Table S1).

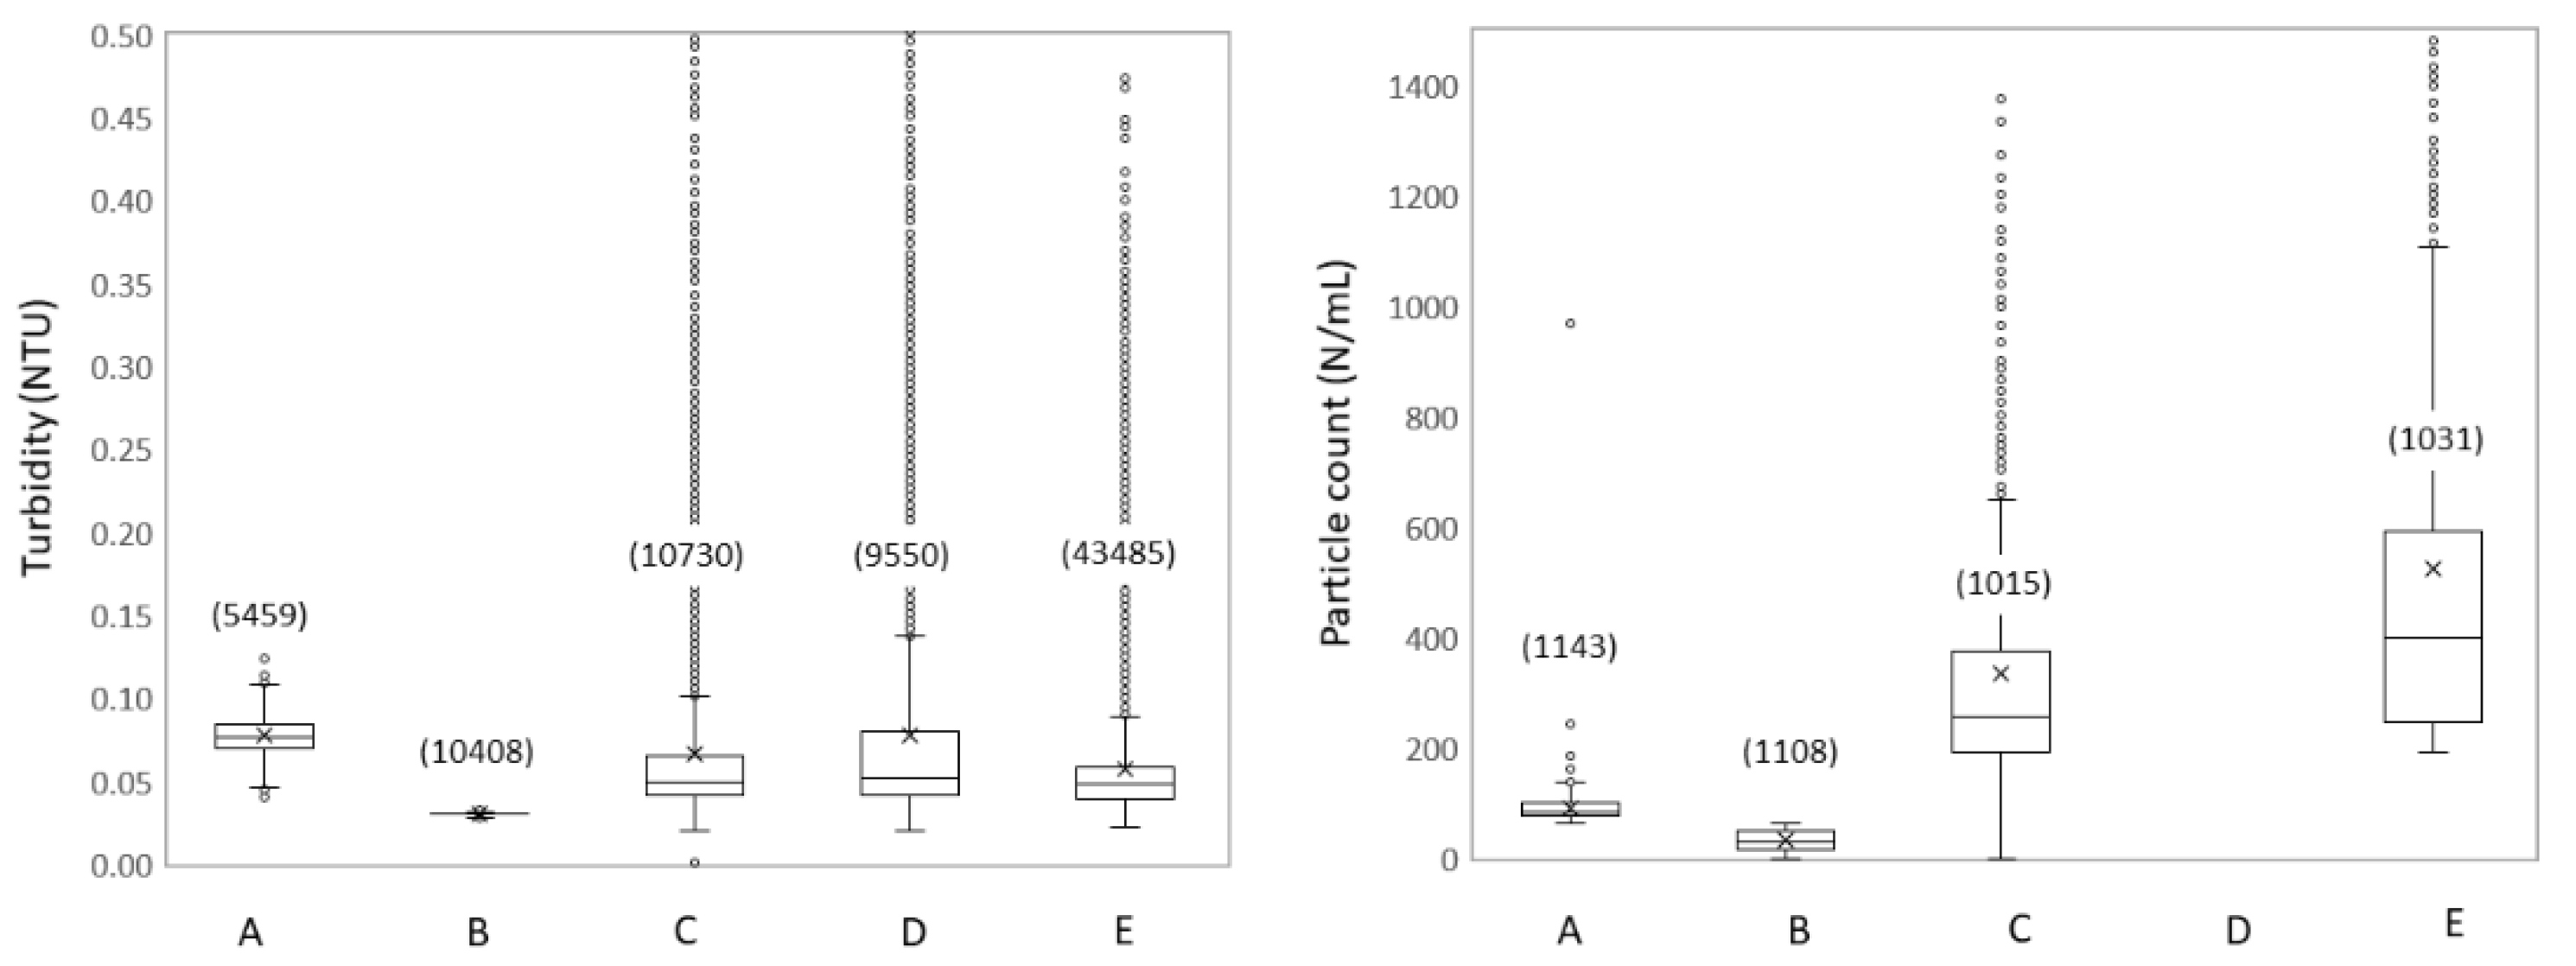
3.1.3. Spatial Dynamics Show Increased Turbidity and Particles

The total number of particles increased gradually from the treatment effluent (90 ± 32/mL, location A) to downstream distribution location E (397 ± 524/mL). This was observed not only for the total number of particles, but also for each individual particle size (supplementary information, Figure S2), strongly suggesting particle formation during water distribution. It is noticeable that the range of particle counts at locations C and E (RSD 79% for both locations) and the number of outliers were larger than at locations A and B (RSD 36% and 60% respectively). Samples from locations C to E were taken directly in the pipe, and were therefore highly influenced by hydraulic fluctuations, resulting in particle deposition and resuspension, as further discussed in Section 3.2. In comparison, samples from locations A and B were taken after a storage reservoir, where particles can settle, resulting in a more stable particle number in the effluent of the reservoir. The variations in particle numbers and sizes had a direct impact on turbidity. While the basis turbidity level was comparable at all locations (average values ranged from 0.03 NTU to 0.08 NTU), an extremely high range of turbidity values were recorded at locations C, D, and E (RSD 90%, 87%, and 65%, respectively), while low variations were recorded at locations A and B (RSD 15% and 2%, respectively). Nonetheless, turbidity always remained below 0.5 NTU at all locations, as normally observed in drinking water distribution systems.

3.2. Temporal Dynamics Reveal Hydraulic Influences

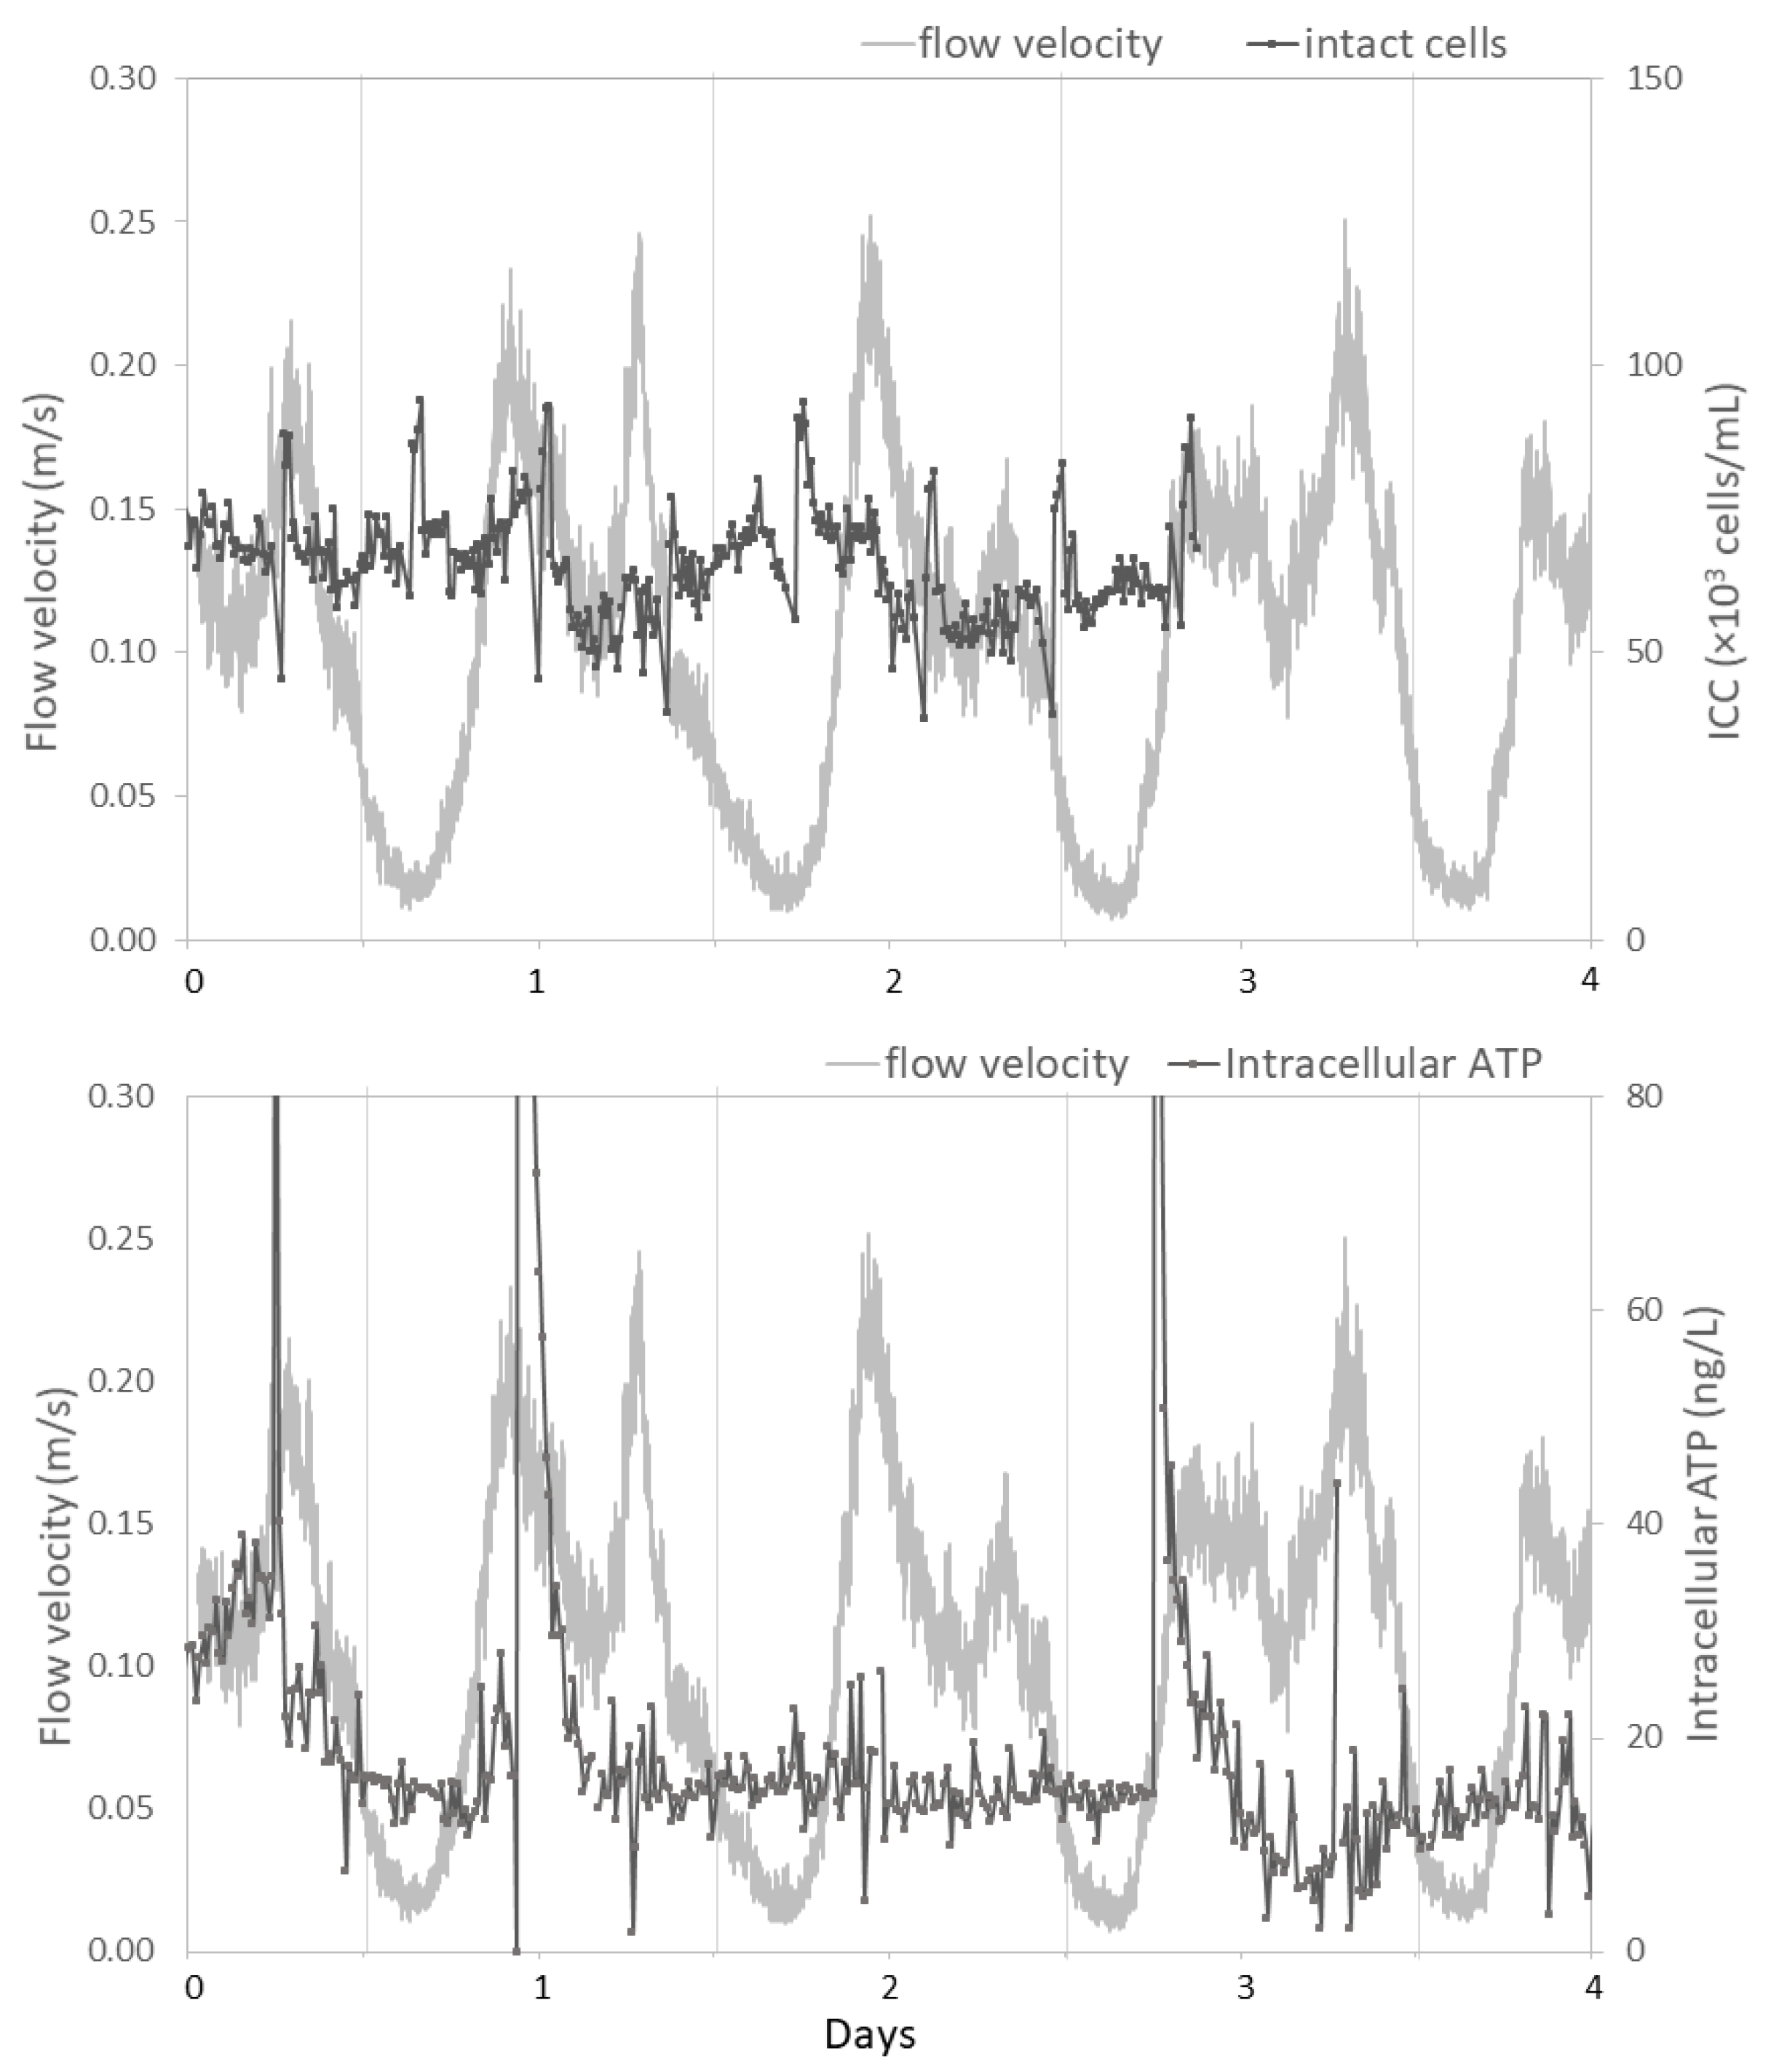
3.2.1. Studied Locations are Subject to Large Daily Variations in Hydraulic Conditions

Measurement and/or modelling of flow velocities revealed clear daily dynamics at locations B to E (supplementary information Figure S3) due to daily water usage profiles by consumers (i.e., morning/evening consumption peaks). However, the range of flow velocities greatly differed at each location due to different flow rates (decreasing flow rates when further in the system) and pipe diameters (decreasing pipe diameters when further in the system). Location A is the effluent of the storage reservoir at the treatment plant, which provides a very stable flow rate (1882 ± 80 m3/h, n = 764), resulting in very little variation in flow velocity (0.82 ± 0.03 m/s). Though the measurement location B at the intermediate pumping station is also after a storage reservoir, part of the water from location A is actively pumped into a large transport pipe (800 mm) towards downstream distribution areas, following a daily pattern that results in large variations in flow rates (461 ± 205 m3/h, n = 768) and velocities (ranging between 0.065 m/s at night and 0.529 m/s during peak hours). The peak velocities increased up to 0.600 m/s at location C, which receives a slightly lower flow rate (444 ± 196 m3/h, n = 384), but has a smaller pipe diameter (700 mm). In comparison, the small residential area where location E is situated has much smaller pipes (152 mm) and received significantly less water (7 ± 4 m3/h, n = 43,495), resulting in the lowest flow velocities, down to 0.002 m/s at night and up to 0.265 m/s during peak hours (Figure 4). The dynamics of particle deposition and resuspension are therefore expected to be more pronounced in small distribution pipes with low velocities than in the larger transport pipes, where flow velocities remain high enough to keep particles in suspension most of the time. The number and size of particles gradually increased from location A to E (Figure 5 and supplementary information Figure S2), similarly to active microbial cells (Figure 3). Consequently, the impact of hydraulic conditions on water quality is expected to be larger at the distribution location E than at earlier locations. Further investigations on the impact of hydraulics on water quality (Section 3.2.2 and Section 3.2.3) therefore focus on location E.

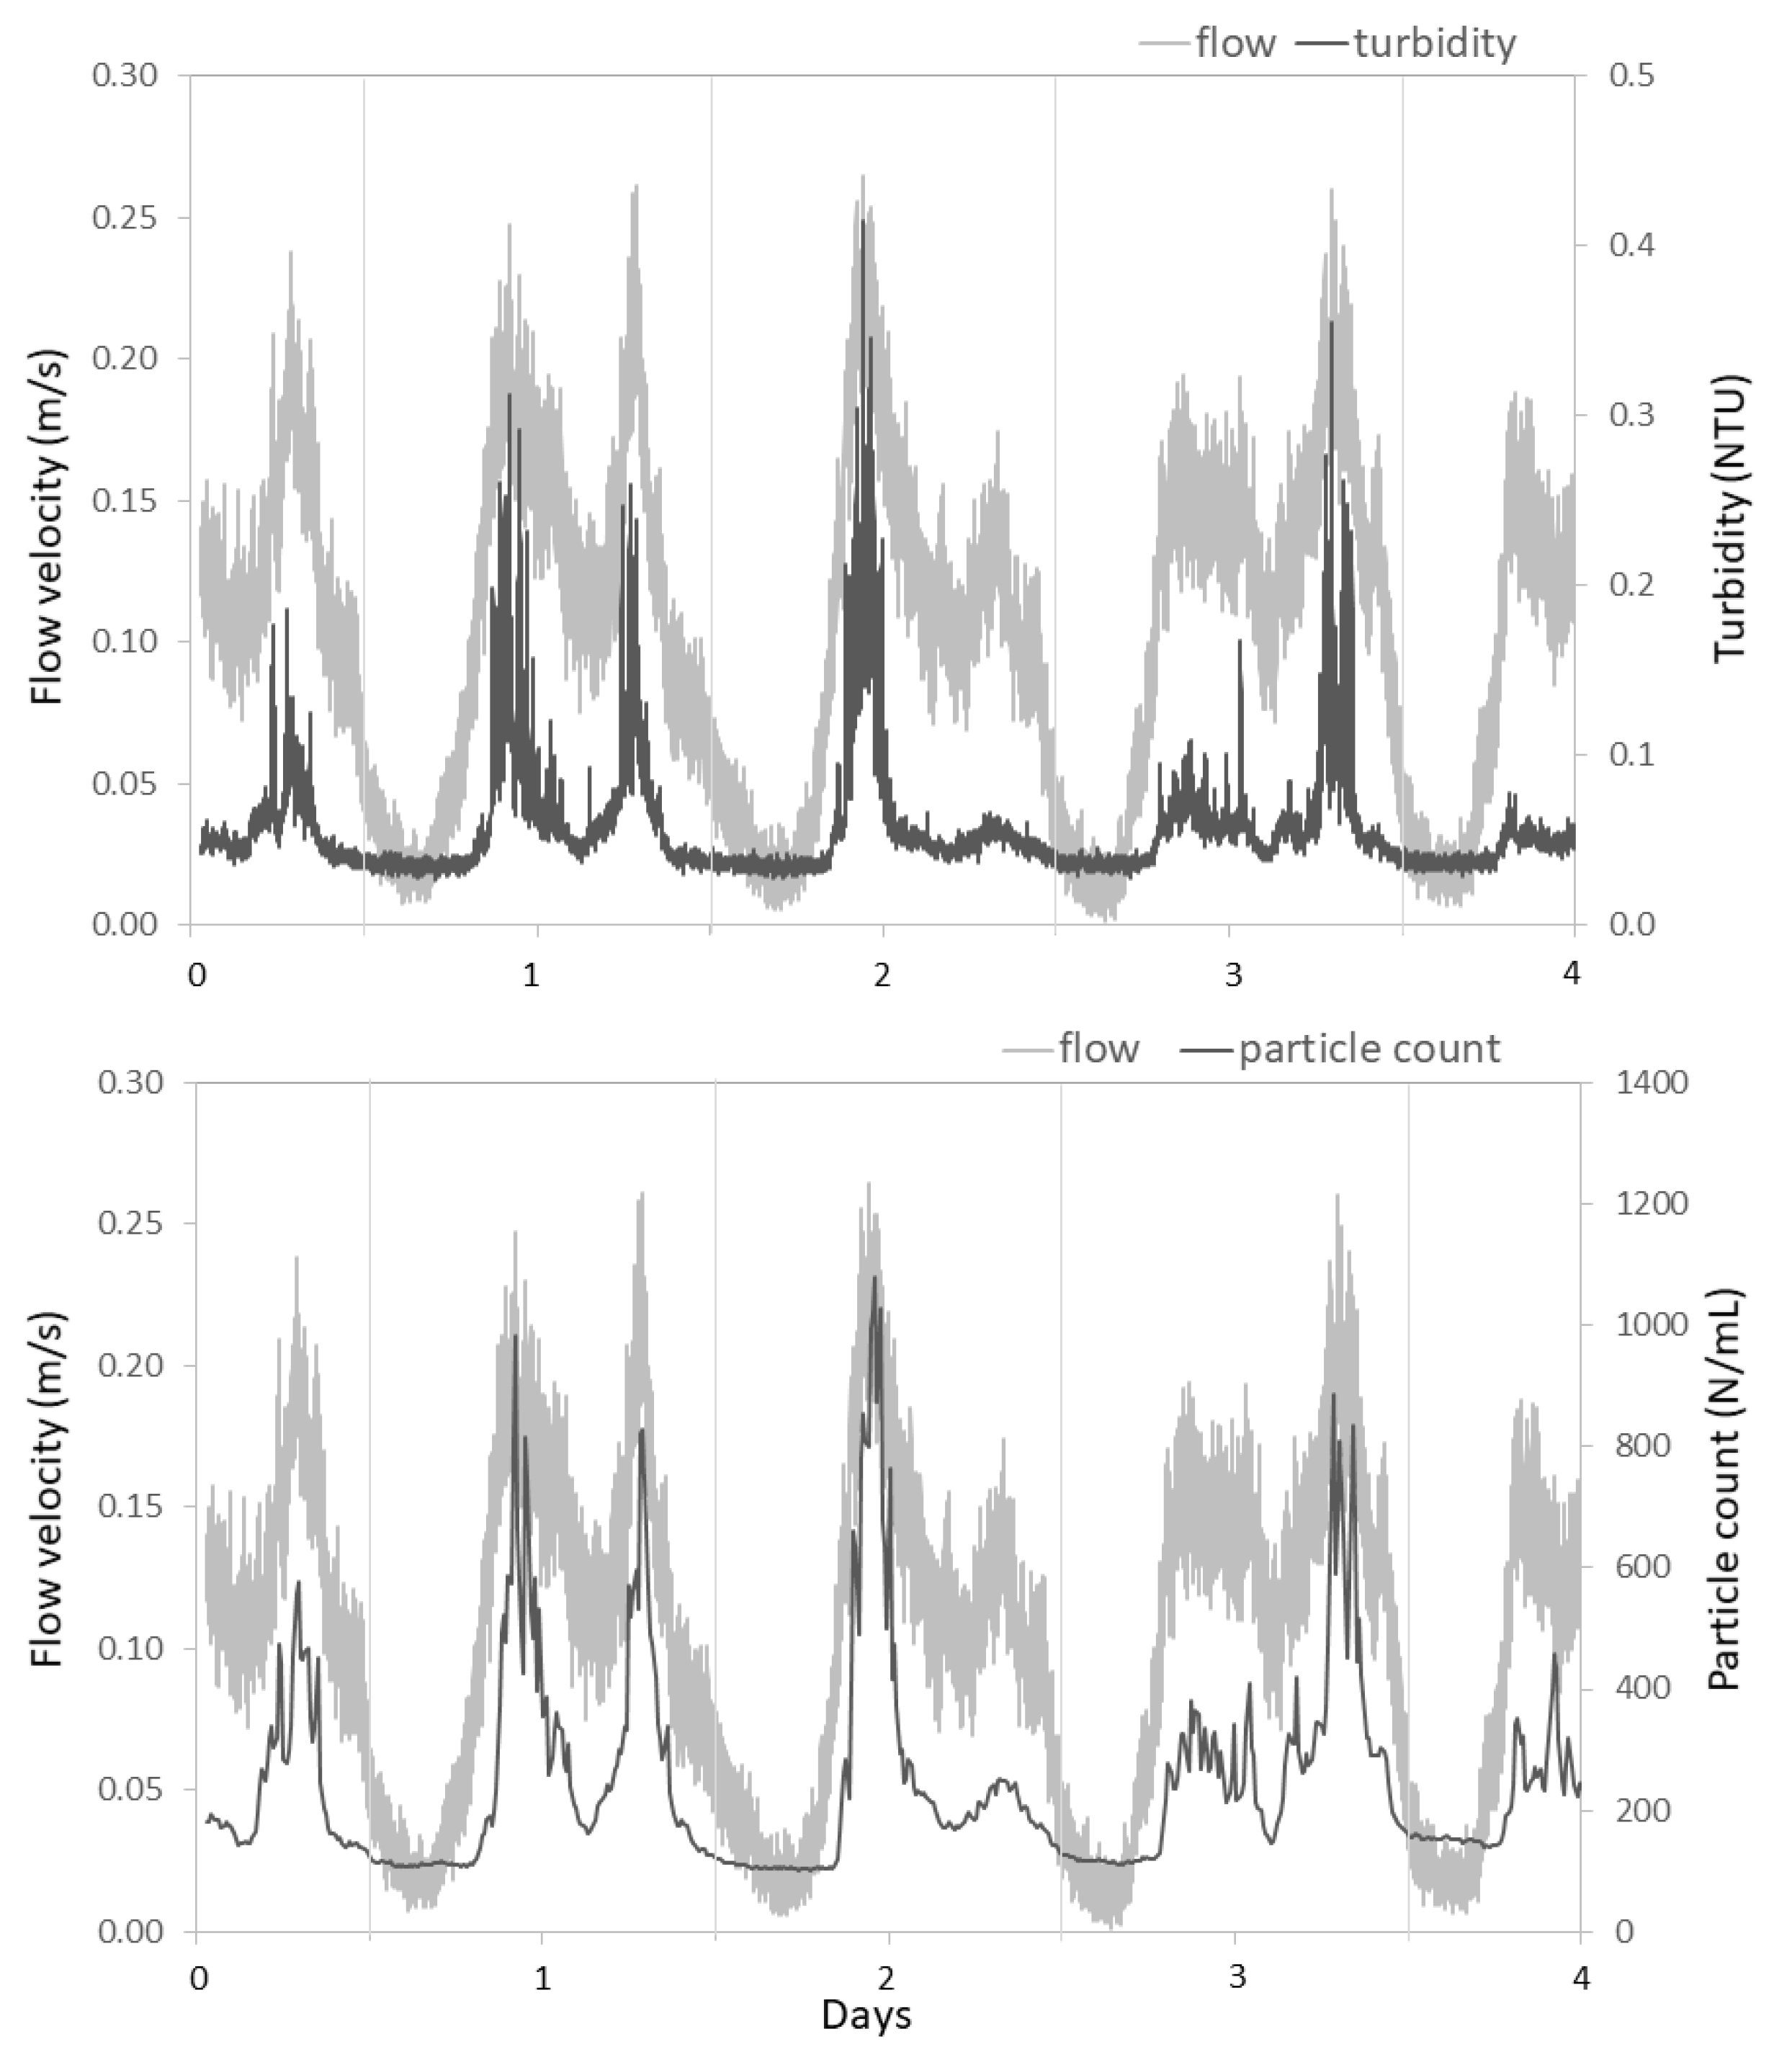
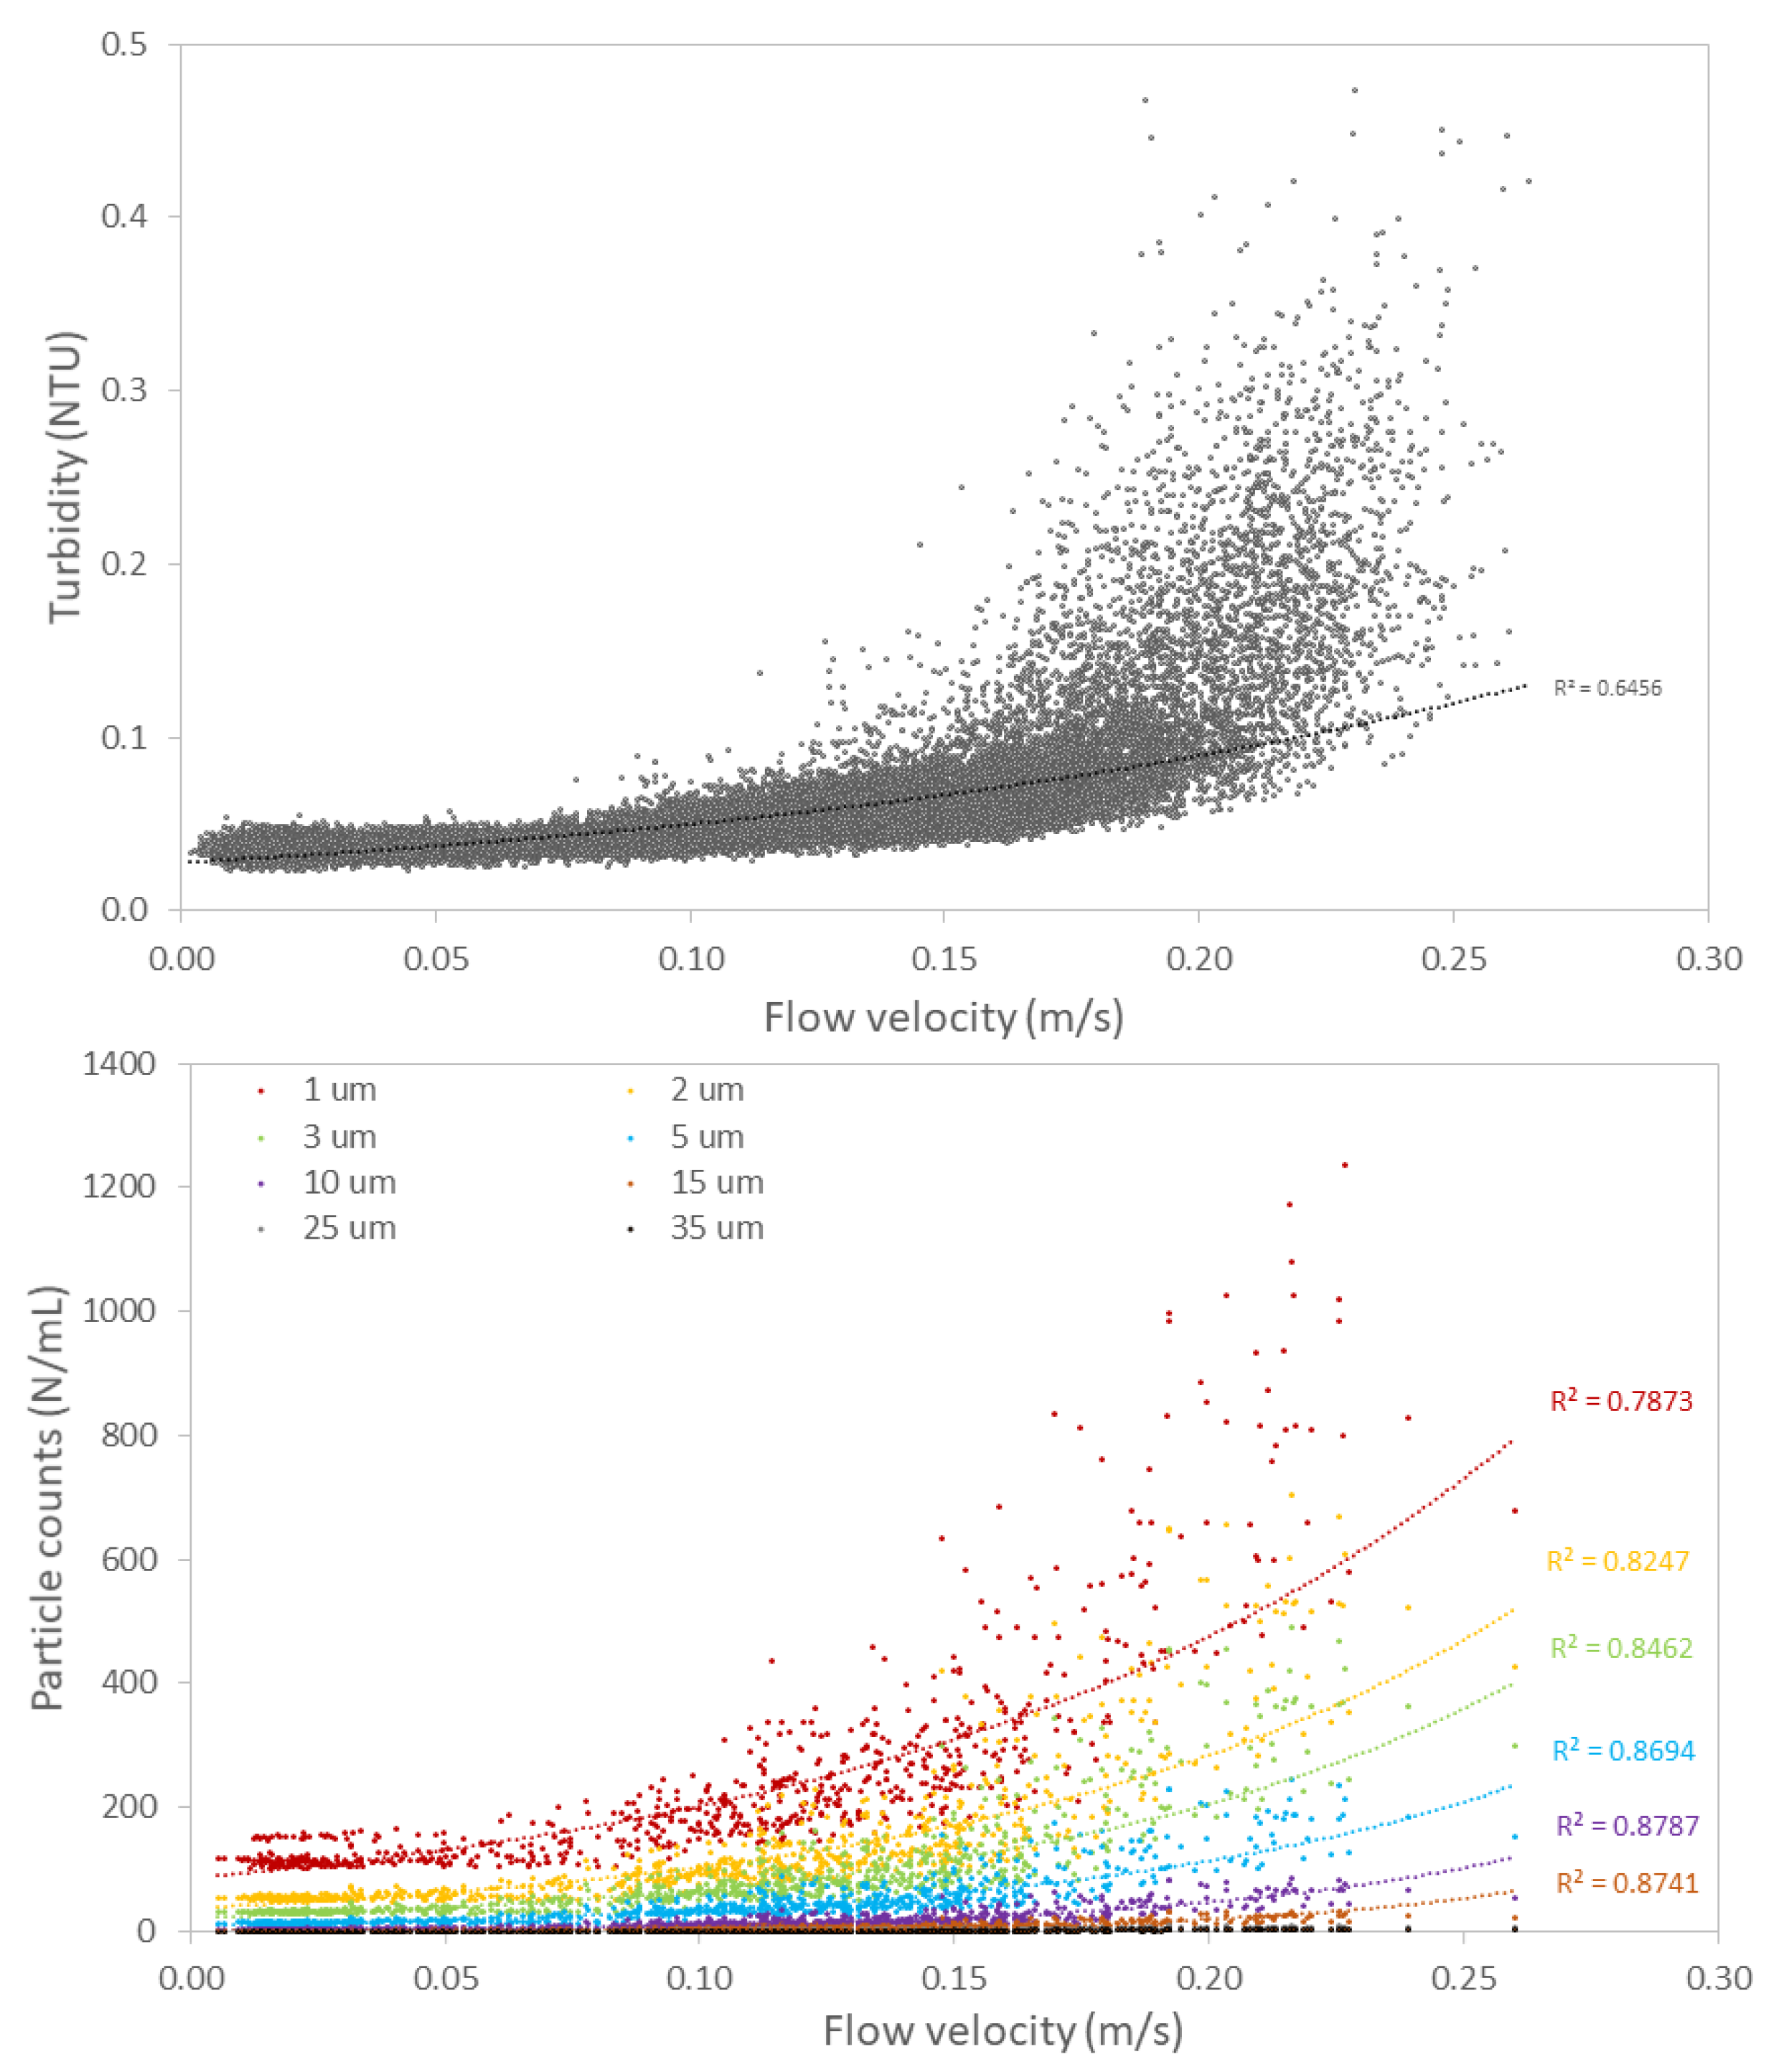
3.2.2. Hydraulic Conditions Influence Particle Counts and Turbidity

The daily fluctuations in flow velocity at distribution location E resulted in daily fluctuations in particle counts and turbidity, with clear morning and evening peaks (Figure 4). All particle sizes reacted to the daily flow variations, with deposition at night and re-suspension during peak hours, as shown in Figure 4 for particle sizes of 1 to 2 µm. The number of particles of 1 µm varied between 49/mL at night and 704/mL in the morning or evening. Variations of the other particle sizes display similar patterns (supplementary information, Figure S4). This phenomenon had a direct impact on turbidity in the water, which also displayed a two-peak daily pattern, varying between 0.03 NTU at night and 0.48 NTU in the morning or evening.
An exponential relationship (R2 = 0.65) was found between flow velocity and turbidity, with no or little change in turbidity at flow velocities below 0.08 m/s, followed by an exponential increase at higher flow velocities (Figure 6). The large spread in the data at high flow velocities may be due to the varying fouling level of the pipe: after a high flow event, particulate material has been flushed out, resulting in a lower turbidity response to the next high flow event. A renewed high response will only be obtained after new particle deposition. Such processes explain the relatively low R2 value for the exponential relationship between flow velocity and turbidity. Similar to turbidity, particle counts were not impacted by flow velocities below 0.08 m/s, but increased exponentially at higher velocities (R2 = 0.8 for all particle sizes), with the highest reaction for the smallest particles. For example, at a velocity of 0.15 m/s, particles of 1 µm ranged between 200/mL and 415/mL, while particles of 5 µm ranged between 30/mL and 100/mL. These data show that a minimum flow velocity is required to settle and re-suspend particles, which also has a direct impact on turbidity. The reaction of turbidity on flow velocity is, however, location-dependent (supplementary information S5), with a lower response at locations B and C and strong responses at locations D and E. This is a direct consequence of increased particle accumulation in the distal areas of the distribution system (Figure 5), illustrating the continuous loading of the system, which can eventually result in customer complaints.

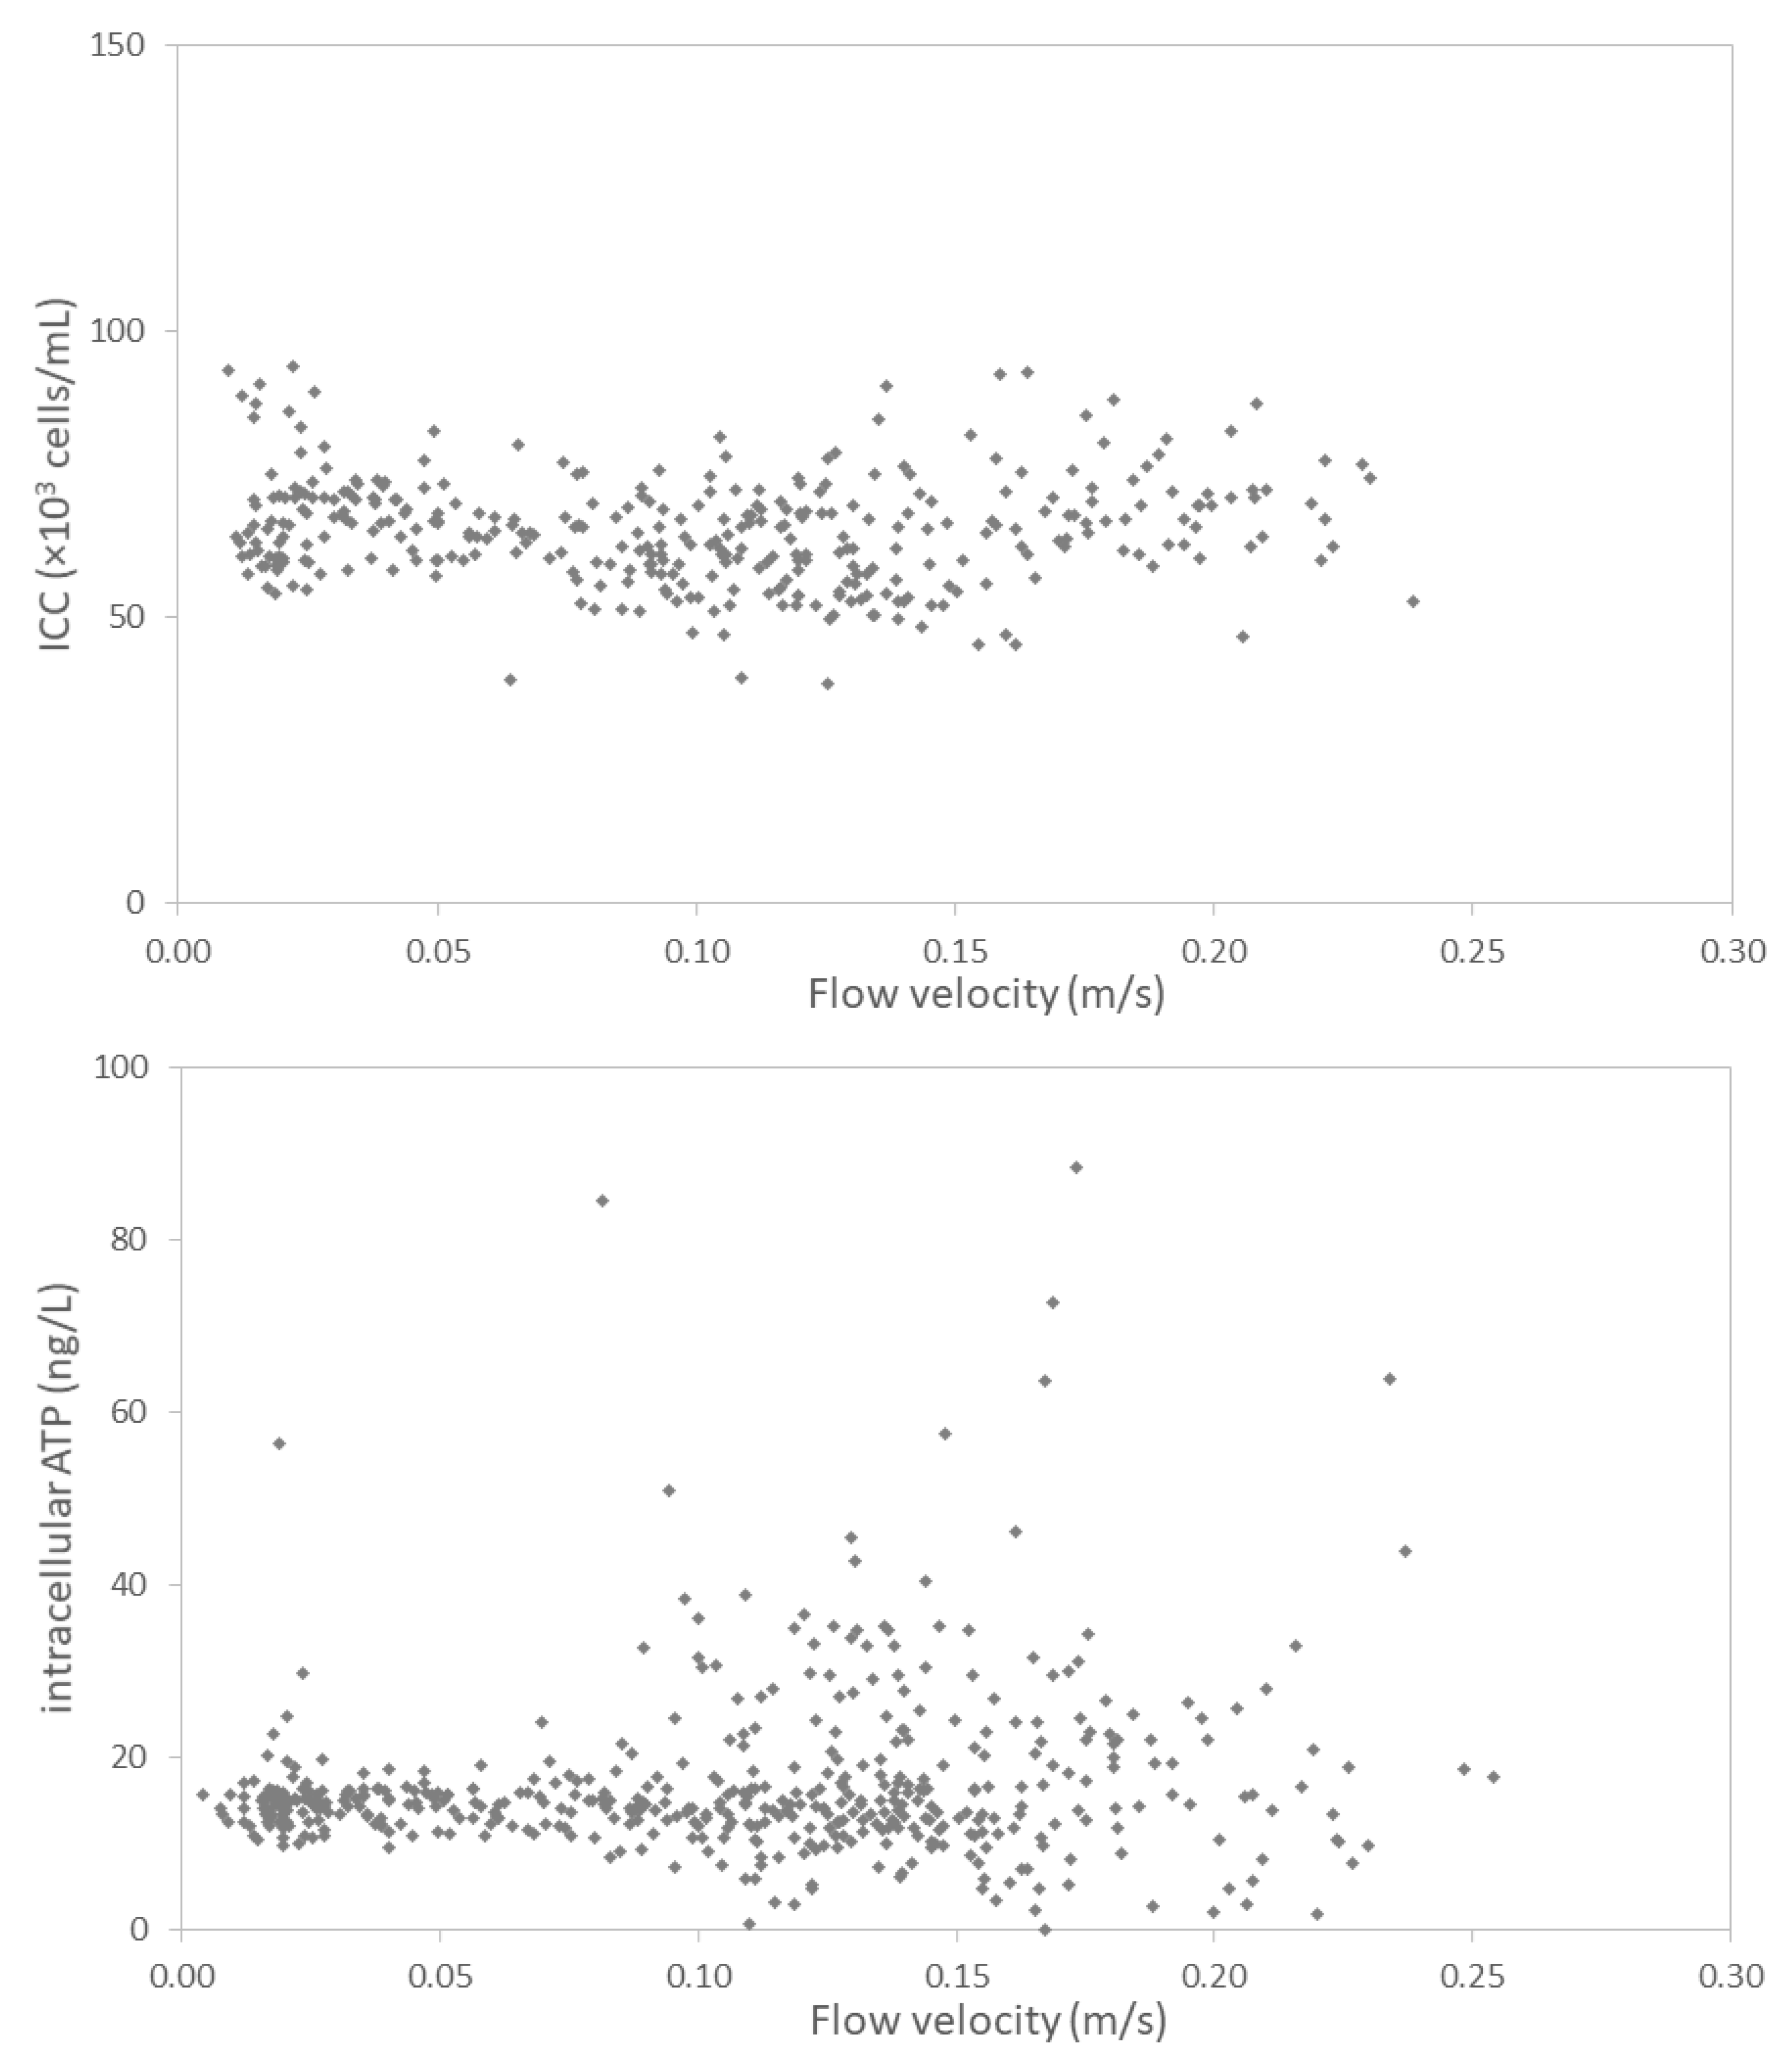
3.2.3. Hydraulic Conditions Barely Impact Online Microbial Parameters

In contrast to the turbidity and particle counts data, no clear daily pattern in TCCs or ICCs was detected anywhere in the DWDS. The daily fluctuations in flow velocity did not translate to fluctuations in cell concentrations, as shown for distribution location E in Figure 7 (ICC) and supplementary information Figure S6 (TCC). Consequently, no significant statistical correlation was found between cell concentrations and turbidity or particle counts of any size (Figure 8). In fact, TCC and ICC remained remarkably stable at (39.9 ± 1.7) × 104 cells/mL (n = 598) and (7.0 ± 1.2) × 104 cells/mL (n = 597), respectively (Figure 7). However, more variability was detected within ATP measurements. Intracellular ATP concentrations did not display clear daily patterns, but concentrations varied generally between 4 and 35 ng/L, with occasional peaks at 120 and up to 685 ng/L, generally happening when flow velocities were high. No clear statistical correlation could be found (R2 = 0.07) between flow velocity and ATP. However, ATP concentrations remained systematically below 20 ng/L at flow velocities below 0.1 m/s, while high ATP concentrations (typically ranging between 20 and 40 ng/L, up to 120 ng/L) were frequently recorded at higher flow velocities (Figure 8), as already observed for particles and turbidity (Figure 6). High ATP values during high velocity time periods can be attributed to the measurement of ATP from bacteria bound to (re-)suspended particles. Interestingly, the daily variations in total ATP were slightly more pronounced than for intracellular ATP (supplementary information, Figure S6), which is attributed to daily fluctuations in extracellular ATP, also resulting in a weak but positive correlation between extracellular ATP concentrations and flow velocity (supplementary information, Figure S7). It is not clear why extracellular ATP displays a daily pattern. One could argue that predation occurring in the deposited sediment and/or biofilm causes the release of ATP that comes into the water phase when sediment particles are re-suspended.

4. Discussion

Water quality was studied at different locations in a large-scale DWDS, from large transport pipes to small distribution pipes with varying flow rates and velocities, all of them subject to daily variations. Collection of up to 4000 data points per parameter enabled accurate description of spatial and short-term temporal dynamics in water quality, including process, abiotic, and microbial parameters.

4.1. Impact of Hydraulic Conditions on Particle Deposition and Re-Suspension

Accumulation of particulate material naturally occurs in pipes during drinking water distribution [20]. Particles may originate from the treatment [21], but also from distribution pipes (e.g., rust) [22], mobilization of biofilm from pipe walls [23], and/or biological activity and trophic chains in the DWDS [24]. Resuspension of such particles as a result of regular hydraulic dynamics in the DWDS can negatively affect consumers’ water quality perception. Intermittently increased flow velocity (typically morning and evening consumption peaks) causes particle re-suspension, in turn impacting turbidity (Figure 4) and increasing the risk of turbid/brown water at the consumer’s taps.
The particle re-suspension mechanism is complex, and is influenced by both flow velocity profiles and particle size and composition. Husband et al. [6,23] showed with laboratory experiments and on-site studies that increasing shear stress results in the mobilization of different cohesive layers of accumulated material in the pipes, mobilizing particles from different sizes and composition. The particle behavior can vary between DWDSs with different water quality and pipe materials, as shown by van Summeren and Blokker [7] with a modelling study based on sediment collected in the United Kingdom, in the Netherlands, and in Australia with different particle sizes and densities. Even within the same DWDS supplying water from a single water source, the composition of deposits or suspended particles can vary as a result of microbial activity [24] or inorganic composition (e.g., as a result of corrosion) [22]. In this study, particle counter data showed that not only were more particles found at downstream locations (Figure 5), but the particles were also larger (supplementary information, Figure S2). Consequently, the turbidity response to varying flow velocity was highest at the downstream distribution locations (supplementary information, Figure S5).
Several studies showed that a minimum flow velocity is required to allow re-suspension of particles in water. In the studied system, increases in turbidity were observed at flow velocities higher than 0.08 m/s at the downstream distribution location E (Figure 6). A number of studies reported similar minimum flow velocities for particle resuspension, varying from 0.10 to 0.25 m/s, depending on the material and conditions tested [25,26,27]. Blokker et al. [28,29] suggested a minimum velocity of 0.2 m/s based on field studies in the Netherlands. The knowledge of a minimum flow velocity to resuspend particles inspired the design of self-cleaning pipes [28,29,30], composed of branched distribution systems with pipes of small diameters to maintain a high flow velocity (initial design flow velocity of 0.4 m/s) and keep particles in suspension. In our study, the smallest pipe studied had a diameter of 152 mm. However, it is feeding a distribution area with smaller pipes (40 to 110 mm), where the lowest diameter pipes (40 to 63 mm) are designed to be self-cleaning pipes. In these pipes, flow conditions and therefore dynamics will differ from the locations described in this study. Note that the use of self-cleaning pipes may require limiting the particle fouling in the upstream mains feeding the self-cleaning area, if the particle load towards the downstream area is high enough to cause consumer’s complaints during high velocity events. This can be obtained by regular flushing of the mains. This approach is more generally applied by water utilities to remove deposits from DWDSs [20,31]. In the present study, the particle load seems low, as turbidity remained below 0.5 NTU at all times (typically a consumer’s complaint will be recorded by turbidity in the range of 5 to 10 NTU). Recently, flow conditioning has been proposed as a mitigation strategy to limit material loading in pipes and brown water complaints. The careful regular increase of flow in trunk mains enables to mobilize small amounts of material from cohesive layers from the pipe walls and to reduce loading of downstream distribution pipes [32].

4.2. Impact of Hydraulic Conditions on Microbiology

While the impact of hydraulics on particle re-suspension is well-documented, the impact on microbiology in DWDSs is less understood. Bacterial cells in DWDSs are found as single cells or cell clumps in the bulk water, but also attached to particles in suspension or deposited as sediments, and in the form of biofilms on pipe walls [8,9,10]. Considering the high impact of hydraulics on particles, one could expect that particle-bound microbiology would be affected by changes in flow velocities, as a result of detachment and resuspension of bacteria and particle-associated bacteria from sediments and biofilms.
The results of the present study showed that suspended ICC was not affected by hydraulic changes, while intracellular ATP concentrations had a slight relation with flow velocity. In addition, high ATP peaks were sometimes detected during flow velocity peaks (Figure 7 and supplementary information Figure S6). Methodological differences between the two microbial detection methods may explain the discrepancies between FCM and ATP results. FCM in essence measures single microbial cells in suspension in water, i.e., enumerates each event as a single cell. A clump of cells or cells attached to a particle will therefore be counted as one cell, or fall outside the fixed gates used to separate microbial signal from background. Considering the difference in particle concentration (in the range of 500/mL) compared to intact cells (in the range of 5 × 10⁴ cells/mL) or total cells (in the range of 5 × 10⁵ cells/mL), resuspension of one or few particles will not be detected as an event against the background cell concentration in suspension. In comparison, ATP, measured as a bulk parameter, comprises the ATP concentration of suspended and particle-bound microbial cells, therefore re-suspension of particle-bound ATP may increase the ATP concentration in the water. In addition, the methods differ in sample volume analyzed and the statistical chance of measuring particle-bound cells. While ATP measurements were performed on a large sample volume (100 mL), FCM measurements were performed on merely 1 mL, reducing the chance of sampling particles and detecting them against the background suspended microbial concentrations. The differences in methodology highlight that FCM results essentially provide insights on single suspended microbial cells, while ATP results are dependent on both suspended and particle-bound cells.
The presence of ATP bound to particles suspended in drinking water has already been reported earlier [9]. ATP bound to particles can have different origins and be the result of complex interactions between the different microbial phases of DWDSs. Particles in DWDSs contain organic material and are therefore optimal niches for microbial growth [8,24]. Furthermore, Liu et al. [12] showed using source tracking methods that loose deposits and biofilm communities were contributing significantly to bulk water and particle-bound microbial communities, most likely as a result of hydraulic disturbances. In the present study, the weak correlation of flow velocity with ATP and occasional high ATP peaks at high flow velocity illustrate the random resuspension of particle-bound ATP under highly varying hydraulic conditions. Another source of particle-bound ATP and deposits may be biofilm detachment from pipe walls [13] as a result of erosion (small particles) or sloughing (larger flocs of biomass). Numerous studies have shown that hydraulics have an impact on both biofilm development and detachment [13,14,33,34,35]. Fish et al. [34] demonstrated that hydraulic regimes influence biofilm biomass concentration and bacterial community diversity, where biofilms developed under high-varied flow conditions had the highest amounts of biomass. The higher biomass combined with sudden events of increased flow velocities may cause an increased risk of biofilm detachment in distribution locations with highly varying flow, as studied here (location E).
Overall, the results suggest that the impact of single cell re-suspension or detachment potentially caused by changing hydraulic conditions is not significant relative to the background cell concentration. However, resuspension of particle-bound bacteria by either biofilm detachment or release from sediment is a random process, which can be incidentally enhanced by increased flow velocities in distribution areas with highly varying hydraulic conditions. Biofilm detachment and re-suspension of particle-bound microbiology may well contribute to discoloration events [13,23,34], which is supported by the high microbial density/activity found in material extracted from distribution systems e.g., during flushing events [8,36,37].
It is noticeable that most studies on microorganisms bound to suspended particles or sediments are performed based on one-time sampling of water samples and sediment flushed from DWDSs. Such an approach provides information on the composition of the sediment, however, the impact on water quality on short time scales is merely based on assumptions. The use of online monitoring methods, such as online ATP meters, provides clear advantages in capturing resuspension of a particle-bound microorganism under highly variable hydraulic conditions.

4.3. Different Microbial Methods Provide Complementary Information

FCM and ATP are two complementary methods that provide different types of information due to differences in methodology. As discussed in Section 4.2, FCM is based on single cell measurement, and is not able to detect clumps of cells, while ATP is a bulk parameter that does not provide information at the single cell level [38]. In addition, FCM combined with the nucleic acid stains applied in this study (Sybr Green/propidium iodide) detects membrane damage, which is a clear indicator of cell death, while ATP is the energy carrier for life-sustaining processes [39].
In the present study, FCM and ATP results showed different trends, especially in the first transport section, with a decrease in FCM ICC, but an increase in intracellular ATP (Figure 3). While this data appears contradictory, it may well be the consequence of two processes occurring simultaneously: (1) cells dying and becoming visibly damaged with FCM as a result of ClO2 addition, and (2) new cells growing and/or being released from biofilms detected by ATP. At the treatment effluent (location A), the contact time of bacterial cells with ClO2 is one to two hours, which is sufficient to damage most bacteria and liberate ATP from bacterial cells. This is visible through both methods, with only 7 to 8% of all cells having an intact cell membrane and containing intracellular ATP. After the first transport section (16 h residence time including transport reservoir), FCM TCC decreases by (5.4 ± 8.9) × 104 cells/mL. This total concentration includes a decrease in ICC of only (2.6 ± 1.2) × 104 cells/mL, which can be due to settling of microbial cells in pipes or reservoir. The remaining decrease in TCC suggests that cells already damaged at location A further degrade to a state where they are not detectable anymore with FCM at location B. The net increase in total ATP between locations A and B (net increase of 2.0 ± 1.8 ng/L) was lower than the increase in intracellular ATP (net increase of 3.6 ± 1.5 ng/L), and was therefore compensated for by a loss of intra or extracellular ATP. This can be due to setting of microbial cells, but can also be due to degradation and/or consumption of extra cellular ATP by other organisms [40]. The increase in intracellular ATP in turn clearly implies that microbial growth takes place between location A and B, which is further supported by an increase in ATP/cell (from (0.14 ± 0.29 ng) × 10−7 ng/cell to (2.89 ± 1.21) × 10−7 ng/cell, suggesting increased microbial activity. Similar ranges of ATP/cell have been reported earlier by Hammes et al. [41], with an average value of 1.8 × 10⁻¹⁰ nmol/cell (equivalent to 0.91 × 10⁻⁷ ng/cell). Earlier publications have shown that results obtained by FCM and ATP methodologies do not show simultaneous reactions to an event. Nescerecka et al. [40] showed in controlled laboratory experiments with E. Coli cultures that the partial release of intracellular ATP occurs at lower chlorine concentrations than detection of cell damage by FCM.
The results clearly show that different processes (cell damage, cell die-off, growth, etc.) are detected independently by the two methodologies. Combination of the two methodologies, including abundance and viability, is therefore useful in systems where a disinfection step is applied. However, the two methods may not be sufficient to unravel all microbiological processes in drinking water distribution systems. The simultaneous mechanisms of growth, cell damage, and settling cannot be separated, and are masked by the fact that only the net increase or decrease in cell concentrations and ATP is measured. As pointed out in Section 4.3, particles are not taken into account in FCM measurements, and may have only a small impact on ATP measurements. Collection of larger water volumes would be necessary to include particle-bound microbiology in integrated studies. Furthermore, additional tools are required to understand the complex underlying mechanisms resulting in bacterial cells in drinking water. Microbial community analysis, for example, can help in studying the interaction between bulk water, sediments, and biofilm phases [12], while functional studies coupled with emerging genomics or proteomics methodology may help elucidating which functions are being used by bacterial communities for the formation of biofilm and its different components (e.g., EPS) [42].

4.4. Online Measurements and Large Datasets

The present study highlights the value of online microbiological measurements to capture short-term dynamics in drinking water systems. The results showed that highly dynamic variations in flow velocity are inherent to a DWDS (Figure 4) as a result of daily consumption profiles that are repeatable over days. Ad-hoc hydraulic events can also occur following e.g., pipe flushing actions, change in flow direction in specific pipes, or pipe burst. Daily variations in flow velocities caused clear variations in abiotic parameters (particle counts and turbidity). Though no clear daily variation in microbiological parameters could be observed, occasional abnormally high ATP concentrations were detected, which were not representative for suspended microbiology and for concentrations at other times of the study. Such regular variations and ad hoc events in microbiological parameters could only be captured by high frequency measurements using online technologies. To our knowledge, this is the first time that nearly 3000 data points were collected for ATP over a short time in a distribution system.
While online abiotic sensors are commonly applied by water utilities (e.g., turbidity measurements), online microbiological sensors are not used on regular basis, despite the meaningful information they can provide, especially in drinking water systems. For example, water quality changes as a result of e.g., a change in water source [43] or in operational conditions [15] can easily be detected with online technologies. In this sense, microbiological and abiotic online technologies provide complementarity information in response to specific events [44]. Note that the current online microbial technologies (FCM and ATP) do not allow the same measurement frequency (typically in the range of one measurement per 10–15 min) as online abiotic technologies, such as turbidity meters (typically in the range of 1 to 10 measurements per minute).
In practice, online microbiological sensors are relatively pricey and require regular maintenance. One could envision the use of online microbiological sensors at treatment effluents, as already applied for abiotic parameters (e.g., turbidity, pH, conductivity). Favere et al. [43] demonstrated that online flow cytometry can be used as an early warning system for changes in water quality. However, it is not realistic to install the online microbiological sensors at many points in the distribution system. Instead, online technologies can be useful for water utilities to define targeted monitoring programs. Most water utilities and laboratories use infrequent grab sampling for monitoring water quality, especially for microbiological parameters. Considering daily water quality variations, water sampling alternatively in the morning or early afternoon may provide different results. Sampling systematically the same location at a given time can also provide a wrong image of the range of values expected at one location. A monitoring program, when not carefully thought out, may therefore provide a biased picture of the system. Online microbiological sensors can therefore be used in a detailed study to accurately describe inherent variations to the system (spatial changes and short-term variations), identify a representative range of values through high-frequency sampling, and define potential outliers. Such a detailed system description provides the opportunity to design appropriate monitoring campaigns by adapting the frequency of off-line sampling to the inherent dynamics of a system, as already proposed by Besmer et al. [16]. A detailed system description can also help in interpreting standard monitoring datasets with, for example, abnormal changes.

5. Conclusions

The investigation of spatial and short-term temporal variations in a drinking water distribution system using abiotic and microbial online sensors led to the following conclusions:
  • Hydraulic changes in drinking water distribution systems are highly dynamic and inevitable.
  • Flow velocity variations have a strong impact on turbidity and particle counts as a result of particle deposition and re-suspension.
  • Concentration of bacteria in suspension in water (free flowing) is mostly influenced by water age and concentration of the residual disinfectant (when relevant). Hydraulic conditions had limited impact on suspended microbiology, as assessed by flow cytometry.
  • A weak correlation between flow velocity and ATP concentrations suggests an impact of the hydraulic condition on particle-bound bacteria. Resuspension of particle-bound bacteria by either biofilm detachment or release from sediment is a random process, which can be incidentally enhanced by increased flow velocities.
  • Combinations of complimentary methods are required to describe complex microbial dynamics in drinking water systems.
  • Online measurements provide a range of values expected at a specific location or distribution area, and therefore help with the interpretation of routine monitoring data, understanding of dynamics inherent to the system, and better design sampling programs for water utilities.

Supplementary Materials

The following are available online at https://www.mdpi.com/2073-4441/13/1/109/s1, Figure S1: Range of FCM total cell concentrations (ICC) and total ATP concentrations at the treatment effluent (A) and four locations over water transport (B to D) and distribution (E) trajectory. Table S1. Statistical results of datasets of microbiological parameters at the studied locations described in Figure 1. Figure S2. Average particle counts per particle size (1 to 35 µm) at the treatment effluent (A) and three locations over water transport (B and C) and distribution (E) trajectory. Figure S3. Variation of flow velocities over 4 days at the treatment effluent (A) and four locations over water transport (B to D) and distribution (E) trajectory. Figure S4. Variations over 4 days of particle counts of 8 different particle sizes at the distribution location E. Figure S5. Correlation between flow velocity and turbidity at sampling locations A to E. Figure S6. Variations over 4 days of flow velocity, compared to FCM intact cells (ICC, top figure) intracellular ATP (bottom figure) at distribution location E. Figure S7. Correlation between flow velocity and with FCM total cells (TCC, top figure) and with total ATP and extracellular ATP.

Author Contributions

Conceptualization, E.I.P., P.G.S., M.D.B. and F.H.; methodology, M.D.B. and F.H.; Investigation, E.I.P., M.D.B. and F.H.; data curation, M.D.B.; formal analysis, E.I.P., M.D.B. and F.H.; writing—original draft preparation, E.I.P.; writing—review and editing, P.G.S., M.D.B. and F.H.; resources, E.I.P., P.G.S., M.D.B. and F.H.; project administration, E.I.P. and F.H.; All authors have read and agreed to the published version of the manuscript.

Funding

This research received no external funding.

Institutional Review Board Statement

Not applicable.

Informed Consent Statement

Not applicable.

Data Availability Statement

Data is contained within the article and supplementary material.

Acknowledgments

This research was performed under the R&D program of PWN, Water Supply Company Noord Holland, in collaboration with Eawag, Swiss Federal Institute of Aquatic Science and Technology. The authors thank Promega and TU-Delft for providing the microbial online equipment; Koos Michielsen (PWN) for support on practical design of sampling locations; Koos Michielsen (PWN), Roland Tschumie (Het Waterlaboratorium) and Marco Aalders (PWNT) for support on installation and maintenance of online equipment.

Conflicts of Interest

The authors declare no conflict of interest.

References

  1. De Moel, P.J.; Verberk, J.Q.J.C.; Van Dijk, J.C. Drinking Water: Principles and Practices; World Scientific: Singapore, 2006. [Google Scholar]
  2. National Research Council. Drinking Water Distribution Systems: Assessing and Reducing Risks; The National Academies Press: Washington, DC, USA, 2006. [Google Scholar] [CrossRef]
  3. Blokker, E.J.M.; Vreeburg, J.H.G.; Buchberger, S.G.; van Dijk, J.C. Importance of demand modelling in network water quality models: A review. Drink. Water Eng. Sci. 2008, 1, 27–38. [Google Scholar] [CrossRef] [Green Version]
  4. Pothof, I.W.M.; Blokker, E.J.M. Dynamic hydraulic models to study sedimentation in drinking water networks in detail. Drink. Water Eng. Sci. 2012, 5, 87–92. [Google Scholar] [CrossRef] [Green Version]
  5. Blokker, E.J.M.; Vreeburg, J.H.G.; Beverloo, H.; Klein Arfman, M.; van Dijk, J.C. A bottom-up approach of stochastic demand allocation in water quality modelling. Drink. Water Eng. Sci. 2010, 3, 43–51. [Google Scholar] [CrossRef] [Green Version]
  6. Husband, P.S.; Boxall, J.B.; Saul, A.J. Laboratory studies investigating the processes leading to discolouration in water distribution networks. Water Res. 2008, 42, 4309–4318. [Google Scholar] [CrossRef] [PubMed]
  7. Van Summeren, J.; Blokker, M. Modeling particle transport and discoloration risk in drinking water distribution networks. Drink. Water Eng. Sci. 2017, 10, 99–107. [Google Scholar] [CrossRef] [Green Version]
  8. Zacheus, O.M.; Lehtola, M.J.; Korhonen, L.K.; Martikainen, P.J. Soft deposits, the key site for microbial growth in drinking water distribution networks. Water Res. 2001, 35, 1757–1765. [Google Scholar] [CrossRef]
  9. Liu, G.; Bakker, G.L.; Li, S.; Vreeburg, H.G.; Verberk, J.Q.J.C.; Medema, G.J.; Liu, W.T.; Van Dijk, J.C. Pyrosequencing Reveals Bacterial Communities in Unchlorinated Drinking Water Distribution System: An Integral Study of Bulk Water, Suspended Solids, Loose Deposits, and Pipe Wall Biofilm. Environ. Sci. Technol. 2014, 48, 5467–5476. [Google Scholar] [CrossRef]
  10. Van der Wielen, P.W.J.J.; Lut, M.C. Distribution of microbial activity and specific microorganisms across sediment size fractions and pipe wall biofilm in a drinking water distribution system. Water Supply 2016, 16, 896–904. [Google Scholar] [CrossRef]
  11. Flemming, H.-C. Biofouling in water systems—Cases, causes and countermeasures. Appl. Microbiol. Biotechnol. 2002, 59, 629–640. [Google Scholar] [CrossRef]
  12. Liu, G.; Zhang, Y.; van der Mark, E.; Magic-Knezev, A.; Pinto, A.; van den Bogert, B.; Liu, W.T.; van der Meer, W.; Medema, G. Assessing the origin of bacteria in tap water and distribution system in an unchlorinated drinking water system by SourceTracker using microbial community fingerprints. Water Res. 2018, 138, 86–96. [Google Scholar] [CrossRef]
  13. Telgmann, U.; Horn, H.; Morgenroth, E. Influence of growth history on sloughing and erosion from biofilms. Water Res. 2004, 38, 3671–3684. [Google Scholar] [CrossRef] [PubMed]
  14. Tsai, Y.-P. Impact of flow velocity on the dynamic behaviour of biofilm bacteria. Biofouling 2005, 21, 267–277. [Google Scholar] [CrossRef]
  15. Besmer, M.D.; Hammes, F. Short-term microbial dynamics in a drinking water plant treating groundwater with occasional high microbial loads. Water Res. 2016, 107, 11–18. [Google Scholar] [CrossRef] [PubMed]
  16. Besmer, M.D.; Hammes, F.; Sigrist, J.A.; Ort, C. Evaluating monitoring strategies to detect precipitation-induced microbial contamination events in karstic springs used for drinking water. Front. Microbiol. 2017, 8, 2229. [Google Scholar] [CrossRef] [PubMed]
  17. Skovhus, L.T.; Højris, B. Microbiological Sensors for the Drinking Water Industry; IWA Publishing: London, UK, 2018. [Google Scholar] [CrossRef]
  18. Besmer, M.D.; Weissbrodt, D.G.; Kratochvil, B.E.; Sigrist, J.A.; Weyland, M.S.; Hammes, F. The feasibility of automated online flow cytometry for in-situ monitoring of microbial dynamics in aquatic ecosystems. Front. Microbiol. 2014, 5. [Google Scholar] [CrossRef] [Green Version]
  19. Prest, E.I.; Hammes, F.; Kotzsch, S.; van Loosdrecht, M.C.M.; Vrouwenvelder, J.S. Monitoring microbiological changes in drinking water systems using a fast and reproducible flow cytometric method. Water Res. 2013, 47, 7131–7142. [Google Scholar] [CrossRef]
  20. Vreeburg, J.H.G.; Boxall, J.B. Discolouration in potable water distribution systems: A review. Water Res. 2007, 41, 519–529. [Google Scholar] [CrossRef]
  21. Vreeburg, J.H.G.; Schaap, P.G.; van Dijk, J.C. Particles in the drinking water system: From source to discolouration. Water Supply 2004, 4, 431–438. [Google Scholar] [CrossRef]
  22. Matsui, Y.; Yamagishi, T.; Terada, Y.; Matsushita, T.; Inoue, T. Suspended particles and their characteristics in water mains: Developments of sampling methods. AQUA 2007, 56, 13–24. [Google Scholar] [CrossRef] [Green Version]
  23. Husband, S.; Fish, K.E.; Douterelo, I.; Boxall, J. Linking discolouration modelling and biofilm behaviour within drinking water distribution systems. Water Sci. Technol. Water Supply 2016, 16, 942–950. [Google Scholar] [CrossRef]
  24. Gauthier, V.; Gérard, B.; Portal, J.-M.; Block, J.-C.; Gatel, D. Organic matter as loose deposits in a drinking water distribution system. Water Res. 1999, 33, 1014–1026. [Google Scholar] [CrossRef]
  25. Ackers, J.; Brandt, M.; Powell, J. Hydraulic Characterisation of Deposits and Review of Sediment Modelling; Drinking water quality and health—Distribution Systems. Project 01/DW/03/18; UK Water Industry Research: London, UK, 2001. [Google Scholar]
  26. Slaats, P.G.G.; Rosenthal, L.P.M.; Siegers, W.G.; van den Boomen, M.; Beuken, R.H.S.; Vreeburg, J.H.G. Processes Involved in the Generation of Discolored Water; AWWARF Report 90966F; AWWARF: Denver, CO, USA, 2003. [Google Scholar]
  27. Ryan, G.; Mathes, P.; Haylock, G.; Jayaratne, A.; Wu, J.; Noui-Mehidi, N.; Grainger, C.; Nguyen, B.V. Particles in Water Distribution Systems; Research Report 33; Cooperative Research Centre for Water Quality and Treatment: Salisbury, Australia, 2008. [Google Scholar]
  28. Blokker, E.J.M.; Schaap, P.G.; Vreeburg, J.H.G. Self-cleaning networks put to the test. In Strategic Asset Management of Water Supply and Wastewater Infrastructures 2008, Proceedings of the Invited Papers from the IWA Leading Edge Conference on Strategic Asset Management (LESAM), Lisbon, Portugal, 17 October 2007; Alegre, H., Almeida, M.C., Eds.; IWA Publishing: London, UK, 2009; pp. 407–417. [Google Scholar]
  29. Blokker, E.J.M.; Vreeburg, J.H.G.; Schaap, P.G.; van Dijk, J.C. The Self-Cleaning Velocity in Practice; WDSA: Tuscon, AZ, USA, 2010. [Google Scholar]
  30. Vreeburg, J.H.G.; Blokker, E.J.M.; Horst, P.; Van Dijk, J.C. Velocity-based self-cleaning residential drinking water distribution systems. Water Sci. Technol. Water Supply 2009, 9, 635–641. [Google Scholar] [CrossRef]
  31. Husband, P.S.; Boxall, J.B. Asset deterioration and discolouration in water distribution systems. Water Res. 2011, 45, 113–124. [Google Scholar] [CrossRef]
  32. Sunny, I.; Husband, P.S.; Boxall, J.B. Impact of hydraulic interventions on chronic and acute material loading and discolouration risk in drinking water distribution systems. Water Res. 2020, 169, 115224. [Google Scholar] [CrossRef] [PubMed]
  33. Fish, K.; Osborn, A.M.; Boxall, J.B. Characterising and understanding the impact of microbial biofilms and the extracellular polymeric substance (EPS) matrix in drinking water distribution systems. Environ. Sci. Water Res. Technol. 2016, 2, 614. [Google Scholar] [CrossRef] [Green Version]
  34. Fish, K.; Osborn, A.M.; Boxall, J.B. Biofilm structures (EPS and bacterial communities) in drinking water distribution systems are conditioned by hydraulics and influence discolouration. Sci. Total Environ. 2017, 593–594, 571–580. [Google Scholar] [CrossRef]
  35. Cowle, M.; Webster, G.; Babatunde, A.; Bockelmann-Evans, B.; Weightman, A. Impact of flow hydrodynamics and pipe material properties on biofilm development within drinking water systems. Environ. Technol. 2019. [Google Scholar] [CrossRef] [Green Version]
  36. Douterelo, I.; Husband, S.; Loza, V.; Boxall, J. Dynamics of biofilm regrowth in drinking water distribution systems. Appl. Environ. Microbiol. 2016, 82, 4155–4168. [Google Scholar] [CrossRef] [Green Version]
  37. Douterelo, I.; Dutilh, B.E.; Arkhipova, K.; Calero, C.; Husband, S. Microbial diversity, ecological networks and functional traits associated to materials used in drinking water distribution systems. Water Res. 2020, 173, 115586. [Google Scholar] [CrossRef]
  38. Van Nevel, S.; Koetzsch, S.; Proctor, C.R.; Besmer, M.D.; Prest, E.I.; Vrouwenvelder, J.S.; Knezev, A.; Boon, N.; Hammes, F. Flow cytometric bacterial cell counts challenge conventional heterotrophic plate counts for routine microbiological drinking water monitoring. Water Res. 2017, 113, 191–206. [Google Scholar] [CrossRef] [Green Version]
  39. Hammes, F.; Berney, M.; Egli, T. Cultivation-independent assessment of bacterial viability. Adv. Biochem. Engin. Biotechnol. 2011, 124, 123–150. [Google Scholar]
  40. Nescerecka, A.; Juhna, T.; Hammes, F. Behavior and stability of adenosine triphosphate (ATP) during chlorine disinfection. Water Res. 2016, 101, 490–497. [Google Scholar] [CrossRef] [PubMed]
  41. Hammes, F.; Goldschmidt, F.; Vital, M.; Wang, Y.; Egli, T. Measurement and interpretation of microbial adenosine tri-phosphate (ATP) in aquatic environments. Water Res. 2010, 44, 3915–3923. [Google Scholar] [CrossRef] [PubMed]
  42. Seviour, T.; Derlon, N.; Dueholm, M.; Flemming, H.; Girbal-Neuhauser, E.; Horn, H.; Kjelleberg, S.; van Loosdrecht, M.; Lotti, T.; Malpei, M.; et al. Extracellular polymeric substances of biofilms: Suffering from an identity crisis. Water Res. 2019, 151, 1–7. [Google Scholar] [CrossRef]
  43. Favere, J.; Buysschaert, B.; Boon, N.; De Gusseme, B. Online microbial fingerprinting for quality management of drinking water: Full-scale event detection. Water Res. 2020, 170, 115353. [Google Scholar] [CrossRef]
  44. Buysschaert, B.; Vermijs, L.; Naka, A.; Boon, N.; De Gusseme, B. Online flow cytometric monitoring of microbial water quality in a full-scale water treatment plant. NPJ Clean Water 2018, 1, 16. [Google Scholar] [CrossRef] [Green Version]
Figure 1. Characteristics of sampling points in the studied DWDS. (Top) Schematic overview of transport mains and distribution system piping layout, indicating the sampling point locations (A–E). (Bottom) Change in average water age and pipe diameters over the studied water trajectory from sampling locations A to E.
Water 13 00109 g001
Figure 2. Changes in the flow rates (left) and flow velocities (right) from the treatment effluent (A) and four locations over the water transport (B–D) and distribution (E) trajectory. Box plots show the first, second (median), and third quartiles, whiskers show the data range, circles show outlier values, and a cross (x) indicates the mean value. The number of measurements are shown in brackets.
Water 13 00109 g002
Figure 3. Range of FCM intact cell concentrations (left; ICC) and intracellular ATP concentrations (right) at the treatment effluent (A) and four locations over water transport (B–D) and distribution (E) trajectory. Box plots show the first, second (median), and third quartiles, whiskers show the data range, circles show outlier values, and a cross (x) indicates the mean value. The number of measurements are shown between brackets. For ATP data, outliers for locations C (9 outliers), D (18 outliers), and E (26 outliers) up to 700 ng/L are out of scale.
Water 13 00109 g003
Figure 4. Variations over four days of flow velocity compared to turbidity (top figure) and the number of particles of 1 to 2 µm size (bottom figure) at distribution location E. For comparison purposes, the flow velocity data shown on the top and bottom figures are identical. Flow velocity and turbidity data are presented as moving averages. Vertical lines indicate the time at 0:00 of each day.
Water 13 00109 g004
Figure 5. Range of turbidity (left) and total particle counts (right) at the treatment effluent (A) and four locations over water transport (B–D) and distribution (E) trajectory. Particle counts data from location D are not reported due to instrument failure. Box plots show the first, second (median), and third quartiles, whiskers show the data range, circles show outlier values, and a cross (x) indicates the mean value. The numbers of measurements are shown in brackets. Outliers for locations C (26 outliers for turbidity and 9 for particle counts), D (15 outliers for turbidity), and E (48 outliers for particle counts) up to 0.9 NTU and 2600 particles/mL are out of scale.
Water 13 00109 g005
Figure 6. Relation between flow velocity and turbidity (top figure) and counts of particles of different sizes (bottom figure) at distribution location E based on measurements collected during one week.
Water 13 00109 g006
Figure 7. Variations over four days of flow velocity compared to FCM intact cells (ICC, top figure) and intracellular ATP (bottom figure) at distribution location E. For comparison purposes, the flow velocity data shown on the top and bottom figure is identical. Flow velocity data is presented as moving averages. Vertical lines indicate the time at 0:00 of each day. Eight ATP data points up to 450 ng/L are out of scale.
Water 13 00109 g007
Figure 8. Relation between flow velocity and FCM intact cells (ICC, top figure) and intracellular ATP (bottom figure) at distribution location E.
Water 13 00109 g008
Table 1. Measurement scheme. An online ATP analyzer (EZ-ATP), two online flow cytometers (FCM), five particle counters, turbidity meters, and flow meters were placed consecutively at the five locations over the drinking water trajectory, as indicated in Figure 1. 1 Particle counts from location B and C and ATP from location D could not be collected simultaneously to other parameters due to practical issues. 2 Particle count data from location D was not collected due to instrument failure.
Water 13 00109 i001
Publisher’s Note: MDPI stays neutral with regard to jurisdictional claims in published maps and institutional affiliations.

