Article

Using Multisource Geospatial Data to Identify Potential Wetland Rehabilitation Areas: A Pilot Study in China’s Sanjiang Plain

1
Key Laboratory of Wetland Ecology and Environment, Northeast Institute of Geography and Agroecology, Chinese Academy of Sciences, Changchun 130102, China
2
University of Chinese Academy of Sciences, Beijing 100049, China
3
Jingyuetan Remote Sensing Experiment Station, Chinese Academy of Sciences, Changchun 130102, China
4
National Earth System Science Data Center, Beijing 100101, China
*
Author to whom correspondence should be addressed.
Water 2020, 12(9), 2496; https://doi.org/10.3390/w12092496
Submission received: 17 August 2020 / Revised: 4 September 2020 / Accepted: 4 September 2020 / Published: 7 September 2020
(This article belongs to the Section Water Resources Management, Policy and Governance)

Abstract

:
Wetland rehabilitation, highlighted in the United Nations (UN) Sustainable Development Goals (SDGs), is imperative for responding to decreased regional biodiversity and degraded ecosystem functions and services. Knowing where the most suitable wetland rehabilitation areas are can strengthen scientific planning and decision-making for natural wetland conservation and management implementation. Therefore, we integrated multisource geospatial data characterizing hydrological, topographical, management, and policy factors, including maximum surface water coverage, farming time, anthropogenic disturbance, and wetland protection level, to identify potential wetland rehabilitation areas in the Sanjiang Plain (SJP), the largest marsh distribution and a hotspot wetland loss region in China. Our results indicate that a total of 11,643 km2 of wetlands were converted into croplands for agricultural production from 1990 to 2018. We estimated that 5415 km2 of the croplands were suitable for wetland rehabilitation in the SJP, of which 4193 km2 (77%) have high rehabilitation priority. Specifically, 63% of the potential areas available for wetland rehabilitation are dry croplands (3419 km2), the rest (37%) being paddy fields. We argue that the selected indicators and approach used in this study to determine potential wetland rehabilitation areas could guide their investigation, at either the provincial or national scale and would be beneficial to conservation and sustainable management of wetlands in the SJP.

1. Introduction

Wetlands perform multiple ecosystem functions and services and thus are of great significance to sustainable development [1,2]. However, intensive anthropogenic disturbances and ongoing climatic changes have triggered a striking loss of wetlands worldwide [3,4,5]. The shrinking wetland areas and declining ecosystem quality have significant ecological consequences, including more frequent and severe floods [6], accelerated loss of biodiversity [2,6], diminished water quality, [7] and reduced carbon sequestration [8,9].
In response to wetland loss and degradation, wetland rehabilitation is an important approach to achieve ecological security and sustainability, as highlighted in the United Nations Sustainable Development Goals (SDGs) 6.6 and 15.1. Before effective wetland rehabilitation measures can be implemented, it is imperative to identify potentially suitable areas. Various methods and indicators have been used to perform this investigation over the past few decades. For example, Maleki et al. [10] extracted the wetlands damaged by water scarcity due to dry climate and upstream interception and categorized them with the highest priority areas for wetland rehabilitation. In work by Russell et al. [11], basin topographical and land cover datasets were combined to determine potential suitability for wetland rehabilitation in the San Luis Rey River basin in southern California. As demonstrated by those studies, rehabilitation of wetlands should benefit from optimum hydrological conditions [12] and topographical characteristics. Cropland with low productivity was considered for a potential wetland rehabilitation area [13]. However, limited indicators were evaluated in these previous studies. Both anthropogenic threats [14] and the protection level provided by nature reserves should also be considered when identifying potential areas for wetland rehabilitation. For instance, agricultural cultivation should be banned in the core and experimental areas of nature reserves based on national legislation. Therefore, a multifactorial and systematic analysis seems essential for robustly assessing which areas are suitable for rehabilitating lost wetlands.
China is increasingly acknowledging the importance of wetlands and has formulated a National Wetland Conservation Project (NWCP), which has a suite of laudable and ambitious targets, including the intention to restore 14,000 km2 of wetlands [15]. As stated by Asselen et al. [16], worldwide wetland losses could be predominantly attributed to agricultural encroachment. Results from research by Mao et al. [17] showed that about 60% (15,765 km2) of the natural wetland loss in China from 1990 to 2010 was due to the encroachment of agricultural cultivation, especially in northeast China, where the conversion from natural wetland to cropland was the highest. Although a total of 1369 km2 of natural wetlands were returned from cropland between 1990 and 2010, mainly in northeastern China and the country’s humid regions [17], this rehabilitated area was far smaller than the area lost. Therefore, China must develop site-based policies and plans for sustainable management of natural wetlands [17]. Effectively identifying areas that are suitable for wetland rehabilitation is thus needed.
Previous research has shown that remote sensing (RS) and geographic information systems (GIS) are valuable tools in support of decision-making regarding wetland rehabilitation [18]. Specifically, RS can describe current and historical land cover through image classification, and then assess the suitability of rehabilitation sites [19]. With GIS, many kinds of spatial analyses can be performed, such as buffer and overlay analyses. Therefore, by using both RS and GIS software, multiple geospatial data can be integrated to form a system for recognizing potential areas for wetland rehabilitation.
The Sanjiang Plain (SJP) located in Northeast China (NEC) has abundant water resources and croplands and thus has been an important grain production base [20,21]. In the SJP, the area of wetlands dominated by marsh has declined in the past few decades due to climatic drivers and anthropogenic disturbances [1,22]. This decline in wetland area has affected local ecosystem stability and negatively impacted populations of waterfowl species [23]. Therefore, it is critical to rehabilitate wetlands in the SJP and balance wetland conservation and food security. To resolve this trade-off, we need to locate potential areas that are optimal for rehabilitating wetlands, but such research is currently lacking for the SJP. Accordingly, our study had three objectives: (1) to investigate wetland disappearance via cropland expansion, (2) to establish an indicator system for identifying potential areas for wetland rehabilitation from multisource geospatial data, and (3) to reveal the spatial patterns and composition of potential wetland rehabilitation areas. The findings will help guide the performance of a wetland rehabilitation in the SJP and provide guidance for wetland rehabilitation in other areas.

2. Materials and Methods

2.1. Study Area

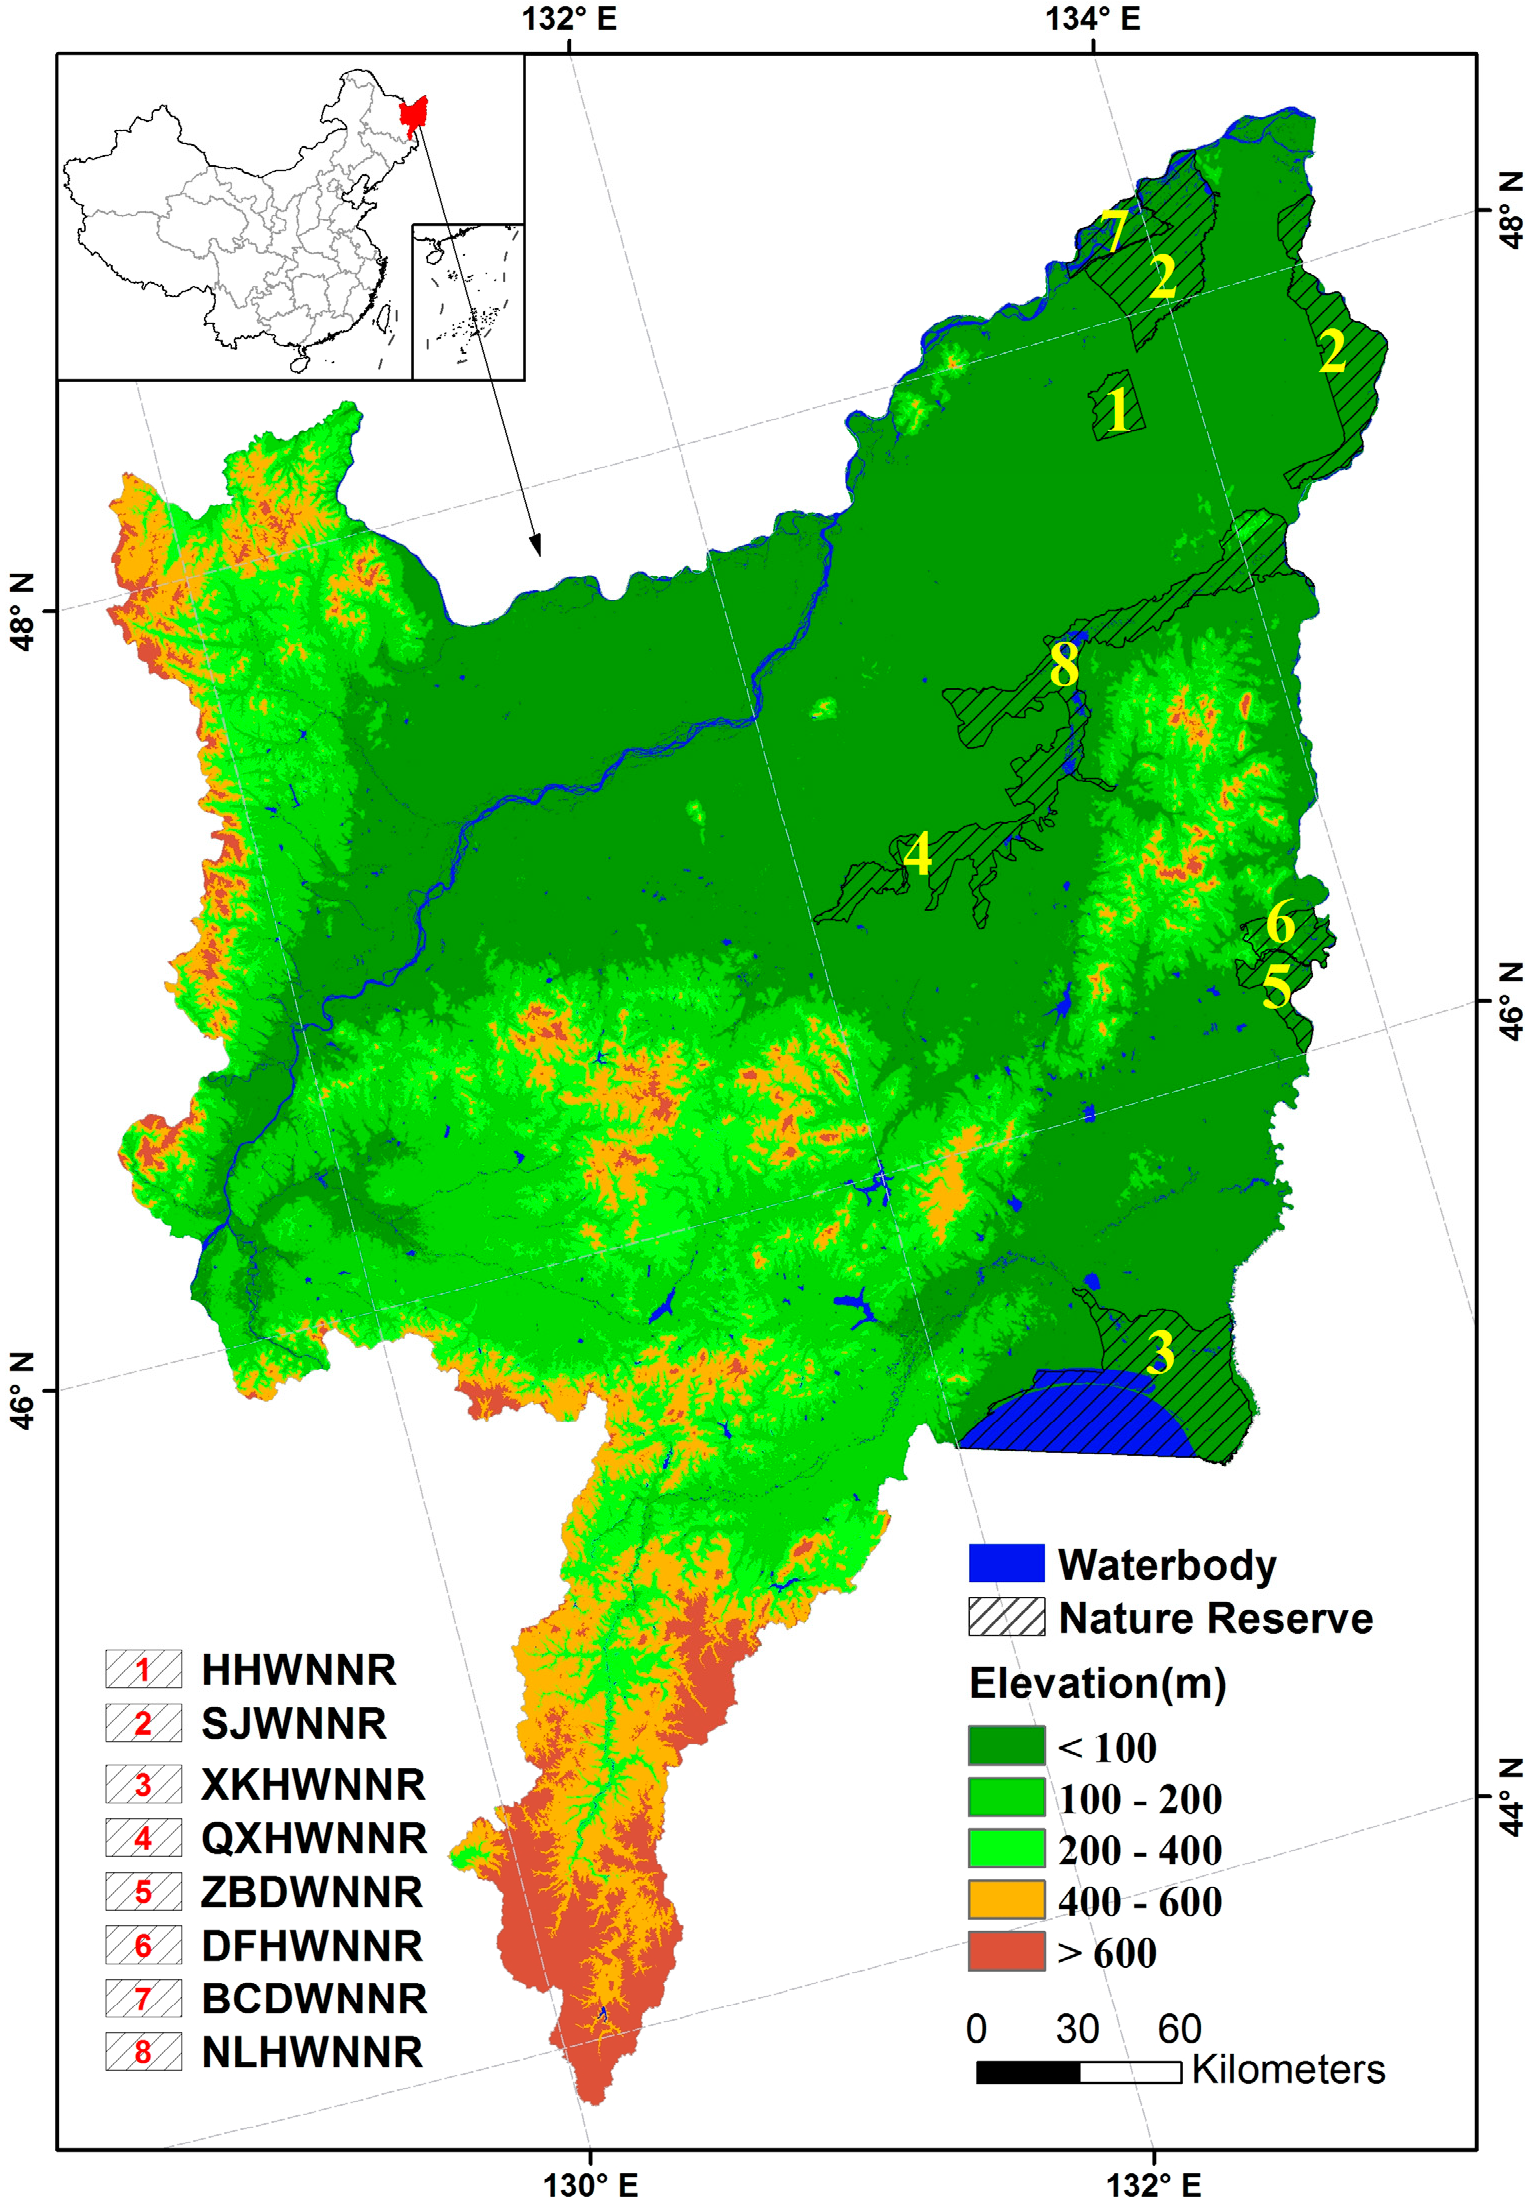
The SJP lies in Heilongjiang Province, extending from 43°49′55″ N to 48°27′40″ N and from 129°11′20″ E to 135°05′26″ E and covering a total land area of 108,900 km2 (Figure 1). Topographically, higher elevations characterize the southwest while lower ones predominate in the northeast. The elevation is below 200 m for most of the plain formed by the alluvial accumulation of the Heilongjiang, Songhuajiang, and Ussuri rivers. The climate in the SJP is dominated by temperate humid and subhumid continental monsoon conditions [22]. Mean annual precipitation ranges from 500 to 650 mm and mean annual air temperature ranges from 1.4 to 4.3 °C [21]. The SJP has the largest marsh area in China [24], providing critical habitats for many waterfowl species. In total, eight Wetland National Nature Reserves [25], (i.e., the Zhenbaodao (ZBDWNNR), the Dongfanghong (DFHWNNR), the Bachadao (BCDWNNR), the Sanjiang (SJWNNR), the Naolihe (NLHWNNR), the Xingkaihu (XKHWNNR), the Qixinghe (QXHWNNR), and the Honghe Wetland National Nature Reserve (HHWNNR)), were established to protect the marsh ecosystem and waterfowl.

2.2. Land Cover Dataset

To characterize different indicators for wetland rehabilitation, land cover datasets covering the SJP in 1990, 2000, 2008, 2013, and 2018 were acquired from the Northeast Branch of the National Earth System Science Data Center (www.igadc.cn). These datasets were classified from Landsat series images with a 30-m spatial resolution through an object-based and hierarchical decision-tree classification method [21]. In this study, land covers were categorized into seven types including woodland, grassland, wetland, waterbody, cropland, built-up land, and barren land. Detailed definitions of these land cover types are found in Zhang et al. [26]. Waterbody was separated from wetland, and thus the wetland in this study refers to marsh. Cropland was classified into two subclasses including dry farmland and paddy field. Built-up land, including transportation land, residential land, industrial land, and mining land, were used to characterize anthropogenic threats.

2.3. Wetland Rehabilitation Indicator System Established from Multisource Geospatial Data

In this study, five indicators characterized by multisource geospatial data were selected for determining potential wetland rehabilitation areas. These indicators considered hydrological and terrain conditions, policy and management, and anthropogenic threats. Detailed descriptions for these indicators are shown below.

2.3.1. Wetlands Encroached by Agricultural Cultivation

In this research, we focus solely on the rehabilitation of wetlands from croplands. Before we can evaluate the wetland rehabilitation potential from such croplands, it is essential to know the spatial positioning of those wetlands that were cultivated into cropland. Wetland rehabilitation projects in northern China consider this return as an effective rehabilitation approach. With a longer cultivation time, the viability of the seed bank becomes lower, since the dominant species in the seed bank survive as seeds for only about 10 years [27,28]. Therefore, we classified the cropland areas converted from wetlands in 2013–2018 and 2008–2013 as a high rehabilitation priority, with those in 2000–2008 and 1990–2000 deemed a medium priority.

2.3.2. Hydrologic Condition Characterized by the Current and Historical Distribution of Waterbodies

The hydrological condition of a site is the most significant factor to be considered when pursuing wetland rehabilitation [29]. Based on our acquired land cover dataset, we used waterbody distribution in 2018 as the basis for the current hydrological condition analysis. Flood disasters in 1998 and 2013 occurred in the SJP, which severely impaired regional economic and social development. Nonetheless, these flooded zones could reflect the suitable topographical and hydrological conditions for wetland rehabilitation. Accordingly, flooded areas in 1998 and 2013 were mapped by manual interpretation from Landsat images. Since the flooded area was smaller in 1998 than in 2013, we presumed the flood layer in 1998 and the waterbody in 2018 within a 300-m buffer zone were assigned a high rehabilitation priority based on field investigation and expert consultation, and the other flooded area in 2013 was given a medium rehabilitation priority.

2.3.3. Topographical Characteristics by Digital Elevation Model (DEM)

The soil and water conservation capacity of lands with a steep slope is limited [30]. Therefore, the influence of topography on wetland rehabilitation should not be ignored [31]. The land slopes across the entire SJP were generated from DEM data with a spatial resolution of 30 m provided by the United States Geological Survey (USGS). We excluded the croplands having a slope greater than 5° from the wetland rehabilitation areas.

2.3.4. Anthropogenic Threats Characterized by Built-Up Land Distribution

Anthropogenic threats have substantial negative impacts on wetland ecosystems [32]. Therefore, potential anthropogenic disturbance should be minimized in the course of wetland rehabilitation. In our assessment, we applied a 500-m buffer zone outside any built-up area and excluded these croplands from the potential wetland rehabilitation area.

2.3.5. Ecological Conservation Levels Characterized by the Legislation for WNNR

Previous researchers [33,34,35] concluded that the protection efficiency of the WNNR in NEC needs to be improved. According to legislation for WNNR, no agricultural activities are allowed in the national protected areas. Based on functional divisions of WNNR, ecosystems in core and buffer zones should be protected with a higher level. Although some croplands existed before the establishment of the WNNR, croplands in natural protected areas should be removed or rehabilitated into wetlands or other natural ecosystems [20]. Therefore, according to the hydrological and topographical criteria, if the above criteria were met, croplands in core and buffer zones of WNNR were assigned as a high priority for wetland rehabilitation, and croplands in the experimental zone were assigned medium priority.

2.4. Method for Determining Potential Wetland Rehabilitation Areas from Croplands

Using ArcGIS 10.6 software to perform the overlay analysis on the above five dataset layers, we could obtain the potential areas of wetland rehabilitation from croplands with differing rehabilitation priorities (Figure 2). Table 1 summarized the established indicator system for identifying potential wetland rehabilitation areas.
To prioritize different wetland rehabilitation, firstly, we merged the layers of croplands converted from wetlands in the periods 1990–2008 and 2008–2018 with any cropland existing in the nature reserves. The newly generated layer contains the largest area of croplands with potential for wetland rehabilitation. Secondly, from this newly generated dataset layer, the croplands that met the hydrological condition were extracted. Thirdly, based on topographical characteristics and anthropogenic disturbance factors, some croplands were excluded from the previous dataset layer. Fourthly, according to our stated classification criteria, the obtained cropland dataset layer was separated into potential wetland rehabilitation areas having either high or medium priorities. Finally, we provided the map of potential wetland rehabilitation areas with differing priorities. Figure 2 shows the wetland rehabilitation framework applied in this study.

3. Results

3.1. Spatial Distribution of Land Cover in 2018

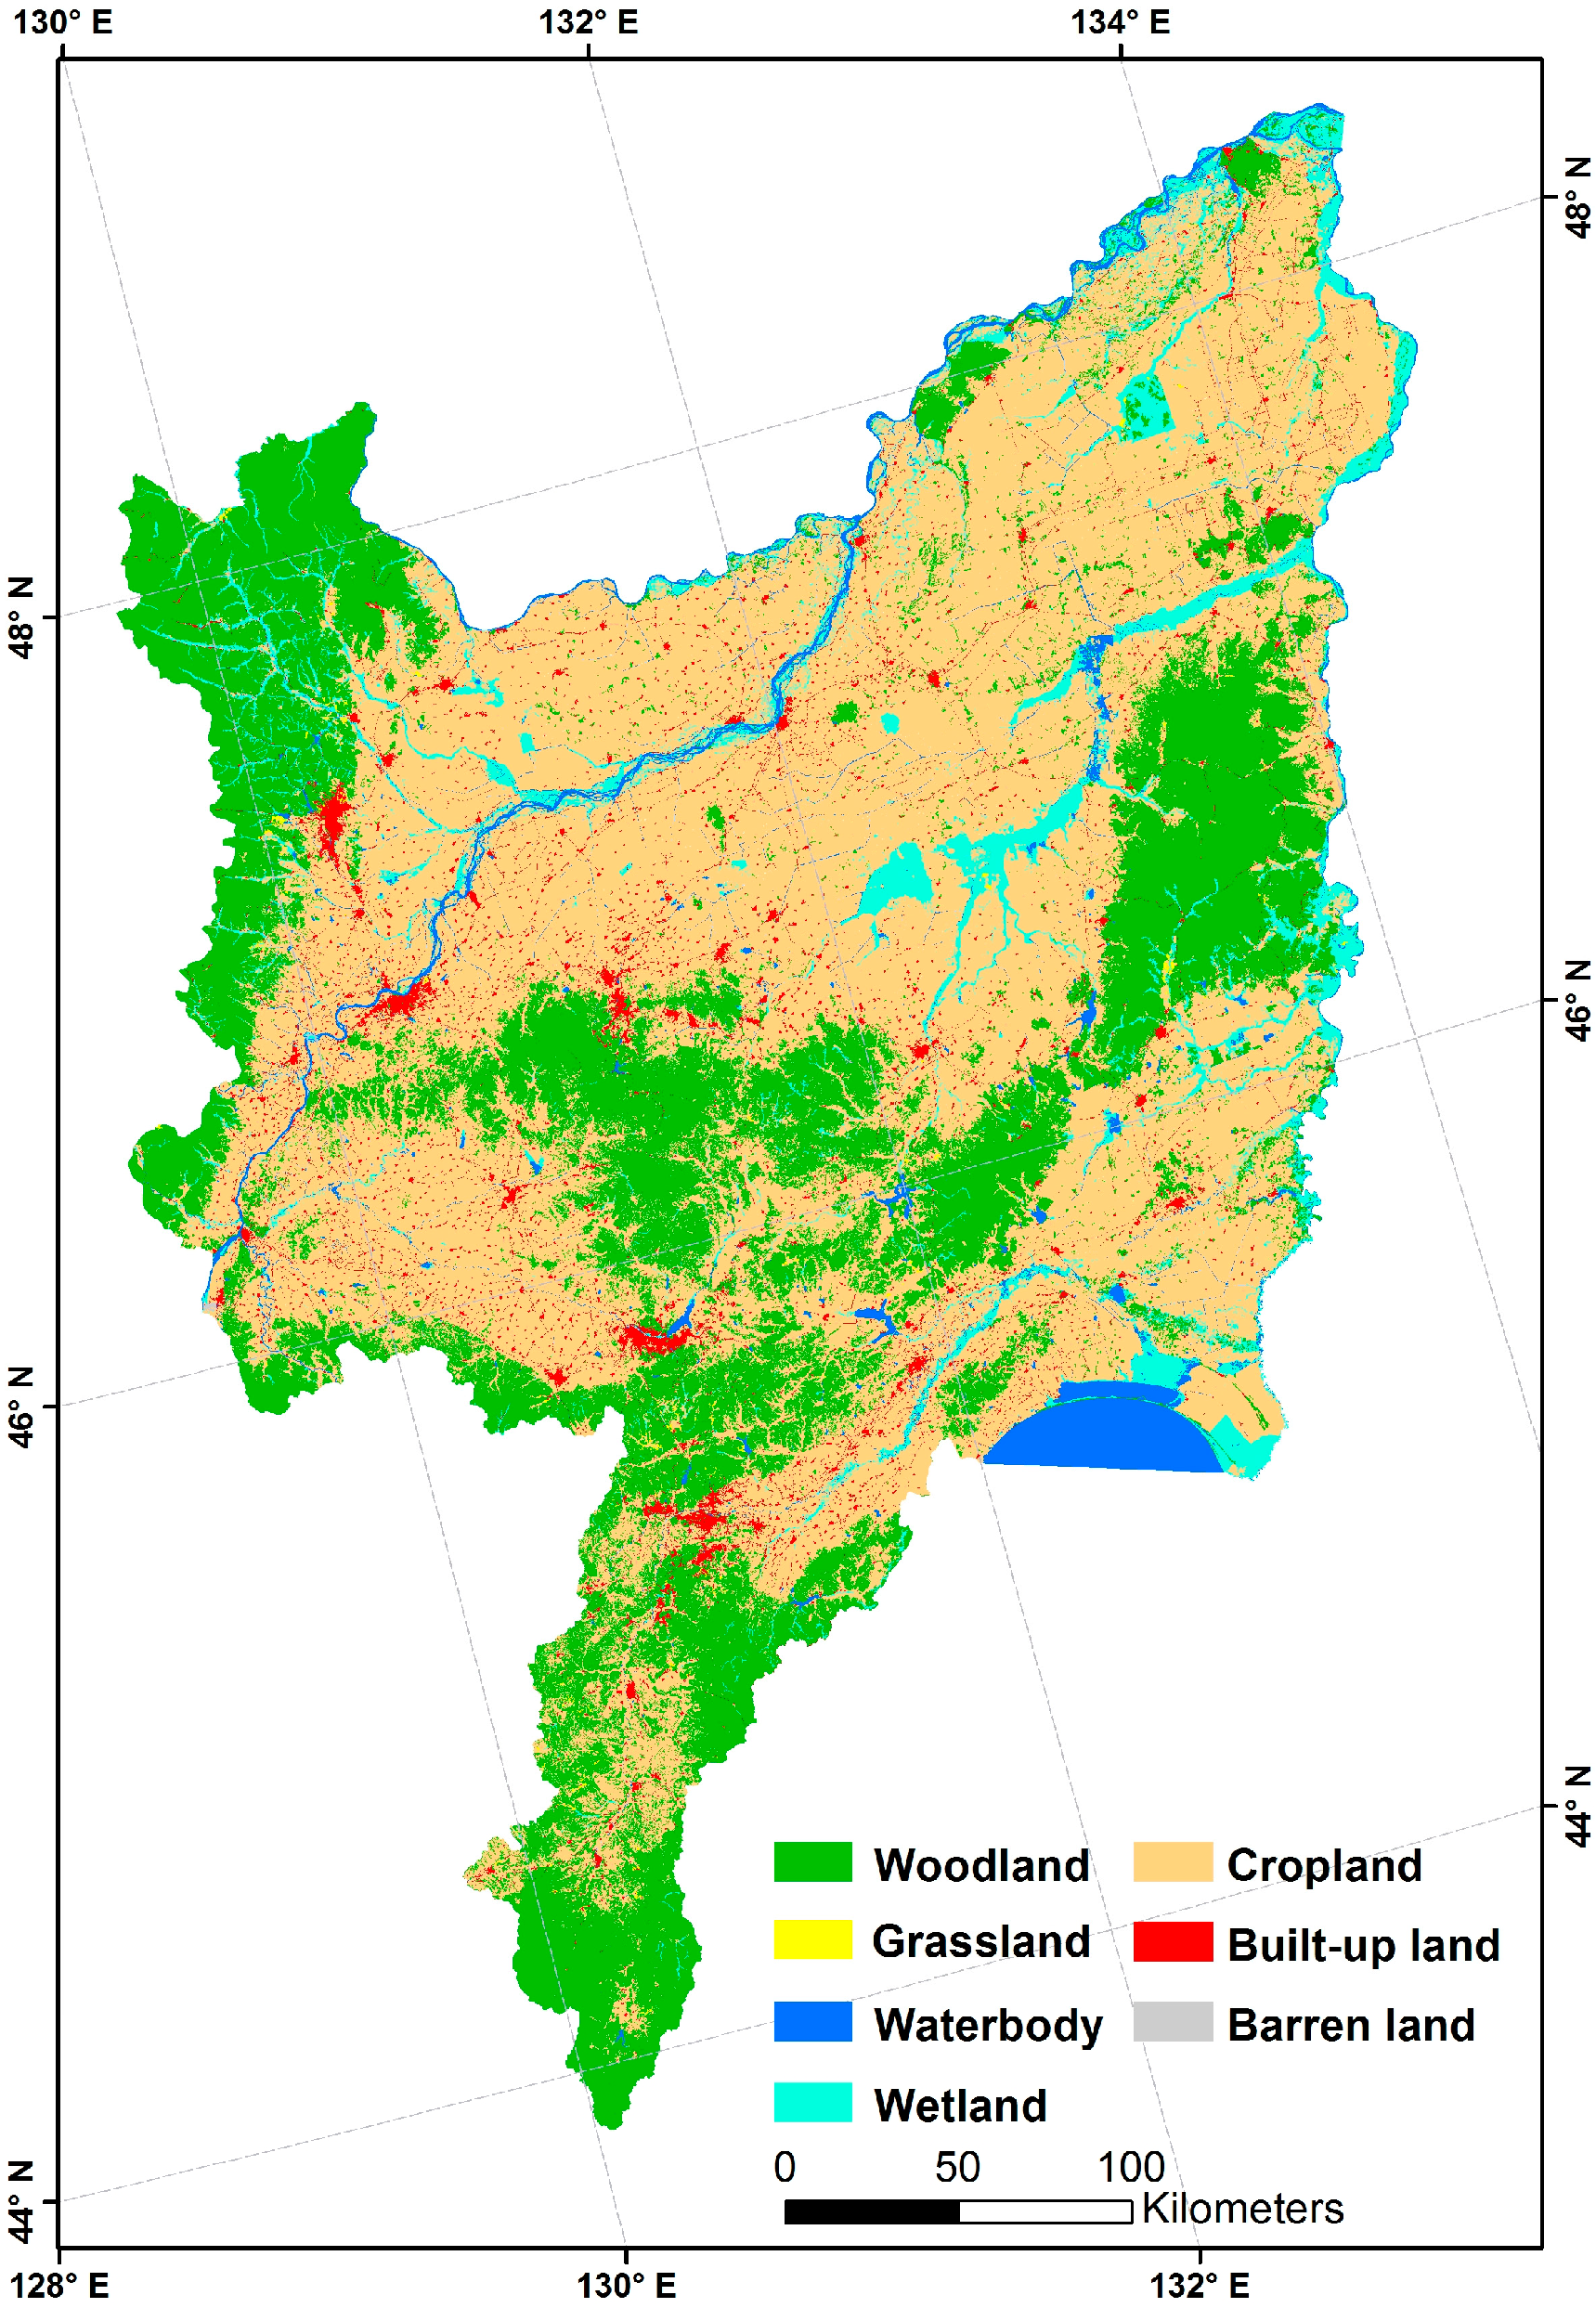
Landscape pattern in 2018 for the SJP is shown in Figure 3. Total area of croplands in the SJP was 61,553 km2, accounting for 57% of the study area. Woodland was dominantly identified in the west and south-central part of the SJP, being the second largest landscape type covering 33,596 km2 (31%).
Wetland and waterbodies occupied an area of 6560 km2 and 3427 km2, respectively, mainly distributed in eastern SJP, together accounting for 9% of its total land area. The largest wetland patch was observed in the NLHWNNL. Little grassland (only 183 km2) was observed in the SJP. The SJP had small amounts of built-up and barren lands, with 3313 km2 (3%) and 71 km2 (<1%), respectively.

3.2. Wetland Loss Triggered by Cropland Expansion

By overlaying datasets of cropland and wetland, the quantity and spatial location of historical wetlands lost from cropland expansion were determined. This revealed that during the four examined periods of 1990–2000, 2000–2008, 2008–2013, and 2013–2018, large proportions of wetlands were converted into croplands (Figure 4, Table 2). Wetlands near rivers were found more likely to be reclaimed. During the periods of 2008–2013 and 2013–2018, most isolated wetland patches were occupied due to expansion of croplands. Wetland conversion into cropland occurred primarily in northeastern SJP during 2000–2008 but also in both its northeastern and middle parts during the 1990–2000 period.
From 1990 to 2018, there were in total 11,643 km2 of wetlands converted to croplands. From 2008 to 2013, the reclamation rate (144 km2·year−1) was the lowest, and wetland losses due to expansion of cropland has been slowing in the past decades. Although we uncovered a slight rise in the conversion of wetlands to croplands between 2013 and 2018, the overall loss trend was downward for the SJP (Table 2).

3.3. Spatial Visualization of Wetland Rehabilitation Indicators

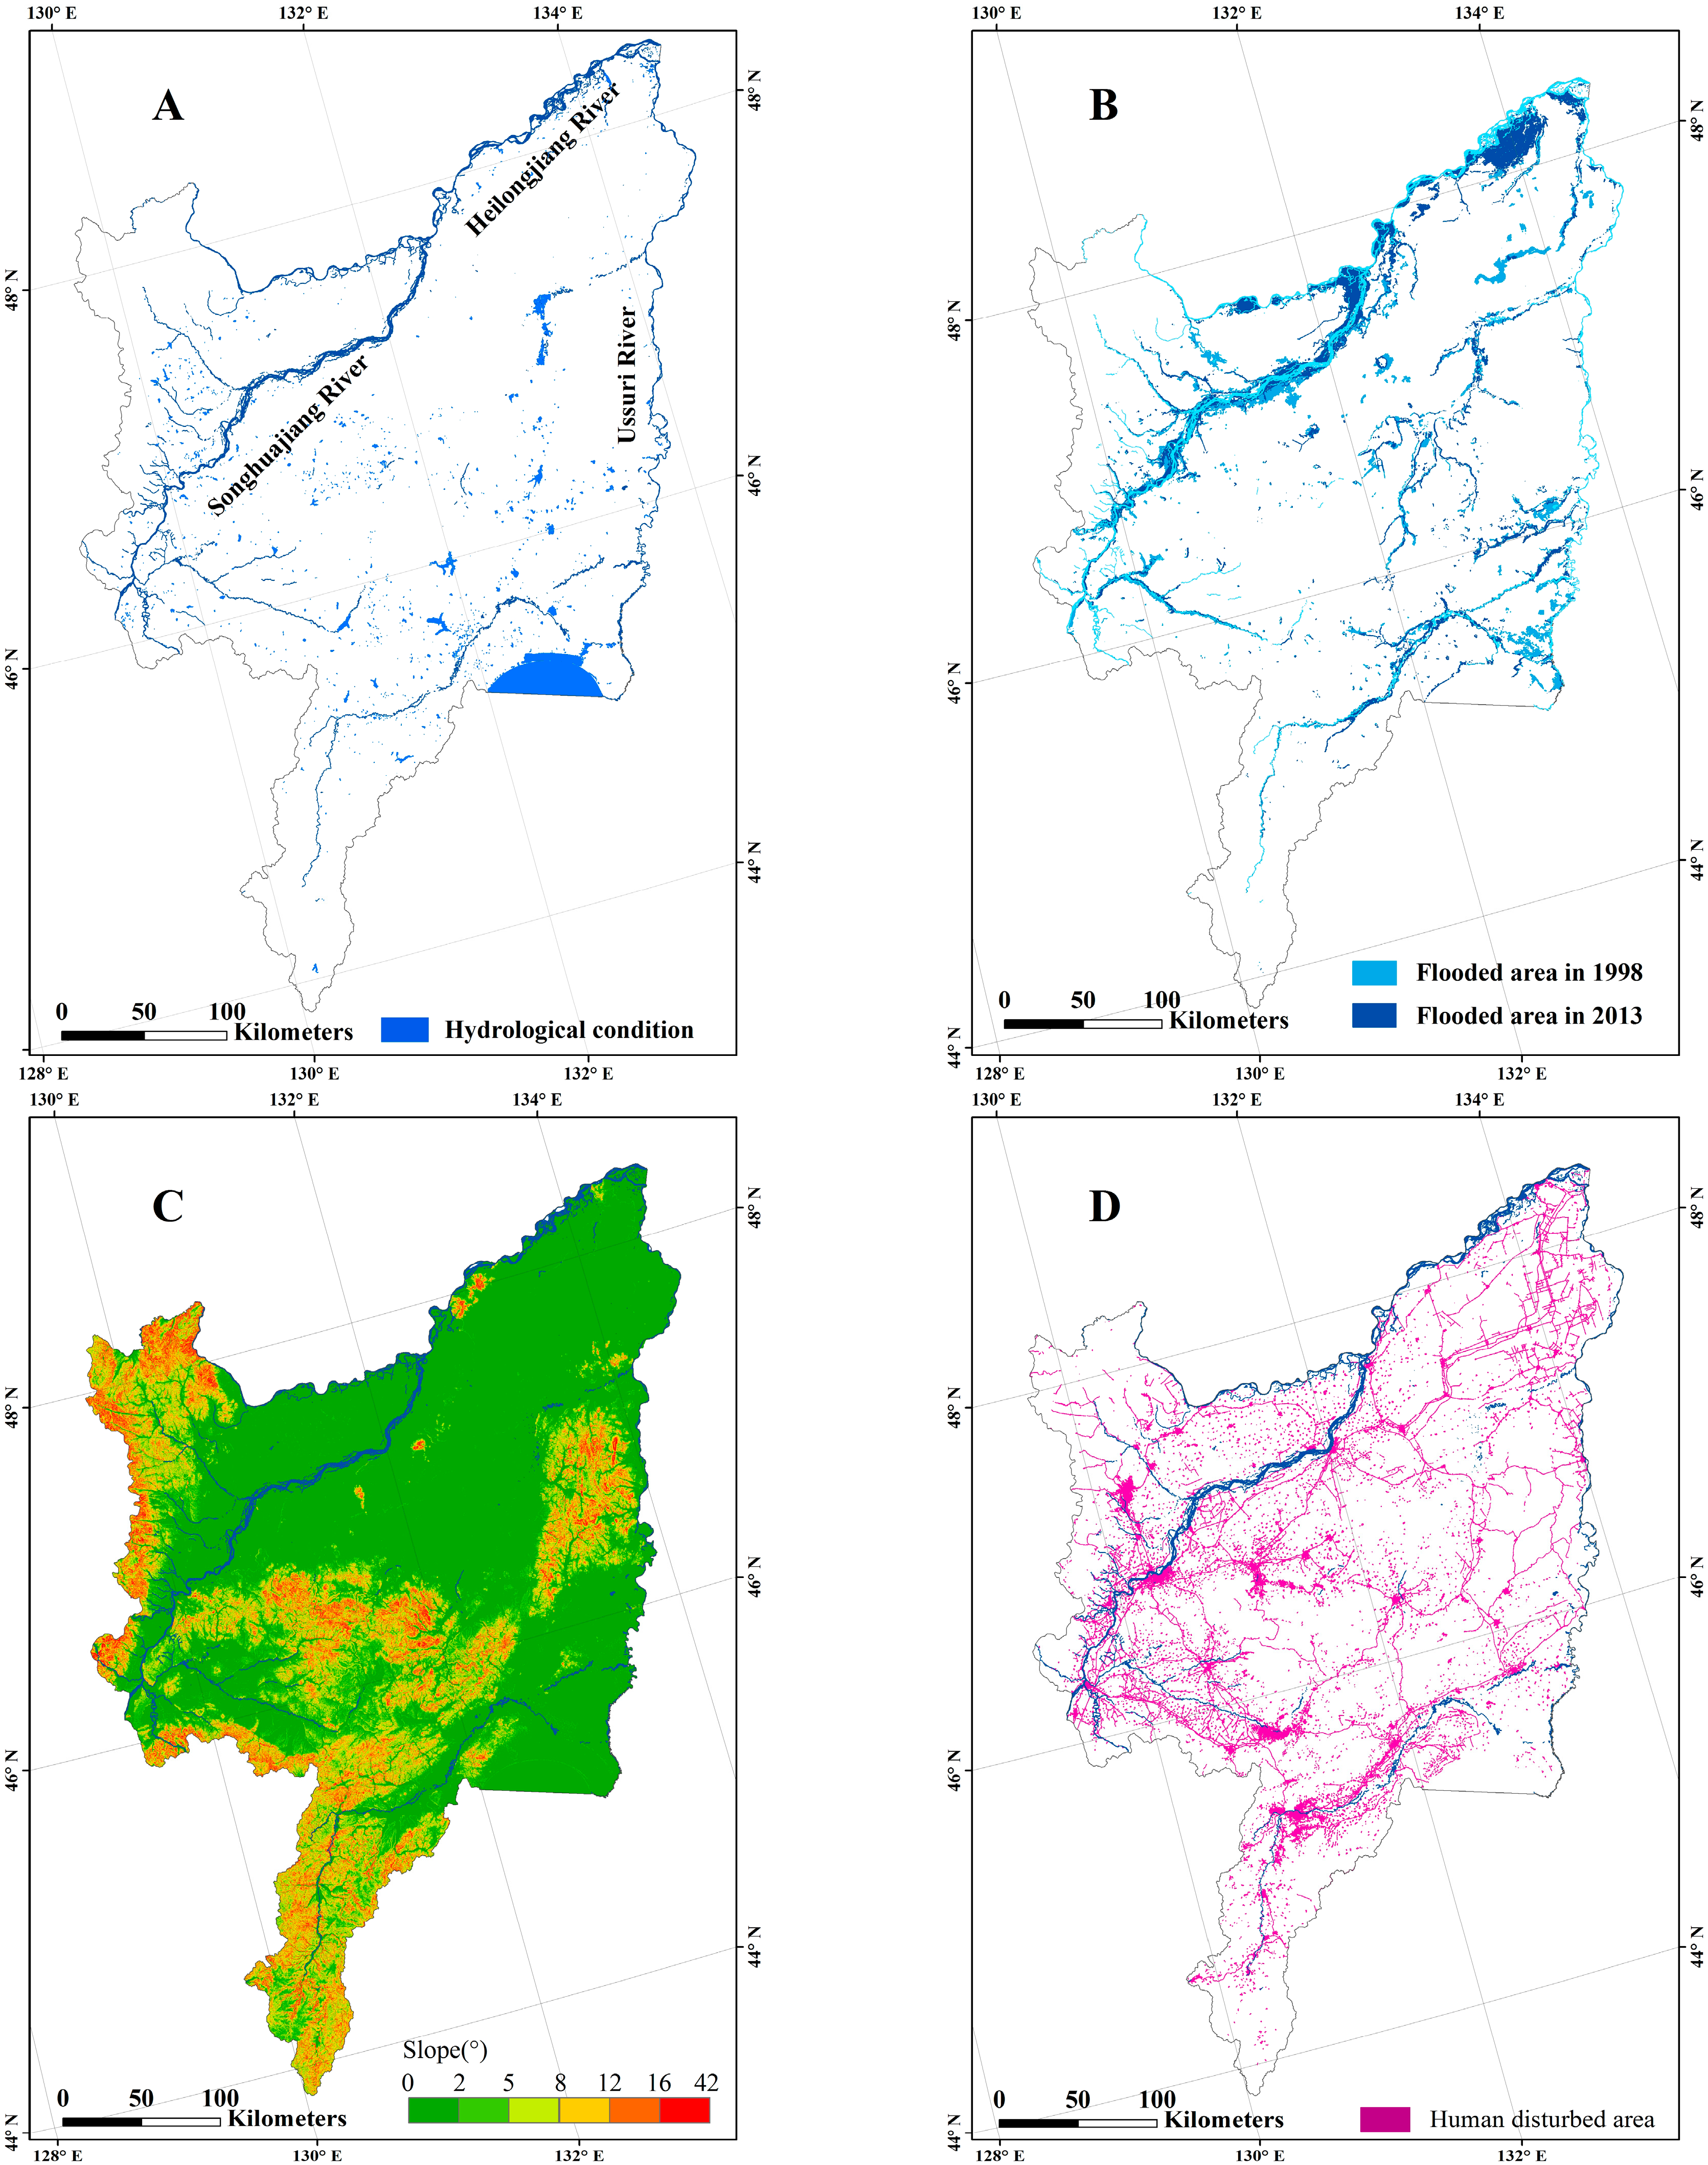
Our analysis indicated extensive waterbodies ensured good hydrological conditions (Figure 5A) in the SJP. In 2018, the overlay analysis between a 300-m buffer zone layer of waterbody and a cropland distribution layer revealed that 2283 km2 of croplands were in good hydrological condition and thus were potentially suitable for wetland rehabilitation.
Figure 5B plots the spatial distribution of two major flood events determined by Landsat observations. They submerged large areas of the SJP and covered an area of 3367 km2 (in 1998) and 2950 km2 (in 2013) of croplands.
As shown in Figure 5C, the terrain of the SJP is generally flat, with a small range of slope variations in the south-central and western regions. According to Figure 5D, we identified the distribution of anthropogenic threats in the SJP, since human activity has an obvious negative effect on the rehabilitation of wetlands. Therefore, the croplands (10,987 km2) with a slope steeper than 5° (26,730 km2) and adjacent to anthropogenic threat sources were excluded from the potential wetland rehabilitation areas.
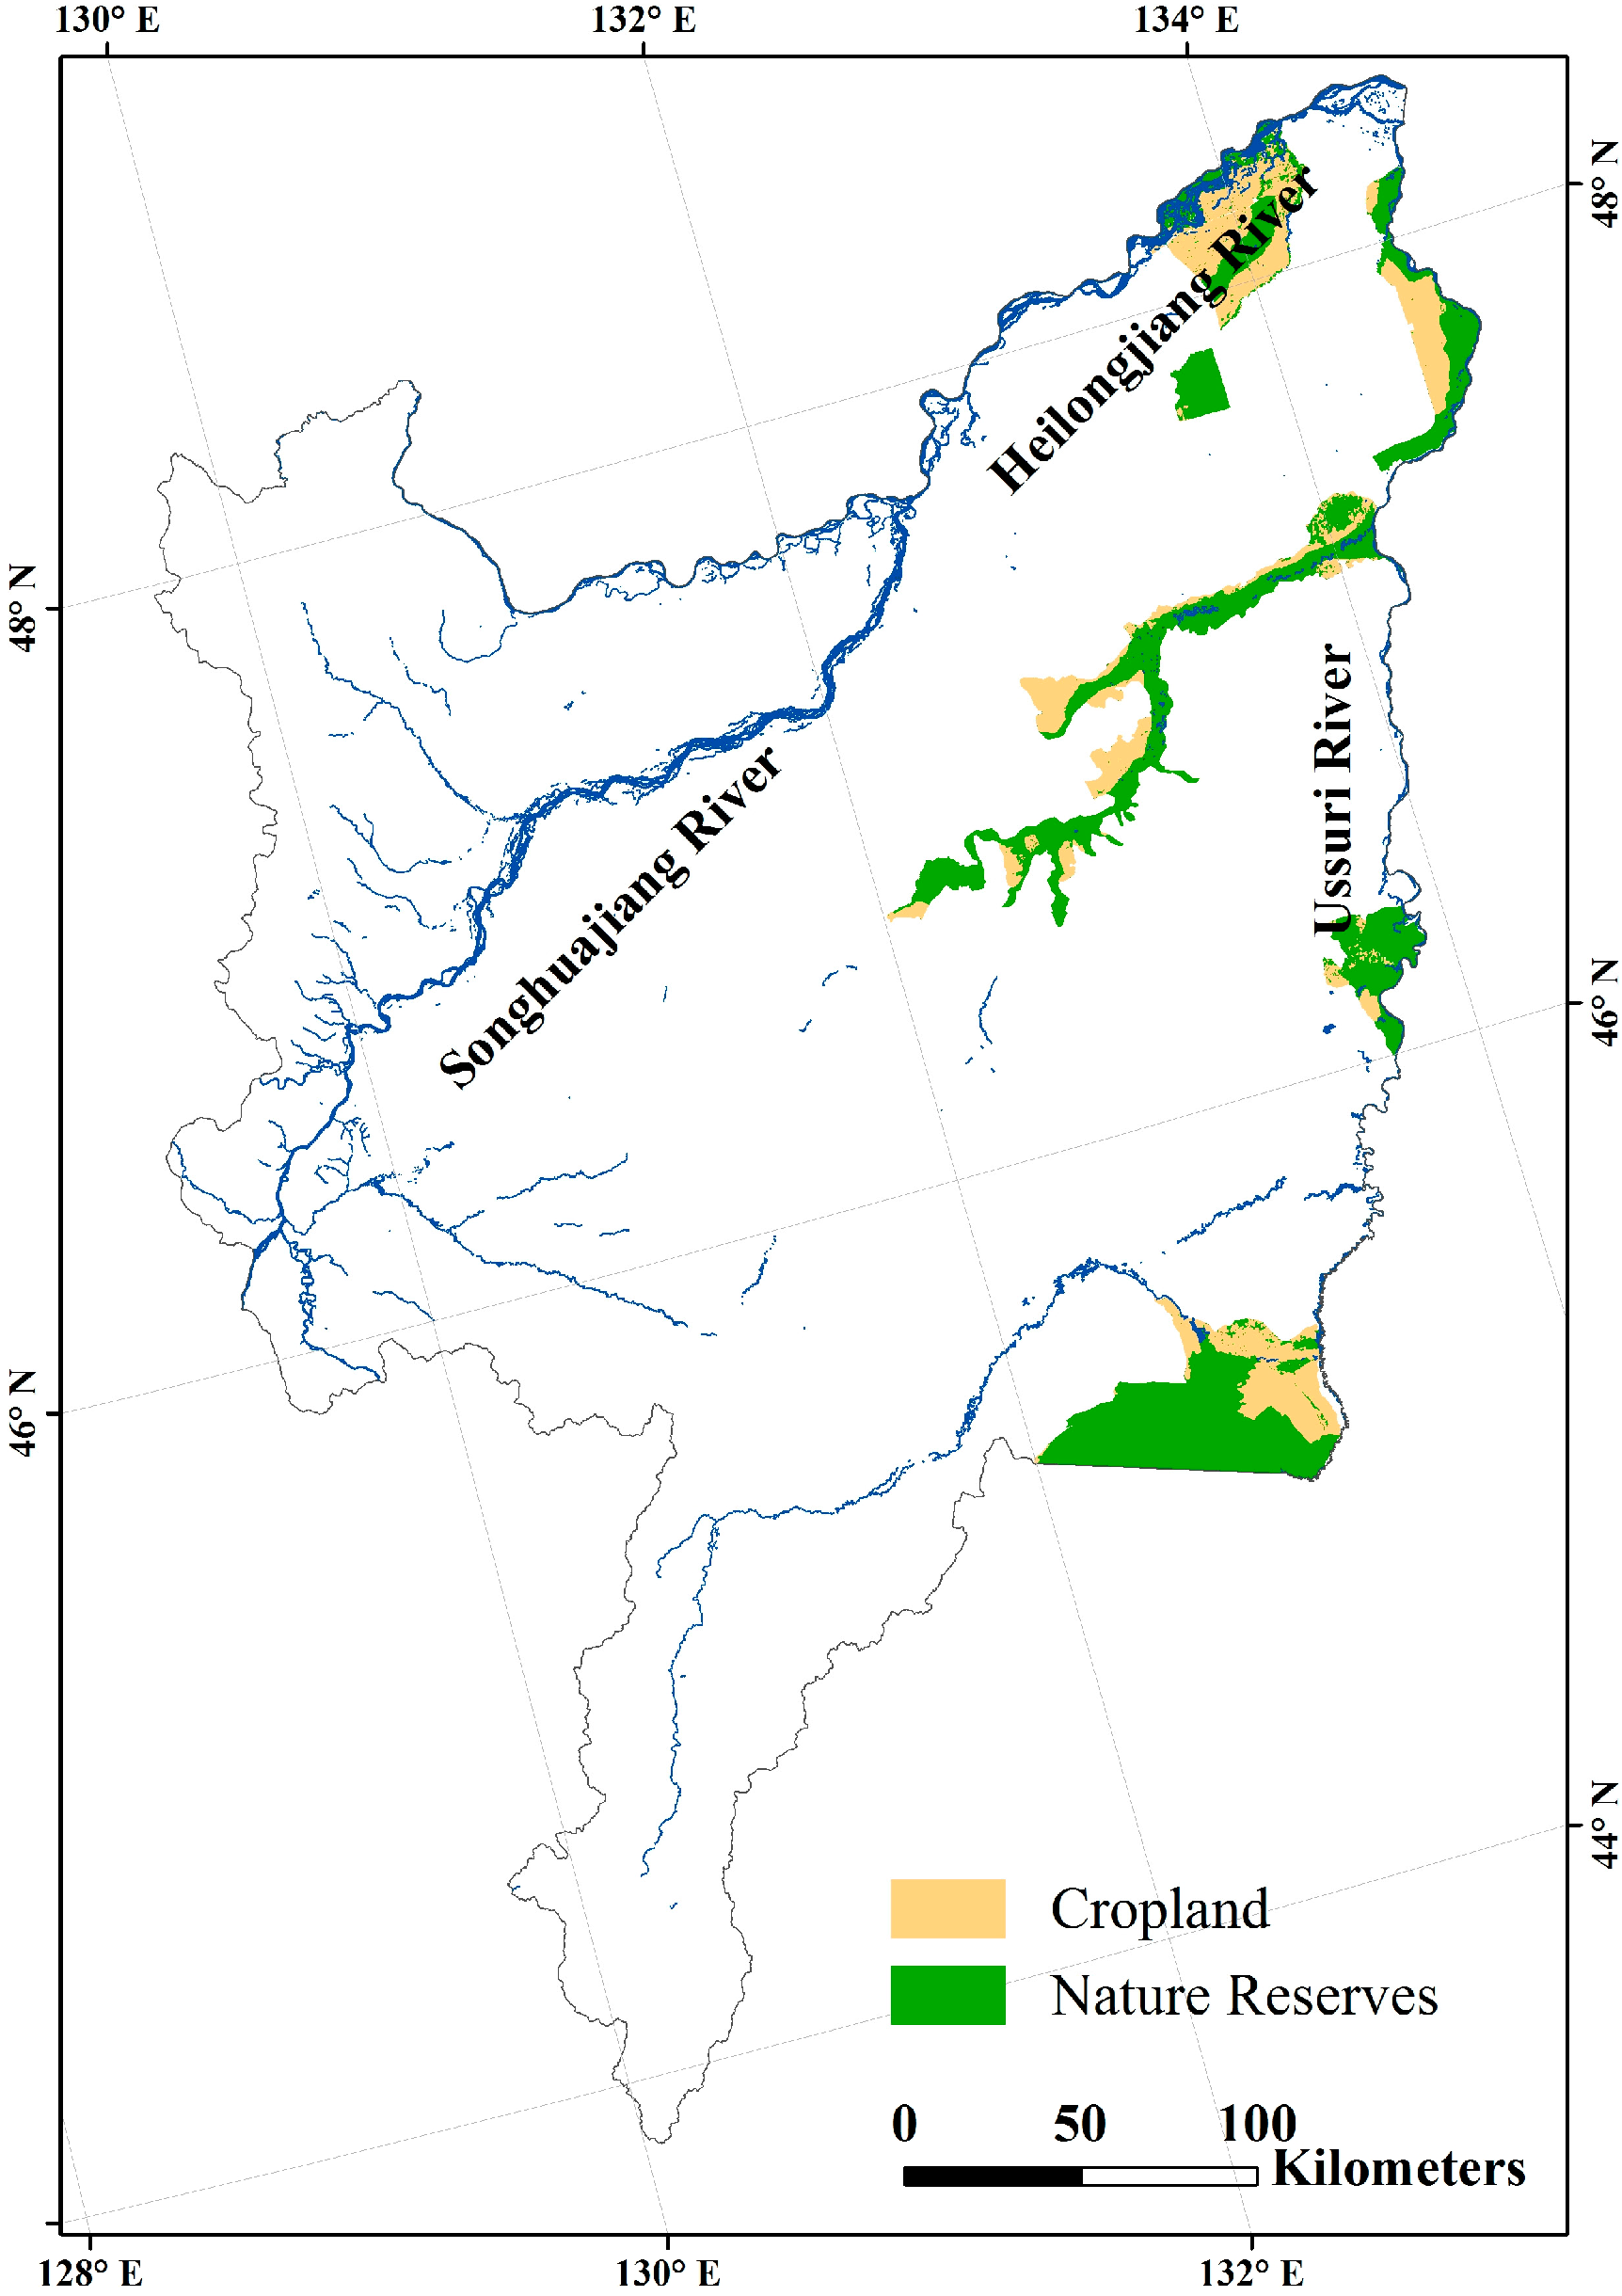
As illustrated in Figure 6 and Table 3, many farming activities were still occurring in the WNNR that should be banned. Specifically, the SJWNNR had the largest cropland area, accounting for 62% (1192 km2) of its whole reserve area. The HHWNNR had the least amount of cropland, representing only 3% (6 km2) of this reserve’s area.

3.4. Pattern of Potential Wetland Rehabilitation Areas

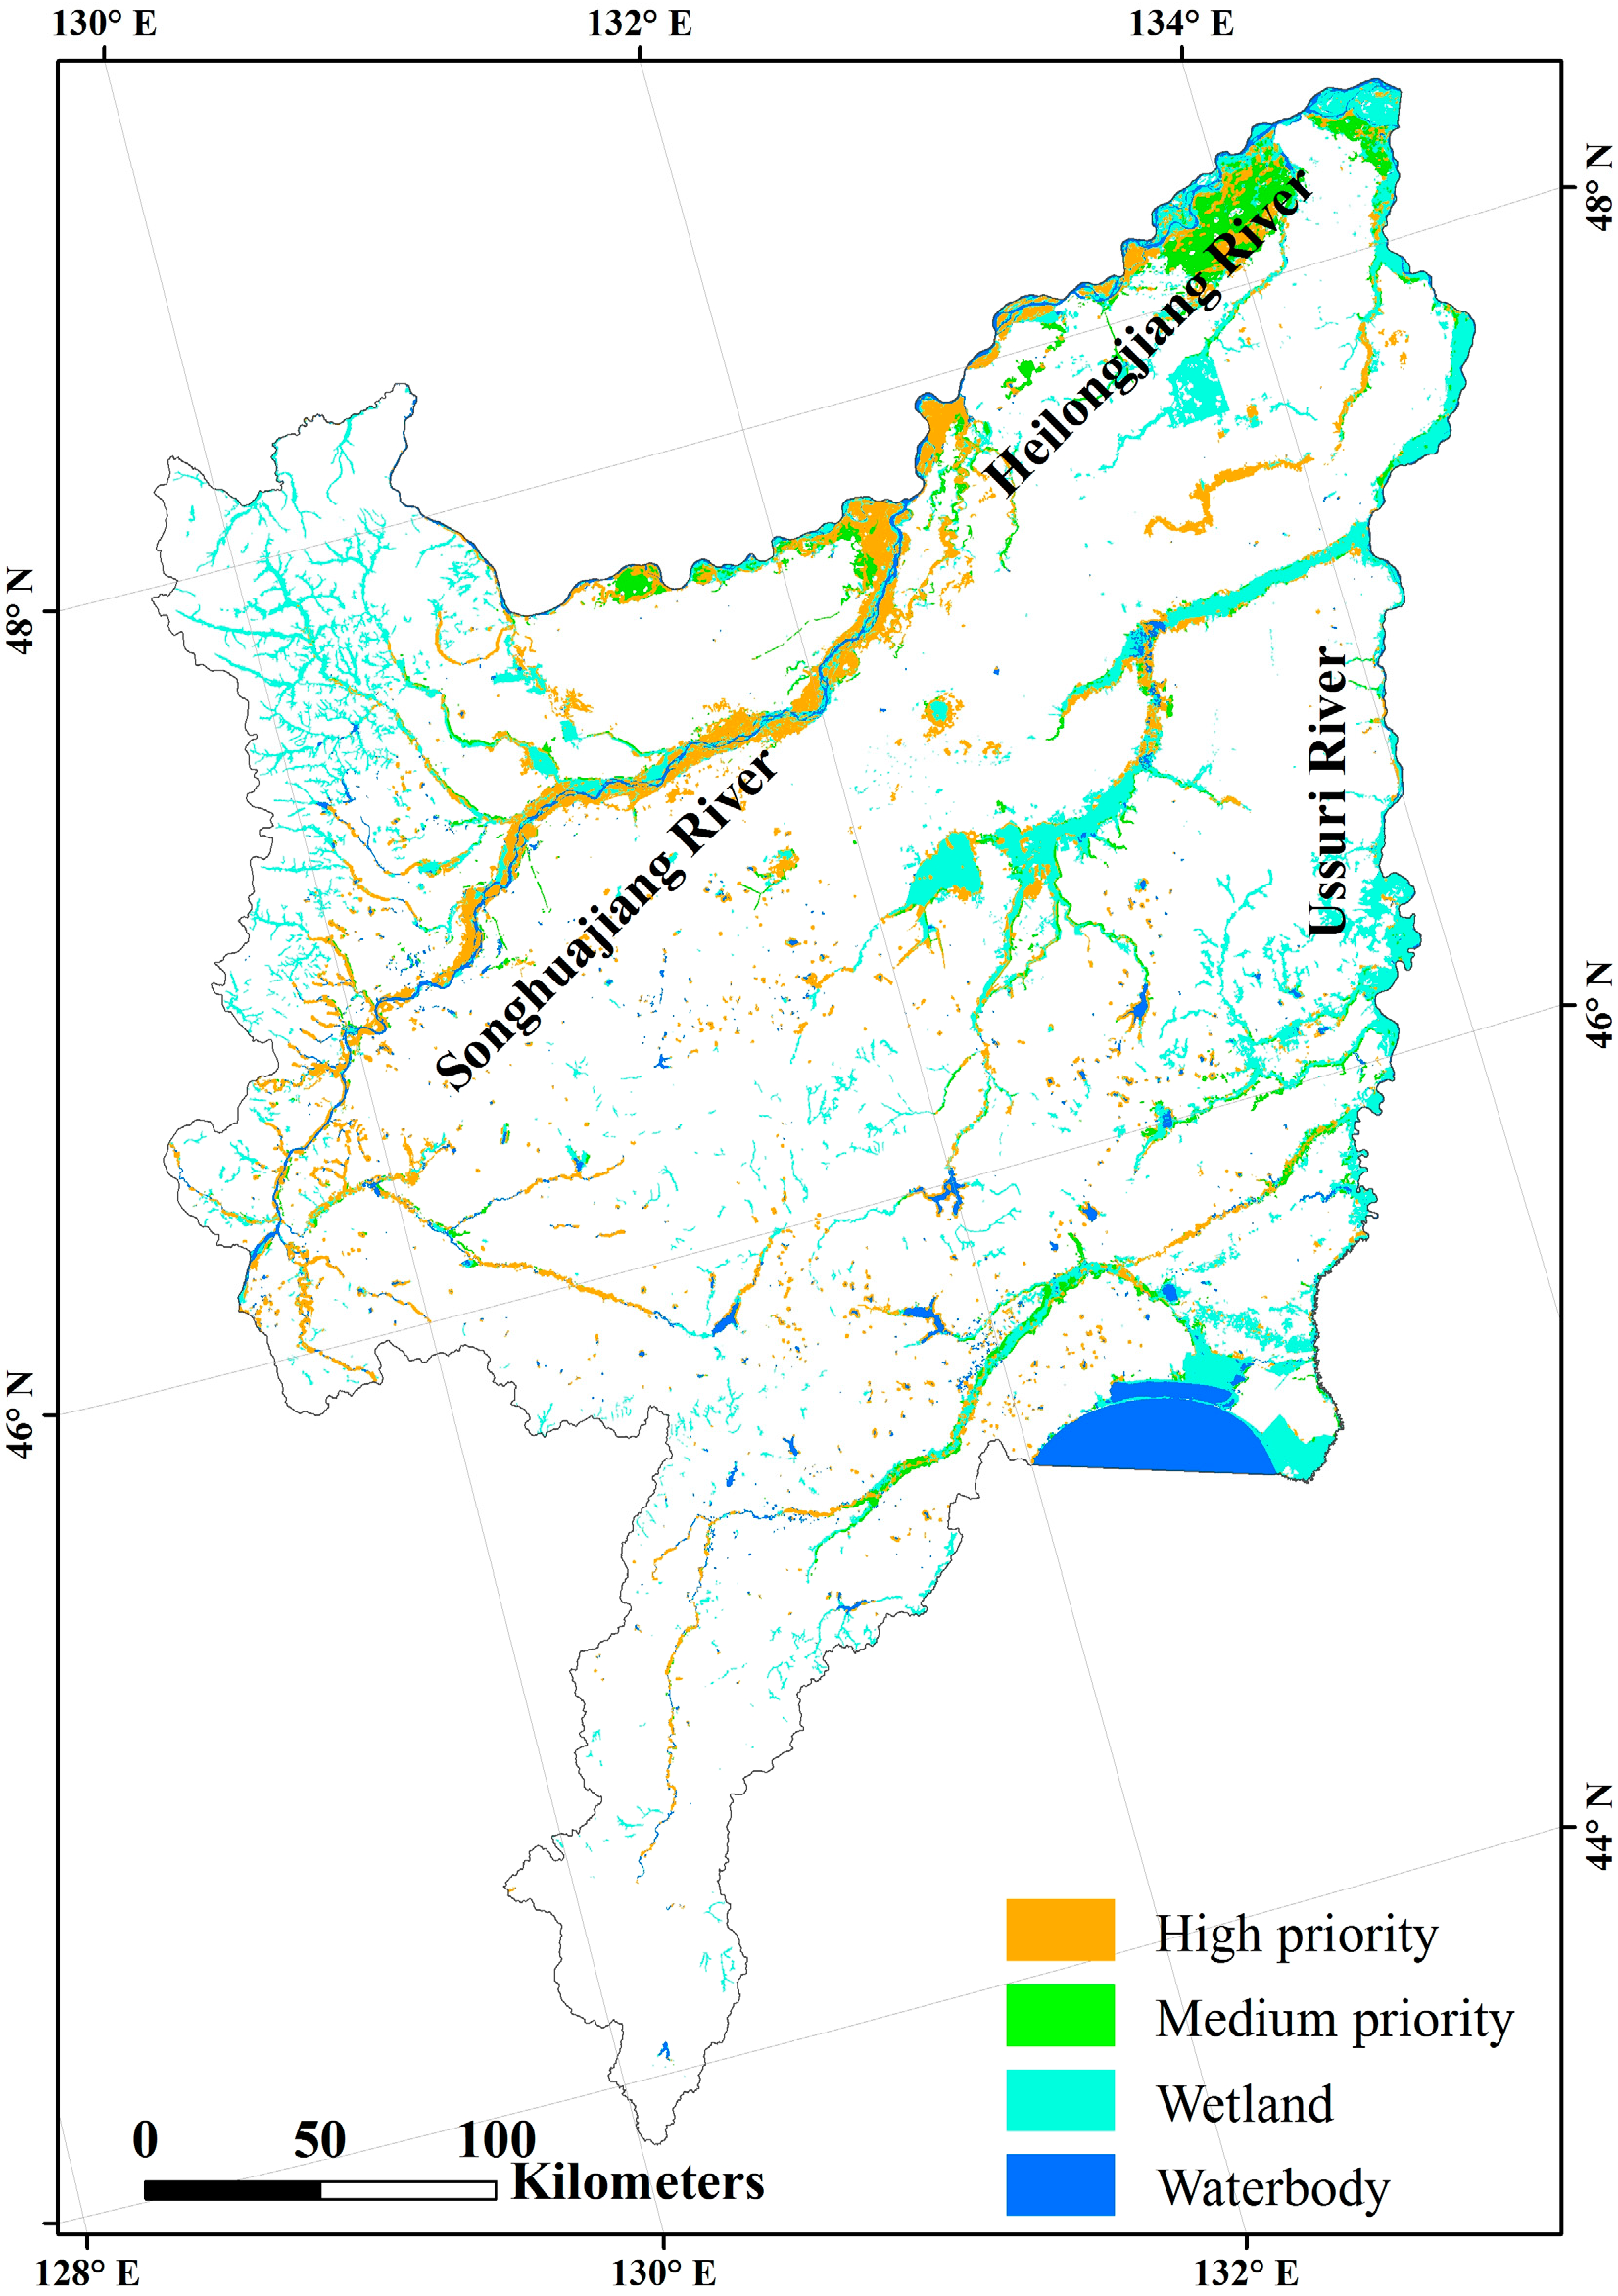
The spatial distribution of potential wetland rehabilitation areas with different priorities is presented in Figure 7. High priority potential areas for wetland rehabilitation are dominantly observed along the Songhuajiang and Ussuri rivers, as well as their tributaries, while those of medium priority are dominantly distributed along the Heilongjiang River and concentrated in the northeastern part of the study area.
Table 4 reports the areas of different wetland rehabilitation priorities from different cropland types. According to our estimates, a total of 5415 km2 of croplands are suitable for rehabilitating into wetlands. Among which, 4193 km2 (77%) have high rehabilitation priority and 1222 km2 (23%) have medium rehabilitation priority. We determined that 3419 km2 of dry farmland could be rehabilitated into wetland. Among which, 74% (2547 km2) have high priority and the rest (26%; 872 km2) have a medium priority. Moreover, 1996 km2 of paddy fields were found to be suitable for wetland rehabilitation. Most of the paddy fields (82%; 1646 km2) have medium rehabilitation priority, while just 18% (350 km2) have high rehabilitation priority.

4. Discussion

Over the past few decades, a series of ecological problems were attributed to extensive loss and degradation of wetlands predominantly caused by agricultural activities in China [36,37,38]. To respond to this shrinkage and degradation of wetlands and declining ecological benefits, China had set a lofty goal of rehabilitating more natural wetlands. Given this background, knowing where priority wetlands could be rehabilitated from cropland is essential.
Many researchers have investigated potential areas for wetland rehabilitation. For instance, Russell et al. [11] used basin topography to forecast the potential for wetland rehabilitation in the basin of the San Luis Rey River in southern California. Meng et al. [39] highlighted the optimization of hydrological communication patterns to rehabilitate the degraded wetlands. However, these studies considered the rehabilitation potential from only a single dimension, that of hydrological condition. Our view is that a single indicator is insufficient to fully determine the optimal potential area of wetland rehabilitation. Rebelo et al. [40] combined ecological and hydrological factors to suggest measures for rehabilitating the valley-bottom wetlands based on land cover changes in the Kromme Basin in South Africa. Huang et al. [13] identified areas with low cropland productivity and moderate or high humidity as potential areas for converting cropland to wetland in the SJP. However, both studies overlooked anthropogenic threats and management policies. We believe that built-up land could be used to characterize anthropogenic threats and, thus, more precisely identify potentially practical areas for wetland rehabilitation. The viability of the seed bank in the soil is also critical for determining potential wetland rehabilitation areas. Until now, protection levels have not been highlighted for wetland rehabilitation. Thus, the comprehensive indicator system composed of multiple indicators taking hydrological and terrain conditions, policy and management, and anthropogenic threats into consideration has been the novelty of this study.
Multisource geospatial data have supported numerous studies including wetland ecosystem management and identifying potential rehabilitation wetlands. For instance, many researchers have demonstrated that conversions between cropland and wetland can be detected from satellite images [17,41]. As an important data source, Landsat can provide historical and real-time data to help assess the potential for wetland rehabilitation by detecting changes in land cover [42], determining flood level and anthropogenic threats. GIS provides analysis tools for a variety of spatial analysis, such as buffer and overlay analyses. Therefore, in this study, we identified conversion between croplands and wetlands, flooded areas, and anthropogenic threats over the SJP in the period of 1990–2018 from Landsat images. Then, GIS allowed us to perform data analysis to map the potential wetland rehabilitation areas.
According to global statistics, wetland area has declined drastically in the past few decades [3]. In China, although the area of wetland rehabilitation reached at 1369 km2 from 1990 to 2010, the total wetland area in China has declined by 15,765 km2, 12 times that of the rehabilitation area [17]. Therefore, we recommend an application of RS and GIS to determine the spatial distribution of croplands available for wetland rehabilitation across the country. The comprehensive analysis method used in this study can provide an example for how to achieve this recognition, because the data we used are also available on a global scale.
Protecting and rehabilitating wetlands are important components of the SDGs. Our observations show that there are 4193 km2 of croplands suitable for the performing of high priority wetland rehabilitation, while another 1222 km2 are of medium priority. Therefore, the map of wetland rehabilitation potential areas can support achieving sustainable development in the SJP. But we must argue that converting cropland to wetland requires explicit consideration of other factors, such as land ownership, labor costs, and so on. Our focus is only on wetland rehabilitation to improve wetland and biodiversity conservation. Policy and management were also taken into consideration in establishing the indicator system. However, in the process of converting cropland to wetland, we need to pay attention also to grain production [43]. Reasonable wetland rehabilitation should not only help solve the ecological problems of vanishing wetlands but also prevent further encroachment from cropland expansion and reduce the pressure of agricultural demand on water resources.

5. Conclusions

Combining multisource geospatial data and GIS analysis, we were able to prioritize wetland rehabilitation areas. This study performed an investigation by integrating five indicators, including hydrological condition, topographical characteristics, anthropogenic threats, cultivation history, and wetland protection level, to identify the potential wetland rehabilitation areas with different priorities. Results show that, from 1990 to 2018, a total of 11,643 km2 of wetlands were occupied by cropland expansion for grain production. It was estimated that 5415 km2 of croplands could be considered as potential areas for wetland rehabilitation. Among which, 4193 km2 (77%) were of high rehabilitation priority. Specifically, 63% of the potential areas available for wetland rehabilitation were from dry croplands (3419 km2), and the rest (37%) were from paddy fields. Our research also demonstrates that the integration of multisource geospatial data provides a highly efficient and timesaving approach for detecting potential areas for wetland rehabilitation. The comprehensive mapping of potential wetland rehabilitation areas produced here is useful for decision makers, as a guide for implementing a wetland rehabilitation project for the SJP.

Author Contributions

Conceptualization, D.M. and L.L.; methodology, L.L. and Z.Q.; software, Z.Q.; validation, B.D. and K.F.; formal analysis, Z.Q.; investigation, D.M.; resources, D.M.; data curation, D.M. and Z.Q.; writing—original draft preparation, Z.Q.; writing—review and editing, D.M.; visualization, Z.Q.; supervision, Z.W. and M.J.; project administration, D.M.; funding acquisition, D.M. All authors have read and agreed to the published version of the manuscript.

Funding

This research was jointly supported by the National Key R&D Program of China (2016YFC0500408, 2019YFA0607100, and 2016YFC0500201), the National Natural Science Foundation of China (41771383), the Science and Technology Development Program of Jilin Province (20200301014RQ), and the funding from Youth Innovation Promotion Association of Chinese Academy of Sciences (2017277) and the National Earth System Science Data Center (www.geodata.cn).

Acknowledgments

We are very grateful to the facility that make Landsat images accessible through the USGS and those who participated in the image classification and field investigation to produce the land cover. We also thank the anonymous reviewers for the constructive comments on our manuscript.

Conflicts of Interest

The authors declare no conflict of interest.

References

  1. Millennium Ecosystem Assessment (MEA). Ecosystems and Human Well-Being: Wetlands and Water Synthesis; World Resources Institute: Washington, DC, USA, 2005. [Google Scholar]
  2. Wang, Z.; Wu, J.; Madden, M.; Mao, D. China’s Wetlands: Conservation Plans and Policy Impacts. AMBIO 2012, 41, 782–786. [Google Scholar] [CrossRef] [Green Version]
  3. Liu, R.; Wang, Q.; Wang, Y.; Zhang, L.; Shao, Z. Distribution of mercury in typical wetland plants in the Sanjiang plain. Chin. Geogr. Sci. 2003, 13, 242–246. [Google Scholar] [CrossRef]
  4. Davidson, N.C. How much wetland has the world lost? Long-term and recent trends in global wetland area. Mar. Freshw. Res. 2014, 65, 934. [Google Scholar] [CrossRef]
  5. Mao, D.; Wang, Z.; Wu, J.; Wu, B.; Zeng, Y.; Song, K.; Yi, K.; Luo, L. China’s wetlands loss to urban expansion. Land Degrad. Dev. 2018, 29, 2644–2657. [Google Scholar] [CrossRef]
  6. Cong, P.; Chen, K.; Qu, L.; Han, J. Dynamic Changes in the Wetland Landscape Pattern of the Yellow River Delta from 1976 to 2016 Based on Satellite Data. Chin. Geogr. Sci. 2019, 29, 372–381. [Google Scholar] [CrossRef] [Green Version]
  7. Kumari, R.; Shukla, S.K.; Parmar, K.; Bordoloi, N.; Kumar, A.; Saikia, P. Wetlands Conservation and Restoration for Ecosystem Services and Halt Biodiversity Loss: An Indian Perspective. In Restoration of Wetland Ecosystem: A Trajectory Towards a Sustainable Environment; Upadhyay, A.K., Singh, R., Singh, D.P., Eds.; Springer: Singapore, 2020; pp. 75–85. ISBN 9789811376641. [Google Scholar]
  8. Man, W.; Yu, H.; Li, L.; Liu, M.; Mao, D.; Ren, C.; Wang, Z.; Jia, M.; Miao, Z.; Lu, C.; et al. Spatial Expansion and Soil Organic Carbon Storage Changes of Croplands in the Sanjiang Plain, China. Sustainability 2017, 9, 563. [Google Scholar] [CrossRef] [Green Version]
  9. Saunders, M.J.; Kansiime, F.; Jones, M.B. Agricultural encroachment: Implications for carbon sequestration in tropical African wetlands. Glob. Chang. Biol. 2012, 18, 1312–1321. [Google Scholar] [CrossRef]
  10. Maleki, S.; Soffianian, A.R.; Koupaei, S.S.; Pourmanafi, S.; Saatchi, S. Wetland restoration prioritizing, a tool to reduce negative effects of drought; An application of multicriteria-spatial decision support system (MC-SDSS). Ecol. Eng. 2018, 112, 132–139. [Google Scholar] [CrossRef]
  11. Russell, G.D.; Hawkins, C.P.; O’Neill, M.P. The Role of GIS in Selecting Sites for Riparian Restoration Based on Hydrology and Land Use. Restor. Ecol. 1997, 5, 56–68. [Google Scholar] [CrossRef]
  12. Acreman, M.C.; Fisher, J.; Stratford, C.J.; Mould, D.J.; Mountford, J.O. Hydrological science and wetland restoration: Some case studies from Europe. Hydrol. Earth Syst. Sci. 2007, 11, 158–169. [Google Scholar] [CrossRef] [Green Version]
  13. Huang, N.; Wang, Z.; Liu, D.; Niu, Z. Selecting Sites for Converting Farmlands to Wetlands in the Sanjiang Plain, Northeast China, Based on Remote Sensing and GIS. Environ. Manag. 2010, 46, 790–800. [Google Scholar] [CrossRef] [PubMed]
  14. Guan, B.; Chen, M.; Elsey-Quirk, T.; Yang, S.; Shang, W.; Li, Y.; Tian, X.; Han, G. Soil seed bank and vegetation differences following channel diversion in the Yellow River Delta. Sci. Total Environ. 2019, 693, 133600. [Google Scholar] [CrossRef] [PubMed]
  15. Pakeman, R.J.; Small, J.L. The role of the seed bank, seed rain and the timing of disturbance in gap regeneration. J. Veg. Sci. 2005, 16, 121–130. [Google Scholar] [CrossRef]
  16. Van Asselen, S.; Verburg, P.H.; Vermaat, J.E.; Janse, J.H. Drivers of Wetland Conversion: A Global Meta-Analysis. PLoS ONE 2013, 8, e81292. [Google Scholar] [CrossRef] [Green Version]
  17. Mao, D.; Luo, L.; Wang, Z.; Wilson, M.C.; Zeng, Y.; Wu, B.; Wu, J. Conversions between natural wetlands and farmland in China: A multiscale geospatial analysis. Sci. Total Environ. 2018, 634, 550–560. [Google Scholar] [CrossRef]
  18. Klemas, V. Remote Sensing of Wetlands: Case Studies Comparing Practical Techniques. J. Coast. Res. 2011, 27, 418. [Google Scholar]
  19. Adam, E.; Mutanga, O.; Rugege, D. Multispectral and hyperspectral remote sensing for identification and mapping of wetland vegetation: A review. Wetl. Ecol. Manag. 2010, 18, 281–296. [Google Scholar] [CrossRef]
  20. Xiang, H.; Wang, Z.; Mao, D.; Zhang, J.; Xi, Y.; Du, B.; Zhang, B. What did China’s National Wetland Conservation Program Achieve? Observations of changes in land cover and ecosystem services in the Sanjiang Plain. J. Environ. Manag. 2020, 267, 110623. [Google Scholar] [CrossRef]
  21. Mao, D.; He, X.; Wang, Z.; Tian, Y.; Xiang, H.; Yu, H.; Man, W.; Jia, M.; Ren, C.; Zheng, H. Diverse policies leading to contrasting impacts on land cover and ecosystem services in Northeast China. J. Clean. Prod. 2019, 240, 117961. [Google Scholar] [CrossRef]
  22. Song, K.; Wang, Z.; Du, J.; Liu, L.; Zeng, L.; Ren, C. Wetland Degradation: Its Driving Forces and Environmental Impacts in the Sanjiang Plain, China. Environ. Manag. 2014, 54, 255–271. [Google Scholar] [CrossRef]
  23. Wang, Z.; Mao, D.; Li, L.; Jia, M.; Dong, Z.; Miao, Z.; Ren, C.; Song, C. Quantifying changes in multiple ecosystem services during 1992–2012 in the Sanjiang Plain of China. Sci. Total Environ. 2015, 514, 119–130. [Google Scholar] [CrossRef] [PubMed]
  24. Mao, D.; Wang, Z.; Du, B.; Li, L.; Tian, Y.; Jia, M.; Zeng, Y.; Song, K.; Jiang, M.; Wang, Y. National wetland mapping in China: A new product resulting from object-based and hierarchical classification of Landsat 8 OLI images. ISPRS J. Photogramm. Remote Sens. 2020, 164, 11–25. [Google Scholar] [CrossRef]
  25. Du, B.; Zheng, Y.; Liu, J.; Mao, D. Threatened Plants in China’s Sanjiang Plain: Hotspot Distributions and Gap Analysis. Sustainability 2018, 10, 194. [Google Scholar] [CrossRef] [Green Version]
  26. Zhang, L.; Li, X.; Yuan, Q.; Liu, Y. Object-based approach to national land cover mapping using HJ satellite imagery. J. Appl. Remote Sens. 2014, 8, 083686. [Google Scholar] [CrossRef]
  27. Stroh, P.A.; Hughes, F.M.R.; Sparks, T.H.; Mountford, J.O. The Influence of Time on the Soil Seed Bank and Vegetation across a Landscape-Scale Wetland Restoration Project. Restor. Ecol. 2012, 20, 103–112. [Google Scholar] [CrossRef]
  28. Wang, G.; Wang, M.; Lu, X.; Jiang, M. Effects of farming on the soil seed banks and wetland restoration potential in Sanjiang Plain, Northeastern China. Ecol. Eng. 2015, 77, 265–274. [Google Scholar] [CrossRef]
  29. Dekker, S.C.; Barendregt, A.; Bootsma, M.C.; Schot, P.P. Modelling hydrological management for the restoration of acidified floating fens. Hydrol. Process. 2005, 19, 3973–3984. [Google Scholar] [CrossRef] [Green Version]
  30. Hua, Y.; Cui, B.; He, W.; Cai, Y. Identifying potential restoration areas of freshwater wetlands in a river delta. Ecol. Indic. 2016, 71, 438–448. [Google Scholar] [CrossRef] [Green Version]
  31. Diefenderfer, H.L.; Sinks, I.A.; Zimmerman, S.A.; Cullinan, V.I.; Borde, A.B. Designing topographic heterogeneity for tidal wetland restoration. Ecol. Eng. 2018, 123, 212–225. [Google Scholar] [CrossRef]
  32. Murray, N.J.; Clemens, R.S.; Phinn, S.R.; Possingham, H.P.; Fuller, R.A. Tracking the rapid loss of tidal wetlands in the Yellow Sea. Front. Ecol. Environ. 2014, 12, 267–272. [Google Scholar] [CrossRef] [Green Version]
  33. Li, Z.; Zhang, Z.; Xue, Z.; Song, X.; Zhang, H.; Wu, H.; Jiang, M.; Lyu, X. Molecular Fingerprints of Soil Organic Matter in a Typical Freshwater Wetland in Northeast China. Chin. Geogr. Sci. 2019, 29, 700–708. [Google Scholar] [CrossRef] [Green Version]
  34. Yan, F.; Zhang, S. Ecosystem service decline in response to wetland loss in the Sanjiang Plain, Northeast China. Ecol. Eng. 2019, 130, 117–121. [Google Scholar] [CrossRef]
  35. Zheng, X.; Fu, J.; Ramamonjisoa, N.; Zhu, W.; He, C.; Lu, C. Relationship between Wetland Plant Communities and Environmental Factors in the Tumen River Basin in Northeast China. Sustainability 2019, 11, 1559. [Google Scholar] [CrossRef] [Green Version]
  36. Wang, G.-P.; Zhai, Z.-L.; Liu, J.-S.; Wang, J.-D. Forms and profile distribution of soil phosphorus in four wetlands across gradients of sand desertification in Northeast China. Geoderma 2008, 145, 50–59. [Google Scholar] [CrossRef]
  37. Cyranoski, D. Putting China’s wetlands on the map. Nature 2009, 458, 134. [Google Scholar] [CrossRef] [PubMed]
  38. Niu, Z.; Gong, P.; Cheng, X.; Guo, J.; Wang, L.; Huang, H.; Shen, S.; Wu, Y.; Wang, X.; Wang, X.; et al. Geographical characteristics of China’s wetlands derived from remotely sensed data. Sci. China Ser. D-Earth Sci. 2009, 52, 723–738. [Google Scholar] [CrossRef]
  39. Meng, B.; Liu, J.; Bao, K.; Sun, B. Methodologies and management framework for restoration of wetland hydrologic connectivity: A synthesis. Integr. Environ. Assess. Manag. 2020, 16, 438–451. [Google Scholar] [CrossRef]
  40. Rebelo, A.J.; Le Maitre, D.C.; Esler, K.J.; Cowling, R.M. Hydrological responses of a valley-bottom wetland to land-use/land-cover change in a South African catchment: Making a case for wetland restoration: Wetland hydrological response to land-cover change. Restor. Ecol. 2015, 23, 829–841. [Google Scholar] [CrossRef]
  41. Wang, Z.; Huang, N.; Luo, L.; Li, X.; Ren, C.; Song, K.; Chen, J.M. Shrinkage and fragmentation of marshes in the West Songnen Plain, China, from 1954 to 2008 and its possible causes. Int. J. Appl. Earth Obs. Geoinf. 2011, 13, 477–486. [Google Scholar] [CrossRef]
  42. Jia, M.; Wang, Z.; Wang, C.; Mao, D.; Zhang, Y. A New Vegetation Index to Detect Periodically Submerged Mangrove Forest Using Single-Tide Sentinel-2 Imagery. Remote Sens. 2019, 11, 2043. [Google Scholar] [CrossRef] [Green Version]
  43. Doran, J.W.; Kirschenmann, F.; Magdoff, F. Balancing food, environmental and resource needs. Renew. Agric. Food Syst. 2007, 22, 77–79. [Google Scholar] [CrossRef] [Green Version]
Figure 1. Terrain variation and the distribution of eight Wetland National Nature Reserves (WNNR) in the Sanjiang Plain.
Water 12 02496 g001
Figure 2. Framework for identifying potential wetland rehabilitation areas.
Water 12 02496 g002
Figure 3. Spatial patterns of various land cover types in 2018 across the SJP.
Water 12 02496 g003
Figure 4. Distribution of wetlands lost to croplands in the SJP during different periods.
Water 12 02496 g004
Figure 5. Spatial patterns of wetland rehabilitation indicators: (A) hydrological conditions in 2018; (B) the flooded areas in 1998 and 2013; (C) topographic slope; and (D) anthropogenic threats in 2018.
Water 12 02496 g005
Figure 6. Cropland distribution in Wetland National Nature Reserves in the Sanjiang Plain.
Water 12 02496 g006
Figure 7. Spatial pattern of potential areas for wetland rehabilitation from croplands in the SJP.
Water 12 02496 g007
Table 1. Summary for the selected five indicators for rehabilitating cropland to wetland.
IndicatorConstraint ConditionThreshold for Prioritizing
Wetlands encroached
by agricultural cultivation
Cultivation history shorter than 10 yearsHigh: cultivation history in 2008–2018
Medium: cultivation history in 1990–2008
Hydrological conditionOpen waterbody;
flooded area
High: waterbody in 2018 with 300-m buffer, flooded in 1998
Medium: flooded in 2013
Topographical characteristicsSlope > 5°, exclude;
Slope ≤ 5°, retain
Filter indicator for generated dataset layer
Anthropogenic disturbanceBuilt-up land Filter indicator for generated dataset layer
Ecological conservationCropland in WNNRsHigh: cropland in core and buffer zone
Medium: cropland in experimental zone
Table 2. Losses of wetlands to croplands in the SJP during different time periods.
Wetlands Lost to Cropland Expansion1990–20002000–20082008–20132013–2018
Area (km2)738423127191228
Contribution of cropland expansion to wetland loss (%)93826580
Table 3. Cropland areas in the eight Wetland National Nature Reserves (WNNR) in the SJP.
Reserve NameCore ZoneBuffer ZoneExperimental ZoneTotal
(km2)(km2)(km2)(km2)
ZBDWNNR233454111
DFHWNNR810523
BCDWNNR238388
SJWNNR1711358861192
NLHWNNR83302608993
XKHWNNR650630695
QXHWNNR053035
HHWNNR0336
Table 4. Areal statistics of two rehabilitation priorities for wetland rehabilitation from croplands.
Area (km2)HighMediumTotal
Dry farmland25474193872122234195415
Paddy field16463501996