Article

Water Demand Scenarios for Electricity Generation at the Global and Regional Levels

1
Wuppertal Institute for Climate, Environment and Energy, Doeppersberg 19, 42103 Wuppertal, Germany
2
Center for Environmental Systems Research, University of Kassel, Wilhelmshoeher Allee 47, 34109 Kassel, Germany
3
Engineering Hydrology and Water Resources Management, Ruhr-University Bochum, Universitaetsstraße 150, 44801 Bochum, Germany
*
Author to whom correspondence should be addressed.
Water 2020, 12(9), 2482; https://doi.org/10.3390/w12092482
Submission received: 16 July 2020 / Revised: 27 August 2020 / Accepted: 31 August 2020 / Published: 4 September 2020
(This article belongs to the Section Water Resources Management, Policy and Governance)

Abstract

:
Electricity generation requires water. With the global demand for electricity expected to increase significantly in the coming decades, the water demand in the power sector is also expected to rise. However, due to the ongoing global energy transition, the future structure of the power supply—and hence future water demand for power generation—is subject to high levels of uncertainty, because the volume of water required for electricity generation varies significantly depending on both the generation technology and the cooling system. This study shows the implications of ambitious decarbonization strategies for the direct water demand for electricity generation. To this end, water demand scenarios for the electricity sector are developed based on selected global energy scenario studies to systematically analyze the impact up to 2040. The results show that different decarbonization strategies for the electricity sector can lead to a huge variation in water needs. Reducing greenhouse gas emissions (GHG) does not necessarily lead to a reduction in water demand. These findings emphasize the need to take into account not only GHG emission reductions, but also such aspects as water requirements of future energy systems, both at the regional and global levels, in order to achieve a sustainable energy transition.

1. Introduction

Water and energy are essential for sustaining and enhancing economic growth and social development. However, water and energy resources are becoming increasingly scarce and factors such as climate change put additional pressure on their availability [1]. At the same time, the demand for water and energy is increasing due to population growth, economic development, urbanization, and changing consumer habits. Particularly in regions affected by water scarcity, the increasing demand for energy can put additional pressure on water resources and the energy sector itself can be negatively affected by reduced water availability. In light of these challenges, a deeper understanding of the role of water for energy security in both current and potential future energy systems is required.
The energy sector today accounts for about 10% to 15% of the global freshwater withdrawal, and for about 3% of the total water consumption [2,3]. Most water in the energy sector is used for generating electricity (about 88%), especially for cooling processes at thermal power plants, with thermal power plants accounting for about 70% of the today’s global installed power plant capacity [2]. In several countries and regions affected by water stress due to over-exploitation of water resources, climate change, and changing weather patterns, cases of water scarcity with negative impacts on power generation have increased significantly [4]. These kinds of water-related risks have resulted in reduced power generation and even power plant shutdowns around the world, and are expected to further intensify in the future (ibid). As a result, significant economic losses and costs are already evident [5].
At the same time, the demand for electricity is expected to increase significantly due to different factors, such as economic development in emerging and developing economies or growing demand driven by electrification strategies pursued by industrialized countries to decarbonize their economies [6]. While the rising demand for electricity is clear, the future water demand for power generation is less certain. This is because the water intensity of electricity generation varies significantly depending on the energy carrier and electricity generation technology, as well as on the cooling system applied [7] and the future structure of the power supply. The role of different energy sources at the global, regional, and national levels is subject to high uncertainties (e.g., [8]). Adding to these uncertainties is the fact that a large proportion of the today’s global power plant fleet will have to be retired and replaced in the coming decades [9,10]. And even assuming rapid decarbonization of the energy sector, the development of future water demand for electricity generation remains unclear, because different renewable energy and climate protection technologies also have very different water use intensities [11].
With water stress levels increasing worldwide [12], it is critical to analyze how water demand for electricity will develop in the future. This is underlined by IEA [13] as well as Schaeffer et al. [14] who cite changes in water availability as one of the main challenges facing future electricity generation. A number of studies have assessed the future water demand of the energy sector from different perspectives and on different geographical scales. A wide range of analyses exists, for instance, for the U.S. (e.g., [15,16,17,18,19]). Other authors have addressed water use for power generation in China (e.g., [20,21,22]). The vulnerability of the thermoelectricity sector to climate change scenarios in the U.S. and Europe was studied by van Vliet et al. [23]. For the UK, Byers et al. [24] and Murrant et al. [25,26] studied electricity generation and cooling water use up to 2050. Flörke et al. [27] simulated water withdrawal and consumption in Europe for 2050 and identified hot spots where water availability may not meet future demand. Mitra and Bhattacharya [28] and Srinivasan et al. [29] provided analyses for India. Further studies on water use for electricity generation exist for Brazil [30] and South Africa [31]. On a regional level, Damerau et al. [32] examined how different energy scenarios could influence water demand in the Middle East and North Africa (MENA).
In addition to these national and regional analyses, a handful of studies focus on the global level. These include the World Energy Council [33] study, which provided the first analysis of future global and regional water requirements. Likewise, Davies et al. [7] assessed the future water demand of the global power sector at the regional level, while Kyle et al. [9] modelled the effects of different energy strategies on the water demand. In 2016, Mekonnen et al. [34] analyzed the consumptive water use for different scenarios of the International Energy Agency (IEA). In the same year, Fricko et al. [35] published an analysis in which they modelled the implications of a 2 °C climate policy on water use by the energy sector, while Ando et al. [36] modelled the future global water use for electricity generation up to 2100.
While several studies have, therefore, already analyzed future water demand for the electricity sector at the global and regional levels, the findings diverge due to the wide variation in modelling techniques, assumptions, and underlying political objectives. Consequently, results and recommendations vary widely. For example, Fricko et al. [35] highlighted significant variations between scenarios, while Ando et al. [36] found only small differences for the energy sector in climate mitigation scenarios up to 2100 in terms of water withdrawal and consumption.
Compared to these existing analyses, the present study is novel in two respects; on the one hand, the study expands the analysis to ambitious energy transition pathways that are in line with, or at least close to, the Paris Agreement climate target to limit the increase in the global average temperature to “well below 2 °C” compared to pre-industrial levels. Secondly, two technology scenarios are developed which consider both power plant efficiencies and cooling technologies. This allows not only differentiating between different energy carrier mixes, but also drawing conclusions regarding the influence of power plant and cooling technologies on the future water demand of the electricity sector. Thereby, this research contributes to better understanding of how different factors contribute to the operational water demand associated with different energy scenarios and advances the discussion on sustainable energy transitions beyond greenhouse gas emissions (GHG) reductions.
The objective of the study is, accordingly, to provide more systematic and robust answers in terms of the impacts of different decarbonization strategies in the electricity sector on water demand at the global and regional levels for the time horizon up to 2040. The focus is on operational water use for electricity generation. As the first step, a meta-analysis of global energy scenarios is conducted to determine region-specific energy sources that are expected to be deployed in the future. The second step develops a set of future scenarios by combining decision options in two technological fields: (a) types of electricity generation technologies; and (b) types of cooling technologies. At the third step, the water withdrawal and consumption levels of the different technological pathways are calculated for each region up to 2040, resulting in water demand scenarios for different electricity futures and making it possible to identify the most water-efficient transition pathways for the electricity sector.

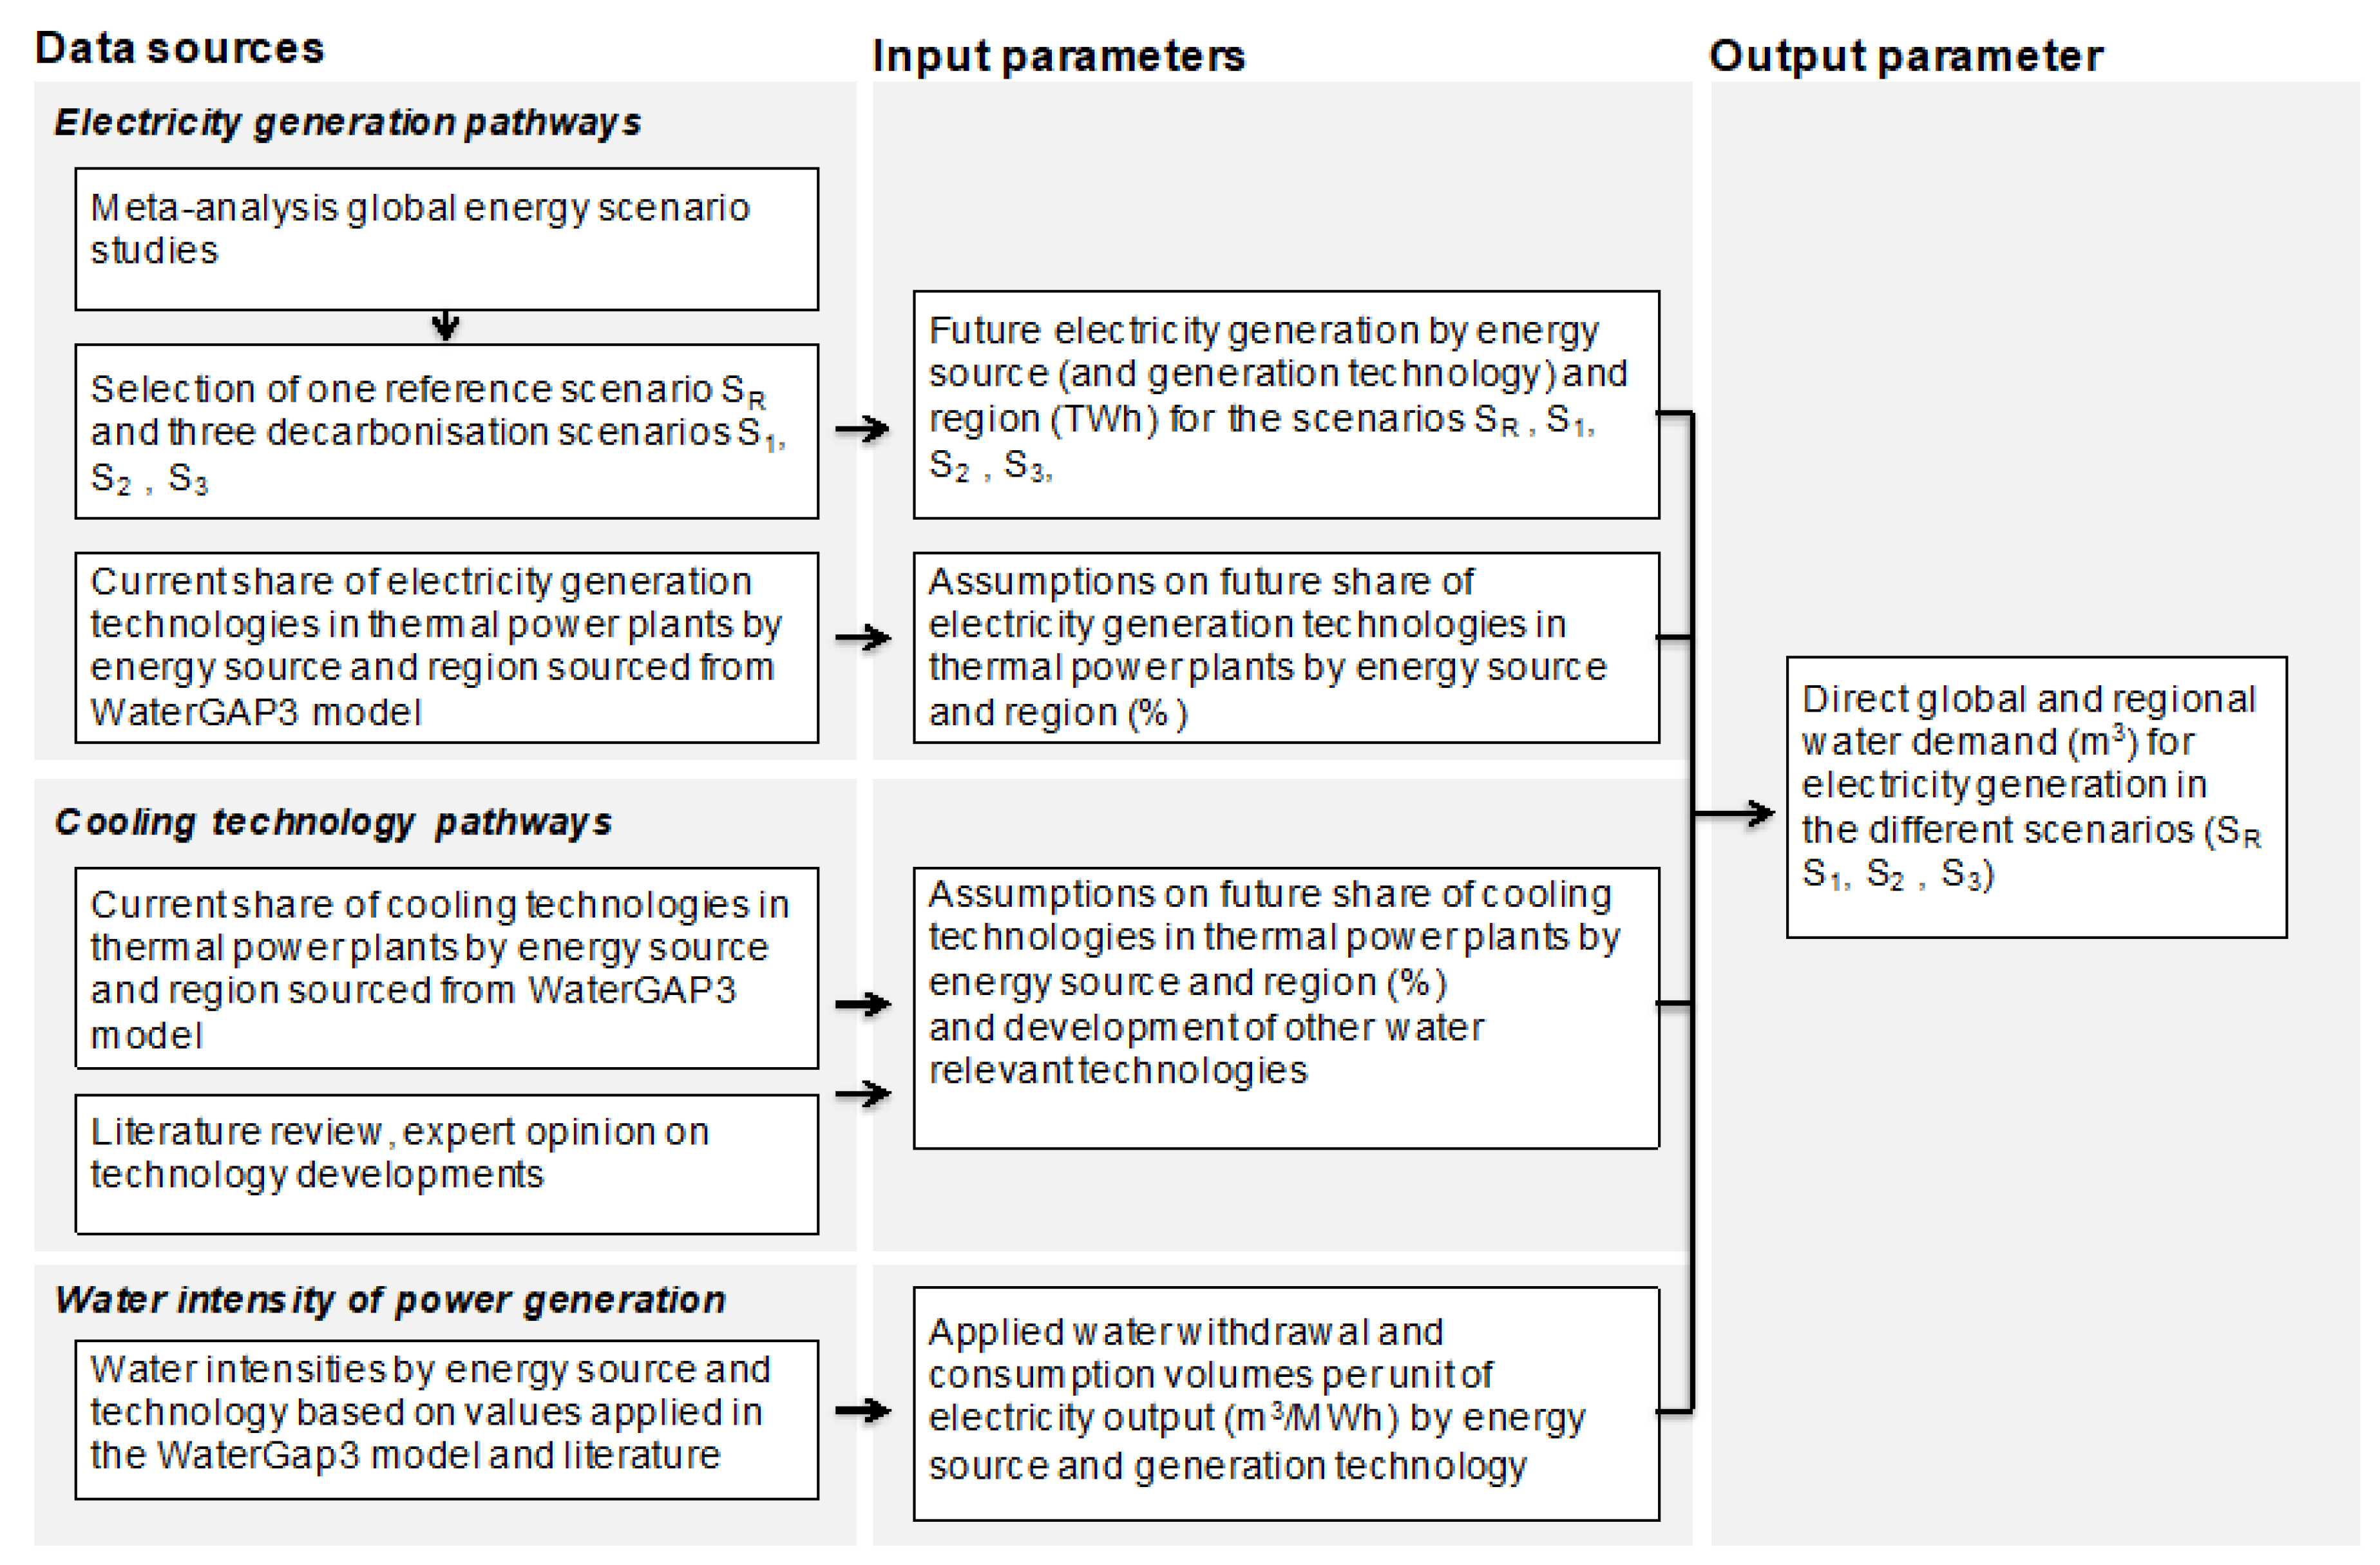
2. Data and Methodology

The water demand for electricity generation depends mainly on three key parameters: (a) the mix of energy sources and type of generation technologies applied; (b) the type of cooling technology deployed at thermal power plants; and (c) the water use intensity in the form of specific water withdrawal and consumption levels for each combination of electricity generation technology and cooling technology. To determine the future water requirements of the power sector, these three parameters are first assessed individually and then combined to estimate the water demand of the electricity sector according to different given future energy scenarios. The approach is summarized in Figure 1 and described in detail for the three parameters in the following sections.

2.1. Future Electricity Generation Pathways

This study conducted a meta-analysis of global energy scenario reports to select ambitious decarbonization scenarios to compare in terms of their direct water requirements. The future shares of energy sources in electricity generation and installed capacities are derived for each scenario. The comparative assessment approach allows for the identification of common characteristics, differences, and uncertainties related to different decarbonization strategies for the electricity sector [37]. Furthermore, drawing on a variety of studies allows for a broader and more systematic perspective on the potential electricity future that might not be apparent in a single study or model [38]. For our analysis, energy scenario studies that meet the following criteria were chosen: (a) topicality (published in or after 2015); (b) time horizon (up to at least 2040, preferably 2050); and (c) scope (sufficient regional differentiation of information about the electricity sector and sufficient details on power generation technologies). As a result of the comparative literature review, one reference scenario (International Energy Agency, Current policies scenario (IEA CP)) and three decarbonization scenarios were chosen based on their heterogeneity in terms of energy transition strategies and their ambition levels in terms of GHG emission reductions, i.e., in line with, or at least close to, the target of limiting the global temperature increase to “below 2 °C” (Table 1).
This allows for comparisons to be made concerning the impact on water demand arising from major shifts in the electricity sector required to achieve these climate objectives. As the level of detail and the definition of regions vary between the scenario studies and to achieve a high level of transparency and comparability, the information on the electricity sector has been grouped and harmonized to cover the following regions: Africa, Eastern Europe/Eurasia, Europe, Latin America, Asia Oceania OECD, China, India, Asia (other), North America, and the Middle East.
To determine water requirements of the potential future energy systems, it is necessary to define the type of the electricity generation technology applied. In this paper, four categories of thermal power plants are considered: steam turbines (ST), gas turbines (GT), combined cycle (CC) plants, and “other” (which mainly comprise internal combustion plants). The total electricity generation per energy source and power plant type in 2015 was calculated for each region based on the power plant database from the WaterGAP3 model [42].
In order to design future technological pathways related to the selected energy scenarios, the evolution of plant type shares is developed along two scenario storylines (Table 2). These storylines may differ from the assumptions made in the respective energy scenario models. This approach, however, allows showing the influence power plant types and cooling technologies have across energy scenario studies by applying a common methodology. The Business as usual (BAU) scenario anticipates that the share of plant types remains at 2015 levels until 2040. The “evolving technology” scenario (ETS), a normative best-case scenario in regard to power generation and cooling technology implementation is based on the following assumptions for the power sector: (a) if the absolute change in electricity generation between 2015 and 2040 is negative for a given energy source in a given region, then the less efficient power plants (i.e., ST and “other”) are retired first; (b) if generation capacities of a given energy source increase up to 2040, the most efficient power generation technologies (classified under the category “combined cycle”) are implemented (Table 2). Overall, the approach leads to eight future technological pathways as a result of selecting four energy scenarios and two scenario storylines addressing changes in power plant type and technologies (BAU and ETS).

2.2. Future Cooling Technology Scenarios

The second parameter to define concerns the question: which cooling technologies will be applied at thermal power plants in the future? Cooling systems are responsible for a large share of the today’s freshwater use in the energy sector [2,42]. Cooling systems can be divided into water-flow systems (wet cooling) and air-flow systems (dry cooling). Wet cooling systems include once-through cooling systems (open-loop cooling) where water passes through the cooling system and is then returned to its source and recirculating technologies (closed-loop cooling, including evaporative cooling towers and ponds) which reuse the water [7,9,35,43]. Hybrid cooling systems, which use both dry and wet cooling to different extents, also exist [43]. Open-loop systems withdraw large volumes of water, but most water is returned to the water source [44]. Closed-loop systems withdraw less water, but a large proportion of the water is consumed through evaporation, blowdown, and drift [45]. Dry cooling systems require no water, or only small amounts, but have lower thermal efficiencies resulting in lower electricity outputs [9].
The water used in cooling systems can be sourced from freshwater or non-freshwater resources (i.e., seawater, brackish water, or reused water sources (BSW) [45]). For example, the use of seawater offers a potentially more sustainable solution in areas where freshwater becomes scares. Yet, while the use of non-freshwater resources for electricity generation is expected to increase in the future, the extent will depend on the availability of these water sources close to the electricity demand centers as well as on aspects of applicable environmental regulations. Due to these uncertainties in this analysis, non-freshwater cooling is included in the water demand calculations, but no changes in the shares are assumed. While the impact that cooling technologies have on water use in the electricity sector is widely acknowledged, there is only limited information about the current deployment of the different cooling system types and even less information about their likely shares in the future.
For our analysis, we examined the cooling technologies applied today for each category of power plant type based on the database from the WaterGAP3 model [42]. WaterGAP3 is a global integrated water model that consists of two main components: (1) a water balance model to simulate the characteristic macro-scale behavior of the terrestrial water cycle in order to estimate water availability [46,47] and (2) a water use model to estimate spatially distributed sectoral water withdrawals and consumptive water use for the five most important water use sectors: irrigation, livestock-based agriculture, industry, thermal electricity production, and households and small businesses [42,48]. In the model, the amount of cooling water withdrawn and consumed for thermal electricity production is determined by multiplying the annual thermal electricity production by the respective water use intensity of each power station [42]. The simulation approach is complemented by taking into consideration technological improvements related to the cooling system which result in reduced water use intensities. Input data on location, type, and size of power stations are based on the World Electric Power Plants Data Set [49] and supplemented by data from various publicly available sources, for example, the data obtained by searching for plant-specific information, State of the Environment reports, and national statistics.
Five categories of cooling systems using freshwater were considered: once-through (1T); cooling pond (CP); cooling tower (CT); combined systems (CMB); and dry cooling (DC). In addition, the sixth category is introduced to account for 1T cooling systems using non-freshwater resources (1T-BSW). We derived the application of future cooling technologies according to the two scenario storylines (Table 2).
The two cooling technology scenarios are designed to examine the potential impact of long-term decisions concerning cooling system technologies on future water demand in the electricity sector. Whereas the BAU scenario assumes no changes in cooling system technologies up to 2040, the ETS scenario represents a progressive pathway with a shift to less water-intensive cooling technologies to address increasing water stress levels. Table 2 assumes: (a) in the case of decreasing electricity generation by a respective power plant type between 2015 and 2040, 1T using freshwater are retired first; (b) in the case of increasing electricity generation, additional power plants are built with closed-loop systems in this case CT or DC technologies. In order to reflect regional differences in water scarcity, additional capacities required up to 2040 are allocated to CT and DC systems according to regional distribution keys (Table 3).
In addition to the cooling systems used at thermal power plants, other technological factors can affect water use at power plants. For instance, at solar power plants, the type of the cleaning system employed affects the volume of water needed for operation. Although this factor accounts for a considerably smaller share of water compared to cooling, this water demand can still be relevant at the regional or local level depending on the availability of freshwater.

2.3. Estimated Water Use Intensity by Energy Source and Technology

The third parameter to define to determine the future water demand of the electricity sector is the technology-specific water use intensity. In terms of water use in the power sector, usually, a distinction is made between water withdrawal and water consumption. Water withdrawal refers to the amount of water extracted from surface water bodies or groundwater, while water consumption describes the proportion of the water withdrawn that is not returned to the water source but evaporates or is otherwise consumed [36]. The actual volume of withdrawn and consumed water by the global power sector is unknown. For some regions and countries, data for water withdrawal are available, but the information on how much water is consumed is generally missing. Data from actual power plants vary significantly, even for the same generation technology, depending on the location, season, age, or water source used [7,43]. Hence, to estimate water use in the electricity sector, water intensity coefficients are applied that define the average amount of water withdrawn or consumed per unit of electricity output—for example, in the form of m3 of water used per MWh electricity generated [7,35,42]. These water intensities are either estimated using a bottom-up approach based on power plant data (e.g., [24,43,50]) or a top-down approach based on national or regional water use information (e.g., [51]). As for the actual power plant data, the water intensities given in the literature vary widely. Especially for hydropower, the range is very broad, as no agreed upon methodology exists and the water consumption is very site-specific [52]. Furthermore, the evaporation losses of dam reservoirs are assigned to electricity generation, although dams might have further functions [7]. This is why the ranges of water withdrawal and consumption for hydropower were excluded from this analysis.
The water use intensities applied in this analysis are presented in Table A1 in the Appendix A.

2.4. Calculating Water Use for Future Global and Regional Electricity Generation

Based on the assumptions made for the three parameters specified above (i.e., the mix of energy sources, cooling technology, water withdrawal and consumption intensity), water withdrawal (Wwithd, m3 per year) and consumption (Wconsum, m3 per year) are calculated for electricity generation at the global and regional levels:
W withd   /   consum   | global   =   r = 1 n r [ s = 1 n s E L s , r ( t = 1 n w γ s , r , t × w s , t ) ]
where E L s , r is the electricity generated by energy source and/or generation technology s in region r (MWh/year); γ s , r , t is the share (%) of energy source and generation technology s in region r with (cooling) technology t and w s , t is the water intensity coefficient for source and technology s with (cooling) technology t (m3/MWh). The Equation (1) is used to calculate both water withdrawal (Wwithd, m3 per year) and consumption (Wconsum, m3 per year) applying the respective water intensity coefficients (Appendix A).

3. Results

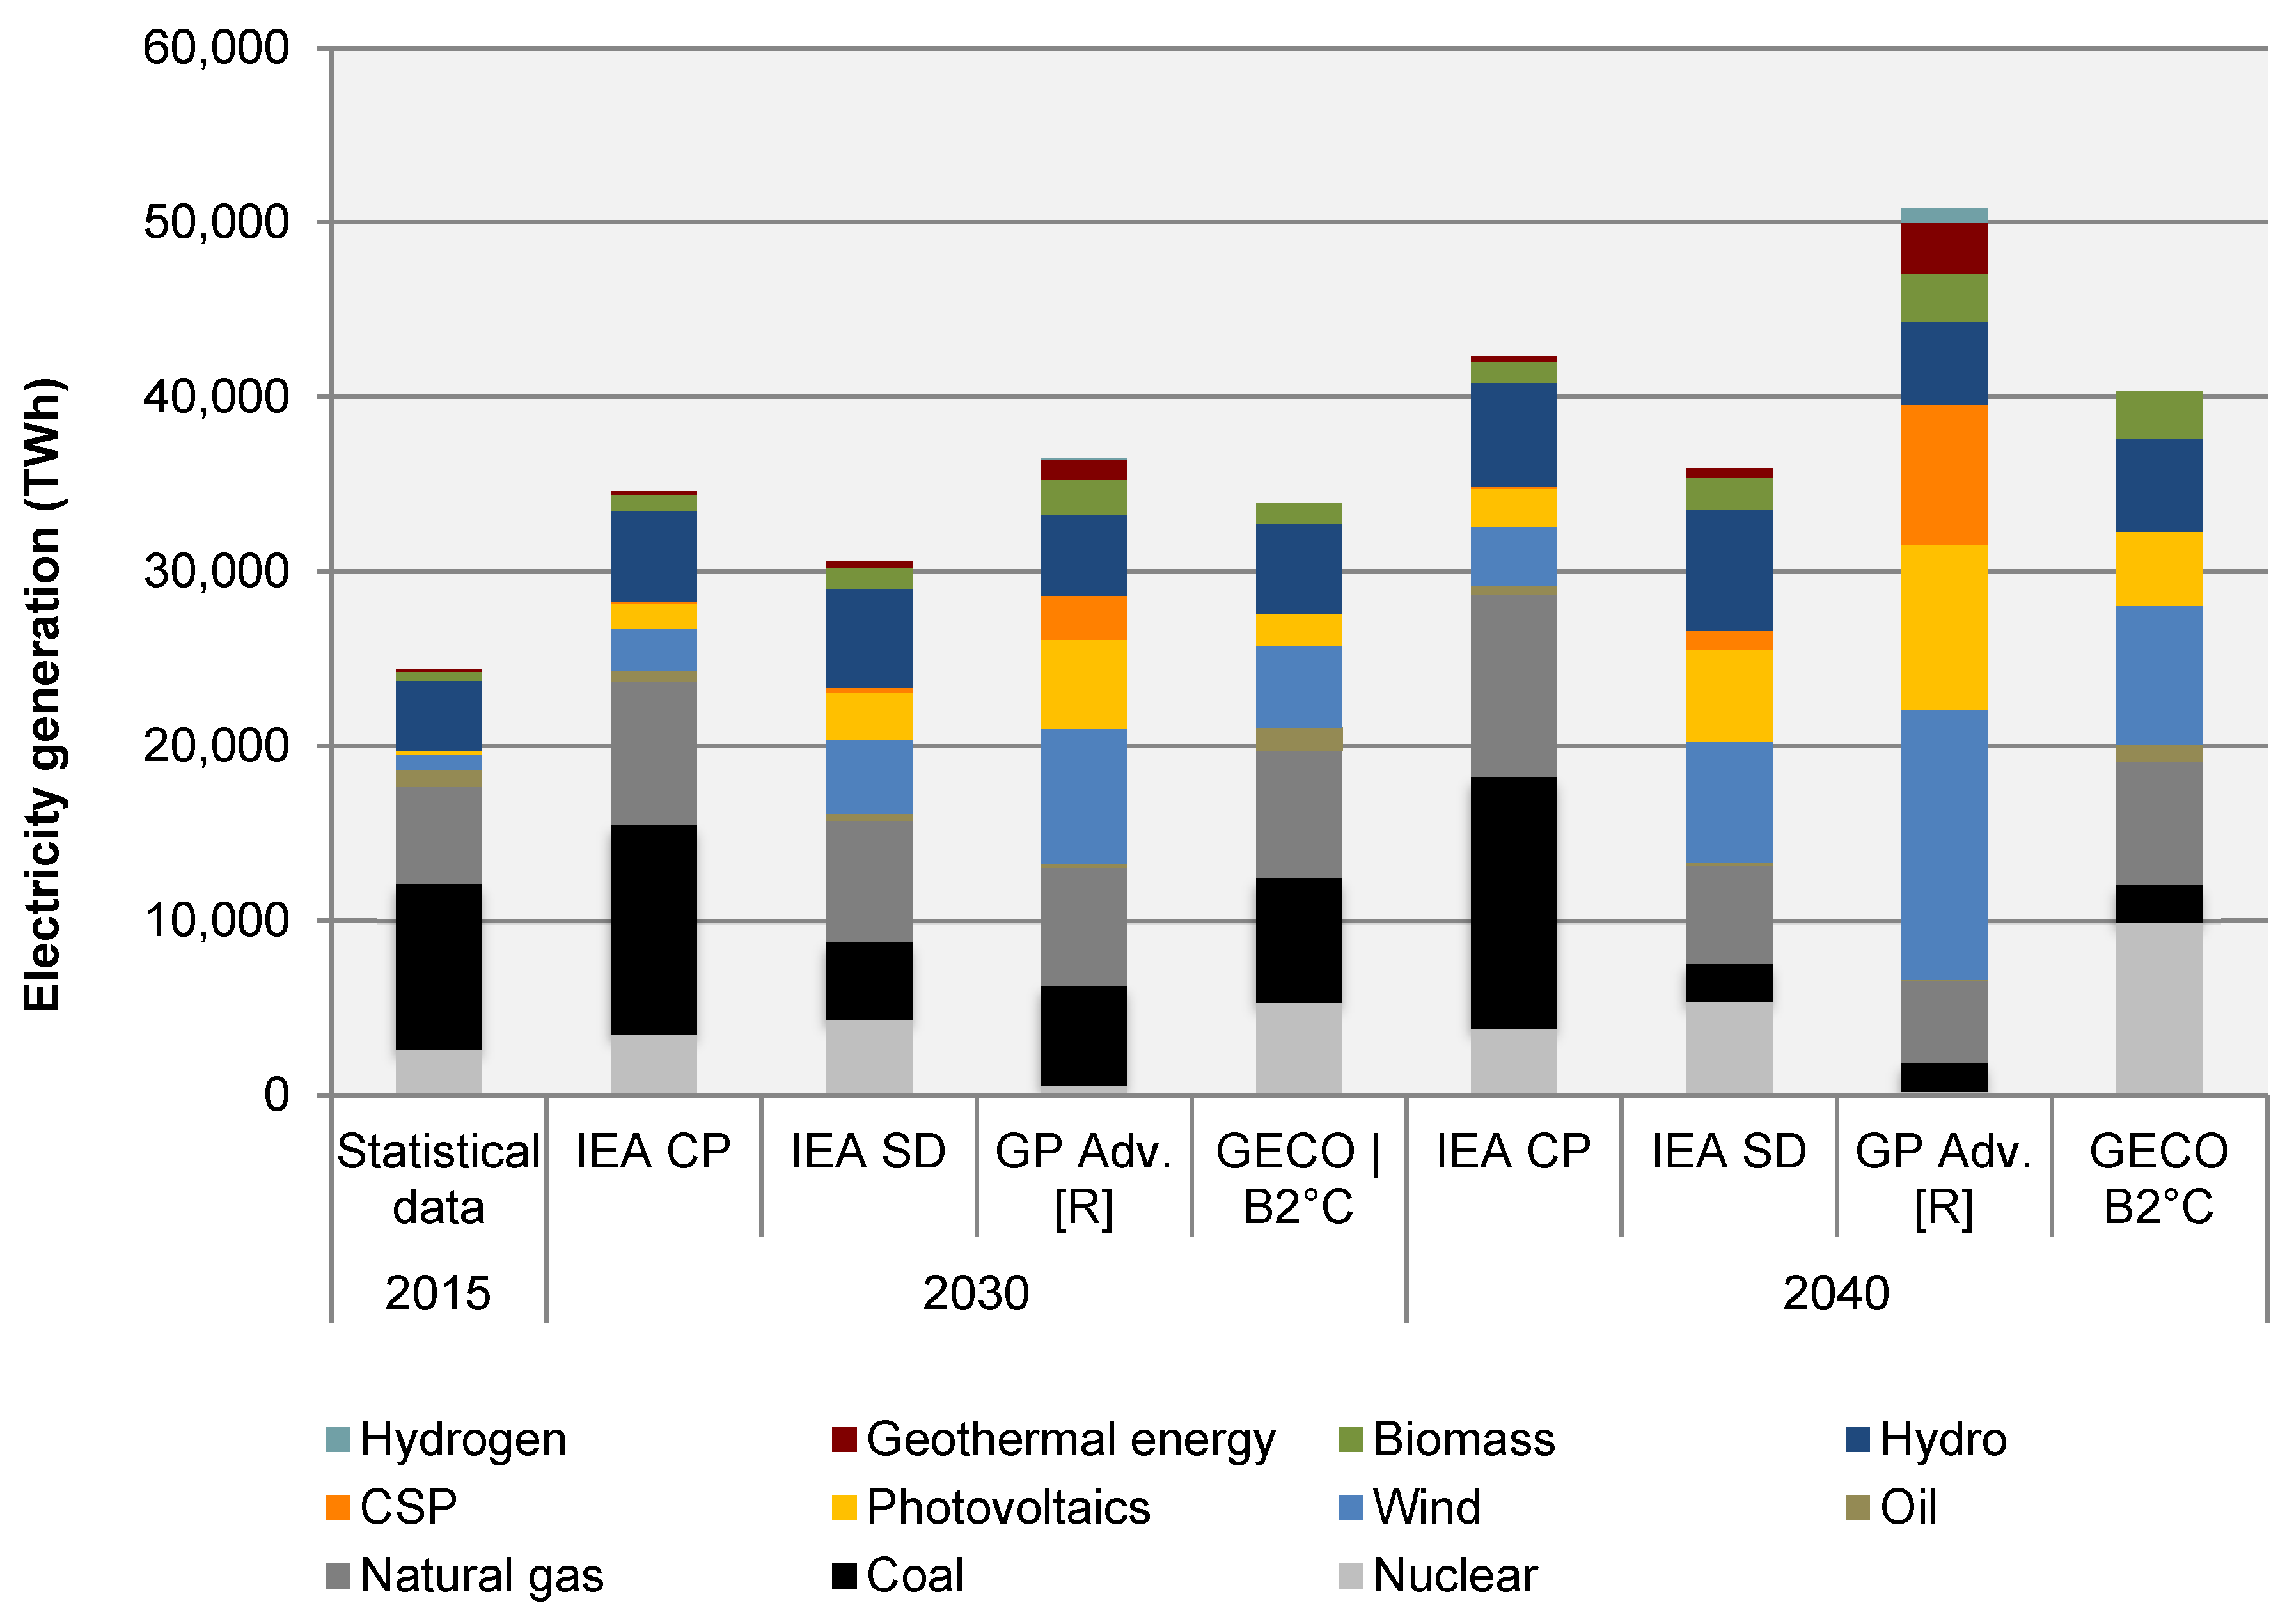
3.1. Comparison of Transition Pathways for the Electricity Sector

The different electricity mixes resulting from the four energy scenarios for the years 2030 and 2040 are shown in Figure 2. These include one reference scenario (IEA CP) and three decarbonization scenarios (International Energy Agency, Sustainable development scenario (IEASD); Greenpeace, Advanced energy revolution scenario (GP Adv. (R)), and Global Energy and Climate Outlook, Below 2 °C scenario (GECO B2°C)).
Overall, all the scenarios anticipate an increase in electricity generation by 2040 compared to 2015. However, the extent of the increase and the overall mix of energy sources vary considerably depending on the scenario. The different underlying decarbonization strategies and the level of ambition in respect of GHG emission reductions explain these differences. For example, scenarios assuming a higher degree of electrification in sectors such as transport or industry require higher amounts of electricity. Moreover, assumptions about economic development and population growth underlying the energy scenarios can influence the anticipated total future electricity demand.
Unsurprisingly, all the scenarios expect an increase in electricity generation from renewable energy sources, with wind and photovoltaic sources anticipated to increase the most. In the GP Adv. (R) scenario, concentrated solar power (CSP) and geothermal energy also play an important role in the electricity mix. An increase in electricity generation from fossil fuels is expected in the reference scenario IEA CP, while the GECO B2°C scenario shows a strong increase in nuclear energy by 2040 compared to 2015. In contrast, the IEA SD and GP Adv. (R) scenarios assume a decline in fossil fuels (especially coal). In the GP Adv. (R) scenario, nuclear energy is almost completely phased out worldwide by 2040.

3.2. Impact of Electricity Generation Pathways on Future Global Water Demand

These differences in the electricity mix influence both water withdrawal and consumption of future electricity systems. Comparing the level of water withdrawal in the two electricity scenarios under BAU and ETS conditions in 2040, it is clear that water withdrawal is reduced in all the scenarios except for IEA CP BAU and GECO B2°C BAU (Figure 3).
The changes in the future global water withdrawal vary between +55% and −72% compared to 2015. In the IEA CP BAU scenario, the increase in fossil fuel-based electricity generation, especially from natural gas and coal, combined with a cooling system mix similar to the current share, results in an increase in water withdrawal of 55% compared to 2015. Overall, higher shares of fossil fuels are likely to lead to greater water withdrawal, while scenarios with high shares of renewable energy perform better in terms of reducing future water withdrawal. In the case of GP Adv. (R), the BAU scenario results in an even lower global water withdrawal than the reference scenario with advanced power plant and cooling technologies (IEA CP ETS). This is due to the fact that electricity generated from fossil fuels still comes predominantly from thermoelectric power plants based on technologies with higher water withdrawal intensities.
Figure 4 shows that the general trend towards reduced global water withdrawal for electricity generation in 2040 does not translate automatically into reduced global water consumption. In absolute terms, water consumption is expected to rise in five out of eight scenarios (by between 9% and 78%) compared to 2015. In contrast, the IEA SD scenario results in lower global water consumption in 2040 compared to 2015 in both the BAU (−1%) and ETS (−20%) pathways. The most common feature of all the decarbonization scenarios is reduced water consumption caused by reduced coal-based power generation.
However, an increase in global water consumption occurs as a result of an increase in electricity production and a shift towards improved cooling systems, which in turn withdraw less water, but consume more [2]. The reference scenario IEA CP assumes an increase in coal and gas-based electricity generation in the future, which leads to increased water consumption under the BAU and ETS technology assumptions. Globally, increased water consumption can be observed for the most ambitious scenario in terms of renewable energy deployment (GP Adv. (R)). The reason for the high levels of water consumption (despite the high share of renewable energy) is the widescale implementation of low carbon technologies, such as geothermal energy, biomass energy, and concentrated solar power (CSP). These renewable technologies are generally heat-based and use similar power blocks to traditional thermal power stations; they also consume comparable amounts of water (Table A1). In the GECO B2°C scenario, the increase in water-intensive nuclear power is the main driver for rising water consumption.
From a global perspective, it can be concluded that more efficient cooling and electricity generation systems (i.e., ETS scenarios) can significantly reduce the water demand of the power sector in terms of water withdrawal and consumption.

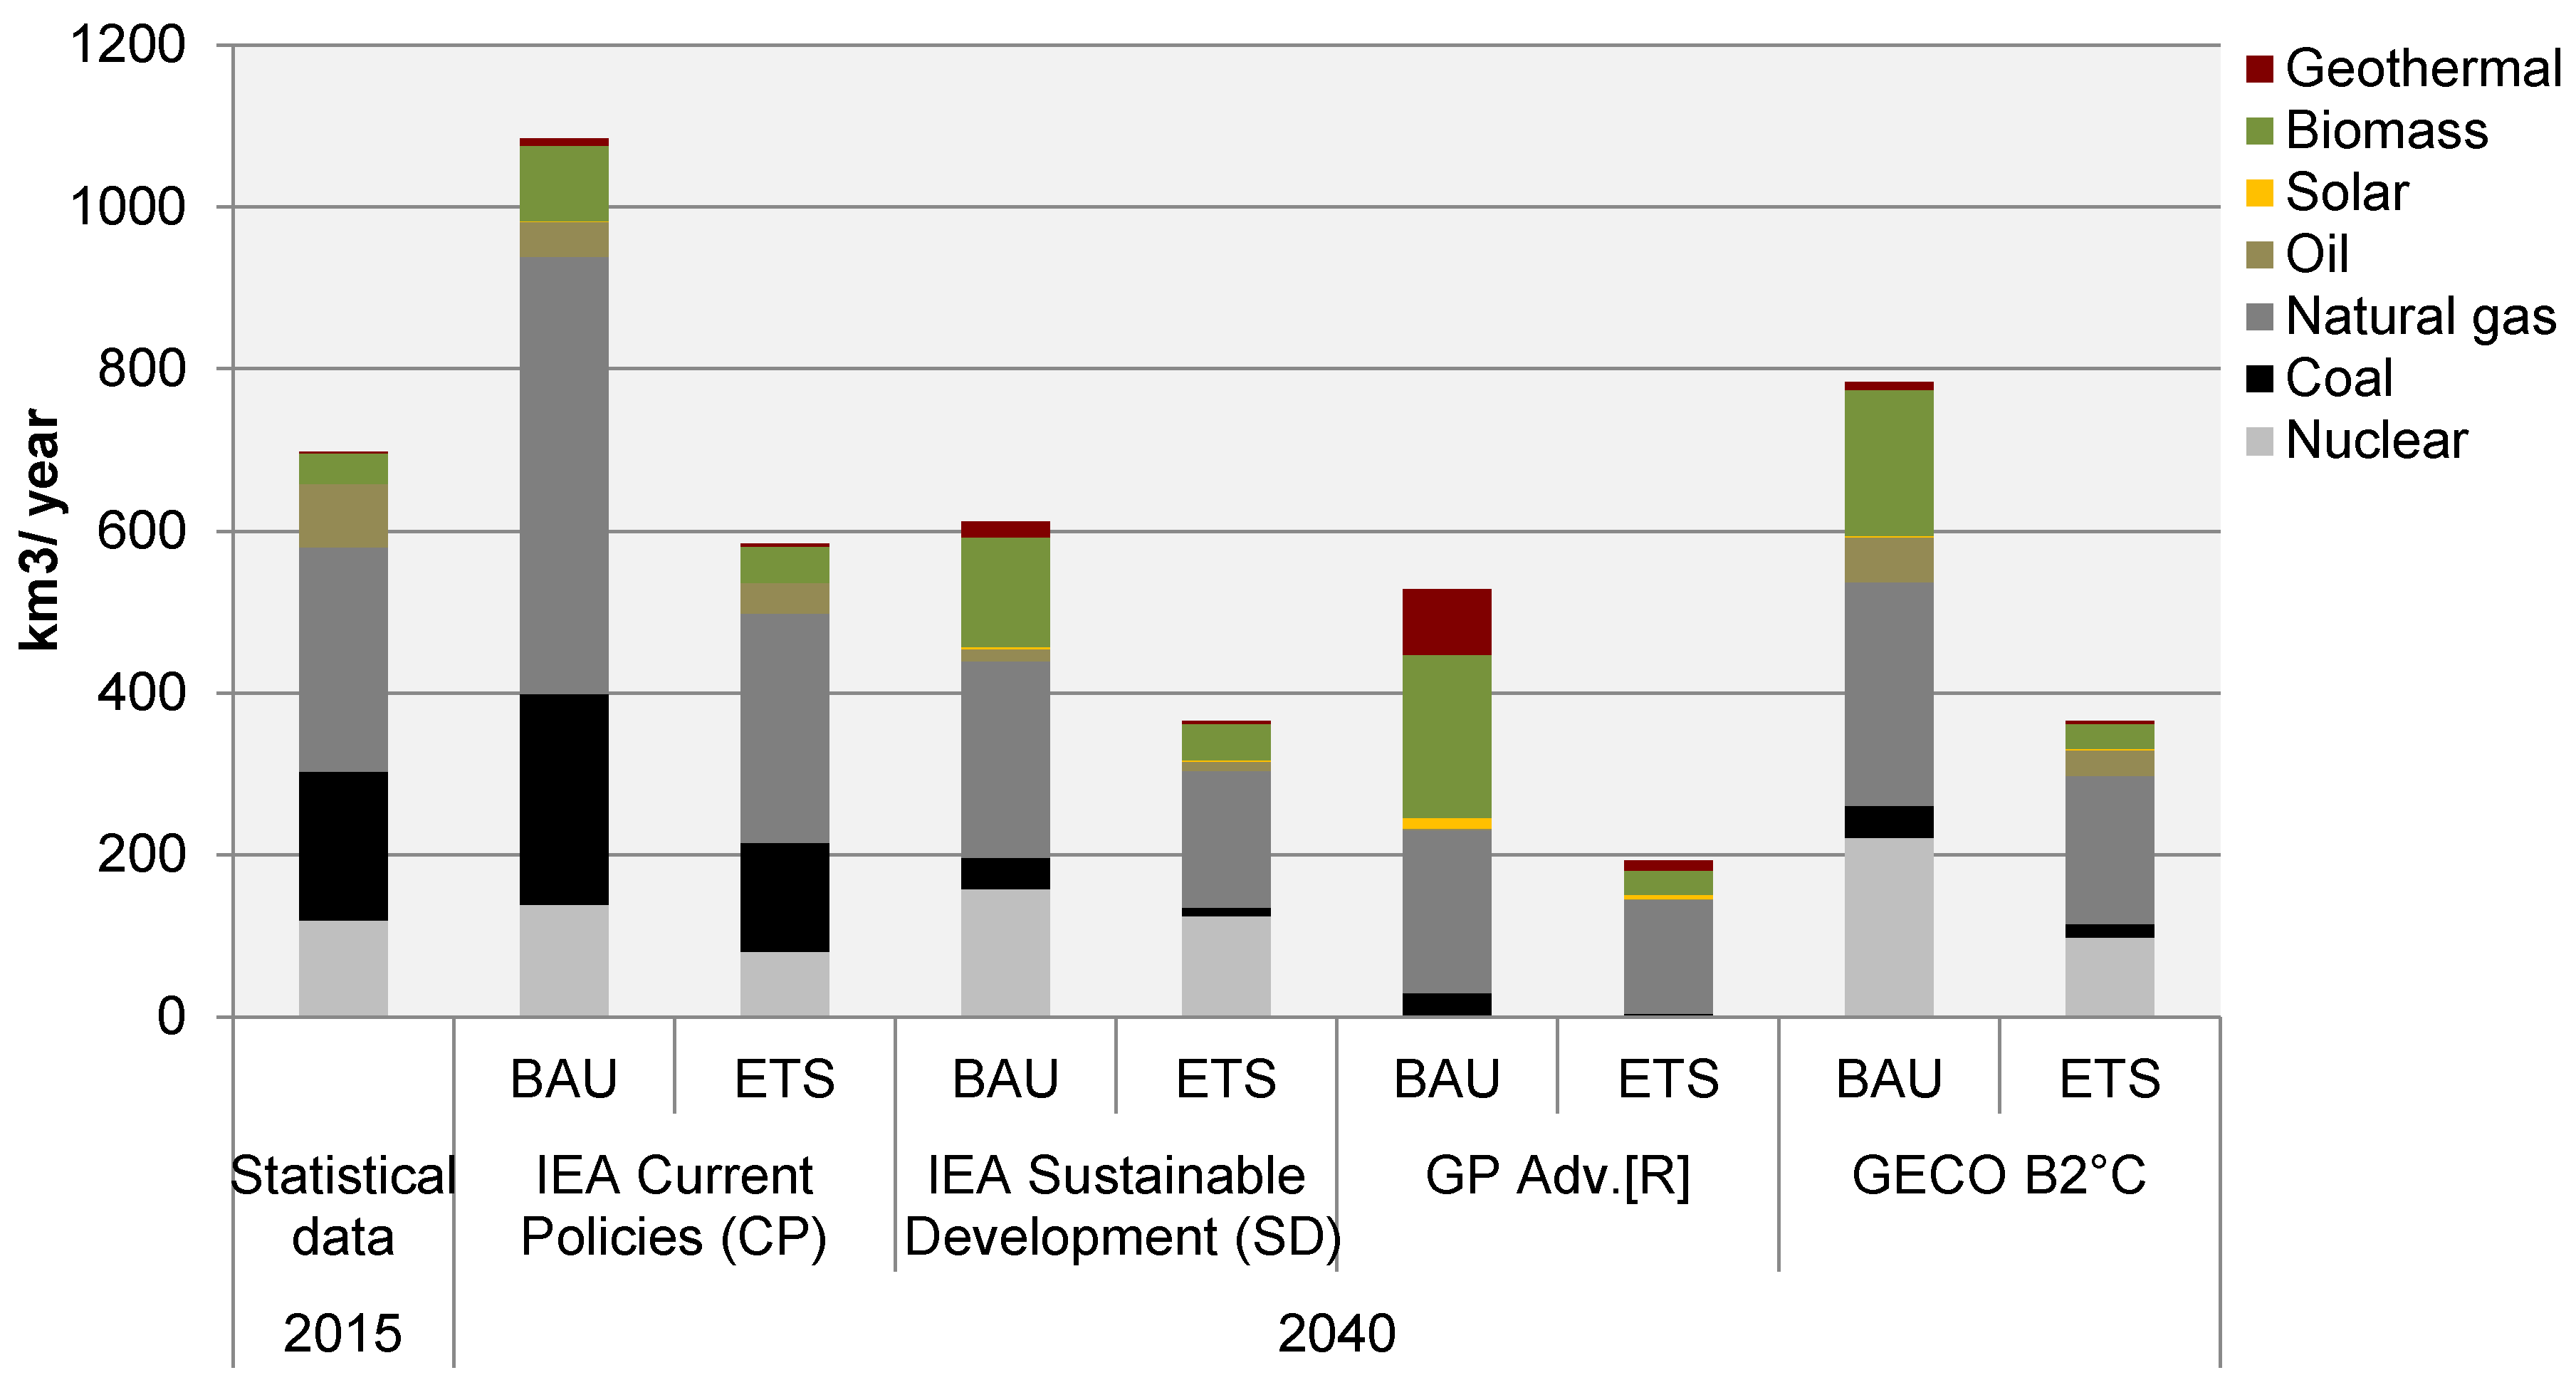
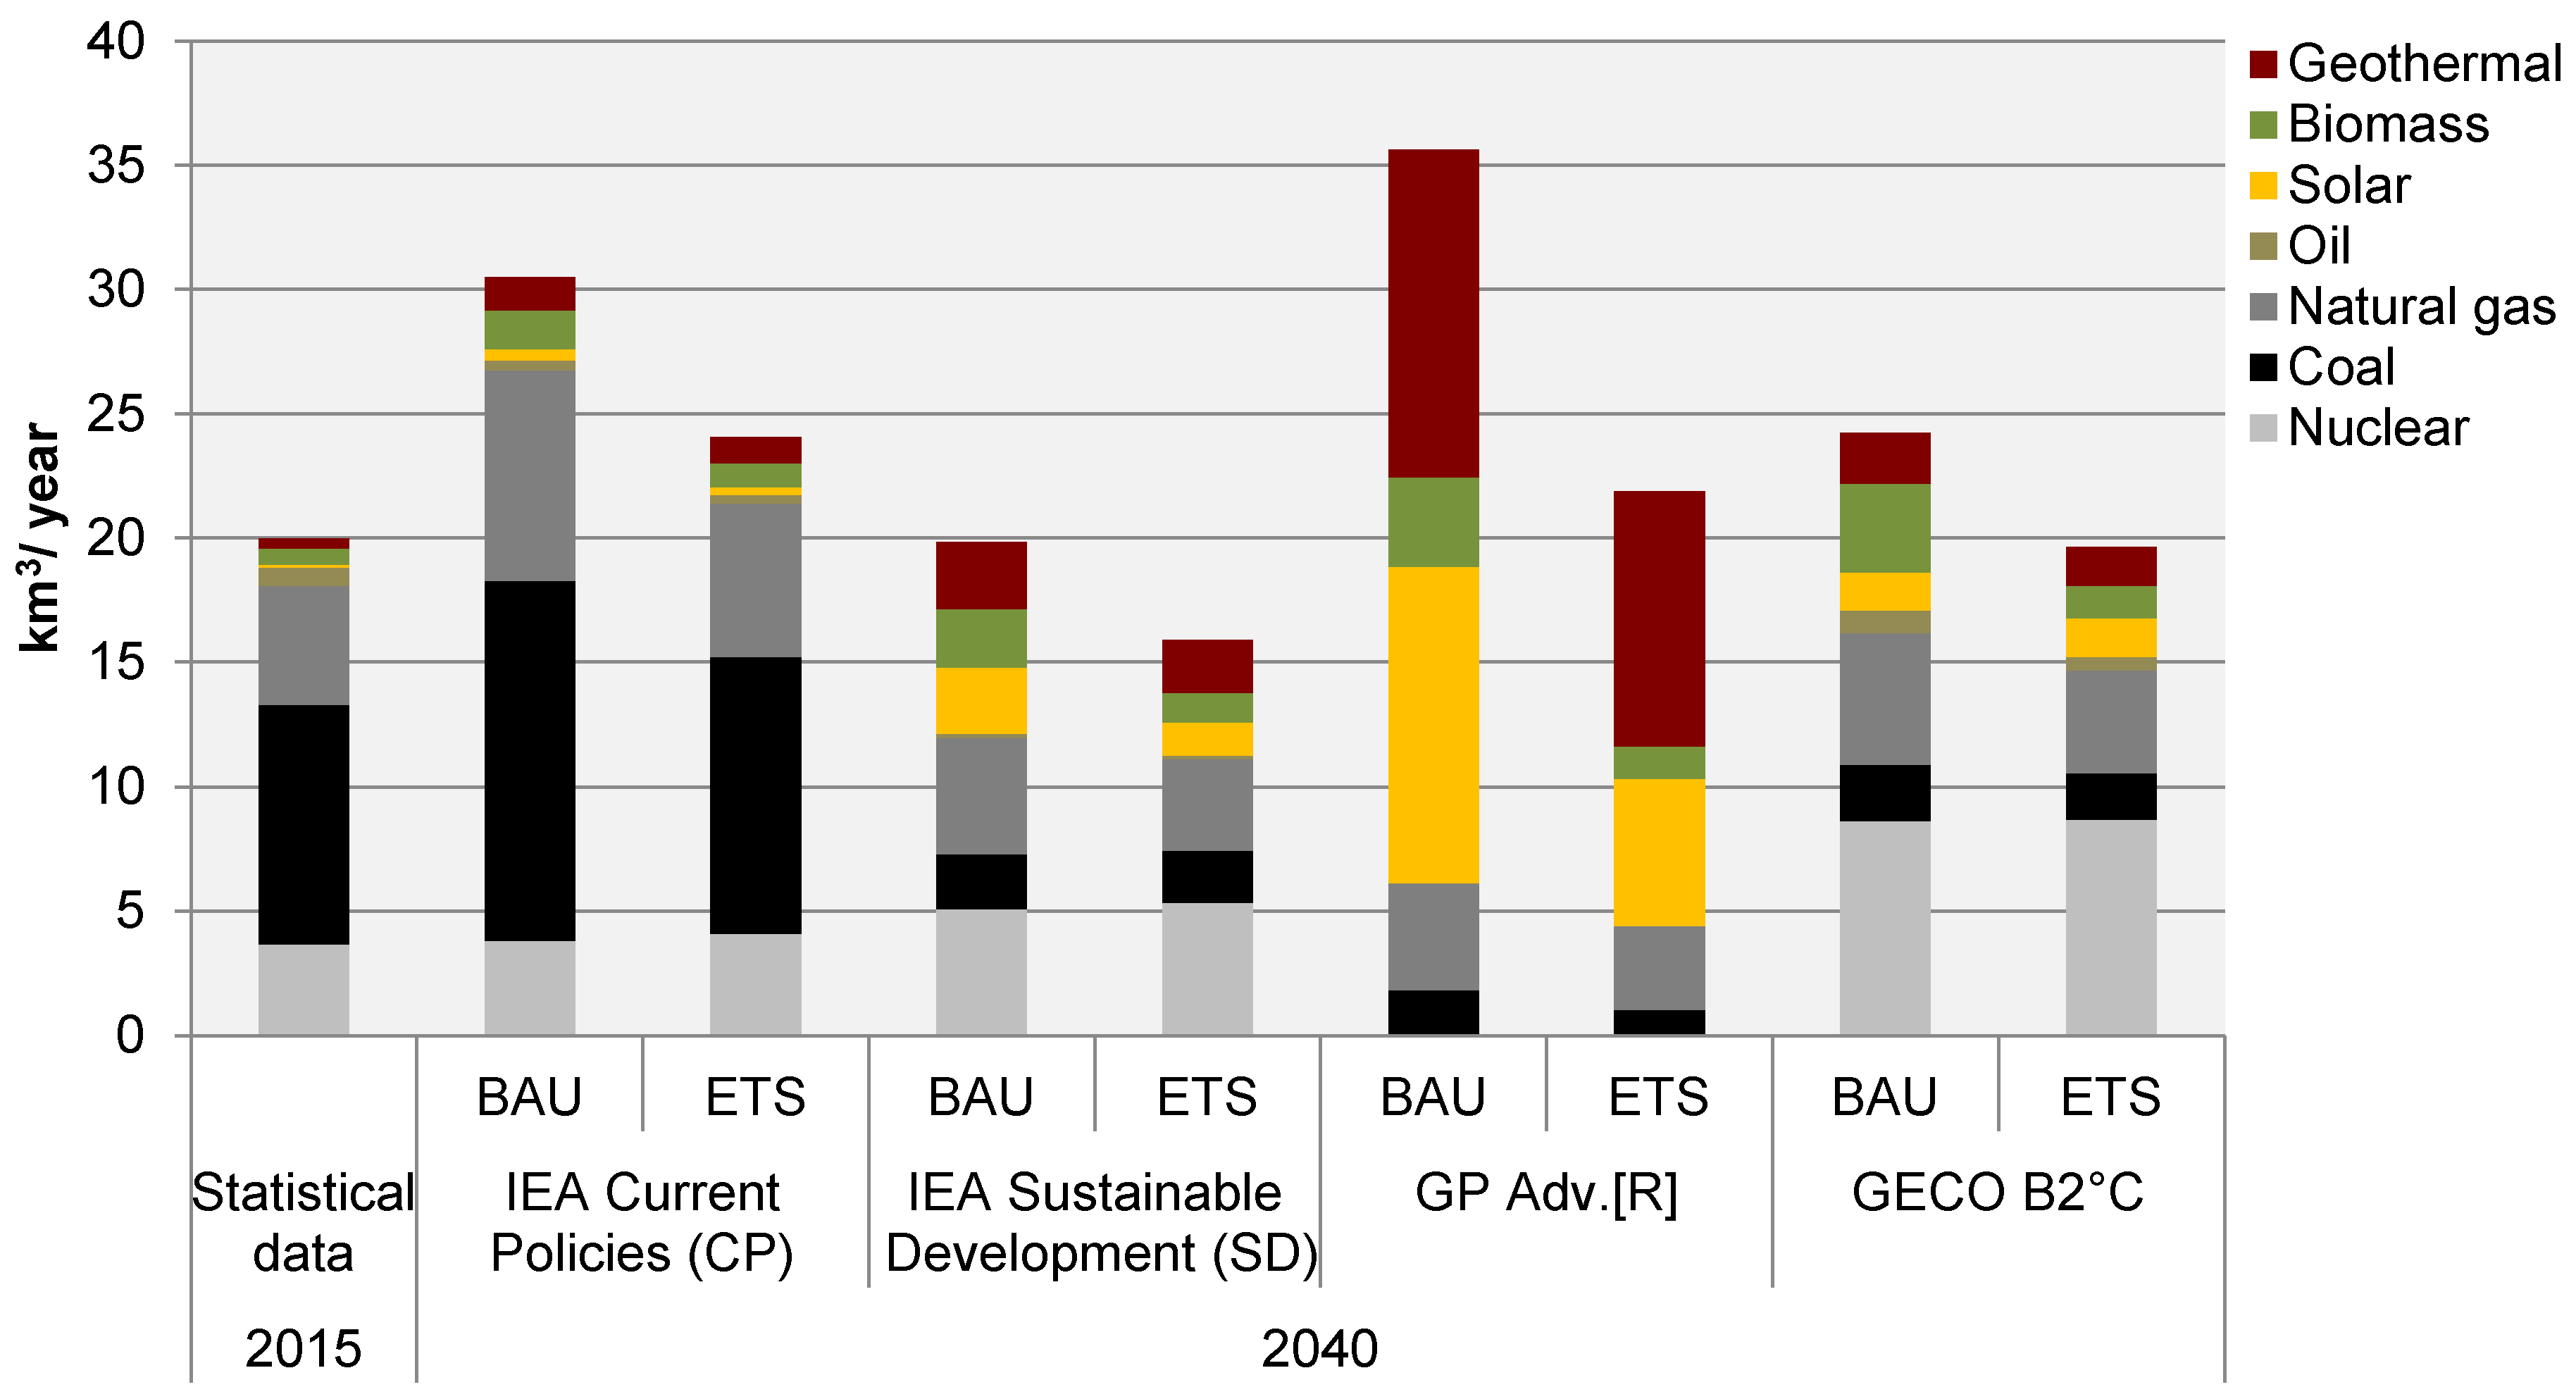
3.3. Impacts of Electricity Demand on Global Water Demand

On the global level, as shown previously in Figure 2, all the scenarios predict an increase in electricity production by 2040. Despite this increase, in most scenarios, the water withdrawal levels, and in some cases even the water consumption, are likely to decrease in the same time period. This implies reduced water withdrawal and consumption intensities in worldwide electricity generation in most scenarios. Despite this general trend, the water intensities across scenarios vary widely due to scenario-specific shifts in the electricity mix and corresponding changes in power plant types and cooling systems. The shift from 1T cooling systems to CT, for example, reduces water withdrawal, but increases water consumption. Likewise, the shift from ST to CC thermal power plants can reduce both water withdrawal and consumption.
Comparing water withdrawal and consumption intensities (Figure 5) between the BAU and ETS technology scenarios demonstrates that shifts in the cooling system and electricity generation technology can have a greater influence on water demand reduction in the electricity sector than the shift towards renewable energy technologies. Without technological advances in cooling systems and electricity generation, scenarios including a high share of renewable energy show comparable water consumption intensities or, in the case of the GP Adv. (R) BAU scenario, even greater intensities than the scenarios with higher shares of fossil fuels.
In the GP Adv. (R) scenario, the high levels of water consumption result from the more widespread use of CSP, geothermal, and biomass sources for electricity generation. If more efficient cooling systems and power generation technologies are implemented, water consumption will be significantly reduced under the same scenario, e.g., under the GP Adv. (R) ETS in comparison to the GP Adv. (R) BAU scenario (Figure 5). It can further be observed that in comparison to the water consumption intensities, the withdrawal intensities are more sensitive to the shift towards renewable energy technologies. The scenarios with the highest share of renewables, namely, IEA SD and GP Adv. (R), show significantly lower withdrawal intensities than the reference scenario (for BAU and ETS).

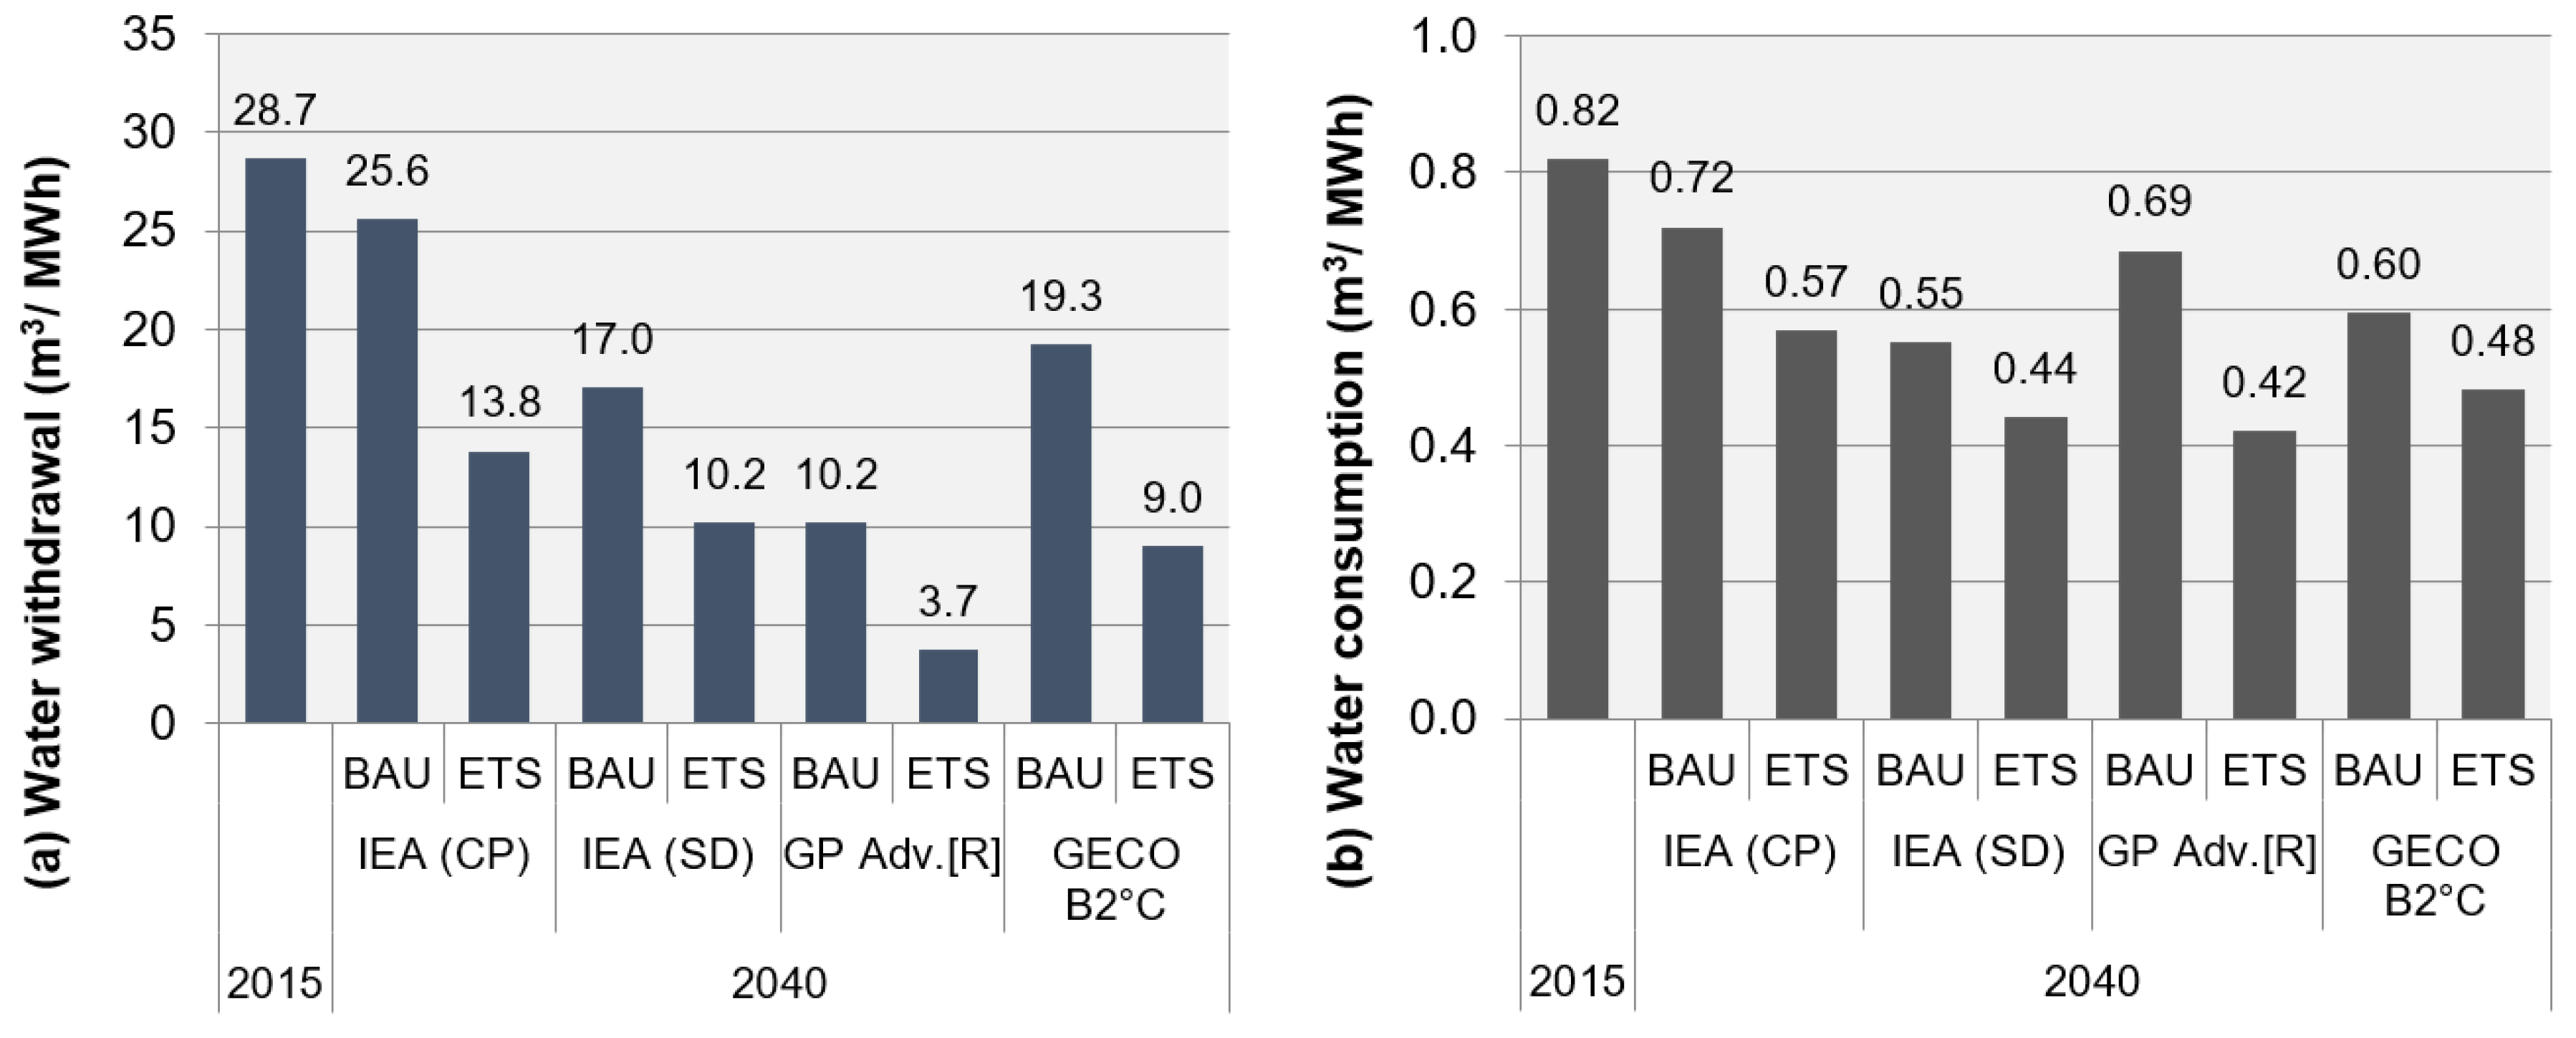
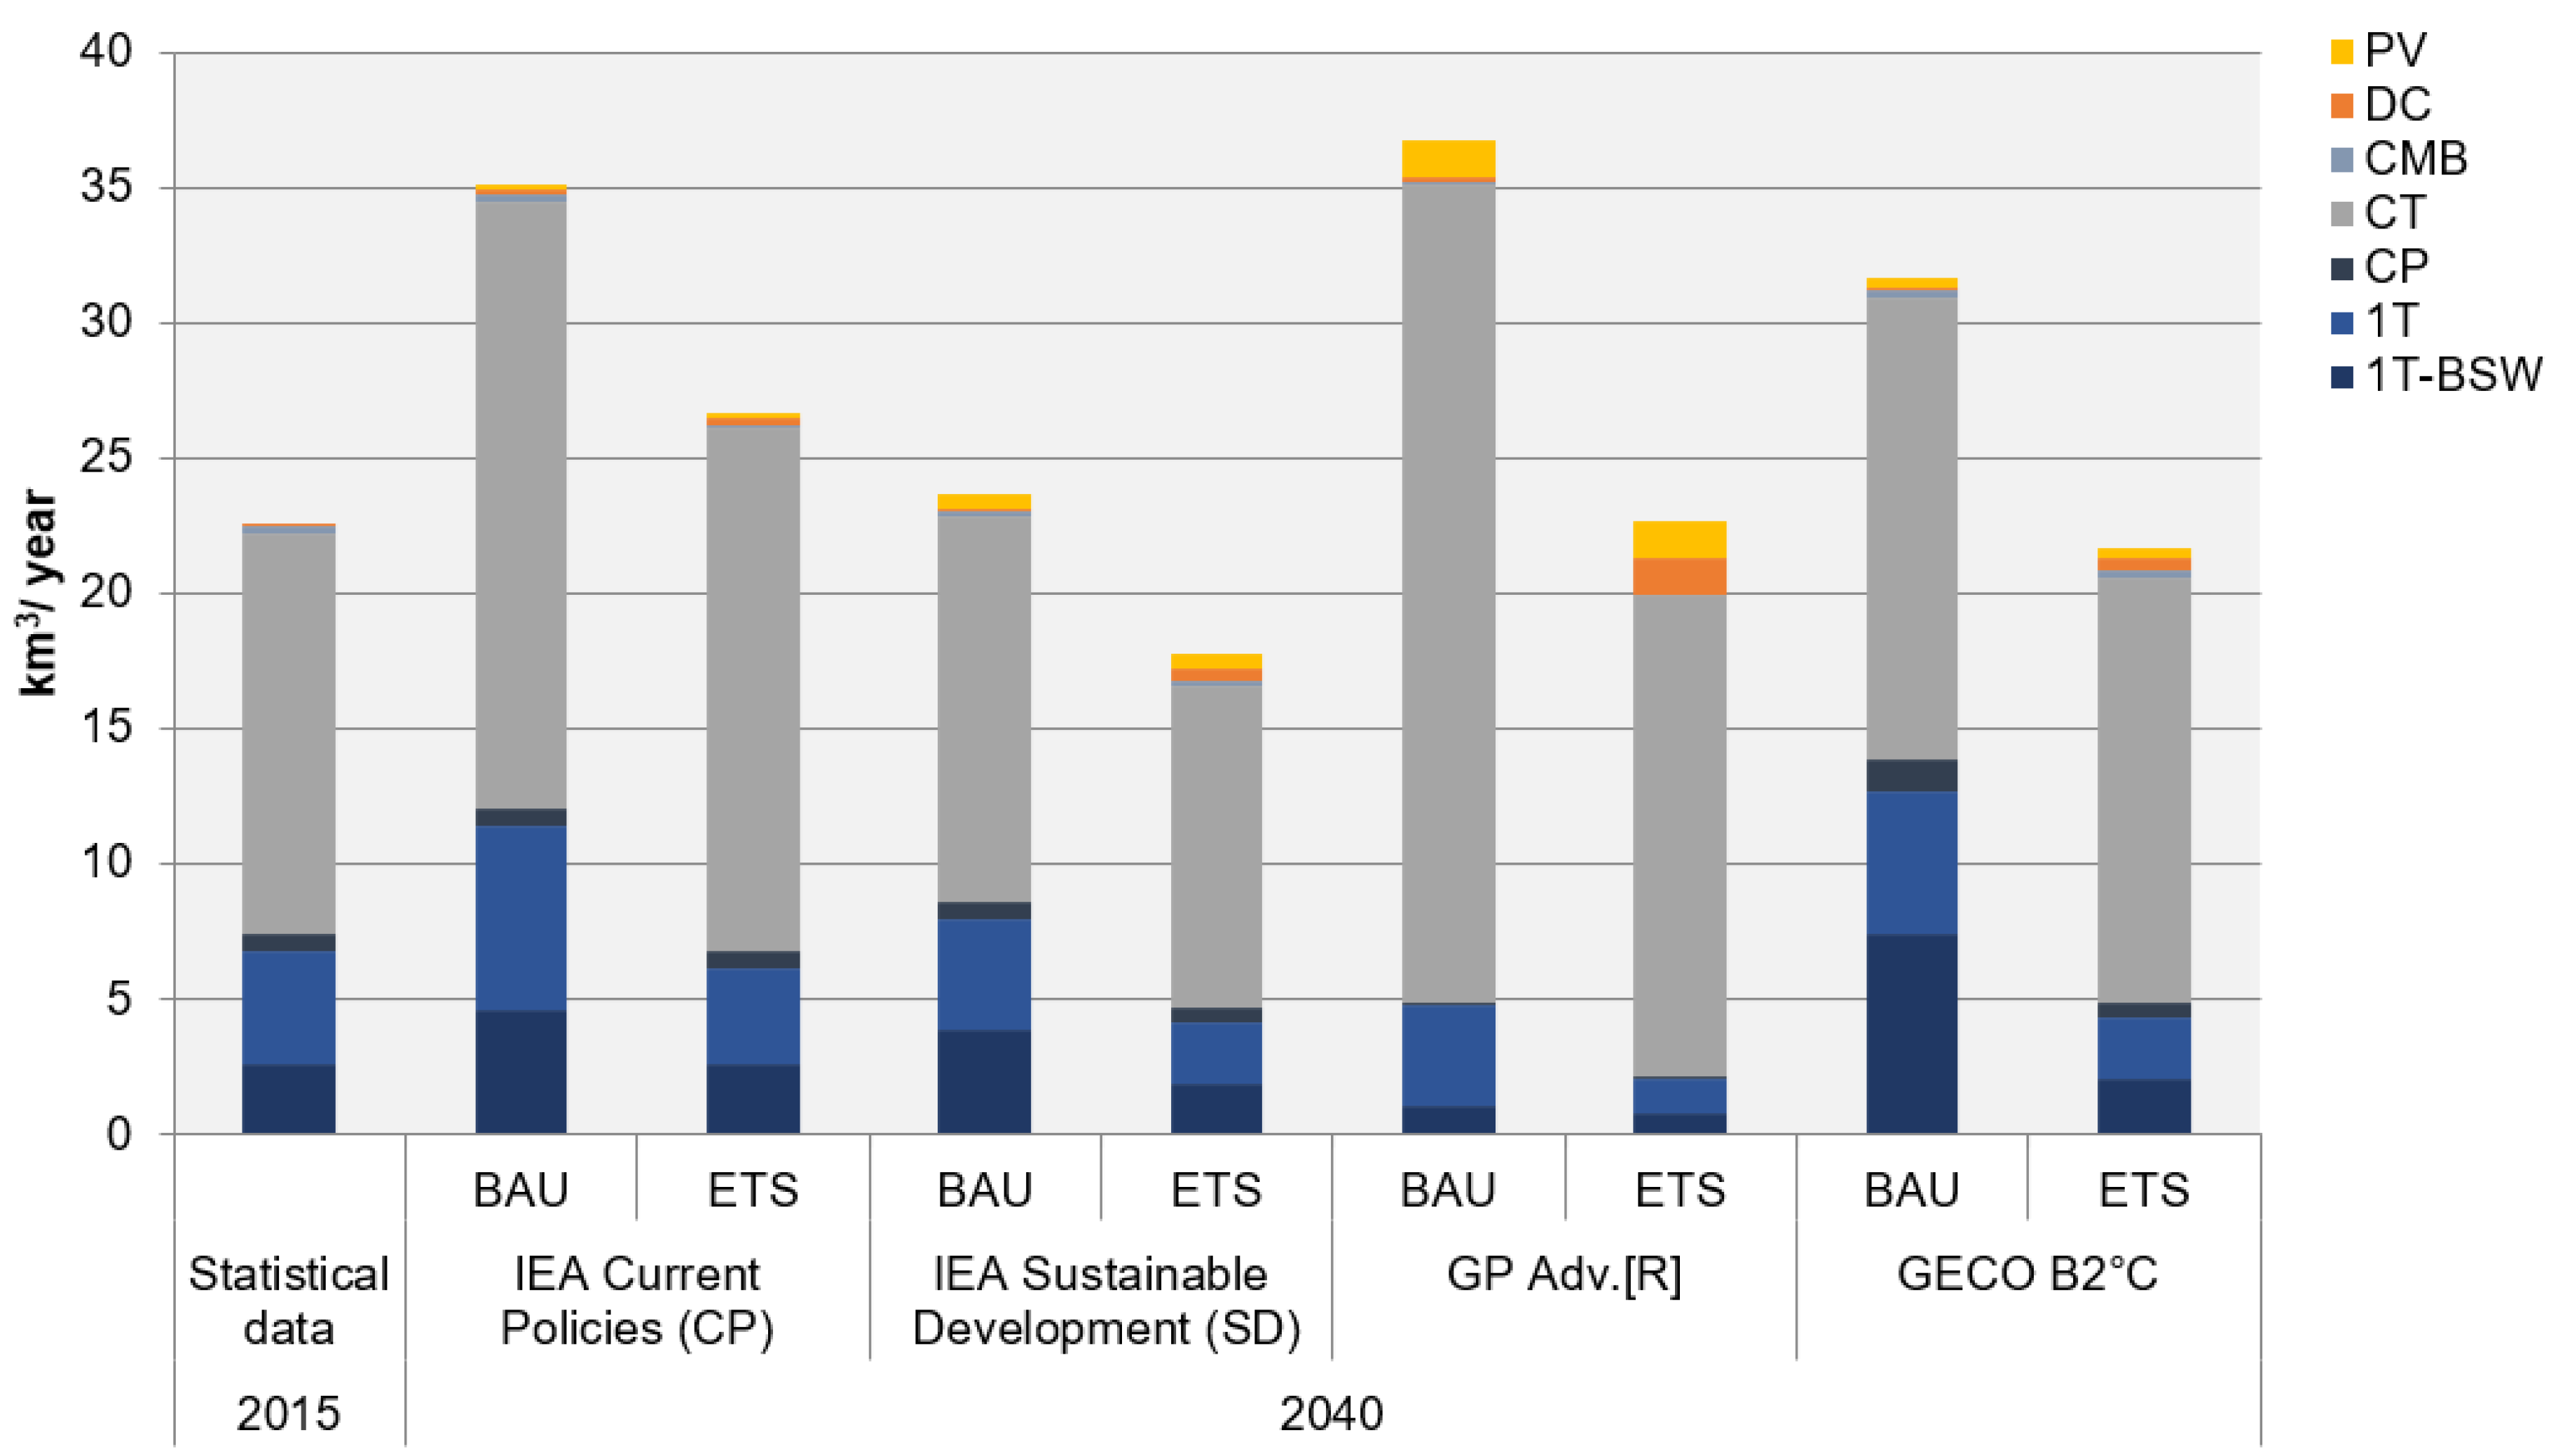
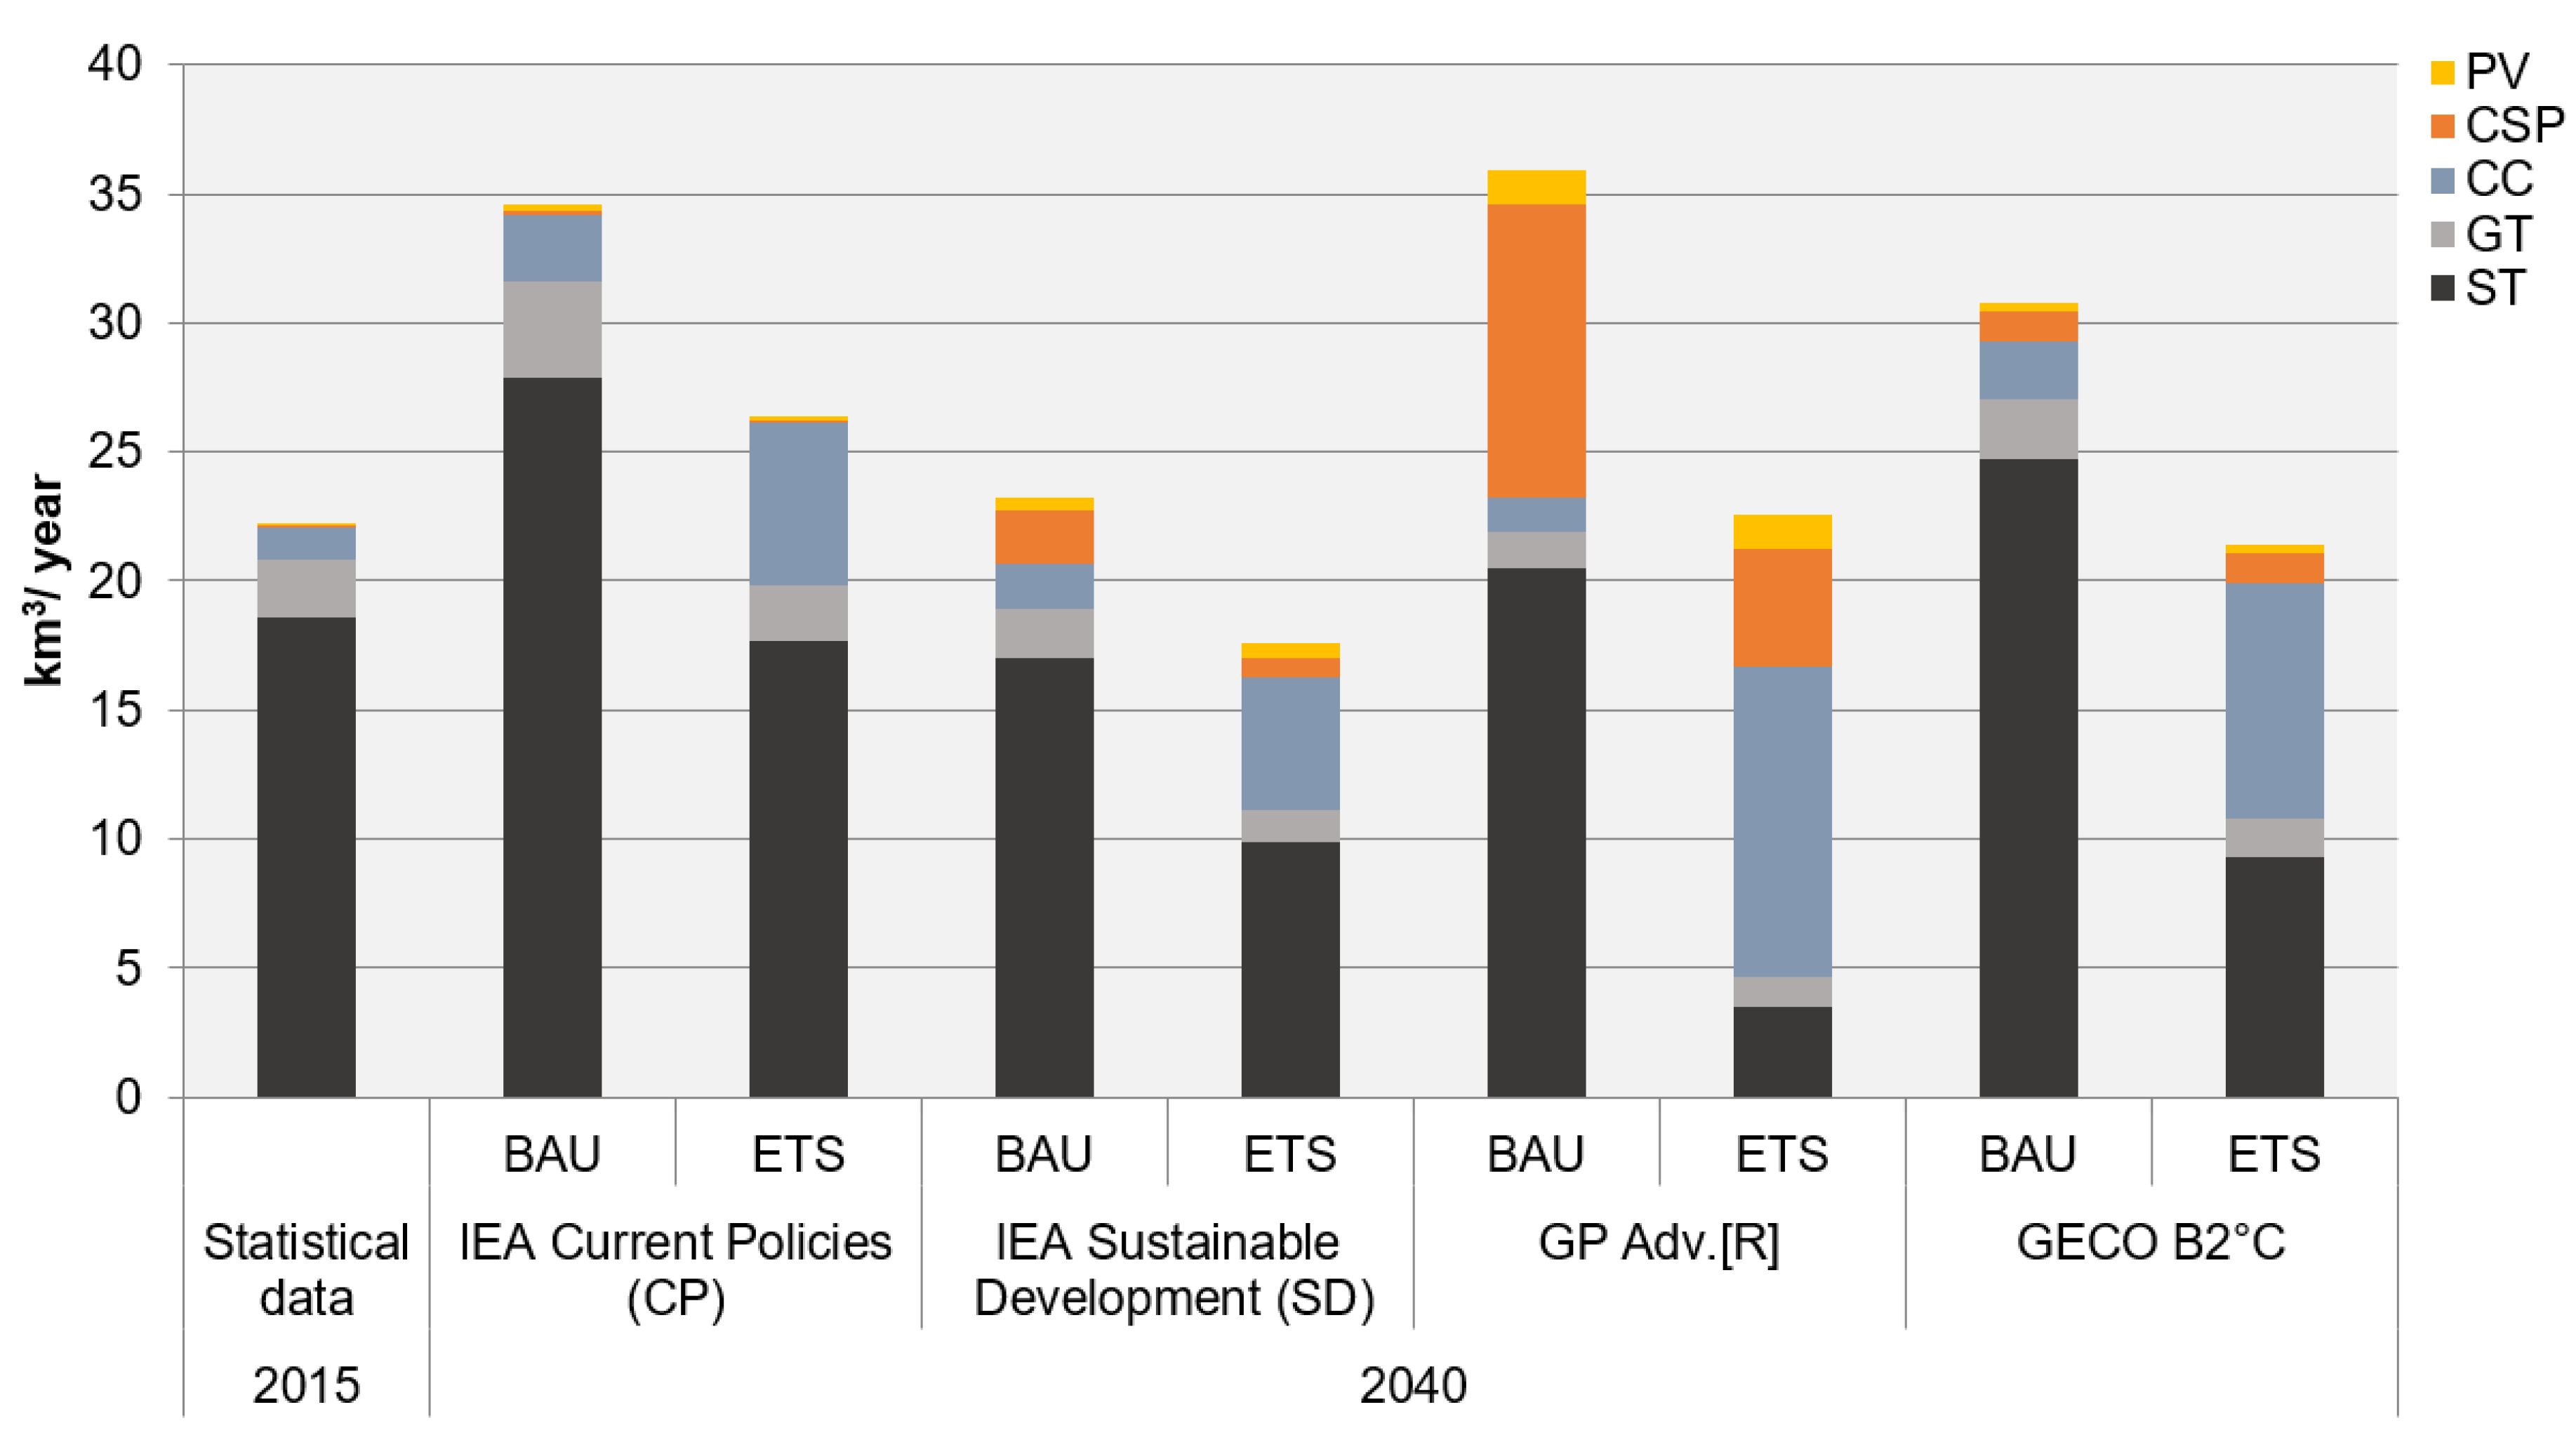
3.4. Impacts of Cooling and Electricity Generation Technologies on Global Water Consumption

This section examines the impact of the shift in cooling systems and power plant technologies on global water consumption for electricity generation. The assessment of water withdrawal and consumption of the different scenarios has already shown that water demand for electricity generation is particularly sensitive to changes in cooling and power generation technologies. In the BAU case, i.e., without deployment of improved cooling systems, water consumption will be higher in 2040 (by 24% to 36%) for the same electricity mix.
Considering the shares of the various cooling systems in water consumption, it is evident that cooling with wet towers accounts for most of the water consumption in all scenarios (with shares of 54% to 82%) (Figure 6). This is due to the current prevalence of the technology and the transition from 1T cooling towards more efficient evaporation cooling systems, such as CT and DC, as foreseen in the ETS scenarios.
In the GP Adv. (R) scenarios and also to a lesser extent in the GECO B2° scenarios, the transition towards improved cooling systems (the ETS case) also highlights the amplified role of DC. DC has a very low water consumption intensity (Table A1) and the increased share of this technology (from almost no DC in 2015 to between 1% and 6% in 2040) illustrates that this technological shift is one option for significantly reducing water consumption for electricity generation. However, DC technologies have higher capital costs and are less efficient, increasing the total cost of electricity generation.
Figure 7 gives an overview of the allocation of water consumption for the power plant types used in the respective scenarios. The comparison of water consumption by electricity generation technology shows that in all but one scenario ST have the highest share of water consumption (56% to 84%). With the transition to improved water-efficient cooling systems and power plant types in the ETS scenario, newly built thermal power plants are equipped with CC power systems that are less water-intensive and reduce the share of water consumption in comparison with ST. In the most ambitious scenario in terms of renewable energy deployment, the GP Adv. (R) scenario, the change in the power generation technology results in a significantly higher share of water consumption by CC power plants (53%) than by ST (16%). Therefore, the expansion of CC power plants can meaningfully contribute to reducing water consumption for electricity generation.

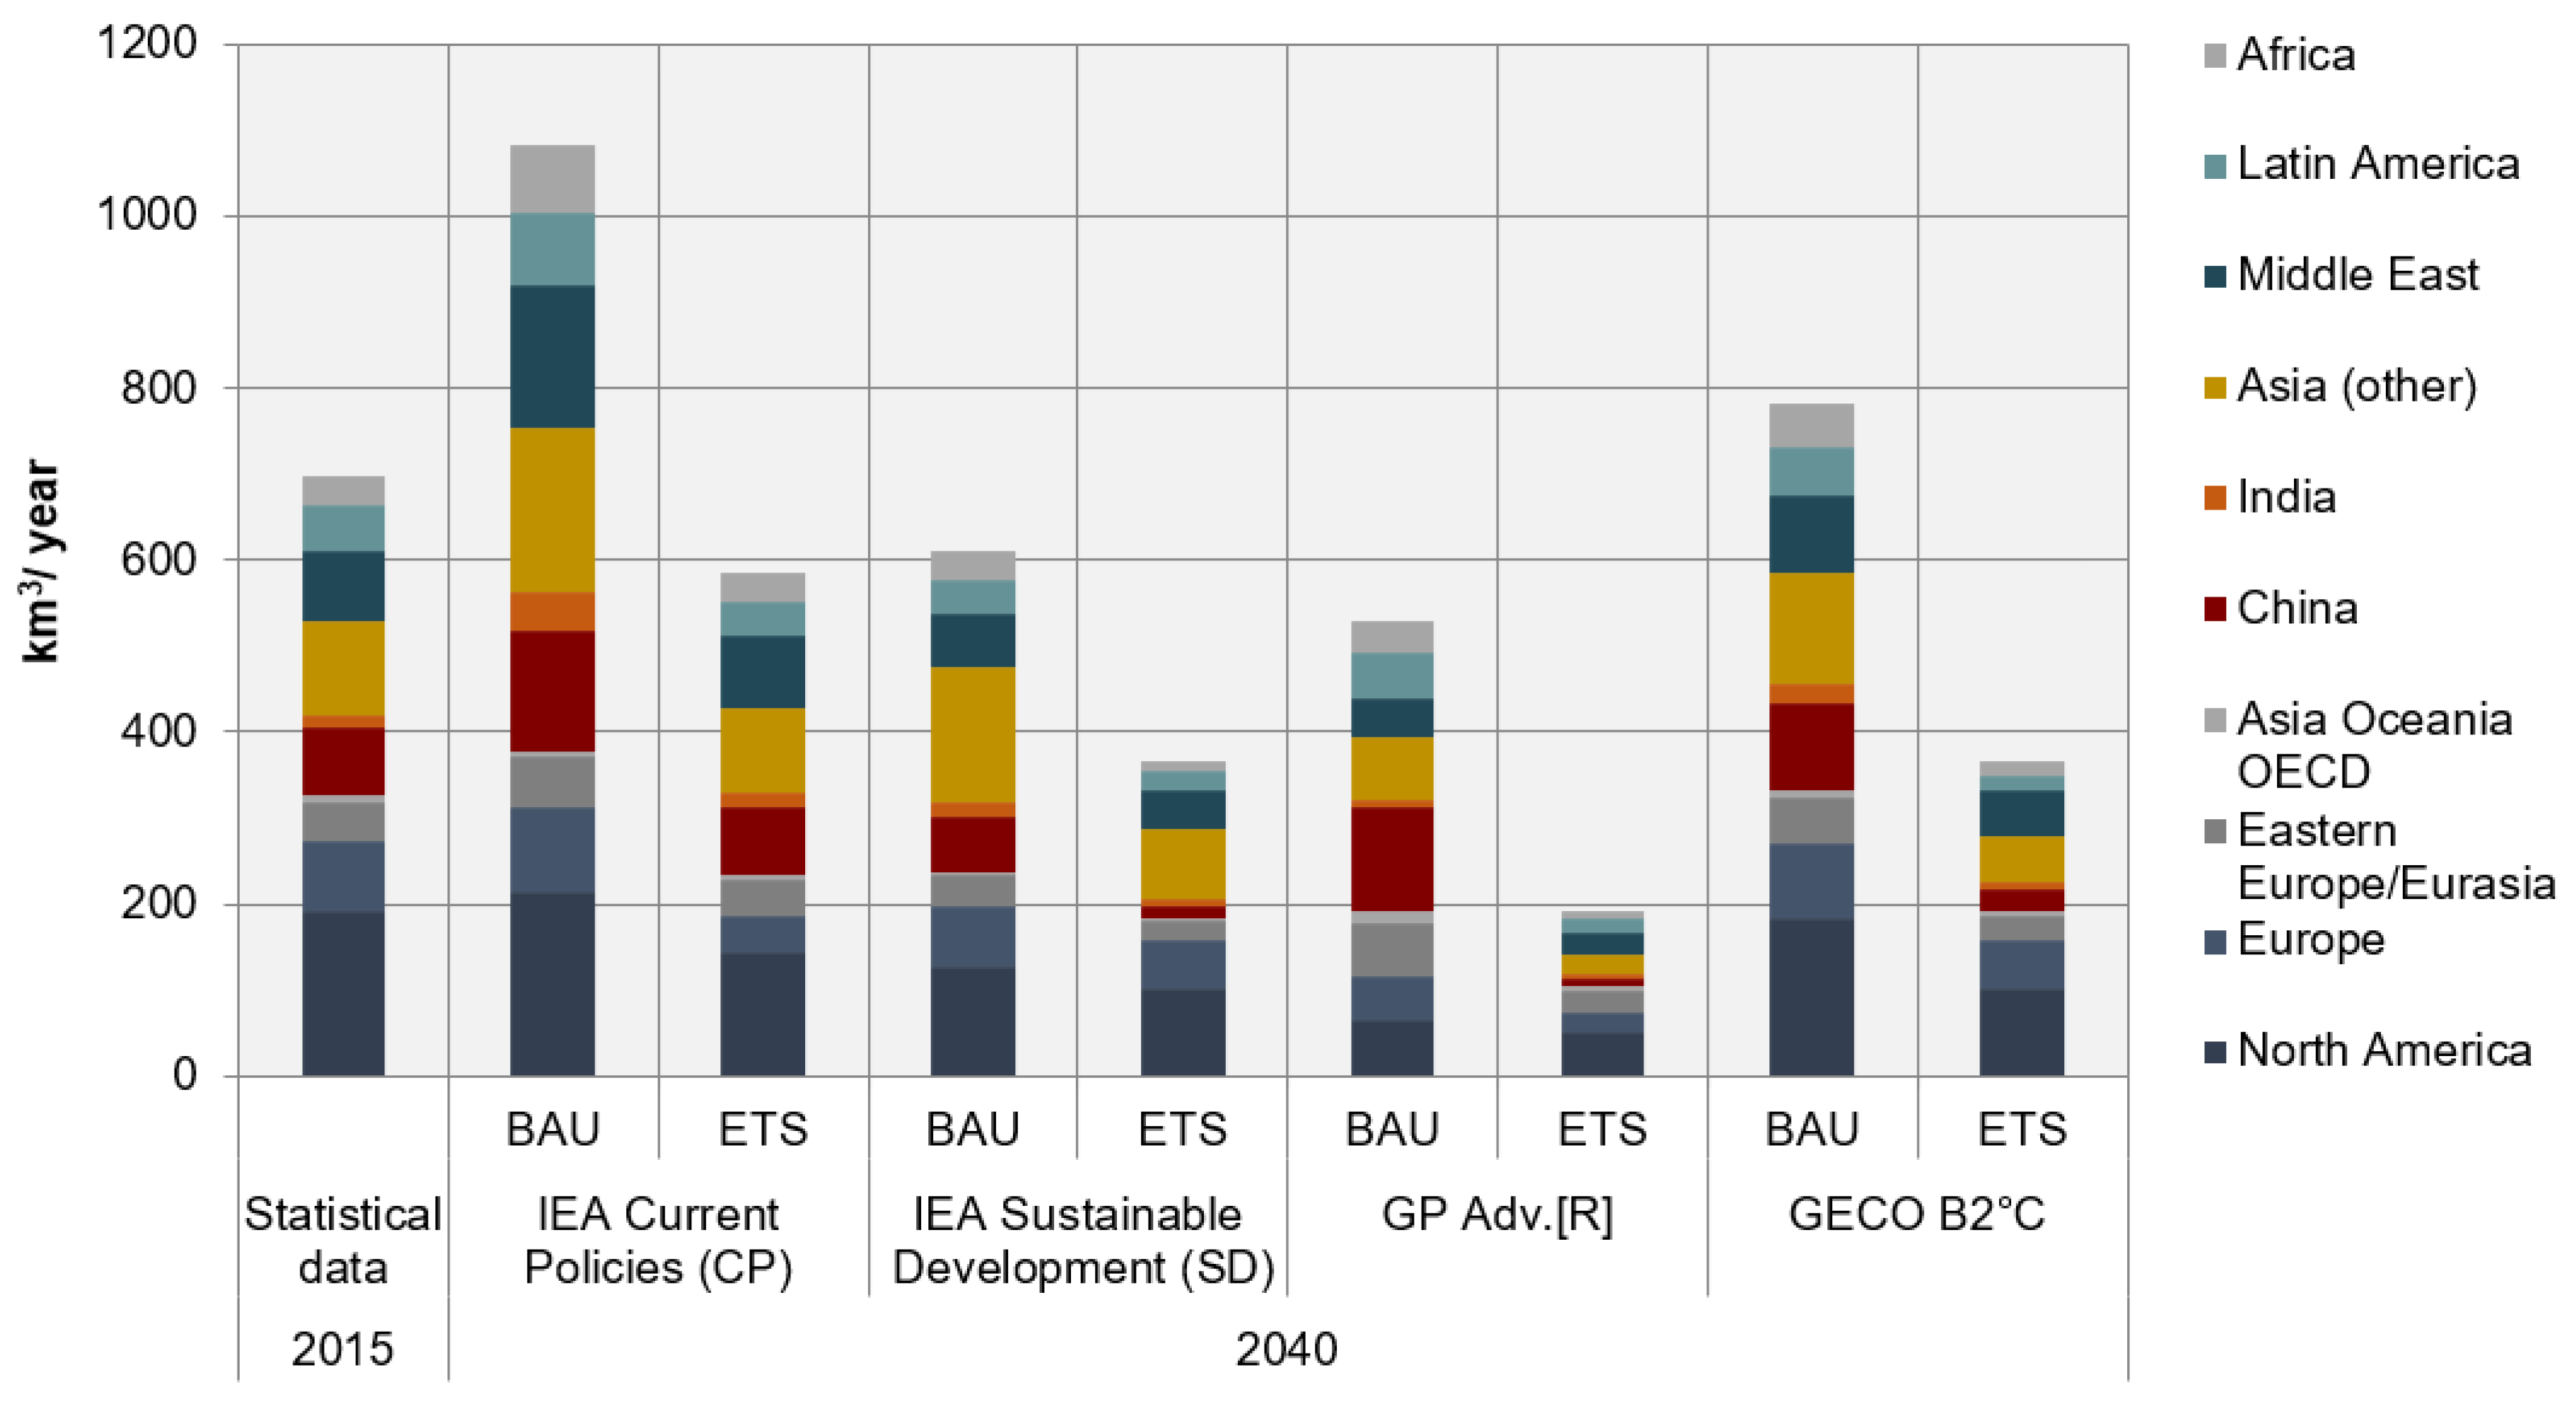
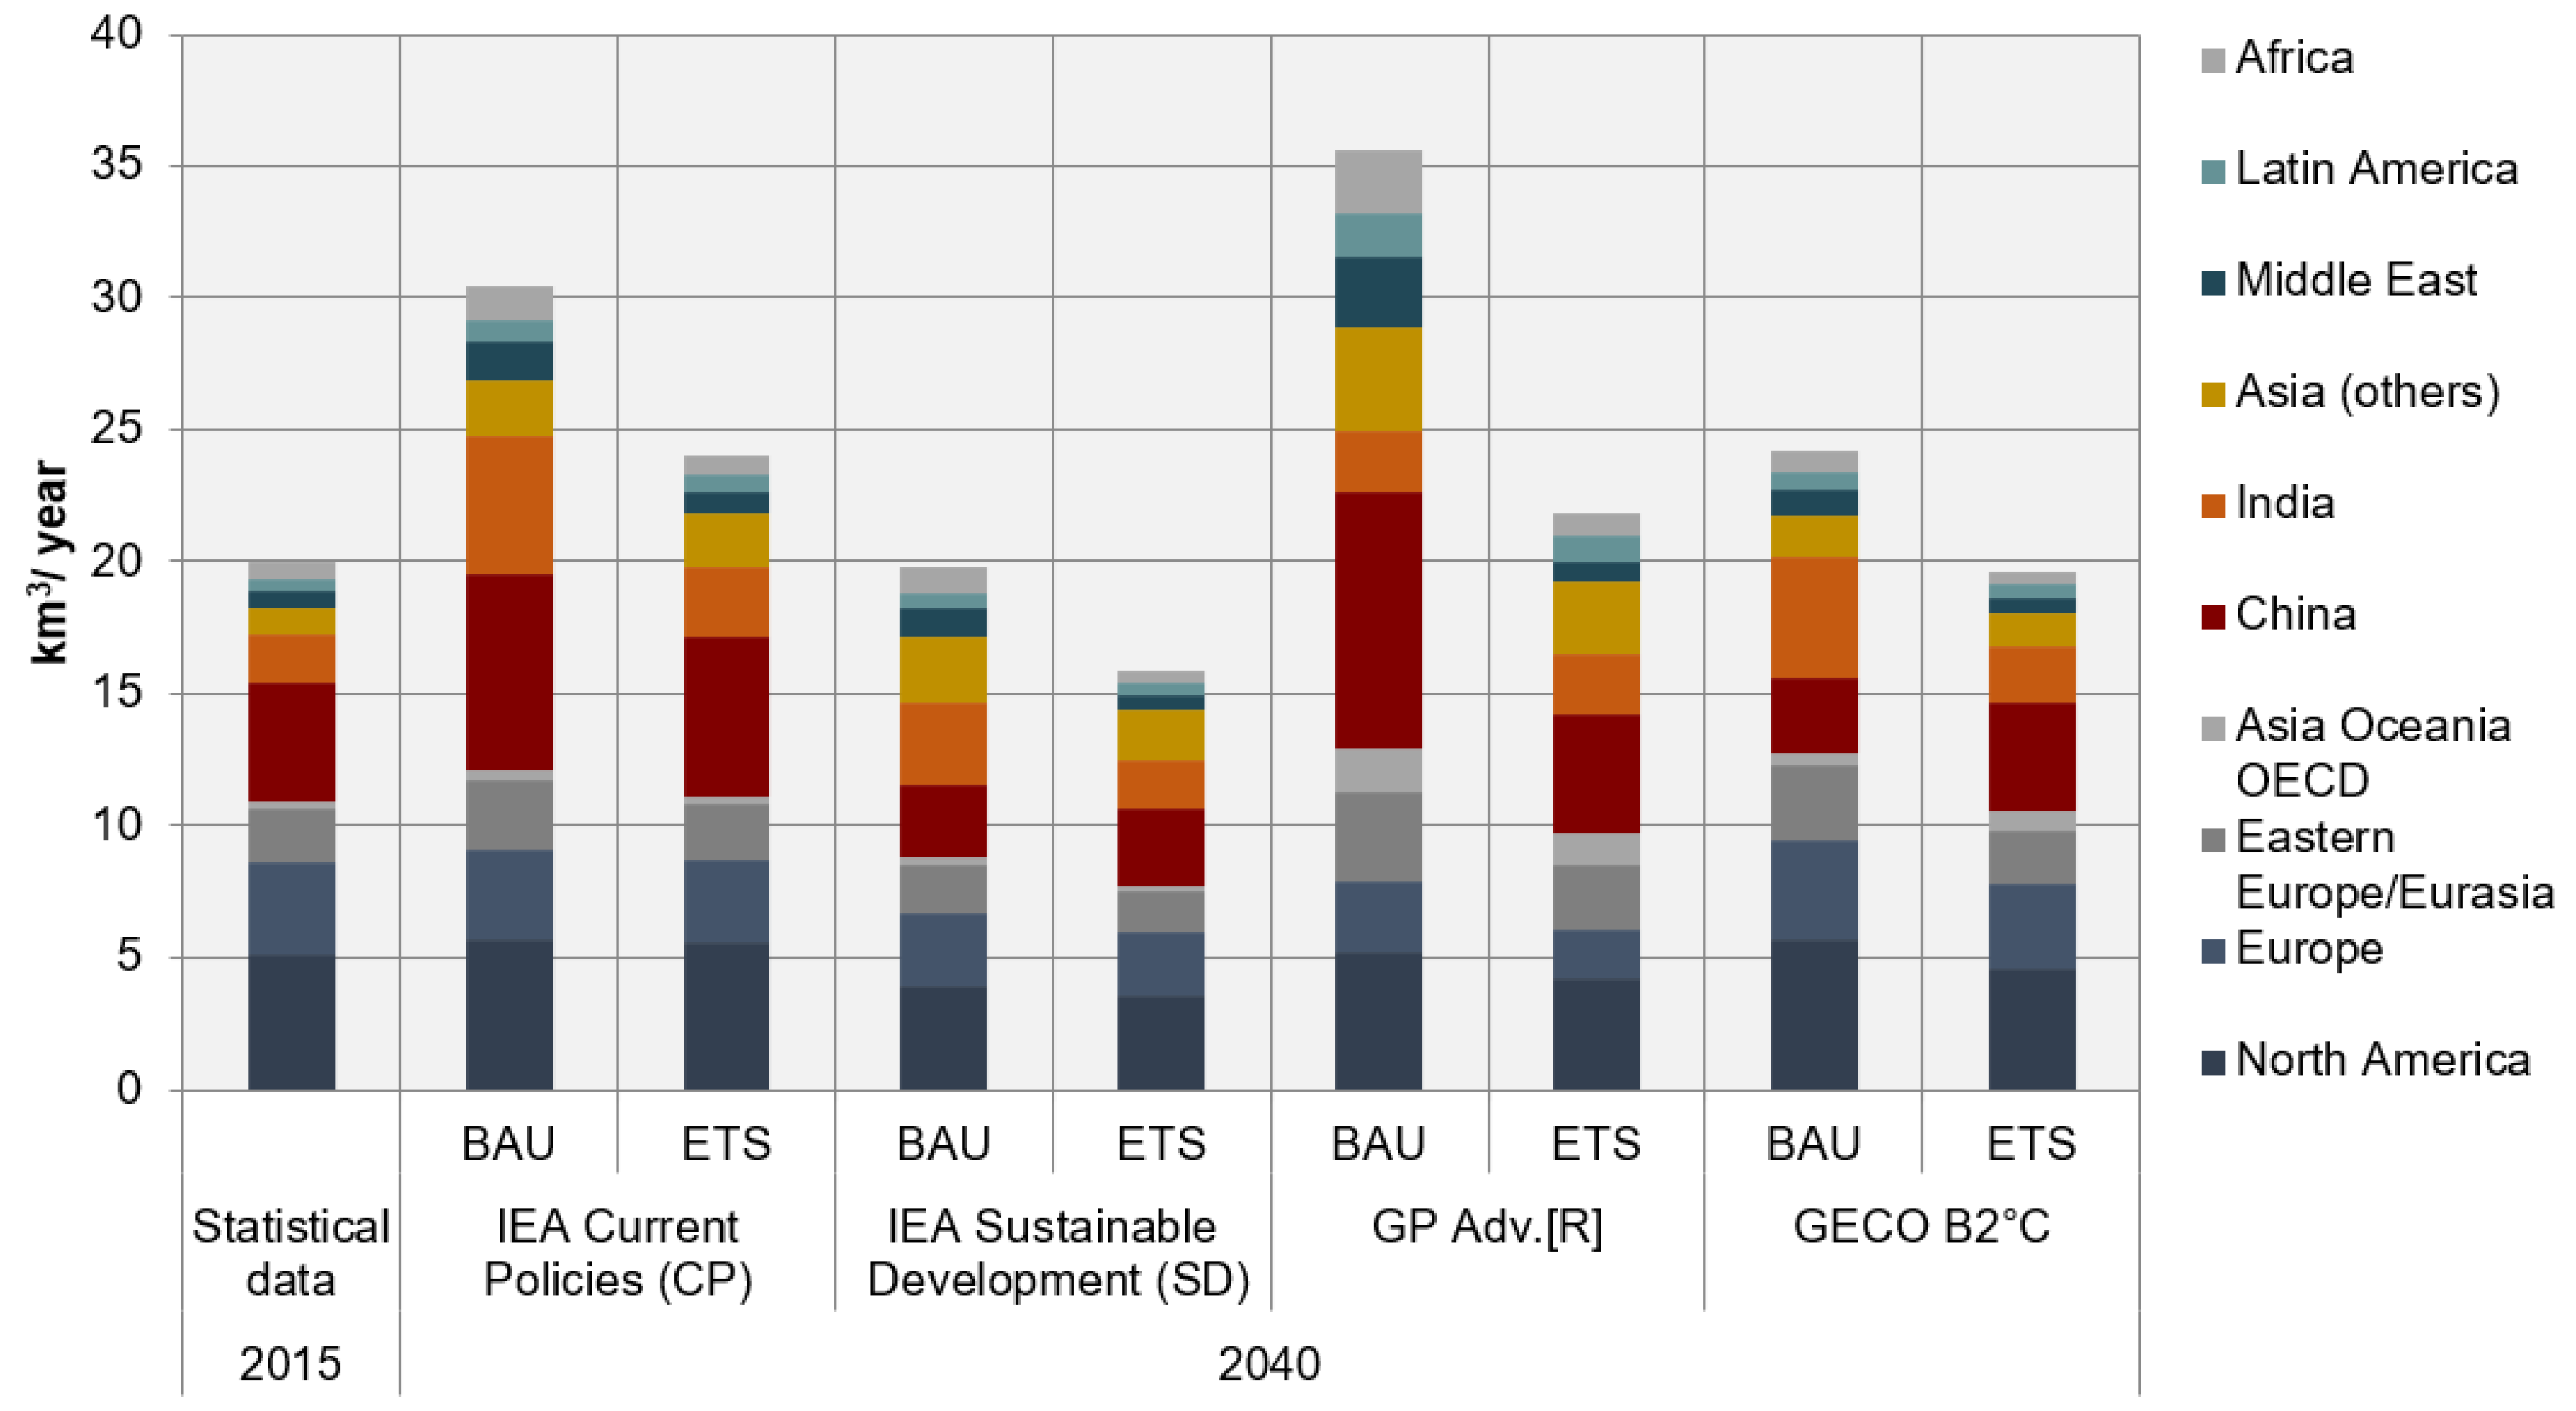
3.5. Impact of Electricity Generation Pathways on the Future Regional Water Demand

On the regional level, the analysis focuses on the development of water demand for electricity generation in ten regions. The shifts in electricity generation anticipated in the scenarios partially result in very different regional developments. Figure 8 illustrates the regional water withdrawal by scenario in 2040. North America is the only region that shows a consistent reduction in water withdrawal (5% to 74%) across all scenarios except for the reference scenario IEA CP BAU. The withdrawal reduction can mainly be attributed to the shift from 1T cooling systems to more efficient CT. Despite this decrease, North America remains the region with the highest share of global water withdrawal (20% to 28%) in six out of eight scenarios. A decrease in water withdrawal is also evident for most scenarios for Europe, Eastern Europe and Eurasia, as well as in Asia Oceania OECD. The developing and emerging regions, namely, China, India, Asia (other), the Middle East, Latin America, and Africa are characterized by a significant increase in water withdrawal for electricity generation in the scenarios with higher shares of fossil fuels (i.e., IEA CP BAU and GECO B2°C BAU). In the other scenarios, water withdrawal levels are likely to reduce in nearly all regions in the future. Exceptions are China in the GP Adv. (R) BAU scenario and Africa and Asia (other) in the IEA SD BAU scenario. The higher share of thermal-based electricity generation with the biomass without a shift to less water-intensive cooling and power generation technologies is the main reason for these increases. Overall, the results indicate that it is particularly important for the developing and emerging regions to combine renewable energy development with less water-intensive cooling technologies in order to reduce water withdrawal.
The results for water consumption vary markedly across the regions (Figure 9) depending on the scenario. In North America, four of the scenarios result in reduced water consumption by 11% to 31%, while four predict an increase of 1% to 11%. Seven scenarios predict a reduction in water consumption of 3% to 47% in Europe in 2040. In Europe, the reduction in water consumption can mainly be attributed to the decrease in the use of coal and oil in the electricity mix and to the phaseout of nuclear energy (in the GP Adv. (R) scenarios). Water consumption for renewable electricity generation increases in Europe in all the scenarios, yet remains lower than the use of water for fossil power generation in 2015 in all scenarios but the GP Adv. (R) BAU one.
Scenario results show large variations in water consumption for future electricity generation in China. The IEA CP and GP Adv. (R) scenarios anticipate an increase, while the IEA SD and the GECO B2°C show a decrease for both the BAU and ETS cases. In the IEA CP scenario, the growth is driven by increased water consumption for coal-based electricity production and in the GP Adv. (R) by an increase in electricity generation and the extension of thermal-based renewable power generation. In India, Asia (other), the Middle East, Latin America, and Africa, the growth in water consumption is substantial in all the scenarios except for the IEA SD ETS. The rise in water consumption in these regions is mainly driven by the rapid growth in electricity demand. In terms of technologies, natural gas, biomass, solar and (in the IEA SD and GECO B2°C scenarios) nuclear energy are the main drivers for the increase in water consumption in these regions. In the Middle East, for example, water consumption is mainly driven by natural gas and solar power expansion. For solar thermal capacities, which will mostly be newly constructed by 2040, the implementation of DC instead of wet cooling systems can significantly reduce water consumption. The regional analysis thereby shows similar developments as seen on the global level: water withdrawal and consumption can be significantly reduced, especially in the developing and emerging regions, with the implementation of more efficient cooling and electricity generation systems (ETS scenarios). This is important as increased water consumption for electricity generation across the decarbonization scenarios will pose significant challenges, because many regions already experience water stress. In order to avoid conflicts of water use for electricity generation and other sectors, water withdrawal and consumption should be essential determinants in the selection of energy sources, power plant types, and cooling systems.

4. Discussion

In this paper, water demand scenarios for different electricity futures are developed to systematically analyze the direct water demand for electricity generation in four global energy scenarios up to 2040. The results show that water demand varies significantly between different electricity mixes. Ambitious decarbonization scenarios with widescale deployment of renewables and a high electrification rate in key energy demanding sectors have the lowest water intensities, but in absolute terms, these systems can lead to higher water consumption levels than the less ambitious mitigation scenarios. The findings underline the importance of considering not only GHG emission reduction potential when designing future electricity systems, but also other environmental aspects—such as water demand—to ensure a holistically sustainable energy transition.
Furthermore, by comparing future technological pathways with changes in cooling and power plant technologies, this analysis highlights the importance of explicitly considering technological factors when envisioning the future development of energy systems. Previous studies on the water demand implications of future energy systems rarely discussed the variations in power plant technologies for different energy sources (e.g., [11,35]). By considering the variations in both electricity generation and cooling technologies, our results show that a better balance of sustainability goals in the energy, climate, and water domains can be achieved by combining highly energy-efficient power plant technologies with low water demand cooling technologies. Consequently, power plant technologies should also be explicitly considered when exploring the future water demand of global and regional energy systems. These issues could also be addressed at the scenario level. To the authors’ knowledge, there are no long-term energy scenarios to date that fully consider the water consumption of the modelled energy system. In order to take the nexus aspect into account, the common optimization with regard to climate targets could be extended to water consumption targets, which in turn raises methodological questions regarding a two-target optimization problem.
Next to the further research needed on the scenario level, the analysis also has some limitations in terms of scope, method, and obtainable input data. Only limited input data are available on current deployment rates of different cooling system types and water intensities of different technologies. Detailed information on power plant types is not provided in the scenario studies. Therefore, in order to estimate future shares of power plant types and cooling systems, two technology scenarios were introduced showing the range of possible plant types and cooling technology developments. These storylines can deviate from the original assumptions in the respective energy scenario models for the technology mix. However, this application of a uniform approach makes it possible to clearly show the influence of power plant types and cooling technologies for different fuel combinations.
In terms of scope, the study addressed only water demand, not water supply. Factors such as water intake, discharge quality, and water temperature were not part of this global and regional analysis, but it should be noted that these factors can play an important role in water consumption and withdrawal at the local or power plant levels and further research is needed to address their impact. In terms of water demand, other aspects are also important, such as the future levels of seawater use for cooling, the extent to which carbon capture and storage (CCS) technologies are deployed, the role of water efficiency innovations in the power sector and the indirect water demand of the power sector. These aspects were not quantified in this analysis, but are discussed briefly in the following sub-sections.

4.1. Seawater

Seawater can be used for cooling in power plants located close to the sea. Increasing the share of seawater for cooling can reduce demand for freshwater resources for electricity generation. Accordingly, a number of authors have anticipated an increased use of seawater for cooling in future [9,35]. At the same time, seawater use in cooling can affect the cooling infrastructure due to higher levels of scaling, corrosion, and biological infestation. In this analysis, seawater cooling is included in the water demand calculations, but no change in the share of seawater is assumed. This allows for the identification of the overall water demand for each energy scenario without introducing an additional variable. Although an increase in the share of seawater for cooling was not quantified, a higher share of seawater cooling should of course be considered as a strategy for reducing the pressure on freshwater resources.

4.2. Carbon Capture and Storage (CCS)

Another influencing factor in the water demand of future energy systems are GHG emission mitigation strategies using CCS at fossil power plants. CCS technologies require additional water for cooling and operation [53,54]. Estimates predict an increase from 19% to 62%in water consumption and from 23% to 68% in water withdrawal depending on the power plant and cooling system types to which CCS is applied [53]. In this analysis, the water demand for the deployment of the CCS technology is not quantified, as the scenarios only provide limited information about the expected extent of the CCS use. In the GP Adv. (R) scenario, the CCS technology is not included, as it is still in an early stage and costs and environmental impacts are not yet clear [40]. In the IEA scenarios, the CCS technology is expected to be implemented, but only to a limited extent in a small number of countries [2]. On the other hand, the GECO B2°C scenario cites CCS as an important technological component for reducing GHG emissions [41]. Implementation of the CCS technology on a large scale will significantly increase the future water demand of power plants. Therefore, further research should be conducted to analyze the effects of CCS on water consumption and withdrawal in future energy systems in detail.

4.3. Efficiency Improvements

Technological innovations can increase the water efficiency of power plants, thereby reducing water use intensity of electricity generation. However, in this study, water intensities of cooling technologies are assumed to be consistent up to 2040. This assumption is based on the findings of Davies et al. [7], who quantified three technology scenarios showing that although efficiency improvements and water-saving technologies can decrease water withdrawal and consumption, these reductions will only take effect in the long term (by 2095) even if their deployment starts in 2020. Nevertheless, at the local and power plant levels, technical options to reduce the water use intensity of power generation should be considered.

4.4. Indirect Water Demand for Power Generation

This analysis focuses on the direct water demand for electricity generation. In addition to this operational water demand, the indirect effect of power generation in the form of the water footprint outside the catchment area is also an important factor to consider. This includes, for example, the water required for the production of technology components, the extraction of primary energy carriers, but also the use of water in the cultivation of the biomass feedstock. Especially, the cultivation of biofuels can have area-wide effects on water use. While indirect water demand is out of the scope of this paper, further research that includes the entire supply chain and applies a spatially explicit lifecycle perspective has been conducted as part of the research project “Water resources as important factors in the energy transition at the local and global level”( WANDEL) [55].

5. Conclusions

The global energy transition that is required to reach the GHG reduction targets set in the Paris agreement imposes huge challenges all over the world. Yet, sustainability implies more than lowering GHG emission, electricity generation also requires water, but water is becoming an increasingly scarce resource in many regions worldwide. In order to ensure sustainable development, it is, therefore, important to understand the implications of the global energy transition on the direct operational water demand to generate electricity at the global and regional levels. However, as we show in this paper, the future structure of the power supply and thus the future water demand for power generation are subject to high levels of uncertainty. This is due to the fact that water withdrawal and consumption intensities of electricity generation vary significantly depending on the choices made in the coming years regarding power generation technologies and cooling systems. So far, however, most analyses of the water–energy nexus focus mainly on the water component of the nexus, in this case, the cooling technologies. This study also attempts to better understand the role of the energy component of the nexus, namely, the influence of the power plant type on the future operational water demand for power generation on the global scale.
To this end, water demand scenarios for the power sector up to 2040 were developed to assess the impact of different decarbonization strategies that are close to or consistent with the climate goal of limiting global warming to below 2 °C on the water demand of the power generation sector.
The results show that ambitious decarbonization scenarios involving wide-scale deployments of renewables and a high electrification rate of the end use achieve the lowest water intensities, but can, in absolute terms, consume more water than less ambitious mitigation scenarios in combination with more inefficient power plant and cooling technologies. The study concludes that energy transition strategies should take into account not only the potential to reduce GHG, but also the water demand of the future energy system. Finally, the different technological options for both power plants and cooling systems should be explicitly considered when designing and evaluating future electricity systems.

Author Contributions

Conceptualization, J.C.T.-P. and W.O.; Methodology, J.C.T.-P. and W.O.; Software, E.K.; Validation, E.K. and M.F.; Writing—Original Draft Preparation, J.C.T.-P.; Writing—Review & Editing, W.O, P.V. and M.F.; Supervision, P.V. and M.F. All authors have read and agreed to the published version of the manuscript.

Funding

The authors gratefully acknowledge the financial support of the German Federal Ministry of Education and Research (BMBF) (grant No. 02WGR1430E).

Conflicts of Interest

The authors declare no conflict of interest

Appendix A

Table A1. Applied water use intensity per unit of electricity output (m3/MWh) by energy source and generation technology. The sole responsibility for the content of this paper lies with the authors.
Energy SourcePower Plant TypeCooling SystemCooling Water Requirement (m3/MWh)
WithdrawalConsumption
CoalST1T-BSW89.7880.410
1T85.5120.390
CMB80.0000.390
CP56.9550.159
CT2.3051.866
DC0.1320.132
GT1T-BSW144.4800.993
1T137.6000.946
CT3.8042.601
CC1T-BSW3.9942.731
1T43.0780.379
CT0.9580.750
Dry0.0080.008
Natural gasST1T-BSW139.1130.953
1T132.4890.908
CMB80.0000.908
CP1.7031.476
CT4.5543.127
Dry0.1320.132
GT1T-BSW139.1130.953
1T132.4890.908
CT4.5543.127
Dry0.1320.132
CC1T-BSW45.2320.398
1T43.0780.379
CP22.5230.908
CT0.9580.750
Dry0.0080.008
OilST1T-BSW139.1130.953
1T132.4890.908
CP26.6872.309
CT4.5543.127
Dry0.1320.132
GT1T-BSW139.1130.953
1T132.4890.908
CT4.5543.127
CP22.5230.908
DC0.1320.132
CC1T-BSW45.2320.398
1T43.0780.379
CT0.9580.750
DC0.0080.008
NuclearST1T-BSW176.2771.069
1T167.8831.018
CMB100.0002.000
CP26.6872.309
CT4.1682.544
Dry0.1320.132
CC1T-BSW105.7660.641
1T100.7300.611
CMB60.0001.200
CP16.0121.385
CT2.5011.526
DC0.0790.079
Biomass **ST1T-BSW139.1131.193
1T132.4891.136
CMB80.0001.136
CT3.3242.093
Dry0.1320.132
GT1T-BSW139.1131.193
1T132.4891.136
CT3.3240.890
CC1T-BSW45.2320.398
1T43.0780.379
CT0.9580.750
Dry0.0080.008
GeothermalST/Others1T-BSW139.1130.953
1T132.4890.908
CP6.8201.480
CT6.8206.820
DC0.6700.670
SolarCSPCT3.2743.274
Dry0.0980.098
PV *none0.0980.098
Wind none0.0000.000
Hydro ** none0.00017.000
(Power plants: ST = steam turbine; GT = gas turbine; CC = combined cycle; CSP = concentrated solar power; PV = photovoltaic. Cooling systems: 1T-BSW = once-through with non-freshwater resources; 1T = once-through; CMB = combined-cooling system; CP = cooling pond; CT = cooling tower; DC = dry cooling.); * Values for PV correspond to the water needs for cleaning and operation.; ** Values for the biomass refer only to the operation of the cooling systems.; (Source: WaterGAP3 model based on [9,43,56,57]).

References

  1. Rodriguez, D.J.; Delgado, A.; DeLaquil, P.; Sohns, A. Thirsty Energy; Water Papers; World Bank: Washington, DC, USA, 2013. [Google Scholar]
  2. OECD/IEA. Water-Energy Nexus; World Energy Outlook 2016 Excerpt; International Energy Agency: Paris, France, 2016. [Google Scholar]
  3. IRENA. Renewable Energy in the Water, Energy and Food Nexus; International Renewable Energy Agency: Abu Dhabi, UAE, 2015. [Google Scholar]
  4. Roehrkasten, S.; Schaeuble, D.; Helgenberger, S. Secure and Sustainable Power Generation in a Water-Constrained World. In Proceedings of the South African International Renewable Energy Conference, Cape Town, South Africa, 4–7 October 2015. [Google Scholar]
  5. Förster, H.; Lilliestam, J. Modeling thermoelectric power generation in view of climate change. Reg. Environ. Chang. 2010, 10, 327–338. [Google Scholar] [CrossRef]
  6. Bauer, N.; Calvin, K.; Emmerling, J.; Fricko, O.; Fujimori, S.; Hilaire, J.; De Boer, H.S. Shared socio-economic pathways of the energy sector–quantifying the narratives. Glob. Environ. Chang. 2017, 42, 316–330. [Google Scholar] [CrossRef] [Green Version]
  7. Davies, E.G.; Kyle, P.; Edmonds, J.A. An integrated assessment of global and regional water demands for electricity generation to 2095. Adv. Water Resour. 2013, 52, 296–313. [Google Scholar] [CrossRef]
  8. Van Vuuren, D.P.; Nakicenovic, N.; Riahi, K.; Brew-Hammond, A.; Kammen, D.; Modi, V.; Smith, K.R. An energy vision: The transformation towards sustainability—Interconnected challenges and solutions. Curr. Opin. Environ. Sustain. 2012, 4, 18–34. [Google Scholar] [CrossRef]
  9. Kyle, P.; Davies, E.G.; Dooley, J.J.; Smith, S.J.; Clarke, L.E.; Edmonds, J.A.; Hejazi, M. Influence of climate change mitigation technology on global demands of water for electricity generation. Int. J. Greenh. Gas Control 2013, 13, 112–123. [Google Scholar] [CrossRef]
  10. Dooley, J.J.; Kyle, P.; Davies, E.G. Climate mitigation’s impact on global and regional electric power sector water use in the 21st Century. Energy Procedia 2013, 37, 2470–2478. [Google Scholar] [CrossRef] [Green Version]
  11. Jin, Y.; Behrens, P.; Tukker, A.; Scherer, L. Water use of electricity technologies: A global meta-analysis. Renew. Sustain. Energy Rev. 2019, 115, 109391. [Google Scholar] [CrossRef]
  12. Kummu, M.; Guillaume, J.H.A.; De Moel, H.; Eisner, S.; Flörke, M.; Porkka, M.; Ward, P.J. The world’s road to water scarcity: Shortage and stress in the 20th century and pathways towards sustainability. Sci. Rep. 2016, 6, 38495. [Google Scholar] [CrossRef] [Green Version]
  13. IEA. Making the Energy Sector More Resilient to Climate Change; OECD/IEA: Paris, France, 2015. [Google Scholar]
  14. Schaeffer, R.; Szklo, A.S.; De Lucena, A.F.P.; Borba, B.S.M.C.; Nogueira, L.P.P.; Fleming, F.P.; Boulahya, M.S. Energy sector vulnerability to climate change: A review. Energy 2012, 38, 1–12. [Google Scholar] [CrossRef]
  15. Chandel, M.K.; Pratson, L.F.; Jackson, R.B. The potential impacts of climate-change policy on freshwater use in thermoelectric power generation. Energy Policy 2011, 39, 6234–6242. [Google Scholar] [CrossRef]
  16. Strzepek, K.M.; Baker, J.; Farmer, W.; Schlosser, C.A. Modeling Water Withdrawal and Consumption for Electricity Generation in the United States; Joint Program Report Series Report 222; MIT Joint Program on the Science and Policy of Global Change: Cambridge, MA, USA, 2012. [Google Scholar]
  17. Baker, J.; Strzepek, K.; Farmer, W.; Schlosser, C.A. Quantifying the impact of renewable energy futures on cooling water use. JAWRA J. Am. Water Resour. Assoc. 2014, 50, 1289–1303. [Google Scholar] [CrossRef]
  18. Liu, L.; Hejazi, M.; Patel, P.; Kyle, P.; Davies, E.; Zhou, Y.; Clark, L.; Edmonds, J. Water demands for electricity generation in the US: Modeling different scenarios for the water-energy nexus. Technol. Forecast. Soc. Chang. 2015, 94, 318–334. [Google Scholar] [CrossRef] [Green Version]
  19. Talati, S.; Zhai, H.; Kyle, G.P.; Morgan, M.G.; Patel, P.; Liu, L. Consumptive water use from electricity generation in the southwest under alternative climate, technology, and policy futures. Environ. Sci. Technol. 2016, 50, 12095–12104. [Google Scholar] [CrossRef] [PubMed]
  20. Lin, L.; Chen, Y.D. Evaluation of Future Water Use for Electricity Generation under Different Energy Development Scenarios in China. Sustainability 2017, 10, 30. [Google Scholar] [CrossRef] [Green Version]
  21. Liao, X.; Hall, J.W.; Eyre, N. Water use in China’s thermoelectric power sector. Glob. Environ. Chang. 2016, 41, 142–152. [Google Scholar] [CrossRef]
  22. Zheng, X.; Wang, C.; Cai, W.; Kummu, M.; Varis, O. The vulnerability of thermoelectric power generation to water scarcity in China: Current status and future scenarios for power planning and climate change. Appl. Energy 2016, 171, 444–455. [Google Scholar] [CrossRef]
  23. Van Vliet, M.T.; Yearsley, J.R.; Ludwig, F.; Vögele, S.; Lettenmaier, D.P.; Kabat, P. Vulnerability of US and European electricity supply to climate change. Nat. Clim. Chang. 2012, 2, 676. [Google Scholar] [CrossRef]
  24. Byers, E.A.; Hall, J.W.; Amezaga, J.M. Electricity generation and cooling water use: UK pathways to 2050. Glob. Environ. Chang. 2014, 25, 16–30. [Google Scholar] [CrossRef] [Green Version]
  25. Murrant, D.; Quinn, A.; Chapman, L.; Heaton, C. Water use of the UK thermal electricity generation fleet by 2050: Part 1 identifying the problem. Energy Policy 2017, 108, 844–858. [Google Scholar] [CrossRef]
  26. Murrant, D.; Quinn, A.; Chapman, L.; Heaton, C. Water use of the UK thermal electricity generation fleet by 2050: Part 2 quantifying the problem. Energy Policy 2017, 108, 859–874. [Google Scholar] [CrossRef]
  27. Mitra, B.K.; Bhattacharya, A.; Zhou, X. A critical review of long term water energy nexus in India. In Proceedings of the Nexus 2014: Water, Food, Climate and Energy Conference, Chapel Hill, NC, USA, 3–7 March 2014. [Google Scholar]
  28. Flörke, M.; Bärlund, I.; Kynast, E. Will climate change affect the electricity production sector? A European study. J. Water Clim. Chang. 2012, 3, 44–54. [Google Scholar] [CrossRef]
  29. Srinivasan, S.; Kholod, N.; Chaturvedi, V.; Ghosh, P.P.; Mathur, R.; Clarke, L.; Liu, B. Water for electricity in India: A multi-model study of future challenges and linkages to climate change mitigation. Appl. Energy 2018, 210, 673–684. [Google Scholar] [CrossRef]
  30. Senger, M.; Spataru, C. Water-energy-land nexus-modelling long-term scenarios for Brazil. In Proceedings of the 2015 IEEE European Modelling Symposium (EMS), Madrid, Spain, 6–8 October 2015; pp. 266–271. [Google Scholar]
  31. Thopil, G.A.; Pouris, A. A 20 year forecast of water usage in electricity generation for South Africa amidst water scarce conditions. Renew. Sustain. Energy Rev. 2016, 62, 1106–1121. [Google Scholar] [CrossRef] [Green Version]
  32. Damerau, K.; Van Vliet, O.P.; Patt, A.G. Direct impacts of alternative energy scenarios on water demand in the Middle East and North Africa. Clim. Chang. 2015, 130, 171–183. [Google Scholar] [CrossRef]
  33. World Energy Council. Water for Energy; World Energy Council: London, UK, 2010. [Google Scholar]
  34. Fricko, O.; Parkinson, S.C.; Johnson, N.; Strubegger, M.; Van Vliet, M.T.; Riahi, K. Energy sector water use implications of a 2 C climate policy. Environ. Res. Lett. 2016, 11, 034011. [Google Scholar] [CrossRef]
  35. Ando, N.; Yoshikawa, S.; Fujimori, S.; Kanae, S. Long-term projections of global water use for electricity generation under the shared socioeconomic pathways and climate mitigation scenarios. Hydrol. Earth Syst. Sci. Discuss 2017, 2017, 1–25. [Google Scholar]
  36. Samadi, S.; Terrapon-Pfaff, J.; Lechtenböhmer, S.; Knoop, K. Long-term low greenhouse gas emission development strategies for achieving the 1.5 °C target—Insights from a comparison of German bottom-up energy scenarios. Carbon Manag. 2018, 9, 549–562. [Google Scholar] [CrossRef] [Green Version]
  37. Keles, D.; Möst, D.; Fichtner, W. The development of the German energy market until 2030—A critical survey of selected scenarios. Energy Policy 2011, 39, 812–825. [Google Scholar] [CrossRef]
  38. IEA/OECD. World Energy Outlook 2017; IEA/OECD: Paris, France, 2017. [Google Scholar]
  39. Teske, S.; Pregger, T.; Simon, S.; Naegler, T.; Crijns-Graus, W.H.; Lins, C. Energy [R]evolution 2010—A sustainable world energy outlook. Energy Effic. 2010, 4, 409–433. [Google Scholar] [CrossRef] [Green Version]
  40. Kitous, A.; Keramidas, K.; Vandyck, T.; Saveyn, B.; Van Dingenen, R.; Spadaro, J.; Holland, M. Global Energy and Climate Outlook 2017: How Climate Policies Improve Air Quality—Global Energy Trends and Ancillary Benefits of the Paris Agreement; EUR 28798 EN; Publications Office of the European Union: Luxembourg, 2017; ISBN 978-92-79-73864-7. [Google Scholar] [CrossRef]
  41. Flörke, M.; Kynast, E.; Bärlund, I.; Eisner, S.; Wimmer, F.; Alcamo, J. Domestic and industrial water uses of the past 60 years as a mirror of socio-economic development: A global simulation study. Glob. Environ. Chang. 2013, 23, 144–156. [Google Scholar] [CrossRef]
  42. Eisner, S. Comprehensive Evaluation of the WaterGAP3 Model Across Climatic, Physiographic, and Anthropogenic Gradients. Ph.D. Thesis, University of Kassel, Kassel, Germnay, 2016. [Google Scholar]
  43. Müller Schmied, H.; Eisner, S.; Franz, D.; Wattenbach, M.; Portmann, F.T.; Flörke, M.; Döll, P. Sensitivity of simulated global-scale freshwater fluxes and storages to input data, hydrological model structure, human water use and calibration. Hydrol. Earth Syst. Sci. Discuss. 2014, 11, 1583–1649. [Google Scholar] [CrossRef] [Green Version]
  44. Aus der Beek, T.; Flörke, M.; Lapola, D.M.; Schaldach, R. Modelling historical and current irrigation water demand on the continental scale: Europe. Adv. Geosci. 2010, 27, 79–85. [Google Scholar] [CrossRef] [Green Version]
  45. Bergesen, C. UDI World Electric Power Plants Data Base; Platts: Washington, DC, USA, 2010. [Google Scholar]
  46. Macknick, J.; Newmark, R.; Heath, G.; Hallett, K.C. Operational water consumption and withdrawal factors for electricity generating technologies: A review of existing literature. Environ. Res. Lett. 2012, 7, 045802. [Google Scholar] [CrossRef]
  47. Cooley, H.; Fulton, J.; Gleick, P.H.; Ross, N.; Luu, P. Water for Energy: Future Water Needs for Electricity in the Intermountain West; Pacific Institute: Oakland, CA, USA, 2011. [Google Scholar]
  48. Pan, S.Y.; Snyder, S.W.; Packman, A.I.; Lin, Y.J.; Chiang, P.C. Cooling water use in thermoelectric power generation and its associated challenges for addressing water-energy nexus. Water-Energy Nexus 2018, 1, 26–41. [Google Scholar] [CrossRef]
  49. Lin, L.; Chen, Y.D. Evaluation of Future Water Use for Electricity Generation under Different Energy Development Scenarios in China. Sustainability 2018, 10, 30. [Google Scholar] [CrossRef] [Green Version]
  50. Gleick, P.H. Water and energy. Annu. Rev. Energy Environ. 1994, 19, 267–299. [Google Scholar] [CrossRef]
  51. Qin, Y.; Mueller, N.D.; Siebert, S.; Jackson, R.B.; AghaKouchak, A.; Zimmerman, J.B.; Tong, D.; Hong, C.; Davis, S.J. Flexibility and intensity of global water use. Nat. Sustain. 2019, 2, 515–523. [Google Scholar] [CrossRef]
  52. Bakken, T.H.; Killingtveit, Å.; Alfredsen, K. The water footprint of hydropower production—State of the art and methodological Challenges. Glob. Chall. 2017, 1, 1600018. [Google Scholar] [CrossRef]
  53. Spang, E.S.; Moomaw, W.R.; Gallagher, K.S.; Kirshen, P.H.; Marks, D.H. The water consumption of energy production: An international comparison. Environ. Res. Lett. 2014, 9, 105002. [Google Scholar] [CrossRef]
  54. Mekonnen, M.M.; Gerbens-Leenes, P.W.; Hoekstra, A.Y. Future electricity: The challenge of reducing both carbon and water footprint. Sci. Total Environ. 2016, 569, 1282–1288. [Google Scholar] [CrossRef] [Green Version]
  55. Magneschi, G.; Zhang, T.; Munson, R. The impact of CO2 capture on water requirements of power plants. Energy Procedia 2017, 114, 6337–6347. [Google Scholar] [CrossRef]
  56. Meldrum, J.; Nettles-Anderson, S.; Heath, G.; Macknick, J. Life cycle water use for electricity generation: A review and harmonization of literature estimates. Environ. Res. Lett. 2013, 8, 015031. [Google Scholar] [CrossRef]
  57. Schomberg, A.; Flörke, M.; Campos, J.; Sebesvari, Z.; Terrapon-Pfaff, J.; Amroune, S.; Viebahn, P.; Benelcadi, H.; Jähnig, S.; Landwehr, T.; et al. Requirements for a Water Footprint Approach to Compare Different Energy Generation Systems. In Proceedings of the Mid-Term Conference–Frankfurt am Main, Frankfurt, Germany, 20–21 February 2019; p. 44. [Google Scholar]
Figure 1. Overview of the methodology applied to estimate water demand for different electricity generation pathways. SR = Reference electricity generation scenario, S1–3 = decarbonization electricity generation scenarios to be analyzed.
Water 12 02482 g001
Figure 2. Electricity generation by energy source (in TWh) for the year 2015 and the four selected energy scenarios in 2030 and 2040. (Source: based on the data from [39,40,41]).
Water 12 02482 g002
Figure 3. Water withdrawal (in km3 per year without 1T-BSW) for electricity generation by energy source (excluding hydropower) for the year 2015 and the four energy scenarios in combination with changes in the power plant type and cooling technologies (BAU and ETS scenarios) in 2040. (Source: own calculation based on the data from [39,40,41]).
Water 12 02482 g003
Figure 4. Water consumption (in km³ per year without 1T-BSW) for electricity generation (km3) by energy source (excluding hydropower) for the year 2015 and the four energy scenarios in combination with changes in the power plant type and cooling technologies (BAU and ETS scenarios) in 2040. (Source: own calculation based on the data from [39,40,41]).
Water 12 02482 g004
Figure 5. Average global freshwater intensities for water withdrawal (a) and consumption (b) for electricity generation (m3/MWh) for 2015 and the four energy scenarios in combination with changes in the power plant type and cooling technologies (BAU and ETS scenarios) in 2040. (Source: own calculation based on the data from [39,40,41]).
Water 12 02482 g005
Figure 6. Water consumption for electricity generation (in km3 per year, excluding hydropower) by cooling technology for 2015 and the four energy scenarios in combination with changes in the power plant type and cooling technologies (BAU and ETS scenarios) in 2040. Cooling systems: 1T-BSW = once-through with non-freshwater resources; 1T = once-through; CP = cooling pond; CT = cooling tower; CMB = combined-cooling system; DC = dry cooling; PV = photovoltaic (values for PV correspond to the water needs for cleaning and operation). (Source: own calculation based on the data from [39,40,41]).
Water 12 02482 g006
Figure 7. Water consumption for electricity generation (km3 per year, excluding hydropower) by electricity generation technology for 2015 and the four energy scenarios in combination with changes in the power plant type and cooling technologies (BAU and ETS scenarios) in 2040. Power plant types: ST = steam turbine; GT = gas turbine; CC = combined cycle; CSP = concentrated solar power; PV = photovoltaic (values for PV correspond to the water needs for cleaning and operation); (Source: own calculation based on the data from [39,40,41]).
Water 12 02482 g007
Figure 8. Water withdrawal for electricity generation (in km³ per year, excluding hydropower) by region in 2015 and the four energy scenarios in combination with changes in the power plant type and cooling technologies (BAU and ETS scenarios) in 2040. (Source: own calculation based on the data from [39,40,41]).
Water 12 02482 g008
Figure 9. Water consumption for electricity generation (in km3 per year, excluding hydropower) by region in 2015 and the four energy scenarios in combination with changes in the power plant type and cooling technologies (BAU and ETS scenarios) in 2040. (Source: own calculation based on the data from [39,40,41]).
Water 12 02482 g009
Table 1. Overview of selected energy scenarios.
StudyTime HorizonScenarioGreenhouse Gas Emission Changes 2040 (Compared to 1990)Strategy Summaries
World Energy Outlook
[39]
2040Reference scenario:
International Energy Agency (IEA) | Current Policies (CP)
+104%
  • Assessment of the energy sector development in the absence of any additional measures
International Energy Agency (IEA) | Sustainable Development (SD)−13%
  • Back-casting approach
  • Stronger role of renewable energies
  • Broad exploitation of efficiency potentials in the industrial sector
  • Transport sector: increasing electrification and increasing use of "advanced" biofuels and natural gas assumed
  • Carbon capture and storage (CCS)
The advanced energy (r)evolution
[40]
2050Greenpeace (GP) | Advanced Energy Revolution
(Ad.(R))
−61%
  • Renewable electricity as the most important primary energy resource
  • Limited use of biomass (100 EJ/a)
  • Broad electrification of the transport sector
  • Hydrogen and other synthetic fuels in subsectors difficult to electrify (e.g., freight transport)
  • No CCS
  • Phase-out of nuclear energy
Global Energy and Climate Outlook (GECO)
[41]
2050GECO | B2°C+1%
  • Combination of CCS, renewables, and nuclear power in the electricity sector
  • In the transport sector: combination of electricity, biofuels, natural gas, and hydrogen
Table 2. Overview of power plant type and cooling technology scenarios developed in this study.
Business as Usual Scenario
(BAU)
Evolving Technology Scenario
(ETS)
Power plantsDistribution of power plant types for the different energy sources remains fixed at the level of regional shares in 2015.In the case of a decrease in electricity generation of a given energy source (e.g., coal), the most water-intensive power plant technology will be retired first (e.g., the steam turbine one).
In the case of an increase in electricity generation of a given energy source, the most water-efficient electricity generation technology will be implemented in the newly built power capacities (e.g., the combined cycle one).
Cooling systemsDistribution of cooling system shares by electricity generation technology remains fixed at the level of regional shares in 2015.In the case of a decrease in electricity generation of a given energy source, the most water-intensive cooling technology will be retired first (e.g., once- through cooling).
In the case of an increase in electricity generation of a given energy source, a fixed regional share of a cooling tower and dry cooling technology is applied to the power capacity increase.
Table 3. Future share of cooling technologies by region, in the case of increased electricity generation by 2040.
RegionCooling System
CTDC
Africa0.20.8
Asia Oceania OECD0.50.5
Asia (Other)0.50.5
China0.40.6
Eastern Europe/Eurasia0.50.5
Europe0.50.5
India0.50.5
Latin America0.50.5
The Middle East0.10.9
North America0.50.5
CT = cooling tower; DC = dry cooling.

