Abstract
Multi-elemental (Ca, Mg, Na, K, Al, As, Ba, Cd, Co, Cr, Cu, Fe, Li, Mn, Mo, Ni, P, Pb, Sb, Se, Tl, V, and Zn) and stable isotope (i.e., δ2H, δ18O, and δ13CDIC) analyses were performed on 13 (8 Slovenian and 5 imported) bottled mineral and spring waters from the Slovenian market. In addition, 87Sr/86Sr isotope ratios were determined for the first time. In all analyzed bottled waters, the majority of elements were present although in low concentrations, and according to EU legislation, all were suitable for human consumption. Also, concentrations of major elements (Ca, Mg, Na, and K) were in general agreement with the values reported on the bottle labels, and any differences were the consequence of the natural variability of the water source used for bottling. The exception was one spring water, for which the source location changed, which was confirmed by the δ2H, δ18O, and δ13CDIC data. Two mineral waters had distinctive elemental compositions due to the particular geology of their recharge areas. The δ13CDIC was also investigated to decipher the carbonate contribution in the bottled waters. The results suggest that dissolution of carbonates and non-equilibrium carbonate dissolution by carbonic acid produced from soil zone CO2 are the predominant geochemical processes influencing the δ13CDIC values of bottled water.
Keywords:
bottled waters; multielemental analysis; 87Sr/86Sr; δ2H; δ18O; δ13CDIC; water quality; Slovenian market 1. Introduction
Bottled water is the most popular beverage in the world, and sales continue to grow year-on-year. Estimated global consumption in 2007 was 212 billion liters and 437 billion liters in 2017 [1]. More than 25% of the global bottled water production is located in the EU, where 52 billion liters of bottled water are consumed each year [2]. This increase in consumption of bottled water can be attributed to the claims about its higher quality compared to tap water and its health benefits. Bottled water is classified into mineral, spring, and table water according to the Council Directive 80/777/EEC [3]. Their properties are described in detail in EU Directive 2009/54/EC [4]. In both the Drinking Water Directive (98/83/EC) [5] and for bottled waters in more detail in Commission Directive 2003/40/EC [6] the quality requirements for water intended for human consumption with threshold levels for toxic substances are laid down. According to national legislation/regulations, only the concentrations of the major elements must be declared on the label.
Waters used for bottling originate from various parts from the hydrological cycle and have a distinctive hydro-geochemical fingerprint. The natural origin of the water is reflected in its hydrogen (δ2H), oxygen (δ18O), carbon as dissolved inorganic carbon (δ13CDIC) values, strontium isotope ratio (87Sr/86Sr), and elemental composition, among others. Additionally, its composition may be affected by handling operations after extraction from the source [7,8] and by leaching from storage containers (glass or plastic) [9,10,11,12].
Elemental composition and 87Sr/86Sr isotope ratio of water are linked to the geology of the recharge area. Both are traditional geochemical tracers and used mainly for defining lithological sources (silicate and carbonate rocks) and the percentage of silicate/carbonate fraction in groundwater [13,14] since they are controlled by water-rock interactions [15]. The isotopic composition of oxygen and hydrogen (i.e., δ18O and δ2H) in the water molecule changes as the water circulates through the water cycle. Significant variations in δ18O and δ2H values in precipitation (i.e., the ultimate water source for surface and groundwater) depend on latitude and altitude [16]. Therefore, determining δ18O and δ2H can help to characterize the origin of the bottled water and the natural conditions of the parent water body, recharge area and the influence of different processes during infiltration and the flow of water through the water body [7]. Dissolved inorganic carbon (DIC) is the main species in waters draining from carbonate rocks; therefore, carbon isotopes can be used to assess its origin. Changes in dissolved inorganic carbon concentrations result from the addition and removal of carbon from the DIC pool [17].
The importance of collecting different data on the elemental and isotopic composition of bottled waters is twofold. First, since the composition of natural waters varies even in the absence of pollution sources, the collected data can be used to create meaningful standardized limits for potentially toxic constituents. Secondly, due to the increasing consumption of bottled water and consequently, higher economic value, the data can help protect the quality and origin of bottled natural mineral and spring waters. Several studies investigating the chemical composition and origin of the bottled water using δ2H, δ18O, δ13CDIC, 87Sr/86Sr, and elemental analyses together or separately have been published. Frengstad et al. [18], Birke et al. [19], and Filipe-Sotelo et al. [8] characterized bottled water based on major and trace elemental composition, while Montgomery et al. [20], Voerkelius et al. [21], and Kim et al. [14] used multielemental and Sr isotope data for the geochemical assessment of bottled waters. Brenčič and Vreča [7,22], Redondo and Yélamos [23], and Raco et al. [24] used stable isotope composition of light elements (i.e., δ2H, δ18O, and δ13CDIC) for the characterization and classification of bottled waters.
Slovenia has abundant water resources, with 272 km2 of Slovenia’s territory covered by water [25], and an extensive groundwater system. Due to climate change and extended periods of drought, the situation could change in the coming years. A detailed characterization of bottled water available on the Slovenian market based on their elemental and isotopic (δ2H, δ18O, δ13CDIC) composition was performed in 2004 by Brenčič and Vreča [7,22,26], and in 2008 additional elemental investigations were performed by Brenčič et al. [27]. In the past, it was proposed that isotopic and elemental investigations of bottled waters should continue; however, according to our best knowledge, there have been no systematic follow-up studies. Moreover, there is no data on the 87Sr/86Sr isotope ratio available for any type of bottled water samples from Slovenia. Therefore, the main objective of the present study was to characterize Slovenian spring and natural mineral bottled waters as well as the most popular bottled waters from the EU available on the Slovenian market using multi-elemental and multi-isotope analyses. We aimed to (i) determine the 87Sr/86Sr isotope ratio in bottled spring and natural mineral waters, (ii) compare the data with data from previous investigations, (iii) compare label vs. analytical values, (iv) verify compliance with regulatory demands, and (v) evaluate the geochemical processes to determine, e.g., the type of aquifer (geological composition).
2. Materials and Methods
2.1. Samples and Sampling Procedure
Examples of the popular Slovenian mineral water brands (8 samples) and imported (5 samples) were collected from supermarkets across Slovenia in 2016. Table 1 lists the mineral waters by type, brand, and source/origin. The survey was focused only on still waters. All samples were stored in plastic (PET) bottles.

Table 1.
List of natural mineral and spring bottled waters
2.2. Analytical Procedures
2.2.1. Determination of Major and Trace Elements
Dissolved trace elements were determined using an Agilent 7900x inductively coupled plasma mass spectrometer (ICP-MS, Agilent Technologies, Tokyo, Japan). Two surface water reference materials: SLRS-5 (National Research Council Canada, Ottawa, Ontario, Canada) and SPS-SW1 (Spectrapure Standards, Manglerud, Norway), were used for the accuracy check and analyzed multiple times during the measurements; recoveries varied between 97% and 102%. Repeatability was > 5%.
2.2.2. Determination of 87Sr/86Sr Isotope Ratio
Samples (1–30 mL) for Sr isotope analysis were evaporated to dryness on a hot plate at 80–90 °C. Concentrated HNO3 (Supra-pure, Merck, Darmstadt, Germany) was then added and again evaporated to dryness. The dried residue was dissolved in 1 mL of 8 M HNO3 and loaded on pre-packed columns with 2 mL Sr specific resin Eichrom® (SR-B50-S, Triskem International, France). The resin was pre-cleaned with 6 M HCl and 8 M HNO3. The Sr was eluted from the Sr specific resin with 10 mL of MilliQ water (Merck-Millipore Watertown, MA, USA). The final concentration of Sr in the samples was approximately 30–50 ng mL−1. Rb was efficiently removed, as its concentrations in the Sr fraciotn were <0.003 ng/mL. The Sr recovery from the resin was better than 95%.
The 87Sr/86Sr isotope ratio was determined using a Nu plasma II multi-collector ICP-MS (Nu Instruments Ltd., Wrexham, United Kingdom) fitted with an Aridus II™ Desolvating Nebulizer System (Teledyne Cetac, Omaha, Nebraska, USA). Instrumental mass discrimination was corrected by internal normalization using the ratio 86Sr/88Sr = 0.1194, and Rb and Kr interferences were corrected for mathematiclay using 87Rb/85Rb and 86Kr/83Kr ratios of 0.38567 and 1.50566, respectively. Measurements were performed following the standard-sample-standard bracketing method using a NIST SRM 987 SrCO3 (0.71034 ± 0.00026, National Institute of Standards and Technology, Gaithersburg, MD, USA) as the standard. All samples were prepared in triplicates. In Table 2, the ± values rapresent the reproducibility (expressed as 2 SD). The instrumental operation parameters are given in Supplementary Table S1.

Table 2.
87Sr/86Sr isotope ratios (mean, 2 SD, n = 3) of 13 bottled waters.
2.2.3. Determination of the Isotope Composition of Hydrogen and Oxygen
The isotope composition of hydrogen (δ 2H) and oxygen (δ 18O) was determined using the H2-H2O [28] and CO2-H2O [29,30] equilibration technique. Measurements were performed on a dual inlet isotope ratio mass spectrometer (DI IRMS, Finnigan MAT DELTA plus, Finnigan MAT GmbH, Bremen, Germany) with an automated CO2-H2O and H2-H2O HDOeq 48 Equilibration Unit (custom built by M. Jaklitsch). The temperature of the water bath was 18 °C. The water vapor trap was cooled to −55 °C. Both CO2 (Messer 4.5) and H2 (IAEA) were used as working standards for water equilibration. Equilibration of H2-H2O and CO2-H2O was 2 and 6 hours, respectively. All measurements were performed together with laboratory reference materials (LRM) calibrated periodically against primary IAEA calibration standards: to VSMOW/SLAP scale. Samples of water were measured as independent duplicates. Results were normalized to the VSMOW/SLAP scale using the LIMS programme and expressed in the standard δ notation (in ‰). For independent quality control we used LRM W-45 with defined isotope values and an estimated measurement uncertainty of δ2H = −60.6 ± 0.7 ‰ and δ18O = −9.12 ± 0.04 ‰, and commercial reference materials USGS 45 (δ2H = −10.3 ± 0.2 ‰, δ18O = −2.238 ± 0.006 ‰) and USGS 46 (δ2H = −235.8 ± 0.4 ‰, δ18O = −29.80 ± 0.02 ‰). The average sample repeatability for δ2H and δ18O was 0.3 and 0.02 ‰, respectively.
2.2.4. Determination of Alkalinity
In order to measure alkalinity, each sample was passed through 0.45 μm nylon filter into HDPE bottle and kept refrigerated until analyzed. First, the pH was measured in the lab with a pH meter (Mettler Toledo AG 8603, Schwerzenbach, Switzerland). The total alkalinity was then determined within 24 h of sample collection using the Gran titration method [31] with a precision of ± 1%. Approximately 8–10 g of the sample was weighed into a plastic container and placed on a magnetic stirrer. A calibrated pH electrode (7.00 and 4.00 ± 0.02) was placed in the sample, and the initial pH was recorded. Reagencon HCl 0.05N (0.05M) was used for titration. The titration performed using a CAT titrator (Ingenierbüro CAT, M. Zipperer GmbH Ballrechten-Dottingen, Germany). HCl acid was added, and the change in mV monitored. At 220 mV, the mV was recorded with the addition of acid until a value of 260 mV was reached. A Gran plot was then constructed and the intersection of the line estimated using linear regression. The intersection of the line represents the amount of acid required to reach the second endpoint of the carbonate equilibrium. From the volume of acid added with a known concentration, the alkalinity of the sample can be then calculated as
where,
As = (Ca × Va)/Vs
As – alkalinity of the sample
Ca – concentration of acid
Vs – sample volume
Va – the volume of acid added
The result is expressed in mmol/l.
2.2.5. Determination of Stable Isotope Composition of Dissolved Inorganic Carbon (δ13CDIC)
Samples were stored in glass serum bottles filled with no headspace and sealed with septa caps. The δ13CDIC values were then determined using continuous flow IRMS (Europa Scientific 20–20) with an ANCA-TG preparation module. Phosphoric acid (100%) was added (100–200 µL) to a septum-sealed vial which was then purged with pure He. The sample (1 mL to 6 mL, depending on alkalinity) was then injected, and the headspace CO2 measured (modified after [32] and [33]). In order to determine the optimal extraction procedure for bottled water samples, a standard solution of Na2CO3 (Carlo Erba reagents, Val de Reuil, France) with a known δ13CDIC value of –10.8 ± 0.2‰ was used. The average sample repeatability was 0.2‰.
2.2.6. Thermodynamic Modeling
Thermodynamic modeling was used to evaluate the pCO2 and the saturation state of calcite (SIcalcite) and dolomite (SIdolomite) using the PHREEQC speciation program [34]. The inputs were pH, total alkalinity, and temperature (20 °C).
2.2.7. Statistical Analysis
Correlations between determined parameters, descriptive statistics (i.e., mean, median, standard deviation, minimum, and maximum) were calculated and principal component analyses (PCA) were performed and visualized using the R language [35] and ggplot2 package in R [36]. Spearman’s correlation analysis was used to identify correlations between 24 elements. The significance level was p < 0.05. General descriptive statistics were calculated (median, Q1, Q3) and presented as boxplots on a logarithmic scale. Two PCA analyses were performed, the first using element concentrations, and the second using stable isotopes, alkalinity, and pH. For both analyses, Z-scores were calculated to represent the relationship between the samples and the observed variables.
3. Results and Discussion
3.1. Content of Major and Trace Elements in Bottled Waters
The concentrations of major elements (Ca, K, Mg, and Na), potentially toxic elements (As, Cd, Cr, Ni, Pb) and trace elements (Al, Ba, Co, Cu, Fe, Li, Mn, Mo, P, Rb, Sb, Se, Sr, Tl, V, and Zn) in the samples of bottled spring and mineral waters are summarized graphically in Figure 1. The actual values are given in Table S2 and the descriptive statistics in Table S3.
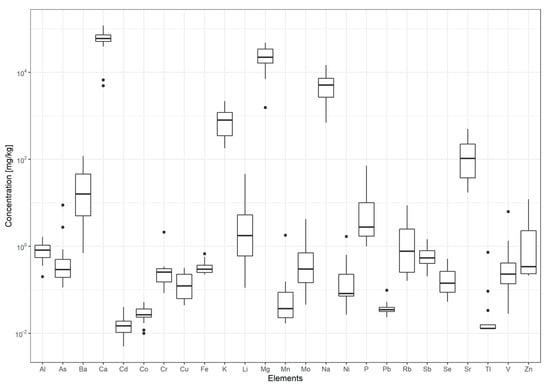
Figure 1.
Boxplots of element concentrations (major elements, potentially toxic elements and trace elements) in bottled mineral and spring waters.
The concentrations were in the range 4.92 to 120 mg L−1 for Ca 1.55 to 48.3 mg L−1 for Mg, 0.70 to 14.7 mg L−1 for Na and 0.18 to 2.20 mg L−1 for K. The highest variability between waters was observed for Ca and Mg, which differed by two orders of magnitude. In general, the determined concentrations were in good agreement with those reported on the labels (Table S4). The largest inconsistency was between labeled vs. determined values of Ca, K, and Na in Jana (bottled in Gorice Svetojanske, Croatia) and Mg, K, and Na in Voda 902, bottled in Črnivec, Slovenia. In both samples, the determined concentrations were higher than the label values. The levels of major elements in Dana (Mirna, Slovenia), Julijana (Tržič, Slovenia), Oda (Rimske Toplice, Slovenia), and Zala (Ljubljana, Slovenia) from this study were also compared to those reported by Brenčič et al. [26] where they analyzed the same bottled waters, among others, in 2004 and 2008. The most significant difference was for Ca in Dana (93.1, 73.2, and 66.0 mg L−1 in 2004, 2008, and 2016, respectively), and Julijana (42.5 and 51.9 mg L−1 in 2004 and 2016, respectively). Also, in Julijana, significant differences were observed for K (0.292 mg L−1 in 2004 and 1.25 mg L−1 in 2016) and Na (0.661 mg L−1 in 2004 and 9.3 mg L−1 in 2016). These differences in major element concentrations can be explained by natural variability, except for Julijana, for which the location of the source was changed.
The trace elements—Al, As, Ba, Cd, Co, Cr, Cu, Fe, Li, Ni, Mn, Mo, Pb, Sb, Se, V, and Zn—were detectable in all the water samples but were generally very low. The exception was As in Vodavoda spring water (bottled in Gornja Toplica, Serbia) where its concentration (8.86 µg L−1) was just under the European drinking water standard of 10 µg L−1. In the same bottled water, also Li (45.9 µg L−1), Cr (2.13 µg L−1), and Tl (0.731 µg L−1) concentrations were much higher than in other waters, suggesting that this is a consequence of geology rather than contamination of the aquifer. The water comes from a limestone aquifer situated at the bottom of Neogene sediments. Its chemical composition is altered by the presence of pegmatite, as reported by Petrović et al. (2010) [37]. Spring water Laqueuille was characterized by higher As, V, and K concentrations, where K may be related to the occurrence of alkaline rocks, especially near volcanic centers, and V confirming the presence of volcanism and basaltic rocks [38]. Indeed, the Laqueuille spring water is captured near Parc Naturel Regional des Volcans d’Auvergne in France.
The median values for the PTE determined in bottled waters from the present study were, in general, lower than those of the British and continental EU (Czech Republic, Slovakia, Finland, France, Germany and Italy) bottled waters analyzed by Felipe-Sotelo et al. (2015) [8]. The median values for As (0.293 µg L−1), Cd (0.015 µg L−1), and Cr (0.257 µg L−1) from the present study were slightly higher compared to German and other EU mineral bottled waters as reported by Birke et al. [19] (0.190 µg L−1 for As, 0.0032 µg L−1 for Cd, and 0.121 µg L−1 for Cr) and Demetriades et al. [38] (0.235 µg L−1 for As and <0.2 µg L−1 for Cr). Frengstad et al. [18] determined the elemental composition (58 elements) of bottled mineral and spring waters from Norway, Sweden, Finland and Iceland. Their median values for most elements were mostly lower than the values in the present study, except for Cu, Fe, Mn, Ni, and Zn that were higher.
In the present study, the element concentrations in all the mineral and spring bottled waters were well below the limits set by Slovenian regulation [39], the EU Drinking Water Directive [6], US EPA [40], and WHO guidelines [41] for drinking water (Table S3).
3.2. 87Sr/86Sr Isotope Ratio
The concentrations of Sr, Rb, and 87Sr/86Sr values of the studied bottled waters are presented in Table 2.
The Rb concentrations were low (0.162 to 8.75 µg L−1), while Sr concentrations ranged widely between 17.2 and 502 µg L−1. On average, the Sr and Rb concentrations were lower in Slovenian compared to imported bottled waters. The 87Sr/86Sr ratio ranged from 0.70400 up to 0.71942. Most waters had a ratio between 0.708 and 0.710, suggesting that in most cases the carbonate fraction prevails. The most radiogenic was Voda 902 (0.71942), while the least radiogenic was Laqueuille (0.70400).
Laqueuille has the highest Rb/Sr ratio and the lowest Mg/Na and Sr/Na ratios (Figure 2) confirming its volcanic origin. Alternatively, Voda 902 spring water is characterized by having the lowest Sr/Na ratio and low Mg/Na and Ca/Na (Figure 2) ratios while the Sr isotope composition is the most radiogenic indicating silicate weathering within the aquifer. The Oda spring water has the highest Ca/Sr, Mg/Na, and Ca/Na ratios, and 87Sr/86Sr ratio of 0.70921, Such data are indicative of carbonate weathering in the aquifer which is confirmed by the hydrogeological conditions in the area [42].
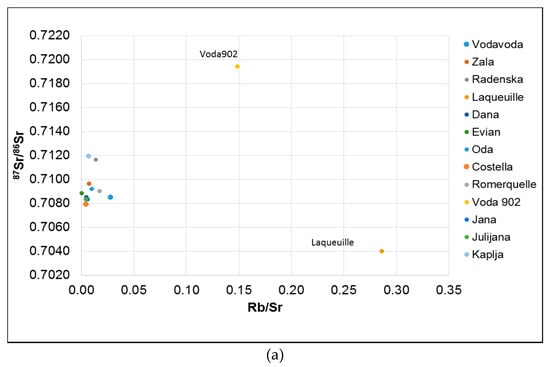
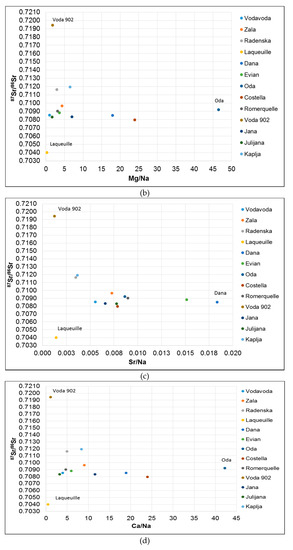
Figure 2.
Plot of 87Sr/86Sr isotope ratio vs. (a) Rb/Sr; (b) Mg/Na; (c) Sr/Na; (d) Ca/Na.
3.3. Hydrogen (δ2H) and Oxygen (δ18O) Analysis
The variability in the δ2H and δ18O values in the present study, together with some literature data, is presented in Figure 3. All results are reported in Table S4. The reported isotope data vary between −77.9 ‰ and −53.3 ‰ for δ2H and between −10.84 ‰ and −8.20 ‰ for δ18O. Variations in δ2H (−65.5 ‰ and −56.6 ‰) and δ18O values (−9.44 ‰ and −8.32 ‰) in Slovenian bottled water were smaller compared to literature values, and are typical for groundwater in shallow aquifers where precipitation is the primary recharge source [7]. In Slovenia, such values are also characteristic for karstic and fissured carbonate aquifers and are an important water resource (Figure 3).
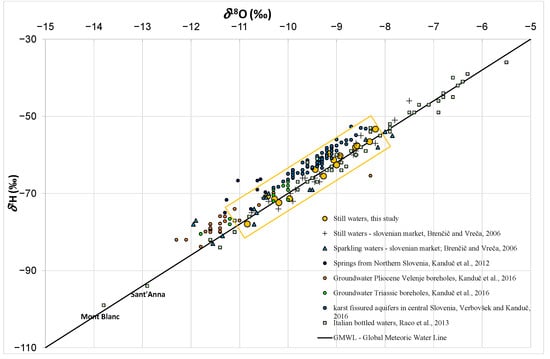
Figure 3.
Plot of δ2H versus δ18O of bottled waters from this study in comparison to data from the literature: still and sparkling waters from Slovenian market [7], springs from Northern Slovenia [43], groundwater from Pliocene and Triassic aquifers from the Velenje coal basin [44], groundwater from karst fissured aquifers in central Slovenia [45], and Italian bottled waters [24].
Furthermore, we compared Naturelle, Dana, Zala, Oda, Kaplja, Julijana and Costella with results from previous Slovene investigations [7,11,12]. A general trend to more positive values of δ2H and δ18O was observed for Dana, Zala, Oda, and Kaplja, with an average increase of 2.5‰ and 0.28‰, respectively, since 2004. A similar positive shift was also observed for foreign bottled water Jana and Evian since 2004. For Naturelle, Dana, Zala, and Costella an increase of 0.3 ‰ for δ2H and 0.24‰ for δ18O were detected since 2009. In general, those changes are small and can be attributed either to the variation and changes of the isotope composition of the source water or to changes related to storage conditions. As reported by Ferjan [12], the oxygen isotope composition in the source water used for bottling of brand Costella monitored in the period 2006–2011 was on average −9.03 ± 0.12‰. According to the authors’ knowledge, there have been no long-term isotope studies of source waters for the bottled waters included in the study. In addition, a >1‰ positive shift in δ18O values was observed for Costella when stored under laboratory conditions while in a closed, dark room and outdoors a much smaller increase (up to 0.36‰) was observed [11,12]. A similar positive shift in δ18O values was observed for Naturelle, Dana, and Zala. The most significant difference between our and previous results [7] was observed for Julijana. This increase of 9.7‰ for δ2H and 1.44‰ for δ18O results from a change in the source water from near Jesenice to Tržič. The δ2H and δ18O values indicate a change in the recharge area, which was in the past higher and near the tree limit [7]. Therefore, caution is needed when comparing results with past observations.
3.4. Evaluation of Geochemical Processes with Geochemical Parameters (Ca2+/Mg2+ Ratios, Total Alkalinity) and δ13CDIC in Bottled Waters
3.4.1. Geochemical Processes
Figure 4a shows how most of the cations originate from clastic rocks (sandstone, claystone, and marls) and carbonate rocks since they deviate from the 1:2 (weathering of carbonate) and 1:1 (weathering of feldspars, e.g., albite/anorthite) lines. Only Voda 902 falls on the 1:1 line. Both cations (Ca2+, Mg2+) originate in carbonate and clastic rocks, which is indicated by an excess of divalent cations (Figure 4a). Romerquille has the highest mineralization and alkalinity (6.75 mM), while Laqueuille (alkalinity 0.66 mM) and Voda 902 (alkalinity 0.45 mM) have the lowest mineralization (Table S5). Also, most of the samples have a Mg2+/Ca2+ ratio of over 0.5 (Figure 4a). In Oda, dolomite prevails, while in Vodovoda calcite prevails. Laqueuille and Voda 902, have low alkalinity concentrations suggesting that Mg2+ originates from mafic minerals (e.g., amphiboles and pyroxenes) and not from carbonate minerals like dolomite.
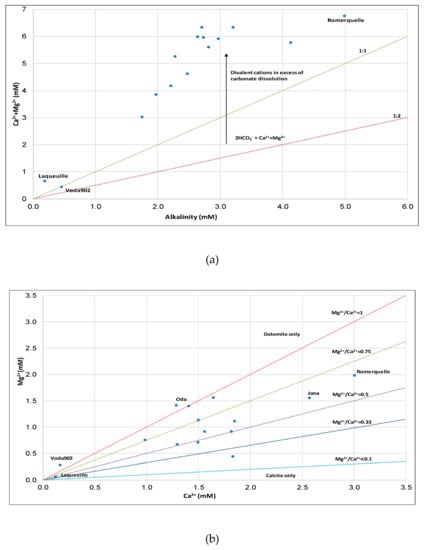
Figure 4.
Plot of (a) Ca2++Mg2+ ratio versus alkalinity with lines 1:2 indicating weathering of carbonates and 1:1 indicating weathering of albite of bottled waters, and (b) Mg2+ vs Ca2+ indicating the dominance of dolomite/calcite in the bottled waters.
All the samples were oversaturated with CO2 (Figure 5a). Calculated pCO2 ranged from 851.1 to 17378 ppm (average 6881 ppm) and is 2.36 to 48.3 fold higher than atmospheric CO2 (360 ppm). A lower pCO2 was observed in Voda 902, which has low alkalinity (0.45 mM). The calcite/dolomite saturation indexes (SIcalcite = log ([Ca2+]·[CO32-])/(Kcalcite), where Kcalcite/Kdolomite is the solubility product of calcite and dolomite and was generally well above equilibrium (SIcalcite = 0, SIdolomite = 0), indicating that calcite and dolomite were supersaturated and carbonate precipitation was thermodynamically favored in the majority of the bottled waters (Figure 5b). Laqueuille (sample with low Ca2+, Mg2+, and total alkalinity) was undersaturated with respect to calcite and dolomite, while Voda 902 and Naturelle (Radenska) were undersaturated with respect to dolomite (Figure 5b). This data is consistent with Figure 4A; Voda 902 and Laqueuille have low total alkalinities meaning that the origin of cations in both bottles is in mafic alumosilicate minerals. In contrast, Oda has high mineralization (Ca2++Mg2+), alkalinity, and pH, and therefore the highest SIcalcite/SIdolomite (Figure 5b).
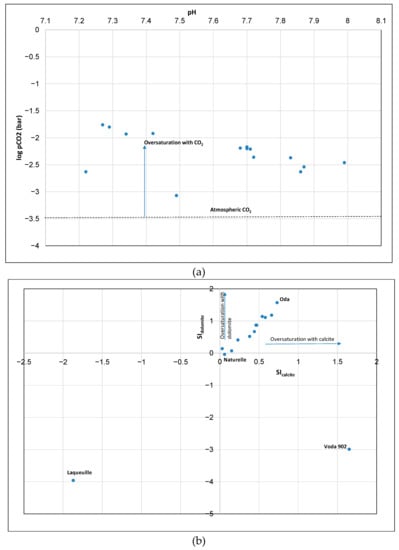
Figure 5.
Plot of (a) pCO2 versus pH in bottled waters and (b) saturation index of calcite (SIcalcite) versus dolomite (SIdolomite) in bottled waters.
3.4.2. Origin of Carbon in the Dissolved Inorganic Carbon (δ13CDIC) in Groundwater
Inorganic carbon in natural water consists of gaseous CO2(g), dissolved CO2(aq), dissolved carbon acid (H2CO3), dissolved hydrogen carbonate (HCO3−), and solid calcium carbonate (CaCO3). All the δ13CDIC depends on the contribution of these multiple sources of carbon [23]. All these species represent the carbonate system in dynamic equilibrium. Concentrations of DIC and δ13CDIC are governed by processes occurring in the soil-aquifer system with time, depending on the contribution of multiple sources and sinks. Changes in DIC concentrations result from addition or removal from the DIC pool, while changes of δ13CDIC result from fractionation accompanying the transformation of carbon or from mixing of carbon from different sources. The major sources of carbon to aquifer DIC loads are dissolution of carbonate minerals, and soil derived from root respiration and microbial decomposition of organic matter [43]. The primary removal mechanism of DIC in the aquifer system is carbonate mineral precipitation [17]. Redondo and Yélamos (2005) [23] found that naturally carbonated waters had δ13CDIC values between −8 and −7 ‰. The industrial carbon dioxide injected into mineral bottled water is produced from hydrocarbons by chemical processing leading to low δ 13C values of −35.0 to −21.7‰ [23].
δ13CDIC in our study is on average, −11.7 ‰ and range from −17.3 to −6.2 ‰ (Figure 6a). A summary of all δ13CDIC values is presented in Table S5. In a study by Brenčič and Vreča, (2007) of domestic and foreign bottled waters randomly collected from the Slovene market (58 brands and 16 replicates), the δ13CDIC values varied between −63.1 ‰ and +1‰ with an average of −12.3 ‰, while average values of naturally sparkling, artificially sparkling, still and flavored waters were −3.3 ‰, −36.5 ‰, −10.0 ‰, and −11 ‰, respectively [22]. The lowest values are characteristic of artificial sparkling waters because of the injection of industrial CO2 [22]. Carbon isotopic values of effervescent bottled waters vary from −35.0 to −2.7‰ [23]. Figure 6a shows that most of the DIC in bottled waters falls between lines 1 and 2 indicating the dissolution of carbonates according to the average δ13CCaCO3 (2.2‰ predicted value for carbonate rocks) [43] and non-equilibrium carbonate dissolution by carbonic acid produced from soil zone CO2 [43]. Only Laqueuille with a value of δ13CDIC −17.3‰ falls close to the equilibration line 3, indicating more soil CO2. Vodovoda had the highest carbonate contribution with δ13CDIC value of −6.2‰. The low alkalinity of Voda 902 meant that the δ13CDIC could not be measured.
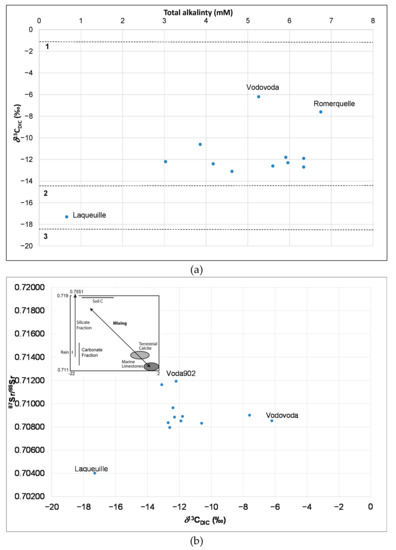
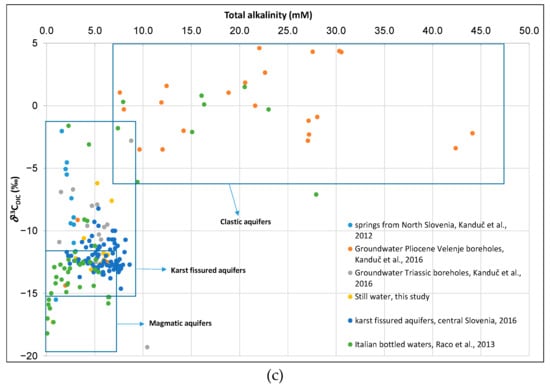
Figure 6.
Plot of (a) δ13CDIC values in bottled waters, with lines indicating biogeochemical processes. These include (1) dissolution of carbonates according to the average δ13CCaCO3 (2.2‰) value- predicted value [43], causing 1‰ ±0.2‰ enrichment in 12C in DIC [46]; (2) non-equilibrium carbonate dissolution by carbonic acid produced from soil zone CO2 [43] and (3) open system equilibration of DIC with soil CO2 originating from degradation of organic matter with δ13Csoil=−27.2‰ [43]; (b) 87Sr/86Sr vs δ13CDIC in bottled waters with a figure indicating silicate/carbonate fraction [47]. (c) Comparison of δ13CDIC versus total alkalinity of bottled waters from this and other studies [43], tap water from central Slovenia [45] and mining groundwater wells (Pliocene and Triassic) from Slovenia [44] and Italian bottled waters [24].
A plot of 87Sr/86Sr versus δ13CDIC (Figure 6b) confirms our presumption that for the majority of analyzed samples the carbonate fraction prevails. The low alkalinity Voda 902, suggest it is undersaturated with respect to dolomite (Figure 5b) and has the highest 87Sr/86Sr ratio. Vodovoda has high δ13CDIC, low 87Sr/86Sr and is supersaturated with calcite and dolomite (Figure 5b), meaning it is of carbonate origin. Laqueuille has low alkalinity, low δ13CDIC, low 87Sr/86Sr ratio and is undersaturated with calcite and dolomite and is the lowest mineralized bottled water in our study (Figure 5b). The δ13CDIC and total alkalinity results reveal that samples from our study fall between karst fissured and igneous aquifers (Figure 6c). Figure 6c also represents values of δ13CDIC and alkalinity of some previous studies [43,44,45] of groundwater in Slovenia and Italian bottled waters [24].
3.5. Statistical Analysis
None of the observed correlations between elements had a correlation coefficient >0.8, although Sr-Se, Sr-Ca, Se-Ca, Se-Ni, Ca-Ni, Li-Na, Na-K, and Cu-Al had correlations of 0.75 or above, with Sr-Ca and Li-Na having the highest (0.8). Figure 7 shows a Spearman correlation matrix for all elemental combinations where dark blue colors present higher positive correlation values and light green colors higher negative values. Crossed-out values are not significant.
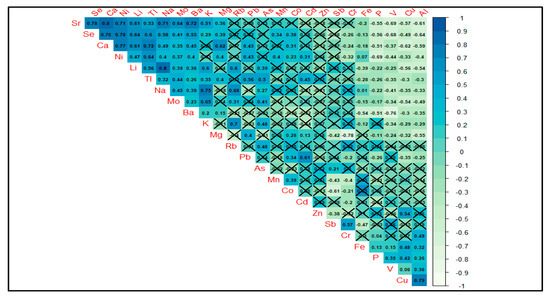
Figure 7.
Spearman correlation matrix for all analyzed elements with significance model set at p < 0.05 and insignificant values crossed-out. Blue colors represent higher correlation factors, while green values show negative correlations.
The first PCA analysis, for elements only (Figure 8), shows that there is no clear and evident clustering of the samples. In this case, PC1 explains 27.3% of the variance, and PC2 explains 21.7% of the variance, which combined is only 49%, suggests observing more principle components to evaluate further the relationships of the elements and samples. Although there are no apparent clusters, two samples stand out—Vodavoda and Romerquelle—the former being characterized by As, Cr, and Tl, and the latter by Se, Ca, Sr, and Mn.
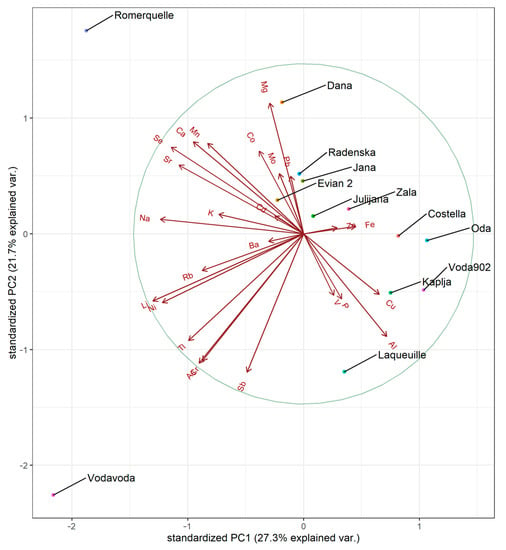
Figure 8.
Biplot of the first two principal components axes from a PCA of elemental concentrations in bottled waters.
The second PCA analysis (Figure 9), which includes stable isotope values, alkalinity and pH shows higher values for the first two principal components (PC1: 46.8%, PC2: 23.6%) which combined explain 70.4% of the variance. Again, no apparent clustering is observed, although Julijana, Voda 902 and Jana show a strong positive relationship with δ13CDIC. The reverse is evident for Laqueuille. Moderate clustering could be interpreted for Kaplja and conditionally Zala with positive relationships with δ2H and δ18O.
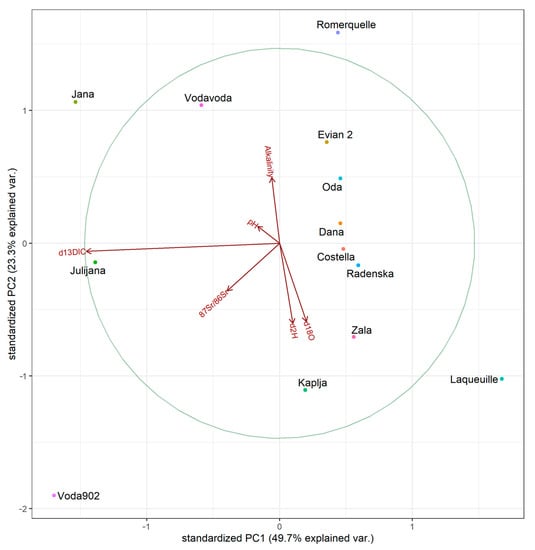
Figure 9.
Biplot of the first two principal component axes of the PCA of stable isotopes, alkalinity, and pH in samples of bottled water.
4. Conclusions
Multi-elemental and stable isotope analyses were performed on 13 (8 Slovenian and 5 foreign) bottled mineral and spring waters from Slovenian market. The majority of the elements studied were present in the samples in low concentrations. According to EU legislation, all waters were suitable for human consumption. Concentrations of major elements were in good agreement with the data on the labels, while compared to data from previous studies, some differences were observed. Most differences were a consequence of the natural variability, except for Julijana spring water where the source changed. Vodavoda and Laqueuille had the most distinctive elemental compositions due to the particular geology of their recharge areas. Laqueuille also had a distinctive 87Sr/86Sr isotope ratio, since its recharge area has a volcanic origin. With combining Sr isotope ratio data and ratios of major elements (i.e., Mg/Na, Ca/Na, and Ca/Sr), the prevailing mineral weathering was identified. Although differences in the elemental and Sr isotope composition of the samples were observed, it was not possible to provide a clear division according to their geographical origin.
The study also showed how HCO3−, Ca2+, and Mg2+ dominate the solute chemistry of bottled mineral and spring water. According to the calculated pCO2 values, bottled waters are saturated with CO2. Also, saturation indexes of calcite and dolomite indicated saturation with both minerals, except for Voda 902 (undersaturated with dolomite) and Laqueuille (undersaturated with calcite and dolomite) that are low in mineralization. Vodovoda is Ca enriched, while Oda is the most saturated with calcite/dolomite and Mg enriched. Voda 902 is also Mg enriched. δ13CDIC values indicate that Laqueuille has the most soil CO2 contribution, while Vodovoda has the most carbonate contribution.
General geochemistry together with O, H, C, and Sr isotope data indicates that analyzed bottled waters originated mostly from shallow aquifers in clastic and carbonate rocks. A general trend towards more positive values of δ18O and δ2H for Naturelle, Dana, Zala, Oda, Kaplja, Costella, Jana, and Evian in comparison to previous investigations were observed. However, it was not possible to confirm whether the changes are related to climate change and isotope composition variability of the source water or storage conditions.
Therefore, in future studies, a systematic approach for bottled water characterization, including trace element and isotope monitoring, of source water prior to bottling would be necessary. Also, these data would be of value in raising consumer awareness about the quality of bottled water.
Supplementary Materials
The following are available online at https://www.mdpi.com/2073-4441/12/9/2454/s1, Table S1: Instrumental and operation parameters of MC-ICP-MS; Table S2: Elemental compositions of the analyzed bottled mineral and spring waters; Table S3: Summary of elemental concentrations, basic statistics and recommended maximum levels by SI and EU legislation, US EPA and WHO; Table S4: Data from the declarations on the bottles; Table S5: Data for δ2H, δ18O, δ13CDIC, total alkalinity, pH, pCO2, SIcalcite and SIdolomite.
Author Contributions
Conceptualization, T.Z.; Software, T.K. and R.N.; Formal analysis, T.Z., T.K., and P.V; Investigation, T.Z., T.K., and P.V.; Resources, T.Z., T.K., and P.V.; Data curation, T.Z., T.K., and P.V. Writing—original draft preparation, T.Z.; Writing—review and editing, T.Z., T.K., P.V., and R.N.; Visualization, T.Z., T.K., and P.V.; Supervision, T.Z., T.K., and P.V.; Project administration, T.Z.; Funding acquisition, T.Z., T.K., and P.V. All authors have read and agreed to the published version of the manuscript.
Funding
The Slovenian Research Agency funded this research through the ARRS Programme P1-0143, MASSTWIN – Spreading excellence and widening participation in support of mass spectrometry and related techniques in Health, the Environment and Food Analysis (H2020, GA no. 692241), ERA Chair ISO-FOOD for isotope techniques in food quality, safety, and traceability (H2020, GA No. 621329) and bilateral project BI-US/19-21-078.
Acknowledgments
Special thanks go to S. Žigon for his valuable help with H, O, and C isotope analysis.
Conflicts of Interest
The authors declare no conflict of interest.
References
- Statista. Available online: www.statista.com (accessed on 14 September 2018).
- Natural Mineral & Spring Waters The Natural Choice For Hydration. Available online: www.efbw.org (accessed on 14 September 2018).
- European Commission. Council Directive 80/777/EEC of 15 July 1980 on the Approximation of the Laws of the Member States Relating to the Exploiting and Marketing of Natural Waters. Off. J. L. 1980, 229, 1–10. [Google Scholar]
- European Commission. Directive 2009/54/EC of the European Parliament and of the Council of 18 June 2009 on the Exploitation and Marketing of Natural Mineral Waters. Off. J. Eur. Union 2009, 164, 45–58. [Google Scholar]
- European Commission. Council Directive 98/83/EC of 3 November 1998 on the Quality of Water Intended for Human Consumption. Off. J. L. 1998, 330, 32–54. [Google Scholar]
- European Commission. Commission Directive 2003/40/EC of 16 May 2003 Establishing the List Concentration Limits and Labelling Requirements for the Constituents of Natural Mineral Waters and the Conditions for Using Ozone-Enriched Air for the Treatment of Natural Mineral Waters and Spring Waters. Off. J. L. 2003, 126, 34–39. [Google Scholar]
- Brenčič, M.; Vreča, P. Identification of sources and production processes of bottled waters by stable hydrogen and oxygen isotope ratios. Rapid Commun. Mass Spectrom. 2006, 20, 3205–3212. [Google Scholar] [CrossRef] [PubMed]
- Felipe-Sotelo, M.; Henshall-Bell, E.R.; Evans, N.D.M.; Read, D. Comparison of the chemical composition of British and continental European bottled waters by multivariate analysis. J. Food Compos. Anal. 2015, 39, 33–42. [Google Scholar] [CrossRef]
- Pip, E. Survey of the bottled drinking water available in Manitoba, Canada. Environ. Health Perspect. 2000, 108, 863–866. [Google Scholar] [CrossRef]
- Spangenbery, J.E.; Vennemann, T.W. The stable hydrogen and oxygen isotope variation of water stored in polyethylene terephthalate (PET) bottles. Rapid Commun. Mass Spectrom. 2008, 22, 672–676. [Google Scholar] [CrossRef]
- Ferjan, T.; Brenčič, M.; Vreča, P. Changes in isotopic composition of bottled natural mineral waters due to different storage conditions. In Proceedings of the V: International Symposium on Isotopes in Hydrology, Marine Ecosystems, and Climate Change Studies, Monaco, Monaco, 27 March–1 April 2011; International Atomic Energy Agency: Vienna, Austria, 2011; p. 153. [Google Scholar]
- Ferjan, T. Determination of Sources of Bottled Waters; in Slovene. Ph.D. Thesis, University of Ljubljana, Ljubljana, Slovenia, 2012. [Google Scholar]
- Cartwright, I.; Weaver, T.; Petrides, B. Controls on 87Sr/86Sr ratios of groundwater in silicate-dominated aquifers: SE Murray Basin, Australia. Chem. Geol. 2007, 246, 107–123. [Google Scholar] [CrossRef]
- Kim, G.E.; Shin, W.J.; Ryu, J.S.; Choi, M.S.; Lee, K.S. Identification of the origin and water type of various Korean bottled waters using strontium isotopes. J. Geochem. Explor. 2013, 132, 1–5. [Google Scholar] [CrossRef]
- Frei, K.; Frei, R. The geographic distribution of strontium isotopes in Danish surface waters–A base for provenance studies in archaeology, hydrology and agriculture. Appl. Geochem. 2011, 26, 326–340. [Google Scholar] [CrossRef]
- Dansgaard, W. Stable isotopes in precipitation. Tellus 1964, 16, 436–468. [Google Scholar] [CrossRef]
- Atekwana, E.A.; Krishnamurthy, R.V. Seasonal variations of dissolved inorganic carbon and δ13C of surface waters: Application of a modified gas evaluation technique. J. Hydrol. 1998, 205, 260–278. [Google Scholar] [CrossRef]
- Frengstad, B.S.; Lax, K.; Tarvainen, T.; Jæger, Ø.; Wigum, B.J. The chemistry of bottled mineral and spring waters from Norway, Sweden, Finland and Iceland. J. Geochem. Explor. 2010, 107, 350–361. [Google Scholar] [CrossRef]
- Birke, M.; Rauch, U.; Harazim, B.; Lorenz, H.; Glatte, W. Major and trace elements in German Bottled water, their regional distribution, and accordance with national and international standards. J. Geochem. Explor. 2010, 107, 245–271. [Google Scholar] [CrossRef]
- Montgomery, J.; Evans, J.A.; Wildman, G. 87Sr/86Sr isotope composition of bottled British mineral waters for environmental and forensic purposes. Appl. Geochem. 2006, 21, 1626–1634. [Google Scholar] [CrossRef]
- Voerkelius, S.; Lorenz Gesine, D.; Rummel, S.; Quétel, C.R.; Heiss, G.; Baxter, M.; Brach-Papa, C.; Deters-Itzelsberger, P.; Hoelzl, S.; Hoogewerff, J.; et al. Strontium isotopic signatures of natural mineral waters, the reference to a simple geological map and its potential for authentication of food. Food Chem. 2010, 118, 933–940. [Google Scholar] [CrossRef]
- Brenčič, M.; Vreča, P. Isotopic composition of dissolved inorganic carbon in bottled waters on the Slovene market. Food Chem. 2007, 101, 1516–1525. [Google Scholar] [CrossRef]
- Redondo, R.; Yélamas, J.G. Determination of CO2 origin (natural and industrial) in sparkling bottled waters by 13C/12C isotope ratio analysis. Food Chem. 2005, 92, 507–514. [Google Scholar] [CrossRef]
- Raco, B.; Dotsika, E.; Cerrina Feroni, A.; Battaglini, R.; Poutoukis, D. Stable isotope composition of Italian bottled waters. J. Geochem. Explor. 2013, 124, 203–211. [Google Scholar] [CrossRef]
- ARSO. 2019. Available online: www.arso.gov.si/en/water (accessed on 26 April 2019).
- Brenčič, M.; Vreča, P. General chemistry of bottled waters on the Slovene market. Mater. Geoenviron. 2005, 52, 549–560. [Google Scholar]
- Brenčič, M.; Ferjan, T.; Gosar, M. Geochemical survey of Slovenian bottled waters. J. Geochem. Explor. 2010, 107, 400–409. [Google Scholar] [CrossRef]
- Coplen, T.; Wildman, J.; Chen, J. Improvements in the gaseous hydrogen-water equilibration technique for hydrogen isotope ratio analysis. Anal. Chem. 1991, 63, 910–912. [Google Scholar] [CrossRef]
- Epstein, S.; Mayeda, T. Variations of 18O content of waters from natural sources. Geochim. Cosmochim. Acta 1953, 4, 213–224. [Google Scholar] [CrossRef]
- Avak, H.; Brand, W.A. The finning MAT HDO-equilibration—A fully automated H2O/gas phase equilibration system for hydrogen and oxygen isotope analyses. Thermo Electron. Corp. Appl. News 1995, 11, 1–13. [Google Scholar]
- Clesceri, L.S.; Greenberg, A.E.; Eaton, A.D.; American Public Health Association (APHA); American Water Works Association (AWWA); Water Environment Federation (WEF). Standard Methods for the Examination of Water and Wastewater, 20th ed.; American Public Health Organization: Washington, DC, USA, 1998. [Google Scholar]
- Miyajima, T.; Yamada, Y.; Hanba, Y.T. Determining the stable isotope ratio of total dissolved inorganic carbon in lake water by GC/C/IRMS. Limnol. Oceanogr. 1995, 40, 994–1000. [Google Scholar] [CrossRef]
- Spötl, C. A robust and fast method of sampling and analysis of δ13C of dissolved inorganic carbon in ground waters. Isot. Environ Health Stud. 2005, 41, 217–221. [Google Scholar] [CrossRef]
- Parkhurst, D.L.; Appelo, C.A.J. User’s Guide to PHREEQC (Version 2)—A Computer Program for Speciation, Batch-Reaction, One-Dimensional Transport, and Inverse Geochemical Calculations; Water Resources Investigations Report 99-4259; U.S. DEPARTMENT OF THE INTERIOR: Denver, CO, USA, 1999.
- R Core Team 2019: R: A Language and Environment for Statistical Computing; R Foundation for Statistical Computing: Vienna, Austria; Available online: https://www.R-project.org/ (accessed on 1 October 2019).
- Wickham, H. ggplot2: Elegant Graphics for Data Analysis; Springer: New York, NY, USA, 2016. [Google Scholar]
- Petrović, T.; Zlokolica-Mandić, M.; Veljković, N.; Vidojević, D. Hydrogeological conditions for the forming and quality of mineral waters in Serbia. J. Geochem. Explor. 2010, 107, 373–381. [Google Scholar] [CrossRef]
- Demetriades, A.; Reimann, C.; Birke, M.; The Eurogeosurveys Geochemistry EGG Team. European ground water geochemistry using bottled water as a sampling medium. In Clean Soil and Safe Water; NATO Science for Peace and Security Series; Quercia, F.F., Vidojevic, D., Eds.; Springer: Dordrecht, The Netherlands, 2012; pp. 115–139. [Google Scholar]
- Republic of Slovenia, Ministry of Health. Drinking Water Regulations of 1 March 2004; Official Gazette of the Republic Slovenia: Ljubljana, Slovenia, 2004; Volume 19, pp. 2155–2158.
- US EPA, Safe Drinking Water Act. 2019. Available online: www.epa.gov/ground-water-and-drinking-water (accessed on 26 April 2019).
- World Health Organization. Guidelines for Drinking-Water Quality; World Health Organization: Geneva, Switzerland, 2008. [Google Scholar]
- Lapajne, A. Hydrogeological properties of the thermal source Rimske Toplice. Geologija 2002, 45, 451–456. [Google Scholar]
- Kanduč, T.; Mori, N.; Kocman, D.; Stibilj, V.; Grassa, F. Hydrogeochemistry of Alpine springs from North Slovenia: Insights from stable isotopes. Chem. Geol. 2012, 300, 40–54. [Google Scholar] [CrossRef]
- Kanduč, T.; Mori, N.; Koceli, A.; Verbovšek, T. Hydrogeochemistry and isotopic geochemistry of the Velenje basin groundwater. Geologija 2016, 51, 7–22. [Google Scholar] [CrossRef]
- Verbovšek, T.; Kanduč, T. Isotope geochemistry of groundwater from fractured dolomite aquifers in central Slovenia. Aquat. Geochem. 2016, 22, 131–151. [Google Scholar] [CrossRef]
- Romanek, C.S.; Grossman, E.L.; Morse, J.W. Carbon isotopic fractionation in synthetic aragonite and calcite: Effects temperature and precipitation rate. Geochim. Cosmochim. Acta 1992, 46, 419–430. [Google Scholar] [CrossRef]
- Clarke, I.D.; Fritz, P. Environmental Isotopes in Hydrogeology; Lewis: New York, NY, USA, 1997; p. 328. [Google Scholar]
© 2020 by the authors. Licensee MDPI, Basel, Switzerland. This article is an open access article distributed under the terms and conditions of the Creative Commons Attribution (CC BY) license (http://creativecommons.org/licenses/by/4.0/).