Article

Spatiotemporal Dynamics of Dissolved Organic Carbon and Freshwater Browning in the Zoige Alpine Wetland, Northeastern Qinghai-Tibetan Plateau

1
Department of Environmental Science and Engineering, School of Architecture and Environment, Sichuan University, Chengdu 610065, China
2
Department of Environmental Engineering, School of Architecture and Civil Engineering, Chengdu University, Chengdu 610106, China
*
Author to whom correspondence should be addressed.
Water 2020, 12(9), 2453; https://doi.org/10.3390/w12092453
Submission received: 10 July 2020 / Revised: 28 August 2020 / Accepted: 28 August 2020 / Published: 31 August 2020
(This article belongs to the Special Issue Emerging Trends in Freshwater Ecology and Ecosystem Management)

Abstract

:
The concentrations of dissolved organic carbon (DOC) and its light-absorbing fraction (chromophoric dissolved organic matter; CDOM) in surface waters, particularly those draining organic-rich peatlands, have dramatically increased over the past decade due to climate change and human disturbance. To explore the spatiotemporal dynamics of DOC and CDOM in surface waters of the northeastern Qinghai-Tibetan Plateau, we collected water samples from two rivers in the Zoige alpine wetland and from two rivers in its adjacent alpine-gorge region, during wet and dry seasons. DOC concentration ranged from 4.82 mg·L−1 to 47.83 mg·L−1, with a mean value of 15.04 mg·L−1, 2.84 times higher than the global average. The Zoige rivers had higher DOC concentration and highly terrigenous CDOM. Significantly higher DOC concentration was observed for the Zoige rivers in the wet season compared to the dry season. In contrast, the alpine-gorge rivers had higher DOC levels in the dry season. No significant correlations were observed between DOC and CDOM at all rivers due to the influence of autochthonous sources on the alpine-gorge rivers and intensive photochemical degradation of terrigenous DOM in the Zoige rivers. Significant relationships between CDOM and specific ultraviolet absorbance at 254 nm (SUVA254) and between CDOM/DOC and SUVA254 were observed, indicating that the aromaticity of DOM in the rivers was mainly determined by CDOM. Moreover, the DOC/CDOM properties of the Hei River indicate critical human-induced water quality degradation. High DOC level and high browning degree were found in rivers in the Zoige alpine wetland, indicating that large amounts of terrigenous DOC were released to the aquatic systems of the region.

1. Introduction

Dissolved organic matter (DOM), operationally measured as dissolved organic carbon (DOC) and defined as the organic fraction in solution that passes through a 0.45 μm filter [1], is a ubiquitous component in soils and natural waters which establishes a connection between terrestrial and aquatic carbon pools [2,3]. DOC is related to the energy supply, light penetration, the biogeochemical cycles of carbon (C) and elements coupled to C, and the transportation of metals and nonpolar organic contaminants in waters [4,5,6], and thus plays an important role in environmental processes in aquatic ecosystems. Moreover, DOC acts as the precursor of the carcinogenic by-products (e.g., trihalomethanes) produced in the water disinfection process, exerting adverse effects on the quality of drinking water and human health [7]. Therefore, variation of the DOC concentration and composition may not only impose change on physical, chemical, and biological features in aquatic ecosystems, but may also affect the use of water by the local population.
Freshwater browning, referring to the phenomenon of brown, tea-stained color in waters caused by the increase of dissolved organic matter (DOM) loads into aquatic water systems [8], is observed in many areas throughout the northern Hemisphere, including northern Europe and northeastern United States [3,9,10]. Generally, DOM consists of one fraction of low-molecular weight compounds, such as carbohydrates and amino acids, and another fraction of complicated, high-molecular weight compounds (i.e., humic substances) [3]. Humic substances absorb ultraviolet and short-wave visible light, and any increase of them contributes to the brown coloration in waters [8,11]. Colored or chromophoric dissolved organic matter (CDOM), defined by the component of DOM capable of absorbing light in the range from the ultraviolet to visible wavelength in natural water systems, mostly consists of humic substances [4,12]. CDOM is considered to be closely related to the photochemistry and ecology of the aquatic system due to its special optical and chemical properties [4]. CDOM parameters, which can be determined by ultraviolet-visible absorption and fluorescence measurements, have been widely used to indicate the chemical composition, molecular weight, photochemical degradation degree of DOM, and to trace sources [12,13,14]. DOM and CDOM in aquatic ecosystems may be autochthonous (from microbial and phytoplankton processes) and/or allochthonous (from terrestrial natural and anthropogenic inputs) [15,16]. Allochthonous sources, particularly terrigenous ones (mainly composed of humic and fulvic acids), are the main sources of CDOM in river waters and thus, a major driver of the spatiotemporal CDOM dynamics [15,17]. Terrigenous DOM contains more humus, aromatic, and high-molecular-weight compounds than autochthonous DOM (which is mainly composed of protein-like material) [18]. In contrast, algal-derived DOM contains fewer colored components than DOM derived from the breakdown of vascular plants, and DOC of anthropogenic origin is mostly uncolored [4]. Therefore, as an important component of DOM, CDOM provides a powerful optical approach to investigate DOM dynamics and characteristics in aquatic ecosystems in the context of climate change and human disturbances.
A growing number of studies are focused on the increase of DOC in aquatic ecosystems and its potential drivers over the last decades [1,3]. It is broadly agreed that freshwater browning is driven by the global change trends through mechanisms related to changes of deposition chemistry [9], land use change [19], temperature increase [20], drought [21], etc. Among various ecosystems affected by global change, the wetlands and peatlands in high latitude/altitude areas (or permafrost) stand out as being very sensitive, as well as having the largest amounts of soil carbon stocks [22,23]. The Zoige alpine wetland, located in the northeastern part of the Qinghai-Tibetan Plateau (QTP), is considered to have the largest alpine peatland distribution area in the world [24,25], storing up to 0.206–0.672 Pg of peat [23]. Moreover, the Zoige wetland serves as an important natural reservoir for the Yellow river [24], thus the dynamics of DOC in the wetland surface waters influence the carbon cycle and water quality of the downstream area. Nevertheless, according to a study by Chen et al. [23], which estimated the carbon storage of Zoige peatlands, the total area of the peatland is 4605 km2, of which 1426 km2 has been degraded as a result of human activities and intense climate warming, accompanied with substantial carbon being released from peatlands to the atmosphere through CO2 and to nearby waters through particle organic carbon or DOC. To date, there have been few studies related to DOC in the Zoige peatlands, most of which focused on C stocks or DOC dynamics or in soils [26,27,28,29], with only a few focused on the C dynamics in the aquatic systems [30].
The purpose of this study is to explore the spatiotemporal dynamics of DOC and CDOM, in relation to the browning of surface waters, in the Zoige wetland, northeastern Qinghai-Tibetan Plateau. To broaden our understanding of the carbon pathways between terrestrial and aquatic ecosystems, we sample 35 river sites in the Zoige wetland and its adjacent alpine-gorge areas in the wet and dry seasons (June and November, respectively) of 2018. We specifically aim to (i) explore the spatiotemporal distribution patterns of DOC and evaluate DOC concentration; (ii) determine the spatiotemporal variation of CDOM absorption spectral parameters (through ultraviolet-visible absorption) and identify the characteristics and sources of DOM; (iii) evaluate the relationships between DOC and CDOM absorption parameters, and further investigate DOM and CDOM quality, sources, and their roles in environmental processes.

2. Materials and Methods
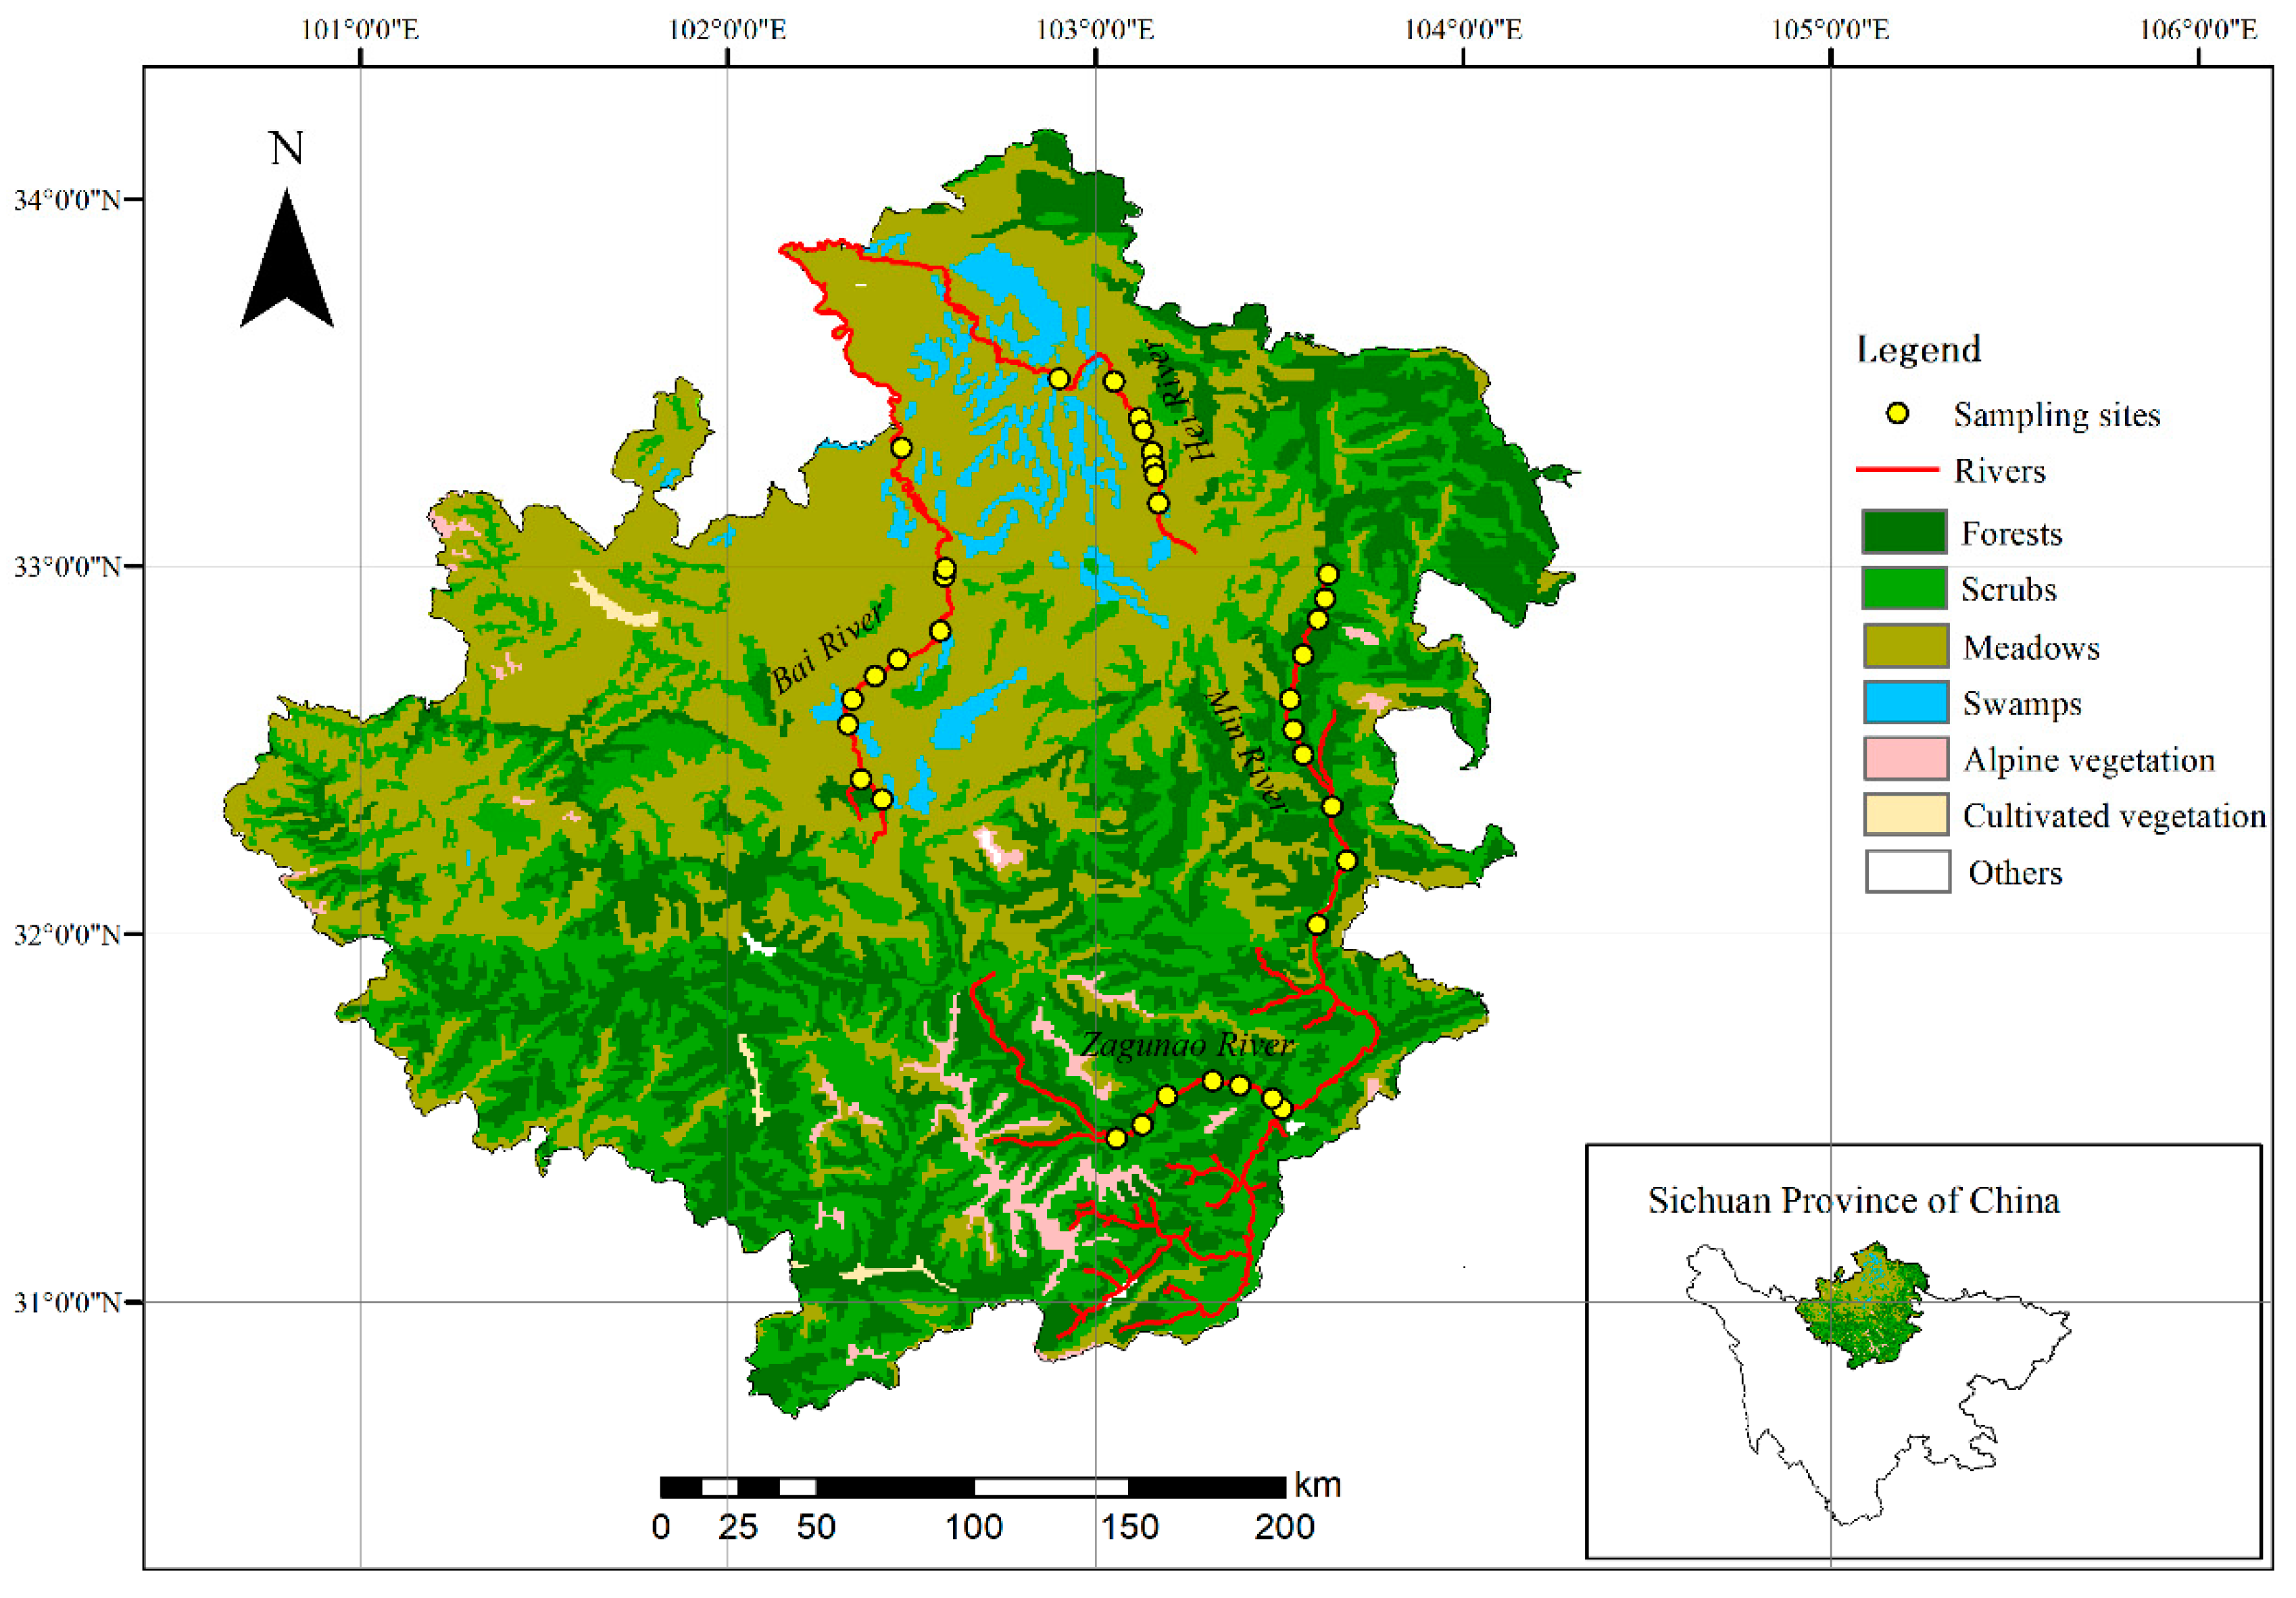
2.1. Study Area

Two rivers in the Zoige wetland, the Bai River and the Hei River (major tributaries of the Yellow River), and two rivers in the alpine-gorge area of the northeastern QTP, the Zagunao River and the Min River, were examined (Figure 1). With an average altitude over 3500 m, the Zoige wetland has a cold, humid continental monsoon climate. The mean annual temperature is around 1 °C, with the highest monthly mean temperature recorded in July (10.7 °C) and the lowest in January (−10.1 °C). The mean annual precipitation is around 650 mm, 86% of which falls during April and October (data were obtained from 1971–2000 climate data of the Zoige meteorological station). In the Zoige region, the growing season is very short (May to September), and so is the non-frozen period (16–25 days) [25]. The main land cover types of the Zoige region are alpine meadow and swamp meadow [31]. The Min River is the largest tributary in the upper reaches of the Yangtse River. In this study, we focused on the upstream of the Min River (tracing to the headwater) and the Zagunao River (the largest tributary of the Min River). Compared to the climate conditions of the Zoige wetland, this watershed region also has distinct dry and wet seasons, but has slightly higher temperature and precipitation levels. In addition, forests and scrubs are the main land cover types in the alpine-gorge river basins. Land vegetation data were obtained from Resource and Environment Data Cloud Platform of Institute of Geographical Sciences and Natural Resources Research, Chinese Academy of Sciences.

2.2. Water Sample Collection

Water samples were collected from 35 sites across the four rivers in June and November (representing wet and dry seasons) of 2018 (Supplementary Materials Table S1). Teflon sampling bottles were washed once with soap water and then several times with ultra-pure water before being dried in an oven at 60 °C [32]. After pre-rinsing the Teflon sampling bottles three times with the surface water, we collected three parallel samples and preserved them in a dark refrigerator at 4 °C. After the collection, the samples were immediately transported to the laboratory, and were filtered through 0.45 μm filters (PVDF, Millipore, MA, USA) before analysis.

2.3. DOC and CDOM Absorption Determination

A Milti N/C 2100S Total Organic Carbon (TOC) analyzer (Analytik Jena, Germany) was used to measure the DOC and total dissolved nitrogen (TDN) concentrations (mg·L−1) [33]. Absorption spectra of the samples were measured between 240 and 550 nm at 3 nm intervals using an Aqualog® spectrophotometer (Horiba, HORIBA Instruments Incorporated, NJ, USA) with a 1 cm quartz cuvette, with Milli-Q water used as reference [33]. The CDOM absorption coefficient a ( λ 0 ) (m−1) was calculated from:
a ( λ ) = 2.303 A ( λ ) / l ,
where A ( λ ) is the measured absorbance at wavelength λ and l is the cuvette path length 1 cm [12]. The absorption coefficient at 355 nm was selected to represent the relative concentration of CDOM [33,34,35]. SUVA254 (L·mg C−1·m−1) was defined as dividing the UV absorbance at λ = 254 nm by the DOC concentration (mg·L−1), and higher values indicate greater aromaticity [14]. The spectral slope parameter (S) was calculated from:
a ( λ ) = a ( λ 0 ) × e s ( λ 0 λ ) ,
where a ( λ ) is the CDOM absorption coefficient at wavelength λ , a ( λ 0 ) is the absorption coefficient at a reference wavelength λ 0 [13]. The spectral slope ratio (SR) was calculated as the ratio of S275–295 to S350–400, with higher values indicative of lower aromaticity and lower molecular weight [12].

2.4. Fluorescence Determination

Excitation-emission matrices (EEMs) fluorescence spectra were also measured on the Aqualog® spectrophotometer (Horiba, HORIBA Instruments Incorporated, NJ, USA) with Milli-Q water as reference [33]. The excitation wavelength (Ex) and emission wavelength (Em) ranged from 240 to 550 nm and 214 to 619 nm, respectively. The intervals and slits were at 3.0 nm and 2.5 nm, respectively. The Raman scattering and Rayleigh scattering were automatically eliminated from analysis by the system [33]. The fluorescence index (FI) was calculated by dividing the fluorescence intensity at 450 nm by that at 500 nm with Ex = 370, which can be used to distinguish between terrestrial DOM (FI < 1.4) and microbial DOM (FI > 1.9) [36]. The humification index (HIX) was defined as dividing the cumulative fluorescence intensity at 435–480 nm by that at 300–345 nm with Ex = 254, with higher values indicative of higher humification degree of DOM [37]. Data of FI and HIX are presented in the Supplementary Materials Figure S1 online.
Statistical analysis was carried out using the Python 3.7 software package and the IBM SPSS Statistics 21 software (IBM, Armonk, NY, USA). The Shapiro-Wilk (SW) test was applied to determine if the response variable of each group of data would have a normal distribution. Based on the distribution pattern of each variable, ANOVA (for a normal distribution) or Mann-Whitney (for non-normal distributions) were used to test for significance differences among groups, and Pearson’s correlation (normal) or Spearman’s correlation (non-normal) was used for correlation analysis. Assuming that the terrestrial DOM input and the microbial activity related with autochthonous processes were both high in summer, data from June for all sampling sites were used to conduct the hierarchical clustering to determine the DOM types in the four rivers. Hierarchical clustering analysis was performed through Ward’s method with squared Euclidian distance as the measurement of similarity, and the variables involved in the process were DOC concentration, a (355), SUVA254, SR, TDN, FI, and HIX.

3. Results and Discussion

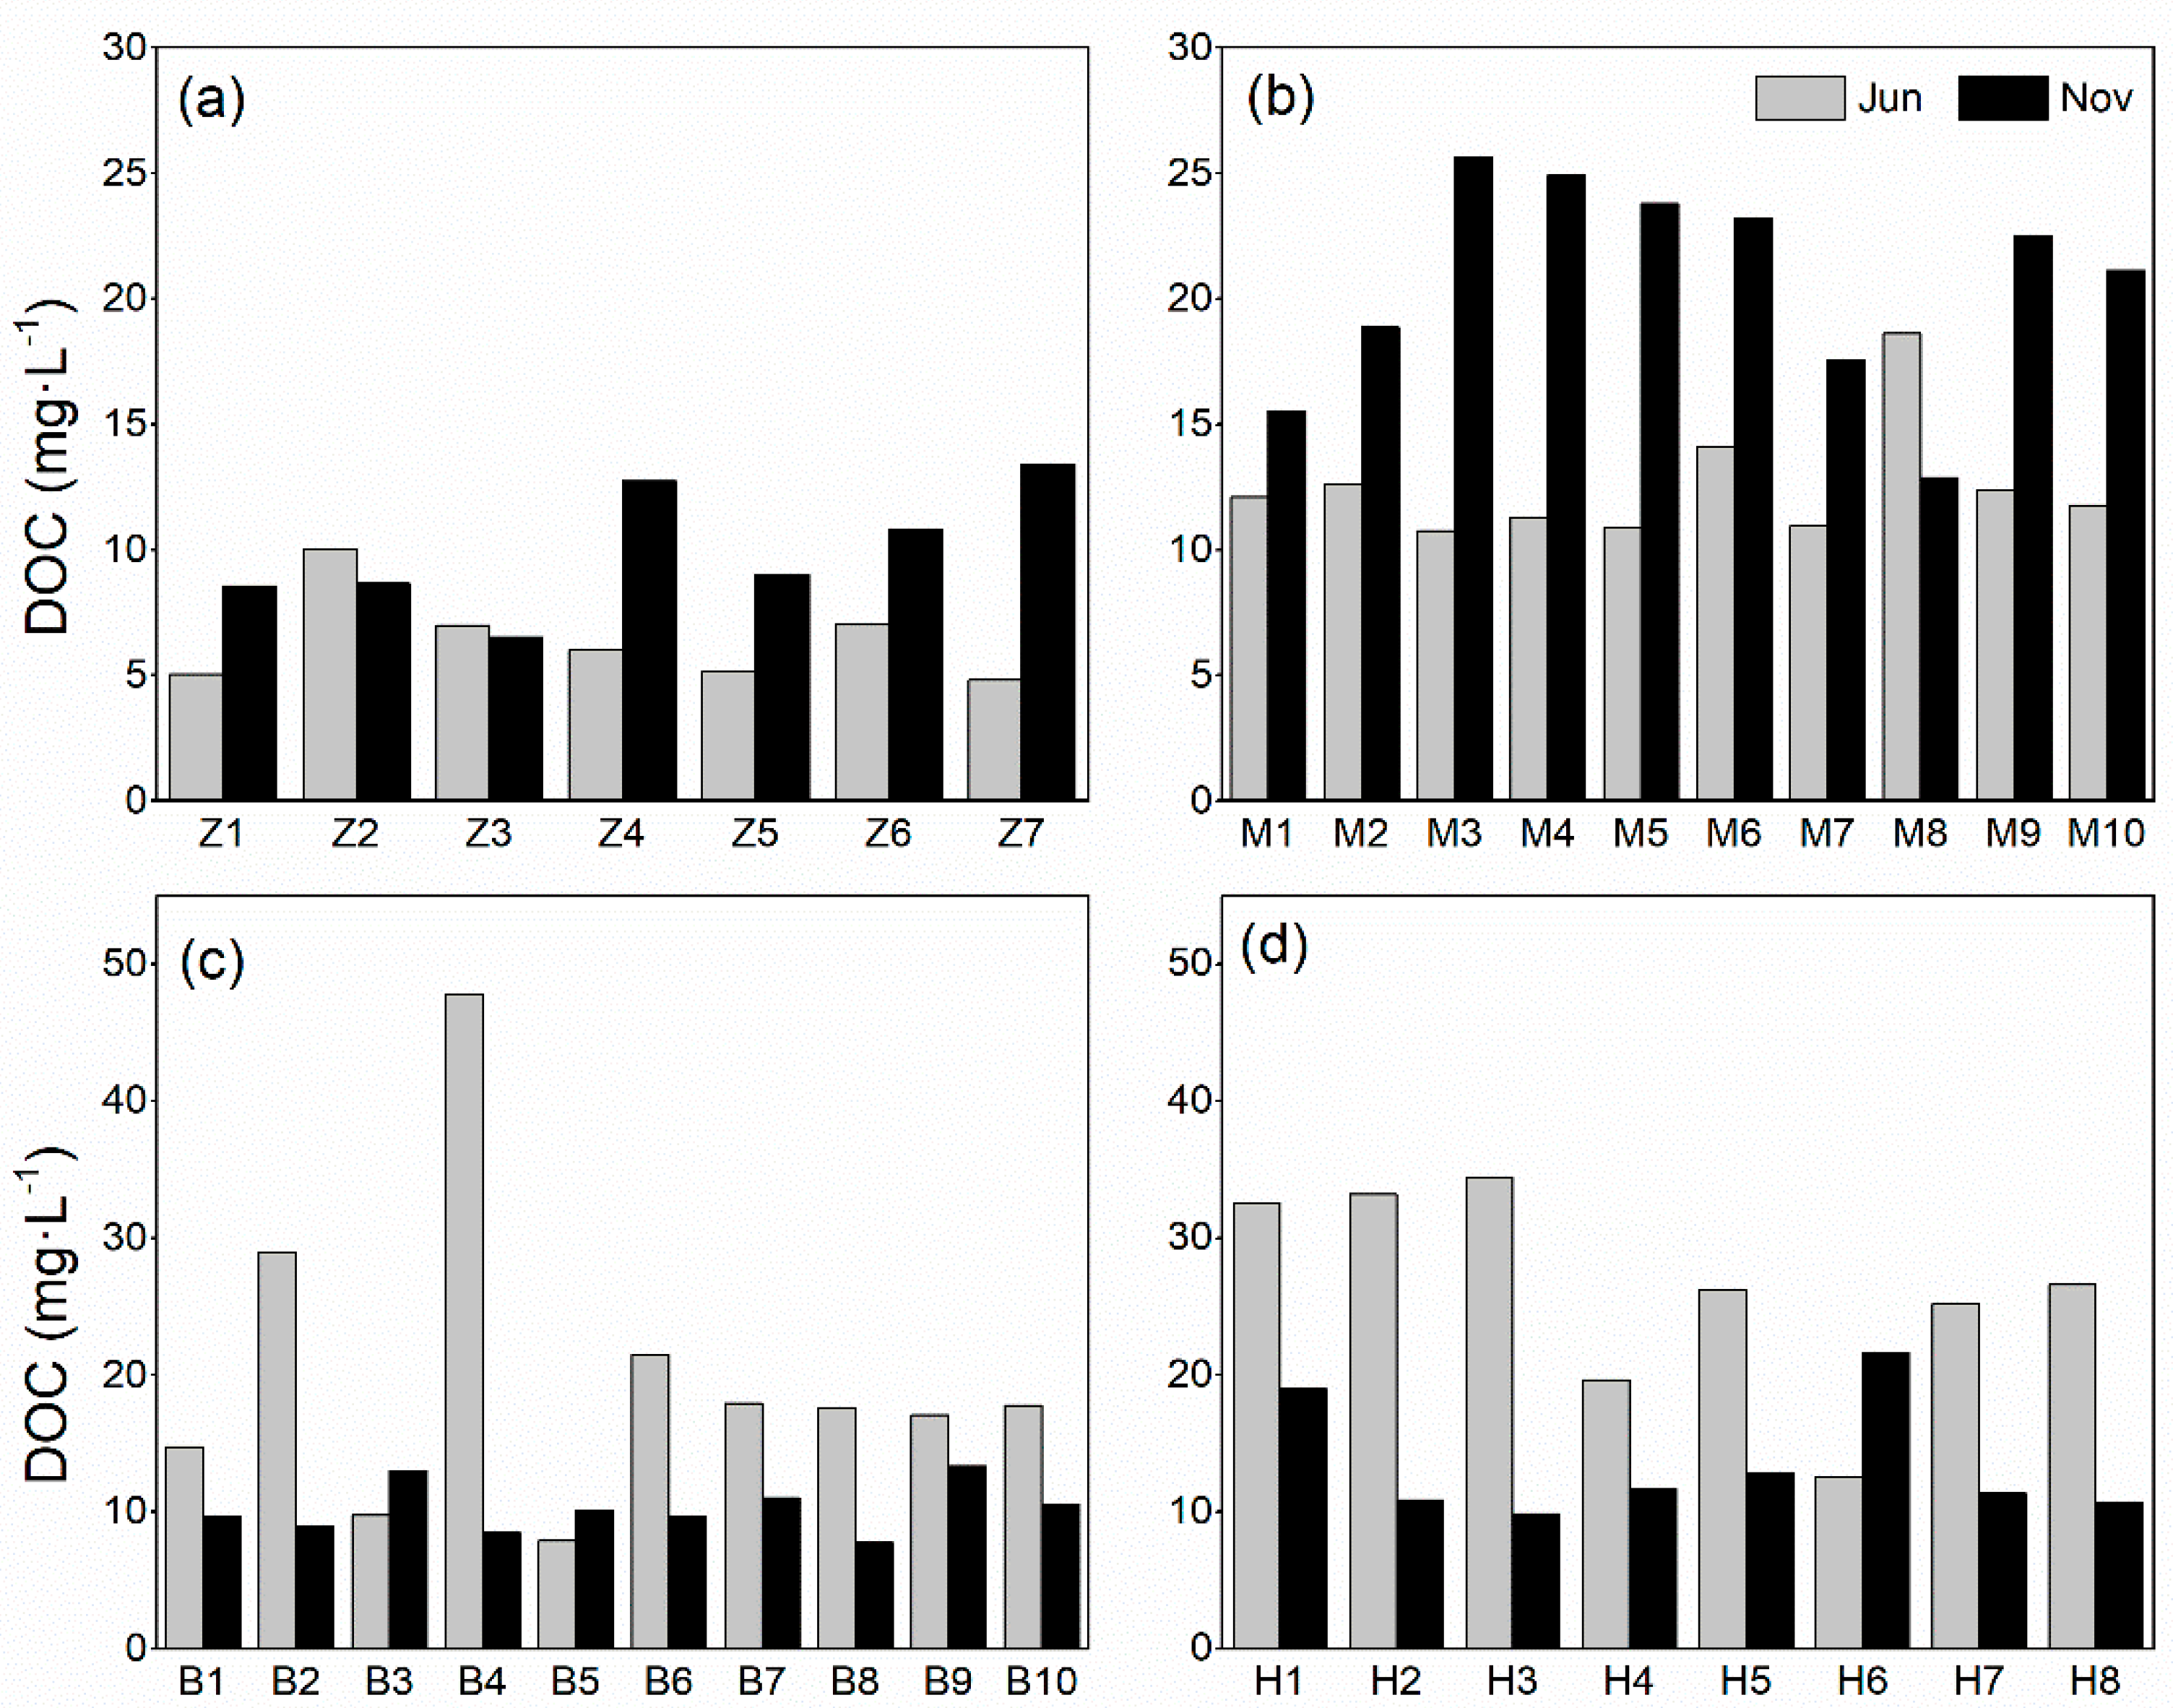
3.1. DOC Concentration

DOC concentration in rivers is affected by climate, land cover, soil characteristics and structure, runoff, and anthropogenic activities [38,39,40,41]. In our study area, DOC concentration ranged from 4.82 mg·L−1 in the Zagunao River to 47.83 mg·L−1 in the Bai River, with a mean value of 15.04 mg·L−1. (Figure 2). The mean DOC concentration in the rivers of our study area was not only higher than that in other rivers of the Qinghai-Tibetan Plateau (1.16–6.57 mg·L−1) [42,43,44] and the global average (5.3 mg·L−1) [45], but also higher than that in African (8.0 mg·L−1) [45] and Arctic rivers (12 mg·L−1) [46]. Although differences may exist in the research time scale between our study and others, it can be concluded that the DOC levels in these examined rivers were relatively high in our study periods.

3.1.1. Spatial Variation

The Hei River had the highest mean DOC concentration (19.90 ± 8.85 mg·L−1), followed by the Min (16.58 ± 5.32 mg·L−1), Bai (15.20 ± 9.38 mg·L−1), and the Zagunao rivers (8.20 ± 2.77 mg·L−1) (Figure 2). The varying DOC concentrations could be partly attributed to the varying catchment land cover types, which is further related to the stock of organic carbon in the adjacent terrestrial ecosystems. It has been shown that in the Qinghai-Tibetan Plateau, rivers surrounded by wet meadows and alpine meadows had a higher DOC concentration than those surrounded by alpine steppes and alpine deserts [42]. Similar DOC patterns have been reported for Irish streams as follows: peatland and forest dominated watershed > grassland dominated watershed > arable land dominated watershed [40]. Our results further support these findings. The Hei and Bai rivers, flowing across the Zoige Peatland with catchments dominated by wet meadows and alpine meadows, both had higher DOC levels than the Zagunao Rivers, which is mainly surrounded by forests and scrubs. Besides, exhibiting relatively high values in November, the Min River, which is mainly surrounded by forests and scrubs, had similar mean DOC concentrations to the Bai River. This can be attributed to the high Lignin and cellulose decomposition rates of forest litter during the freeze-thaw period (October to April) around the catchments of the Min River [47], which results in abundant soil DOC being produced and exported to surface streams in November.
As for the spatial fluctuation across sites, since the sites of a specific river have similar climatic and hydrological conditions in a specific season, their variation of DOC concentration is mostly influenced by land cover types and pollution sources (e.g., domestic sewage and other organic pollutants) [48].

3.1.2. Seasonal Variation

All examined rivers showed significant seasonal variation in DOC concentration (p < 0.05) (Figure 2). Higher DOC concentrations were found in June and lower values were found in November in the Zoige rivers (Figure 2c,d). This is consistent with the results reported by research on rivers in a permafrost wetland catchment in northeastern China [49], which found that maximum DOC concentration in rivers coincided with the maximum flood peaks (generally during spring and summer). A study of DOM in several large Arctic Rivers also reported higher DOC concentration in June than compared to November [50]. According to the study of Guo et al. [49], in wet and warm seasons, more DOC in the upper organic soil layer is released to surface streams with the increase of rainfall and fast runoff, and increased thawing depth enables deeper soil layers to release DOC into streams, while in the catchments of alpine-gorge rivers where the carbon stock of the organic soil layer is lower and limited, the terrestrial input of DOC is no longer the crucial factor in determining DOC levels in waters. Thus, the dilution effect of the increased runoff in the alpine-gorge rivers, which contributes to lower DOC concentrations in June, cannot be neglected anymore. In the meantime, the presence of lower DOC concentrations in June than November in the alpine-gorge rivers may also result from the greater influences of photochemical and microbial degradation, considering that the increased light level and longer water residence time in June could both facilitate the degradation of DOM [35].

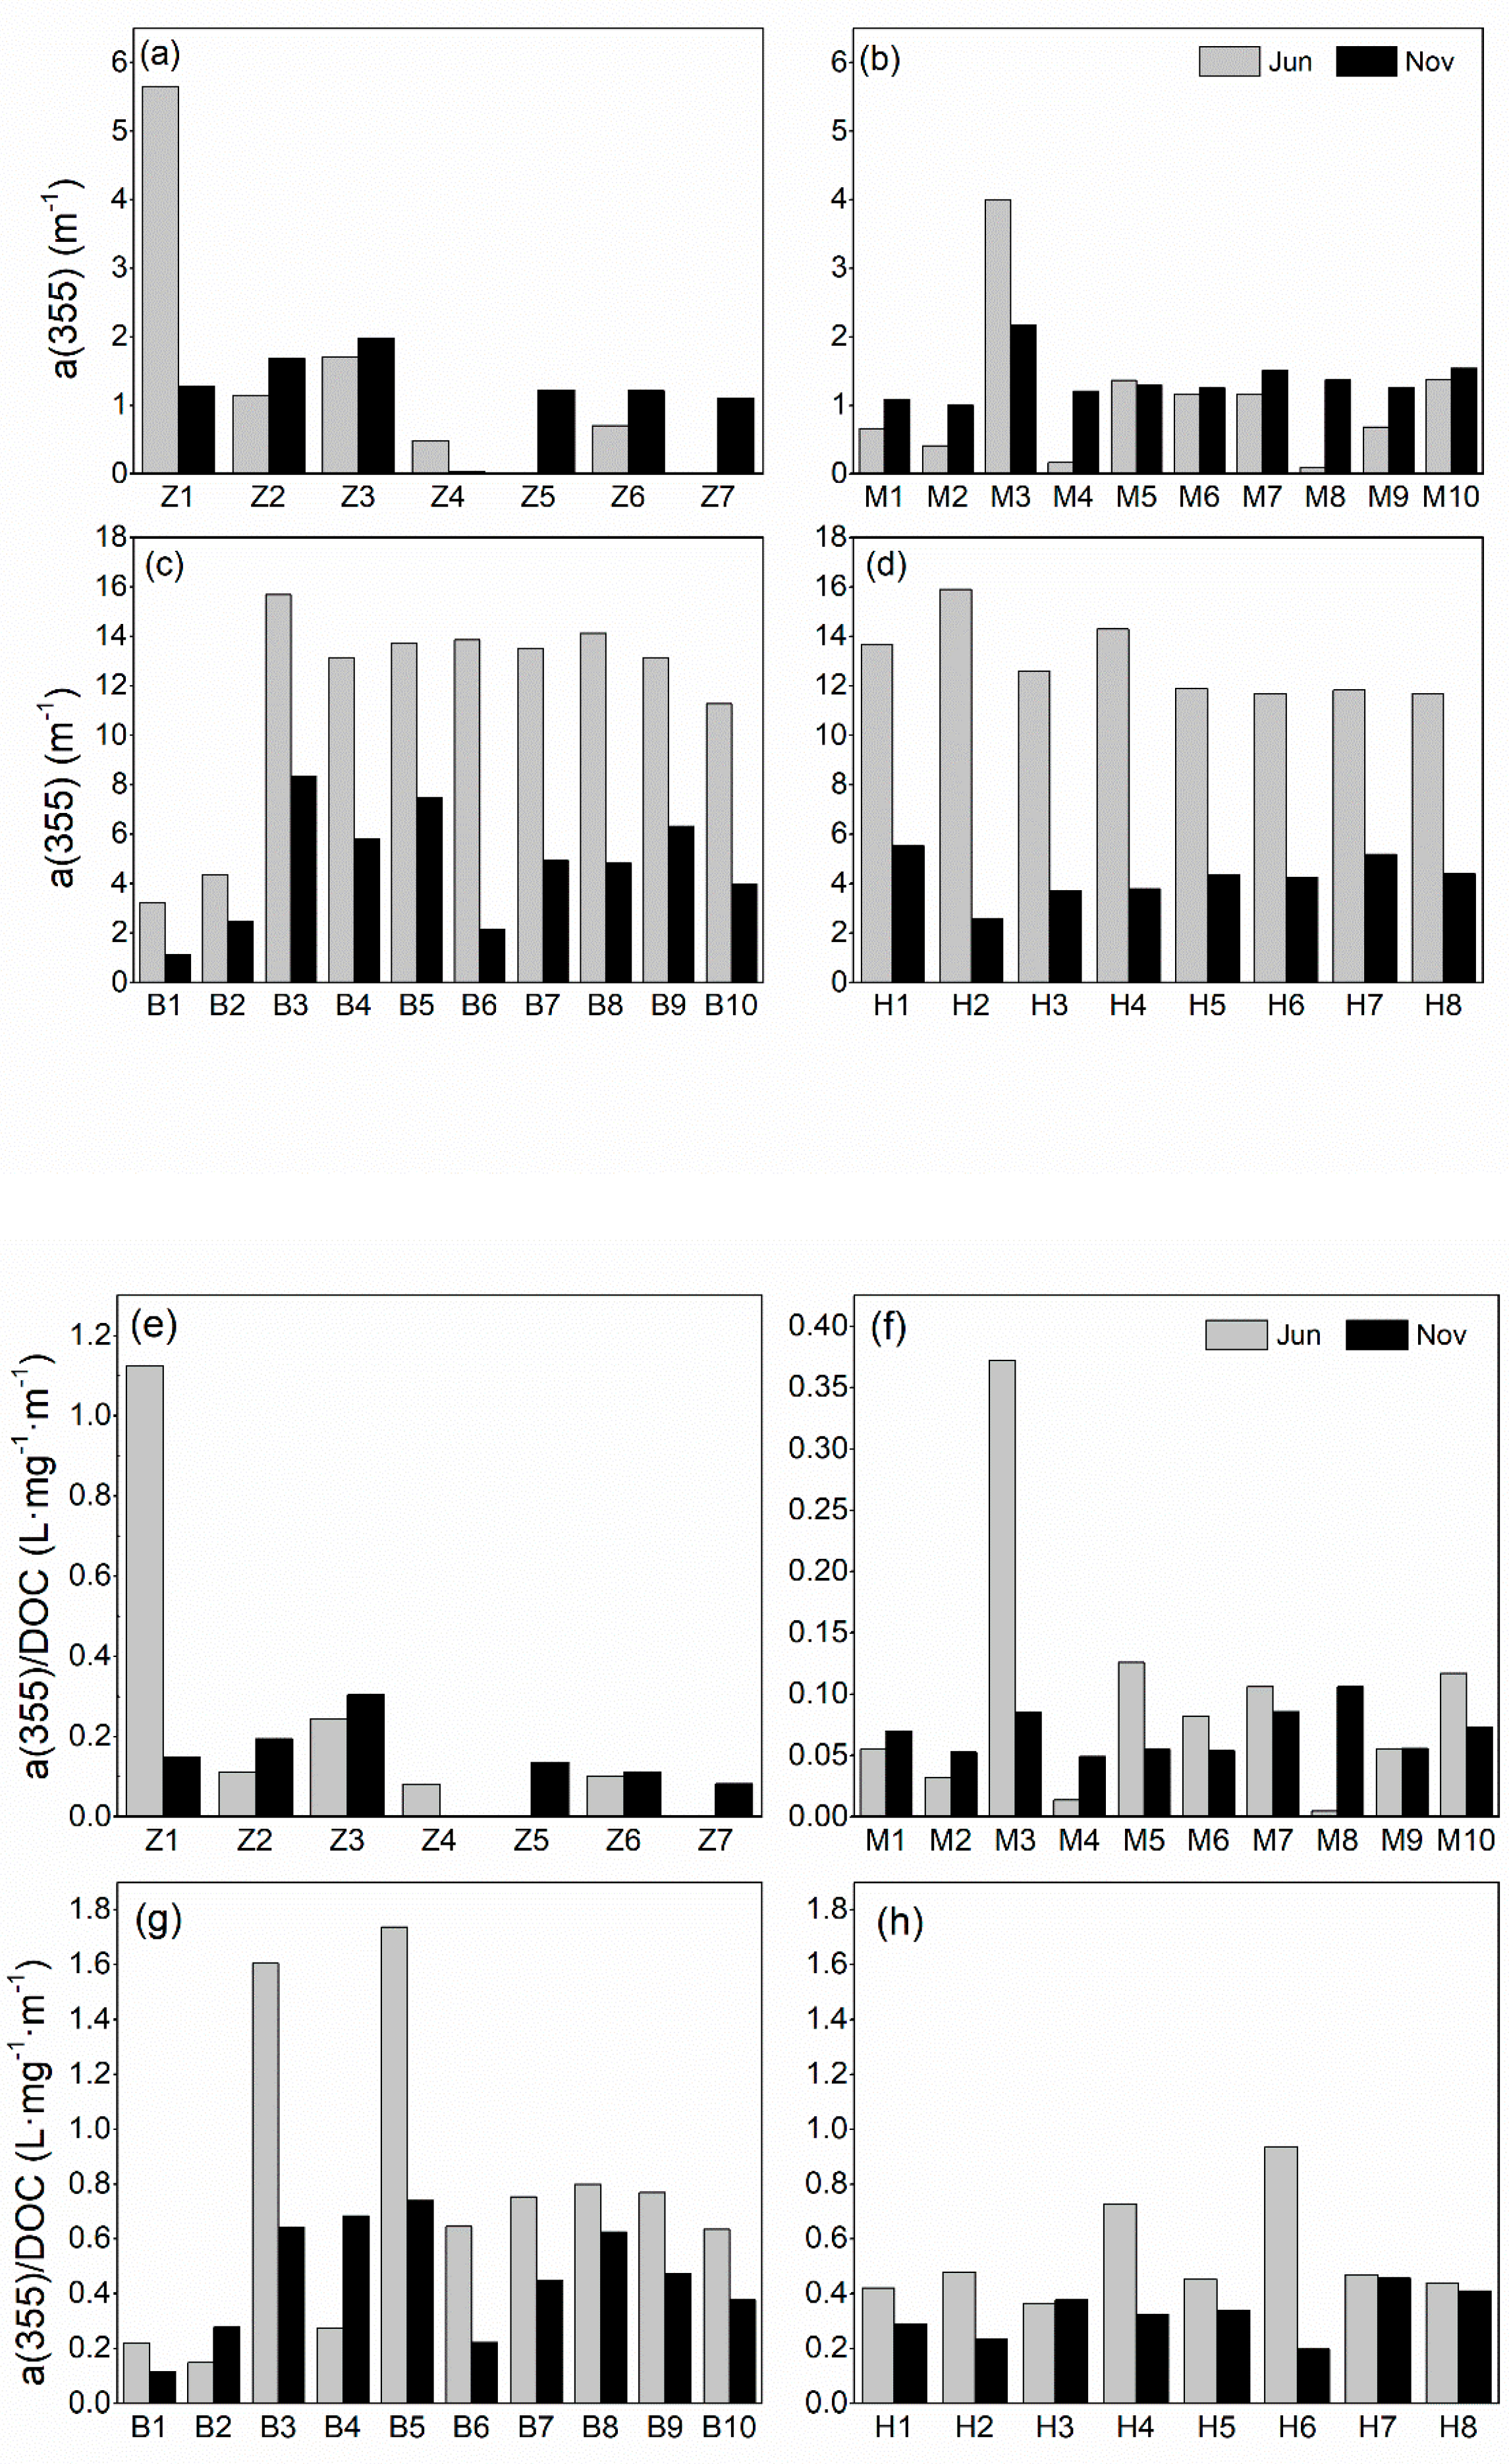
3.2. CDOM Absorption

3.2.1. CDOM and CDOM/DOC

Quantified as a(355), CDOM concentrations ranged from 0 to 15.895 m−1 in the examined rivers (Figure 3a–d). The alpine-gorge rivers had an average a(355) level of 1.26 ± 1.08 m−1, which was close to aquatic systems dominated by autochthonous sources (usually < 1.0 m−1) [51], while the Zoige rivers had an average a(355) level of 8.37 ± 4.71 m−1, belonging to the terrigenous-dominated type (usually > 5.0 m−1) [35]. The Bai River stands out as having the highest average a(355)/DOC, SUVA254, and lowest average SR value of all examined rivers. The Hei river is also noteworthy as having the highest average a(355). The observation of marked terrigenous feature in the Zoige rivers could be attributed to the abundant terrigenous CDOM (DOM) input from the Zoige peatland, where large amounts of peat and humus are stored. Meanwhile, the flat terrain characteristics along the Zoige rivers allow a higher DOC leaching degree of the soil and more DOC release from the bank or sediment into the water system [33]. Furthermore, owing to the high elevation (over 3 km) and low temperature in the Zoige region, the decrease of microbial activity contributes to the accumulation of high-molecular-weight and aromatic DOM in the rivers [17,33]. Seasonal variation of CDOM was significant (p < 0.01) in the Zoige rivers, with higher values observed in June and lower values observed in November (Figure 3c,d). This finding supports the former inference that Zoige rivers accept more terrestrial derived DOC in June. Unlike the Zoige Rivers, the alpine-gorge rivers showed no significant difference in the seasonal variations of a(355) (Figure 3a,b), indicating that the increased precipitation and runoff in June may dilute the terrestrial input of DOC (CDOM).
CDOM/DOC in the rivers was calculated as a proxy for the relative contribution of CDOM to DOC, and covered the range from 0 to1.737 L·mg−1·m−1 among all sampling sites (Figure 3e–h). The Bai River exhibited the highest mean CDOM/DOC value of 0.61 ± 0.43 L·mg−1m−1, followed by the Hei River (0.43 ± 0.18 L·mg−1·m−1), the Zagunao River (0.19 ± 0.28 L·mg−1·m−1), and the Min River (0.08 ± 0.08 L·mg−1·m−1), which was indicative of the great contribution of non-chromophoric organic matter to DOC in the alpine-gorge rivers and the important contribution of CDOM to DOC in the Zoige Rivers. For the alpine-gorge rivers, the spatial and temporal variabilities of CDOM/DOC were similar to that of CDOM absorption, indicating that the fluctuation of non-chromophoric DOM concentrations along sites may be quite stable.

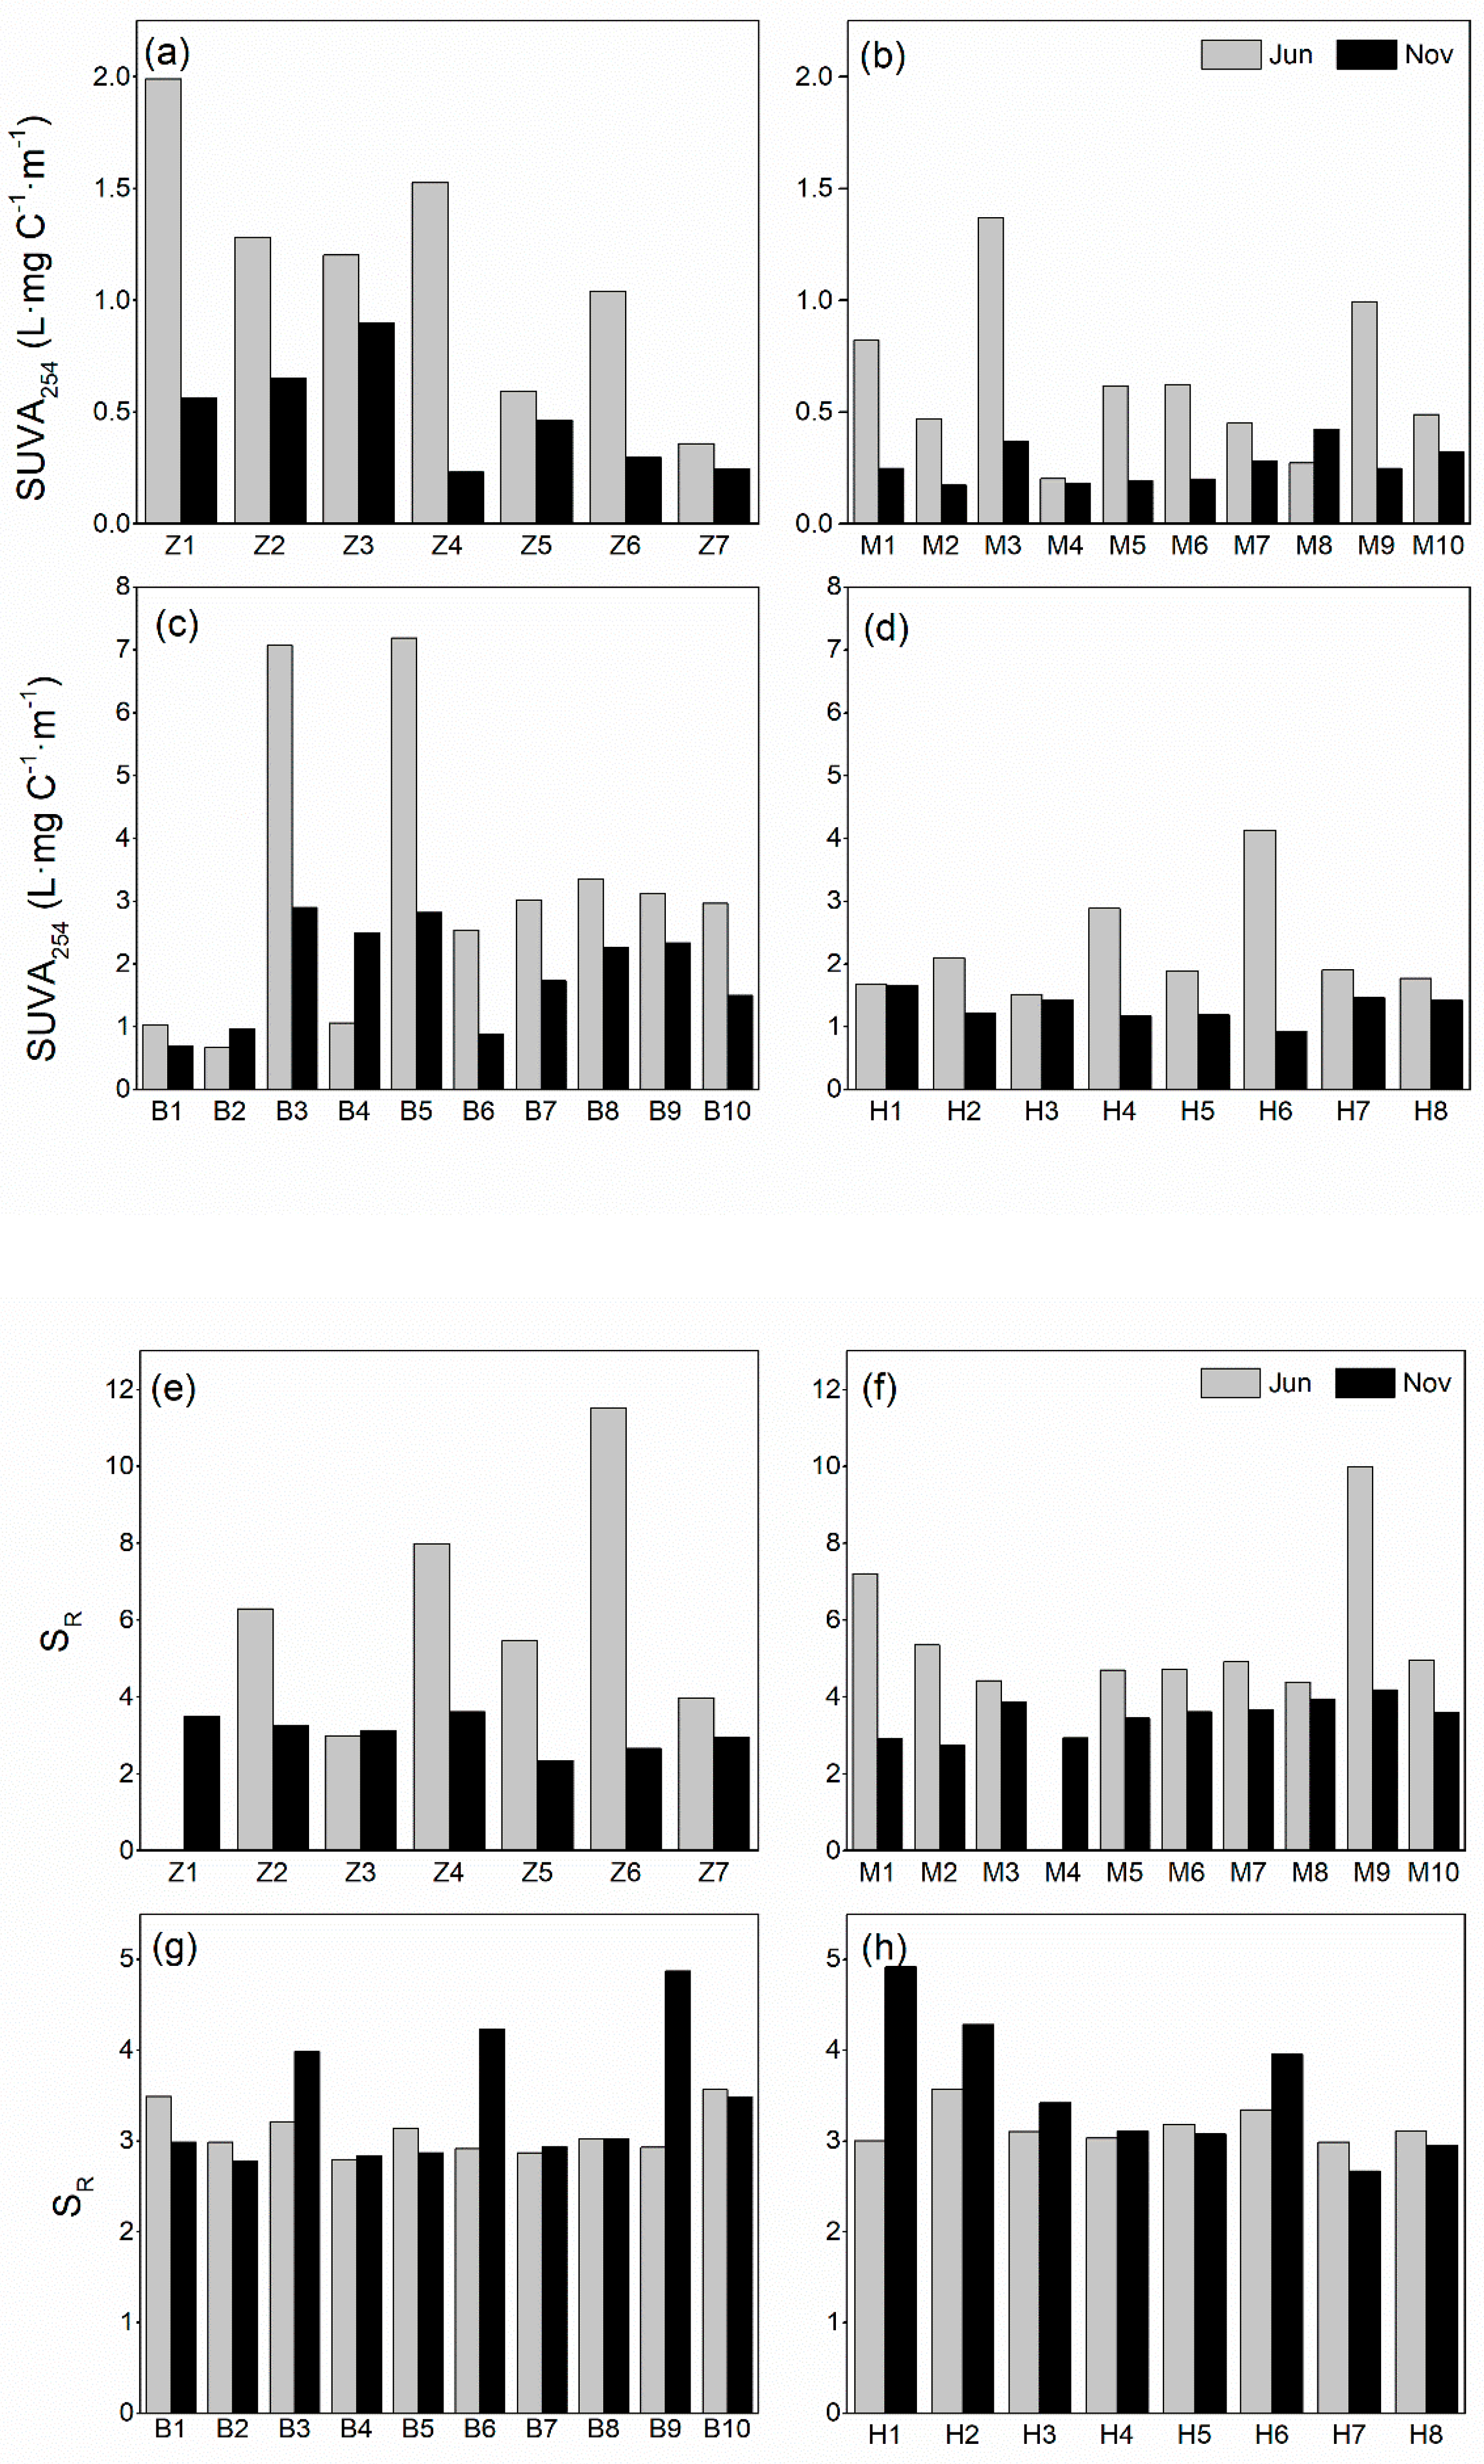
3.2.2. SUVA254 and SR

It has been shown that the SUVA254 are positively correlated with the percentage aromaticity of DOM as an effective tool to determine DOC characteristics [14]. The SUVA254 values of the examined sites ranged from 0.17 L·mg C−1·m−1 in the Min River to 7.19 L·mg C−1·m−1 in the Bai River (Figure 4a–d). The Bai River had the highest average SUVA254 level (2.53 ± 1.81 L·mg C−1·m−1), followed by the Hei (1.77 ± 0.78 L·mg C−1·m−1), Zagunao (0.81 ± 0.53 L·mg C−1·m−1), and the Min rivers (0.45 ± 0.31 L·mg C−1·m−1). The Zagunao, Min, and Hei rivers all showed that SUVA254 values in June were higher than that in November (p < 0.05), indicating a larger input of terrestrial DOM during the wet season.
The spectral ratio SR (calculated as the ratio of S275–295 to S350–400) is suggested to be related to the source and quality of DOM, with higher values indicative of a decrease in molecular weight and aromaticity [12,13]. SR values tested in our sites ranged from 0 to 11.53, with the majority of the values ranging from 2 to 5 (Figure 4e–h). The order of the average SR level in the rivers was the Bai River (3.25 ± 0.55) ≤ the Hei River (3.36 ± 0.58) < the Zagunao River (4.26 ± 2.82) < the Min River (4.28 ± 1.92). No significant difference was observed in the seasonal variation of SR in the Zagunao river, the Bai River, and the Hei river (p > 0.05), although the alpine-gorge rivers had relatively higher SR values in November, which suggests that SR and SUVA254 have different sensitivities towards DOM aromaticity.
Meanwhile, it is of interest that although the Bai River and the Hei River had similar average SR and average a(355) levels, slightly higher SUVA254 levels were detected in the Bai River. Combined with the presence of a higher average a(355)/DOC level in the Bai River than that in the Hei River (Figure 3g,h), we can infer that the Hei River has a larger proportion of non-chromophoric DOM which is of low-aromaticity. In addition, since S275–295 and S350–400 are corelated with different molecular formulae of DOM [52], their ratio (i.e., SR) could be affected by the molecular formulae indicated by any of these spectral slopes. Wagner et al. [52] also found that S275–295 provided similar information to other indices, including SUVA254, while the molecular formulae negatively corelated with S350–400 were more oxidized and more aromatic than molecular formulae negatively corelated with S275–295. The fact that SR provides different information from SUVA254 on some occasions may be induced by the complex aromatic structures of DOM.

3.2.3. Spatial Fluctuations Along Rivers

Concluding from the research conducted by Liu et al. [33] and our results, the wide fluctuation ranges of CDOM and CDOM properties along the Bai River can be attributed to the unequal input intensity of terrigenous sources, while the autochthonous impacts on the Zagunao River and the Min River are more significant. However, exhibiting extremely high DOC concentration in June but normal a(355) and low SUVA254 values (Figure 2c, Figure 3c and Figure 4c), B4 is also influenced by autochthonous or anthropogenic sources. Furthermore, the fluctuations of a(355) and SR among the sampling sites of the Hei River were relatively stable, which may be due to the similar topographic, climatic, and hydrological conditions of these sites.

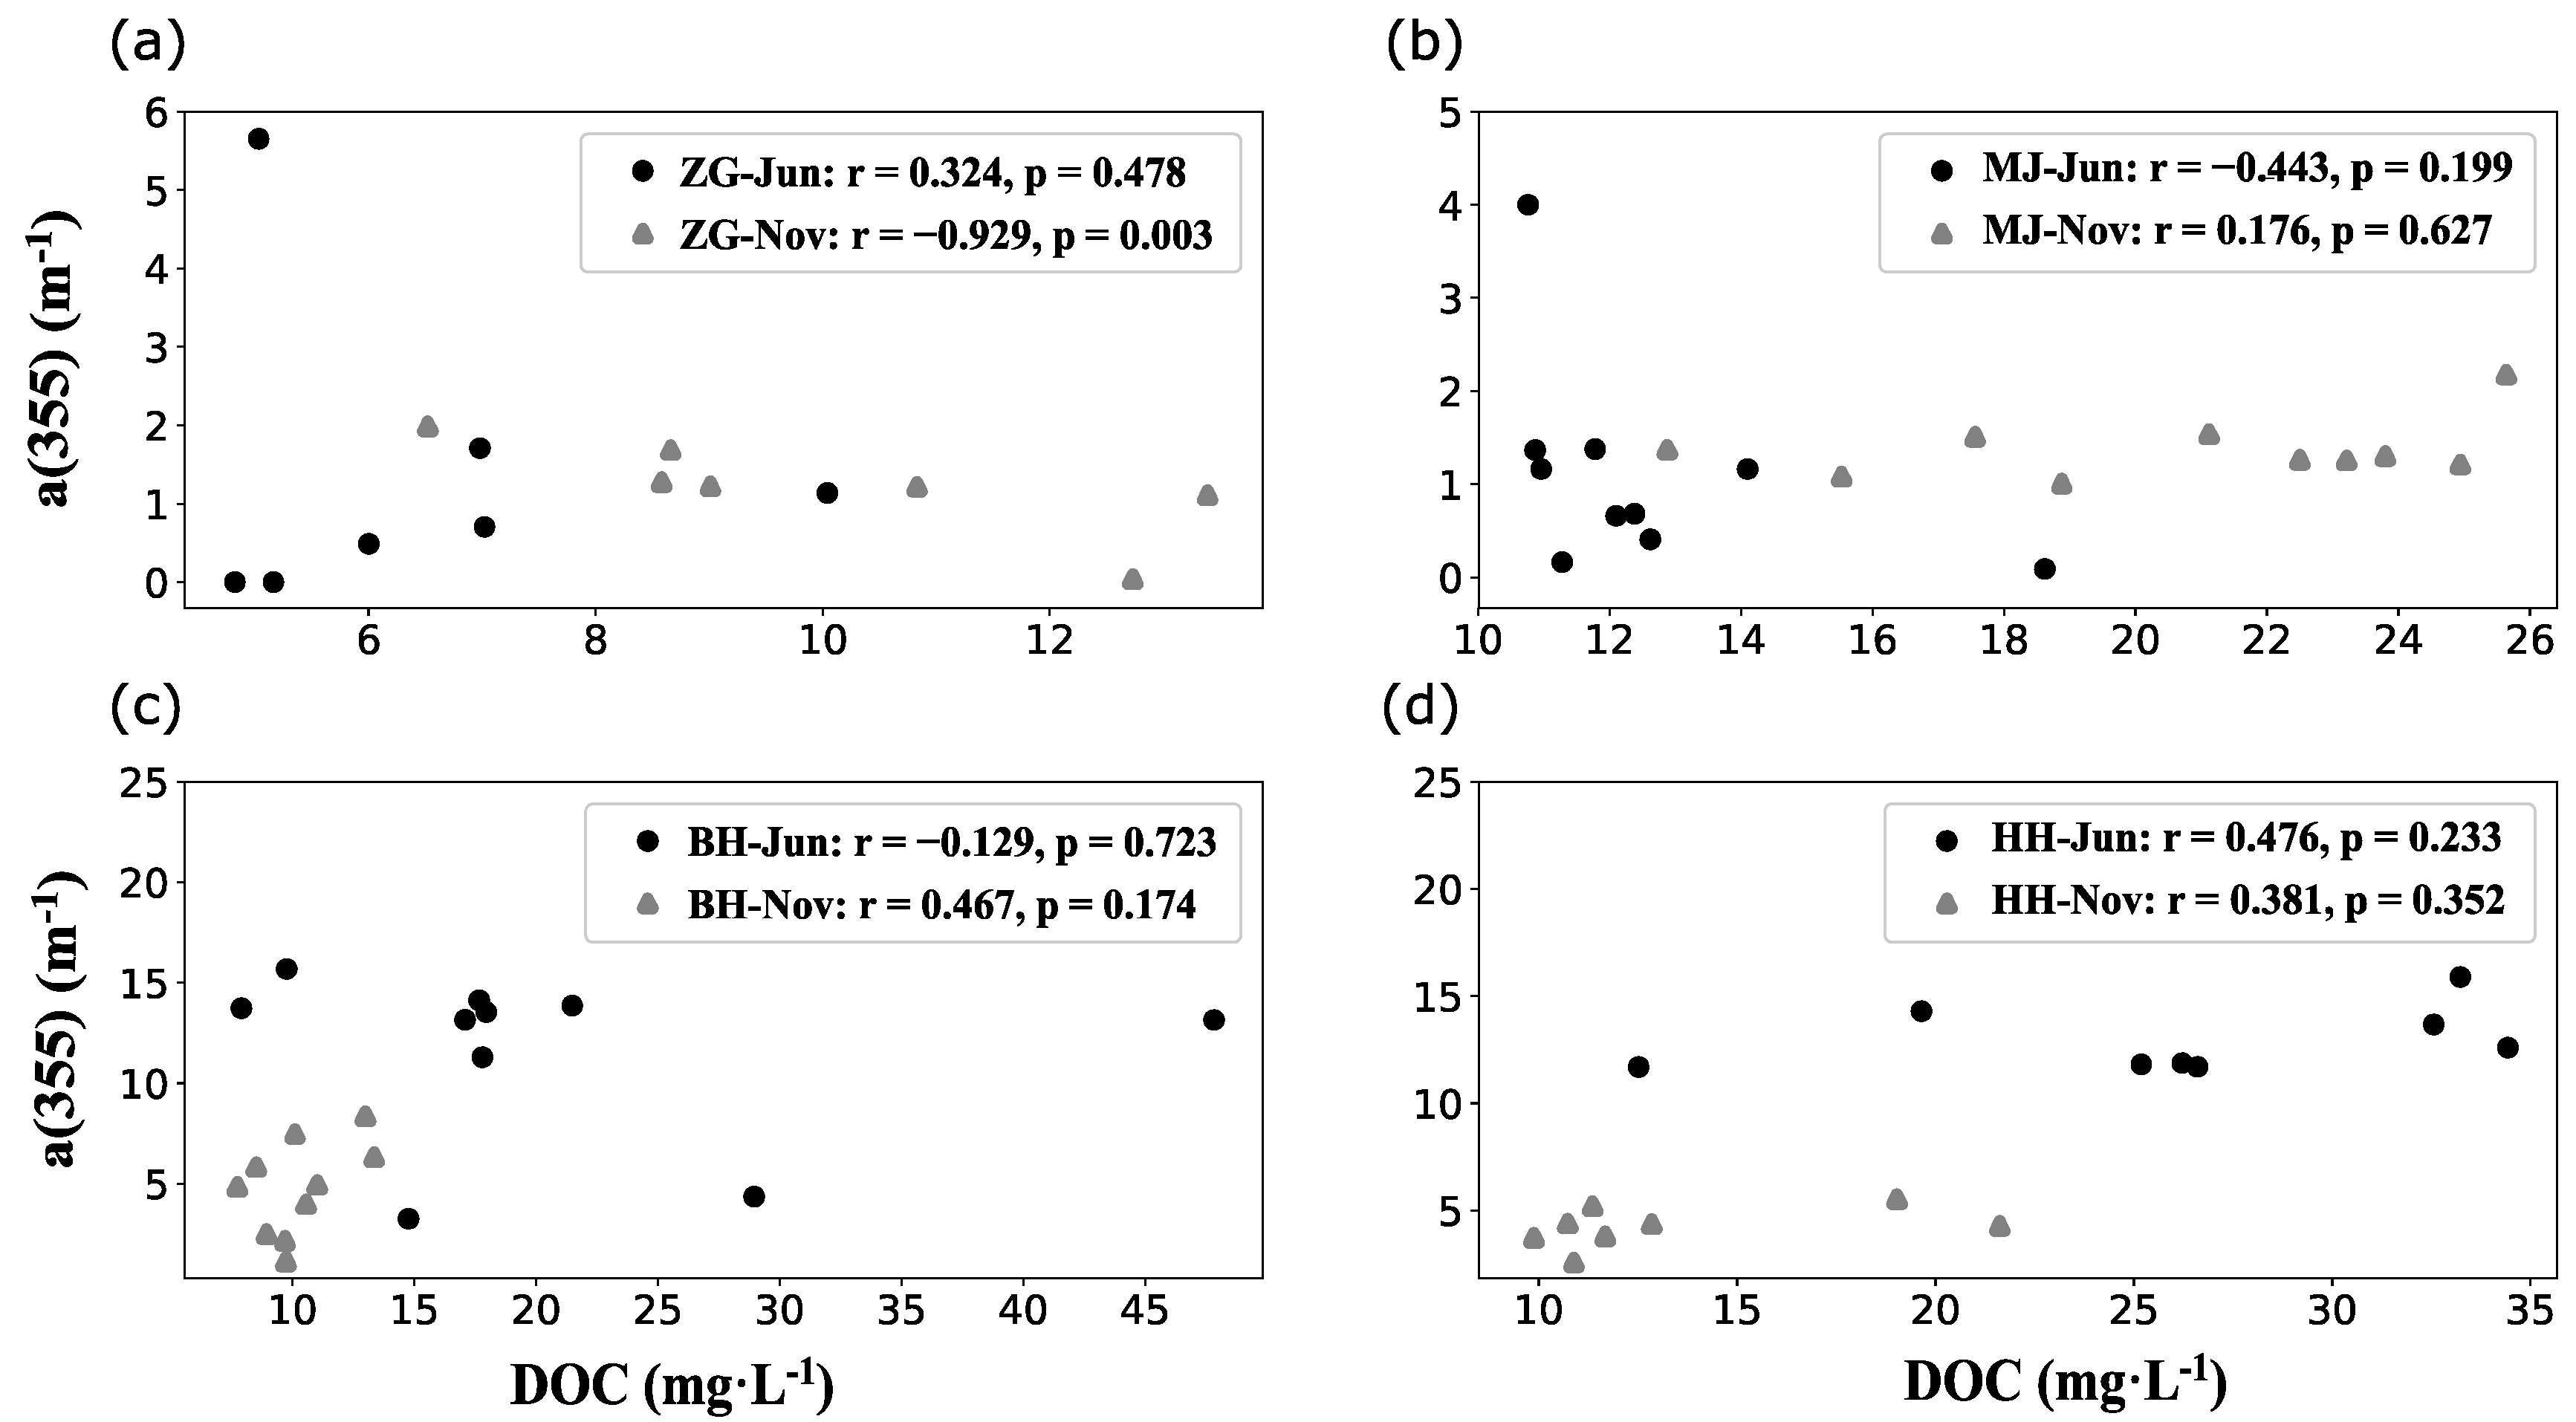
3.3. Correlations Between DOC and CDOM

Positive and significant relationships between the CDOM absorption coefficients and DOC concentrations have been observed in many inland water systems like rivers, lakes, and reservoirs in recent years, indicating the possibility of estimating DOC from in-situ or remote monitoring of CDOM absorption [4,13,17,40,53]. However, this does not apply to different river systems under various spatial and temporal backgrounds, and decoupled CDOM-DOC relationships were more common in our study (Figure 5), noting that significant correlation was only observed in November for the Zagunao river (r = −0.929, p = 0.003). It was reported that river systems with CDOM parameters indicative of autochthonous or anthropogenic, or photochemically degraded allochthonous sources had weaker CDOM-DOC relationships than other typical rivers systems in America [13]. In addition, autochthonous (i.e., microbial/algae) produced DOM is easily removed from DOC pools through microbial activities in the water systems [18,54], and CDOM or high-aromaticity DOM are suggested to be more sensitive to photo-irradiation than bulk DOC in waters [55,56,57], dissociating CDOM from DOC to some extent. It was also reported that highly polluted tributaries derived from anthropogenic sources could weaken the CDOM-DOC relationships in the main stream of the Songhua River in Northeast China [48]. Thus, considering that the fluctuation of non-chromophoric DOM is quite stable along the alpine-gorge rivers (will be discussed later), the disassociated CDOM-DOC relationships may be attributed to the impact of autochthonous sources on DOC pools in these rivers. However, as for the Zoige rivers with distinct terrigenous feature, the presence of disassociated CDOM-DOC relationships may have resulted from the intensive photochemical degradation of terrestrial DOM (CDOM), which is supported by research on bog water, arctic lakes and rivers, and even estuarine rivers, suggesting that the role of photodegradation on terrestrial DOM is higher than previously thought and an increased fraction of low-aromaticity and low-molecular-weight organic matter is produced during the process [56,57,58].

3.4. Correlations Among DOC and Light Absorption Characteristics

Although positive DOC-SUVA254 correlation was evidenced in some cases, there was overall negative correlation between DOC and SUVA254, which was significant in November in the Zagunao River (p < 0.01), in June in the Bai River and the Hei River (p < 0.05, p < 0.01, respectively) (Table 1). The significantly negative correlation between SUVA254 and DOC indicates that the increase of DOC in the river is mainly induced by low-aromaticity components, for example, microbial or algae derived organic matter (in the alpine-gorge rivers) and some photochemically produced organic matter (in the Zoige rivers).
Significantly positive correlation between CDOM and SUVA254 existed in many cases (especially in the Bai river), suggesting that the increase of aromaticity in DOC was closely related to the input of CDOM. However, no CDOM-SUVA254 correlation was found in the Hei River, suggesting that river CDOM concentration was not the only critical factor of DOC aromaticity. The SUVA254-CDOM/DOC relationship tended to be significant and strong on many occasions and was somehow dependent on the SUVA254-CDOM relationship. However, the independence of the SUVA254-CDOM/DOC relationship from the SUVA254-CDOM relationship observed in June in the Hei River (r = 0.993, p < 0.01 and r = −0.071, p > 0.05, respectively) indicates that the aromaticity percentage of DOC is not only determined by CDOM but can also be diluted by non-chromophoric DOM. Regardless of the few occasions exhibiting not significant CDOM-CDOM/DOC relationships (e.g., the Hei River), significantly positive CDOM-CDOM/DOC relationships were common across the four rivers, and were independent of spatiotemporal differences. The simultaneous presence of these two results (the dependence of SUVA254-CDOM/DOC on SUVA254-CDOM relationship and significantly positive CDOM-CDOM/DOC relationship) demonstrates that the fluctuation of non-chromophoric DOM is quite stable along the rivers. Combining the discussed relationships of the parameters in the Hei River, we inferred that the Hei River may be profoundly affected by anthropogenic sources, as the fluctuation of non-chromophoric DOM in the Hei River is not as stable as that in the alpinegorge rivers and the Bai River.

3.5. DOC Classification

All of the samples were divided into two main classes (A, B), and each class was subdivided into two subclasses (expressed as Type 1, Type 2, Type 3, and Type 4) (Table 2). Samples collected from the Zoige rivers (except for B1) belonged to class A, exhibiting significant terrigenous feature in a(355) and HIX, while samples collected from the alpine-gorge rivers were classified as class B, with a(355) and HIX indicative of autochthonous feature. In class A, Type 1 waters (including most samples from the Hei River) exhibited higher DOC concentrations, lower SUVA254 values, and higher TDN concentrations in comparison with Type 2 waters, indicating that Type 1 waters may be intensively influenced by anthropogenic sources, as increased TDN may result from wastewater discharge and fertilizer use in the river basins [43]. In class B, Type 3 waters had lower a(355), higher SR, and lower HIX values than Type 4 waters, which demonstrates the autochthonous feature in Type 3 waters was more significant than the average level in the alpine-gorge rivers.

4. Summary and Conclusions

DOC concentration, CDOM absorption coefficient a(355), SUVA254, the spectral slope ratio SR, and a(355)/DOC were examined in four rivers (the Zagunao, Min, Bai, and Hei rivers) of the northeastern Qinghai-Tibetan Plateau in June and November of 2018. Distinct spatiotemporal patterns were evidenced in the distribution of these parameters. The following results were obtained: (1) the average DOC level (15.04 mg·L−1) of the rivers was relatively high in the study periods, and the browning level was particularly high in June in the Zoige rivers, indicating that a large amount of terrestrial DOC was transferred to the surface waters in the Zoige region; (2) the Zoige rivers stand out as having higher average DOC concentration, a(355), SUVA254, a(355)/CDOM, and lower SR value than the alpine-gorge rivers, which is indicative of significant terrigenous characteristics. The temporal distribution patterns of DOC and CDOM were also different between the Zoige rivers and the alpine-gorge rivers; (3) differing from other studies reporting a significant linear relationship between the CDOM absorption coefficient and DOC concentration, disassociated CDOM-DOC relationships were common in our study. Therefore, deriving the DOC flux from CDOM parameters may not be feasible in these rivers; (4) combining the results of DOC classification and correlations of DOC and CDOM properties, we conclude that the Hei River may have experienced a profound influence by anthropogenic sources.
Significant warming and wetting trends were observed on the Qinghai-Tibetan Plateau over the past few decades [59], and if these trends continue, the terrestrial input of DOM into the plateau’s freshwaters will be greatly increased, which may ultimately affect the carbon cycle in the aquatic systems at both the regional and global scales. Since the fate of DOM and CO2 emissions in waters is related to photochemical and microbial degradation processes, and many studies have pointed out that the increase of terrigenous DOM will enhance the CO2 emissions in various water systems [17,30,57,60], long-term monitoring of the DOC concentration and its optical characteristics with higher time resolution is needed to track the carbon dynamics in the aquatic systems in the Zoige alpine wetlands. Our findings also indicate the intensive anthropogenic influence on aquatic DOM in this region (especially in the Hei River). In order to further reveal the impacts of global change on the DOC fate and carbon cycle in these aquatic ecosystems, more attention should be given to the sources, dynamics, characteristics, and photochemical/microbial degradation mechanisms of aquatic DOM.

Supplementary Materials

The following are available online at https://www.mdpi.com/2073-4441/12/9/2453/s1, Table S1: Sampling information (location, sample temperature and pH) for the four rivers on the Northeastern Qinghai-Tibetan Plateau, Figure S1: FI and HIX in (a) and (e) the Zagunao River (sites Z1–Z7), (b) and (f) the Min River (sites M1–M10), (c) and (g) the Bai River (sites B1–B10), and (d) and (h) the Hei River (sites H1–H8) in the wet (June) and dry (November) seasons.

Author Contributions

Conceptualization, H.S.; Funding acquisition, H.S.; Supervision, H.S.; Writing—review and editing, H.S.; Data curation, Z.Z. and J.Y.; Methodology, Z.Z. and Y.L.; Writing—original draft, Z.Z.; Formal analysis, J.Q.; Investigation, J.Q. and J.Y.; Project administration, J.Q.; Resources, Y.L. All authors have read and agreed to the published version of the manuscript.

Funding

This study was funded by the National Natural Science Foundation of China (grant No. 41271094).

Acknowledgments

We are grateful for the support provided by the National Natural Science Foundation of China (grant No. 41271094). We are also grateful to the four anonymous reviewers whose valuable comments helped us improve the manuscript.

Conflicts of Interest

The authors declare no conflict of interest.

References

  1. Roulet, N.; Moore, T.R. Environmental chemistry: Browning the waters. Nature 2006, 444, 283–284. [Google Scholar] [CrossRef] [PubMed]
  2. Evans, C.D.; Jones, T.G.; Burden, A.; Ostle, N.; Zieliński, P.; Cooper, M.D.A.; Peacock, M.; Clark, J.M.; Oulehle, F.; Cooper, D.; et al. Acidity controls on dissolved organic carbon mobility in organic soils. Glob. Chang. Biol. 2012, 18, 3317–3331. [Google Scholar] [CrossRef] [Green Version]
  3. Evans, C.D.; Monteith, D.T.; Cooper, D.M. Long-term increases in surface water dissolved organic carbon: Observations, possible causes and environmental impacts. Environ. Pollut. 2005, 137, 55–71. [Google Scholar] [CrossRef]
  4. Brezonik, P.L.; Olmanson, L.G.; Finlay, J.C.; Bauer, M.E. Factors affecting the measurement of CDOM by remote sensing of optically complex inland waters. Remote Sens. Environ. 2015, 157, 199–215. [Google Scholar] [CrossRef]
  5. Fork, M.L.; Heffernan, J.B. Direct and Indirect Effects of Dissolved Organic Matter Source and Concentration on Denitrification in Northern Florida Rivers. Ecosystems 2014, 17, 14–28. [Google Scholar] [CrossRef] [Green Version]
  6. Jones, R.I. The influence of humic substances on lacustrine planktonic food chains. Hydrobiologia 1992, 229, 73–91. [Google Scholar] [CrossRef]
  7. Liang, L.; Singer, P.C. Factors Influencing the Formation and Relative Distribution of Haloacetic Acids and Trihalomethanes in Drinking Water. Environ. Sci. Technol. 2003, 37, 2920–2928. [Google Scholar] [CrossRef]
  8. Solomon, C.T.; Jones, S.E.; Weidel, B.C.; Buffam, I.; Fork, M.L.; Karlsson, J.; Larsen, S.; Lennon, J.T.; Read, J.S.; Sadro, S.; et al. Ecosystem Consequences of Changing Inputs of Terrestrial Dissolved Organic Matter to Lakes: Current Knowledge and Future Challenges. Ecosystems 2015, 18, 376–389. [Google Scholar] [CrossRef]
  9. Monteith, D.T.; Stoddard, J.L.; Evans, C.D.; de Wit, H.A.; Forsius, M.; Høgåsen, T.; Wilander, A.; Skjelkvåle, B.L.; Jeffries, D.S.; Vuorenmaa, J.; et al. Dissolved organic carbon trends resulting from changes in atmospheric deposition chemistry. Nature 2007, 450, 537–540. [Google Scholar] [CrossRef]
  10. SanClements, M.D.; Oelsner, G.P.; McKnight, D.M.; Stoddard, J.L.; Nelson, S.J. New Insights into the Source of Decadal Increases of Dissolved Organic Matter in Acid-Sensitive Lakes of the Northeastern United States. Environ. Sci. Technol. 2012, 46, 3212–3219. [Google Scholar] [CrossRef]
  11. Fenner, N.; Freeman, C.; Hughes, S.; Reynolds, B. Molecular weight spectra of dissolved organic carbon in a rewetted Welsh peatland and possible implications for water quality. Soil Use. Manag. 2001, 17, 106–112. [Google Scholar] [CrossRef]
  12. Helms, J.R.; Stubbins, A.; Ritchie, J.D.; Minor, E.C.; Kieber, D.J.; Mopper, K. Absorption spectral slopes and slope ratios as indicators of molecular weight, source, and photobleaching of chromophoric dissolved organic matter. Limnol. Oceanogr. 2008, 53, 955–969. [Google Scholar] [CrossRef] [Green Version]
  13. Spencer, R.; Butler, K.; Aiken, G. Dissolved organic carbon and chromophoric dissolved organic matter properties of rivers in the USA. J. Geophys. Res. Biogeosci. 2012, 117, 3001. [Google Scholar] [CrossRef]
  14. Weishaar, J.L.; Aiken, G.R.; Bergamaschi, B.A.; Fram, M.S.; Fujii, R.; Mopper, K. Evaluation of Specific Ultraviolet Absorbance as an Indicator of the Chemical Composition and Reactivity of Dissolved Organic Carbon. Environ. Sci. Technol. 2003, 37, 4702–4708. [Google Scholar] [CrossRef] [PubMed]
  15. Li, S.; Zhang, J.; Mu, G.; Ju, H.; Rui, W.; Li, D. Spatiotemporal Characterization of Chromophoric Dissolved Organic Matter (CDOM) and CDOM-DOC Relationships for Highly-Polluted River. Water 2016, 8, 399. [Google Scholar] [CrossRef]
  16. Loiselle, S.; Vione, D.; Minero, C.; Maurino, V.; Tognazzi, A.; Dattilo, A.; Rossi, C.; Bracchini, L. Chemical and optical phototransformation of dissolved organic matter. Water Res. 2012, 46, 3197–3207. [Google Scholar] [CrossRef]
  17. Fasching, C.; Behounek, B.; Singer, G.A.; Battin, T.J. Microbial degradation of terrigenous dissolved organic matter and potential consequences for carbon cycling in brown-water streams. Sci. Rep. 2014, 4, 4981. [Google Scholar] [CrossRef]
  18. Massicotte, P.; Frenette, J.-J. Spatial connectivity in a large river system: Resolving the sources and fate of dissolved organic matter. Ecol. Appl. 2011, 21, 2600–2617. [Google Scholar] [CrossRef]
  19. Stanley, E.; Powers, S.; Lottig, N.; Buffam, I.; Crawford, J. Contemporary Changes in Dissolved Organic Carbon (DOC) in Human-Dominated Rivers: Is There a Role for DOC Management? Freshwater Biol. 2011, 57, 26–42. [Google Scholar] [CrossRef]
  20. Freeman, C.; Evans, C.D.; Monteith, D.T.; Reynolds, B.; Fenner, N. Export of organic carbon from peat soils. Nature 2001, 412, 785. [Google Scholar] [CrossRef]
  21. Ritson, J.; Brazier, R.; Graham, N.; Freeman, C.; Templeton, M.; Clark, J. The effect of drought on dissolved organic carbon (DOC) release from peatland soil and vegetation sources. Biogeosciences 2017, 14, 2891–2902. [Google Scholar] [CrossRef] [Green Version]
  22. Yu, Z. Northern peatland carbon stocks and dynamics: A review. Biogeosciences 2012, 9, 4071–4085. [Google Scholar] [CrossRef] [Green Version]
  23. Chen, H.; Yang, G.; Peng, C.; Zhang, Y.; Zhu, D.; Zhu, Q.; Hu, J.; Wang, M.; Zhan, W.; Zhu, E.; et al. The carbon stock of alpine peatlands on the Qinghai–Tibetan Plateau during the Holocene and their future fate. Quaternary Sci. Rev. 2014, 95, 151–158. [Google Scholar] [CrossRef]
  24. Hu, G.; Dong, Z.; Lu, J.; Yan, C. Driving forces of land use and land cover change (LUCC) in the Zoige Wetland, Qinghai-Tibetan Plateau. Cold Arid Reg. 2012, 4, 422–430. [Google Scholar]
  25. Xiang, S.; Guo, R.; Wu, N.; Sun, S. Current status and future prospects of Zoige Marsh in Eastern Qinghai-Tibet Plateau. Ecol. Eng. 2009, 35, 553–562. [Google Scholar] [CrossRef]
  26. Huo, L.; Chen, Z.; Zou, Y.; Lu, X.; Guo, J.; Tang, X. Effect of Zoige alpine wetland degradation on the density and fractions of soil organic carbon. Ecol. Eng. 2013, 51, 287–295. [Google Scholar] [CrossRef]
  27. Lou, X.D.; Zhai, S.Q.; Kang, B.; Hu, L.L. Seasonal dynamic characteristics of dissolved organic carbon in Zoige peatland and its impact factors. Res. Environ. Sci. (China) 2014, 27, 157–163. [Google Scholar]
  28. Yang, G.; Wang, M.; Chen, H.; Liu, L.; Wu, N.; Zhu, D.; Tian, J.; Peng, C.; Zhu, Q.; He, Y. Responses of CO2 emission and pore water DOC concentration to soil warming and water table drawdown in Zoige Peatlands. Atmos. Environ. 2016, 152, 323–329. [Google Scholar] [CrossRef]
  29. Zhang, X.W.; Mo, Y.; Zhang, B.Y.; Gao, J.J.; Gao, J.Q. Effect of wetting-drying cycle and litter on dissolved organic carbon in peat soil in Zoigê Plateau. Wetland Sci. (China) 2014, 12, 134–140. [Google Scholar]
  30. Zhu, D.; Chen, H.; Zhu, Q.a.; Wu, Y.; Wu, N. High Carbon Dioxide Evasion from an Alpine Peatland Lake: The Central Role of Terrestrial Dissolved Organic Carbon Input. Water Air. Soil Poll. 2012, 223, 2563–2569. [Google Scholar] [CrossRef]
  31. Zhang, Y.; Wang, G.; Wang, Y. Changes in alpine wetland ecosystems of the Qinghai–Tibetan plateau from 1967 to 2004. Environ. Monit. Assess 2011, 180, 189–199. [Google Scholar] [CrossRef] [PubMed] [Green Version]
  32. Wurl, O. Practical Guidelines for the Analysis of Seawater; CRC Press: Boca Raton, FL, USA, 2009; pp. 81–83. [Google Scholar]
  33. Liu, Y.-Y.; Qin, J.-H.; Liu, C.; Sun, H.; Tang, X.-Y.; Fan, S.-Y. Characteristics of Chromophoric Dissolved Organic Matter (CDOM) in Rivers of Western Sichuan Plateau Based on EEM-PARAFAC Analysis. Environ. Sci. (China) 2018, 39, 720–728. [Google Scholar]
  34. Gonnelli, M.; Vestri, S.; Santinelli, C. Chromophoric dissolved organic matter and microbial enzymatic activity. A biophysical approach to understand the marine carbon cycle. Biophys. Chem. 2013, 182, 79–85. [Google Scholar] [CrossRef] [PubMed]
  35. Jiang, T.; Wang, D.; Wei, S.; Yan, J.; Liang, J.; Chen, X.; Liu, J.; Wang, Q.; Lu, S.; Gao, J.; et al. Influences of the alternation of wet-dry periods on the variability of chromophoric dissolved organic matter in the water level fluctuation zone of the Three Gorges Reservoir area, China. Sci. Total Environ. 2018, 636, 249–259. [Google Scholar] [CrossRef]
  36. McKnight, D.M.; Boyer, E.W.; Westerhoff, P.K.; Doran, P.T.; Kulbe, T.; Andersen, D.T. Spectrofluorometric characterization of dissolved organic matter for indication of precursor organic material and aromaticity. Limnol. Oceanogr. 2001, 46, 38–48. [Google Scholar] [CrossRef]
  37. Ohno, T. Fluorescence Inner-Filtering Correction for Determining the Humification Index of Dissolved Organic Matter. Environ. Sci. Technol. 2002, 36, 742–746. [Google Scholar] [CrossRef]
  38. Alvarez-Cobelas, M.; Angeler, D.; Sánchez-Carrillo, S.; Almendros, G. A worldwide view of organic carbon export from catchments. Biogeochemistry 2012, 107, 275–293. [Google Scholar] [CrossRef]
  39. Jiang, R.; Hatano, R.; Zhao, Y.; Kuramochi, K.; Hayakawa, A.; Woli, K.; Shimizu, M. Factors controlling nitrogen and dissolved organic carbon exports across timescales in two watersheds with different land uses. Hydrol. Process. 2014, 28, 5105–5121. [Google Scholar] [CrossRef]
  40. Liu, W.; Xu, X.; McGoff, N.M.; Eaton, J.M.; Leahy, P.; Foley, N.; Kiely, G. Spatial and Seasonal Variation of Dissolved Organic Carbon (DOC) Concentrations in Irish Streams: Importance of Soil and Topography Characteristics. Environ. Manag. 2014, 53, 959–967. [Google Scholar] [CrossRef]
  41. Tzortziou, M.; Zeri, C.; Dimitriou, E.; Ding, Y.; Jaffe, R.; Anagnostou, E.; Pitta, E.; Mentzafou, A. Colored dissolved organic matter dynamics and anthropogenic influences in a major transboundary river and its coastal wetland: CDOM dynamics in a transboundary river. Limnol. Oceanogr. 2015, 60, 1222–1240. [Google Scholar] [CrossRef]
  42. Ma, X.; Liu, G.; Wu, X.; Smoak, J.; Ye, L.; Xu, H.; Zhao, L.; Ding, Y. Influence of land cover on riverine dissolved organic carbon concentrations and export in the Three Rivers Headwater Region of the Qinghai-Tibetan Plateau. Sci. Total Environ. 2018, 630, 314–322. [Google Scholar] [CrossRef] [PubMed]
  43. Qu, B.; Sillanpää, M.; Kang, S.; Yan, F.; Li, Z.; Zhang, H.; Li, C. Export of dissolved carbonaceous and nitrogenous substances in rivers of the “Water Tower of Asia”. J. Environ. Sci. 2018, 65, 53–61. [Google Scholar] [CrossRef] [PubMed]
  44. Song, C.; Wang, G.; Mao, T.; Chen, X.; Huang, K.; Sun, X.; Hu, Z. Importance of active layer freeze-thaw cycles on the riverine dissolved carbon export on the Qinghai-Tibet Plateau permafrost region. PeerJ 2019, 7, e7146. [Google Scholar] [CrossRef] [PubMed] [Green Version]
  45. Dai, M.; Yin, Z.; Meng, F.; Liu, Q.; Cai, W.-J. Spatial distribution of riverine DOC inputs to the ocean: An updated global synthesis. Curr. Opin. Environ. Sustain. 2012, 4, 170–178. [Google Scholar] [CrossRef]
  46. Dittmar, T.; Kattner, G. The biogeochemistry of the river and shelf ecosystem of the Arctic Ocean: A review. Mar. Chem. 2003, 83, 103–120. [Google Scholar] [CrossRef]
  47. Deng, R.; Yang, W.; Zhang, J.; Wu, F. Changes in litter quality of subalpine forests during one freeze-thaw season. J. Ecol. 2010, 30, 830–835. [Google Scholar]
  48. Zhao, Y.; Song, K.; Lv, L.; Wen, Z.; Du, J.; Shang, Y. Relationship changes between CDOM and DOC in the Songhua River affected by highly polluted tributary, Northeast China. Environ. Sci. Pollut. R 2018, 25, 25371–25382. [Google Scholar] [CrossRef]
  49. Guo, Y.D.; Song, C.C.; Wan, Z.M.; Lu, Y.Z.; Qiao, T.H.; Tan, W.W.; Wang, L.L. Dynamics of dissolved organic carbon release from a permafrost wetland catchment in northeast China. J. Hydrol. 2015, 531, 919–928. [Google Scholar] [CrossRef]
  50. Mann, P.; Hernes, P.; Six, J.; Aiken, G.; Tank, S.; McClelland, J.; Butler, K.; Dyda, R.; Spencer, R.; Holmes, R. Pan-Arctic Trends in Terrestrial Dissolved Organic Matter from Optical Measurements. Front. Earth Sci. 2016, 4, 1–18. [Google Scholar] [CrossRef]
  51. Andrew, A.A.; Del Vecchio, R.; Subramaniam, A.; Blough, N.V. Chromophoric dissolved organic matter (CDOM) in the Equatorial Atlantic Ocean: Optical properties and their relation to CDOM structure and source. Mar. Chem. 2013, 148, 33–43. [Google Scholar] [CrossRef]
  52. Wagner, S.; Jaffe, R.; Cawley, K.; Dittmar, T.; Stubbins, A. Associations Between the Molecular and Optical Properties of Dissolved Organic Matter in the Florida Everglades, a Model Coastal Wetland System. Front. Chem. 2015, 3, 66. [Google Scholar] [CrossRef] [PubMed] [Green Version]
  53. Hestir, E.; Brando, V.; Campbell, G.; Dekker, A.; Malthus, T. The relationship between dissolved organic matter absorption and dissolved organic carbon in reservoirs along a temperate to tropical gradient. Remote Sens. Environ. 2015, 156, 395–402. [Google Scholar] [CrossRef]
  54. Stedmon, C.; Markager, S. Tracing the Production and Degradation of Autochthonous Fractions of Dissolved Organic Matter by Fluorescence Analysis. Limnol. Oceanogr. 2005, 50, 1415–1426. [Google Scholar] [CrossRef]
  55. Catalán, N.; Obrador, B.; Felip, M.; Pretus, J. Higher reactivity of allochthonous vs. autochthonous DOC sources in a shallow lake. Aquat. Sci. 2013, 75, 581–593. [Google Scholar] [CrossRef]
  56. Moran, M.A.; Sheldon, W.M., Jr.; Zepp, R.G. Carbon loss and optical property changes during long-term photochemical and biological degradation of estuarine dissolved organic matter. Limnol. Oceanogr. 2000, 45, 1254–1264. [Google Scholar] [CrossRef]
  57. Oleinikova, O.V.; Drozdova, O.Y.; Lapitskiy, S.A.; Demin, V.V.; Bychkov, A.Y.; Pokrovsky, O.S. Dissolved organic matter degradation by sunlight coagulates organo-mineral colloids and produces low-molecular weight fraction of metals in boreal humic waters. Geochim. Cosmochim. Acta 2017, 211, 97–114. [Google Scholar] [CrossRef]
  58. Ward, C.P.; Cory, R.M. Complete and Partial Photo-oxidation of Dissolved Organic Matter Draining Permafrost Soils. Environ. Sci. Technol. 2016, 50, 3545–3553. [Google Scholar] [CrossRef]
  59. Li, L.; Yang, S.; Wang, Z.; Zhu, X.; Tang, H. Evidence of Warming and Wetting Climate over the Qinghai-Tibet Plateau. Arct. Antarct. Alp. Res. 2010, 42, 449–457. [Google Scholar] [CrossRef]
  60. Lapierre, J.-F.; Guillemette, F.; Berggren, M.; Giorgio, P. Increases in terrestrially-derived carbon stimulate organic carbon processing and CO2 emissions in Canadian aquatic ecosystems. Nat. Commun. 2013, 4, 2972. [Google Scholar] [CrossRef]
Figure 1. Location of northeastern Qinghai-Tibetan Plateau.
Water 12 02453 g001
Figure 2. Dissolved organic carbon (DOC) concentration in (a) the Zagunao River (sites Z1–Z7), (b) the Min River (sites M1–M10), (c) the Bai River (sites B1–B10), and (d) the Hei River (H1–H8) in the wet (June) and dry (November) seasons.
Water 12 02453 g002
Figure 3. a(355) and a(355)/chromophoric dissolved organic matter (CDOM) in (a,e) the Zagunao River (sites Z1–Z7), (b,f) the Min River (sites M1–M10), (c,g) the Bai River (sites B1–B10), and (d,h) the Hei River (sites H1–H8) in the wet (June) and dry (November) seasons.
Water 12 02453 g003
Figure 4. SUVA254 and SR in (a,e) the Zagunao River (sites Z1–Z7), (b,f) the Min River (sites M1–M10), (c,g) the Bai River (sites B1–B10), and (d,h) the Hei River (sites H1–H8) in the wet (June) and dry (November) seasons.
Water 12 02453 g004
Figure 5. Relationships between a(355) and dissolved organic carbon (DOC) in sites of the Zaguano (ZG; (a)), Min (MJ; (b)), Bai (BH; (c)), and Hei (HH; (d)) rivers in the wet (June) and dry (November) season.
Water 12 02453 g005
Table 1. Correlation coefficients for dissolved organic carbon (DOC) and chromophoric dissolved organic matter (CDOM) parameters across sites and seasons.
Rivers and MonthParametersDOCCDOMSUVA254SRRivers and MonthParametersDOCCDOMSUVA254SR
CDOM0.324 CDOM−0.929 **
ZagunaoSUVA2540.2140.739 ZagunaoSUVA254−0.929 **1 **
JunSR0.571−0.414−0.143 NovemberSR−0.143−0.036−0.036
CDOM/DOC0.3240.993 **0.739−0.414 CDOM/DOC−0.929 **1 **1**−0.036
CDOM−0.443 CDOM0.176
MinSUVA254−0.2000.590 MinSUVA254−0.2860.790 **
JunSR0.2240.0970.467 NovemberSR0.0180.648 *0.699 *
CDOM/DOC−0.4570.997 **0.5710.061 CDOM/DOC−0.4670.733 *0.936 **0.612
CDOM−0.129 CDOM0.467
BaiSUVA254−0.680 *0.637 * BaiSUVA2540.2850.976 **
JunSR−0.648 *−0.1270.188 NovemberSR0.5150.0790.006
CDOM/DOC−0.673 *0.830 **0.998 **0.103 CDOM/DOC0.0550.891 *0.952 **−0.176
CDOM0.476 CDOM0.381
HeiSUVA254−0.762 *−0.071 HeiSUVA254−0.3330.524
JunSR0.071−0.0240.357 NovemberSR0.333−0.2620
CDOM/DOC−0.762 *−0.0710.993 **0.357 CDOM/DOC−0.5950.3570.500−0.833 *
Note: ** p < 0.01 level; * p < 0.05 level.
Table 2. Water types determined by hierarchical clustering and statistics of relevant variables.
Main ClassWater Types and SamplesVariablesMin.–Max.Mean ± SD
Type 1DOC19.65–47.8329.62 ± 8.05
a(355)4.36–15.9012.32 ± 3.09
B2, B4, B6, H1–H5, H7–H8SUVA2540.67–2.891.80 ± 0.65
SR2.79–3.573.07 ± 0.21
TDN0.18–4.811.92 ± 1.30
FI1.37–1.421.39 ± 0.02
Class A HIX11.55–15.5613.58 ± 1.41
Type 2DOC7.91–17.9614.39 ± 4.27
a(355)11.30–15.6813.32 ± 1.48
B3, B5, B7–B10, H6SUVA2542.97–7.204.41 ± 1.90
SR2.88–3.573.16 ± 0.24
TDN0.35–1.520.99 ± 0.35
FI1.36–1.411.38 ± 0.017
HIX9.96–19.8714.23 ± 3.40
Type 3DOC6.00–12.389.38 ± 3.34
a(355)0.49–0.710.63 ± 0.099
Z4, Z6, M1, M9SUVA2540.82–1.531.10 ± 0.30
SR7.20–11.539.20 ± 1.96
TDN0.77–0.900.83 ± 0.06
FI1.41–1.811.55 ± 0.18
Class B HIX1.42–3.782.64 ± 1.28
Type 4DOC4.82–18.6210.56 ± 4.00
a(355)0–5.651.53 ± 1.68
B1, Z1–Z3, Z5, Z7SUVA2540.20–1.990.78 ± 0.52
M2–M8, M10SR0–6.303.98 ± 1.87
TDN0.64–2.240.90 ± 0.40
FI1.40–1.561.49 ± 0.04
HIX0.90–8.293.28 ± 2.05
Note: Units: mg·L−1 for DOC and TDN, m−1 for a(355), L·mg C−1·m−1 for SUVA254. SR, FI, and HIX are unitless.

