Is Clustering Time-Series Water Depth Useful? An Exploratory Study for Flooding Detection in Urban Drainage Systems


Abstract
1. Introduction
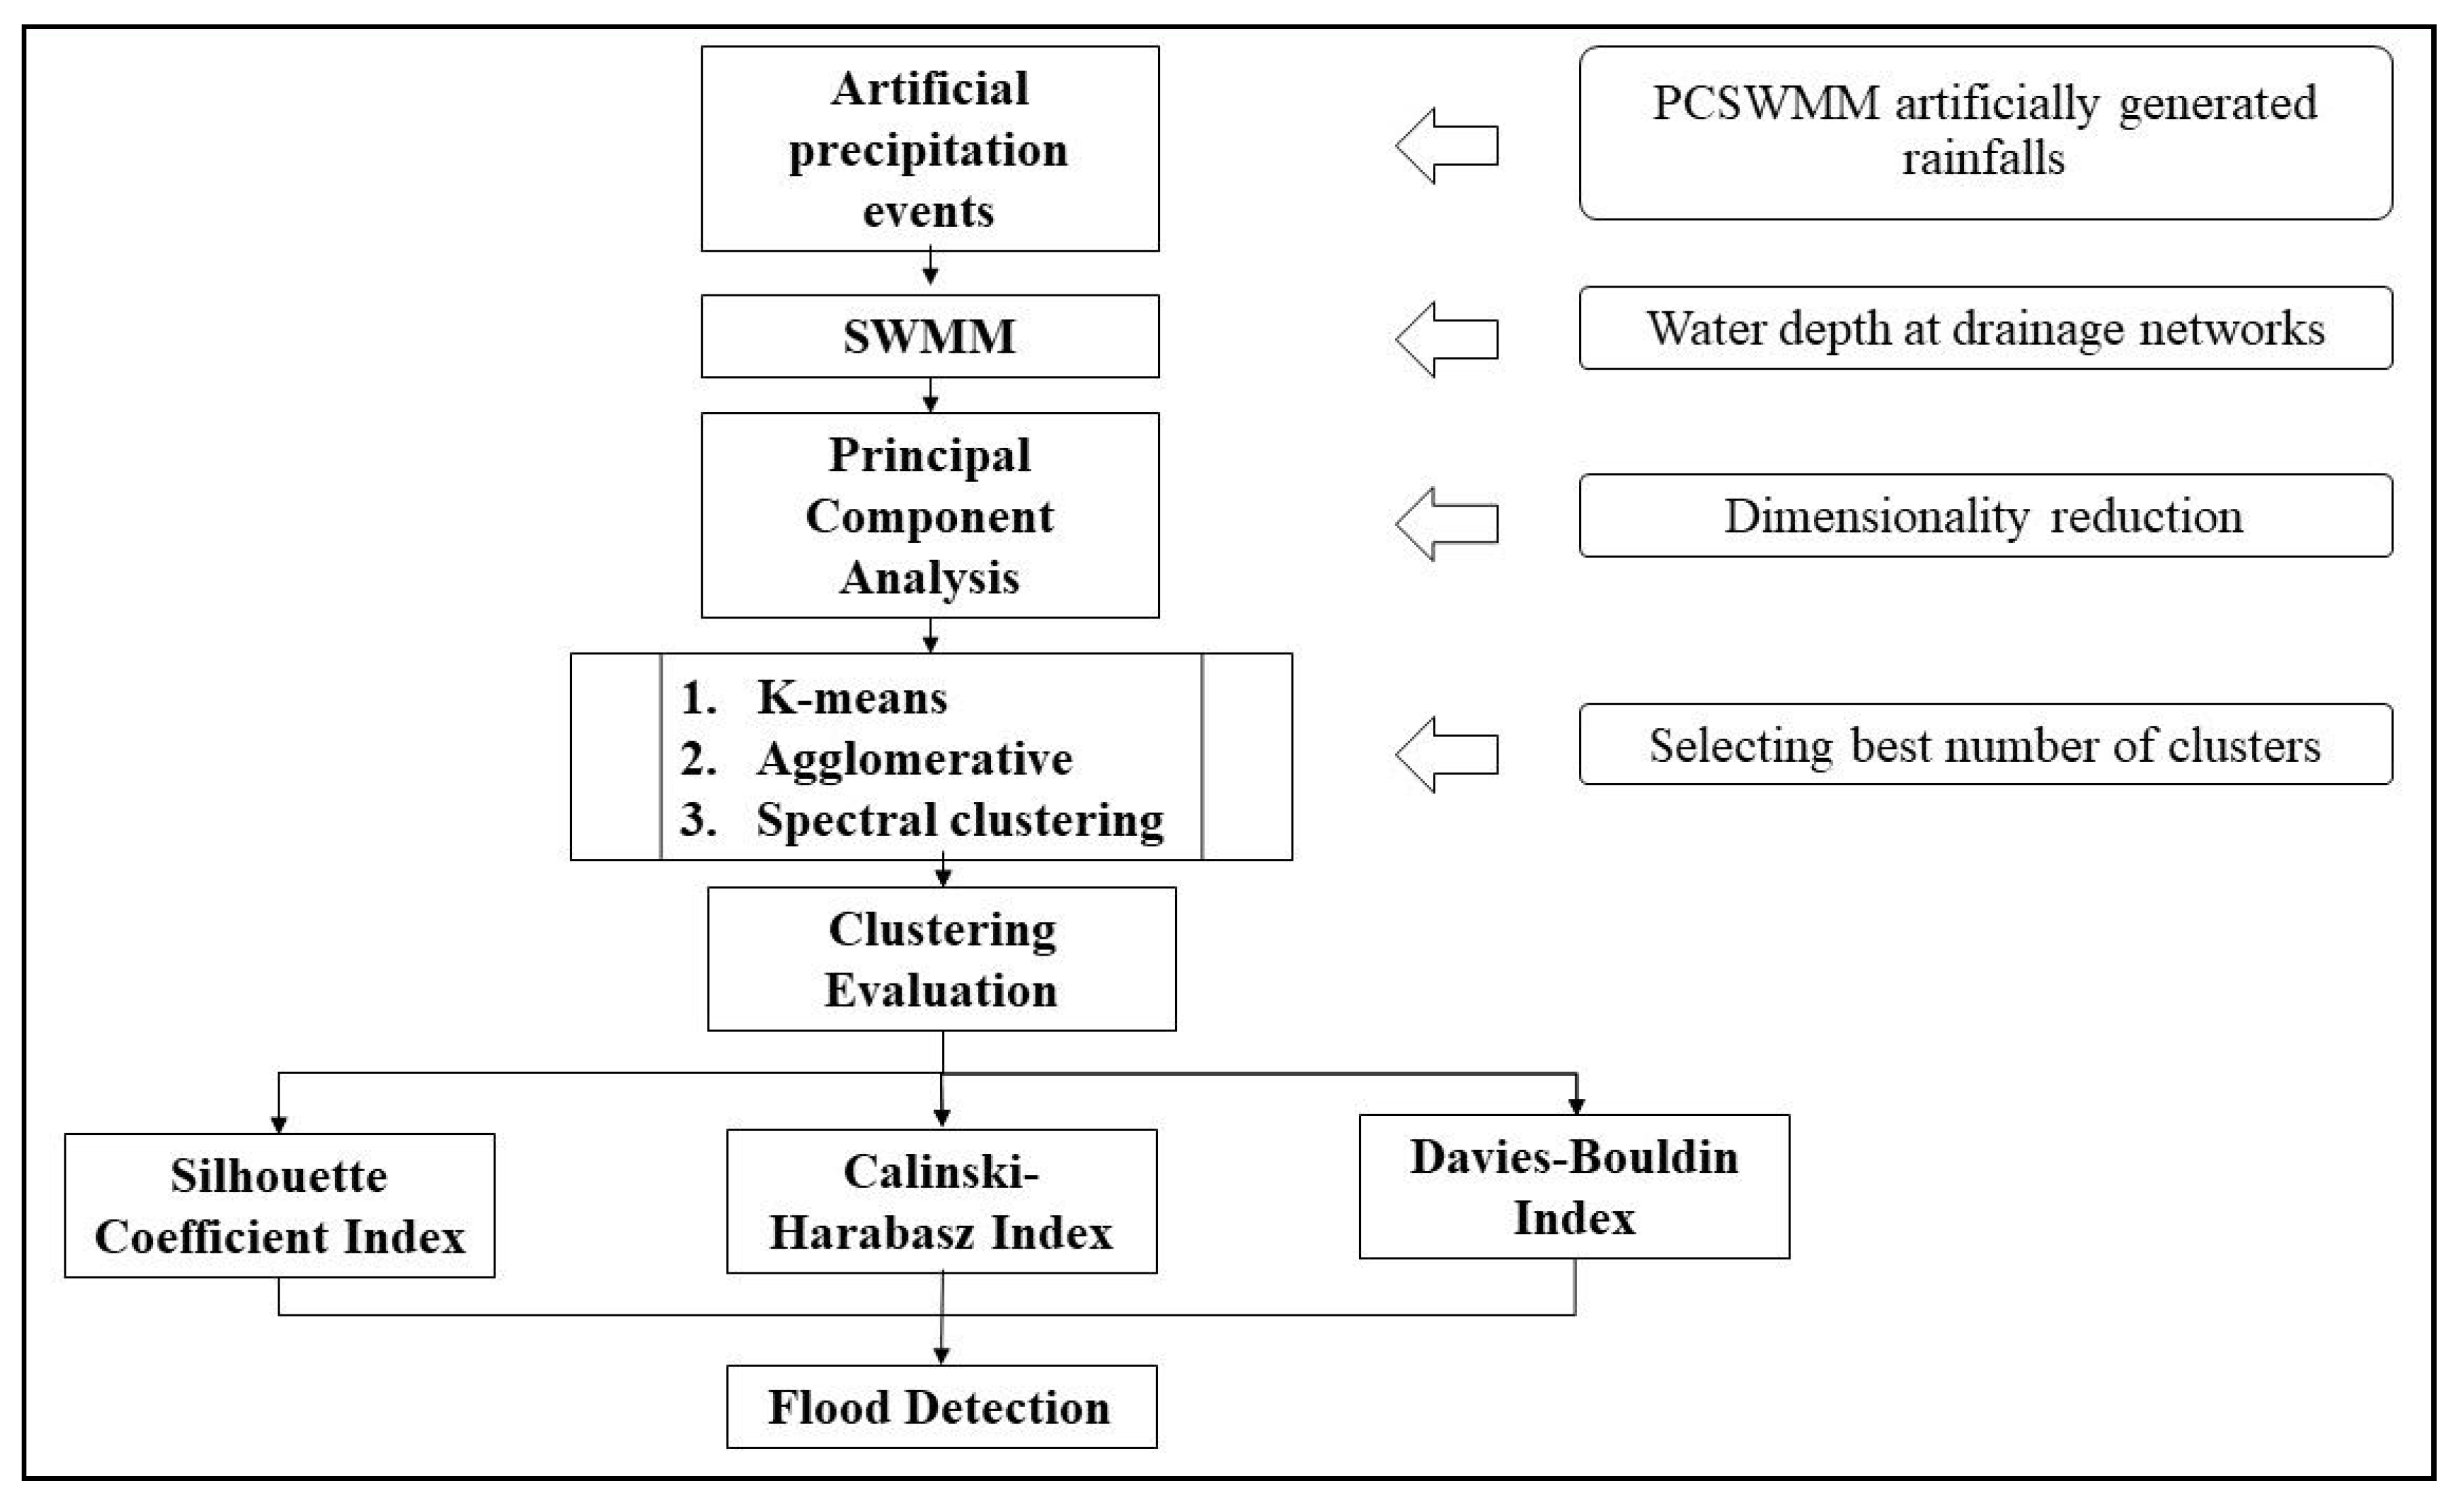
2. Materials and Methods
2.1. Description of Unsupervised Machine Learning Algorithms
2.1.1. K-Means Clustering
- (1)
- Choose k initial centroids, each defined by a value for each of the p variables. These are chosen randomly, often by simply choosing k observations.
- (2)
- Assign each observation to the centroid it is most similar to. The similarity is generally measured as the Euclidean distance between the observation and centroid in parameter space.
- (3)
- Once all observations are assigned, re-estimate the centroids location as the mean of the p variables of all observations assigned to that centroid.
- (4)
- Repeat until the algorithm stabilizes (minimize the within-cluster sum of squares).
2.1.2. Agglomerative Clustering
- (1)
- Start with each data point as its own cluster.
- (2)
- Select the distance metric and linkage criteria to calculate the dissimilarity between pairs of observations.
- (3)
- Link together the two clusters with the minimum dissimilarity.
- (4)
- Continue this process until there is only one cluster.
2.1.3. Spectral Clustering
- (1)
- Create a similarity matrix S between observations. This is the complement to the dissimilarity matrices used in other methods, and here is calculated as the negative Euclidean distance.
- (2)
- Create an adjacency matrix A, representing the graph or connectivity between observations. This is a transformation of S, where for each observation, we find the k nearest neighbors (i.e., with the highest similarity). If observations i and j are considered to be neighbors, we set Aij = Sij. If not, we set Aij = 0.
- (3)
- Create a degree matrix D, where the diagonal values are the degree of connectivity for each observations, given as
- (4)
- Next, calculate the graph Laplacian matrix L. This can be normalized or unnormalized. Here, we use the unnormalized: L = D − A
- (5)
- The clustering solution is then found by eigendecomposition of the Laplacian, and selecting the k smallest eigenvectors. Consequently, these result in a perfect separation of the observations. K-means is then run on these eigenvectors, to get the final cluster assignment of each observation:
2.1.4. Summary and Comparison of Clustering Algorithms
2.2. Clustering Model Implementation
- (1)
- K-means: We initially set the number of clusters (k) to 2 for each modeling scenarios. The algorithm was repeated ten times with different random initialization, and a maximum of 5 iterations was used to converge the algorithm.
- (2)
- Agglomerative clustering model: We used Ward linkage, as this is robust to outliers and unequal variance in the data. As only ‘Euclidean’ supports ‘Ward’ linkage distance computation. If ‘Ward’ linkage is used for cluster distance computation, ‘Euclidean’ would be the best way to measure the data dissimilarity [51]. Thus, the cluster distance calculation method and dissimilarity metric among sample points are set to be ‘Ward’ and ‘Euclidean’ distance, respectively. The resulting hierarchy was cut to provide 2 clusters.
- (3)
- Spectral clustering: The algorithm was used to identify 2 clusters, using the unnormalized graph Laplacian.
2.3. Clustering Model Evaluation and Validation
2.3.1. Silhouette Coefficient Index
2.3.2. Calinski-Harabasz Index
2.3.3. Davies-Bouldin Index
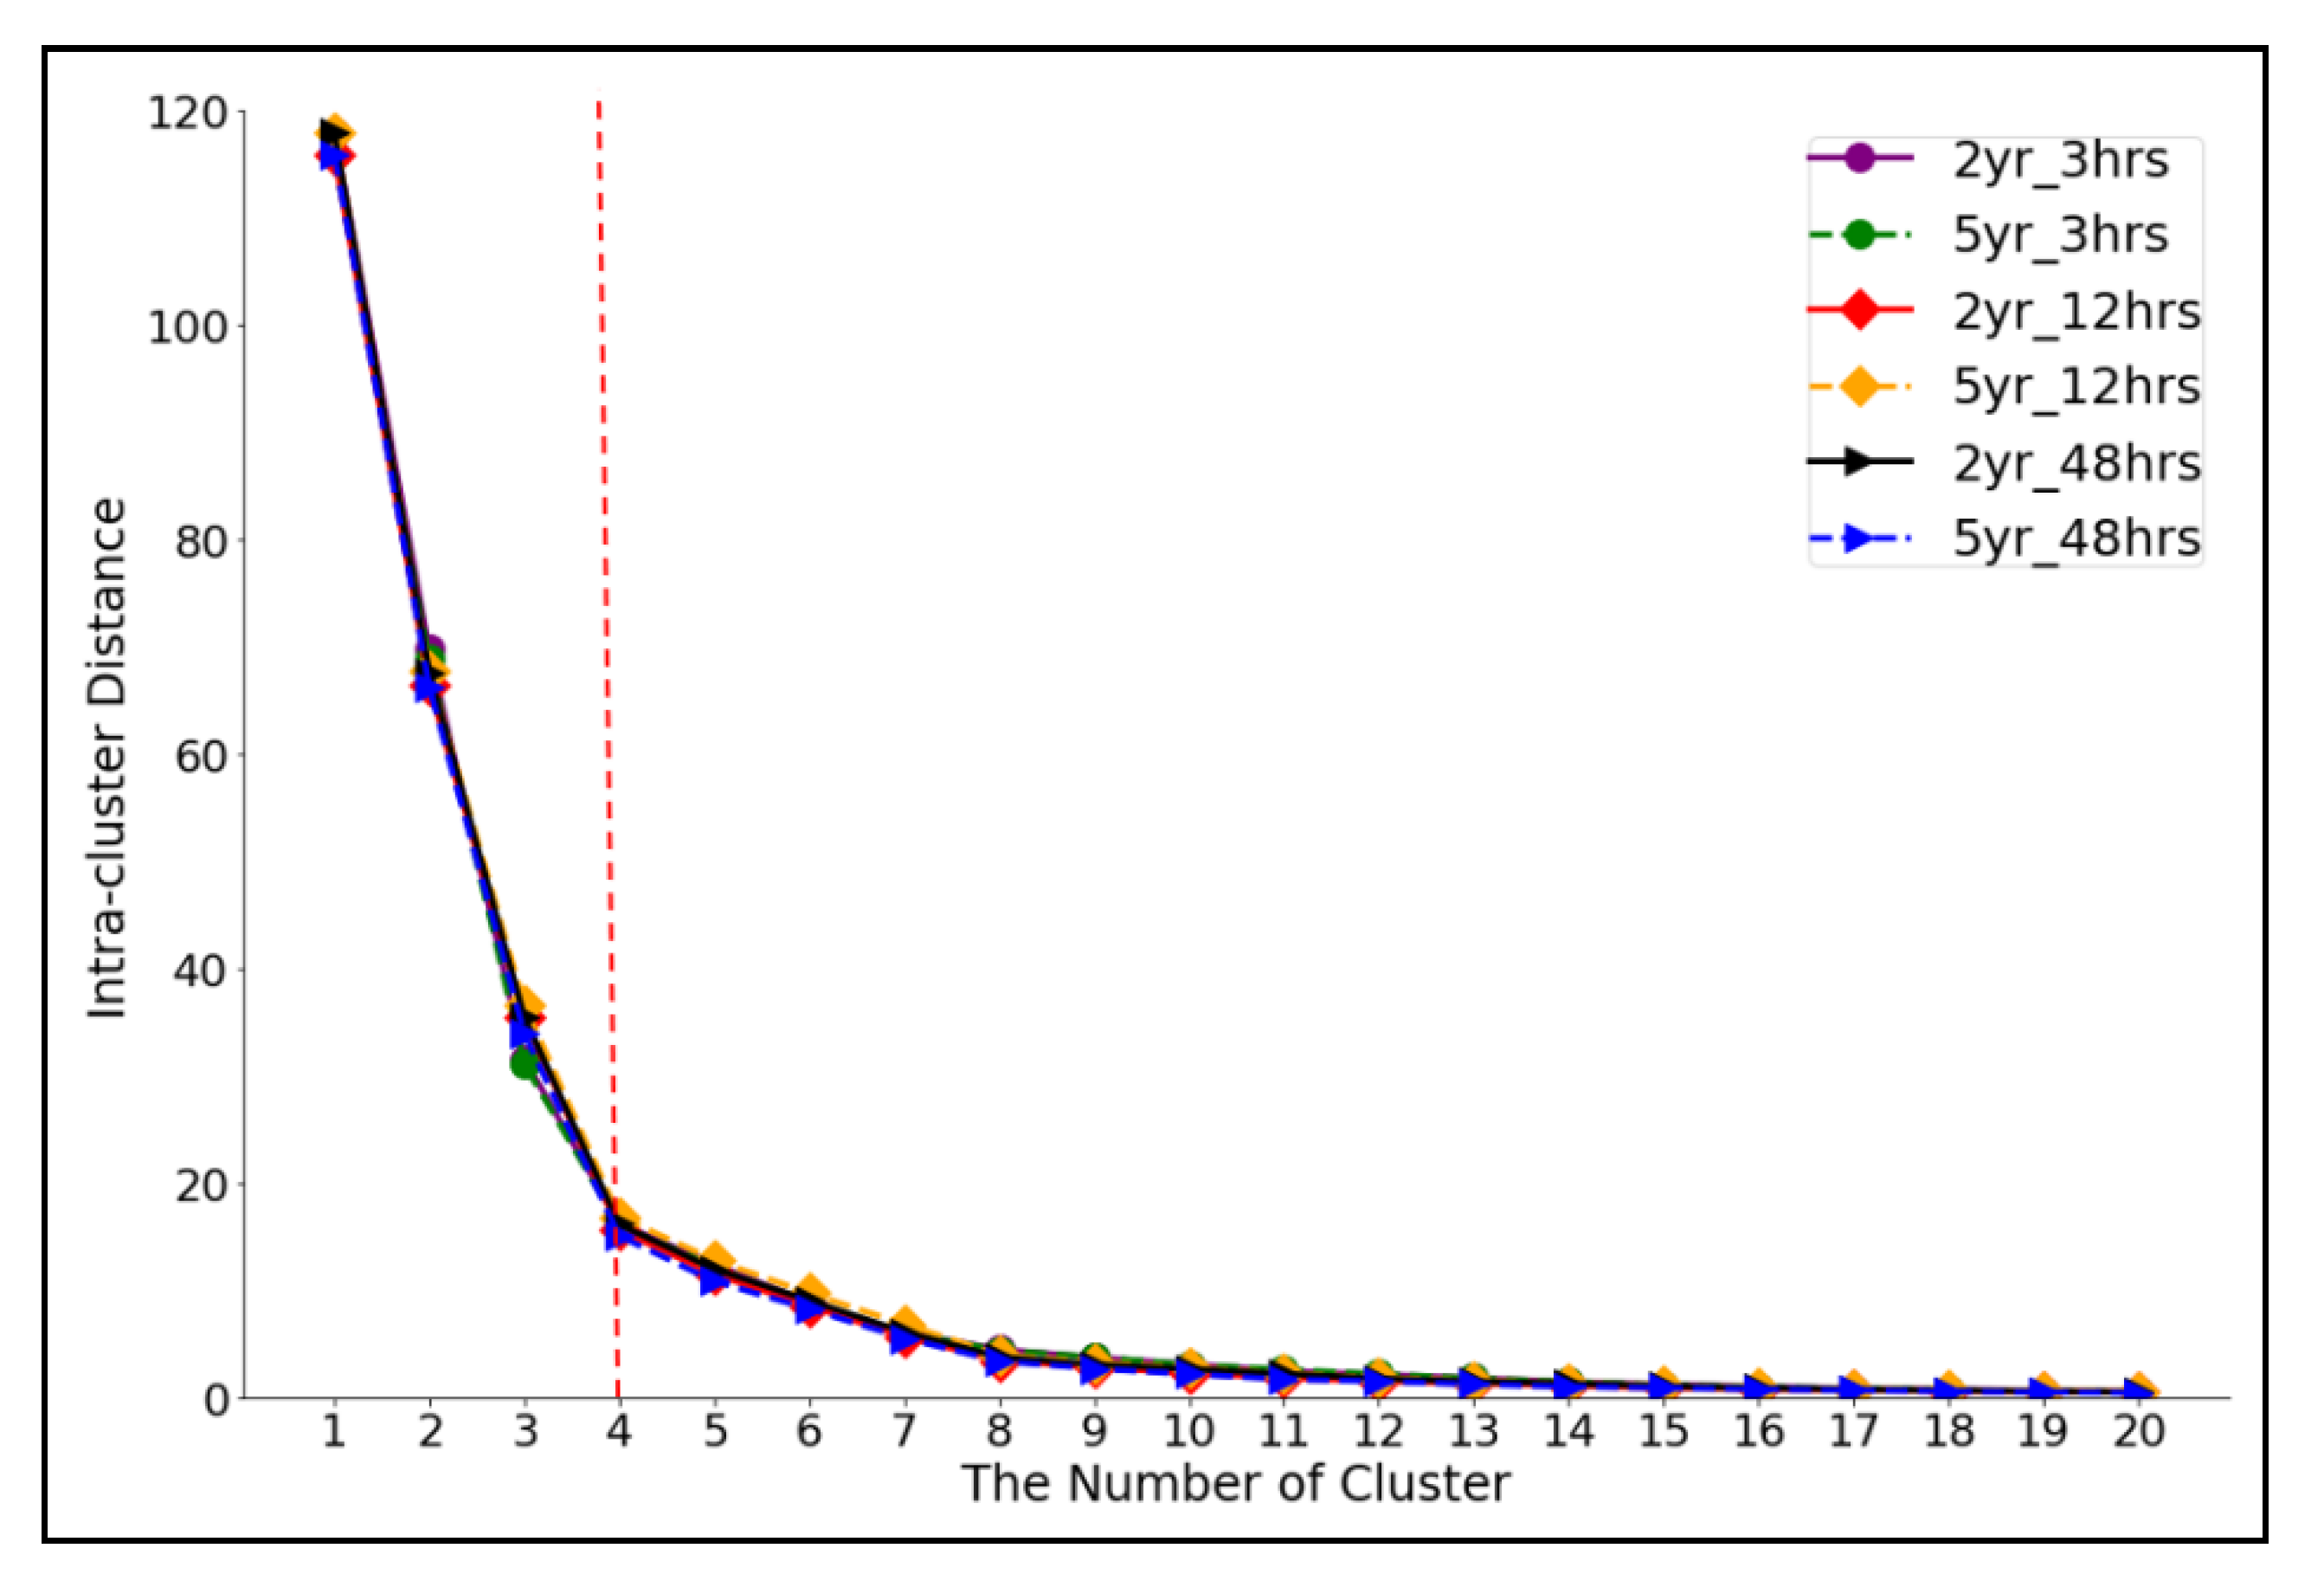
2.3.4. Intra-Cluster Distance
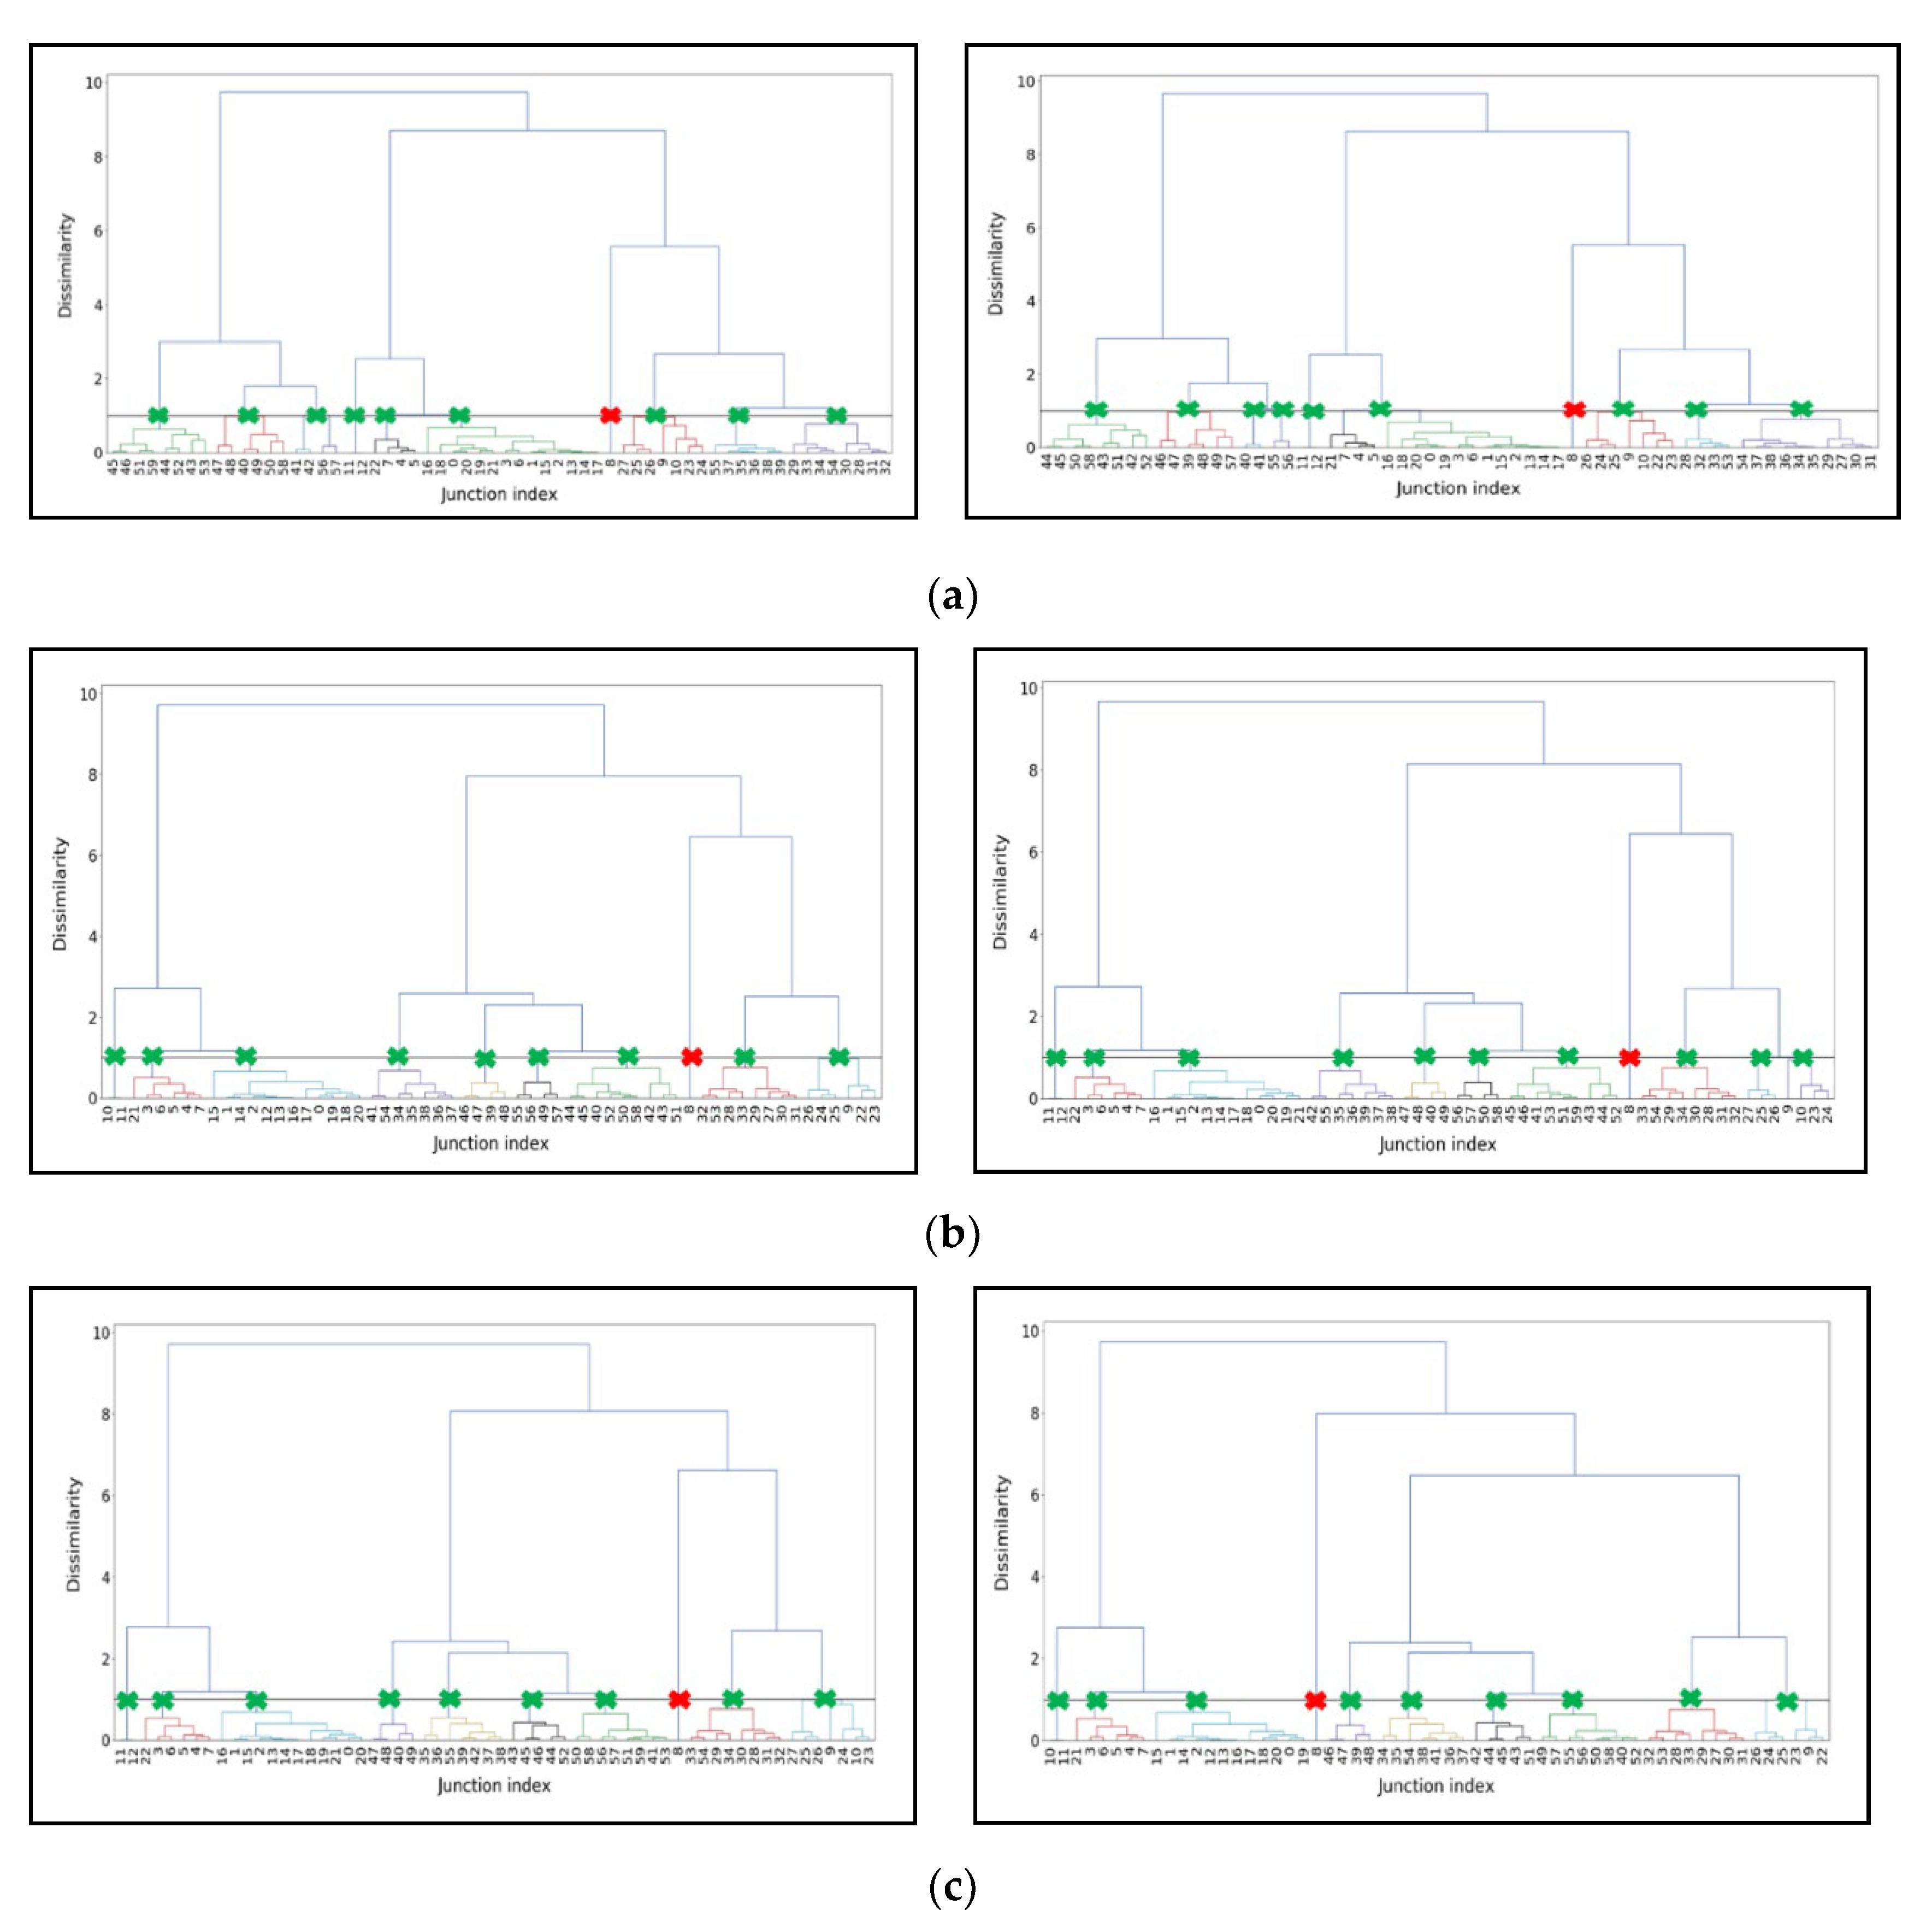
2.3.5. Dendrogram
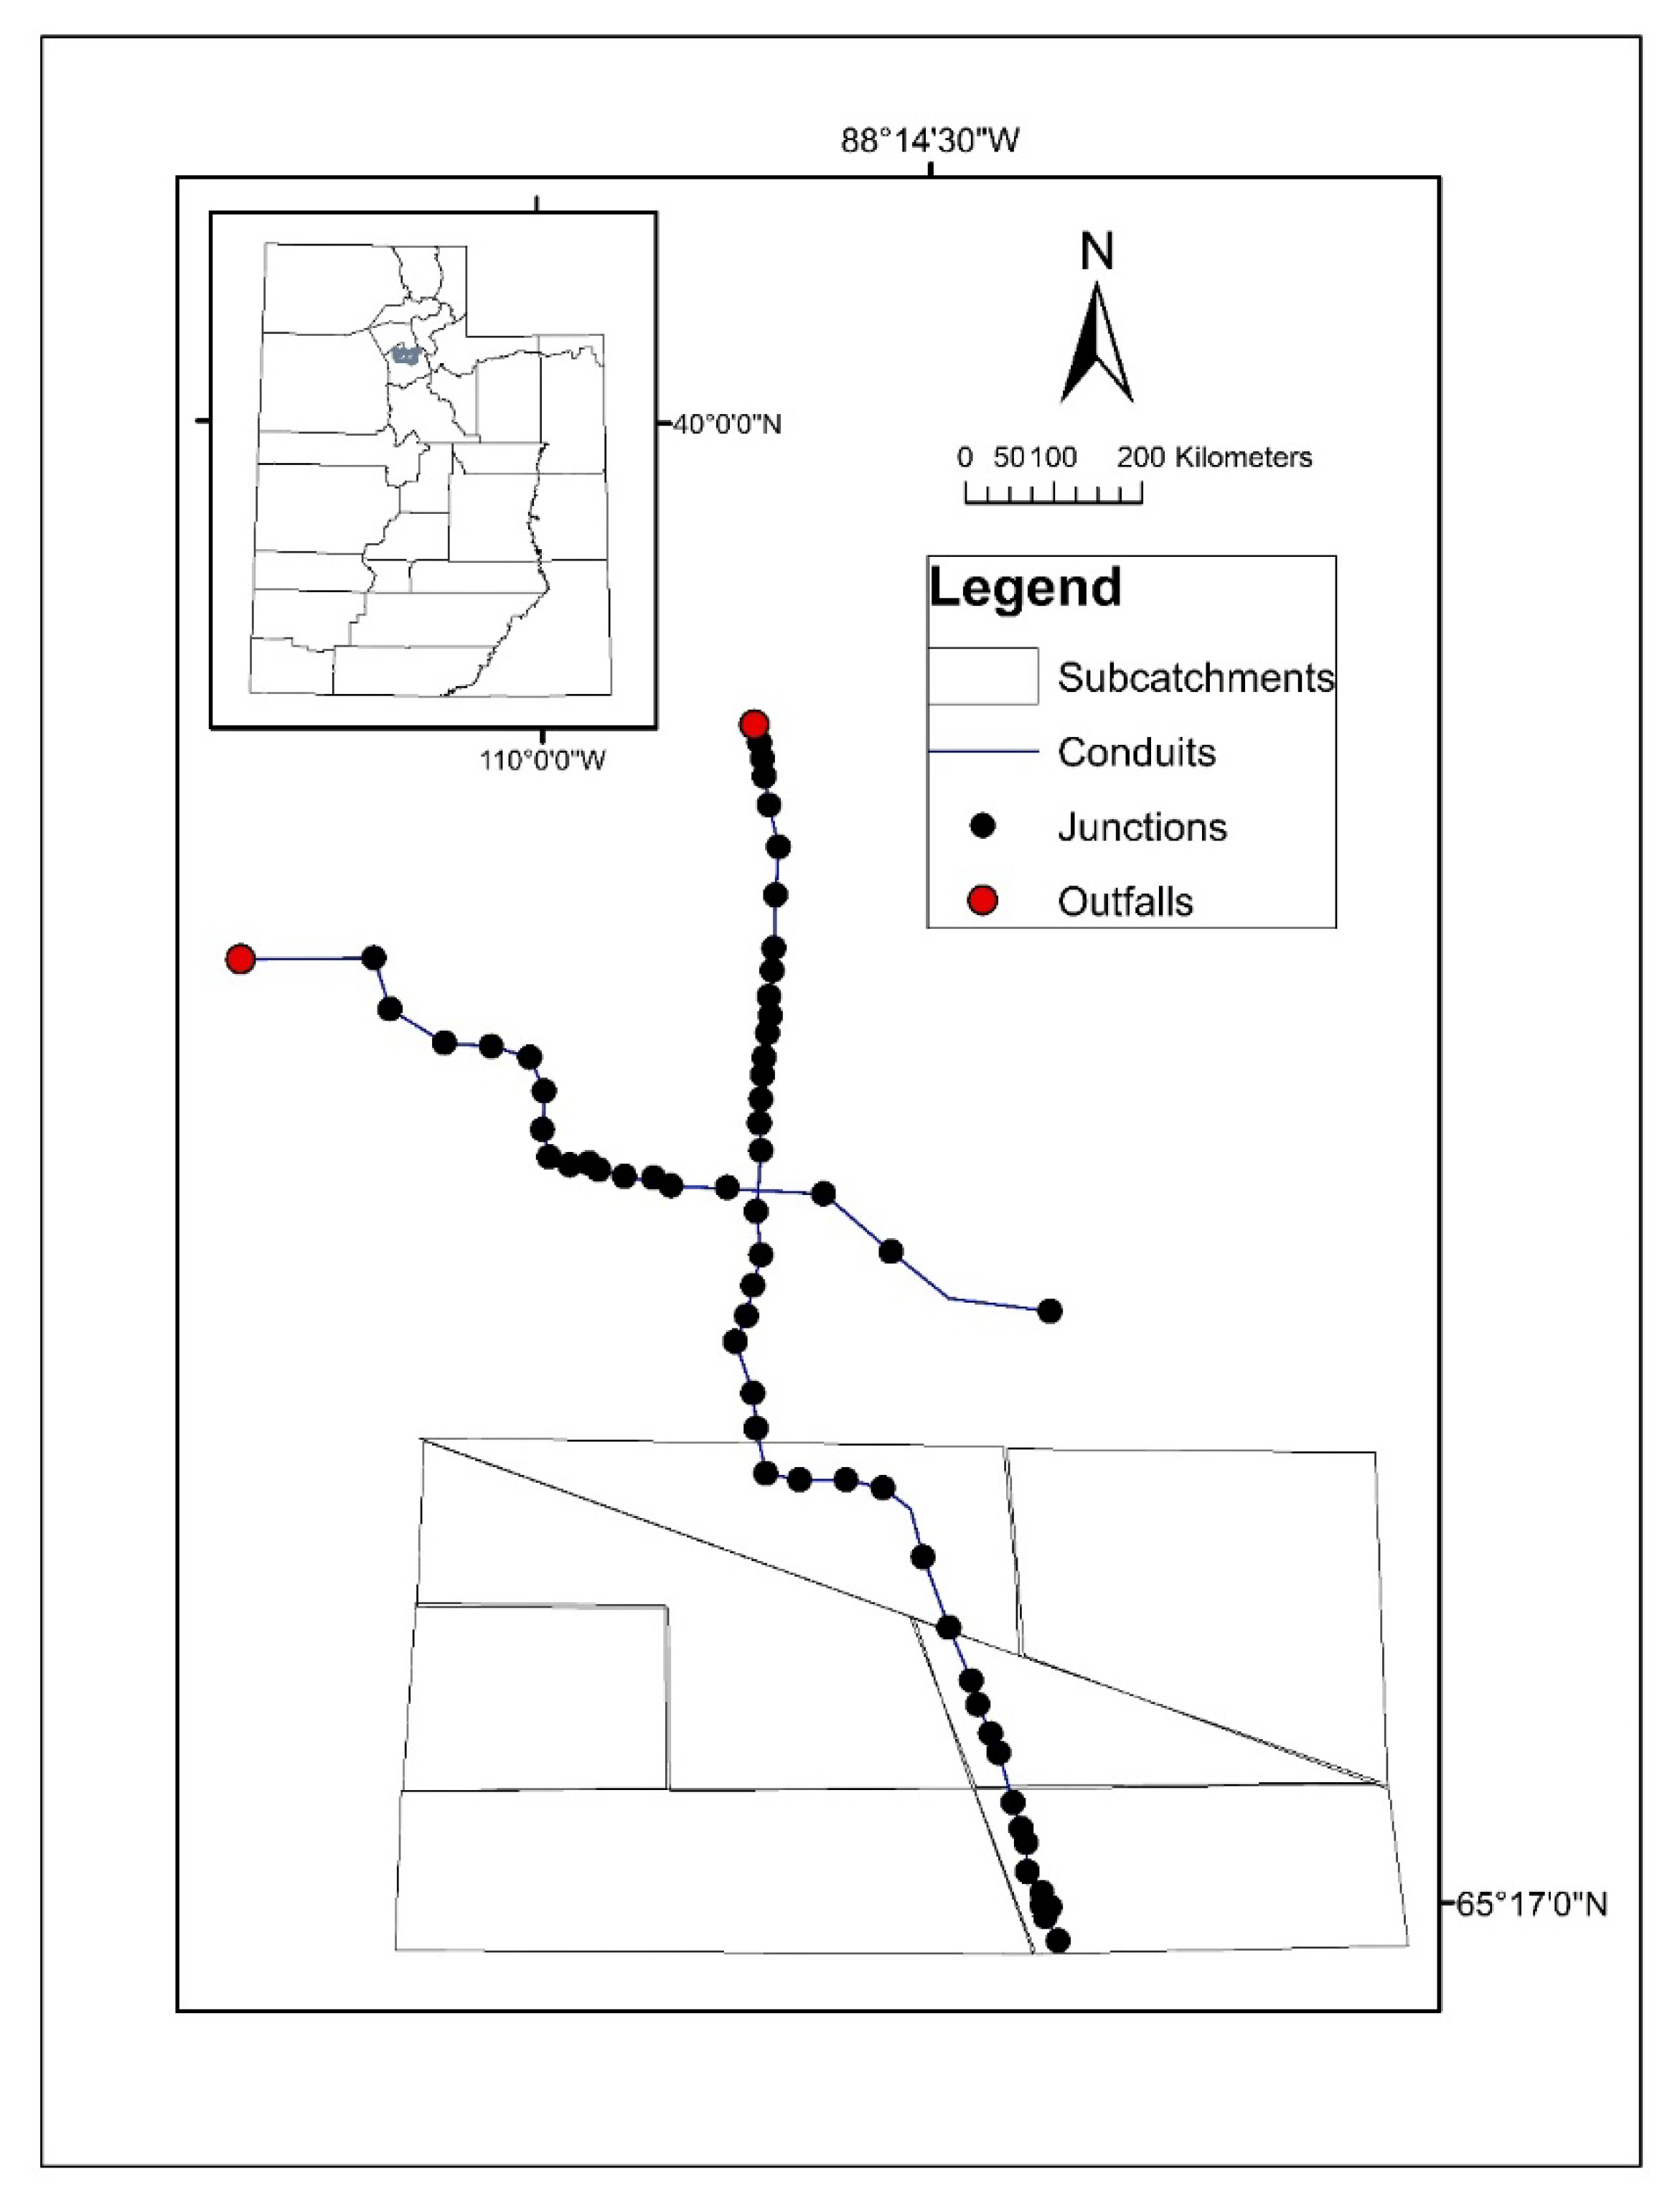
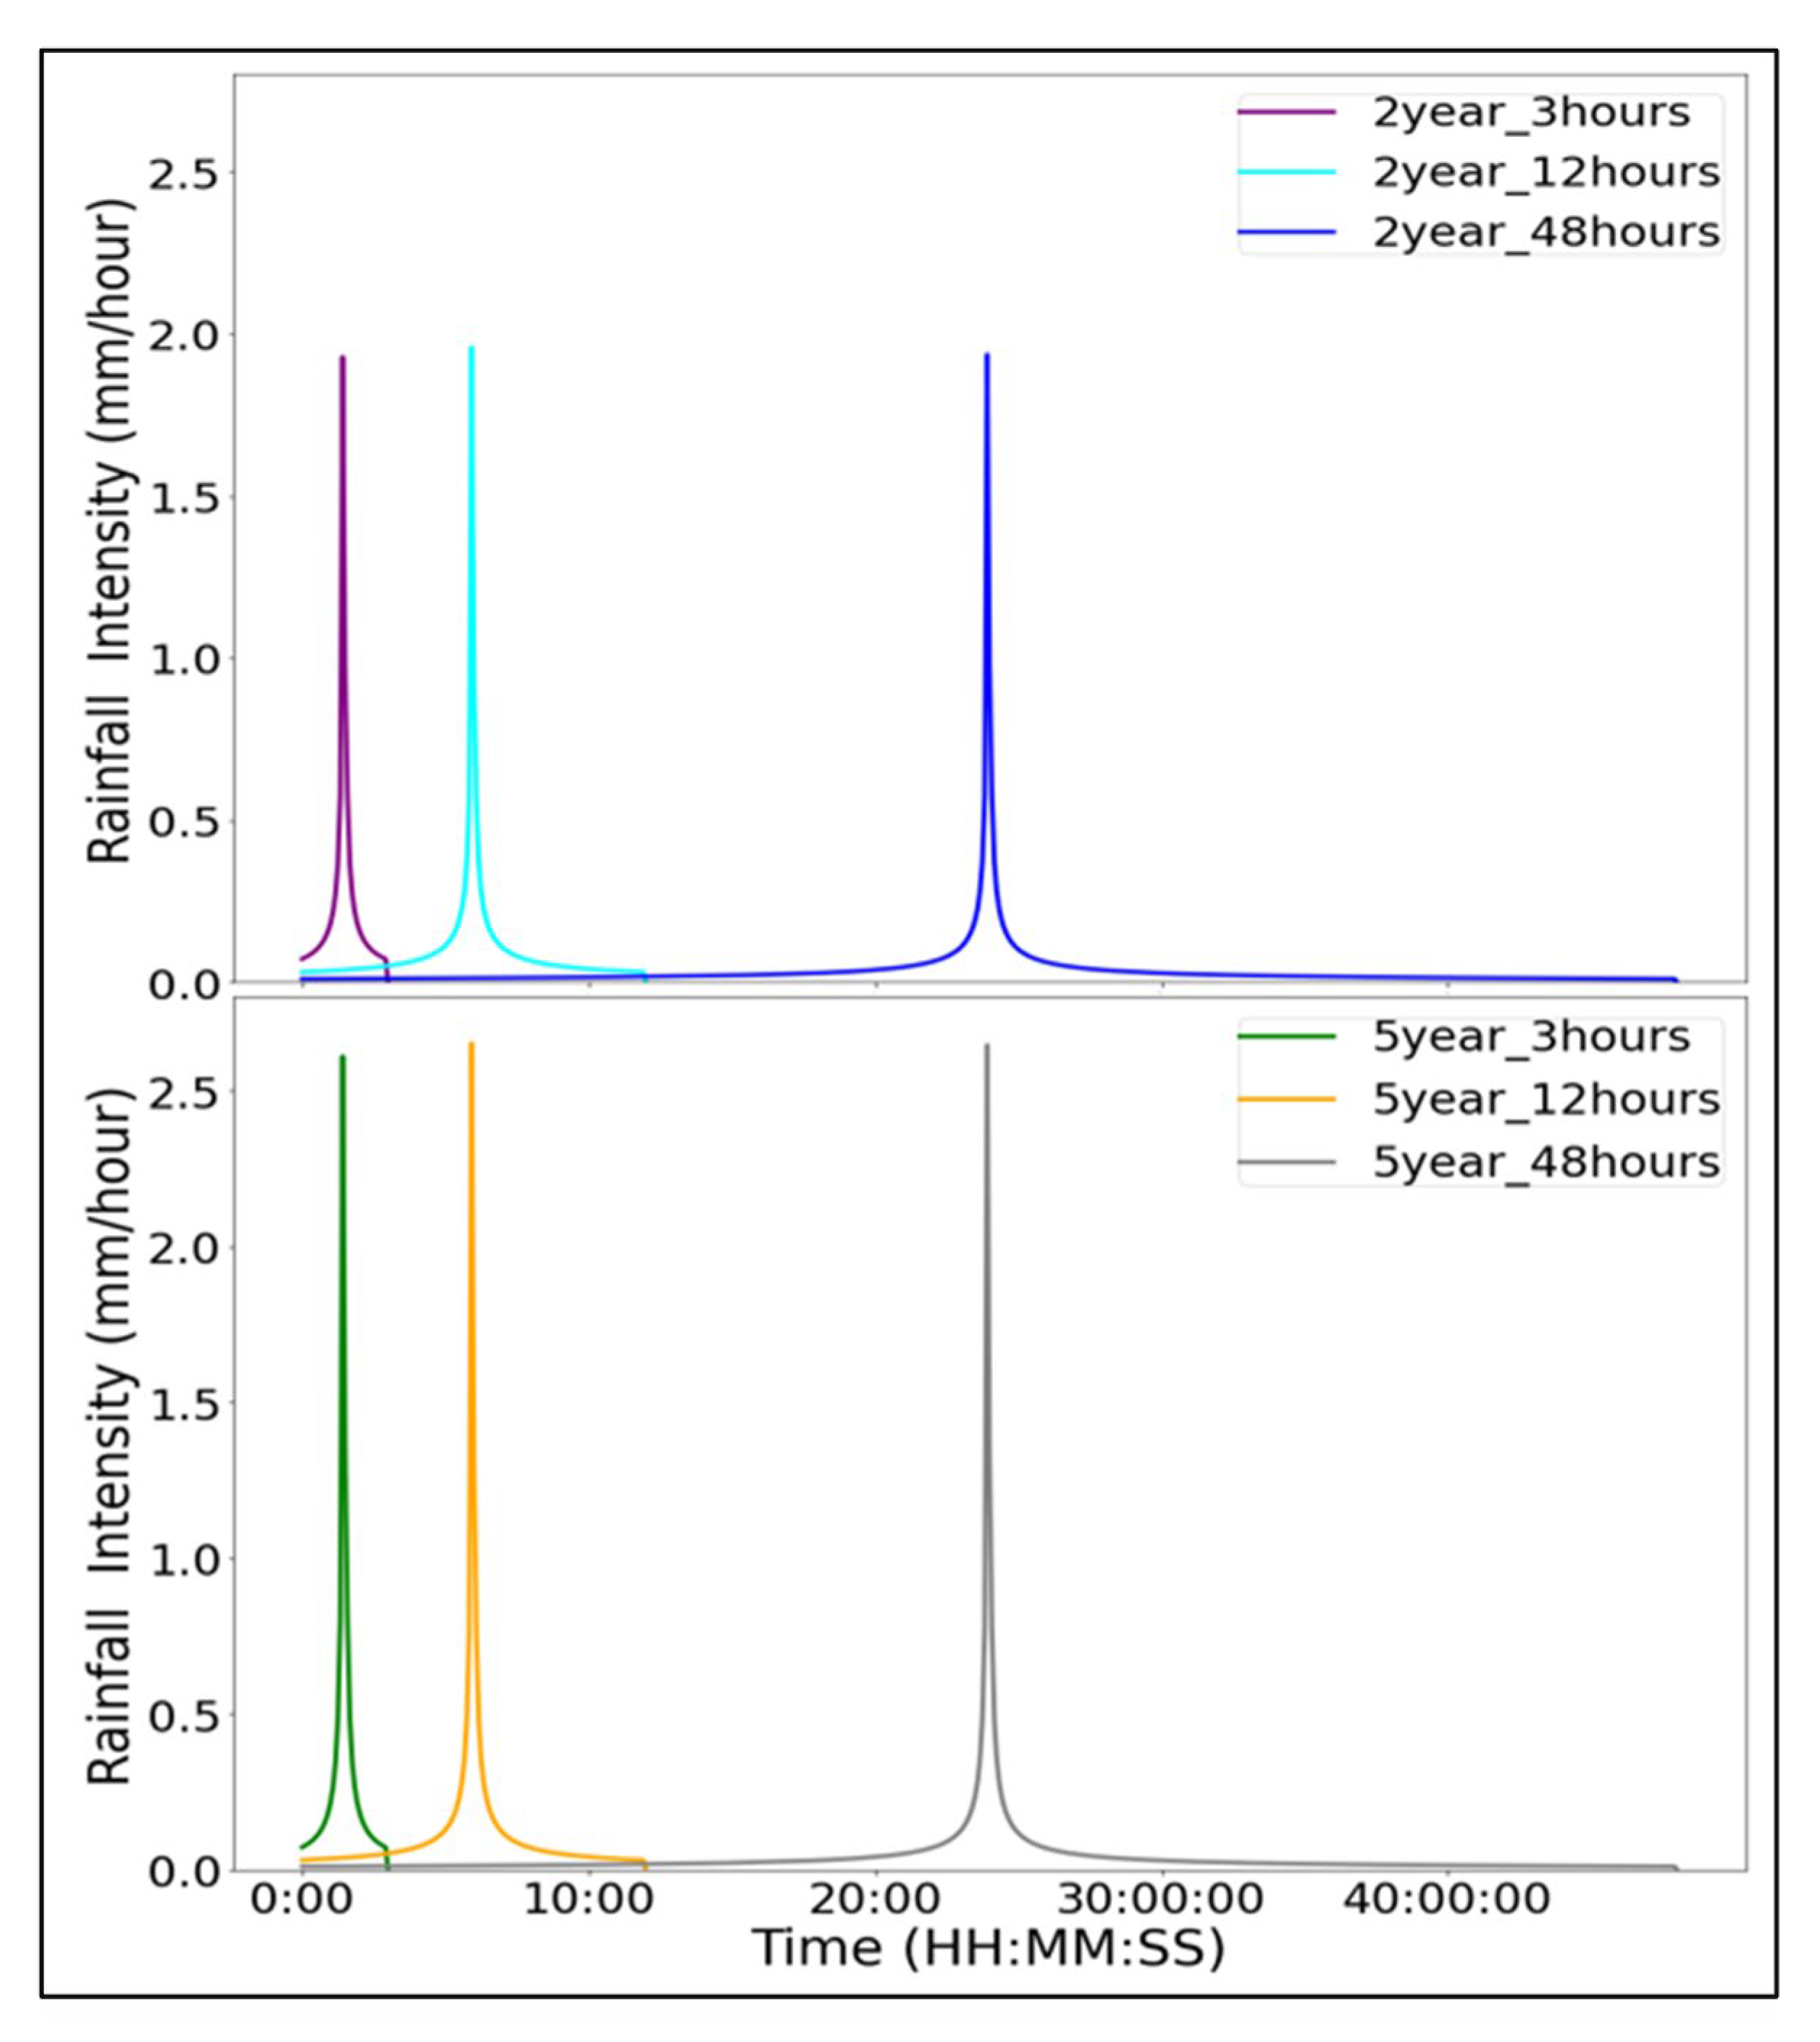
2.4. Study Area and Data Description
3. Results
3.1. Clustering Performance Evaluation
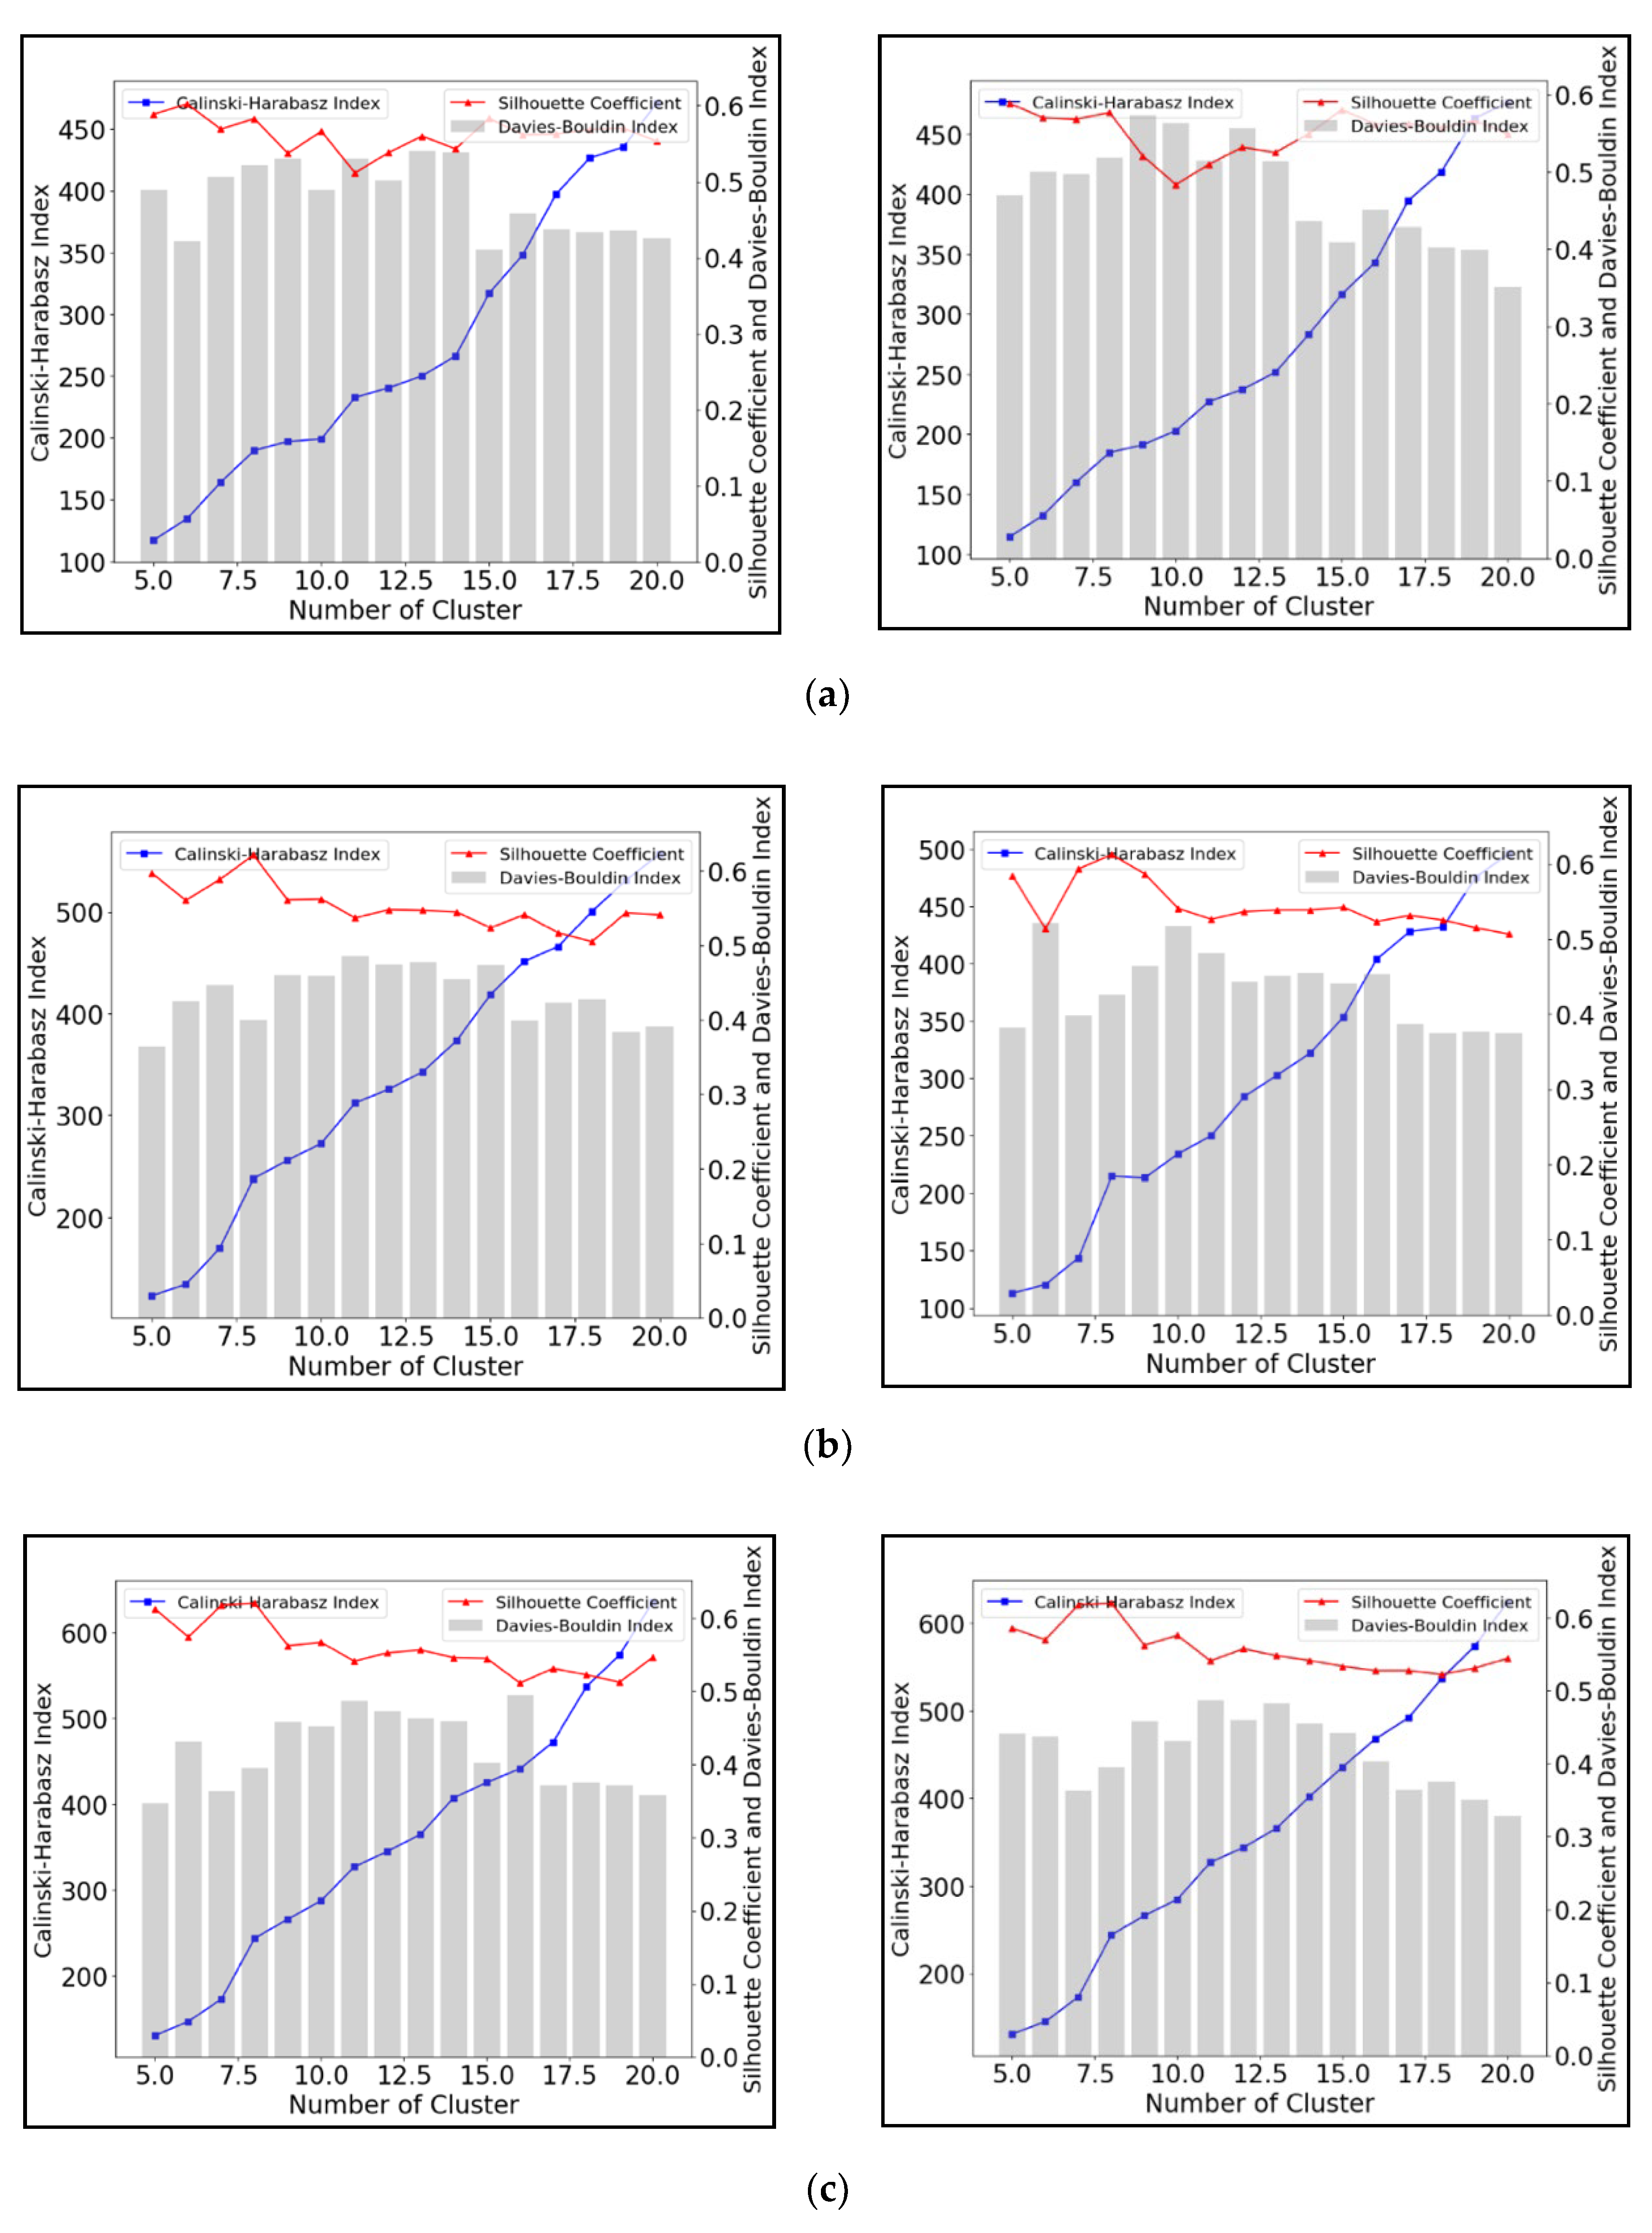
3.1.1. K-Means
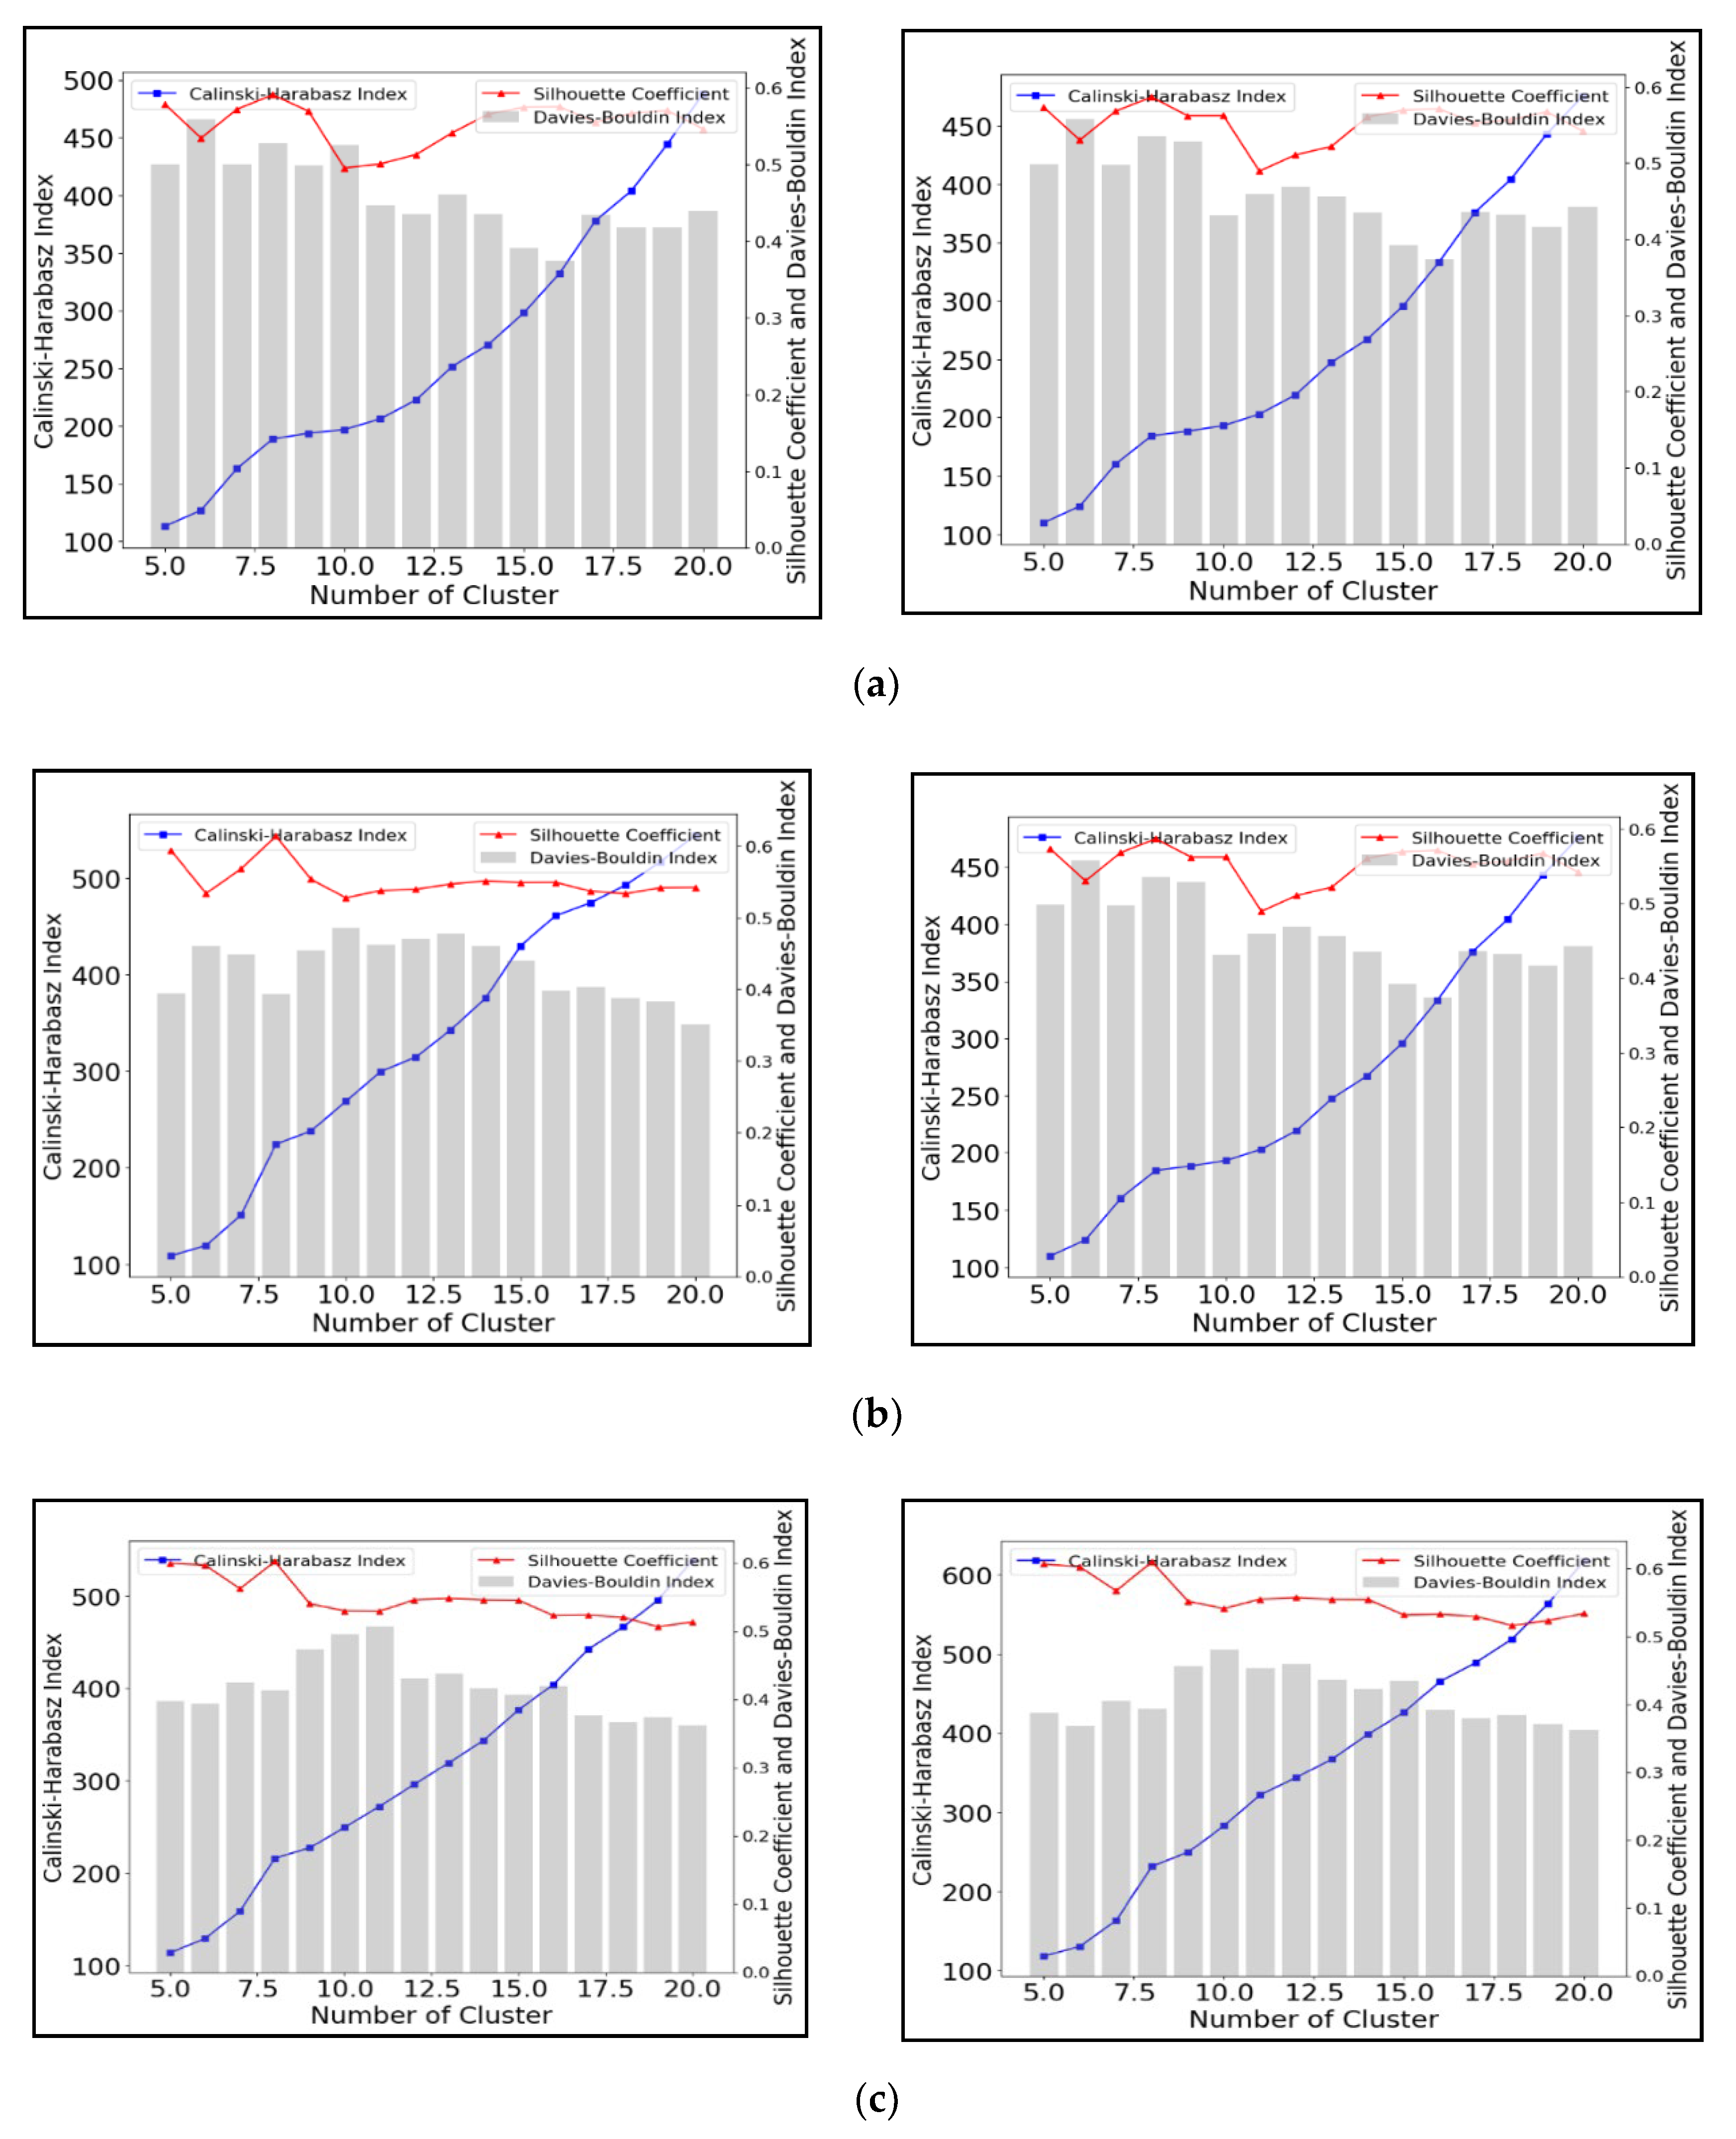
3.1.2. Agglomerative Clustering
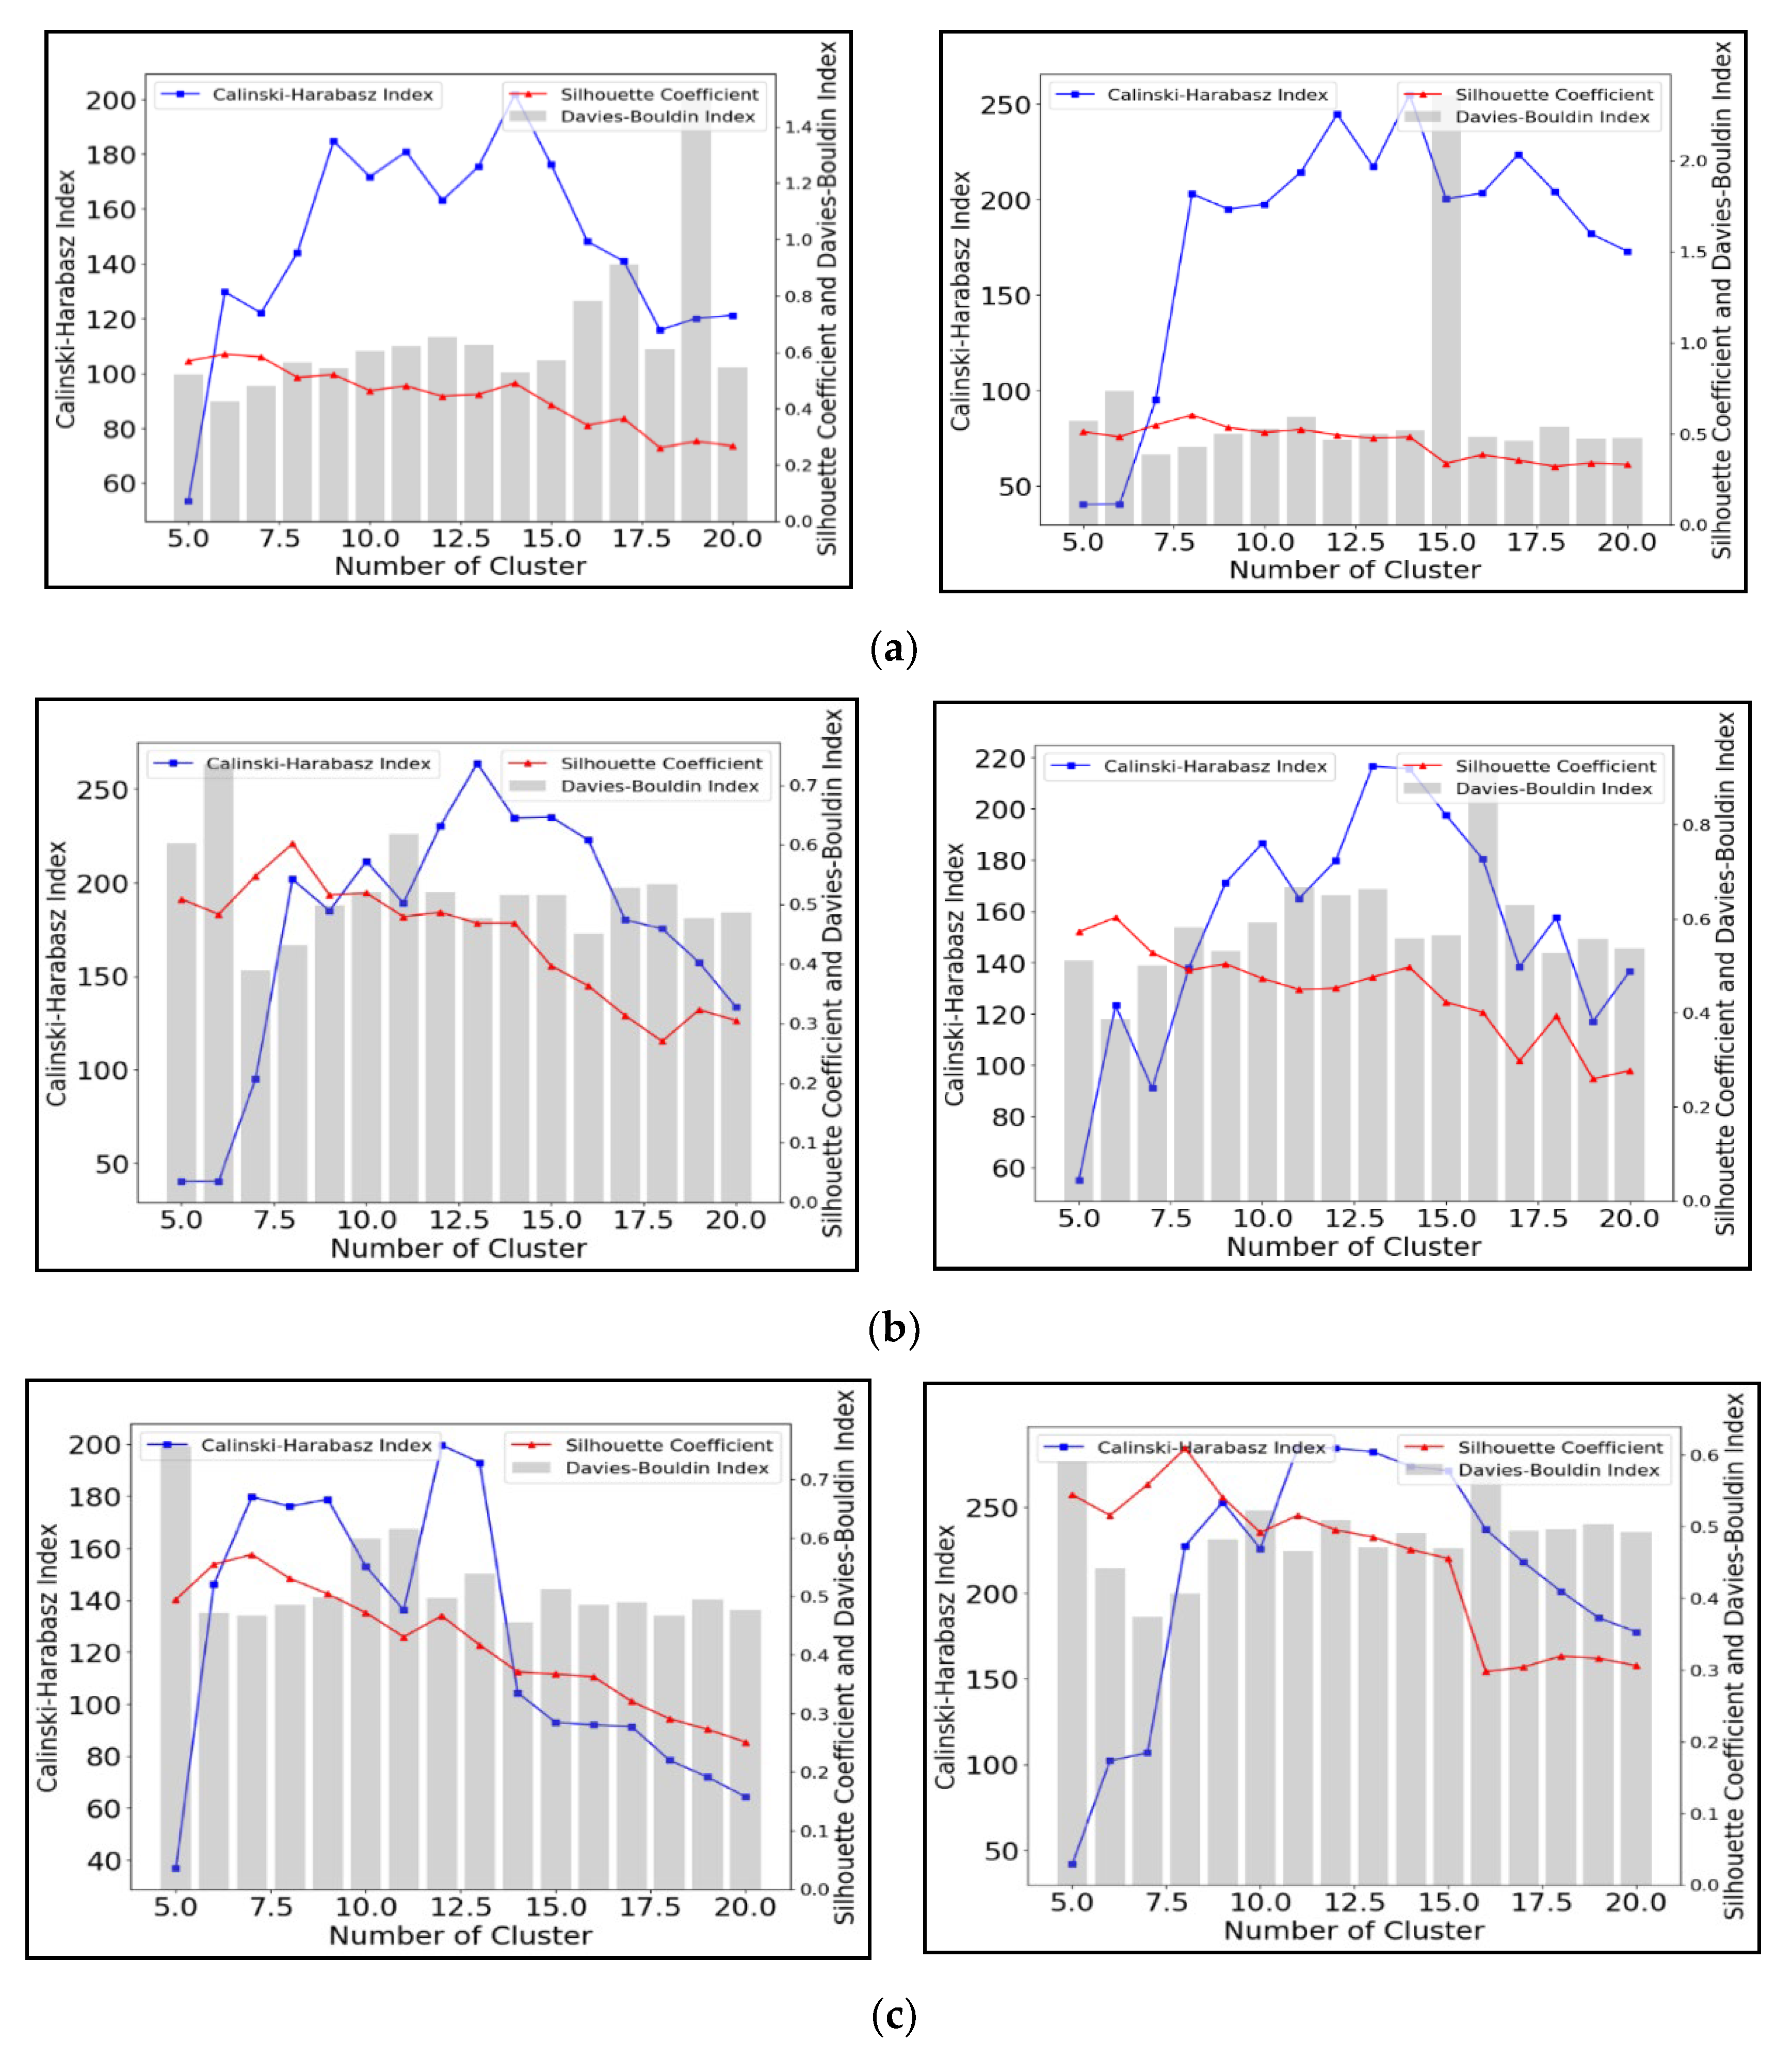
3.1.3. Spectral Clustering
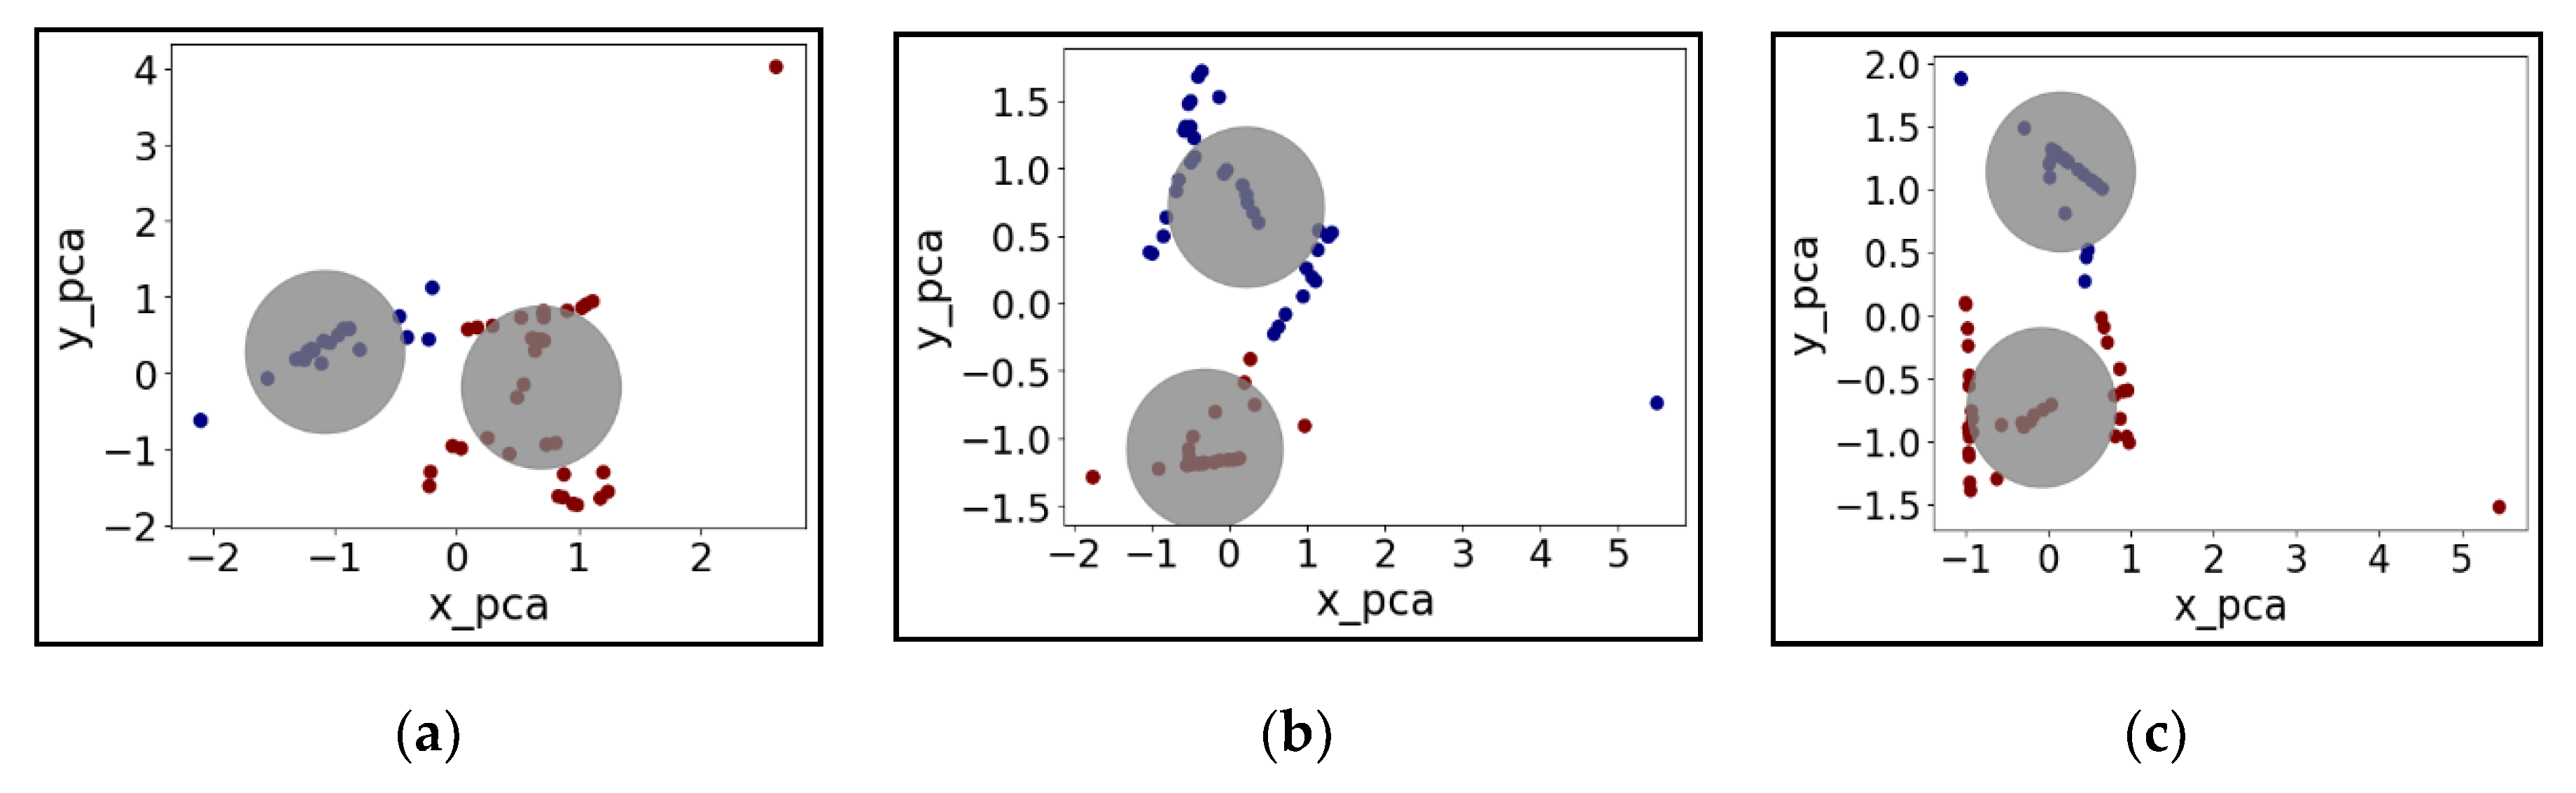
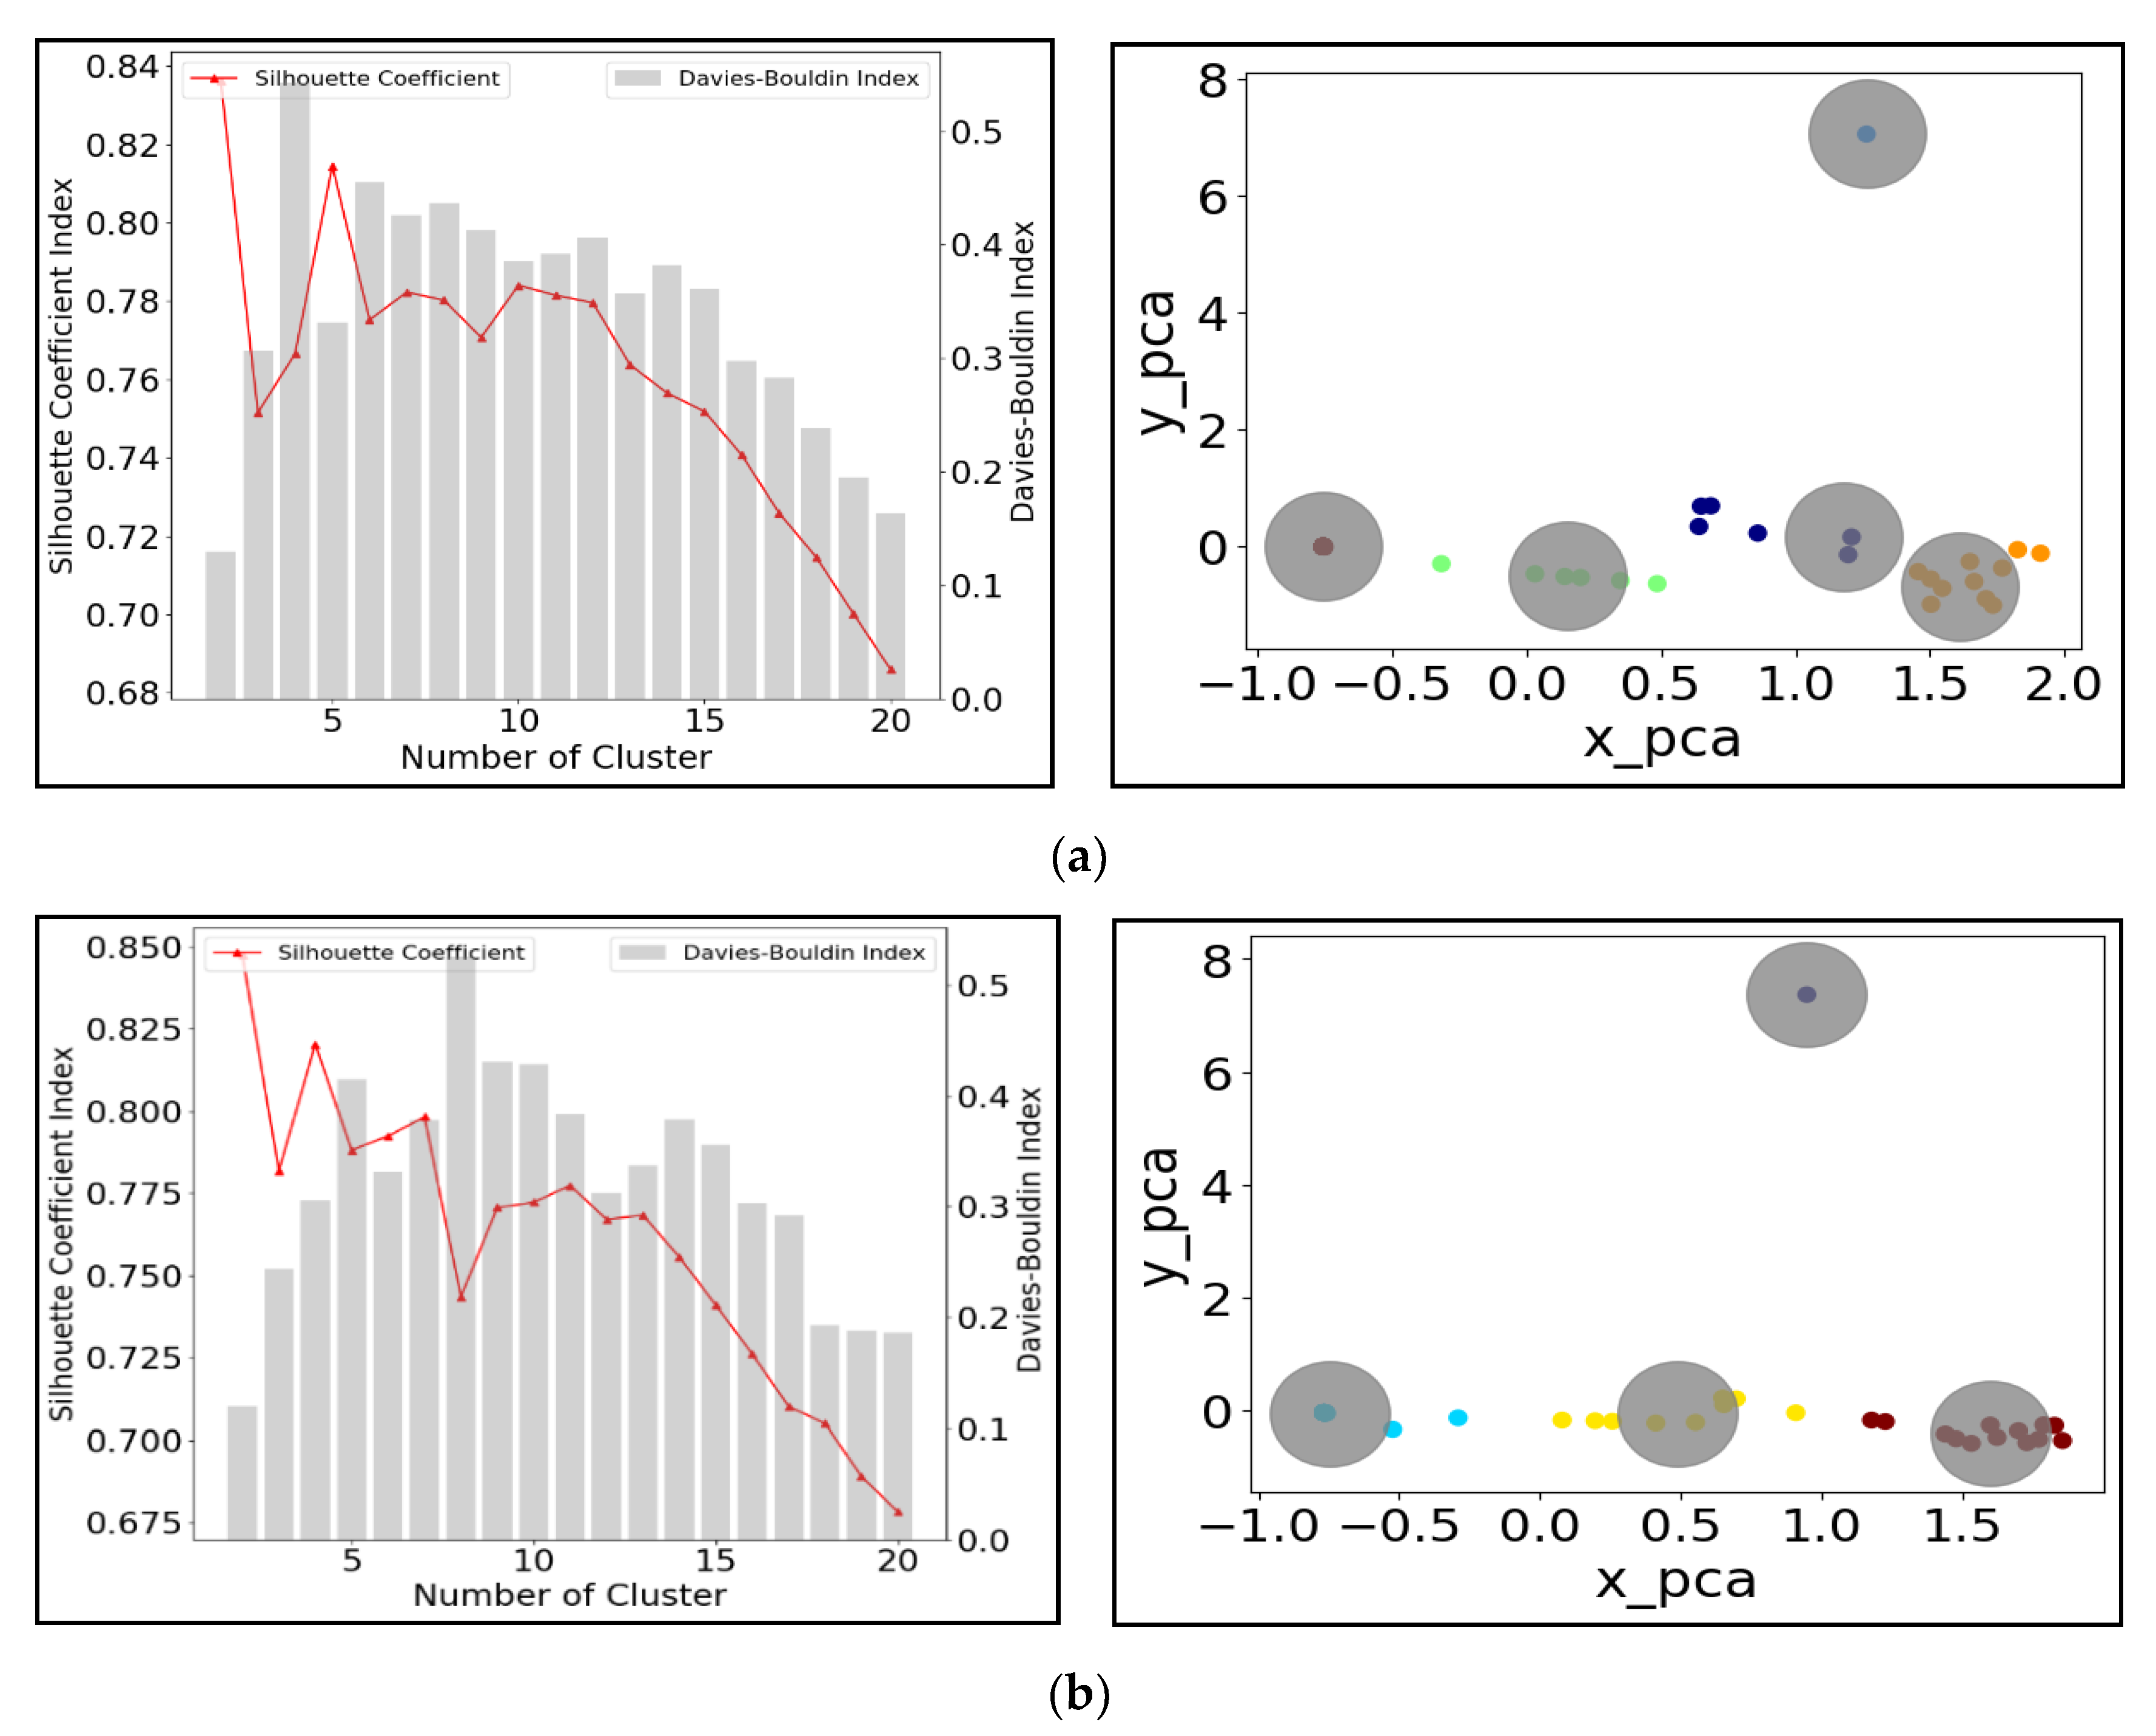
3.2. Clustering Performance Testing
3.3. Cluster Number Validation
4. Discussions
4.1. Clustering Parametric Discussion
4.2. Implications of Clustering Application
4.3. Limitations and Future Work
5. Summary and Conclusions
- (1)
- Silhouette coefficient index and Davies–Bouldin index are suitable metrics to measure the performance of K-means and agglomerative clustering model when subject to identify the number of clusters for the best performance. However, the Calinski–Harabasz Index is found to be more favorable to assess the performance of the spectral clustering model in grouping time-series water depth datasets for urban drainage flooding detection.
- (2)
- In K-means and spectral clustering models, the number of the clusters for maximizing model performance is highly related to the dataset length (flooding duration) but is slightly associated with the dataset magnitude. There is a negative correlation between the number of clusters and the length of datasets.
- (3)
- The short-period water depth data can be well-grouped by the agglomerative clustering model. In contrast, K-means and spectral clustering models are better able to handle time-series water depth datasets from long-duration storm scenarios.
- (4)
- This research work provides insight into unlabeled hydraulic data-driven techniques by conducting clustering experiments. The outcomes are useful for researchers to select the appropriate clustering model and to choose the corresponding performance metrics for specific urban flooding applications.
- (5)
- The detailed analyses in this work provide guidance concerning how to use cluster solutions to isolate or prescreen vulnerable locations for flooded location detection strategies. The water level in isolated clusters can be considered as the floods early warning for the local residents. The occurrence of anomalous changes in water level in urban drainage systems could be a timely reminder of the upstream or downstream flood events for the surrounding neighborhoods.
Author Contributions
Funding
Acknowledgments
Conflicts of Interest
References
- Li, J.; Tao, T.; Kreidler, M.; Burian, S.; Yan, H. Construction Cost-Based Effectiveness Analysis of Green and Grey Infrastructure in Controlling Flood Inundation: A Case Study. J. Water Manag. Model. 2019, 27, C466. [Google Scholar] [CrossRef]
- Kerkez, B.; Gruden, C.; Lewis, M.; Montestruque, L.; Quigley, M.; Wong, B.; Bedig, A.; Kertesz, R.; Braun, T.; Cadwalader, O.; et al. Smarter stormwater systems. Environ. Sci. Technol. 2016, 50, 7267–7273. [Google Scholar] [CrossRef]
- Li, J.; Yang, X.; Sitzenfrei, R. Rethinking the framework of smart water system: A review. Water (Switzerland) 2020, 12, 412. [Google Scholar] [CrossRef]
- Morales, V.M.; Mier, J.M.; Garcia, M.H. Innovative modeling framework for combined sewer overflows prediction. Urban Water J. 2017, 14, 97–111. [Google Scholar] [CrossRef]
- Norbiato, D.; Borga, M.; Degli Esposti, S.; Gaume, E.; Anquetin, S. Flash flood warning based on rainfall thresholds and soil moisture conditions: An assessment for gauged and ungauged basins. J. Hydrol. 2008, 362, 274–290. [Google Scholar] [CrossRef]
- Wong, B.P.; Kerkez, B. Adaptivemeasurements of urban runoff quality. Water Resour. Res. 2016, 52, 8986–9000. [Google Scholar] [CrossRef]
- Solomatine, D.P.; Ostfeld, A. Data-driven modelling: Some past experiences and new approaches. J. Hydroinformatics 2008, 10, 3–22. [Google Scholar] [CrossRef]
- Henonin, J.; Russo, B.; Mark, O.; Gourbesville, P. Real-time urban flood forecasting and modelling—A state of the art. J. Hydroinformatics 2013, 15, 717–736. [Google Scholar] [CrossRef]
- Koo, D.; Piratla, K.; Matthews, C.J. Towards Sustainable Water Supply: Schematic Development of Big Data Collection Using Internet of Things (IoT). Procedia Eng. 2015, 118, 489–497. [Google Scholar] [CrossRef]
- Vojinovic, Z.; Abbott, M.B. Twenty-five years of hydroinformatics. Water 2017, 9, 59. [Google Scholar] [CrossRef]
- Diao, K.; Farmani, R.; Fu, G.; Astaraie-Imani, M.; Ward, S.; Butler, D. Cluster analysis of water distribution systems: Identifying critical components and community impacts. Water Sci. Technol. 2014, 70, 1764–1773. [Google Scholar] [CrossRef] [PubMed]
- Kang, O.Y.; Lee, S.C.; Wasewar, K.; Kim, M.J.; Liu, H.; Oh, T.S.; Janghorban, E.; Yoo, C.K. Determination of key sensor locations for non-point pollutant sources management in sewer network. Korean J. Chem. Eng. 2013, 30, 20–26. [Google Scholar] [CrossRef]
- Mullapudi, A.; Lewis, M.J.; Gruden, C.L.; Kerkez, B. Deep reinforcement learning for the real time control of stormwater systems. Adv. Water Resour. 2020, 140, 103600. [Google Scholar] [CrossRef]
- Tehrany, M.S.; Pradhan, B.; Jebur, M.N. Flood susceptibility mapping using a novel ensemble weights-of-evidence and support vector machine models in GIS. J. Hydrol. 2014. [Google Scholar] [CrossRef]
- Yu, P.S.; Yang, T.C.; Chen, S.Y.; Kuo, C.M.; Tseng, H.W. Comparison of random forests and support vector machine for real-time radar-derived rainfall forecasting. J. Hydrol. 2017, 118, 489–497. [Google Scholar] [CrossRef]
- Shu, C.; Ouarda, T.B.M.J. Regional flood frequency analysis at ungauged sites using the adaptive neuro-fuzzy inference system. J. Hydrol. 2008, 552, 92–104. [Google Scholar] [CrossRef]
- Zadeh, M.R.; Amin, S.; Khalili, D.; Singh, V.P. Daily Outflow Prediction by Multi Layer Perceptron with Logistic Sigmoid and Tangent Sigmoid Activation Functions. Water Resour. Manag. 2010, 24, 2673–2688. [Google Scholar] [CrossRef]
- Wang, Z.; Lai, C.; Chen, X.; Yang, B.; Zhao, S.; Bai, X. Flood hazard risk assessment model based on random forest. J. Hydrol. 2015, 527, 1130–1141. [Google Scholar] [CrossRef]
- Choubin, B.; Darabi, H.; Rahmati, O.; Sajedi-Hosseini, F.; Kløve, B. River suspended sediment modelling using the CART model: A comparative study of machine learning techniques. Sci. Total Environ. 2018, 615, 272–281. [Google Scholar] [CrossRef]
- Bowes, B.D.; Sadler, J.M.; Morsy, M.M.; Behl, M.; Goodall, J.L. Forecasting groundwater table in a flood prone coastal city with long short-term memory and recurrent neural networks. Water (Switzerland) 2019, 11, 1098. [Google Scholar] [CrossRef]
- Hu, Y.; Scavia, D.; Kerkez, B. Are all data useful? Inferring causality to predict flows across sewer and drainage systems using directed information and boosted regression trees. Water Res. 2018, 145, 697–706. [Google Scholar] [CrossRef] [PubMed]
- Li, J. A data-driven improved fuzzy logic control optimization-simulation tool for reducing flooding volume at downstream urban drainage systems. Sci. Total Environ. 2020, 732, 138931. [Google Scholar] [CrossRef] [PubMed]
- Yang, J.; Ye, M.; Tang, Z.; Jiao, T.; Song, X.; Pei, Y.; Liu, H. Using cluster analysis for understanding spatial and temporal patterns and controlling factors of groundwater geochemistry in a regional aquifer. J. Hydrol. 2020, 583, 124594. [Google Scholar] [CrossRef]
- Jain, A.K.; Murty, M.N.; Flynn, P.J. Data clustering: A review. ACM Comput. Surv. 1999, 31, 264–323. [Google Scholar] [CrossRef]
- Wu, Y.; Liu, S.; Wu, X.; Liu, Y.; Guan, Y. Burst detection in district metering areas using a data driven clustering algorithm. Water Res. 2016, 100, 28–37. [Google Scholar] [CrossRef] [PubMed]
- Perelman, L.; Ostfeld, A. Topological clustering for water distribution systems analysis. Environ. Model. Softw. 2011, 26, 969–972. [Google Scholar] [CrossRef]
- Sela Perelman, L.; Allen, M.; Preis, A.; Iqbal, M.; Whittle, A.J. Automated sub-zoning of water distribution systems. Environ. Model. Softw. 2015, 65, 1–14. [Google Scholar] [CrossRef]
- Keogh, E.; Lin, J. Clustering of time-series subsequences is meaningless: Implications for previous and future research. Knowl. Inf. Syst. 2005, 8, 154–177. [Google Scholar] [CrossRef]
- Chen, J.R. Making subsequence time series clustering meaningful. In Proceedings of the Fifth IEEE International Conference on Data Mining (ICDM'05), Houston, TX, USA, 27–30 November 2005; pp. 114–121. [Google Scholar]
- Chen, J.R. Useful clustering outcomes from meaningful time series clustering. Conf. Res. Pract. Inf. Technol. Ser. 2007, 70, 101–109. [Google Scholar]
- Rodriguez, A.; Laio, A. Clustering by fast search and find of density peaks. Science 2014, 344, 1492–1496. [Google Scholar] [CrossRef]
- Xing, L.; Sela, L. Unsteady pressure patterns discovery from high-frequency sensing in water distribution systems. Water Res. 2019, 158, 291–300. [Google Scholar] [CrossRef] [PubMed]
- Xu, D.; Tian, Y. A Comprehensive Survey of Clustering Algorithms. Ann. Data Sci. 2015, 2, 165–193. [Google Scholar] [CrossRef]
- Aggarwal, C.C.; Zhai, C.X. A survey of text clustering algorithms. In Mining Text Data; Springer: Boston, MA, USA, 2012; pp. 77–128. ISBN 9781461432234. [Google Scholar]
- Mosavi, A.; Ozturk, P.; Chau, K.W. Flood prediction using machine learning models: Literature review. Water (Switzerland) 2018, 10, 1536. [Google Scholar] [CrossRef]
- Mel, R.A.; Viero, D.P.; Carniello, L.; D’Alpaos, L. Optimal floodgate operation for river flood management: The case study of Padova (Italy). J. Hydrol. Reg. Stud. 2020, 30, 100702. [Google Scholar] [CrossRef]
- Mel, R.A.; Viero, D.P.; Carniello, L.; D’Alpaos, L. Multipurpose use of artificial channel networks for flood risk reduction: The case of the waterway Padova-Venice (Italy). Water (Switzerland) 2020, 12, 1609. [Google Scholar] [CrossRef]
- Hsu, M.H.; Chen, S.H.; Chang, T.J. Inundation simulation for urban drainage basin with storm sewer system. J. Hydrol. 2000, 234, 21–37. [Google Scholar] [CrossRef]
- Yaseen, Z.M.; Sulaiman, S.O.; Deo, R.C.; Chau, K.W. An enhanced extreme learning machine model for river flow forecasting: State-of-the-art, practical applications in water resource engineering area and future research direction. J. Hydrol. 2019, 569, 387–408. [Google Scholar] [CrossRef]
- Fotovatikhah, F.; Herrera, M.; Shamshirband, S.; Chau, K.W.; Ardabili, S.F.; Piran, M.J. Survey of computational intelligence as basis to big flood management: Challenges, research directions and future work. Eng. Appl. Comput. Fluid Mech. 2018, 12, 411–437. [Google Scholar] [CrossRef]
- Kubat, M. An Introduction to Machine Learning; Publisher: New York City, NY, USA, 2017; ISBN 9783319639130. [Google Scholar]
- Xu, R.; Wunsch, D. Survey of clustering algorithms. IEEE Trans. Neural Networks 2005, 16, 645–678. [Google Scholar] [CrossRef]
- Shannon, W.D. 11 Cluster Analysis. Handb. Stat. 2007, 27, 342–366. [Google Scholar]
- Celebi, M.E.; Kingravi, H.A.; Vela, P.A. A comparative study of efficient initialization methods for the k-means clustering algorithm. Expert Syst. Appl. 2013, 40, 200–210. [Google Scholar] [CrossRef]
- Lloyd, S.P. Least Squares Quantization in PCM. IEEE Trans. Inf. Theory 1982, 28, 129–137. [Google Scholar] [CrossRef]
- Stanford, M. Chapter 7 Hierarchical cluster analysis. Stat. Med. 2012, 2, 1–11. [Google Scholar]
- Danielsson, P.E. Euclidean distance mapping. Comput. Graph. Image Process. 1980, 14, 227–248. [Google Scholar] [CrossRef]
- Forina, M.; Armanino, C.; Raggio, V. Clustering with dendrograms on interpretation variables. Anal. Chim. Acta 2002, 454, 13–19. [Google Scholar] [CrossRef]
- Von Luxburg, U. A tutorial on spectral clustering. Stat. Comput. 2007, 17, 395–416. [Google Scholar] [CrossRef]
- Bro, R.; Smilde, A.K. Principal component analysis. Anal. Methods 2014, 6, 2812–2831. [Google Scholar] [CrossRef]
- Maier, H.R.; Kapelan, Z.; Kasprzyk, J.; Kollat, J.; Matott, L.S.; Cunha, M.C.; Dandy, G.C.; Gibbs, M.S.; Keedwell, E.; Marchi, A.; et al. Evolutionary algorithms and other metaheuristics in water resources: Current status, research challenges and future directions. Environ. Model. Softw. 2014, 62, 271–299. [Google Scholar] [CrossRef]
- Aghabozorgi, S.; Seyed Shirkhorshidi, A.; Ying Wah, T. Time-series clustering—A decade review. Inf. Syst. 2015, 53, 16–38. [Google Scholar] [CrossRef]
- Rokach, L.; Maimon, O. Clustering Methods. Data Min. Knowl. Discov. Handb. 2006, 14, 321–352. [Google Scholar] [CrossRef]
- Hastie, T.; Tibshirani, R.; Friedman, J. The Elements of Statistical Learning: The Elements of Statistical LearningData Mining, Inference, and Prediction, 2nd ed.; Publisher: New York City, NY, USA, 2009; ISBN 978-0-387-84858-7. [Google Scholar]
- Pedregosa, F.; Varoquaux, G.; Gramfort, A.; Michel, V.; Thirion, B.; Grisel, O.; Blondel, M.; Prettenhofer, P.; Weiss, R.; Dubourg, V.; et al. Scikit-learn: Machine learning in Python. J. Mach. Learn. Res. 2011, 12, 2825–2830. [Google Scholar]
- Maulik, U.; Bandyopadhyay, S. Performance evaluation of some clustering algorithms and validity indices. IEEE Trans. Pattern Anal. Mach. Intell. 2002, 24, 1650–1654. [Google Scholar] [CrossRef]
- Al-Zoubi, M.B.; Al Rawi, M. An efficient approach for computing silhouette coefficients. J. Comput. Sci. 2008, 4, 252–255. [Google Scholar] [CrossRef]
- Aranganayagi, S.; Thangavel, K. Clustering categorical data using silhouette coefficient as a relocating measure. In Proceedings of the Proceedings—International Conference on Computational Intelligence and Multimedia Applications, Sivakasi, Tamil Nadu, India, 13–15 December 2007; Volume 2, pp. 13–17. [Google Scholar]
- Caliñski, T.; Harabasz, J. A Dendrite Method Foe Cluster Analysis. Commun. Stat. 1974, 3, 1–27. [Google Scholar] [CrossRef]
- Davies, D.L.; Bouldin, D.W. A Cluster Separation Measure. IEEE Trans. Pattern Anal. Mach. Intell. 1979, PAMI-1, 224–227. [Google Scholar] [CrossRef]
- Petrovic, S. A Comparison Between the Silhouette Index and the Davies-Bouldin Index in Labelling IDS Clusters. In Proceedings of the 11th Nordic Workshop of Secure IT Systems, Linköping, Sweden, 19–20 October 2006; pp. 53–64. [Google Scholar]
- Xiao, J.; Lu, J.; Li, X. Davies Bouldin Index based hierarchical initialization K-means. Intell. Data Anal. 2017, 21, 1327–1338. [Google Scholar] [CrossRef]
- Thorndike, R.L. Who belongs in the family? Psychometrika 1953, 18, 267–276. [Google Scholar] [CrossRef]
- Rossman, L.A. Storm Water Management Model User’s Manual Version 5.1; EPA/600/R-14/413b; Natl. Risk Manag. Lab. Off. Res. Dev. United States Environ. Prot. Agency: Cincinnati, OH, USA, 2015.
- Li, J.; Burian, S.; Oroza, C. Exploring the potential for simulating system-level controlled smart stormwater system. In Proceedings of the World Environmental and Water Resources Congress 2019: Water, Wastewater, and Stormwater; Urban Water Resources; and Municipal Water Infrastructure—Selected Papers from the World Environmental and Water Resources Congress, Pittsburgh, Pennsylvania, 19–23 May 2019; pp. 46–56. [Google Scholar]
- Kroll, S.; Weemaes, M.; Van Impe, J.; Willems, P. A methodology for the design of RTC strategies for combined sewer networks. Water (Switzerland) 2018, 10, 1675. [Google Scholar] [CrossRef]
- Rinaldo, A.; Rodriguez-Iturbe, I. Geomorphological theory of the hydrological response. Hydrol. Process. 1996, 10, 803–829. [Google Scholar] [CrossRef]
- Moazenzadeh, R.; Mohammadi, B.; Shamshirband, S.; Chau, K.W. Coupling a firefly algorithm with support vector regression to predict evaporation in northern iran. Eng. Appl. Comput. Fluid Mech. 2018, 12, 584–597. [Google Scholar] [CrossRef]
- Suzuki, R.; Shimodaira, H. Pvclust: An R package for assessing the uncertainty in hierarchical clustering. Bioinformatics 2006, 22, 1540–1542. [Google Scholar] [CrossRef] [PubMed]
- Sambito, M.; Di Cristo, C.; Freni, G.; Leopardi, A. Optimal water quality sensor positioning in urban drainage systems for illicit intrusion identification. J. Hydroinform. 2020, 22, 46–60. [Google Scholar] [CrossRef]
- Shende, S.; Chau, K.W. Design of water distribution systems using an intelligent simple benchmarking algorithm with respect to cost optimization and computational efficiency. Water Sci. Technol. Water Supply 2019, 19, 1892–1898. [Google Scholar] [CrossRef]
- Wu, Y.; Liu, S. Burst Detection by Analyzing Shape Similarity of Time Series Subsequences in District Metering Areas. J. Water Resour. Plan. Manag. 2020, 146, 04019068. [Google Scholar] [CrossRef]
- Mel, R.; Sterl, A.; Lionello, P. High resolution climate projection of storm surge at the Venetian coast. Nat. Hazards Earth Syst. Sci. 2013, 13, 1135–1142. [Google Scholar] [CrossRef]
- Flowerdew, J.; Horsburghb, K.; Wilson, C.; Mylne, K. Development and evaluation of an ensemble forecasting system for coastal storm surges. Q. J. R. Meteorol. Soc. 2010, 136, 1444–1456. [Google Scholar] [CrossRef]
- Chang, L.C.; Shen, H.Y.; Wang, Y.F.; Huang, J.Y.; Lin, Y.T. Clustering-based hybrid inundation model for forecasting flood inundation depths. J. Hydrol. 2010, 385, 257–268. [Google Scholar] [CrossRef]
- Guo, X.; Zhao, D.; Du, P.; Li, M. Automatic setting of urban drainage pipe monitoring points based on scenario simulation and fuzzy clustering. Urban Water J. 2018, 15, 700–712. [Google Scholar] [CrossRef]
- Mel, R.; Viero, D.P.; Carniello, L.; Defina, A.; D’Alpaos, L. Simplified methods for real-time prediction of storm surge uncertainty: The city of Venice case study. Adv. Water Resour. 2014, 71, 177–185. [Google Scholar] [CrossRef]
- Sitzenfrei, R.; Rauch, W. Optimizing small hydropower systems in water distribution systems based on long-time-series simulation and future scenarios. J. Water Resour. Plan. Manag. 2015, 141, 04015021. [Google Scholar] [CrossRef]
- Lionello, P.; Sanna, A.; Elvini, E.; Mufato, R. A data assimilation procedure for operational prediction of storm surge in the northern Adriatic Sea. Cont. Shelf Res. 2006. [Google Scholar] [CrossRef]
- Buizza, R.; Milleer, M.; Palmer, T.N. Stochastic representation of model uncertainties in the ECMWF ensemble prediction system. Q. J. R. Meteorol. Soc. 2007, 26, 539–553. [Google Scholar] [CrossRef]
- Panganiban, E.B.; Cruz, J.C.D. Rain water level information with flood warning system using flat clustering predictive technique. In Proceedings of the IEEE Region 10 Annual International Conference, Penang, Malaysia, 5–8 November 2017; Volume 2017, pp. 727–732. [Google Scholar]


| Models | Definition | Pros | Cons |
|---|---|---|---|
| K-means Clustering | A kind of vector quantization, partition data points into clusters by minimizing the intra-cluster distance. | (1) Fast, easy-to-understand, and wide applications; (2) Stable for time series data; (3) Simple and efficient optimization performance; (4) Suitable for huge datasets. | (1) Number of clusters; (2) Spherical assumption. |
| Agglomerative Clustering | A kind of hierarchical clustering for merging clusters according to a measure of data dissimilarity. | (1) Stable runs (2) Reasonable dendrogram cut-off nodes; (3) Clusters growth without globular assumption; (4) Good performance for time-series data; (5) No need to know the correct clusters’ number. | (1) Number of clusters; (2) Slow implementation; (3) Cluster with polluted noise. |
| Spectral Clustering | A kind of graph clustering based on the distances between points. | (1) Stable due to the data transformation; (2) No purely globular cluster assumption; (3) Easy to implement. | (1) Number of clusters; (2) Slow performance; (3) Cluster with polluted noise. |
© 2020 by the authors. Licensee MDPI, Basel, Switzerland. This article is an open access article distributed under the terms and conditions of the Creative Commons Attribution (CC BY) license (http://creativecommons.org/licenses/by/4.0/).
Share and Cite
Li, J.; Hassan, D.; Brewer, S.; Sitzenfrei, R. Is Clustering Time-Series Water Depth Useful? An Exploratory Study for Flooding Detection in Urban Drainage Systems. Water 2020, 12, 2433. https://doi.org/10.3390/w12092433
Li J, Hassan D, Brewer S, Sitzenfrei R. Is Clustering Time-Series Water Depth Useful? An Exploratory Study for Flooding Detection in Urban Drainage Systems. Water. 2020; 12(9):2433. https://doi.org/10.3390/w12092433
Chicago/Turabian StyleLi, Jiada, Daniyal Hassan, Simon Brewer, and Robert Sitzenfrei. 2020. "Is Clustering Time-Series Water Depth Useful? An Exploratory Study for Flooding Detection in Urban Drainage Systems" Water 12, no. 9: 2433. https://doi.org/10.3390/w12092433
APA StyleLi, J., Hassan, D., Brewer, S., & Sitzenfrei, R. (2020). Is Clustering Time-Series Water Depth Useful? An Exploratory Study for Flooding Detection in Urban Drainage Systems. Water, 12(9), 2433. https://doi.org/10.3390/w12092433