Article

Isotope Composition of Precipitation, Groundwater, and Surface and Lake Waters from the Plitvice Lakes, Croatia

1
Laboratory for Low-level Radioactivities, Division of Experimental Physics, Ruđer Bošković Institute, 10000 Zagreb, Croatia
2
Faculty of Mining, Geology and Petroleum Engineering, University of Zagreb, 10000 Zagreb, Croatia
*
Author to whom correspondence should be addressed.
Water 2020, 12(9), 2414; https://doi.org/10.3390/w12092414
Submission received: 5 August 2020 / Revised: 21 August 2020 / Accepted: 25 August 2020 / Published: 28 August 2020
(This article belongs to the Special Issue Application of Stable Isotopes and Tritium in Hydrology)

Abstract

:
The application of tritium, 2H, and 18O in the characterization of the precipitation, groundwater, and surface and lake water of the Plitvice Lakes (PL), Croatia, over the 1979–2019 period is presented. An increase in the mean annual air temperature of 0.06 °C/year and in the annual precipitation amount of 10 mm/year is observed. The good correlation of the tritium activity concentration in the PL and Zagreb precipitation implies that the tritium data for Zagreb are applicable for the study of the PL area. The best local meteoric water line at PL was obtained by the reduced major axis regression (RMA) and precipitation-weighted ordinary least squares regression (PWLSR) approaches: δ2HPWLSR = (7.97 ± 0.12) δ18O + (13.8 ± 1.3). The higher deuterium excess at PL (14.0 ± 2.2 ‰) than that at Zagreb reflects the higher altitude and influence of the Mediterranean precipitation. The δ2H in precipitation ranges from −132.4‰ to −22.3‰ and δ18O from −18.3 ‰ to −4.1‰. The much narrower ranges in the groundwater (<1‰ in δ18O, <10‰ in δ2H) indicate the good mixing of waters in aquifers and short mean residence times. The higher average δ2H in all three karst springs observed after 2003 can be attributed to the increase in the mean air temperature. The mean δ2H and δ18O values in the surface and lake water increase downstream due to the evaporation of surface waters. There is no significant difference between the surface water line and the lake water line (2011–2014). The stable isotope composition of the surface and lake waters reacts to extreme hydrological conditions.

1. Introduction

Karst is a special type of landscape that is formed by the process of karstification—i.e., the dissolution of soluble carbonate rocks, mostly limestone and dolomite. Karst channels, conduits, and fissures store relatively large quantities of groundwater, and such karst aquifers are capable of providing large supplies of water for human consumption. The precipitation water quickly infiltrates underground, creating a system of interconnected flow paths, and eventually re-appears at the surface as springs. Karst aquifers, especially in areas with a high permeability, can be very vulnerable to contamination and can enable the fast transport of contaminants through the aquifers, which can result in the degradation of water quality [1,2,3,4]. The assessment of the impact of human activities and recent climate changes on karst waters has to be properly considered [5]. A good understanding of the characteristics of karst aquifers, especially the origin of karst spring water, is essential for their efficient protection.
The most prominent methods for the research of the origin of spring water (groundwater) are isotopic methods, especially the application of 2H, 18O, and 3H isotopes that constitute water molecules. They behave as conservative ideal tracers, with a broad application in hydrogeology [5,6,7,8,9,10,11,12,13,14,15,16,17,18]. Precipitation presents an input to groundwater, and therefore knowledge of the isotope composition of precipitation is a prerequisite for groundwater studies [19]. The importance of water isotopes as perfect tracers was recognized by the World Meteorological Organization (WMO) and the International Atomic Energy Agency (IAEA), which established a worldwide network for the monitoring of water isotopes—the Global Network of Isotopes in Precipitation (GNIP) [20,21,22]. GNIP contains data from Zagreb, as a permanent GNIP station, and from some other locations where the isotope composition of precipitation was monitored in different projects, including the Plitvice Lakes station [23] and references therein. Some differences in the isotopic composition of precipitation in the continental and maritime stations were discussed [19], and the long-term data for the station in Zagreb showed the influence of climate change on the isotope composition [23].
Croatia is a southeastern European country situated between the eastern Adriatic coast and the Pannonian Plain (Figure 1). Dinaric karst covers almost half of the Croatian territory [24,25], including the islands and the Adriatic coast, the high mountain regions, and part of central Croatia. Dinaric karst, known worldwide as the locus typicus of classical karst, is a part of the Dinarides system and consists of very porous and permeable rocks, with many permanent and intermittent springs and a developed underground drainage system [26,27]. Croatia is rich with clean drinking water, and in many cases this water is groundwater originated from the karst springs [11,12,14,28].
The Plitvice Lakes (PL) area presents a unique system of 16 cascade flow-through lakes that are fed by three main springs (Crna Rijeka River, Bijela Rijeka River, Plitvica River) and outflow to the Korana River. It is famous worldwide for its beauty and diversity. The area has been protected as a part of the national park since 1949, and since 1979 it has been included in the United Nations Educational, Scientific, and Cultural Organisation (UNESCO) World Heritage List. The area is one of the most studied karst areas in Croatia, where various scientific studies have been performed since the beginning of 20th century. During the 1970s, a group from the Ruđer Bošković Institute joined the scientific community with the application of isotope methods. A comprehensive overview of the investigation conducted at the Plitvice Lakes is given in [29]. An overview of the isotope investigations in both the karst and alluvial aquifers in Croatia [30] at approximately 100 sites in period 1997–2014 presents an important contribution to regional knowledge of groundwater hydrology. However, the study did not include the area of the Plitvice Lakes.
The main aim of the investigation of the group from the Ruđer Bošković Institute was the study of secondary carbonate precipitation in the form of tufa and lake sediment (e.g., [7,31,32]), which made the Plitvice Lakes a unique natural phenomenon. The analysis of more than 30 years of records of various physico-chemical parameters presented geochemical conditions for tufa precipitation in relation to climate change [33]. Isotope methods were applied also to studies of springs and surface and lake waters of the area [7,8,34,35]. Precipitation was also occasionally studied [36,37]. Both the isotope and physico-chemical data at springs showed constant values in different seasons, implying that the water was of atmospheric (meteoric) origin, of both winter and summer precipitation, and that the recharge water was well mixed with the existing water in aquifers [7]. The short mean residence time (MRT) of the water was determined based on the tritium activity concentration [7,8,35] and by the stable isotopes and additional tracers (helium and neon, chlorofluorocarbons (CFCs), and sulfur hexafluoride) [10].
Plitvice Lakes, although protected from direct anthropogenic influence, cannot be protected from global changes such as climate change. Thus, the consideration of the lakes’ hydrology is of most importance for the system, especially in dry summer periods [38,39,40]. Water warming was observed in the surface water and springs of the Crna Rijeka and Bijela Rijeka Rivers [33]. The warming of the waters did not endanger the tufa precipitation process, since the increase in temperature favors both the physico-chemical and biological factors of authigenic calcite precipitation. However, an increase in temperature contributes to the loss of water from the lakes through evaporation [10,38,40].
The aim of this paper is to present various isotope studies of different types of water bodies (precipitation, groundwater, surface lake and river water, lake water from traps at certain depths) from the early period of isotope applications (since 1979) to the most recent one (2018) at the Plitvice Lakes National Park, as an area of unique geomorphological karst formation. Although the Plitvice Lakes are of great scientific interest worldwide, an overview of the isotopic studies of its water bodies has never been presented so far.
The results will be compared to the long-term isotope-in-precipitation data at Zagreb [23], as well as to regional precipitation and groundwater data [30]. The aim of the paper is to evaluate the most important hydrological inputs to the Plitvice Lakes, detect the possible influence of climate change on karst groundwater, and eventually show what conclusions could be drawn after a long-term and rather comprehensive study of a certain area by isotopic techniques.

2. Materials and Methods

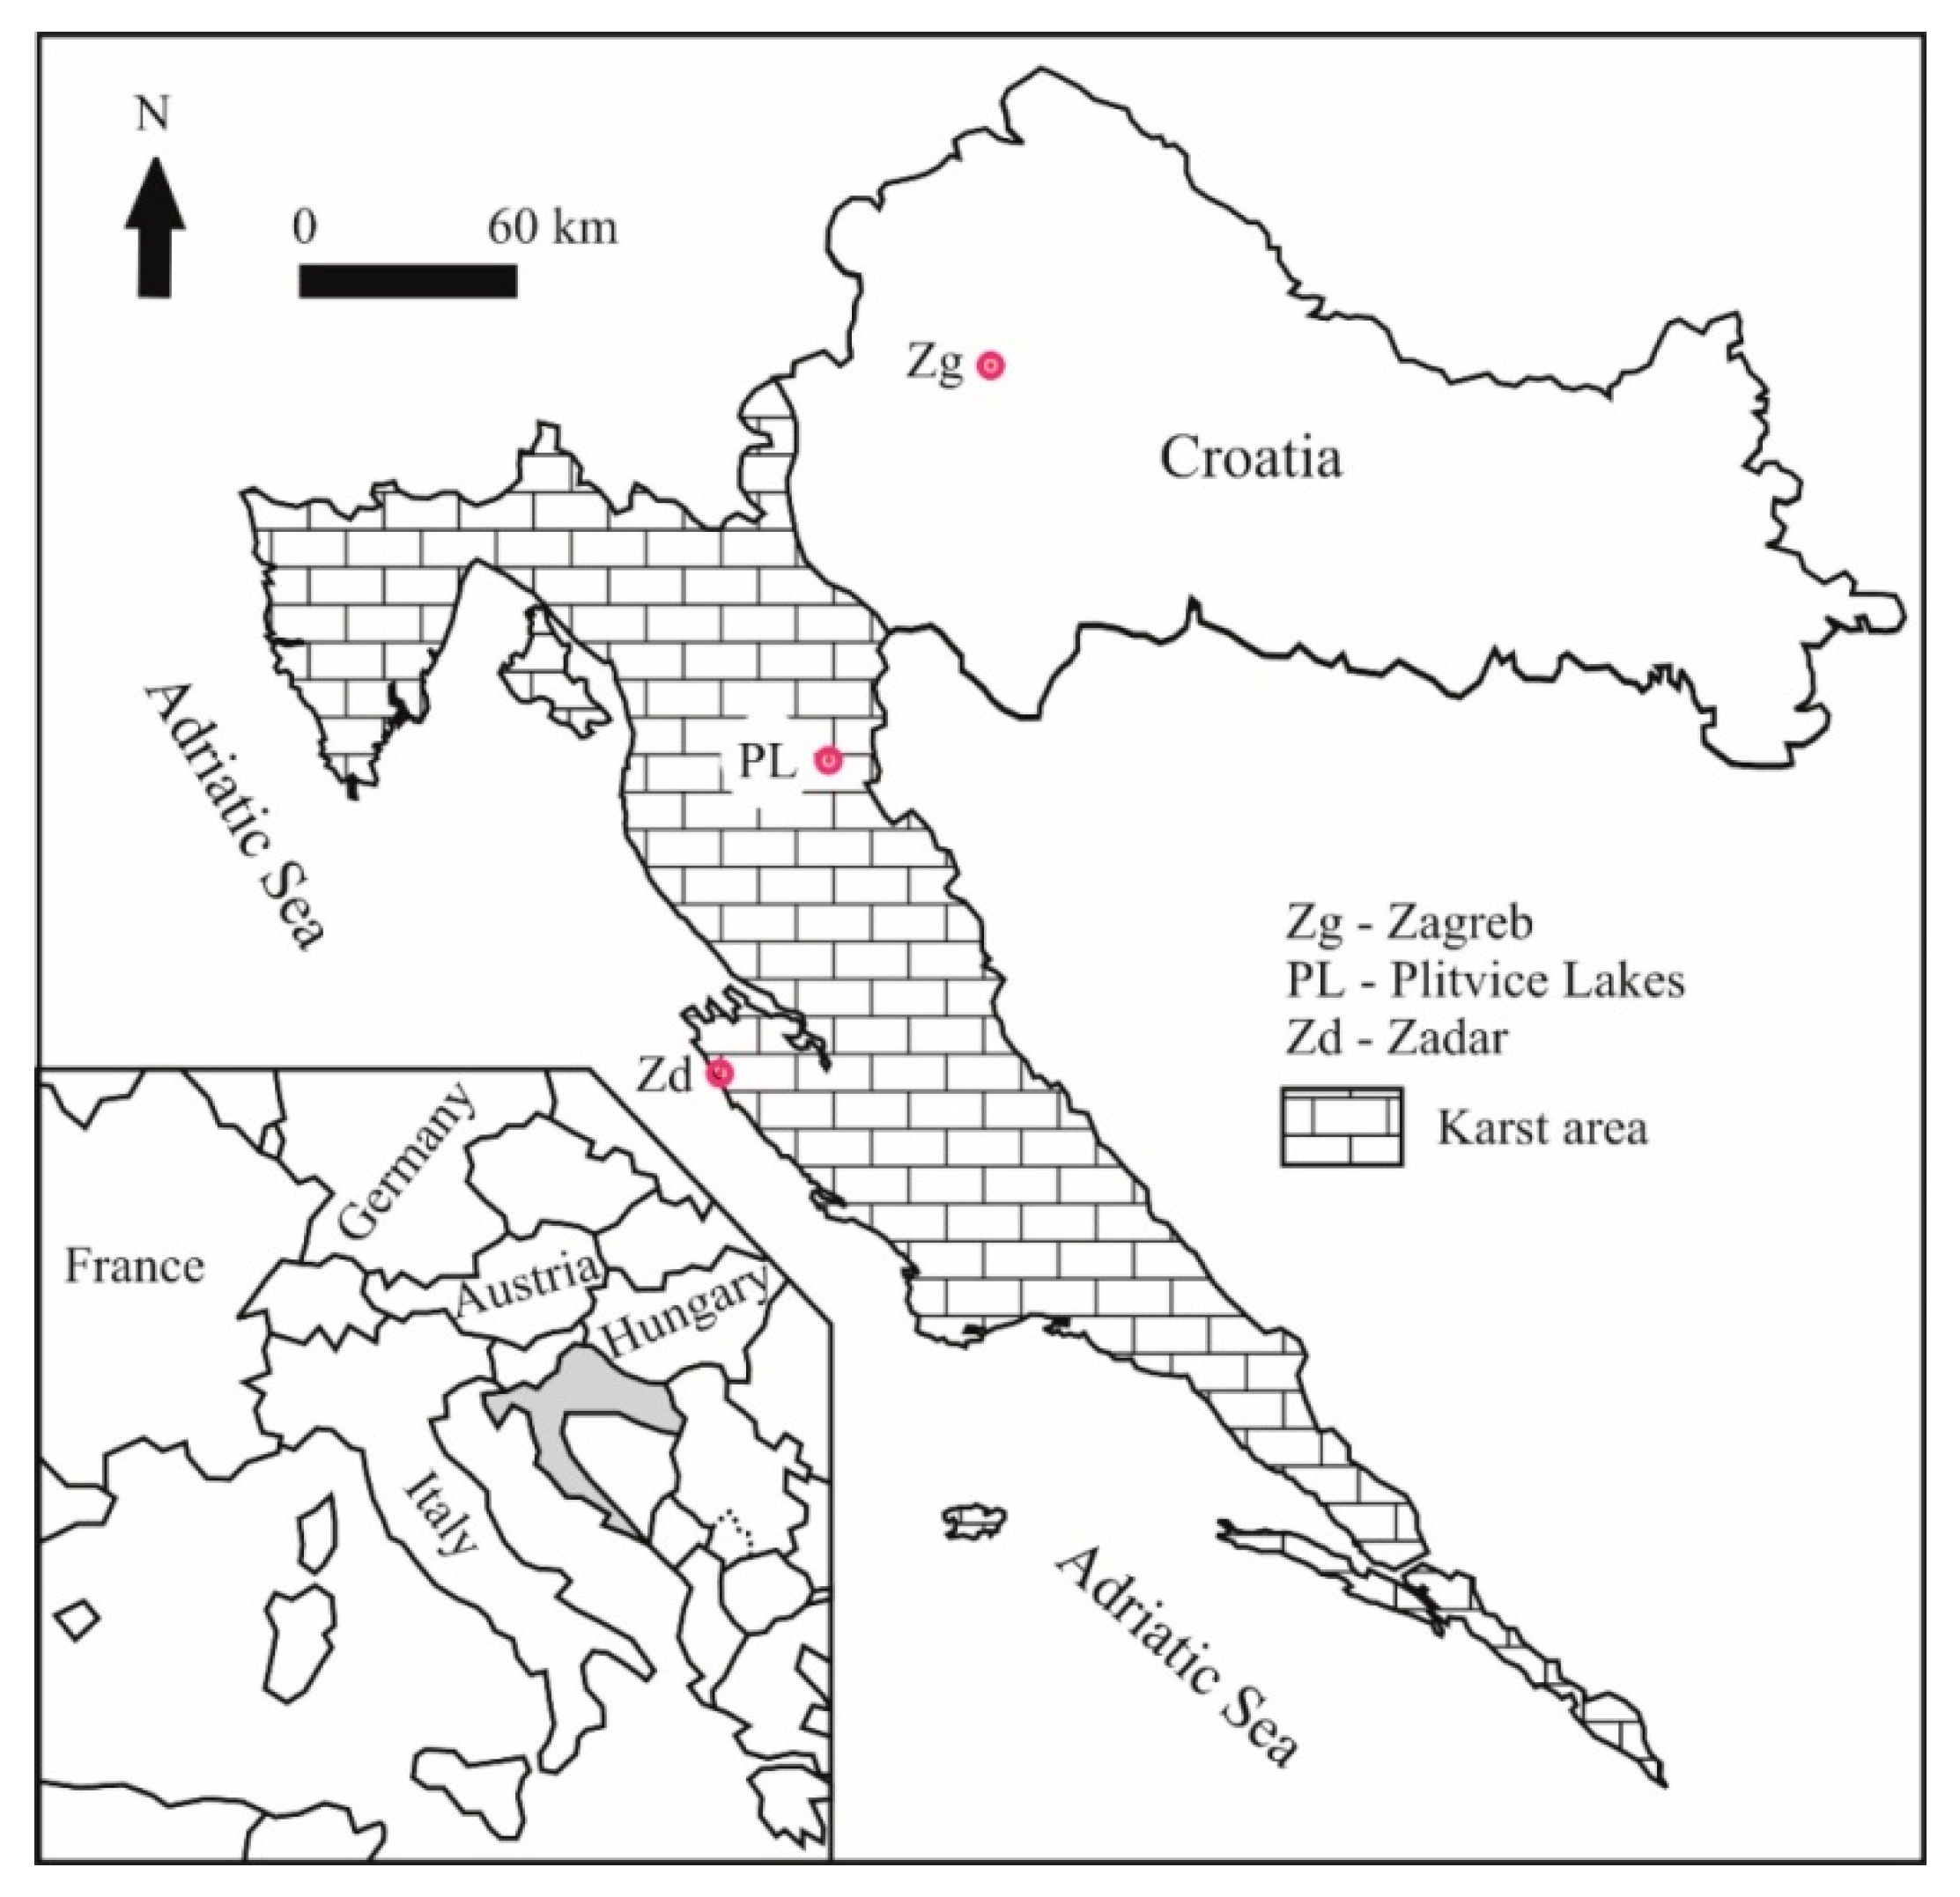
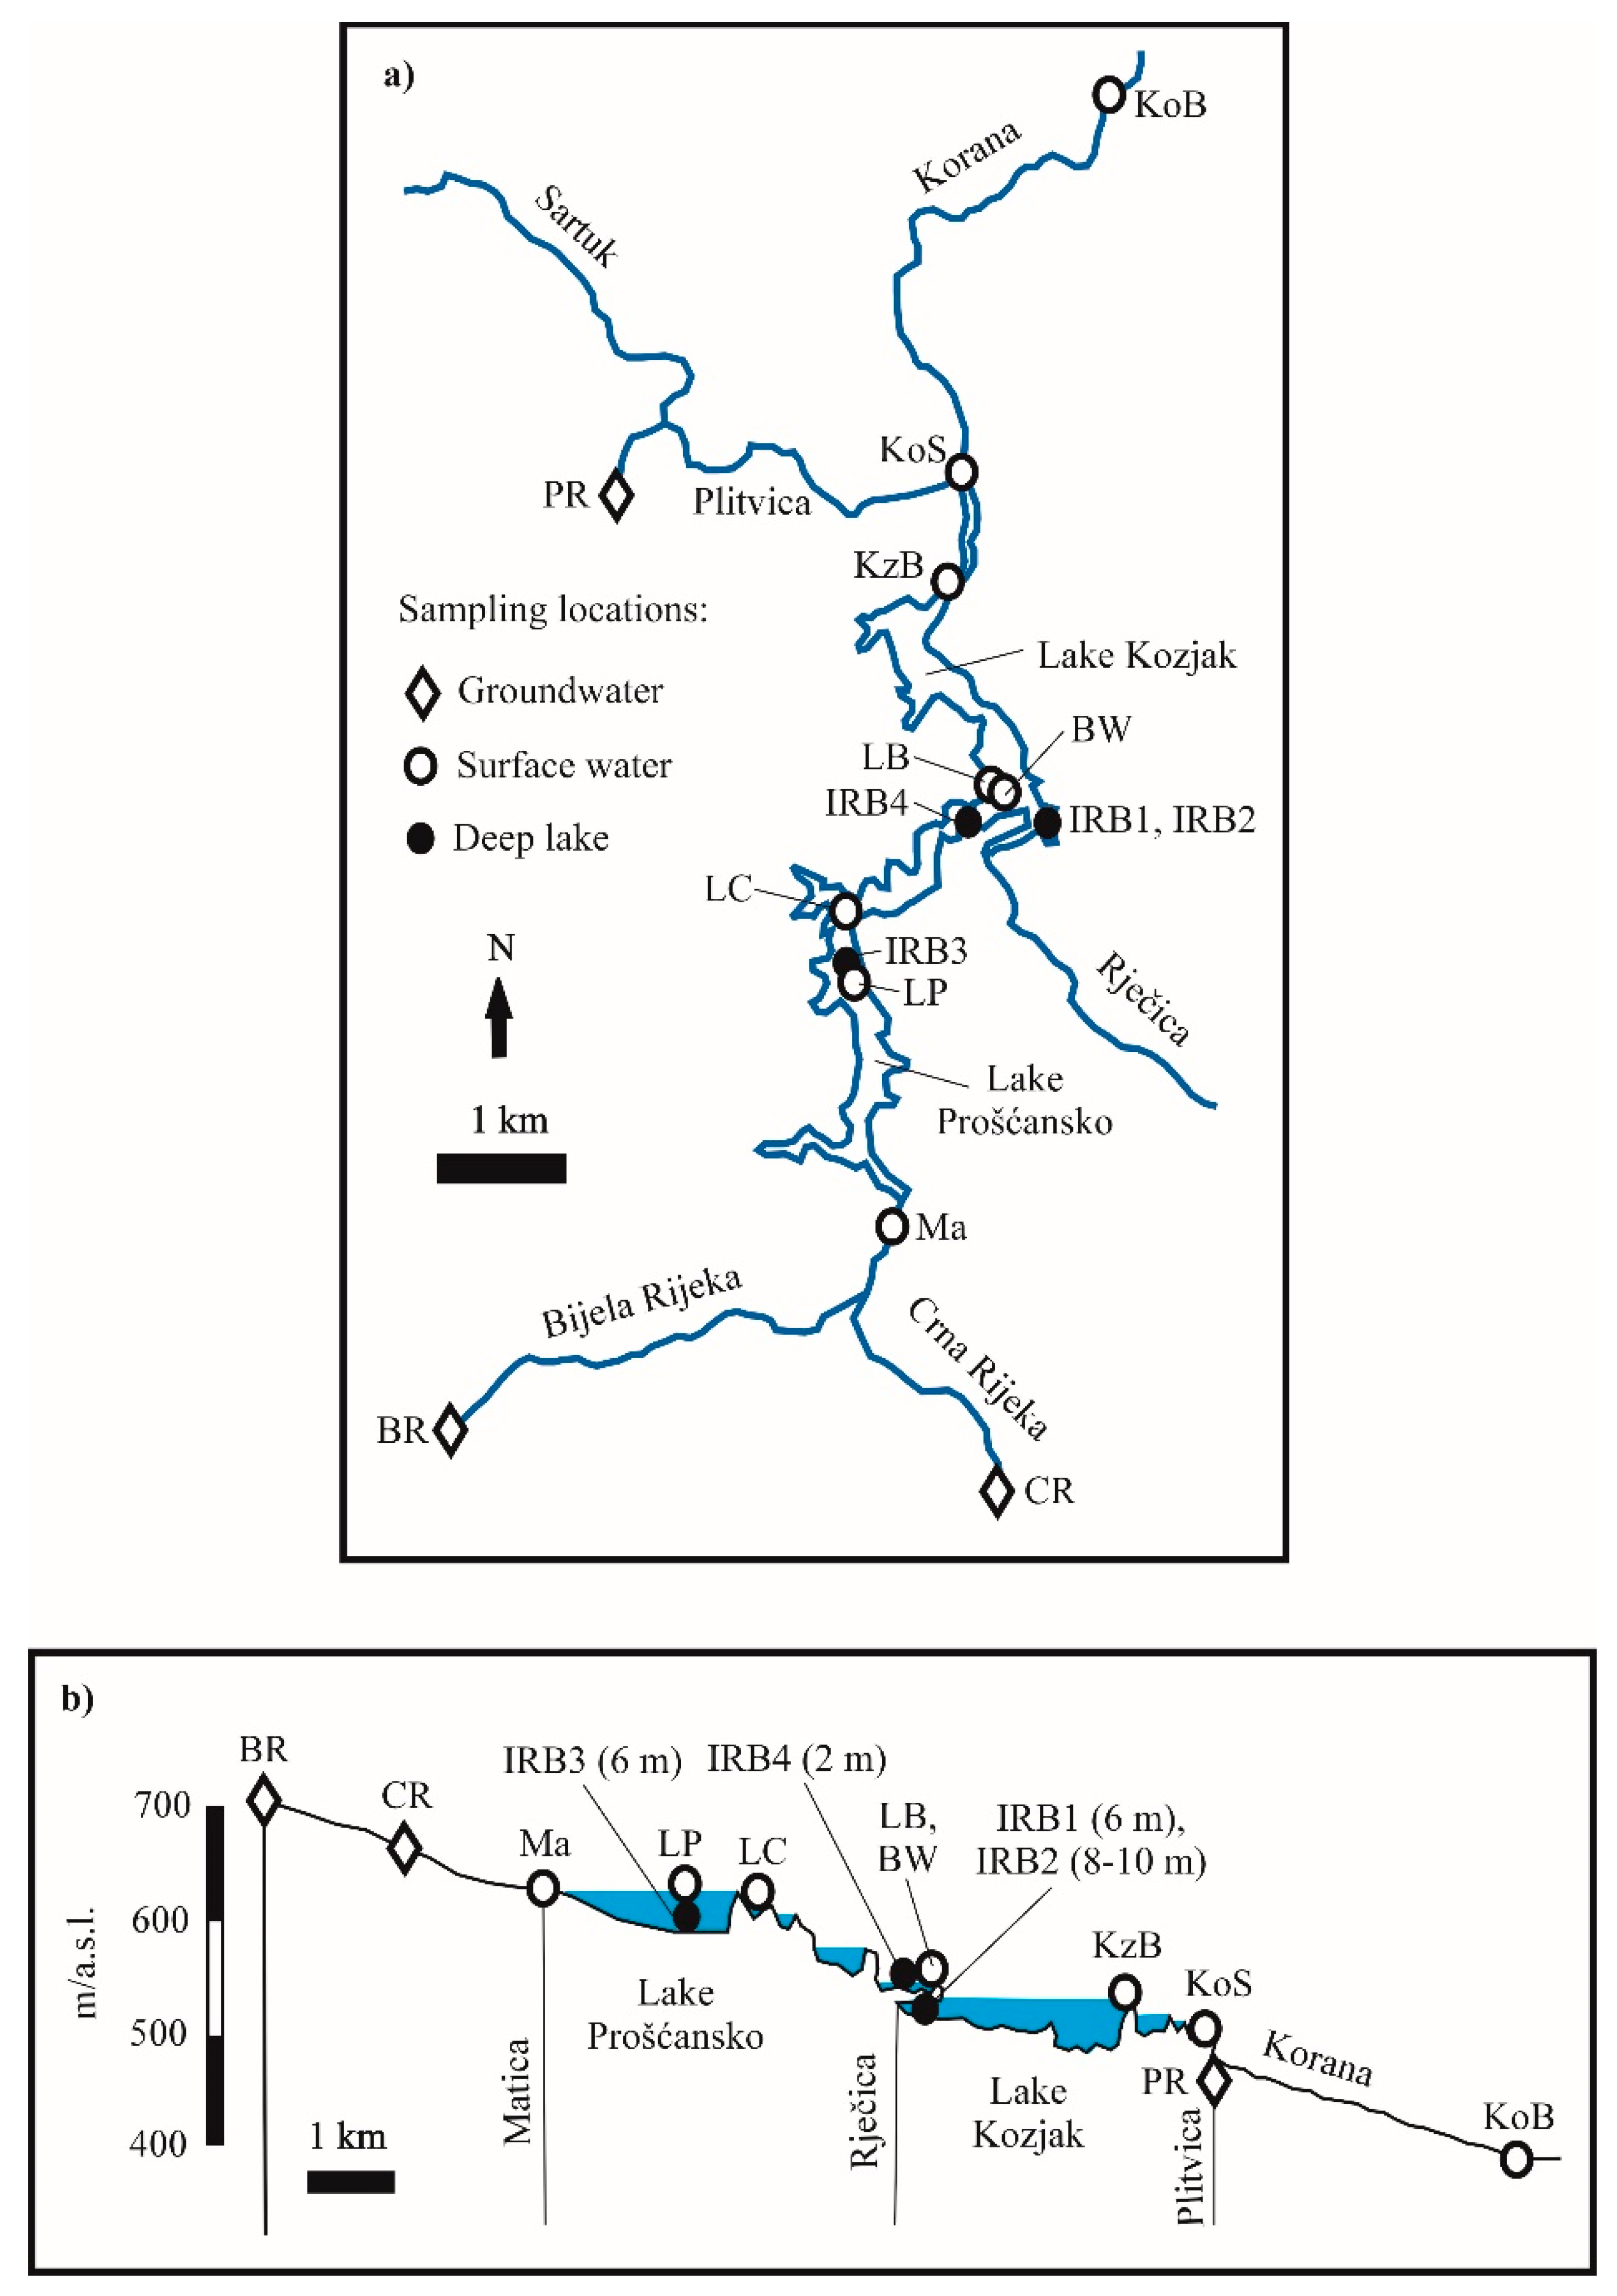
2.1. Site Description

The Plitvice Lakes area is located in a continental, mountainous part of west Croatia (Figure 1). The Plitvice Lakes are a system of 16 lakes developed on carbonate rocks [41] separated by tufa barriers and interconnected by waterfalls (Figure 2). Geologically, they belong to the External Dinarides or Dinaric-coastal area, with characteristic carbonate sediments and karstic features. The altitude difference of the system from the springs to the Korana River is about 300 m (Figure 2b). However, the recharge area extends to higher mountains (the highest altitude of the national park is 1279 m a.s.l.), and the average recharge altitude is about 900 m a.s.l. [38].
Zagreb is also situated in a continental part of Croatia (to the north) (Figure 1). It belongs to the Pannonian area characterized by its milder relief; predominantly magmatic, clastic, and metamorphic rocks; and well-developed stream grid [42]. Zadar is located at the Adriatic Sea coast (southern Croatia) (Figure 1), which belongs to the Dinaric coastal area.
The three selected locations of precipitation sampling differ in the altitude of the meteorological stations; Plitvice Lakes station is situated at 550 m a.s.l., Zagreb-Grič station at 165 m a.s.l., and Zadar at 5 m a.s.l. [19,23]. Climatologically, Zagreb and Plitvice Lakes belong to the Cfb climate class, characterized by a temperate climate without a dry season and with a warm summer, while Zadar belongs to the Cfa climate class, characterized by a temperate climate without a dry season but with a hot summer [43,44]. The annual precipitation amounts in Zagreb (measured at the Zagreb-Grič meteorological station) and Zadar are almost identical: 883 mm and 915 mm for the 1961–1990 period, and 884 mm and 882 mm for the 1991–2004 period, respectively [19]. The annual precipitation amount is significantly higher at the Plitvice Lakes, where it ranges between 1148 and 2113 mm in the 1986–2019 period [45]. The monthly precipitation at the Plitvice Lakes is distributed relatively uniformly throughout the year, with slight maxima observed in spring and autumn and minimum values in summer months. The annual temperatures range from 8.0 to 10.8 °C (1986–2019), with an average value of 9.2 ± 0.5 °C. January is the coldest month (0 ± 2.3 °C on average) and July is the warmest month (18.4 ± 1.1 °C) [45]. Snow falls between November and March; however, reduced snowfall is observed in recent times compared to the older data [33,45].
The water temperature at the springs is very stable throughout the year. Nevertheless, an increase in the spring temperatures is observed between the 1981–1986 and 2010–2014 periods in both Crna Rijeka spring (from 7.80 ± 0.15 °C to 8.04 ± 0.14 °C) and the Bijela Rijeka spring (from 7.46 ± 0.17 °C to 8.14 ± 0.53 °C) [33]. The temperature of the surface water downstream ranges from near zero in winter to 23 °C in summer, being on the average about 12 °C [33,46]. The lakes can be frozen in the winter months.

2.2. Sampling

The monthly precipitation was collected between 1978 and 1984 [36] (not continuously) and from 2003 to 2006 [11,37] at the meteorological station at the Plitvice Lakes (altitude 550 m, International Atomic Energy Agency (IAEA) and World Meteorological Organization (WMO) station code 1432501) [23].
Groundwater samples were collected at the three main karst springs of the system: Crna Rijeka River and Bijela Rijeka River (in the south), and the Plitvica River that joins the lake water after the Great waterfall before the location of Korana River—Sastavci (Figure 2, Table 1).
Surface water was collected as grab samples at 8 locations along the water course for the length of ~10 km from Matica (the main stream feeding the lakes) to the Korana River (the outflow from the lake system) (Figure 2, Table 1). Lake water was collected at 4 sediment traps in different lakes: IRB1 and IRB2 in Lake Kozjak at water depths of 6 m and 8–10 m, respectively; IRB3 in Lake Prošćansko at 6 m; and IRB4 in Lake Gradinsko at 2 m water depths (note: the water from sediment traps will be called “lake water” in the further text). At the same time, the surface water was collected at nearby locations.
All the sampling locations are listed in Table 1, with the location code and the type of water body sampled. The amount of tritium activity concentration data, stable isotope data, and period of sampling is given in Table S1.

2.3. Meteorological and Hydrological Data

The meteorological data consisted of the monthly precipitation amount (P) and the average monthly air temperature (T). The data were obtained on request from the Croatian Meteorological and Hydrological Service (CMHS) [45]. The meteorological records for the Plitvice Lakes, Croatia, exist for three distinctive periods: 1986–1990, 1996–2011, and 2015–2019. The data are not complete for all years, and in further analyses only the years with all 12 months of data will be used. The minimal and maximal monthly values within a year were identified, and the mean annual temperature and total annual precipitation amount were determined. CMHS [45] also provided data on the flow rates measured at different points in the Plitvice Lakes area for the period since 1982, except for the 1991–2001 period.

2.4. Measurement

Details on the measurement techniques and their changes were described in [23], and here we give only a short overview. The stable isotope composition of water samples for the period up to 2003 was measured on a Varian MAT 250 dual inlet isotope ratio mass spectrometer (IRMS) at the Jožef Stefan Institute in Ljubljana [23,47]. The measurement precision of duplicates was better than ± 0.1‰ for δ18O and ± 1‰ for δ2H. The δ2H and δ18O in the surface and lake water samples in the period 2012–2014 were measured at the JOANNEUM, Graz, Austria. The oxygen isotopic composition was determined on a dual-inlet Finnigan DELTAplus by means of the fully automated equilibration technique, and the isotopic composition of hydrogen was determined on a continuous flow Finnigan DELTAplus XP mass spectrometer with a HEKAtech high-temperature oven by the reduction of water over hot chromium [48]. All the measurements were carried out together with laboratory standards that were calibrated periodically against international standards, as recommended by the IAEA. The measurement precision was better than ± 0.1‰ for δ18O and ± 1‰ for δ2H [47]. The stable isotope composition of recent samples was determined at the Laboratory for Spectroscopy of the Faculty of Mining, Geology, and Petroleum Engineering, University of Zagreb, with a Liquid Water Isotope Analyzer (LWIA-45-EP, Los Gatos Research), and the official LGR working standards were used. The data were analyzed by the Laboratory Information Management System (LIMS) [49].
The tritium activity concentration (A) in all the samples was determined at the Ruđer Bošković Institute in Zagreb, except for some data for the 2003–2006 period [10]. The results are expressed in tritium units (1 TU = 0.118 Bq l−1) [20,22], which represent one 3H atom in 1018 atoms of hydrogen. The gas proportional counting technique (GPC) was used up to 2009 [34,50]. The detection limit was 2.5 TU, and the measurement uncertainty was between 2 and 5 TU, depending on the activity concentration. Since 2008, the technique of the electrolytical enrichment of samples (LSC-EE) and measurement by an ultra-low-level liquid scintillation counter Quantulus 1220 was used [51]. The detection limit obtained by the LSC-EE technique was 0.5 TU, and the measurement uncertainty was between 0.5 and 3 TU [51].

2.5. Data Analysis

The results of the stable isotope analyses are reported as δ-values—i.e., the relative difference in isotope ratios of the sample and the standard [52]:
δ S / R = R Sample R Reference 1 ,
where RSample and RReference stand for the isotope ratio (R = 2H/1H and R = 18O/16O) in the sample and the reference material (standard), respectively. The δ-values are dimensionless and small, and therefore they are expressed in per mill (‰) [21,52,53,54]. The international standard VSMOW (the Vienna Standard Mean Ocean Water) is used [23,54,55]. The δ2H and δ18O isotopic compositions of meteoric waters (precipitation and atmospheric water vapor) are strongly correlated, and the relation in Equation (2) is referred to as the global meteoric water line (GMWL) [53,55,56,57].
δ2H = 8.0∙δ18O + 10
The GMWL describes the general relation between δ2H and δ18O on a global scale reasonably well. However, for applications in hydrogeological studies, regional local meteoric water lines (LMWLs), either long-term or for certain shorter periods, can be more appropriate [23,58,59]. Generally, a LMWL has the form δ2H = a δ18O + b, where a is the slope and b is the intercept. LMWLs can differ from the GMWL in terms of both the slope and intercept values, depending on the conditions for forming a local water source [21,58,59,60].
The deuterium excess (d-excess, or d) was calculated from the paired monthly data according to Equation (3) [56]:
d = δ2H − 8 δ18O.
This can be related to the meteorological conditions in the source region from which the water vapor is obtained [20,21,58,59,60]. Autumn and winter precipitation originating from the Mediterranean Sea is characterized by distinctly higher d-excess values (d > 18‰) than precipitation coming from the Atlantic (d ~ 10‰), reflecting the specific source conditions during water vapor formation [19,59,60].
Correlations between various data points were obtained as ordinary least squares regressions using standard commercial software. Pearson’s coefficient r is given, as are the number of data pairs n and the p-values describing the statistical significance of the correlations. The data taken from the literature usually have the adjacent R2 value reported.
In the special case of calculating the a- and b-values of LMWLs, different methods were applied: ordinary least squares regression (OLSR), reduced major axis regression (RMA), and major axis least squares regression (MA, or the orthogonal regression) [61,62]. We calculated precipitation-weighted regressions (PWLSR, PWRMA, and PWMA) [61,62,63], which took into account the precipitation amount in a particular month. The local meteoric water lines are defined as LMWLOLSR, LMWLRMA, LMWLMA, LMWLPWLSR, LMWLPWRMA, and LMWLPWMA. For calculating the regressions from data sets of at least 36 continuous monthly records, we used the Local Meteoric Water Line Freeware [64]. The software also calculated an average of the root mean square sum of squared errors (rmSSEav), which is a relative error that allows for a comparison of different methods; the closer the value of rmSSEav is to 1.0, the better the regression method is for that set of data [61].

3. Results and Discussion

In this section, we present an analysis of the climatological parameters (temperature T and precipitation amount P) in the area of the Plitvice Lakes, followed by the isotope composition (tritium activity concentration, δ2H and δ18O values) of precipitation, groundwater, and finally the surface and lake waters.

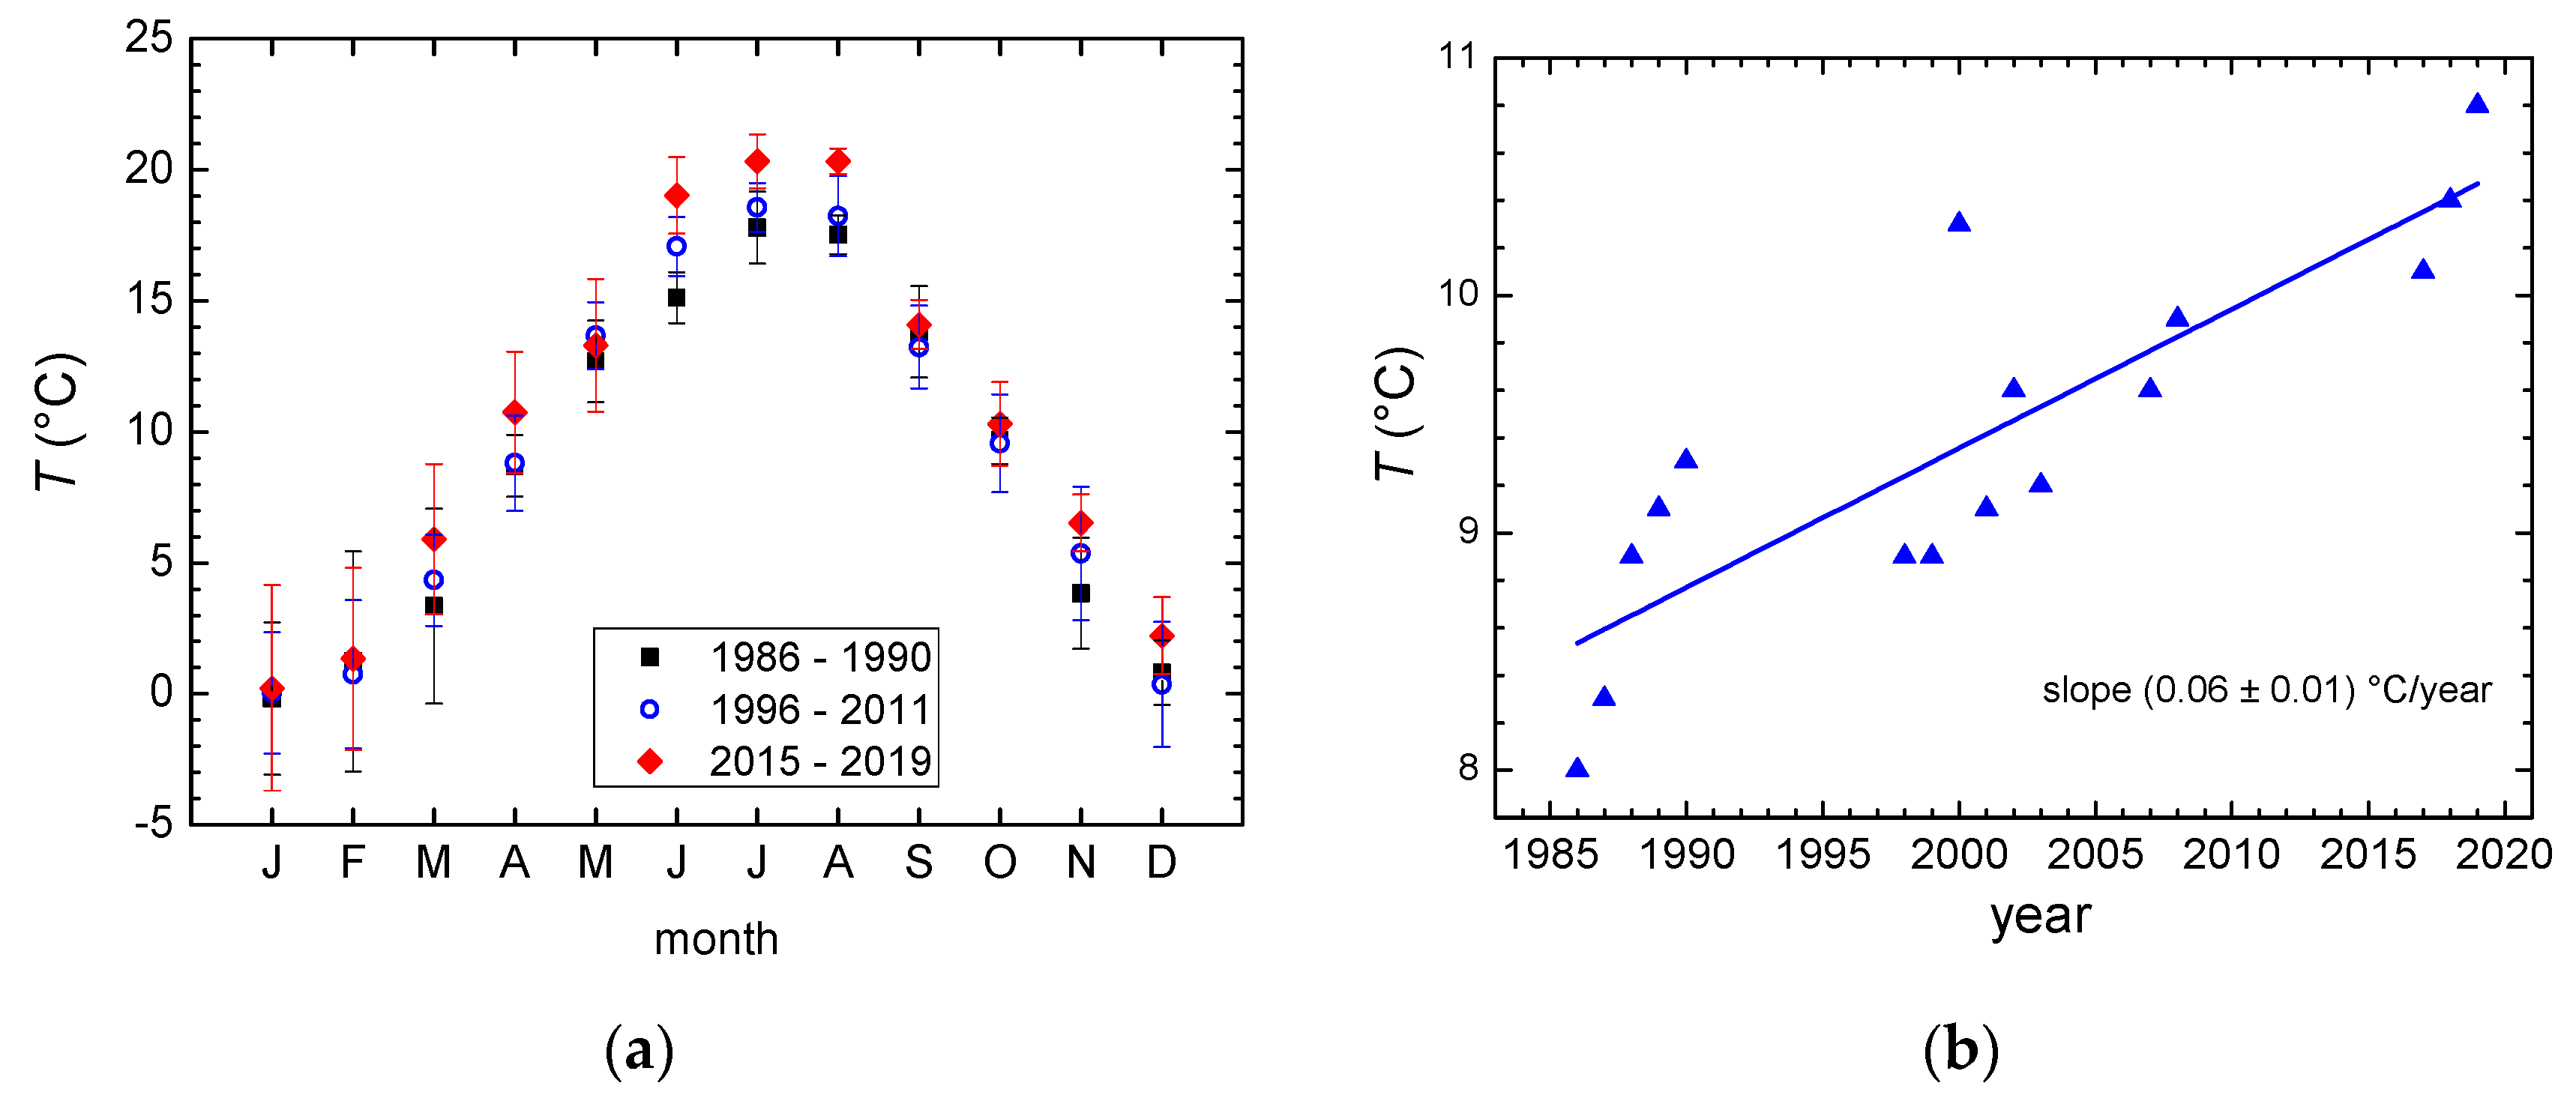
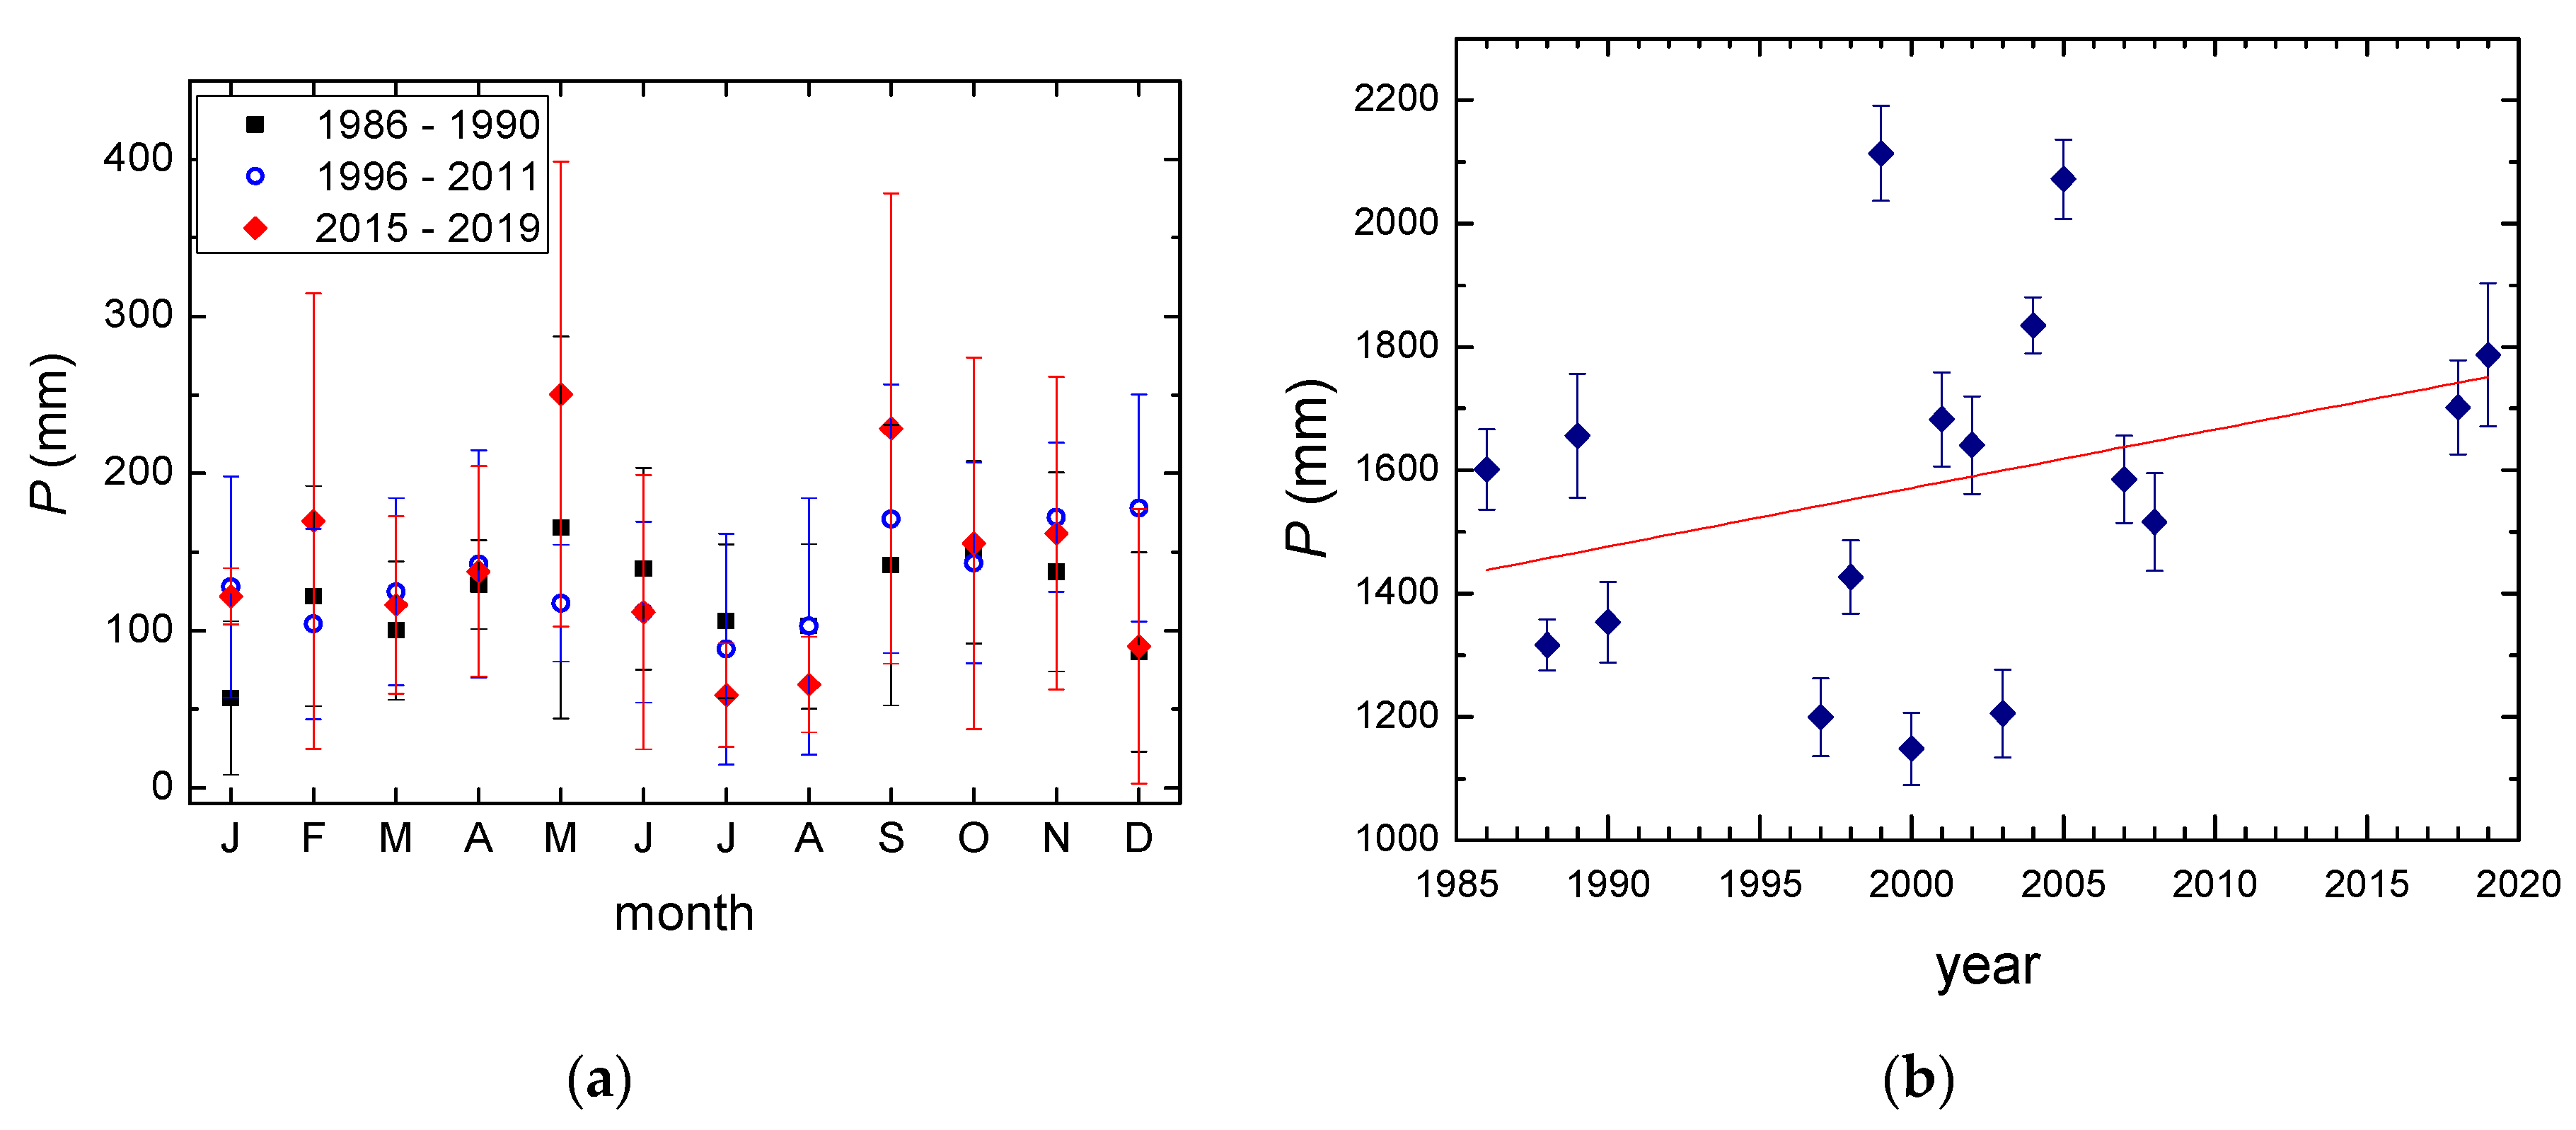
3.1. Temperature and Precipitation Amount

The monthly mean temperatures in three periods when data are available—1986–1990, 1996–2011, and 2015–2019—show an increase in temperature in all months (Figure 3a). The increase is statistically significant at 5% (p < 0.05) in June, July, August, and November, and at 10% (p < 0.10) in April. When the mean annual temperatures in the 1986–2019 period are compared (Figure 3b) (only years with data for all 12 months), an increase with the slope of 0.06 ± 0.01 °C per year is observed, and n = 16, r = 0.85, p < 0.05. The mean annual temperature at the Zagreb-Grič station in the 1976–2018 period showed a significant increase, with a slope of 0.071 ± 0.008 °C per year (r = 0.82, p < 0.05) and a faster increase in the maximal annual temperatures (0.09 ± 0.02 °C per year, r = 0.69) [23], which is in accordance with the observation at the Plitvice Lakes, although the set of meteorological data at the Plitvice Lakes is not complete. The mean temperatures in the three periods with available data (Table 2) show a constant increase.
The annual increases in temperature at both the Zagreb and PL stations can be compared with the global temperature increase and the temperature increase in the city of Ljubljana in Slovenia. Ljubljana shows a distinctive air warming trend, particularly in the period 1979–2008, of 0.06 °C per year [65]. Although this period does not include the hottest years on record globally (2014–2018), with 2016 being the hottest year [66], the value of the increase is consistent with the values obtained for Zagreb [23] and the Plitvice Lakes. Moreover, all the data are higher than the globally observed temperature change of 0.018 °C per year in the 1980–2020 period [67]. A recent study [68] indicated that the cities in East Europe, including Ljubljana, will experience air warming at a higher extent than is observed globally.
The monthly mean precipitation amounts show no significant seasonal variations (Figure 4a), although a slight minimum is observed in the summer months, and slightly higher values in spring and autumn. Higher fluctuations within a month are observed in the most recent period (2015–2019) compared to the older ones (Figure 4a). The annual precipitation amounts increase with a slope of 10 ± 7 mm per year, r = 0.31 (Figure 4b, Table 2). A wider range in the monthly and annual precipitation amount values has been observed (Figure 4b, Table 2), as observed also in the data for Zagreb [23]. The long-term (1976–2018) annual precipitation amount at Zagreb showed a slight, statistically not significant, increase of 1.4 ± 1.7 mm per year. However, the most prominent characteristics of the data were the higher deviations of the annual values in the period after 2000 from the mean value for the whole period [23].

3.2. Isotope Composition of Precipitation

The record of the tritium activity concentration (A) in the precipitation for Plitvice Lakes (Table S2) is not as complete as the one for Zagreb precipitation [23] (Figure 5). The most complete data for Plitvice Lakes are recorded from mid-1980 to mid-1982, and later from mid-2003 to mid-2006. Both records exhibited a seasonal pattern typical of the continental stations of the Northern Hemisphere; the maximal monthly 3H activity concentrations were observed between May and July, mostly in June, and the lowest 3H activity concentrations were observed in winter. Seasonal variations were superposed on the basic decreasing trend of the mean annual values. The data for Zagreb show that, after 1996, there is no significant decrease in the A values of precipitation. The mean value of A in the precipitation at Zagreb for the 1995–2018 period was 8.5 ± 1.2 TU [23], and in the 2003–2006 period it was 7.7 + 1.8 TU, while that for the precipitation at Plitvice Lakes in the 2003–2006 period was 7.4 ± 4.5 TU, with the highest value of 18.8 TU in July 2006 and winter values close to the detection limit of the GPC method.
It is obvious (Figure 5) that the tritium activity concentration in the precipitation at Plitvice Lakes follows the trend of the precipitation in Zagreb. The linear correlation between the two sets revealed a line with a slope of (1.02 ± 0.04), n = 62, r = 0.96, and the paired t-test showed that at the 0.05 level, the two sets of data are not significantly different.
The δ2H values in the Plitvice Lakes precipitation range from −132.4‰ (February 2005, monthly temperature −4.1 °C) to −22.3‰ in August 2003 (monthly temperature 21.7 °C) (Table S2, Figure 6). The extreme δ18O values, −18.3% and −4.1‰, were observed in the same months. The mean δ2H and δ18O values in the period from July 2003 to September 2006 are −65.3‰ and −9.9‰, respectively. However, if the 3-year cycle is taken into account (July 2003–June 2006) the corresponding values are −67.5‰ and −10.2‰, respectively. These values can now be compared to the Zagreb values in the same period 2003–2006, which are −59.7‰ and −8.3‰ for δ2H and δ18O, respectively, resulting in difference of 1.9‰ in δ18O between Zagreb and the Plitvice Lakes. Differences in the mean annual temperatures at Zagreb (12.3 °C [23]) and the Plitvice Lakes (9.4 °C, Table 2) can account for about 1‰ difference in the δ18O values, taking into account the temperature gradient of 0.331‰ per °C [23]. A difference in altitude of 385 m and the altitude effect of 0.28‰ per 100 m altitude difference [19] would account for a further 1.1‰, giving a total difference of 2.1‰ in δ18O, which is in good agreement with the observed difference, taking into account limited number of isotope data for the Plitvice Lakes.
In order to determine the relation between the δ2H and δ18O values in the precipitation of Plitvice Lakes—i.e., the LMWL of the form δ2H = (a ± σa) δ18O + (b ± σb)—we performed linear regression by different approaches (Table 3). For comparison, the analysis for the Zagreb precipitation is taken from [23], while the data for Zadar [19] were analyzed here also by applying the same approaches (Table 3). The analysis of the stable isotope composition of the Plitvice Lakes precipitation is based on 36 data pairs from 2003–2006 (Table 1, Table S2). The LMWLs obtained by various correlation methods for all three precipitation stations (PL, Zg, and Zd) are shown in Table 3. The best results for the Plitvice Lakes and Zadar precipitation were obtained by the RMA and PWLSR approaches (marked in bold in Table 3), while the Zagreb precipitation data were best described by the RMA and PWMA approaches (marked in bold in Table 3). The LMWLs obtained by the best approaches are shown in Figure 6. The LMWLRMA and LMWLPWLSR for PL have slopes close to slope 8 of the Global Meteoric Water Line (GMWL), but slightly higher intercepts. The slope of the Zd LMWLs is lower, as well as the intercepts, caused by evaporation during the summer months [19]. In general, the Plitvice Lakes LMWL lines lie above the GMWL and LMWLs for Zagreb, and are close to the LMWLs for Zadar (Figure 6). Several precipitation sampling campaigns of precipitation related to the cave drip water studies in the karst area of Croatia revealed similar results for LMWLs: sites along the coast at low altitudes gave values of slope (6.6–6.8) and intercept (3.8–6.7) similar to those obtained for Zadar, while continental stations gave slopes (7.1 to 7.8) and intercepts (2.3 to 14.5) closer to the ones of Zagreb and the Plitvice Lakes [25].
The deuterium-excess monthly values at the Plitvice Lakes range from 7.7‰ (January 2004) to 17.9‰ (January 2005), with the mean value of 14.0 ± 2.2‰. These values are higher than those for the Zagreb precipitation, where the mean annual d-excess values ranged between 2.3‰ and 10.7‰, and in the 2003–2006 period the mean value was 8.8 ± 0.8‰ [23]. The higher d value may be explained by the observed increase in the d-excess value with the altitude [2,19], but also by the more intense influence of the Mediterranean air masses in the area of Plitvice lakes [13,19], which is shown here by the relative position of the LMWL compared to the GMWL (Figure 6). Similar high d-excess values (between 11.0 and 18.6) were found for several precipitation sampling locations in the continental karst area at altitudes between 300 and 1550 m [25].
The deuterium excess values for the Zagreb precipitation were higher in autumn than in spring. [19,23,69]. The higher d-excess in autumn indicates a higher influence of the Mediterranean air masses in these months. A similar pattern of the monthly d-excess distribution was observed for the Plitvice Lakes station (Figure 7), with higher d-excess monthly values observed in the autumn–winter precipitation (September–December, 15.2 ± 0.4‰). The lowest mean monthly d-excess values were observed in the summer (July–August, 12.5 ± 1.0‰).
It should be mentioned here that the δ18O values from the 1983–1984 period ranged from −7.2‰ to −13.1‰, the δ2H from −46.0‰ to −94.4‰, and the d-excess from 8.9‰ to 11.5‰, based on only five data points for the monthly isotope composition of the precipitation at the Plitvice Lakes [7,8].

3.3. Groundwater

The tritium activity concentration in the three main springs of the Plitvice Lakes (Figure 8) shows a general decrease over the sampling period, but the seasonal variations are much smaller than those for precipitation (Figure 5), and its values fluctuate around the mean annual A values for precipitation. The A values in the Bijela Rijeka springs were always higher than in the other two springs.
Due to a constant decrease in the A values and the non-equal number of data for each spring, we compared the A values in the Crna Rijeka and Bijela Rijeka springs in 1984 and 2015 (Figure 9a). The lower values in 2015 are not surprising, as well as the higher A values in BR than in CR (by a factor of about 1.3 in 1984 and 1.4 in 2015). In addition, the relative standard deviations of 7.8% in 1984 and 1.3% in 2015 in A for BR were smaller in both periods than those for CR (17% and 9%, respectively).
The range in the δ18O in precipitation was 14.2‰ and in δ2H it was 110.1‰ (Table S2). However, the ranges in the δ values in groundwater (at springs) were much lower, at less than 1‰ in δ18O and less than 10‰ in δ2H (Figure 10). Again, we compared the δ2H values in each spring in the two different periods, 1979–1990 and 2003–2019 (Figure 9b). It can be noticed that, in each period, all three springs have similar values, and Bijela Rijeka has the narrowest range in both periods. Interestingly, all three springs have higher δ2H values in the second period, 2003–2019, by 3–5‰. Earlier, we noticed an increase in temperature in the area, and this increase in the δ2H values in spring can be attributed to the increase in temperature of 1.2 to 1.9 °C when the two periods are concerned, which is in agreement with the increase in temperature of 0.06 °C per year (Figure 3b).
Although the isotope data presented above and the physico-chemical and carbon isotope data from previous studies [7,33,46] indicate that the three springs originated from different hydrogeological units, and in principle different groundwater water lines should be obtained, the δ2H and δ18O data in the three springs cluster together along the LMWL line for the Plitvice Lakes, and the Groundwater Water Line (GWL) is determined for all the springs (Figure 11, Table 4):
δ2H = (5.7 ± 0.7) δ18O + (−10 ± 7), n = 31, r = 0.84.
The GWL (Equation (4)) has both a lower slope and a lower intercept than the LMWL (Table 3), which may be a consequence of water evaporation during its flow in karst aquifers, but also due to a very narrow range of the δ2H values for BR. The regional groundwater line (RGWL) for the Croatian karst area, based on 340 karst springs, revealed a slope of 7.0 and an intercept of 4.2 (Table 4) [30].
The physico-chemical parameters in the spring waters (temperature, pH, ion concentrations) were also very constant throughout year, and all these together indicated a good mixing of water, uniformly recharged during the year in ground water karst aquifers, and the mean residence time of several years [7,33,46]. The conclusion was confirmed by applying the tritium activity concentrations in groundwater/springs for the determination of the Mean Residence Time (MRT) by the exponential model, which supposed a complete mixing of a new recharge with the already existing water in the aquifer [6,7,8,70]. The measured A values for the Zagreb precipitation were used as the input data. The MRT values of different karst springs were very short [8], ranging between 1 and 4 years on average. Among the three springs in the Plitvice Lakes area, the Crna Rijeka spring (CR) had the shortest MRT (2 years) and the Bijela Rijeka spring (BR) had the longest of about 4 years. All these data corroborate the previously obtained isotope data: the longer the MRT, the smaller the range of the isotope composition of groundwater (Figure 9).
The extreme climatological characteristics in 1983 and 1984 that enabled the determination of the relative contributions of base-flow and precipitation in the three karst springs are of special interest here. Summer and fall/autumn 1983 were extremely warm and dry, so the aquifers were not completely recharged, and as a result the older water with higher tritium activity concentrations appeared at the springs (Figure 12a). In the following autumn, abundant precipitation was recorded, as well as a high amount of snow in the winter months (February and March 1984), and these caused lower tritium activities in springs in the spring of 1984 (Figure 12a). There are no available P and T data at the Plitvice Lakes in 1983 and 1984. However, the data for Zagreb could help describe the climatological conditions in these years. The mean annual temperature in Zagreb in 1983 was 12.1 °C, which is higher than that in 1982 (11.7 °C) and in 1984 (10.9 °C), and also higher than the average temperature for the 1980–1985 period of 11.2 ± 0.9 °C [23]. The precipitation amount in 1983 was 755 mm, which is lower than that in 1982 (805 mm) and in 1984 (897 mm), and also lower than the mean P in the 1980–1985 period (843 ± 67 mm) [23]. The flow rates at all three springs in autumn 1983 were very low (the lowest flow rates in November 1983: 0.36, 0.018, and 0.12 m3 s−1 for CR, BR, and PR, respectively), much lower than the average flow rates in 1983 (1.327, 0.387, and 0.407 m3 s−1 for CR, BR, and PR, respectively) or the long-term averages (1.41, 0.466, and 0.668 m3 s−1). At all three springs, the highest flow rates were measured in April 1984 (9.12, 1.81, and 13.3 m3 s−1 for CR, BR, and PR, respectively) [45] (Figure 12b).
The exponential model was applied for MRT calculation under the conditions of the highest and lowest A values in springs, although strictly the exponential model is not valid for non-uniform recharge. The calculated MRT from the higher A values in summer was doubled, for CR to 4 years and for BR to 8 years, in comparison with the previously determined 2 and 4 years, respectively. A significant decline in the tritium activity concentrations in springs was observed after abundant autumn and winter precipitation with lower tritium activity concentrations [7,8,35]. The lowest A values were observed at all three springs in April 1984 after intensive snow melting, and the corresponding MRTs were lower, at ~1 year and ~2 years for CR and BR, respectively. The lowest δ2H values in spring in April 1984 (Figure 10) reflected the high contribution of winter precipitation. Knowing the A of precipitation, and the A in springs at the highest values (during the dry period) and at the lowest ones (April 1984), a fraction of precipitation input in the groundwater was estimated. The fraction of new (precipitation) water in April 1984 was the highest in CR, at about 90%, and was about 60% in PR, while BR consisted of approximately equal proportions of old groundwater and new input (50% each).
A similar conclusion about the mixing of quick and slow components in the springs of the Plitvice Lakes area was obtained by multiple tracers [10,11]. To obtain the MRTs, a multi-tracer lumped parameter modelling approach was applied using the time series of stable isotopes (2H and 18O) and tritium with a monthly resolution, as well as noble gases and CFCs. The average MRT of most springs was less than 5 years [10,11]. Two components of the groundwater flow were distinguished: the quick flow in the conduit network with an MRT of up to 0.5 years, and the slow component of the matrix of a fissured-porous aquifer with an MRT of up to 28 years [10,11].

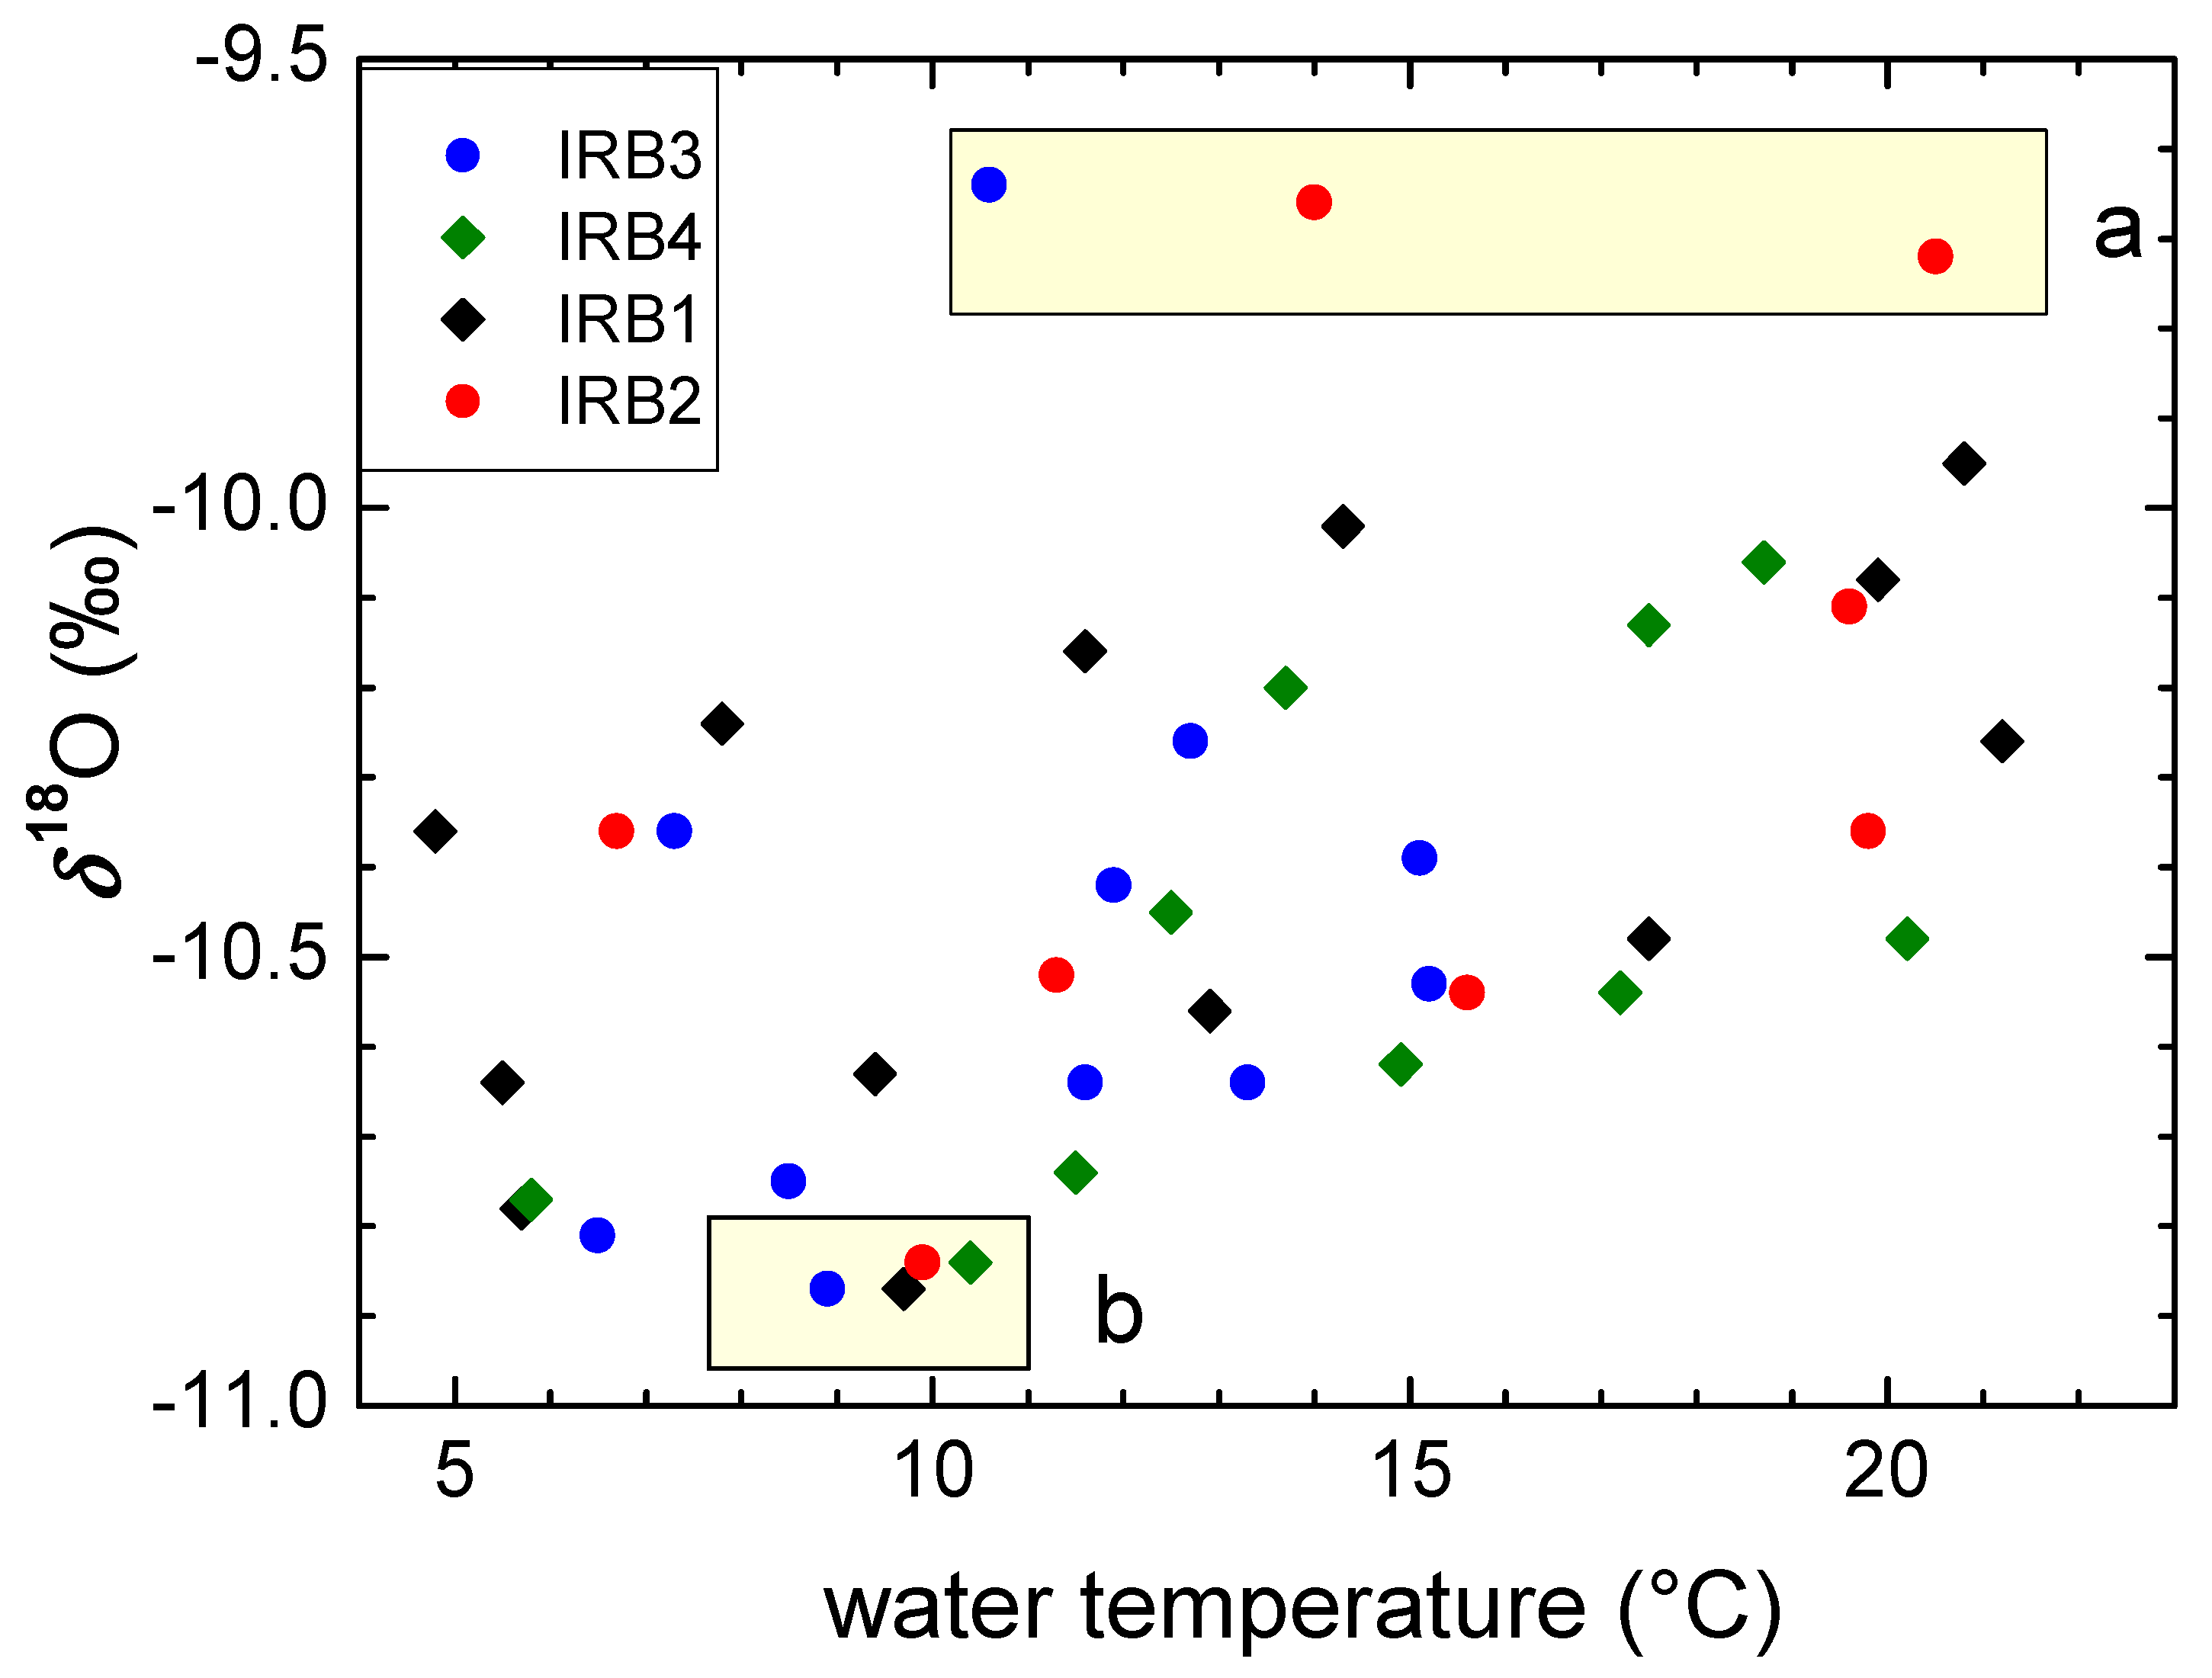
3.4. Surface and Lake Waters

A relatively large set of δ2H data in surface waters in the period 2003–2005 can be found in [10], but the number of δ18O data is significantly lower (Table S1). The data show seasonal fluctuations, with maxima in late summer and minima in late winter (Figure 13a). However, the amplitude in δ2H of less than 10‰ is much smaller than the amplitude of the δ2H values in precipitation (about 110‰, Figure 6), and reflects the isotope composition of groundwaters (Figure 6). The maxima are not observed at all locations at the same time due to the retention of water in the two large lakes (Lake Prošćansko and Lake Kozjak). The two subsequent locations, LB before Lake Kozjak and KzB at the end of Lake Kozjak, show a very similar seasonal pattern, with a delay of approximately two months. The data are almost identical at locations KzB and KoB, although four smaller lakes are situated in between, indicating a fast flow of water through the small lakes. The average values increase in the downstream direction (Figure 13b) due to the evaporation of the surface waters, resulting in a Surface Water Line (SWL) with a lower slope (5.0 ± 0.6) and intercept (−17 ± 6) than the PL LMWLPWLSR line (Table 4).
The more recent sampling campaign (between 2011 and 2014) included also lake water from sediment traps at certain water depths (Table 1, Figure 14a, Figure S1). No difference between lake water at selected depths and surface waters at the closest sampling sites is observed when the mean values are concerned, as can be seen from basic statistics data presented in Table S3. A slight increase in both the mean δ2H and δ18O values and their seasonal variations is observed for locations along the water course. The δ18O increased from −10.7 ± 0.1‰ at Matica to −10.3 ± 0.2‰ at the Korana River–Sastavci (KoS) (Figure S2). Similarly, the δ2H increased from −71.4 ± 1.1‰ at Matica to −69.0 ± 1.7‰ at KoS (Figure 14b). Both the δ2H and δ18O are slightly lower at the final location in this study, KoB, probably due to some local groundwater input along the Korana River course. There is no significant difference between the isotope composition of the lake water and the corresponding surface water.
All the surface waters (2011–2014) lie on the line δ2H = (6.40 ± 0.26) δ18O–(3.4 ± 2.7), r = 0.94 (Surface Water Line (SWL) 2011–2014, Table 4, Figure 15), and the lake water from traps on the line δ2H = (5.8 ± 0.3) δ18O–(9.4 ± 3.0), r = 0.95 (Lake Water Line (LWL), Table 4, Figure 15). The SWL line for 2011–2014 is slightly steeper that the SWL for 2003–2005 (Table 4), which could be explained by the different locations and differences in climatological conditions (2003 was the warmest year in Zagreb and at the Plitvice Lakes in those periods [45]). Additionally, there is no significant difference observed between the SWL and LWL (2011–2014), although both have lower slopes than the LMWLPWLSR obtained for the PL area (Figure 15). The lower slopes and intercepts of both SWL and LWL relations compared to the LMWL indicate the influence of the evaporation of surface waters, which is more pronounced in big lakes.
To justify this conclusion, for all the surface and lake waters from the 2011–2014 sampling campaign we prepared the relations δ2H vs. δ18O, and the slopes and intercepts are shown in Table S4. A general decrease in both the slopes and intercepts in the downstream direction is observed. The lowest values are found in the biggest Lake Kozjak (IRB1, IRB2, and KzB).
The tritium activity concentration was determined in the surface water at the locations Matica and Lake Kozjak–Bridges in 2015, at the same time as in the groundwaters at the CR and BR springs (Figure 8, insert). The lowest mean A value was observed at CR (4.3 ± 0.4 TU, n = 5), and the highest at BR (5.5 ± 0.1 TU, n = 4), and the A values the surface waters were in between them (Ma: 4.8 ± 0.2 TU, n = 5, KzB: 5.1 ± 0.2, n = 4) (Figure S3), as one would expect after the merging of the Bijela Rijeka River and the Crna Rijeka River into the Matica River.
Although the range of δ18O values in the lake water is not large, systematic data can help in identifying extreme hydrological events, similar to the event in 1983–1984 explained earlier. The relation between δ18O and water temperature (Figure 16) shows a generally increasing trend, as would be expected from the general relation of δ18O in precipitation with temperature [23]. The influence of heavy summer rains and snow melting was observed by a slight increase and decrease, respectively, in the δ18O values compared to the average (“normal”) values in both the surface and lake waters. The higher δ18O data points (group a, Figure 16) are the consequences of heavy summer rains. For example, in May and June 2012 the monthly precipitation amounts of 90 mm and 144 mm were recorded in Zagreb, with δ18O values of −4.63‰ and −5.32‰, respectively [23]. Unfortunately, data neither for the precipitation amount nor the δ18O in precipitation are available for these months at the PL area. Nevertheless, the effect of the isotopically heavier precipitation is visible in group a (Figure 16), as well as in Figure S2. The isotope data of group b (Figure 16) are a consequence of the abundant isotopically lighter precipitation (rain and snow) during January–March 2013; the amount of precipitation was 148, 105, and 126 mm in January, February, and March 2013, respectively, with the δ18O values of −12.04‰, −13.73‰, and −11.22‰, respectively (all the data are for Zagreb [23]). The effect of the relatively lower δ18O and δ2H values was observed in all the surface and lake waters in April 2013 (Figure 14a and Figure S2).

4. Conclusions

In this paper, we presented an overview of the application of tritium and stable isotopes of water (2H, 18O) on the characterization of different water bodies (precipitation, groundwater, surface water, lake water) of the karst area of the Plitvice Lakes, Croatia. Various studies were performed over a relatively long time period (1979–2018, with a gap between 1990 and 2001). The available climatological data (amount of precipitation, air temperature) were also analyzed in a search for the evidence of climatological changes. The isotope data were compared to the continuous long-term data record for Zagreb precipitation.
The main conclusion/results of this overview are the following:
  • An increase in the mean annual air temperatures of 0.06 °C per year is observed for the period 1986–2019. An increase in the annual precipitation amount is also observed, at about 10 mm per year, and the range of the monthly precipitation amounts is higher in recent years.
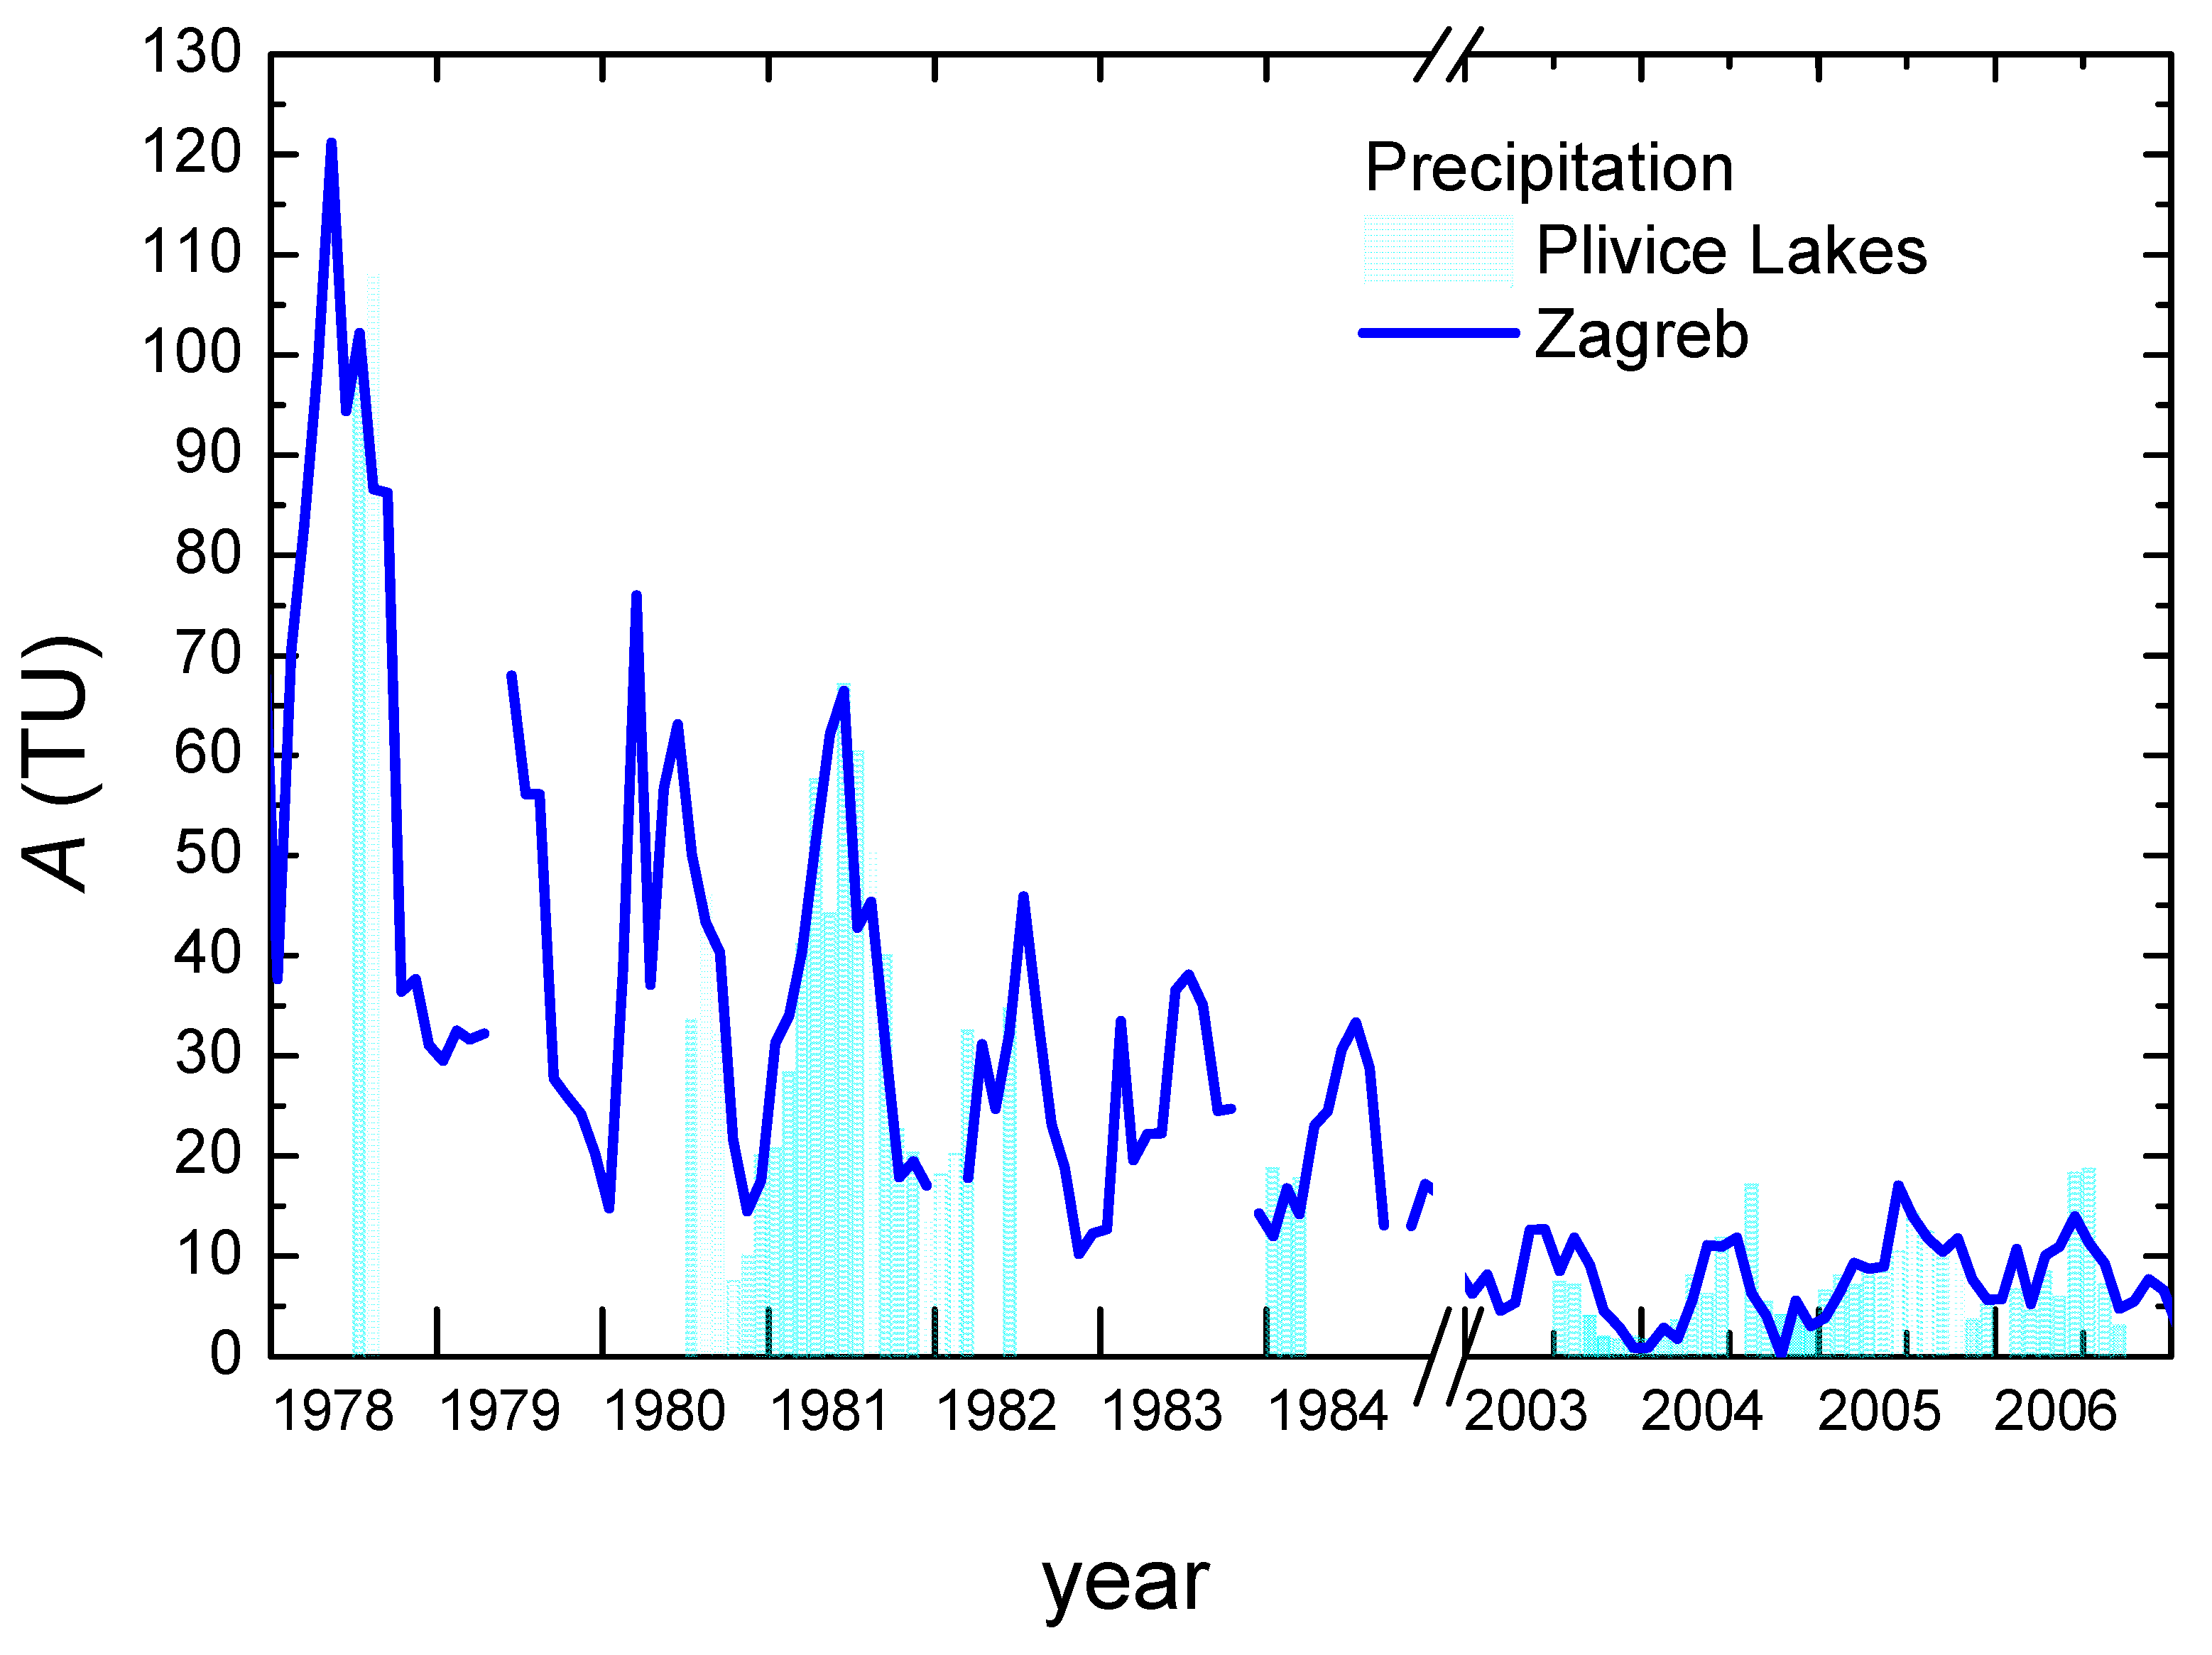
  • Tritium activity concentration in the Plitvice Lakes precipitation shows characteristics typical for the northern hemisphere. A good correlation of the tritium activity concentration in the precipitation at the Plitvice Lakes with that in the Zagreb precipitation is observed, implying that the tritium data for Zagreb can be safely used for the study of the PL area if/when data do not exist for the PL precipitation.
  • The range of the δ18O in precipitation was about 14‰, and in δ2H it was about 110‰. Various regression approaches for the determination of LMWL were applied, and the best results were obtained by the RMA and PWLSR approaches, which gave also the best results for the stations Zagreb and Zadar. The LMWLPWLSR for PL is δ2H = (7.97 ± 0.12) δ18O + (13.8 ± 1.3), n = 36, for the period 2003–2006. This LMWL lies in between the LMWL for Zagreb and Zadar.
  • The deuterium excess for precipitation at the Plitvice Lakes is higher than that for the Zagreb precipitation. This is caused by the combination of higher altitude and the more intense influence of the Mediterranean air masses. The seasonal pattern in d-excess is similar to that in Zagreb, with higher values in the autumn precipitation due to the higher influence of precipitation of Mediterranean origin.
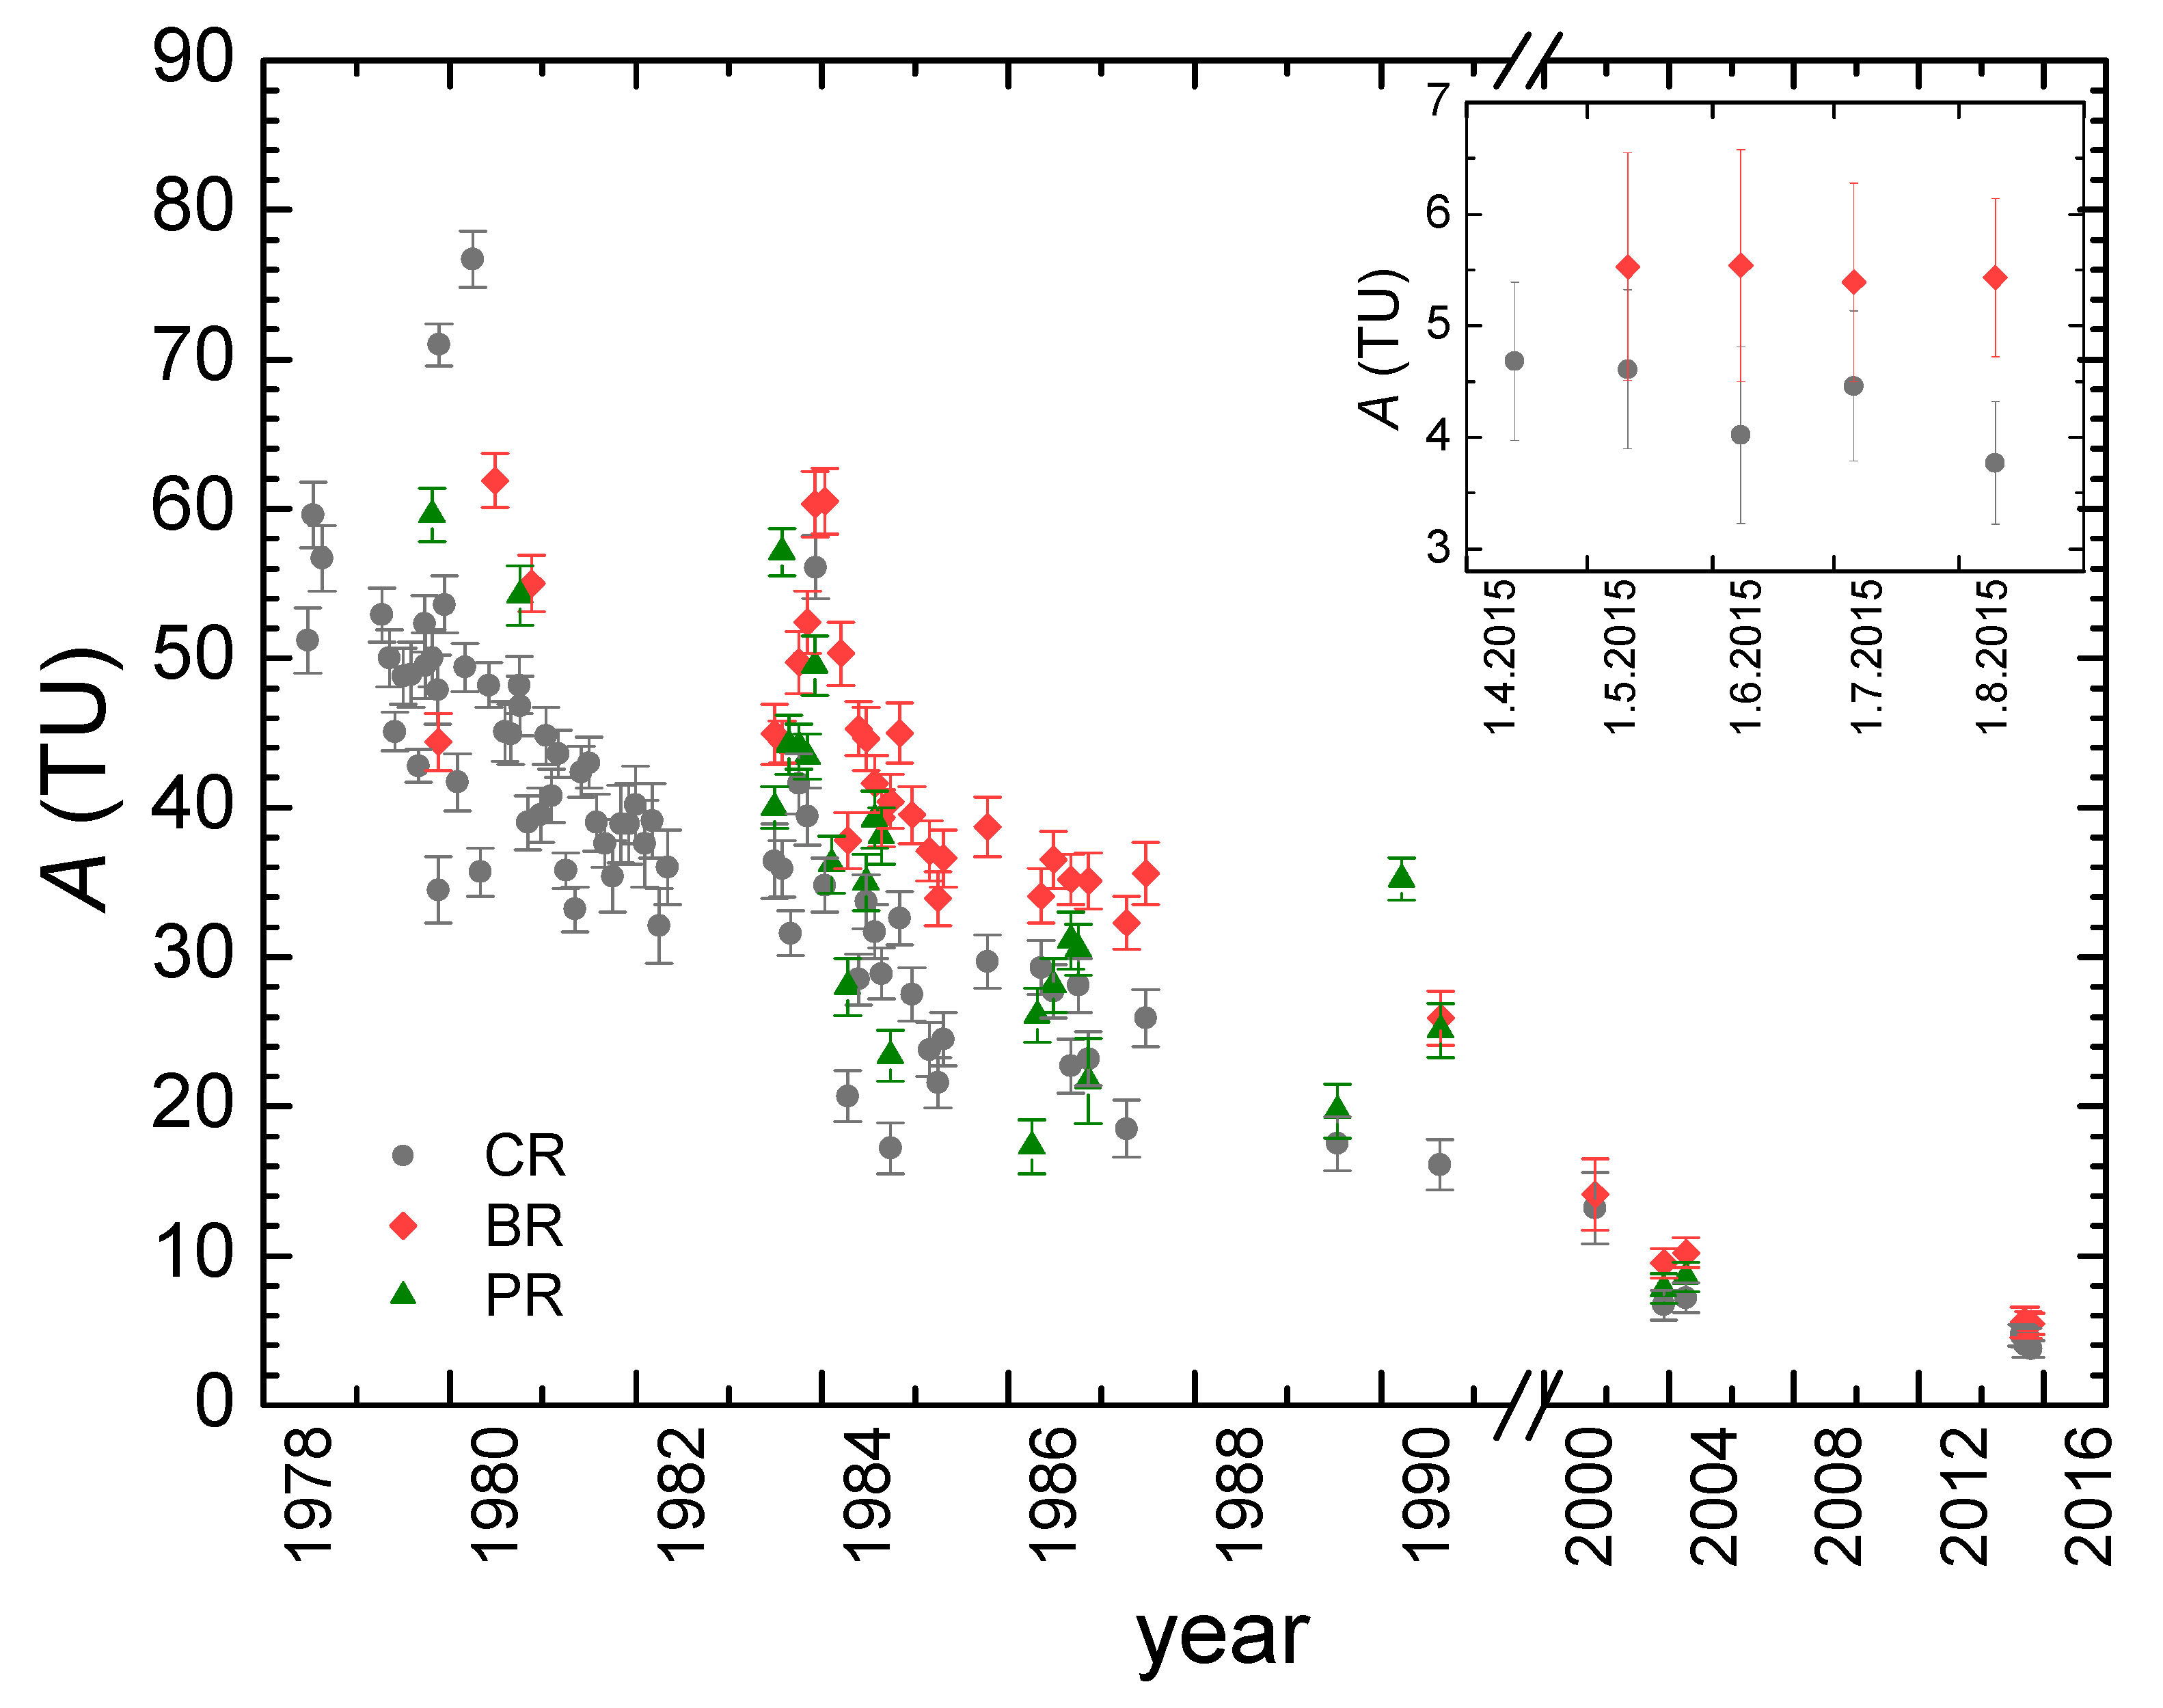
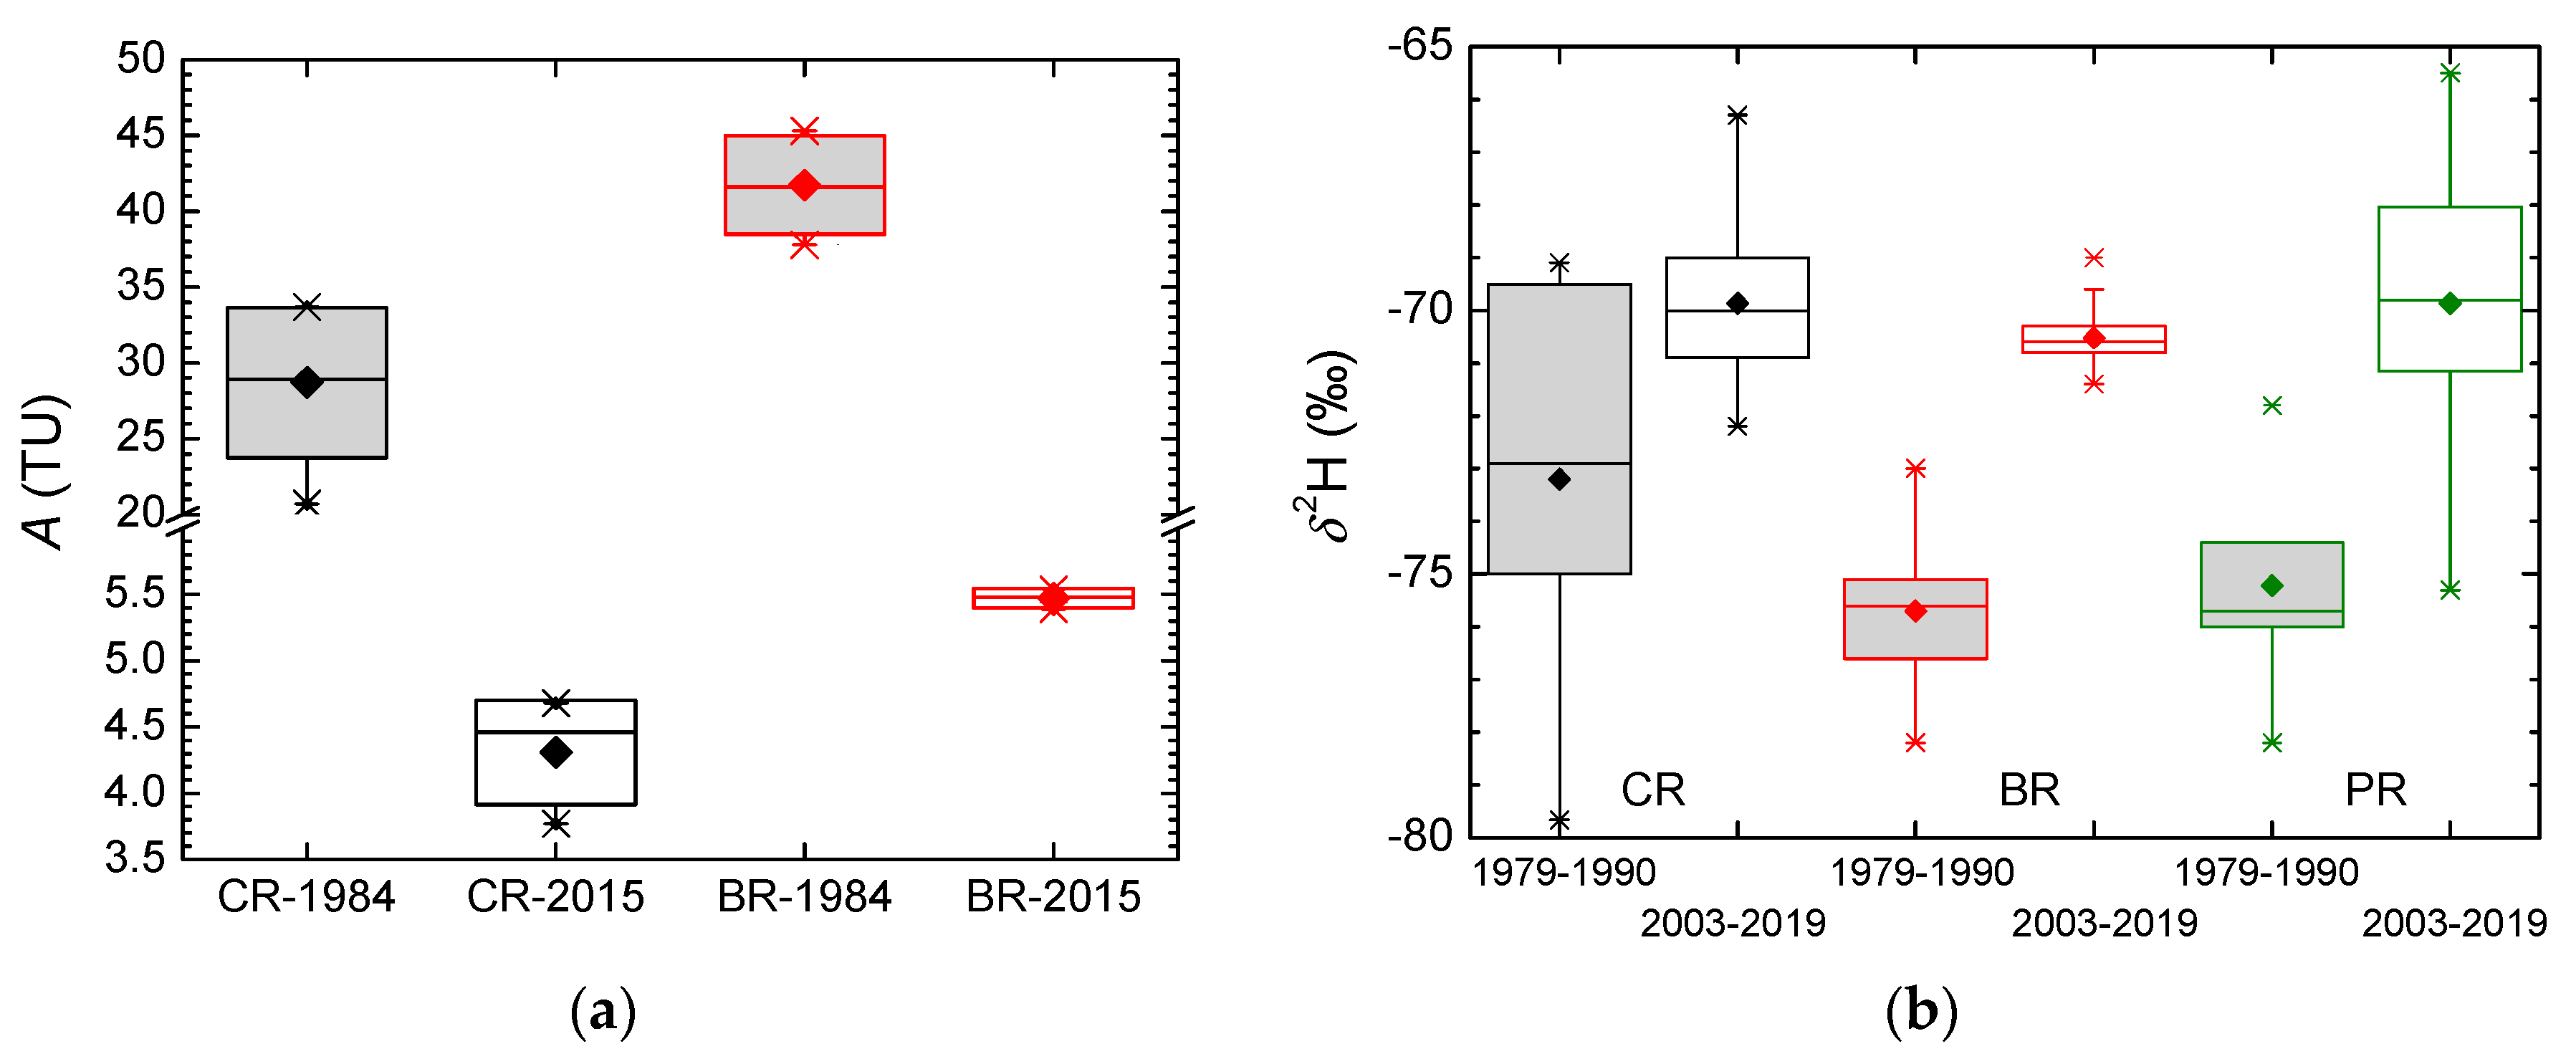
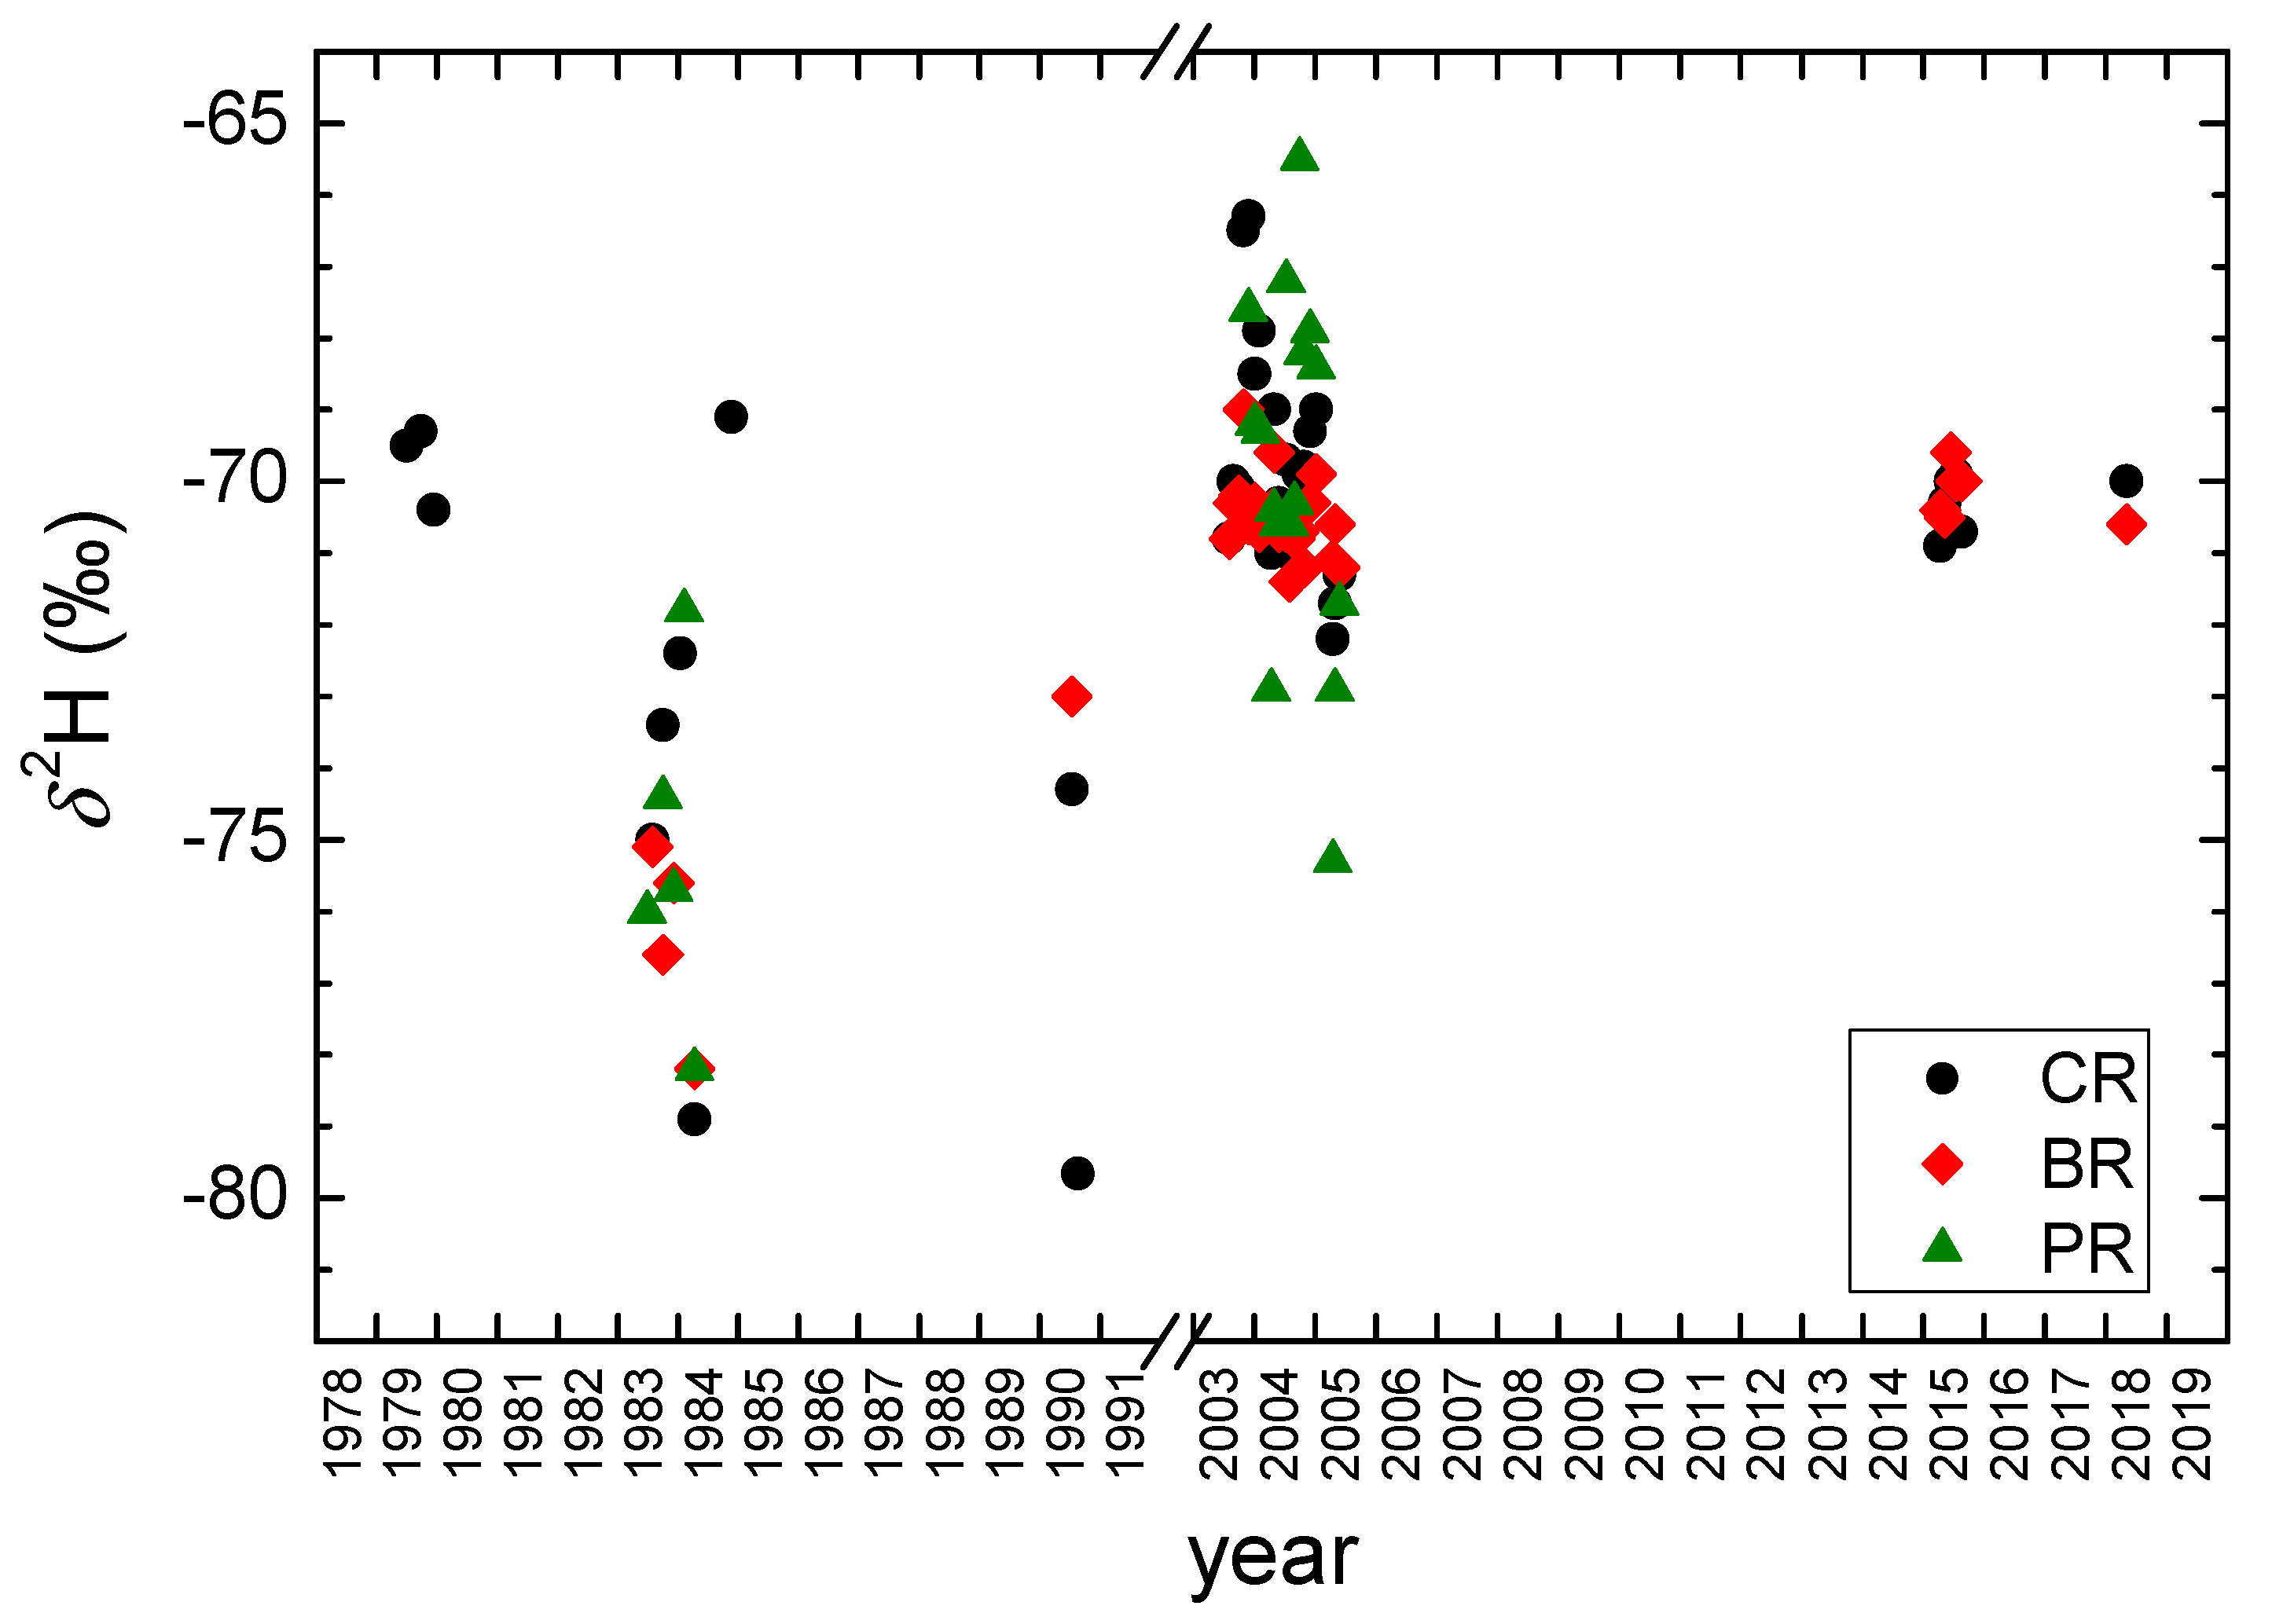
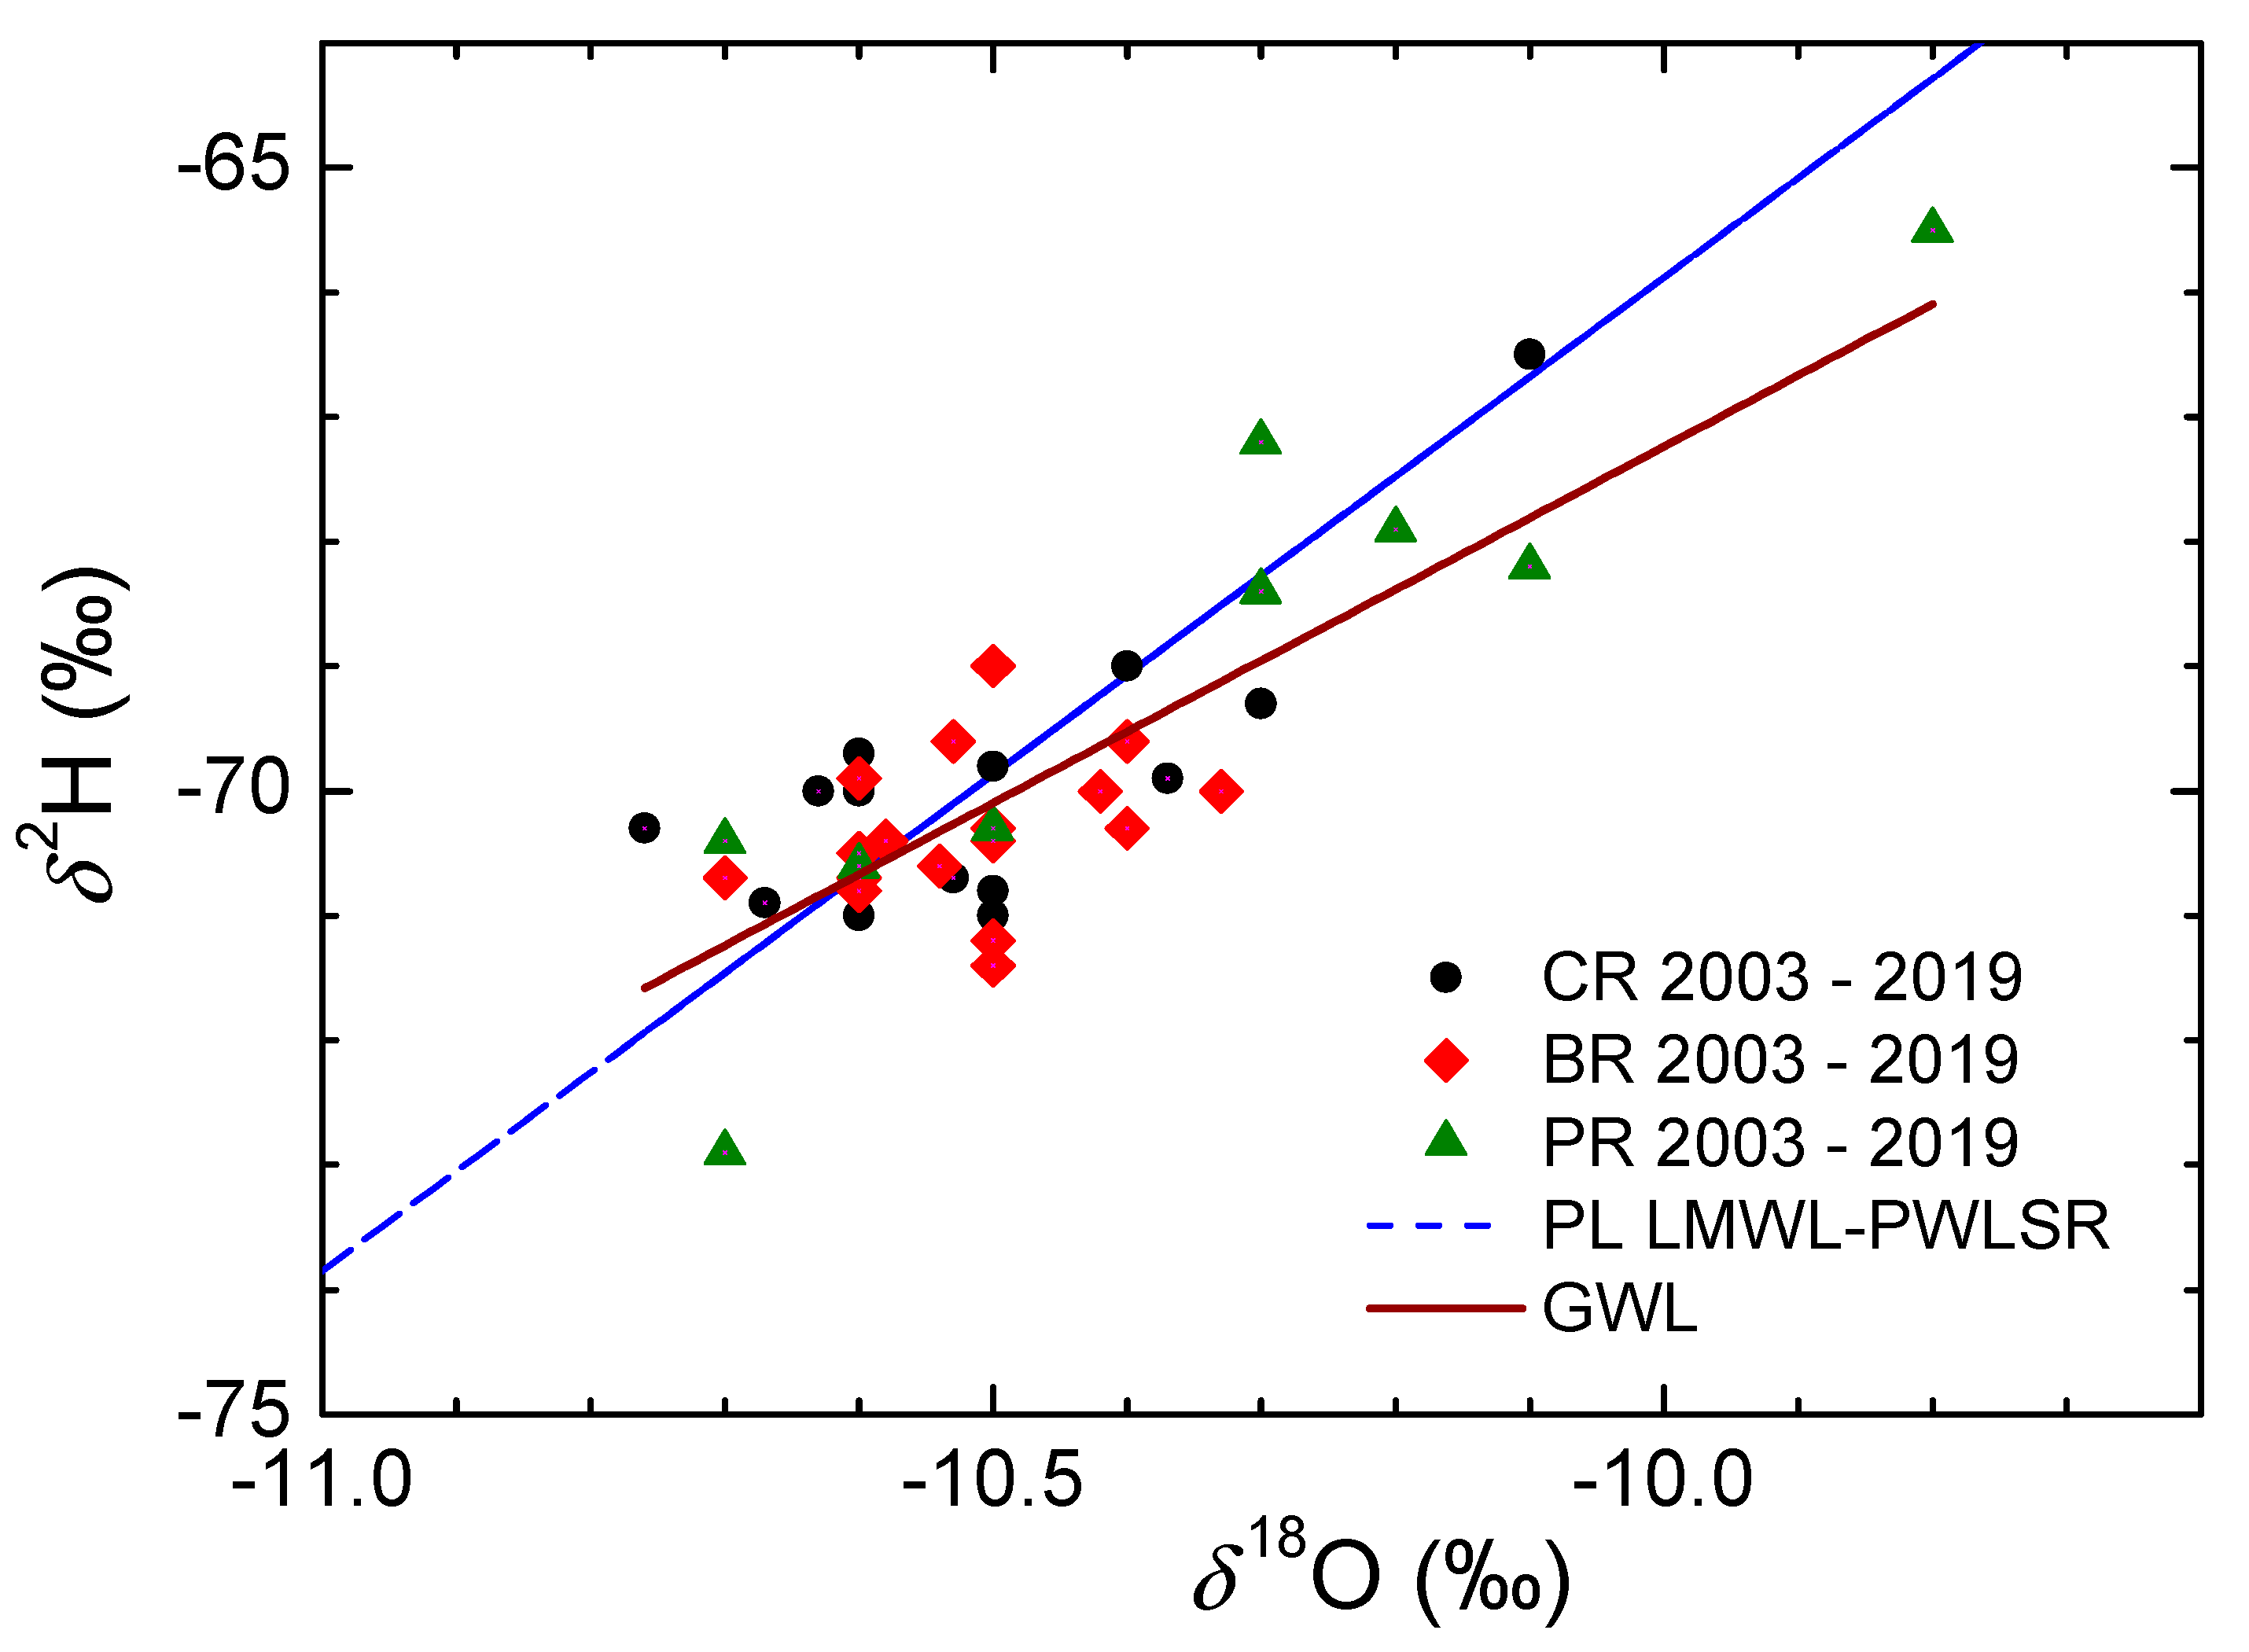
  • The ranges in the δ values in groundwaters (at springs) were much narrower than those in precipitation, at less than 1‰ in δ18O and less than 8‰ in δ2H, indicating the good mixing of waters in karst aquifers.
  • The higher mean δ values in all three karst springs were observed in recent decades (2003–2019) than in the older period 1979–1990. It can be attributed to the increase in the mean air temperature.
  • Different values of mean residence time (MRT) were obtained for three main springs (between 2 years for Crna Rijeka spring and 4 years for Bijela Rijeka spring). Extreme climatological and hydrological conditions in 1983–1984 enabled the estimation of the proportions of precipitation in the spring water: the shorter the MRT, the higher proportions of precipitation.
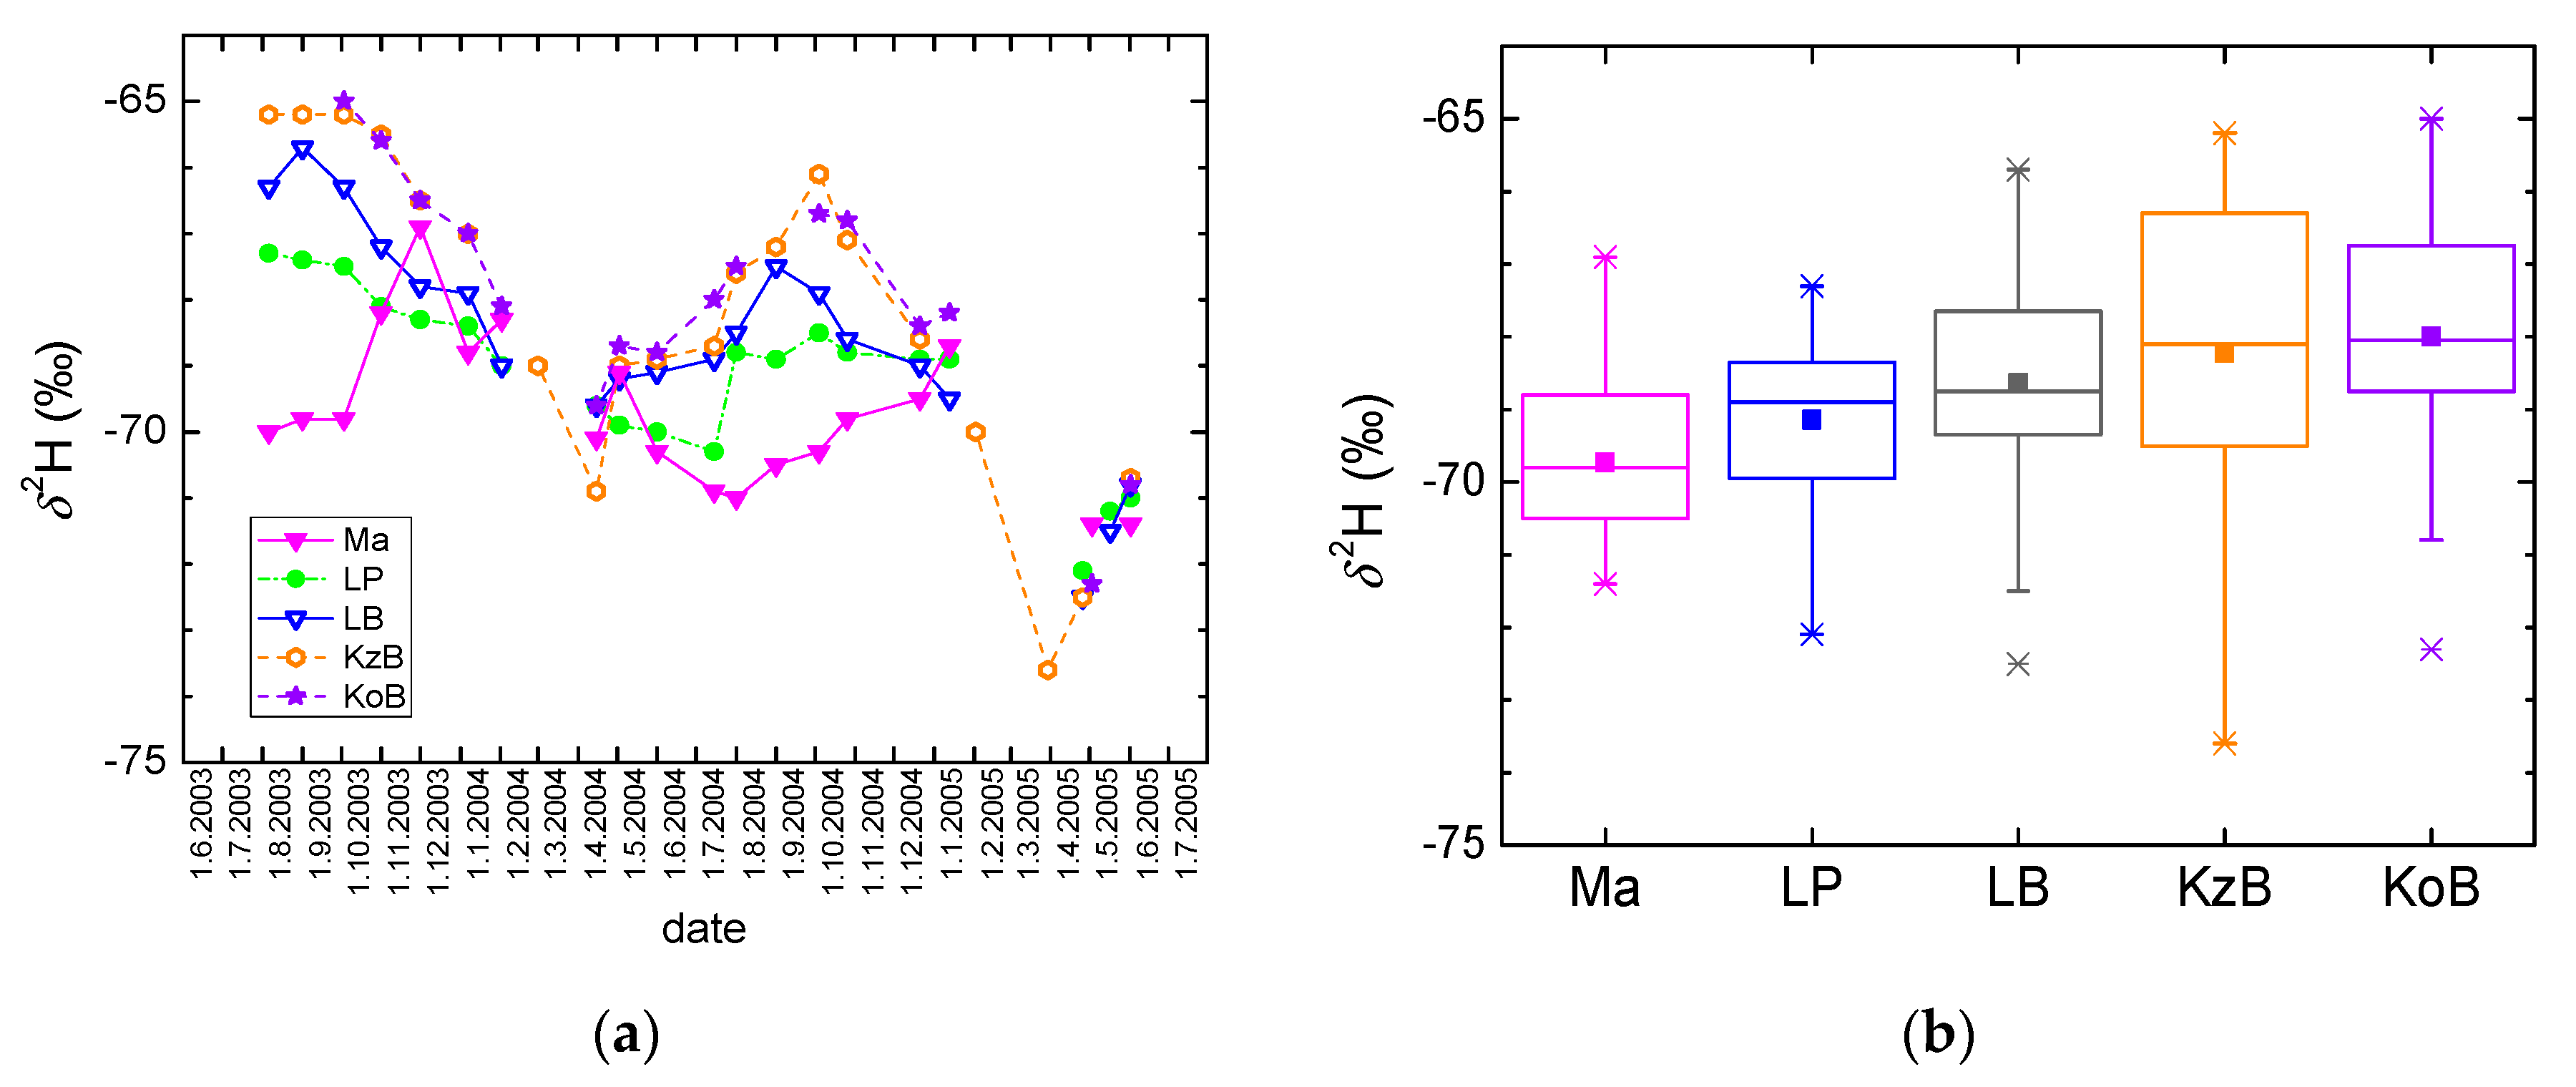
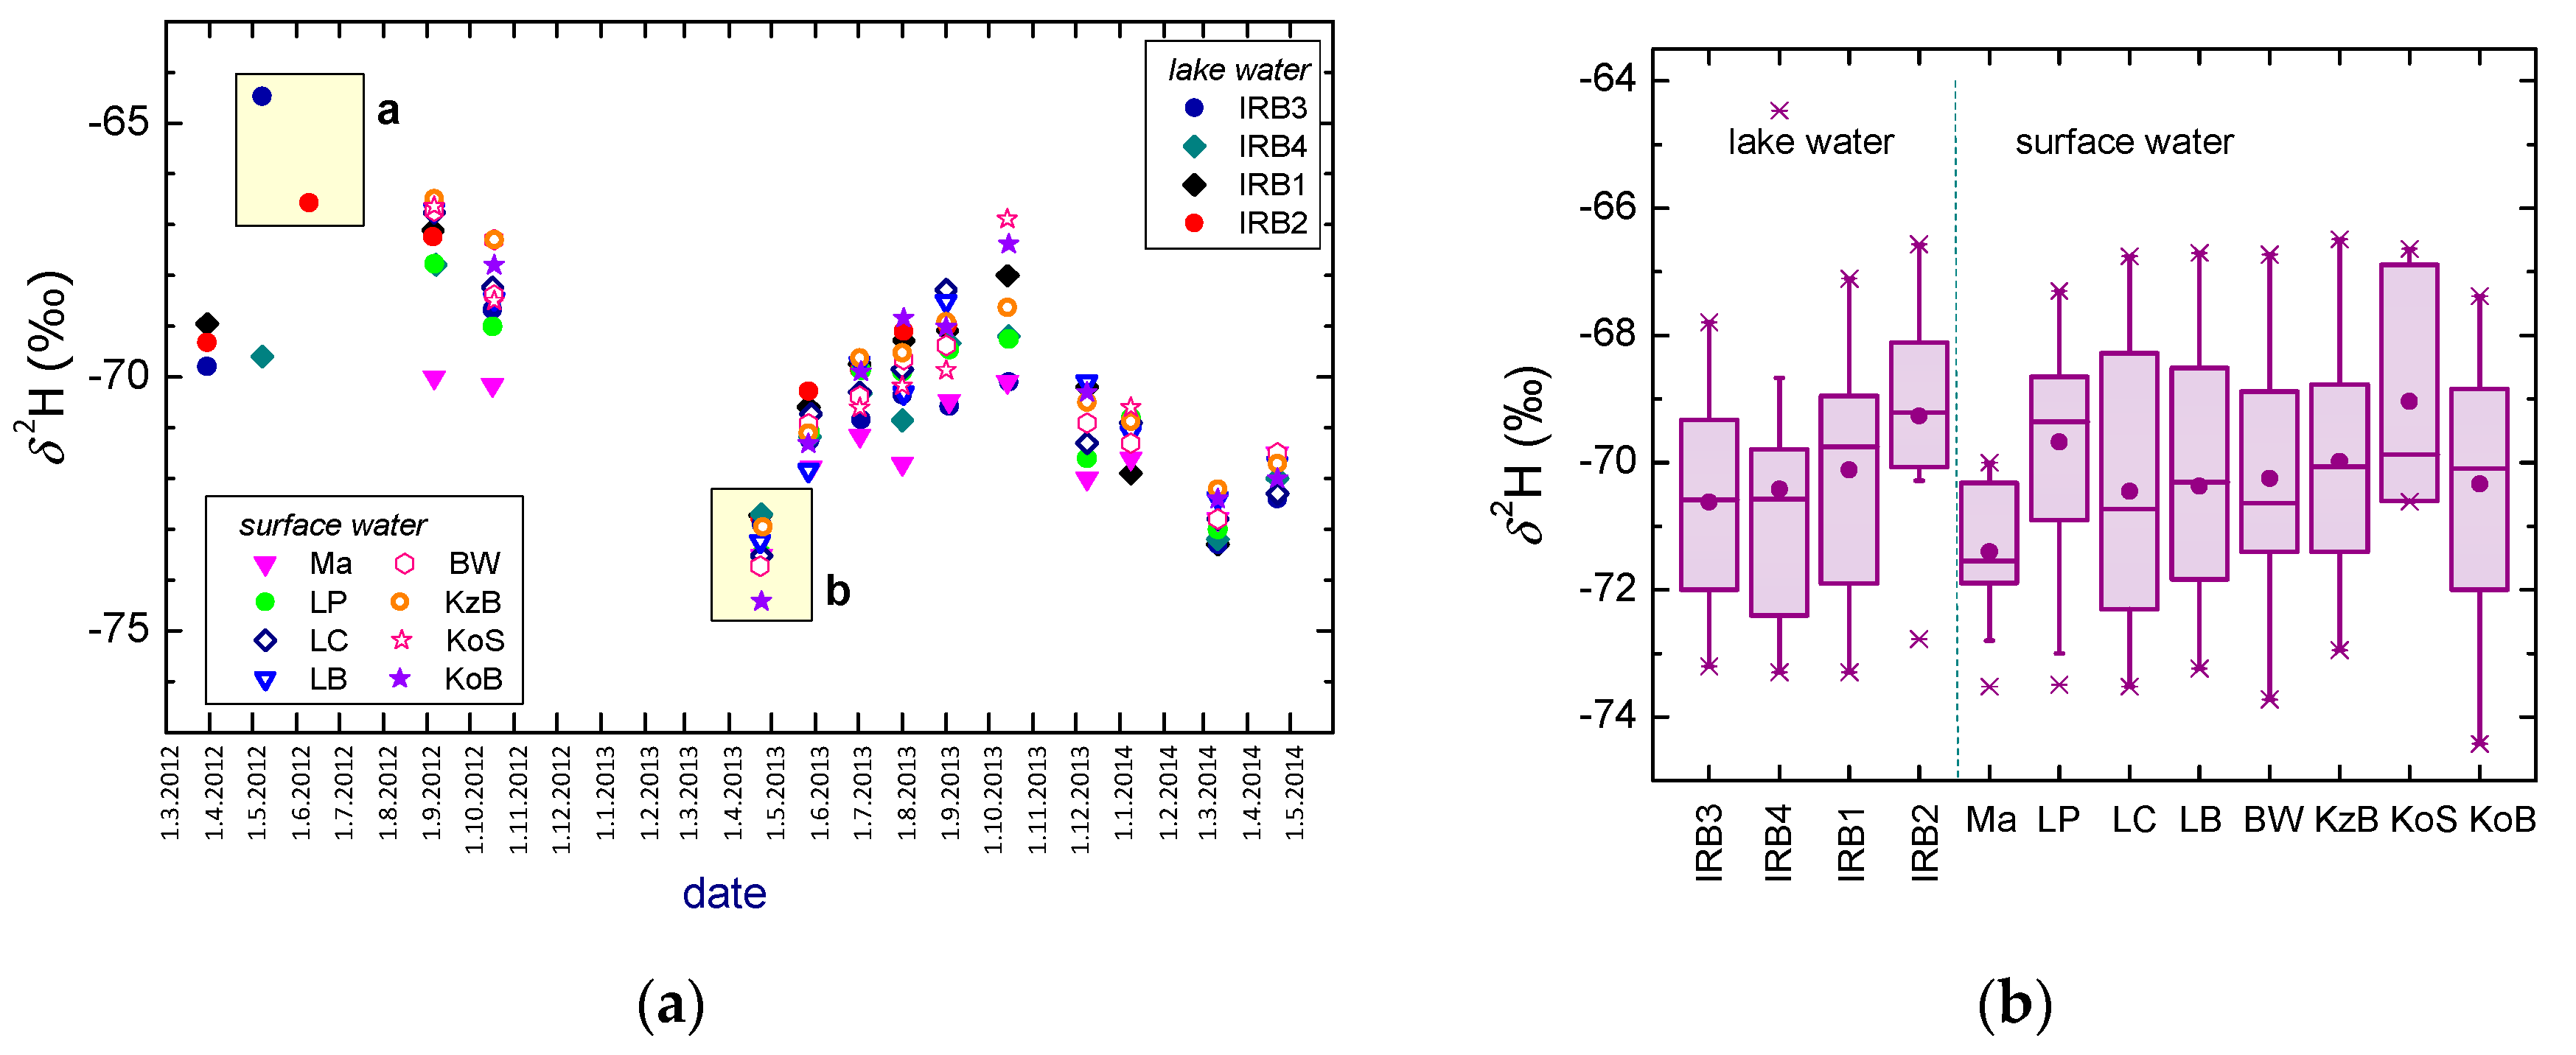
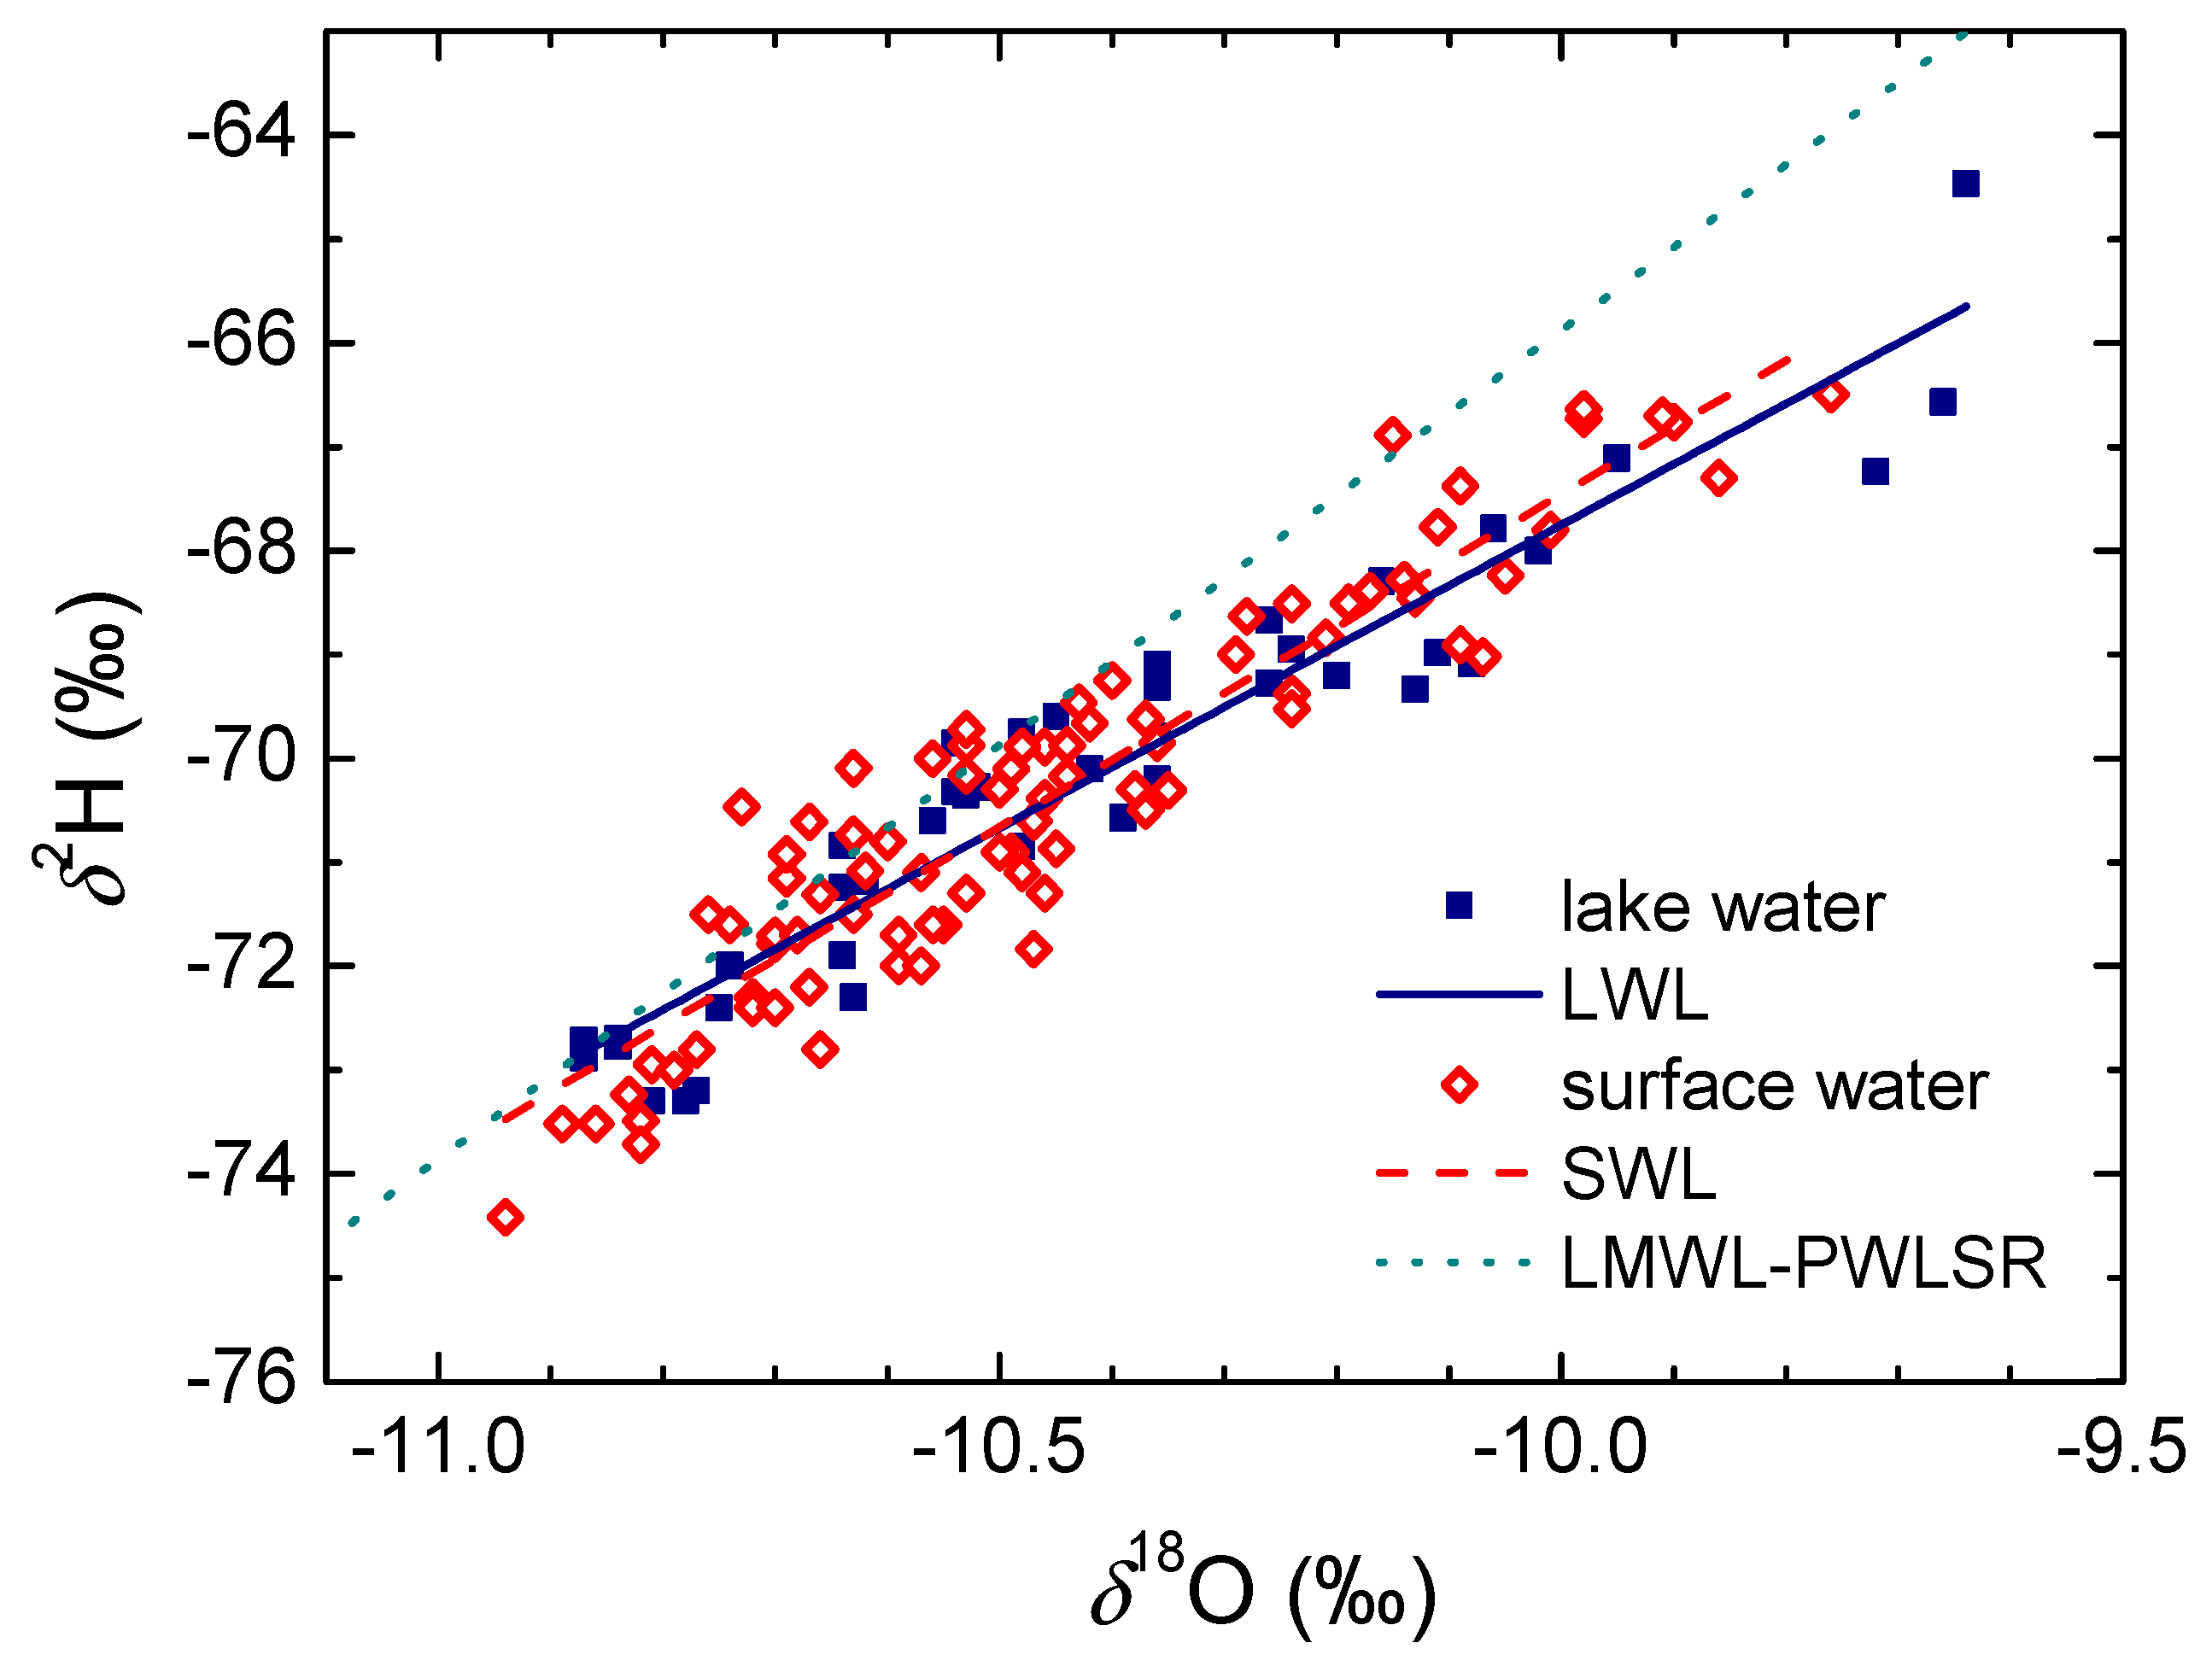
  • The amplitude in the δ2H of surface and lake water is less than 10‰, and < 1.4‰ in δ18O, similar to that in the groundwaters. A slight increase in both the mean δ2H and δ18O values and their seasonal variations is observed for locations along the water course due to the evaporation of surface waters. No difference between lake and surface waters is observed if the mean values are concerned. There is no significant difference observed between the Surface Water Line (SWL) and Lake Water Line (LWL) (2011–2014), both having lower slopes than the LMWLPWLSR obtained for the PL area. The stable isotope composition of the surface and lake waters reacts to the extreme hydrological conditions.
The long-term and comprehensive isotope study of different water bodies in the area of the Plitvice Lakes can be an example of how the application of water isotopes (2H, 18O, 3H) can help in the characterization of karst aquifers on the regional and global scales. The presented data have also shown what could be the topic of future research. A systematic long-term monitoring of water isotopes should be established, which could, together with the new data from the hydrogeological research, result in more detailed definition on the groundwater flow through the research area and possibly differentiate the aquifers from which the Plitvice Lakes receive the water. The usefulness of the tritium activity concentration in hydrogeological research has become recently of less importance due to the relatively constant mean value of A in precipitation during the last three decades. However, the monitoring of A in precipitation at the Plitvice Lakes may help in distinguishing global from local influences on tritium in precipitation. The further monitoring of the stable isotope data in groundwaters and surface water in relation to the global and local climate changes can give valuable data for the protection of waters, as well as tufa and biota in the area. The development of the hydrogeological conceptual model is also foreseen.

Supplementary Materials

The following are available online at https://www.mdpi.com/2073-4441/12/9/2414/s1, all in a single file: Figure S1: Seasonal variations in δ18O of surface and lake waters, 2012–2014 period; Figure S2: Box-plot of δ18O values in lake and surface waters, sorted in downstream direction, 2011–2014 period; Figure S3. Tritium activity concentration in CR and BR springs and in surface water at locations Ma and KzB in 2015; Table S1: Number of isotope data for precipitation, groundwater, surface and lake waters from the Plitvice Lakes area; Table S2: Monthly precipitation amount P, mean monthly temperature T and isotope composition of precipitation (δ18O, δ2H, deuterium excess, tritium activity concentration A) at the Plitvice Lakes; Table S3: Basic statistics (mean values and standard deviations, minimum, median and maximum values) for δ18O (shadowed rows) and δ2H in lake waters (IRB1, IRB2, IRB3, IRB4) and surface waters, 2011–2014 period; Table S4: Slopes and intercepts of relations δ2H vs. δ18O at individual sampling locations of lake waters from traps (IRB1, IRB2, IRB3, IRB4) and surface waters (Ma, LP, LC, LB, BW, KzB, KoS, KoB), 2011–2014 period.

Author Contributions

Conceptualization, data validation and interpretation, writing the manuscript—original draft preparation, final manuscript, visualization—most graphs, and communicating with the journal, I.K.B.; sample collection, tritium activity sample preparation, introduction and participation in discussion, J.B. and A.S.; database management, and LMWL Freeware software application, D.B.; geological setting and visualization, I.L.M.; sample collection, tritium activity sample preparation and interpretation, funding acquisition, N.H.; stable isotope measurement, Z.K. All the co-authors participated in discussions and reviewed the manuscript. All authors have read and agreed to the published version of the manuscript.

Funding

This research received no external funding. In the past, the isotope research on the Plitvice Lakes was part of the following funders and projects: the Ministry of Science and Education (MSE) of the Republic of Croatia, project nos. 00980207 (Natural radioisotopes and processes in gases, 1996–2002), 0098014 (Natural isotopes of low-level activities and the development of instrumentation, 2002–2006), 098-0982709-2741 (Natural radioisotopes in the investigation of Karst ecosystems and dating, 2007–2011); EU project FP5 ICA2-CT-2002-10009 ANTHROPOL.PROT (A study of anthropogenic influence after the war and establishing protection measures in the National Park Plitvice and the Bihać Region at the border area between Croatia and Bosnia and Herzegovina, 2003–2005); and a project financed by the National Park Plitvice Lakes (“An investigation of the influence of forest ecosystems of the National Park Plitvice Lakes on the quality of water and lakes”, 2003–2006). The study was supported by the project “The influence of climatic changes and environmental conditions on biologically induced precipitation of tufa and sedimentation process in the Plitvice Lakes“, contracted between the Ruđer Bošković Institute and the National Park Plitvice Lakes, 2011–2014.

Acknowledgments

The authors are thankful to former Ruđer Bošković Institute laboratory staff members Bogomil Obelić, Dušan Srdoč, Elvira Hernaus, and Božica Mustač and the present technician Anita Rajtarić, who all took part in sample and data collection. We are thankful to the staff of the National Park Plitvice Lakes for their continuous support and help. We are also thankful to colleagues from the Jožef Stefan Institute in Ljubljana (Jože Pezdič, Polona Vreča, Sonja Lojen, Nives Ogrinc, Silva Perko, Zdenka Trkov, and Stojan Žigon) for stable isotope measurements from the period 1980–2003. Meteorological data were obtained on request (free of charge) from the Croatian Meteorological and Hydrological Service. We thank Catherine E. Hughes and Jagoda Crawford for help in getting LMWL Freeware software and for discussions of the formulae used.

Conflicts of Interest

The authors declare no conflict of interest. The funders had no role in the design of the study; in the collection, analysis, or interpretation of data; in the writing of the manuscript; or in the decision to publish the results.

Abbreviations

CMHSCroatian Meteorological and Hydrological Service
GMWLGlobal Meteoric Water Line
GNIPGlobal Network of Isotopes in Precipitation
GPCGas Proportional Counting
GWLGroundwater Water Line
IAEAInternational Atomic Energy Agency
IRMSIsotope Ratio Mass Spectrometry
LMWLLocal Meteoric Water Line
LSC-EELiquid Scintillation Counting with Electrolytic Enrichment
LWLLake Water Line
MAMajor Axis least squared regression
MRTmean residence time
OLSROrdinary Least Square Regression
PLPlitvice Lakes
PWLSRPrecipitation weighted OLSR
PWMAPrecipitation weighted MA
PWRMAPrecipitation weighted RMA
RBIRuđer Bošković Institute
RMAreduced major axis regression
rmSSEavaverage of the root mean square sum of squared errors
SMOWStandard Mean Ocean Water
SWLSurface Water Line
TUTritium Unit
UNESCOThe United Nations Educational, Scientific and Cultural Organisation
WMOWorld Meteorological Organization

References

  1. Bradley, C.; Baker, A.; Jex, C.N.; Leng, M.J. Hydrological uncertainties in the modelling of cave drip-water δ18O and the implications for stalagmite palaeoclimate reconstructions. Quat. Sci. Rev. 2010, 29, 2201–2214. [Google Scholar] [CrossRef]
  2. Biondić, B.; Biondić, R.; Dukanić, F. Protection of karst aquifers in the Dinarides in Croatia. Environ. Geol. 1998, 34, 309–319. [Google Scholar] [CrossRef]
  3. Fajković, H.; Hasan, O.; Miko, S.; Juračić, M.; Mesić, S.; Prohić, E. Vulnerability of the karst area related to potentially toxic elements. Geol. Croat. 2011, 64, 41–48. [Google Scholar] [CrossRef]
  4. Terzić, J.; Marković, T.; Lukač Reberski, J. Hydrogeological properties of a complex Dinaric karst catchment: Miljacka Spring case study. Environ. Earth Sci. 2014, 72, 1129–1142. [Google Scholar] [CrossRef]
  5. Kazakis, N.; Chalikakis, K.; Mazzilli, N.; Ollivier, C.; Manakos, A.; Voudouris, K. Management and research strategies of karst aquifers in Greece: Literature overview and exemplification based on hydrodynamic modelling and vulnerability assessment of a strategic karst aquifer. Sci. Total Environ. 2018, 643, 592–609. [Google Scholar] [CrossRef]
  6. Małoszewski, P.; Rauert, W.; Stichler, W.; Herrmann, A. Application of flow models in an alpine catchment area using tritium and deuterium data. J. Hydrol. 1983, 66, 319–330. [Google Scholar] [CrossRef]
  7. Srdoč, D.; Horvatinčić, N.; Obelić, B.; Krajcar Bronić, I.; Sliepčević, A. Procesi taloženja kalcita u krškim vodama s posebnim osvrtom na Plitvička jezera (Calcite deposition processes in karstwaters with special emphasis on the Plitvice Lakes, Yugoslavia). Carsus Iugoslaviae 1985, 11, 101–204. [Google Scholar]
  8. Srdoč, D.; Krajcar Bronić, I. The application of stable and radioactive isotopes in karst water research. Naš Krš 1986, 12, 37–47. [Google Scholar]
  9. Małoszewski, P.; Zuber, A. Lumped parameter models for the interpretation of environmental tracer data. In Manual on Mathematical Models in Isotope Hydrology; IAEA-TECDOC-910; IAEA: Vienna, Austria, 1996; pp. 9–58. [Google Scholar]
  10. Babinka, S. Multi-tracer study of karst waters and lake sediments in Croatia and Bosnia-Herzegovina: Plitvice Lakes National Park and Bihać area. Ph.D. Thesis, Rheinischen Friedrich-Wilhelms-Universität, Bonn, Germany, 2007; p. 167. [Google Scholar]
  11. Babinka, S.; Obelić, B.; Krajcar Bronić, I.; Horvatinčić, N.; Barešić, J.; Kapelj, S.; Suckow, A. Mean residence time of water from springs of the Plitvice Lakes and Una River area. In Advances in Isotope Hydrology and Its Role in Sustainable Water Resources Management (HIS-2007), Proceedings of a Symposium, Vienna, Austria, 21–25 May 2007; IAEA-CN-15/45; IAEA: Vienna, Austria, 2007; pp. 327–336. Available online: https://www-pub.iaea.org/MTCD/publications/PDF/Pub1310_web.pdf (accessed on 5 August 2020).
  12. Horvatinčić, N.; Kapelj, S.; Sironić, A.; Krajcar Bronić, I.; Kapelj, J.; Marković, T. Investigation of water resources and water protection in the karst area of Croatia using isotopic and geochemical analyses. In Advances in Isotope Hydrology and Its Role in Sustainable Water Resources Management (HIS-2007), Proceedings of a Symposium, Vienna, Austria, 21–25 May 2007; IAEA: Vienna, Austria, 2007; pp. 295–304. ISBN 978-92-0-110207-2. Available online: https://www-pub.iaea.org/MTCD/publications/PDF/Pub1310Vol2_web.pdf (accessed on 5 August 2020).
  13. Häusler, H.; Frančišković-Bilinski, S.; Rank, D.; Stadler, P.; Bilinski, H. Preliminary results from stable isotope investigations in the Kupa Drainage Basin (Western Croatia). In BALWOIS 2012 Conference Web-Site, Ohrid, Macedonia, 28 May–3 June 2012; Morell, M., Popovska, C., Morell, O., Stojov, V., Eds.; BALWOIS: Ohrid, Macedonia, 2012. [Google Scholar]
  14. Mandić, M.; Bojić, D.; Roller-Lutz, Z.; Lutz, H.O.; Krajcar Bronić, I. Note on the spring region of Gacka River (Croatia). Isot. Environ. Health Stud. 2008, 44, 201–208. [Google Scholar] [CrossRef]
  15. Cartwright, I.; Morgenstern, U. Transit times from rainfall to baseflow in headwater catchments estimated using tritium: The Ovens River, Australia. Hydrol. Earth Syst. Sci. 2015, 19, 1–15. [Google Scholar] [CrossRef] [Green Version]
  16. Nikolov, J.; Krajcar Bronić, I.; Todorović, N.; Barešić, J.; Petrović Pantić, T.; Marković, T.; Bikit-Schroeder, K.; Stojković, I.; Tomić, M. A survey of isotopic composition (2H, 3H, 18O) of groundwater from Vojvodina. J. Radioanal. Nucl. Chem. 2019, 320, 385–394. [Google Scholar] [CrossRef]
  17. Parlov, J.; Kovač, Z.; Nakić, Z.; Barešić, J. Using Water Stable Isotopes for Identifying Groundwater Recharge Sources of the Unconfined Alluvial Zagreb Aquifer (Croatia). Water 2019, 11, 2177. [Google Scholar] [CrossRef] [Green Version]
  18. Madonia, P.; Cangemi, M.; Oliveri, Y.; Germani, C. Hydrogeochemical Characters of Karst Aquifers in Central Italy and Relationship with Neotectonics. Water 2020, 12, 1926. [Google Scholar] [CrossRef]
  19. Vreča, P.; Krajcar Bronić, I.; Horvatinčić, N.; Barešić, J. Isotopic characteristics of precipitation in Slovenia and Croatia: Comparisom of continental and maritime stations. J. Hydrol. 2006, 330, 457–469. [Google Scholar] [CrossRef]
  20. IAEA/WMO. Global Network of Isotopes in Precipitation. The GNIP Database. Available online: https://nucleus.iaea.org/wiser (accessed on 22 November 2019).
  21. Rozanski, K.; Araguás-Araguás, L.; Gonfiantini, R. Isotopic patterns in modern global precipitation. Geophys. Monogr. Ser. 1993, 78, 1–36. [Google Scholar] [CrossRef]
  22. Rozanski, K.; Gonfiantini, R.; Araguas-Araguas, L. Tritium in the global atmosphere: Distribution patterns and recent trends. J. Phys. G Nucl. Part. Phys. 1991, 17, 523–536. [Google Scholar] [CrossRef]
  23. Krajcar Bronić, I.; Barešić, J.; Borković, D.; Sironić, A.; Lovrenčić Mikelić, I.; Vreča, P. Long-Term Isotope Records of Precipitation in Zagreb, Croatia. Water 2020, 12, 226. [Google Scholar] [CrossRef] [Green Version]
  24. Bognar, A.; Faivre, S.; Buzjak, N.; Pahernik, M.; Bočić, N. Recent Landform Evolution in the Dinaric and Pannonian Regions of Croatia. In Recent Landform Evolution; Lóczy, D., Stankoviansky, M., Kotarba, A., Eds.; Springer: Berlin/Heidelberg, Germany, 2012; pp. 313–344. [Google Scholar] [CrossRef]
  25. Surić, M.; Czuppon, G.; Lončarić, R.; Bočić, N.; Lončar, N.; Bajo, P.; Drysdale, R.N. Stable Isotope Hydrology of Cave Groundwater and its Relevance for Speleothem-Based Palaeoenvironmental Reconstruction in Croatia. Water 2020, 12, 2386. [Google Scholar] [CrossRef]
  26. Bonacci, O. Karst hydrogeology/hydrology of Dinaric chain and isles. Environ. Earth Sci. 2015, 74, 37–55. [Google Scholar] [CrossRef]
  27. Bonacci, O.; Terzić, J.; Roje-Bonacci, T.; Frangen, T. An Intermittent Karst River: The Case of the Čikola River (Dinaric Karst, Croatia). Water 2019, 11, 2415. [Google Scholar] [CrossRef] [Green Version]
  28. Garašić, M.; Garašić, D. The new insights about deep karst springs in the Dinaric karst of Croatia. In Proceedings of the 17th International Congress of Speleology—Volume 2, The 17th International Congress of Speleology, Sydney, NSW, Australia, 23–29 July 2017; Moore, K., White, S., Eds.; Australian Speleological Federation Inc and Speleo: Sydney, Australia, 2017; pp. 26–29. [Google Scholar]
  29. Bencetić Klaić, Z.; Rubinić, J.; Kapelj, S. Review of research on Plitvice Lakes, Croatia in the fields of meteorology, climatology, hydrology, hydrogeochemistry and physical limnology. Geofizika 2018, 35, 189–278. [Google Scholar] [CrossRef]
  30. Brkić, Ž.; Kuhta, M.; Hunjak, T.; Larva, O. Regional Isotopic Signatures of Groundwater in Croatia. Water 2020, 12, 1983. [Google Scholar] [CrossRef]
  31. Horvatinčić, N.; Krajcar Bronić, I.; Obelić, B. Diferences in the 14C age, δ13C and δ18O of Holocene tufa and speleothem in the Dinaric Karst. Palaeogeogr. Palaeoclimatol. Palaeoecol. 2003, 193, 139–157. [Google Scholar] [CrossRef]
  32. Horvatinčić, N.; Sironić, A.; Barešić, J.; Sondi, I.; Krajcar Bronić, I.; Borković, D. Mineralogical, Organic and Isotopic Composition as Palaeoenvironmental Records in the Lake Sediments of Two Lakes, the Plitvice Lakes, Croatia. Quat. Int. 2018, 494, 300–313. [Google Scholar] [CrossRef] [Green Version]
  33. Sironić, A.; Barešić, J.; Horvatinčić, N.; Brozinčević, A.; Vurnek, M.; Kapelj, S. Changes in the geochemical parameters of karst lakes over the past three decades—The case of Plitvice Lakes, Croatia. Appl. Geochem. 2017, 78, 12–22. [Google Scholar] [CrossRef]
  34. Horvatinčić, N. Radiocarbon and tritium measurements in water samples and application of isotopic analyses in hydrology. Fizika 1980, 12, 201–218. [Google Scholar]
  35. Horvatinčić, N.; Krajcar Bronić, I.; Pezdič, J.; Srdoč, D.; Obelić, B. The distribution or radioactive (3H, 14C) and stable (2H, 18O) isotopes in precipitation, surface and groundwaters during the last decade in Yugoslavia. Nucl. Instrum. Methods Phys. Res. B 1986, 1, 550–553. [Google Scholar] [CrossRef]
  36. Krajcar Bronić, I.; Horvatinčić, N.; Obelić, B. Two decades of environmental isotope records in Croatia: Reconstruction of the past and prediction of future levels. Radiocarbon 1998, 40, 399–416. [Google Scholar] [CrossRef] [Green Version]
  37. Krajcar Bronić, I.; Vreča, P.; Horvatinčić, N.; Barešić, J.; Obelić, B. Distribution of hydrogen, oxygen and carbon isotopes in the atmosphere of Croatia and Slovenia. Arch. Ind. Hyg. Toxicol. 2006, 57, 23–29. [Google Scholar]
  38. Biondić, B.; Biondić, R.; Meaški, H. The conceptual hydrogeological model of the Plitvice Lakes. Geol. Croat. 2010, 63, 195–206. [Google Scholar] [CrossRef]
  39. Biondić, R.; Meaški, H.; Biondić, B. Hydrogeology of the sinking zone of the Korana River downstream of the Plitvice Lakes, Croatia. Acta Carsol. 2016, 45, 43–56. [Google Scholar] [CrossRef] [Green Version]
  40. Rubinić, J.; Zwicker, G.; Dragičević, N. Contribution to knowing Plitvice Lakes hydrology—lake water level variation dynamics and significant changes. In Proceedings of the Meeting Hydrological Measurements and Data Processing (“Hidrološka mjerenja i obrada podataka”), NP Plitvice Lakes, Croatia, 26–28 November 2008; pp. 207–230, (In Croatian, English abstract). [Google Scholar]
  41. Polšak, A.; Juriša, M.; Šparica, M.; Šimunić, A. Basic Geological Map of SFRJ, Sheet Bihać, 1:100 000; Federal Geological Office: Belgrade, Yugoslavia, 1976.
  42. Halamić, J. Explanatory Notes of the Geological Map of the Republic of Croatia 1:300.000; Velić, I., Vlahović, I., Eds.; Croatian Geological Institute: Zagreb, Croatia, 2009; p. 141. [Google Scholar]
  43. Köppen, W. Das geographische System der Klimate. In Handbuch der Klimatologie; Köppen, W., Geiger, G., Eds.; Gebrüder Borntraeger: Berlin, Germany, 1936; pp. 1–44. [Google Scholar]
  44. Peel, M.C.; Finlyanson, B.L.; McMahon, T.A. Updated world map of the Köppen-Geiger climate classification. Hydrol. Earth Syst. Sci. 2007, 11, 1633–1644. [Google Scholar] [CrossRef] [Green Version]
  45. CMHS, 2020 Croatian Meteorological and Hydrological Service. Available online: https://meteo.hr/index_en.php (accessed on 25 August 2020).
  46. Sironić, A.; Krajcar Bronić, I.; Horvatinčić, N.; Barešić, J.; Borković, D.; Vurnek, M.; Lovrenčić Mikelić, I. Carbon isotopes in dissolved inorganic carbon as tracers of carbon sources in karst waters of the Plitvice Lakes, Croatia. Geol. Soc. Lond. 2020. [Google Scholar] [CrossRef]
  47. Vreča, P.; Krajcar Bronić, I.; Leis, A.; Demšar, M. Isotopic composition of precipitation at the station Ljubljana (Reaktor), Slovenia—period 2007–2010. Geologija 2014, 57, 217–230. [Google Scholar] [CrossRef]
  48. Morrison, J.; Brockwell, T.; Merren, T.; Fourel, F.; Phillips, A.M. On-line high-precision stable hydrogen isotopic analyses on nanoliter water samples. Anal. Chem. 2001, 73, 3570–3575. [Google Scholar] [CrossRef]
  49. Coplen, T.B.; Wassenaar, L.I. LIMS for Lasers for achieving long-term accuracy and precision of δ2H, δ17O, and δ18O of waters using laser absorption spectrometry. Rapid Commun. Mass Spectrom. 2015, 29, 2122–2130. [Google Scholar] [CrossRef] [PubMed]
  50. Krajcar Bronić, I.; Obelić, B.; Srdoč, D. The simultaneous measurement of tritium activity and background count rate in a proportional counter by the Povinec method: Three years experience at the Rudjer Bošković Institute. Nucl. Instrum. Methods Phys. Res. 1986, 17, 498–500. [Google Scholar] [CrossRef]
  51. Barešić, J.; Krajcar Bronić, I.; Horvatinčić, N.; Obelić, B.; Sironić, A.; Kožar-Logar, J. Tritium activity measurement of water samples using liquid scintillation counter and electrolytical enrichment. In Proceedings of the 8th Symposium of the Croatian Radiation Protection Association, Krk, Croatia, 13–15 April 2011; Krajcar Bronić, I., Kopjar, N., Milić, M., Branica, G., Eds.; HDZZ: Zagreb, Croatia, 2011; pp. 461–467. [Google Scholar]
  52. Coplen, T.B. Guidelines and recommended terms for expression of stable isotope-ratio and gas-ratio measurement results. Rapid Commun. Mass Spectrom. 2011, 25, 2538–2560. [Google Scholar] [CrossRef] [PubMed]
  53. IAEA. Stable Isotope Hydrology: Deuterium and Oxygen-18 in Water Cycle; Technical Reports Series 210; Gat, J.R., Gonfiantini, R., Eds.; IAEA: Vienna, Austria, 1981; p. 339. [Google Scholar]
  54. Brand, W.A.; Coplen, T.B.; Vogl, J.; Rosner, M.; Prohaska, T. Assessment of International Reference Materials for Isotope-Ratio Analysis (IUPAC Technical Report). Pure Appl. Chem. 2014, 86, 425–467. [Google Scholar] [CrossRef]
  55. Craig, H. Isotope variations in meteoric waters. Science 1961, 133, 1702–1703. [Google Scholar] [CrossRef]
  56. Dansgaard, W. Stable isotopes in precipitation. Tellus 1964, 16, 436–468. [Google Scholar] [CrossRef]
  57. Dansgaard, W. The isotope composition of natural waters. Medd. Grønland 1961, 165, 120. [Google Scholar]
  58. Mook, W.G. Environmental Isotopes in the Hydrological Cycle, Principles and Applications, Volumes I, IV and V; Technical Documents in Hydrology 39; IAEA-UNESCO: Paris, France, 2001. [Google Scholar]
  59. Gat, J.R.; Carmi, I. Evolution of the Isotopic Composition of Atmospheric Waters in the Mediterranean Sea Area. J. Geophys. Res. 1970, 75, 3039–3048. [Google Scholar] [CrossRef]
  60. Gat, J.R.; Shemesh, A.; Tziperman, E.; Hecht, A.; Georgopoulos, D.; Basturk, O. The stable isotope composition of waters of the eastern Mediterranean Sea. J. Geophys. Res. 1996, 101, 6441–6451. [Google Scholar] [CrossRef]
  61. Crawford, J.; Hughes, C.E.; Lykoudis, S. Alternative least squares methods for determining the meteoric water line, demonstrated using GNIP data. J. Hydrol. 2014, 519, 2331–2340. [Google Scholar] [CrossRef]
  62. Hughes, C.E.; Crawford, J. A new precipitation weighted method for determining the meteoric water line for hydrological applications demonstrated using Australian and global GNIP data. J. Hydrol. 2012, 464, 344–351. [Google Scholar] [CrossRef]
  63. IAEA. Statistical Treatment of Environmental Isotopes in Precipitation; Technical Report Series 331; IAEA: Vienna, Austria, 1992; p. 781. [Google Scholar]
  64. ANSTO. Australian Nuclear Science and Technology Organisation. Local Meteoric Water Line Freeware. 2012. Available online: https://openscience.ansto.gov.au/collection/879 (accessed on 28 November 2019).
  65. Dolinar, M.; Vertačnik, G. Spremenljivost temperaturnih in padavinskih razmer v Sloveniji. In Okolje se Spreminja: Podnebna Spremenljivost Slovenije in Njen Vpliv na Vodno Okolje; Cegnar, T., Ed.; Ministry of Environment: Ljubljana, Slovenia, 2010; pp. 37–42. ISBN 978-961-6024-55-6. [Google Scholar]
  66. NASA. Available online: https://www.nasa.gov/press-release/nasa-noaa-data-show-2016-warmest-year-on-record-globally/ (accessed on 19 August 2020).
  67. Global Temperature Vital Signs—Climate Change: Vital Signs of the Planet. Available online: https://climate.nasa.gov/vital-signs/global-temperature/ (accessed on 19 August 2020).
  68. Bastin, J.F.; Clark, E.; Elliott, T.; Hart, S.; van den Hoogen, J.; Hordijk, I.; Ma, H.; Majumder, M.; Manoli, G.; Maschler, J.; et al. Understanding climate change from a global analysis of city analogues. PLoS ONE 2019, 14, e0217592. [Google Scholar] [CrossRef] [Green Version]
  69. Barešić, J.; Horvatinčić, N.; Krajcar Bronić, I.; Obelić, B.; Vreča, P. Stable isotope composition of daily and monthly precipitation in Zagreb. Isot. Environ. Health Stud. 2006, 42, 239–249. [Google Scholar] [CrossRef]
  70. Geyh, M.A. Basic studies in hydrology and 14C and 3H measurements. In General Proceedings of the 24th International Geological Congress, The 24th International Geological Congress, Montreal, QC Canada, 21–20 August 1972; Armstrong, J.E., Ed.; International Geological Congress: Montreal, QC, Canada, 1973; Volume 11, pp. 227–234. [Google Scholar]
Figure 1. Map of Croatia and the position of the study area: Zagreb (Zg), Plitvice Lakes (PL), and Zadar (Zd).
Water 12 02414 g001
Figure 2. Sampling locations: (a) along the water course (top view); (b) along the profile. For an explanation of the location codes, see Table 1.
Water 12 02414 g002
Figure 3. (a) Monthly mean temperatures at the Plitvice Lakes meteorological station in the three periods when data are available; (b) mean annual temperatures at the Plitvice Lakes in 1986–2019 (only years with complete data for 12 months are shown).
Water 12 02414 g003
Figure 4. (a) Monthly mean precipitation amount at the Plitvice lakes meteorological station in the three periods when data are available; (b) annual precipitation amounts at the Plitvice Lakes in 1986–2019 (only years with complete data for 12 months are shown).
Water 12 02414 g004
Figure 5. Tritium activity concentration in the precipitation at Zagreb and Plivice Lakes for the 1978–1984 and 2003–2006 periods.
Water 12 02414 g005
Figure 6. Stable isotope composition of the precipitation at the Plitvice Lakes (PL) and the LMWLs obtained by the reduced major axis regression (RMA) and precipitation-weighted ordinary least squares regression (PWLSR) methods (Table 3). Local Meteoric Water Lines (LMWLs) for Zagreb (RMA method) and for Zadar (RMA and PWLSR methods) as well as the Global Meteoric Water Line (GMWL)(δ2H = 8 δ18O + 10) are shown for comparison.
Water 12 02414 g006
Figure 7. Deuterium-excess values in the precipitation at Plitvice Lakes, 2003–2006 monthly data, and mean monthly values.
Water 12 02414 g007
Figure 8. Tritium activity concentration in groundwater (CR, BR, and PR springs), 1978–2016. Data for the CR and BR springs in the spring–summer of 2015 are shown in the insert.
Water 12 02414 g008
Figure 9. (a) Comparison of the tritium activity concentration in the Crna Rijeka (CR) and Bijela Rijeka (BR) springs in 1984 and 2015; (b) comparison of the δ2H values in the CR, BR, and Plitvica River (PR) springs in the two periods, 1979–1990 and 2003–2019.
Water 12 02414 g009
Figure 10. The δ2H values in groundwater (CR, BR, and PR springs), 1978–2019. Note the break between 1991 and 2003.
Water 12 02414 g010
Figure 11. Groundwater water line (GWL) for the three springs, all data after 2000, GWL is given by Equation (4). Comparison with the LMWLPWLSR for the Plitvice Lakes (Table 3).
Water 12 02414 g011
Figure 12. (a) Tritium activity concentration in the CR, BR, and PR springs in 1983 and 1984, when extreme hydro-meteorological conditions appeared; (b) flow rates at the CR, BR, and PR springs during 1983–1984. Symbols refer to the maximal flow rates in respective months, and lines represent the mean annual flow rates in 1983 and 1984.
Water 12 02414 g012
Figure 13. (a) δ2H values in the surface waters, 2003–2005, data from [10]; (b) box-plots of δ2H values at the same locations.
Water 12 02414 g013
Figure 14. (a) Seasonal variation in the δ2H of surface and lake waters for 2012–2014. For an explanation of groups (a,b), see text. (b) Box-plots of δ2H values at the same locations.
Water 12 02414 g014
Figure 15. A relation of δ2H vs. δ18O for the surface and lake waters at the Plitvice Lakes, 2011–2014. SWL and LWL are shown (Table 4), as well as LMWLPWLSR for the Plitvice Lakes.
Water 12 02414 g015
Figure 16. A relation of the δ18O vs. water temperature for lake waters, 2012–2014. Group a: after heavy summer rains; group b: after abundant winter precipitation and snow melting.
Water 12 02414 g016
Table 1. List of sampling locations, their codes, and the types of water body samples.
LocationCodeSample TypeComment
Plitvice LakesPLprecipitationstudy area
ZagrebZgprecipitationcomparison location
ZadarZdprecipitationcomparison location
Crna Rijeka RiverCRgroundwaterspring
Bijela Rijeka RiverBRgroundwaterspring
Plitvica RiverPRgroundwaterspring
MaticaMasurface water
Lake ProšćanskoLPsurface water
Lake CiginovacLCsurface water
Lake BurgetLBsurface water
Burget—WaterfallBWsurface water
Lake Kozjak—BridgesKzBsurface water
Korana River—SastavciKoSsurface water
Korana River—BridgeKoBsurface water
Lake KozjakIRB1lake waterwater depth 6 m
Lake KozjakIRB2lake waterwater depth 8–10 m
Lake ProšćanskoIRB3lake waterwater depth 6 m
Lake GradinskoIRB4lake waterwater depth 2 m
Table 2. Mean annual temperature and annual precipitation amount in the three periods with available meteorological data.
PeriodT (°C)P (mm)
1986–19908.7 ± 0.51480 ± 170
1996–20119.4 ± 0.51580 ± 330
2016–201910.4 ± 0.41745 ± 60
Table 3. Values of slopes (a ± σa) and intercepts (b ± σb) for LMWLs obtained by different regression methods for precipitation at the Plitvice Lakes, Zadar, and Zagreb. OLSR: ordinary least squares regression; RMA: reduced major axis regression; MA: major axis least squares regression; PWLSR, PWRMA, and PWMA: precipitation-weighted respective regressions; n—number of data points included; rmSSEav—average of the root mean square sum of squared errors [60]. In bold: approaches that describe LMWL the best.
Location and PeriodMethodna ± σab ± σbrmSSEav
Plitvice LakesOLSR367.85 ± 0.1212.46 ± 1.231.0016
2003–2006RMA367.88 ± 0.1212.77 ± 1.201.0006
MA367.91 ± 0.1213.06 ± 1.241.0016
PWLSR367.97 ± 0.1213.82 ± 1.321.0000
PWRMA368.00 ± 0.1214.15 ± 1.321.0073
PWMA368.04 ± 0.1214.47 ± 1.321.0162
2003–2005 [10]OLSR247.85 ± 0.1212.46 ± 1.231.0016
ZadarOLSR366.57 ± 0.411.55 ± 2.371.0262
2003–2004RMA366.70 ± 0.403.76 ± 2.311.0100
Data from [19]MA367.43 ± 0.4406.01 ± 2.521.0259
PWLSR367.27 ± 0.505.95 ± 3.031.0000
PWRMA367.84 ± 0.519.23 ± 3.091.0525
PWMA368.44 ± 0.5412.67 ± 3.261.1433
ZagrebOLSR1217.43 ± 0.112.59 ± 0.971.0048
1996–2006RMA1217.52 ± 0.103.35 ± 0.961.0019
[23]MA1217.60 ± 0.114.08 ± 0.981.0047
PWLSR1217.38 ± 0.112.68 ± 0.951.0095
PWRMA1217.47 ± 0.113.44 ± 0.951.0024
PWMA1217.56 ± 0.114.19 ± 0.961.0018
1980–2018 [23]RMA3897.74 ± 0.065.57 ± 0.551.0019
RMWL_cont 2008–2013 [30]OLSR5247.4 ± 0.0054.1 ± 0.5R = 0.99
RMWL_coast 2008–2013 [30]OLSR6557.0 ± 0.084.4 ± 0.5R = 0.96
Table 4. Values of the slopes (a ± σa) and intercepts (b ± σb) for the groundwater line (GWL), surface water lines (SWL), and lake water lines (LWL).
Type of LineSlopeInterceptnrRef.
GWL, 1983–19847.88.513 [7]
RGWL_karst7.04.2340R2 = 0.98[30]
GWL, 2000–20185.7 ± 0.7−10.1 ± 7.3310.84
SWL, 2003–20055.0 ± 0.6−17.3 ± 5.9350.86[10]
SWL, 2011–20146.3 ± 0.3−3.4 ± 2.7870.94
LWL, 2011–20145.8 ± 0.3−9.4 ± 3.0420.95

