Article

A User-Friendly Software Package to Develop Storm Water Management Model (SWMM) Inputs and Suggest Low Impact Development Scenarios

Department of Rural Construction Engineering, Kongju National University, 54 Daehak-ro, Yesan 32439, Korea
*
Author to whom correspondence should be addressed.
Water 2020, 12(9), 2344; https://doi.org/10.3390/w12092344
Submission received: 24 July 2020 / Revised: 17 August 2020 / Accepted: 19 August 2020 / Published: 20 August 2020
(This article belongs to the Section Urban Water Management)

Abstract

:
Increases in imperviousness due to urbanization and industrialization increases stormwater runoff and nonpoint source pollution. Approaches reducing these hydrological impacts include low impact development (LID) methods. Various methods have been developed and applied to date, and an evaluation of stormwater runoff and a reduction of non-point source pollution has been conducted. The Storm Water Management Model (SWMM) is capable of simulating various LID approaches, although selecting and implementing a suitable method for a specific target area, when considering the cost of various low impact development approaches, requires significant time and effort. A software program called Storm Water Management Model–low impact development design program (SWMM-ING), that can be optimally applied to deal with the cost of low impact development methods, was developed in this study. For SWMM-ING, an optimization process was conducted for low impact development, which can reduce stormwater runoff by 10%, suspended solid by 15%, and total phosphorus by 15%. The spatial arrangement and the area of the permeable pavement, bioretention cells, infiltration trenches, and green roofs were determined. Because SWMM-ING has a user-friendly graphical interface, and the optimization process of the low impact development approach is simple and straightforward, it has the advantage of not requiring specialized knowledge.

1. Introduction

Urbanization and industrialization increase the impermeable surface area in the target region and thus increase the amount of stormwater runoff by inhibiting infiltration into the soil layer. At the same time, increased stormwater runoff increases peak flow because the flow rate is faster [1]. In addition, this change in natural rainwater flow must be managed because it changes the behavior of non-point source (NPS) pollution [2]. Accordingly, various low impact development (LID) methods have been developed and applied to the management of stormwater runoff and NPS pollution. Such practices include vegetated swale, vegetated filter strips, rain gardens, tree box filters, planter boxes, green roofs, infiltration trenches, infiltration ditches, infiltration channels, infiltration chambers, and porous pavement [2,3,4,5,6]. Briefly looking at such approaches, vegetated swale is a shallow hydraulic channel planted with vegetation to slow the stormwater runoff and facilitate infiltration; and vegetated filter strips are intended to filter out NPS pollutants by slowing down the stormwater runoff before it reaches the streams. Rain gardens are intended to facilitate infiltration with a detention of stormwater runoff by generating the surface into a recessed shape and after filling the area with soil, which is easily permeable, the surface is covered with vegetation. Tree box filters and planter boxes are containers with planted trees or vegetation applied to increase storage capacity. By adding vegetation to a portion or the entirety of a roof of a building, green roofs are used to store stormwater runoff caused by rainfall within an area corresponding to the foot space of the building. Both infiltration trenches and infiltration ditches are used to induce infiltration by collecting stormwater runoff into a ditch filled with gravel or large aggregate materials. An infiltration channel is composed of a water-permeable material to facilitate infiltration to the side and bottom of the waterway while rainwater runoff flows to the side of the road. An infiltration chamber is an underground reservoir of a stormwater runoff consisting of a permeable bottom surface. Porous pavement facilitates infiltration via water-permeable blocks or water-permeable cement and asphalt concrete and can be applied to a road or parking lot. These methods have in common that they control stormwater runoff for rainfall events through infiltration and detention. However, each approach has a different form and scale, such as the use of fans and surfaces, and thus, in addition to their spatial differences, stormwater runoff and NPS pollution can be controlled only when the hydrological conditions in the target area meet the principle or capacity of each method. In other words, to control stormwater runoff and NPS pollution, a LID practice should be selected after a review of the conditions of the subject area [2,7]. At the same time, before establishing such a method in the target area, the effect of reducing the stormwater runoff and NPS pollution needs to be predicted using a hydrological model [8,9,10,11,12,13,14,15,16].
Therefore, to control stormwater runoff and NPS pollution, different optimization methods and hydrological models have been applied based on the target materials. Using the Storm Water Management Model (SWMM) of the Environmental Protection Agency (EPA) [17], Baek et al. [8] analyzed the relationship between the size and suspended solid (SS) loading reduction effect of six LID practices, including bioretention, and presented effective LID strategies for a target area of 1.25 ha. Chen et al. [9] applied the System for Urban Stormwater Treatment and Analysis Integration (SUSTAIN) model [12] to an 8800 ha area, and optimized three methods for reducing the stormwater runoff: total phosphorus (TP), total nitrogen (TN), SS, and biochemical oxygen demand (BOD). Huang et al. [10] used the SWMM model to predict stormwater runoff reduction in a target area of 140.06 ha, including 75.45 ha of residential land. By considering the establishment cost, annual maintenance cost, and life cycle of eight LID practices including permeable pavements, they presented an optimized scenario using the simulated annealing algorithm [7]. Kaini et al. [11] applied five approaches including a detention pond to a target area of 118,900 ha and applied the genetic algorithm [18] to suggest an optimal scenario for a reduction of sediment, nitrogen, and phosphorus load. Liu et al. [13] optimized nine approaches including a retention pond by using the multi-algorithm genetically adaptive multi-objective method [19] to reduce six pollutants including TN in a target area of 5129 ha using Long-Term Hydrologic Impact Assessment-Low Impact Development 2.1 [6]. While applying the Spreadsheet Tool for the Estimation of Pollutant Load [20] model to a web-based approach, Park et al. [14] proposed a cost-effective scenario for a target area of 12,910 ha by considering the establishment cost, annual maintenance cost, and life cycle for a reduction of NPS pollution [21]. By improving the SWAT model, Seo et al. [15] made it possible to simulate three LID practices, including a rain garden, and simulated the stormwater runoff, TP, and NO3 reduction effects in a target area of 350 ha. In addition, Zhang et al. [16] optimized the development scale of a low impact approach by adding a non-dominated Sorted Genetic Algorithm-II [22] subroutine to the SWMM model.
While these studies developed and/or provided the approaches to select LIDs for stormwater runoff and nonpoint source pollution, these approaches still require profound knowledge on model and optimizing module settings. And these limitations might lead the approaches to be challenging on other area applications. Therefore, the requirements to derive the optimal scenario for LID requires: (1) a hydrological model that can simulate the behavior of various NPS pollutions requiring management of the stormwater runoff in the target area is needed. (2) This hydrological model should be able to reflect the characteristics and application conditions of various approaches. (3) In addition, the effect of reducing the stormwater runoff and NPS pollutants according to the spatial arrangement within the target area should be simulated for each method. (4) A cost analysis should be conducted according to the application of each approach, (5) and the effect of reducing the stormwater runoff and NPS pollutants for each method should be optimized based on cost, as well as for educational purposes and practical use by the design companies. (6) The optimization process of a LID method requires simplicity for use by non-experts, and at the same time (7) the overall process for simulation of stormwater runoff and a reduction of NPS pollutants by LID practices should be developed and provided in the software. Therefore, this study was aimed at the development of software that can build model input data and optimize LID practice to improve its usability in both education and practice.

2. Materials and Methods

2.1. Study Area Description and Stormwater Sampling

To demonstrate the process of building input data for the SWMM model using geographical information and the optimization of the LID method, an impervious-dominant area was chosen as the subject area and the runoff and NPS pollutants were monitored. The study area, located in Chuncheon-si, Gangwon-do (37°53′01” N, 127°43′26” E), has a total area of 6.6925 ha. By using the digital elevation model of the National Geographic Information Institute (scale at 1:5000), a soil map from the National Institute of Agricultural Sciences (scale at 1:25,000), and land use data from the Environmental Geographic Information Service (scale at 1:5000), geographic information data were constructed. Moreover, the area was divided into 21 sub-catchments based on the conduits and junctions for the drainage of stormwater runoff in the study area (Figure 1 and Table 1). The ratio of the impervious area in each sub-catchment ranged from 48.37% (sub-catchment 4) to 100.00% (sub-catchment 8, 9, 11, 17), and 85.08% of the study area consists of impervious material.
For calibration and testing of the SWMM model, the stormwater runoff, the SS, and the TP were monitored twice at the end of the drainage conduit. The calibration process was monitored at five min intervals from 21:15 on a March 2018 to 9:00 on 5 March 2018, and 142 samples of stormwater runoff data were collected. Monitoring of the test process was conducted at five min intervals from 4 April 2018, 13:50 to 5 April 2018, 1:55, and 146 samples of stormwater runoff data were collected. The total rainfall during the calibration process was 14.0 mm, and the range of stormwater runoff was 0.0021–0.0888 m3/s. The total rainfall during the validation process was 22.2 mm and the range of stormwater runoff was 0.0020–0.1484 m3/s. Furthermore, the SS and TP were monitored every 30 min for each rainfall event, and 12 samples were collected.

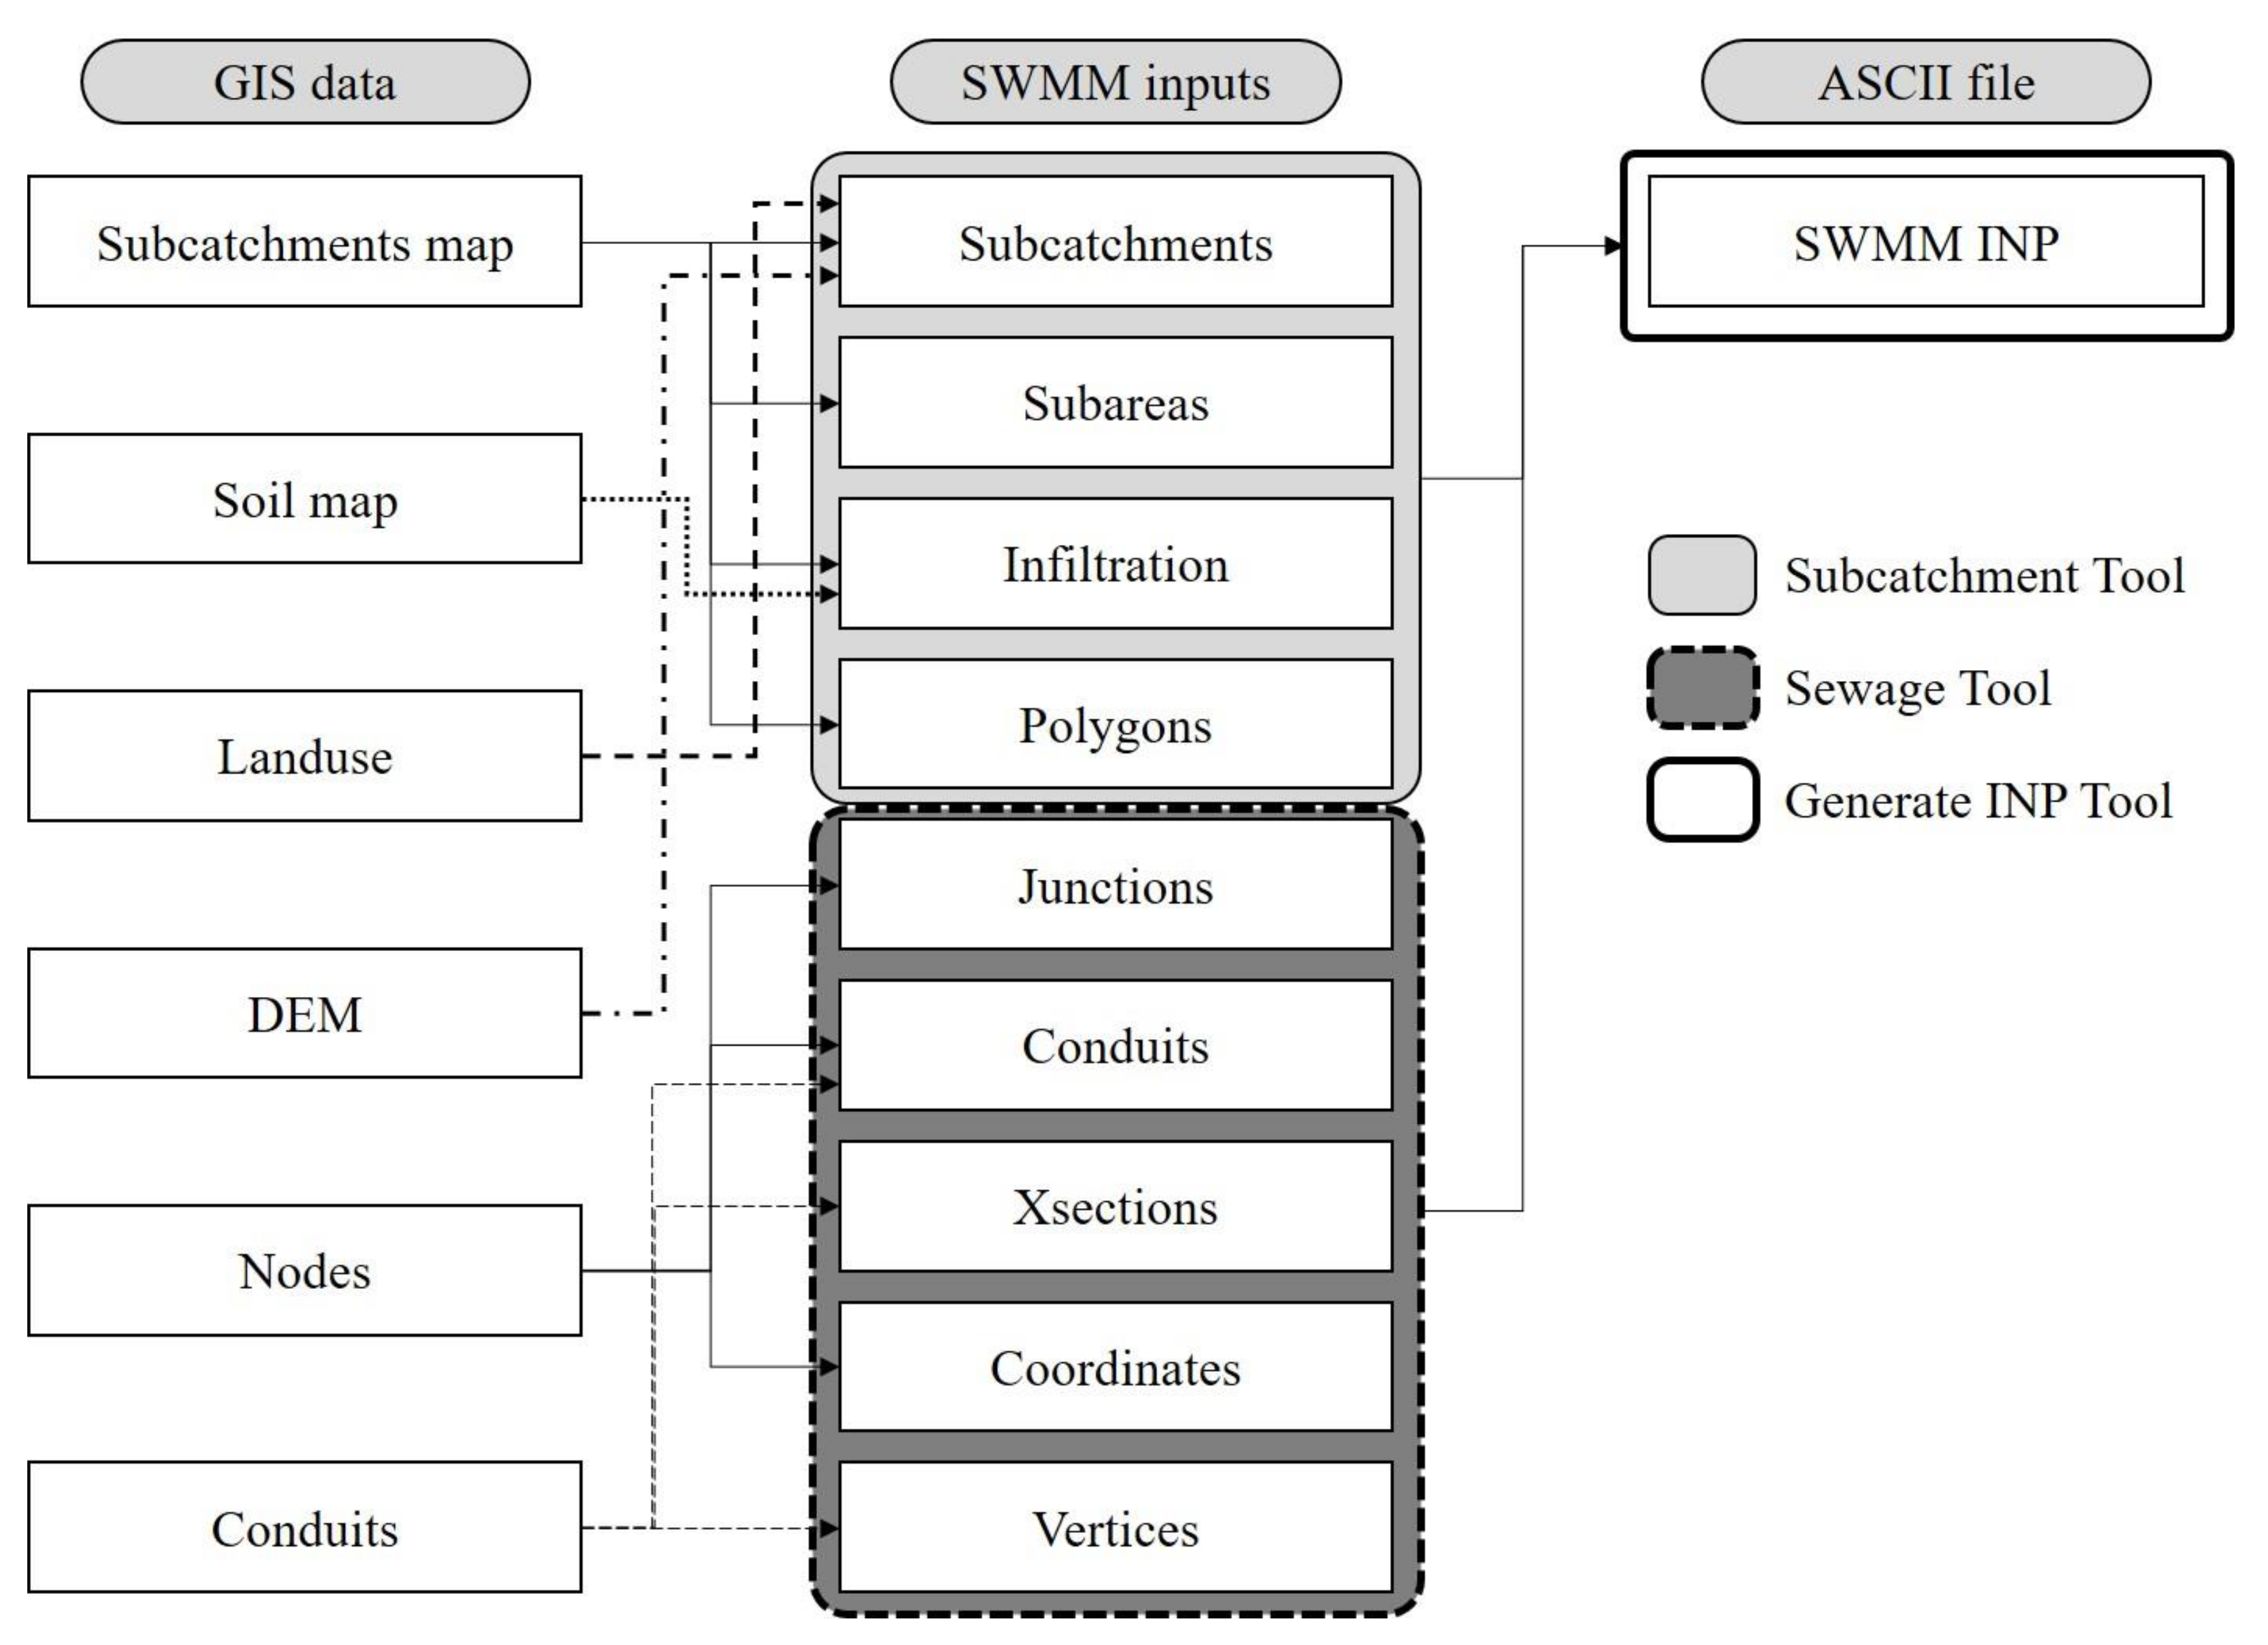
2.2. SWMM Model Description and Input Preparation Using Geographical Information System (GIS) Data

The SWMM model can predict the stormwater runoff and NPS pollution behavior and simulate a LID method. Hydrological characteristics such as stormwater runoff, groundwater, and evaporation caused by rainfall and pipe networks, such as water pipes and waterways, in the simulated area can be considered [17]. This model has been used for an analysis of the runoff volume and peak flow during rainfall for a single rainfall event [23,24], an analysis of stormwater runoff, and a behavior analysis of the NPS pollutant s(SS, TP, and biochemical oxygen demand) [25,26], as well as of the effects of the LID method [8,10,27,28,29,30,31].
For these hydrological impact simulations, the model has several compartments: atmosphere, land surface, groundwater, and transport compartments. The atmosphere compartment generates precipitation and deposits onto the land surface compartment, requiring precipitation and evapotranspiration data. The land surface compartment simulates infiltration and transportation of stormwater runoff, receiving precipitation from the atmosphere compartment and sending the outcomes to the groundwater and transport compartments. This land surface compartment requires data on sub-catchment area, average slope, land surface roughness, etc. The groundwater compartment includes the hydrological process under the soil surface, receiving infiltration from the land surface compartment and sending the outcomes to the transport compartment. The transport compartment is to simulate the hydrological process using conveyance elements such as channels and pipes [32]. Therefore, the input data required for SWMM model applications are physiographical, hydro-meteorological, and hydraulic.
The input data of the SWMM model consists of Sub-catchments, Subareas, Infiltration, Polygons, Junctions, Conduits, X-sections, Coordinates, and Vertices. In the Sub-catchment item, input data such as imperviousness, width, and slope for the sub-catchment are required. The Subareas, Infiltration, and Polygon items require input data such as roughness, suction head, conductivity, and initial deficit of the sub-catchment, respectively. In addition, the Junctions, Conduits, X-sections, Coordinates, and Vertices require input data for the shape or coordinates of the junction and conduit in the target area. Although these input data may be prepared by the user at the interface of the SWMM model, they can also be prepared using GIS data. In other words, in the SWMM model, input data for the Sub-catchment, Subarea, Infiltration, and Polygon items requires information such as imperviousness, width, slope, roughness, infiltration rate, and coordinates of each sub-catchment. These can be extracted from geographic information data such as sub-catchment feature layer, soil map, land use, and digital elevation model (DEM). Input data on the Junctions, Conduits, X-sections, Coordinates, and Vertices that require information such as length, initial and maximum flows, and type of pipe for the nodes and conduits, can be constructed using a sewer network map for the target area (Table 2). Thus, ArcGIS (v10.3; Esri, Redlands, CA, USA [33])-based tools were developed in the study to prepare SWMM model inputs using GIS data.

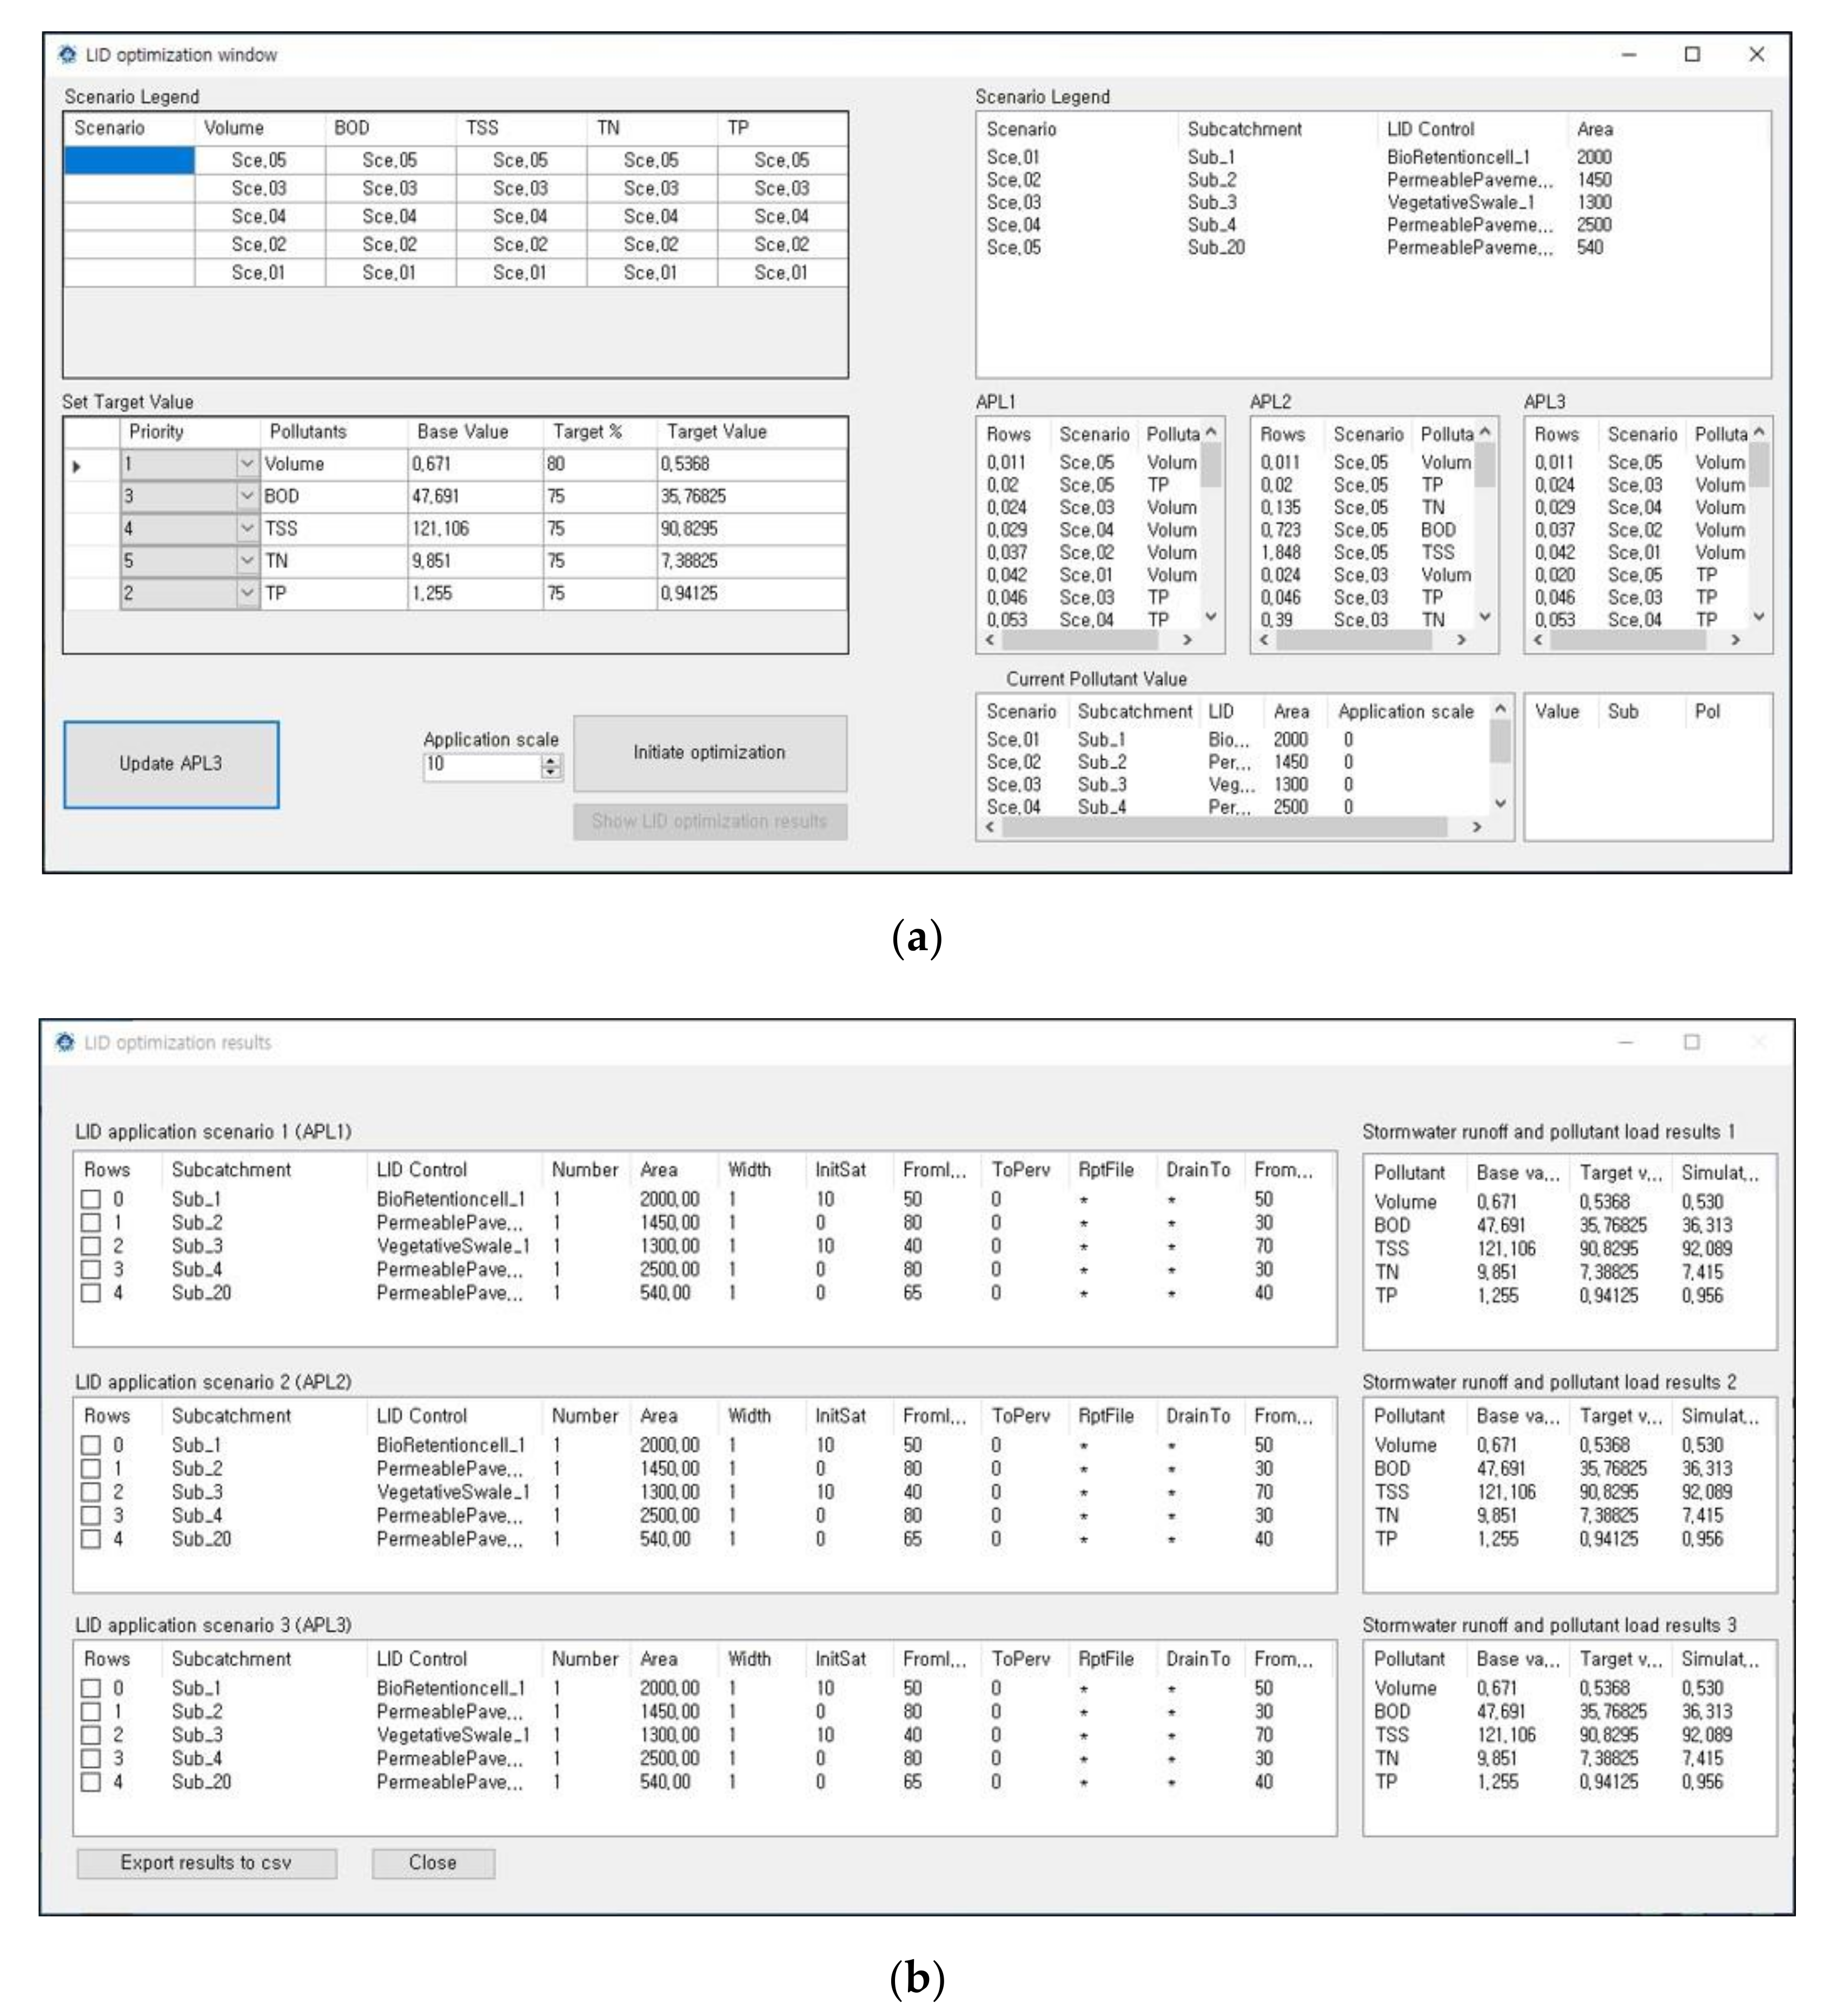
2.3. Optimizing Approach for LIDs

For an efficient application of the method used to reduce the stormwater runoff and NPS pollution, the cost according to the type and scale of the approach applied to the target area needs to be determined. Carrying out this process requires significant time and effort, and thus an optimization algorithm such as a genetic algorithm has been applied [11,12,16]. Optimization of LID methods may be achieved through this sophisticated approach; however, Park et al. [14] suggested a simple and quick optimization method using the least cost per unit mass reduction (i.e., dollars per ton of reduction). Each method for reducing a NPS of pollution calculates the cost for reducing the unit mass (e.g., 1 ton, 1 kg, 1 g, etc.), and the status of the target load is determined as the size of the application increases, starting with low cost methods. This method determines the selection and size of the practice based on the relationship between the reduction and cost of a specific NPS pollution. It can help users understand the optimization process. However, in the study by Park et al. [14], the practice for reducing only one NPS pollution can be optimized. For example, when analyzing a scenario of reduction for total phosphorus and total nitrogen, a scenario that can reduce the two sources of NPS pollution at the same time is not presented. Therefore, this study enabled the process of simultaneously optimizing multiple NPS pollution reduction approaches by improving the optimization method suggested by Park et al. [14]. To achieve this, it was necessary to improve the optimization method, which became more sophisticated as shown in Figure 2.
As shown in Figure 2, when the LID type is applicable to each sub-catchment by the user, the maximum applicable area (MAAi,j) of LIDi for the sub-catchment (SCHj), and the pollutant (PTk, i.e., any pollutant such as SS, TP, etc.) reduction efficiency of LIDi (PREi,k), are defined by the user in Step 1, and the SWMM model is driven by applying one LID selected by the user to each sub-catchment. Here, MAA is an area of LID, and cannot exceed the area of sub-catchment. For example, if MAA of permeable pavement is the same as sub-catchment area, it means that the entire area of sub-catchment is paved with permeable materials. This step aims to simulate the stormwater runoff and NPS pollution reduction for the entire target area when one LID is applied to one sub-catchment. The SWMM model is driven by the product of the number of sub-catchments applicable to the LID and the number of LIDs applicable to each sub-catchment.
In Step 2, when LIDi is applied to the SCHj based on the simulation results in Step 1, the stormwater runoff and NPS pollution reduction are calculated. To review the effectiveness of the LID, the annual cost of each LID needs to be defined. In Step 3, the annual cost for LIDi is defined by Equation (1) [21] by using the establishment cost for LIDi(Cest,i), the annual maintenance cost for LIDi(Cmtn,i), the interest rate (IR, %), and the life cycle for LIDi (LCi, year).
Annual   cos t   for   LID i = C est , i × 1 + IR LC i + C mtn , i × i = 1 LC i 1 + IR i 1 LC i
In Step 4, by using the stormwater runoff and NPS pollution reduction in Step 2 and the annual cost for LIDi in Step 3, each cost (Annual cost for unit PTk load and Runoff volume reduction by LIDi at SCHj j; COSTi,j,k) for a unit mass reduction of the stormwater runoff and NPS pollution by LIDi in the SCHj is defined. That is, COSTi,j,k is the cost of a combination of the LID, sub-catchment, stormwater runoff, and reduction of each NPS pollutant. Thus, looking at the entire target area in Step 4, the cost required to reduce a certain NPS pollutant when applying a certain LID to a sub-catchment is defined. In addition, with the COSTi,j,k, a two-dimensional array of stormwater runoff and NPS pollution can be defined. Figure 3 shows an example of this two-dimensional array definition. Here, COSTR,L3,S1 refers to the cost of reducing the stormwater runoff 1 ×10⁶ L when LID practice 3 (L3, e.g., permeable pavement or bio-retention cell) is applied to sub-catchment 1. In addition, COSTP1,L4,S3 means the cost required to reduce 1 kg of NPS pollution (P1, e.g., BOD or TN) when LID practice 4 is applied to sub-catchment 3. Here, each column sorts the cost for reducing the stormwater runoff or NPS pollution in ascending order. It shows information on which LID practice can be applied at low cost and on which sub-catchment. For example, column 1 shows the cost for a stormwater runoff, and applying LID practice 3 to sub-catchment 1 requires the least cost. The second-lowest cost means applying LID practice 2 to sub-catchment 5. In other words, the row in each column indicates the priority for the combination of LID method and sub-catchment for stormwater runoff and NPS pollution reduction based on the annual cost. In Figure 3, the cell colors are to supplement Figure 4 as an example: the blue tones are priority 1, the yellow tones are priority 2, and the green tones are priority n. The cell with lighter tones at the same priority level has lower annual cost than the cell with darker tones.
In Step 5, the order of applying LID that prioritizes the combination for achieving a low cost is determined based on COSTi,j,k. The order of the application is defined by three approaches. LID application list 1 (APL1) determines the order of the application by reflecting the aforementioned priority condition, and LID application list 2 (APL2) determines the order of the application when not reflecting the priority condition. In other words, for APL1, COSTi,j,k in Priority 1 (from Figure 3 to Row 1) is included in the list in the least expensive order first, and COSTi,j,k in Priority 2 (from Figure 3 to Row 2) is then included in the list sequentially, also in the order of least expensive first. However, in APL2, this priority condition is not reflected, and is included in the list in order of low to high cost for all values of COSTi,j,k. In addition, there may be a condition (stormwater runoff or NPS pollution) that should be prioritized in the target area, and thus, for LID applying list 3 (APL3), a list is defined in the same way as for APL2 by using the order of the stormwater runoff or NPS pollution that should be given priority by the user.
For example, when COSTi,j,k, which is an annual cost in Figure 3, is “COSTP1,L1,S7 (minimum cost) < COSTP2,L2,S1 < COSTP2,L3,S2 < COSTR,L3,S1 < COSTP1,L4,S3 < COSTR,L2,S5 < COSTPn,L4,S1 < COSTPn,L1,S2 < COSTP1,Ln,Sn < COSTP2,Ln,Sn < COSTR,Ln,Sn < COSTPn,Ln,Sn (maximum cost),” in APL1, combinations of LID practice and sub-catchment in Row 1 (Priority 1) of Figure 3 are added to the list first, and Row n is then added to the list sequentially. In APL2, the list is defined in order of annual cost regardless of the priority condition. In addition, if the user defines the reduction target in order of “Pollutant 2 (column 3)–Runoff (column 1)–Pollutant 2 (column 2)–Pollutant n (column n)”, for example, the combinations of LID practice and sub-catchment, which apply to this order, are added to the list sequentially (Figure 4). In short, COSTs are to define cost-effective LIDs which were defined by LID type, location, reduction efficiency, and annual cost. APLs are lists to apply more cost-effective examples in advance of less cost-effective examples.
Steps 6 and 7 are driven by APL1, APL2, and APL3. During these steps, the size of LIDi for the SCHj increases until the target reduction is achieved. Steps 6 and 7 are not applied to the SWMM model for each LID but determine whether to achieve a target reduction while sequentially applying the low cost LID combination.

3. Results and Discussion

3.1. Interfaces of User-Friendly Software Package for SWMM Model

This study aimed at developing software for the overall process of optimizing LID practice using the SWMM model. To be specific, by using the Storm Water Management Model–Low Impact Development Design Program for ArcGIS (SWMM-ING-GIS), which aims to create input data for the SWMM model by using a GIS file in ArcGIS software, along with the SWMM model, the Storm Water Management Model–Low Impact Development Design Program (SWMM-ING) was developed in this study to optimize LID practice.
SWMM-ING-GIS, which aims to provide user convenience during the process of building the input data of the SWMM model, is an ArcGIS-based tool that can convert the sub-catchment, soil map, land use, nodes, conduits, and raster layer type of digital elevation model (DEM) data into the SWMM model input data (Figure 5). It consists of three tools programmed in ArcPy (v10.3; Esri, Redlands, CA, USA [33]). The first, Sub-catchment Tool, is used to create Sub-catchments, Subareas, Infiltration, and Polygon items for the input data of the SWMM model using the user’s sub-catchments, soil map, land use, and DEM. The second, Sewage Tool, is used for creating the Junction, Conduits, X-sections, Coordinates, and Vertices items for the input data of the SWMM model using feature layer data containing information regarding the user nodes and conduits. Finally, the third, Generating INP Tool, is used to create a text file conforming to the format of the INP file requiring the information extracted from the sub-catchment and sewage tools in the SWMM model (Figure 6).
SWMM-ING, which is used to simulate the LID optimization scenario, is largely composed of two interface groups (Figure 7 and Figure 8). The first major interface window is for entering the specifications, costs, and sub-catchments subject to installation for each LID practice (Figure 7a). When an input data file capable of driving the SWMM model is selected, information on the sub-catchments is automatically extracted along with output to the sub-catchments list. In addition, information on the specifications and costs for the LID method to be applied to the target area were made for input by the user (Figure 7b), and the sub-catchment to which each LID practice can be applied, along with the applicable area, were allowed to be inputted (Figure 7c). In particular, the interface for entering the details related to the LID method and sub-catchment application (Figure 7b,c) are intended to make the system more convenient to users by configuring it in the same way as the interface of the SWMM model. When the input data of the SWMM model are selected and information regarding the LID is inputted by the user, simulations for the case in which the LID is not applied and for a combination of the LID and sub-catchment are possible. In other words, this step corresponds to Steps 1 and 3 in Figure 2. The calculation of the reduction of the stormwater runoff and NPS pollution by the combination of the LID and sub-catchment (Step 2 in Figure 2 and Figure 7d), and the cost calculation of the reduction (Step 4 in Figure 2 and Figure 7e), are carried out through the simulation.
The second major interface window of SWMM-ING outputs the combination of the LID and sub-catchment, which need to first be applied based on the cost and reduction through the interface window, and repeatedly simulated by accumulating this combination. This consists of the interface window (Figure 8a) corresponding to Steps 5–7 of Figure 2, and the interface window (Figure 8b), which is the output of the results of the optimization scenario. The optimization scenario was made not only for output through its own interface window (Figure 8b), but also in a comma separated value (CSV) file format compatible with Microsoft Excel, for user convenience.

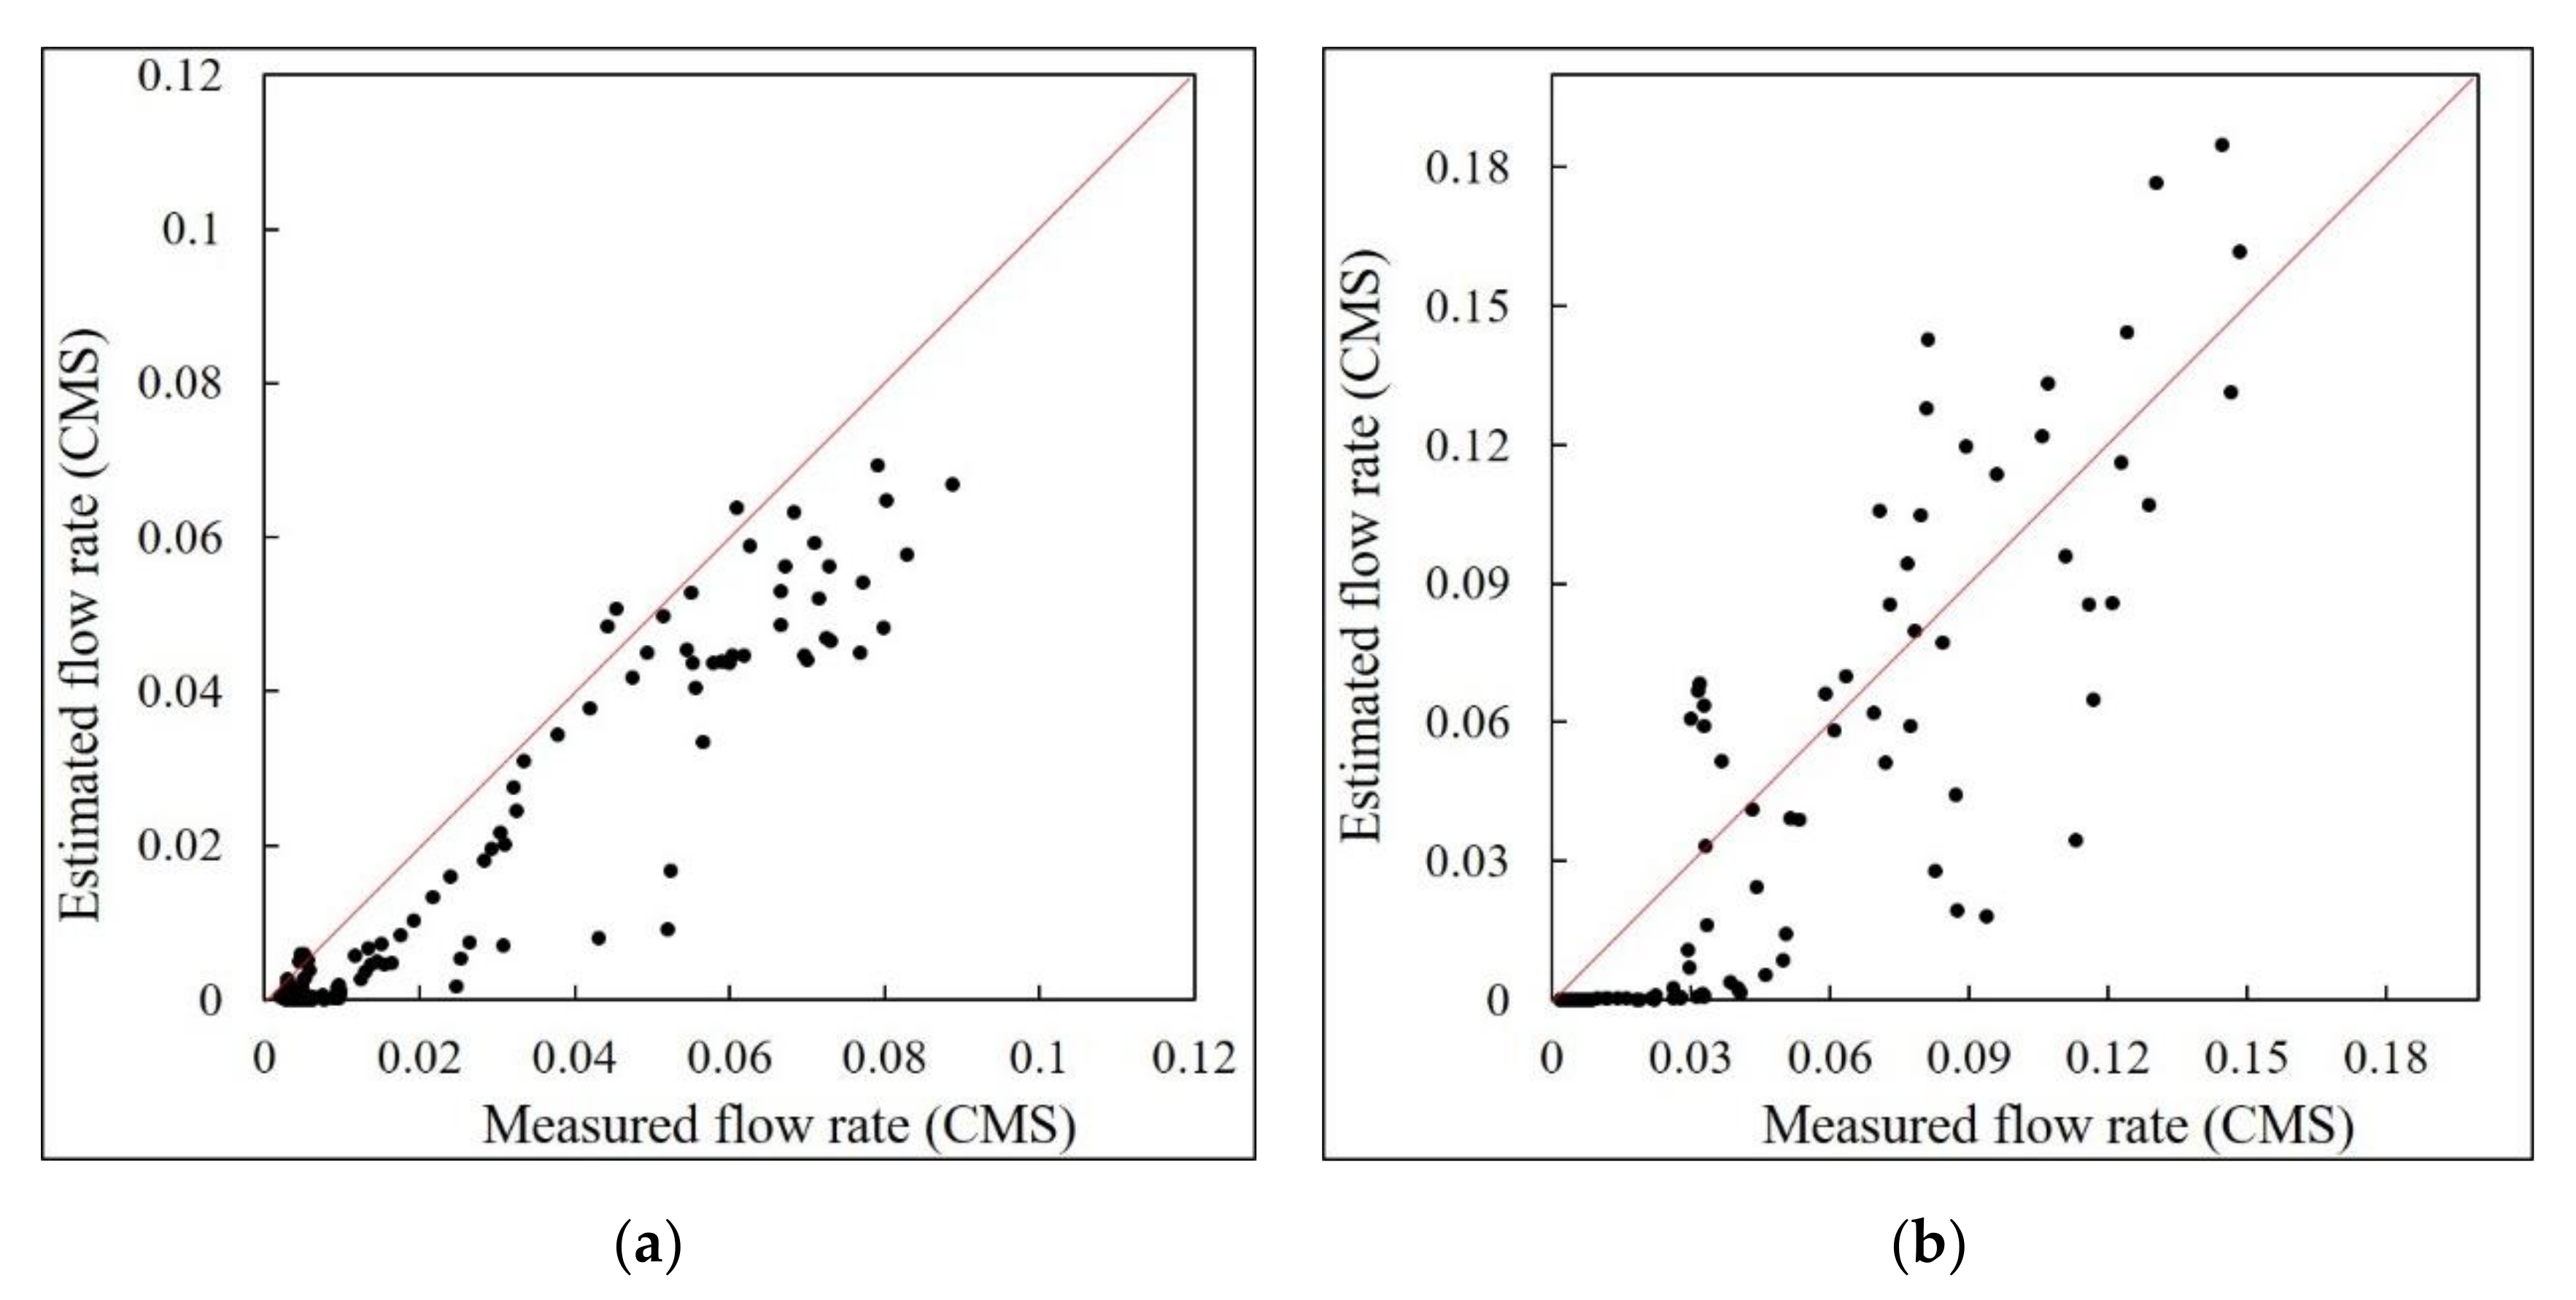
3.2. Calibration and Validation of SWMM Model

When comparing the measured values for the stormwater runoff with the values estimated by the hydrological model, Engel et al. [34] and Moriasi et al. [35] suggested that the results of the calibration and testing for the hydrological model can be satisfied when the Nash Sutcliffe efficiency (NSE) is more than 0.5, the coefficient of determination (R2) is more than 0.6, and the percentage bias (PBIAS) is ±15% in a daily estimation.
Because this study estimates the stormwater runoff for a small single-storm event with a shorter time interval rather than the daily estimation, the NSE, R2, and satisfaction with the calibration and validation results of the SWMM model were determined using a scatter plot. When comparing the estimate for a stormwater runoff with the actual measurement value, the NSE during the calibration process was 0.7902 and R2 was 0.9099 (4–5 March 2018). During the validation process (4–5 April 2018), the NSE was 0.6788 and R2 was 0.7740. Thus, the calibration and validation of the SWMM model for the stormwater runoff in the target area was determined to have been carried out well (Figure 9). Regarding the calibration and testing of the SWMM model for the stormwater runoff, the estimated and actual measurement values were compared for each measurement time, although reasonable results could not be obtained during the calibration and validation process of the SWMM model when using the SS samples (total of 24) and TP samples (total of 24) collected during the calibration and testing period. The LID scenarios in the study were placed in priority to reduce net pollutant loads (i.e., total amount as kg) during the simulation period, therefore other criteria to accept model calibration were used so that total amounts measured and estimated could be compared. Thus, for the SS and TP, the SWMM model was calibrated and tested to show a difference within ±15% when comparing the measured and predicted values for the total amount (kg) generated during each calibration and test period (Table 3).

3.3. Development of Cost-Effective LID Scenarios

Considering the spatial arrangement and size, as well as the annual cost, of a LID practice, the SWMM-ING developed in this study was applied to the study area to demonstrate the optimal scenario. As the LID methods applicable to the target area, permeable pavement, bioretention cells, infiltration trenches, and green roofs were selected. For the establishment cost, maintenance cost, and life cycle of each LID practice, the values presented by Huang et al. [10] were used (Table 4), and an IR of 4% was applied.
The sub-catchments to which a LID practice can be applied within the target area were numbered as 1, 3, 4, 5, 6, 7, 8, 11, 13, and 15 (Table 5). The target load was defined such that a reduction of 10%, 15%, and 15% is required for the stormwater runoff, SS, and TP load, respectively, when the LID method is not applied. The maximum applicable area (MAA) was set arbitrarily, but to be less than 50% of sub=catchment area. No NPS pollutants requiring priority management were defined for the target area. That is, APL3 was not considered in this example.
These conditions were applied to the SWMM-ING. For APL1 and APL2, two scenarios of LID practice were presented when considering the spatial arrangement of the sub-catchments, the area covered by each LID practice, and the annual cost. In this example, it was found that the application of a LID method by APL2 requires less cost, and thus the scenario under APL2 was determined as an optimal scenario. This scenario suggests that such methods need to be applied to 6 out of 10 sub-catchments, which were defined such that a LID practice can be applied. This suggests that permeable pavement should be applied to sub-catchment 3; bioretention cells and permeable pavement, to sub-catchment 4; infiltration trenches, to sub-catchment 8; green roofs and infiltration trenches, to sub-catchment 11; and permeable pavement, to sub-catchments 13 and 15 (Table 6).
In the application, four LIDs and ten sub-catchments were selected to test the SWMM-ING, and 15 combinations by LIDs and sub-catchments were made. The SWMM-ING applied these combinations until the estimated stormwater runoff, SS, and TP at the end of the drainage conduit met with the target reduction, increasing the LID areas up to MAAs. Therefore, if LID area is the same as the MAA that was set by users, the estimated loads did not meet the target load during the optimizing process. If LID area in the optimized scenario is less than MAA, the estimated loads met the target load in the middle of the LID area-increasing process. In this application, starting with the application that was permeable pavement at sub-catchment 3, the optimizing process finished with the last application, permeable pavement at sub-catchment 11. Although the annual cost of permeable pavement was the cheapest (Table 4), it was more expensive than bioretention cell at sub-catchment 4 not only for annual cost but also for reduction efficiency; therefore, the permeable pavement at sub-catchment 11 was applied after other combinations. This application indicates that there is a need to consider spatial location of LIDs for cost-effective scenarios.

4. Conclusions

In general, urbanization increases the impermeability of a developed area. Thus, it increases the stormwater runoff that occurs during rainfall and subsequently causes changes in hydrological behavior, such as increased NPS pollutant spills. To reduce the effect in a developed area, LID practices that induce an infiltration or detention of stormwater runoff need to be applied. Until recently, such methods have been developed and applied in various forms. The principle and scope of the applications are different; in addition, there is a difference in the ability and cost of reducing stormwater runoff and NPS pollution for each LID practice. Thus, to apply a LID method, efficiency must be increased by using a simulated modeling of the behavior of the stormwater runoff and NPS pollution, and of the solution.
The SWMM model not only meets these objectives, but also includes a graphical user interface, providing convenience to users. However, although it has the advantage of being able to simulate a LID method, numerous simulations for the user are needed to derive a scenario that can minimize the cost by determining the size or placement of the applied approach. Accordingly, in this study, software was developed that can simulate the size and spatial arrangement of the LID method for reducing stormwater runoff and NPS pollution when considering the cost. Further, this study aims to provide convenience to users when designing a LID practice using a SWMM model by developing ArcGIS-based tools that can be optionally used for convenience when constructing the input data.
The SWMM-ING-GIS developed in this study is an optional software that facilitates the process of building input data for the SWMM model when a user has a GIS file. Using a sub-catchments map, soil map, land use, DEM, and sewer network map, the input data of the SWMM model can be prepared immediately and used in the model. In addition, when considering the spatial arrangement, scale, and cost of the LID model, SWMM-ING used for the creation of an optimal scenario for such a method for the target area can apply the input data of the existing SWMM model, regardless of the use of SWMM-ING-GIS. The proposed SWMM-ING model has the following advantages.
  • It provides user convenience by applying a graphical user interface.
  • The existing input data of the SWMM model can be used.
  • Optimization of LID method for stormwater runoff and multiple NPS pollution is possible.
  • Placement based on the size of the applied LID practice and the target area is possible.
  • Annual costs, including establishment cost, maintenance cost, interest rate, and life cycle, are considered.
  • Because the optimization process is not complicated, users will have a clear understanding of the approach.
The free software package developed in this study is expected to be used by design companies requiring a LID practice design, or for education requiring an understanding of the LID practice for control of stormwater runoff and NPS pollution. The software package can be found at “http://npslab.kongju.ac.kr” with the user’s manual.
The software package was developed to provide convenience for the overall process of using the SWMM model to create input data and to optimize LID scenarios. However, one required piece of software (or module) to increase convenience in use of the SWMM model is that for calibrating the model automatically. Thus, there is a need to enhance the software package, employing a sophisticated algorithm or developing an algorithm.

Author Contributions

Conceptualization, Y.S.P.; methodology, Y.S.P.; software, H.L.; investigation, W.W.; data curation, W.W.; writing—original draft preparation, H.L.; writing—review and editing, Y.S.P.; visualization, H.L.; supervision, Y.S.P. All authors have read and agreed to the published version of the manuscript.

Funding

This subject is supported by Korea Ministry of Environment as “The SS (Surface Soil conservation and management) projects; 2019002820001”.

Acknowledgments

The authors send special thanks to the Korea Environmental Industry & Technology Institute for continuous research project support.

Conflicts of Interest

The authors declare no conflict of interest.

References

  1. Shuster, W.D.; Bonta, J.; Thurston, H.; Warnemuende, E.; Smith, D.R. Impacts of impervious surface on watershed hydrology: A review. Urban Water J. 2005, 2, 263–275. [Google Scholar] [CrossRef]
  2. Dietz, M.E. Low impact development practices: A review of current research and recommendations for future directions. Water Air Soil Pollut. 2007, 186, 351–363. [Google Scholar] [CrossRef]
  3. Ahiablame, L.M.; Engel, B.; Chaubey, I. Effectiveness of low impact development practices: Literature review and suggestions for future research. Water Air Soil Pollut. 2012, 223, 4253–4273. [Google Scholar] [CrossRef]
  4. Ahiablame, L.M.; Engel, B.; Chaubey, I. Effectiveness of low impact development practices in two urbanized watersheds: Retrofitting with rain barrel/cistern and porous pavement. J. Environ. Manag. 2013, 119, 151–161. [Google Scholar] [CrossRef]
  5. Line, D.E.; Brown, R.A.; Hunt, W.F.; ASCE, M.; Lord, W.G. Effectiveness of LID for commercial development in North Carolina. J. Environ. Eng. 2012, 138, 680–688. [Google Scholar] [CrossRef]
  6. Liu, Y.; Bralts, V.F.; Engel, B.A. Evaluating the effectiveness of management practices on hydrology and water quality at watershed scale with a rainfall-runoff model. Sci. Total Environ. 2015, 511, 298–308. [Google Scholar] [CrossRef]
  7. Kirkpatrick, S.; Gelatt, C.D.; Vecchi, M.P. Optimization by simulated annealing. Science 1983, 220, 671–680. [Google Scholar] [CrossRef]
  8. Baek, S.S.; Choi, D.H.; Jung, J.W.; Lee, H.J.; Lee, H.; Yoon, K.S.; Cho, K.H. Optimizing low impact development (LID) for stormwater runoff treatment in urban area, Korea: Experimental and modeling approach. Water Res. 2015, 86, 122–131. [Google Scholar] [CrossRef]
  9. Chen, C.F.; Sheng, M.Y.; Chang, C.L.; Kang, S.F.; Lin, J.Y. Application of the SUSTAIN model to a watershed-scale case for water quality management. Water 2014, 6, 3575–3589. [Google Scholar] [CrossRef]
  10. Huang, C.L.; Hsu, N.S.; Liu, H.J.; Huang, Y.H. Optimization of low impact development layout designs for megacity flood mitigation. J. Hydrol. 2018, 564, 542–558. [Google Scholar] [CrossRef]
  11. Kaini, P.; Artita, K.; Nicklow, J.W. Optimizing structural best management practices using SWAT and genetic algorithm to improve water quality goals. Water Resour. Manag. 2012, 26, 1827–1845. [Google Scholar] [CrossRef]
  12. Lee, J.G.; Selvakumar, A.; Alvi, K.; Riverson, J.; Zhen, J.Z.; Shoemaker, L.; Lai, F. A watershed-scale design optimization model for stormwater best management practices. Environ. Model. Softw. 2012, 37, 6–18. [Google Scholar] [CrossRef]
  13. Liu, Y.; Cibin, R.; Bralts, V.F.; Chaubey, I.; Bowling, L.C.; Engel, B.A. Optimal selection and placement of BMPs and LID practices with a rainfall-runoff model. Environ. Model. Softw. 2016, 80, 281–296. [Google Scholar] [CrossRef] [Green Version]
  14. Park, Y.S.; Engel, B.A.; Harbor, J. A web-based model to estimate the impact of best management practices. WATER 2014, 6, 455–471. [Google Scholar] [CrossRef] [Green Version]
  15. Seo, M.; Jaber, F.; Srinivasan, R.; Jeong, J. Evaluating the impact of low impact development (LID) practices on water quantity and quality under different development designs using SWAT. Water 2017, 9, 193. [Google Scholar] [CrossRef]
  16. Zhang, G.; Hamlett, J.M.; Reed, P.; Tang, Y. Multi-objective optimization of low impact development designs in an urbanizing watershed. Open J. Optim. 2013, 2, 95–108. [Google Scholar] [CrossRef] [Green Version]
  17. Rossman, L.A. Modeling Low Impact Development Alternatives with SWMM. J. Water Manag. Model. 2010, 6062, 167–182. [Google Scholar] [CrossRef] [Green Version]
  18. Holland, J.H. Adaptation in Natural and Artificial Systems; MIT Press: Cambridge, MA, USA, 1975. [Google Scholar]
  19. Vrugt, J.A.; Robinson, B.A. Improved evolutionary optimization from genetically adaptive multi-method search. Proc. Nat. Acad. Sci. USA 2007, 104, 708–711. [Google Scholar] [CrossRef] [Green Version]
  20. Tetra Tech, Inc. User’s Guide Spreadsheet Tool for the Estimation of Pollutant Load (STEPL) Version 4.1; Tetra Tech, Inc.: Fairfax, VA, USA, 2011. [Google Scholar]
  21. Arabi, M.; Govindaraju, R.S.; Hantush, M.M. Cost-effective allocation of watershed management practices using a genetic algorithm. Water Resour. Res. 2006, 42, W10429. [Google Scholar] [CrossRef] [Green Version]
  22. Deb, K.; Pratap, A.; Agarwal, S.; Meyarivan, T. A fast and elitist multiobjective genetic algorithm: NSGAII. IEEE Trans. Evolutionary Computation 2002, 6, 182–197. [Google Scholar] [CrossRef] [Green Version]
  23. Barco, J.; Wong, K.M.; Stenstorm, M.K. Automatic calibration of the U.S. EPA SWMM model for a large urban catchment. J. Hydro. Eng. 2008, 134, 466–474. [Google Scholar] [CrossRef]
  24. Choi, K.; Ball, J.E. Parameter estimation for urban runoff modelling. Urban Water 2002, 4, 31–41. [Google Scholar] [CrossRef]
  25. Chow, M.F.; Yusop, Z.; Toriman, M.E. Modelling runoff quantity and quality in tropical urban catchment using Storm Water Management Model. Int. J. Environ. Sci. Technol. 2012, 9, 737–748. [Google Scholar] [CrossRef] [Green Version]
  26. Borris, M.; Viklander, M.; Gustafsson, A.M.; Marsalek, J. Modelling the effects of changes in rainfall event characteristics on TSS loads in urban runoff. Hydrol. Process 2014, 28, 1787–1796. [Google Scholar] [CrossRef]
  27. Temprano, J.; Arango, Ó.; Cagiao, J.; Suárez, J.; Tejero, I. Stormwater quality calibration by SWMM: A case study in Northern Spain. Water SA 2006, 32, 55–63. [Google Scholar] [CrossRef] [Green Version]
  28. Zare, S.O.; Saghafian, B.; Shamsai, A. Multi-objective optimization for combined quality-quantity urban runoff control. Hydrol. Earth Syst. Sci. 2012, 16, 4531–4542. [Google Scholar] [CrossRef] [Green Version]
  29. Goncalves, M.L.R.; Zischg, J.; Rau, S.; Sitzmann, M.; Rauch, W. Modeling the effects of introducing low impact development in a tropical city: A case study from Joinville, Brazil. Sustainability 2018, 10, 728. [Google Scholar] [CrossRef] [Green Version]
  30. Vaillancourt, C.; Duchesne, S.; Pelletier, G. Hydrologic performance of permeable pavement as an adaptive measure in urban area: Case studies near Montreal, Canada. J. Hydro. Eng. 2019, 24, 05019020. [Google Scholar] [CrossRef] [Green Version]
  31. Baek, S.S.; Ligaray, M.; Pyo, J.; Park, J.P.; Kang, J.H.; Pachepsky, Y.; Chun, J.A.; Cho, K.H. A novel water quality module of the SWMNM model for assessing low impact development (LID) in urban watersheds. J. Hydrol. 2020, 586, 124886. [Google Scholar] [CrossRef]
  32. U.S. EPA. Storm Water Management Model User’s Manual Version 5.1; United States Environmental Protection Agency: Cincinnati, OH, USA, 2015. [Google Scholar]
  33. ESRI. ArcGIS for Desktop; Version 10.3; Environmental Systems Research Institute: Redlands, CA, USA, 2015; Available online: http://www.esri.com/ (accessed on 1 July 2020).
  34. Engel, B.; Storm, D.; White, M.; Arnold, J.; Arabi, M. A hydrologic/water quality model application protocol. J. Am. Water Resour. Assoc. 2007, 43, 1223–1236. [Google Scholar] [CrossRef]
  35. Moriasi, D.N.; Gitau, M.W.; Pai, N.; Daggupati, P. Hydrologic and water quality models: Performance measures and evaluation criteria. Am. Soc. Agric. Biol. Eng. 2015, 58, 1763–1785. [Google Scholar] [CrossRef] [Green Version]
Figure 1. Study area.
Water 12 02344 g001
Figure 2. Schematic flow of low impact development (LID) optimization based on annual costs.
Water 12 02344 g002
Figure 3. Example table for COSTi,j,k.
Water 12 02344 g003
Figure 4. Example of APLs.
Water 12 02344 g004
Figure 5. Interface of ArcGIS-based tools developed in the study to prepare SWMM inputs: (a) Sub-catchments Tool; (b) Sewage Tool; (c) Generating INP Tool.
Water 12 02344 g005
Figure 6. Preparation of SWMM INP file using ArcGIS-based tools developed in this study.
Water 12 02344 g006
Figure 7. SWMM interfaces for LID definition: (a) LID and Sub-catchments setting window; (b) LID Control Editor window; (c) LID Usage Editor window; (d) Stormwater runoff and pollutant load result window; (e) Annual cost results window.
Water 12 02344 g007
Figure 8. Storm Water Management Model–low impact development design program (SWMM-ING) interfaces to display LID optimization: (a) LID optimization window; (b) LID optimization results window.
Water 12 02344 g008
Figure 9. Calibration (a) and validation (b) of SWMM model for stormwater runoff.
Water 12 02344 g009
Table 1. Characteristics of sub-catchments.
Sub-catchmentArea (ha)Slope (%)Soil
TotalPerviousImpervious
10.88790.08830.79962.86Silt loam
20.34930.00690.34244.90Loam
30.52360.14000.383620.44Loam
40.53850.27800.260526.88Loam
50.34640.05680.289615.64Loam
60.66010.06350.59664.32Silt loam
70.50750.06510.44249.04Loam
80.17510.00000.17516.80Loam
90.18130.00000.18137.71Loam
100.12410.00710.11703.09Silt loam
110.63020.00000.63023.34Silt loam
120.12750.00460.12293.60Silt loam
130.29800.05260.24543.65Silt loam
140.24430.02070.22363.51Loam
150.38720.09110.29613.53Silt loam
160.17760.04130.13633.20Silt loam
170.04280.00000.04282.91Silt loam
180.07870.01430.06443.90Silt loam
190.17080.03890.13193.45Silt loam
200.10740.00320.10423.43Silt loam
210.13420.02580.10843.44Silt loam
Total6.69250.99825.6943--
Table 2. Description of Storm Water Management Model (SWMM) inputs and Geographical Information System (GIS) data.
SWMM Input ItemsInput DetailsGIS Data
Sub-catchmentsPhysical characteristics of sub-catchment (imperviousness, width, slope, etc.)Sub-catchments map, soil map, land use, digital elevation model (DEM)
SubareaRoughness, etc.Sub-catchments map
InfiltrationSuction head, conductivity, initial deficitSoil map
PolygonsSub-catchment coordinatesSub-catchments map
JunctionsElevation, initial and maximum water depth, etc.Sewer network map
ConduitsInlet and outlet nodes, length, roughness, initial and maximum flowSewer network map
X-sectionsPipe type, pipe size, etc.Sewer network map
CoordinatesNode coordinatesSewer network map
VerticesConduit coordinatesSewer network map
Table 3. SWMM model calibration and validation results for suspended solid and total phosphorus.
Suspended SolidTotal Phosphorus
Measured (kg)Estimated (kg)Difference (%)Measured (kg)Estimated (kg)Difference (%)
Calibration112.5197.47−13.370.550.608.88
Validation146.95167.9014.261.261.10−12.73
Table 4. Establishment cost, maintenance cost, and life cycle of LIDs.
LIDEstablishment Cost ($/m2)Maintenance Cost ($/m2)Life Cycle (Year)Annual Cost ($/m2/Year)
Permeable pavement1200.912014.58
Bioretention cell4700.302550.62
Infiltration trench894.541516.74
Green roof2873.785052.18
Table 5. LID selection for sub-catchments.
Sub-catchment NumberLIDSub-catchment Area (m2)Maximum Applicable Area (MAA) (m2)
1Bioretention cell88791500
1Permeable pavement88794400
3Permeable pavement52362500
4Bioretention cell53851250
4Permeable pavement53852500
5Bioretention cell3464900
6Green roof66011500
6Permeable pavement66013000
7Permeable pavement50753500
8Infiltration trench1751500
11Green roof63023350
11Permeable pavement63022500
13Infiltration trench29801500
13Permeable pavement29801400
15Permeable pavement38721900
Table 6. Optimized LID scenario.
Sub-catchmentLIDLID Area (m2)Annual Cost ($/Year)
3Permeable pavement250036,250
4Bioretention cell125063,275
4Permeable pavement250036,250
8Infiltration trench5008375
11Green roof3350175,306
11Permeable pavement5007,250
13Infiltration trench150025,125
13Permeable pavement140020,300
15Permeable pavement190027,550
Total 15,400399,681

