Evaluation of Different Methods to Assess the Hydraulic Behavior in Horizontal Treatment Wetlands
Abstract
:1. Introduction
2. Materials and Methods
2.1. Full-Scale HSTWs Characterization
2.2. Ks Measurements in the Full-Scale HSTW Bed
2.3. Drainage Experiment
- Vi = s ∙ w ∙ L ∙ h (0, 0) (m3) (initial volume of water for x = 0 and t = 0);
- V* = s ∙ w ∙ L ∙ (h (0, 0)–h (0, t)) + ½ s ∙ w ∙ L2 ∙ tan β (m3) (potential outflow due to drawdown and to the slope);
- V = cumulative drainage volume at any time (m3);
- s = drainable porosity (m3 m−3);
- x = linear distance from the drain (m);
- t = time at which the drainage volume is calculated (s);
- β = slope of the impermeable layer (m m−1);
- L = length of the bed (m);
- w = width of the bed (m);
- Ks = saturated hydraulic conductivity (m min−1);
- h (0, 0) = hydraulic head at x = 0 and t = 0 (m); and
- h (0, t) = hydraulic head at x = 0 and t > 0 (m).
2.4. Tracer Tests
- Mout is the total recovered tracer mass at the outlet (g);
- Min is the total tracer introduced into HSTW (g); and
- Mout was determined in accordance with [30]:
- Q(t) is the outflow rate at time t (m3 h−1);
- C(t) is the tracer concentration at time t at the outlet (mg L−1); and
- t is the sample time (h).
- V (m3) is the volume of the water in the system; and
- Q (m3 h−1) is the water flow rate through the system.
2.5. Wastewater Quality Characterization
- Q (m3 day−1) is the water inflow rate through the system;
- TSS (g day−1) is the amount of TSS, based on the water inflow rate through the system;
- BOD5 (g day−1) is the amount of BOD5 based on the water inflow rate through the system; and
- A (m2) is the wetland surface area.
3. Results
3.1. Ks Measurements in the Full-Scale HSTW Bed
3.2. Drainage Experiment
3.3. Tracer Tests
3.4. Wastewater Quality Characterization
4. Discussion
5. Conclusions
Author Contributions
Funding
Acknowledgments
Conflicts of Interest
References
- Knowles, P.; Dotro, G.; Nivala, J.; García, J. Clogging in Subsurface-Flow Treatment Wetlands: Occurrence and Contributing Factors. Ecol. Eng. 2011, 37, 99–112. [Google Scholar] [CrossRef]
- Dotro, G.; Langergraber, G.; Molle, P.; Nivala, J.; Puigagut, J.; Stein, O.; Von Sperling, M. Treatment Wetlands; IWA Publishing: London, UK, 2017; pp. 1–142. [Google Scholar]
- Langergraber, G.; Dotro, G.; Nivala, J.; Rizzo, A.; Stein, O.R. Wetland Technology Practical Information on the Design and Application of Treatment Wetlands; IWA Publishing: London, UK, 2019; pp. 1–190. [Google Scholar]
- Kadlec, R.H.; Wallace, S.D. Hydrology and Hydraulics. In Treatment Wetlands, 2nd ed.; CRC Press: Boca Raton, FL, USA, 2008; Volume 1, pp. 44–46. [Google Scholar]
- Tang, Y.; Yao, X.; Chen, Y.; Zhou, Y.; Zhu, D.Z.; Zhang, Y.; Zhang, T.; Peng, Y. Experiment research on physical clogging mechanism in the porous media and its impact on permeability. Granul. Matter 2020, 22, 37. [Google Scholar] [CrossRef]
- Caselles-Osorio, A.; Garcia, J. Effect of physico-chemical pretreatment on the removal efficiency of horizontal subsurface-flow constructed wetlands. Environ. Pollut. 2007, 146, 55–63. [Google Scholar] [CrossRef] [PubMed]
- Pedescoll, A.; Uggetti, E.; Llorens, E.; Granés, F.; Garcia, D.; García, J. Practical method based on saturated hydraulic conductivity used to asses clogging in subsurface flow constructed wetlands. Ecol. Eng. 2009, 35, 1216–1224. [Google Scholar] [CrossRef]
- Garcia-Artigas, R.; Himi, M.; Revil, A.; Lovera, R.; Sendrós, A.; Casas, A.; Rivero, L. Time-domain induced polarization as a tool to image clogging in treatment wetlands. Sci. Total Environ. 2020, 724, 138189. [Google Scholar] [CrossRef]
- Stefanakis, A.; Akratos, C.S.; Tsihrintzis, V.A. Vertical Flow Constructed Wetlands: Eco-Engineering Systems for Wastewater and Sludge Treatment; Elsevier: Amsterdam, The Netherlands, 2014; pp. 1–390. [Google Scholar]
- Barreto, A.B.; Vasconcellos, G.R.; von Sperling, M.; Kuschk, P.; Kappelmeyer, U.; Vasel, J.L. Field application of a planted fixed bed reactor (PFR) for support media and rhizosphere investigation using undisturbed samples from full-scale constructed wetlands. Water Sci. Technol. 2015, 72, 553–560. [Google Scholar] [CrossRef]
- Al-Isawi, R.H.K.; Scholz, M.; Wang, Y.; Sani, A. Clogging of vertical-flow constructed wetlands treating urban wastewater contaminated with a diesel spill. Environ. Sci. Pollut. Res. 2015, 22, 12779–12803. [Google Scholar] [CrossRef]
- Sanford, W.E.; Steenhuis, T.S.; Parlange, J.Y.; Surface, J.M.; Peverly, J.H. Hydraulic conductivity of gravel sand as substrates in rock-reed filters. Ecol. Eng. 1995, 4, 321–336. [Google Scholar] [CrossRef]
- Rodgers, M.; Mulqueen, J. Field-saturated hydraulic conductivity of unsaturated soils from falling-head well tests. Agric. Water Manag. 2006, 79, 160–176. [Google Scholar] [CrossRef]
- Suliman, F.; French, H.K.; Haugen, L.E.; Søvik, A.K. Change in flow and transport patterns in horizontal subsurface flow constructed wetlands as a result of biological growth. Ecol. Eng. 2006, 27, 124–133. [Google Scholar] [CrossRef]
- Knowles, P.R.; Davies, P.A. A method for the in-situ determination of the hydraulic conductivity of gravels as used in constructed wetlands for wastewater treatment. Desalin. Water Treat. 2009, 1, 257–266. [Google Scholar] [CrossRef] [Green Version]
- Pedescoll, A.; Samsó, R.; Romero, E.; Puigagut, J.; García, J. Reliability, repeatability and accuracy of the falling head method for hydraulic conductivity measurements under laboratory conditions. Ecol. Eng. 2011, 37, 754–757. [Google Scholar] [CrossRef]
- Naval Facilities Engineering Command. Soil Mechanics. Design Manual 7.01; Naval Facilities Engineering Command: Alexandria, VA, USA, 1986. [Google Scholar]
- Licciardello, F.; Aiello, R.; Alagna, V.; Iovino, M.; Ventura, D.; Cirelli, G.L. Assessment of clogging in constructed wetlands by saturated hydraulic conductivity measurements. Water Sci. Technol. 2019, 79, 314–322. [Google Scholar] [CrossRef] [PubMed]
- Nivala, J.; Knowles, P.; Dotro, G.; Garcia, J.; Wallace, S. Clogging in subsurface-flow treatment wetlands: Measurement, modeling and management. Water Res. 2012, 46, 1625–1640. [Google Scholar] [CrossRef]
- Sanford, W.E. Hillslope Drainage with Sudden Drawdown: Closed Form Solution and Laboratory Experiments. Water Resour. Res. 1993, 29, 2313–2321. [Google Scholar] [CrossRef]
- Bowmer, K.H. Nutrient removal from effluents by artificial wetland: Influence of rhizosphere aeration and preferential flow studied using bromide and dye tracers. Water Res. 1987, 21, 591–599. [Google Scholar] [CrossRef]
- Knowles, P.R.; Griffin, P.; Davies, P.A. Complementary methods to investigate the development of clogging within a horizontal subsurface flow tertiary treatment wetland. Water Res. 2010, 44, 320–330. [Google Scholar] [CrossRef] [Green Version]
- Marzo, A.; Ventura, D.; Cirelli, G.L.; Aiello, R.; Vanella, D.; Rapisarda, R.; Barbagallo, S.; Consoli, S. Hydraulic reliability of a horizontal wetland for wastewater treatment in Sicily. Sci. Total Environ. 2018, 636, 94–106. [Google Scholar] [CrossRef]
- Maloszewski, P.; Wachniew, P.; Czuprynski, P. Study of hydraulic parameters in heterogeneous gravel beds: Constructed wetland in Nowa Slupia (Poland). J. Hydrol. 2006, 331, 630–642. [Google Scholar] [CrossRef]
- Aiello, R.; Bagarello, V.; Barbagallo, S.; Iovino, M.; Marzo, A.; Toscano, A. Evaluation of clogging in full-scale subsurface flow constructed wetlands. Ecol. Eng. 2016, 95, 505–513. [Google Scholar] [CrossRef]
- Keller, C.H.; Bays, J.S. Tracer studies for treatment wetlands. In Treatment Wetlands for Water Quality Improvement; CH2M HILL: Englewood, CO, USA, 2000. [Google Scholar]
- Fisher, P.J. Hydraulic characteristics of constructed wetlands at Richmond, New South Wales, Australia. In Constructed Wetlands in Water Pollution Control; Cooper, P.F., Findlater, B.C., Eds.; Pergamon Press: Oxford, UK, 1990; pp. 21–32. [Google Scholar]
- Marsteiner, E.L. Subsurface Flow Constructed Wetland Hydraulics. Master’s Thesis, Clarkson University, Potsdam, NY, USA, 1997. [Google Scholar]
- Drizo, A.; Frost, C.A.; Grace, J.; Smith, K.A. Phosphate and ammonium distribution in a pilot-scale constructed wetland with horizontal subsurface flow using shale as a substrate. Water Res. 2000, 34, 2483–2490. [Google Scholar] [CrossRef]
- Persson, J.; Somes, N.; Wong, T. Hydraulics efficiency of constructed wetlands and ponds. Water Sci. Technol. 1999, 40, 291–300. [Google Scholar] [CrossRef]
- Whitmer, S.; Baker, L.; Wass, R. Loss of bromide in a wetland tracer experiment. J. Environ. Qual. 2000, 29, 2043–2045. [Google Scholar] [CrossRef]
- American Public Health Association. Standard Methods for the Examination of Water and Wastewater, 21th ed.; American Public Health Association (APHA): Washington, DC, USA, 2005. [Google Scholar]
- Legislative Decree 152, 2006. Decreto Legislativo 3 Aprile 2006, n.152,“Norme in Materia Ambientale” GU n. 88 del 14 Aprile 2006, Supplemento Ordinario n. 96. Available online: http://www.ecostudiomc.it/ecostudiomc/images/NORMATIVA_SITO/Ambiente/DLGS%2003%20aprile%202006%20n%20152%20Testo%20Completo.pdf (accessed on 2 July 2018).
- Pedescoll, A.; Knowles, P.R.; Davies, P.; García, J.; Puigagut, J. A Comparison of In Situ Constant and Falling Head Permeameter Tests to Assess the Distribution of Clogging Within Horizontal Subsurface Flow Constructed Wetlands. Water Air Soil Pollut. 2012, 223, 2263–2275. [Google Scholar] [CrossRef]
- Vymazal, J. Does clogging affect long-term removal of organics and suspended solids in gravel-based horizontal subsurface flow constructed wetland? Chem. Eng. J. 2018, 331, 663–674. [Google Scholar] [CrossRef]
- Correia, G. Assessment of Clogging in Constructed Wetlands. Available online: https://fenix.tecnico.ulisboa.pt/downloadFile/281870113703197/Resumo%20Alargado%20%20-%20V2.pdf (accessed on 2 July 2018).
- Reed, S.C.; Crites, R.W.; Middlebrooks, E.J. Natural Systems for Waste Management and Treatment, 2nd ed.; McGraw Hill: New York, NY, USA, 1995; pp. 173–284. ISBN1 10 0070609829. ISBN2 13 9780070609822. [Google Scholar]
- Matos, M.P.; Barreto, A.B.; Vasconcellos, G.R.; Matos, A.T.; Simões, G.F.; von Sperling, M. Difficulties and modifications in the use of available methods for hydraulic conductivity measurements in highly clogged horizontal subsurface flow constructed wetlands. Water Sci. Technol. 2017, 76, 1666–1675. [Google Scholar] [CrossRef]
- Bodin, H.; Persson, J.; Englund, J.E.; Milberg, P. Influence of residence time analyses on estimates of wetland hydraulics and pollutant removal. J. Hydrol. 2013, 501, 1–12. [Google Scholar] [CrossRef]
- Chazarenc, F.; Gérard, M.; Gontheir, Y. Hydrodynamics of horizontal subsurface flow constructed wetlands. Ecol. Eng. 2003, 21, 165–173. [Google Scholar] [CrossRef]
- Seeger, E.M.; Maier, U.; Grathwohl, P.; Kuschk, P.; Kaestner, M. Performance evaluation of different horizontal subsurface flow wetland types by characterization of flow behavior, mass removal and depth-dependent contaminant load. Water Res. 2013, 47, 769–780. [Google Scholar] [CrossRef]


| Permeameter Cell | Scheme | Symbols |
|---|---|---|
| Impervious, with the material inside (Standpipe) Applicability conditions: Ks represents the vertical hydraulic conductivity of the soil |  | R (0.05 m) and L (0.32 m) are the radius and the submerged length (m) of the tube, respectively, as defined in [17]. H1 and H2 are the water levels (m) in the permeameter cell corresponding to time t1 and t2 (s), respectively. |
| Pervious (for a total area of 3.11 × 10⁻⁴ m2), with the material inside. Applicability conditions: Ks represents both the horizontal and vertical hydraulic conductivity of the soil | 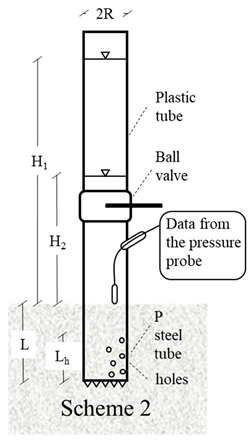 | Rmod (0.049 m) and Lmod (0.20 m) are the radius (m) and the submerged length (m), respectively, as calibrated in [18]. H1 and H2 are the water levels (m) in the permeameter cell corresponding to time t1 and t2 (s), respectively. Lh (0.25 m) is the perforated permeameter length |
| Piezometer | 2018 | 2019 | Reductions of Ks (%) | |||||
|---|---|---|---|---|---|---|---|---|
| Distance from the Inlet (m) | Ks | SD | Ks | SD | Relative to Clean Gravel 1 | In 2019, Relative to 2018 | ||
| (m day−1) | (m day−1) | In 2018 | In 2019 | |||||
| 1 | 8.5 | 3072 | 614 | 420 | 420 | 84 | 98 | 86 |
| 4 | 17 | 6500 | 2397 | 5008 | 1505 | 67 | 74 | 23 |
| 7 | 25.5 | 7310 | 584 | 7258 | 1347 | 62 | 63 | 1 |
| 2 | 8.5 | 4545 | 961 | 225 | 125 | 77 | 99 | 95 |
| 5 | 17 | 10,217 | 2937 | 7049 | 2146 | 48 | 64 | 31 |
| 8 | 25.5 | 5301 | 715 | 3770 | 800 | 73 | 81 | 29 |
| 3 | 8.5 | 2045 | 574 | 1335 | 2212 | 89 | 93 | 35 |
| 6 | 17 | 8449 | 793 | 7468 | 517 | 57 | 62 | 12 |
| 9 | 25.5 | 6309 | 470 | 7285 | 1223 | 68 | 63 | –15 |
| Transect | Ks (m day−1) | Reductions of Ks (%) | |||
|---|---|---|---|---|---|
| Relative to the Clean Gravel 1 | In 2019, Relative to 2018 | ||||
| 2018 | 2019 | In 2018 | In 2019 | ||
| 1-2-3 | 3221 | 660 | 83.5 | 96.7 | 79.5 |
| 4-5-6 | 8388 | 6508 | 56.9 | 66.6 | 22.4 |
| 7-8-9 | 6307 | 6104 | 67.6 | 68.6 | 3.2 |
| Paths | Ks (m day−1) | Reductions of Ks (%) | |||
|---|---|---|---|---|---|
| Relative to Clean Gravel 1 | In 2019, Relative to 2018 | ||||
| 2018 | 2019 | In 2018 | In 2019 | ||
| 1-4-7 | 5627 | 4229 | 71.1 | 78.3 | 24.8 |
| 2-5-8 | 6687 | 3681 | 65.6 | 81.1 | 45.0 |
| 3-6-9 | 5601 | 5363 | 71.2 | 72.4 | 4.2 |
| Mean Values (Standard Deviations) April 2016–February 2019 | Italian WW Discharge Limits a | N Total Samples | N Samples Lower than Limits | ||||||
|---|---|---|---|---|---|---|---|---|---|
| HSTW Inlet | HSTW Outlet | Hybrid-TW Outlet | |||||||
| TSS | 48.6 | (±42.4) | 13.3 | (±9.0) | 7.0 | (±5.8) | 80 | 34 | 34 |
| BOD5 | 106.1 | (±104.9) | 19.5 | (±28.4) | 15.8 | (±26.6) | 40 | 37 | 36 |
| COD | 209.4 | (±203.5) | 41.3 | (±54.9) | 29.8 | (±47.9) | 160 | 37 | 36 |
| TN | 79.5 | (±26.2) | 40.6 | (±20.8) | 27.6 | (±11.3) | - | 31 | |
| N-NH3+ | 17.6 | (±21.3) | 8.1 | (±13.6) | 0.7 | (±1.4) | 15 b | 38 | 38 |
| N-NO3− | 45.6 | (±18.5) | 14.5 | (±16.2) | 18.3 | (±11.4) | 20 b | 37 | 19 |
| TP | 14.6 | (±7.8) | 13.5 | (±9.6) | 11.2 | (±7.4) | 10 | 26 | 16 |
| E. coli | 7.1 × 10⁵ | (±1.1 × 10⁶) | 1.3 × 10⁴ | (±3.7 × 10⁴) | 6.6 × 101 | (±1.1 × 10²) | 5.0 × 10³ | 26 | 26 |
| Mean Annual Values (Standard Deviations) | ||||||
|---|---|---|---|---|---|---|
| 2016 | 2017 | 2018 | ||||
| Q | 23.86 | (±19.8) | 31.59 | (±19.1) | 32.06 | (±17.6) |
| TSSLR | 4.6 | (±2.9) | 4.8 | (±3.4) | 6.5 | (±3.1) |
| HLR | 59.6 | (±19.8) | 79.0 | (±19.1) | 80.1 | (±17.6) |
| OLR | 11.8 | (±6.9) | 8.3 | (±5.4) | 13.3 | (±5.6) |
© 2020 by the authors. Licensee MDPI, Basel, Switzerland. This article is an open access article distributed under the terms and conditions of the Creative Commons Attribution (CC BY) license (http://creativecommons.org/licenses/by/4.0/).
Share and Cite
Licciardello, F.; Sacco, A.; Barbagallo, S.; Ventura, D.; Cirelli, G.L. Evaluation of Different Methods to Assess the Hydraulic Behavior in Horizontal Treatment Wetlands. Water 2020, 12, 2286. https://doi.org/10.3390/w12082286
Licciardello F, Sacco A, Barbagallo S, Ventura D, Cirelli GL. Evaluation of Different Methods to Assess the Hydraulic Behavior in Horizontal Treatment Wetlands. Water. 2020; 12(8):2286. https://doi.org/10.3390/w12082286
Chicago/Turabian StyleLicciardello, Feliciana, Alessandro Sacco, Salvatore Barbagallo, Delia Ventura, and Giuseppe Luigi Cirelli. 2020. "Evaluation of Different Methods to Assess the Hydraulic Behavior in Horizontal Treatment Wetlands" Water 12, no. 8: 2286. https://doi.org/10.3390/w12082286
APA StyleLicciardello, F., Sacco, A., Barbagallo, S., Ventura, D., & Cirelli, G. L. (2020). Evaluation of Different Methods to Assess the Hydraulic Behavior in Horizontal Treatment Wetlands. Water, 12(8), 2286. https://doi.org/10.3390/w12082286


