Aluminum-Doped Cobalt Ferrite as an Efficient Photocatalyst for the Abatement of Methylene Blue


 , ,
, ,  ,
,
Abstract
1. Introduction
2. Experimental
2.1. Synthesis of Undoped CoFe2O4 and Doped CoAlxFe2−xO4
2.2. Characterization
2.2.1. X-ray Diffraction (XRD)s
2.2.2. SEM-EDS Analysis
2.2.3. Nitrogen Adsorption/Desorption Studies
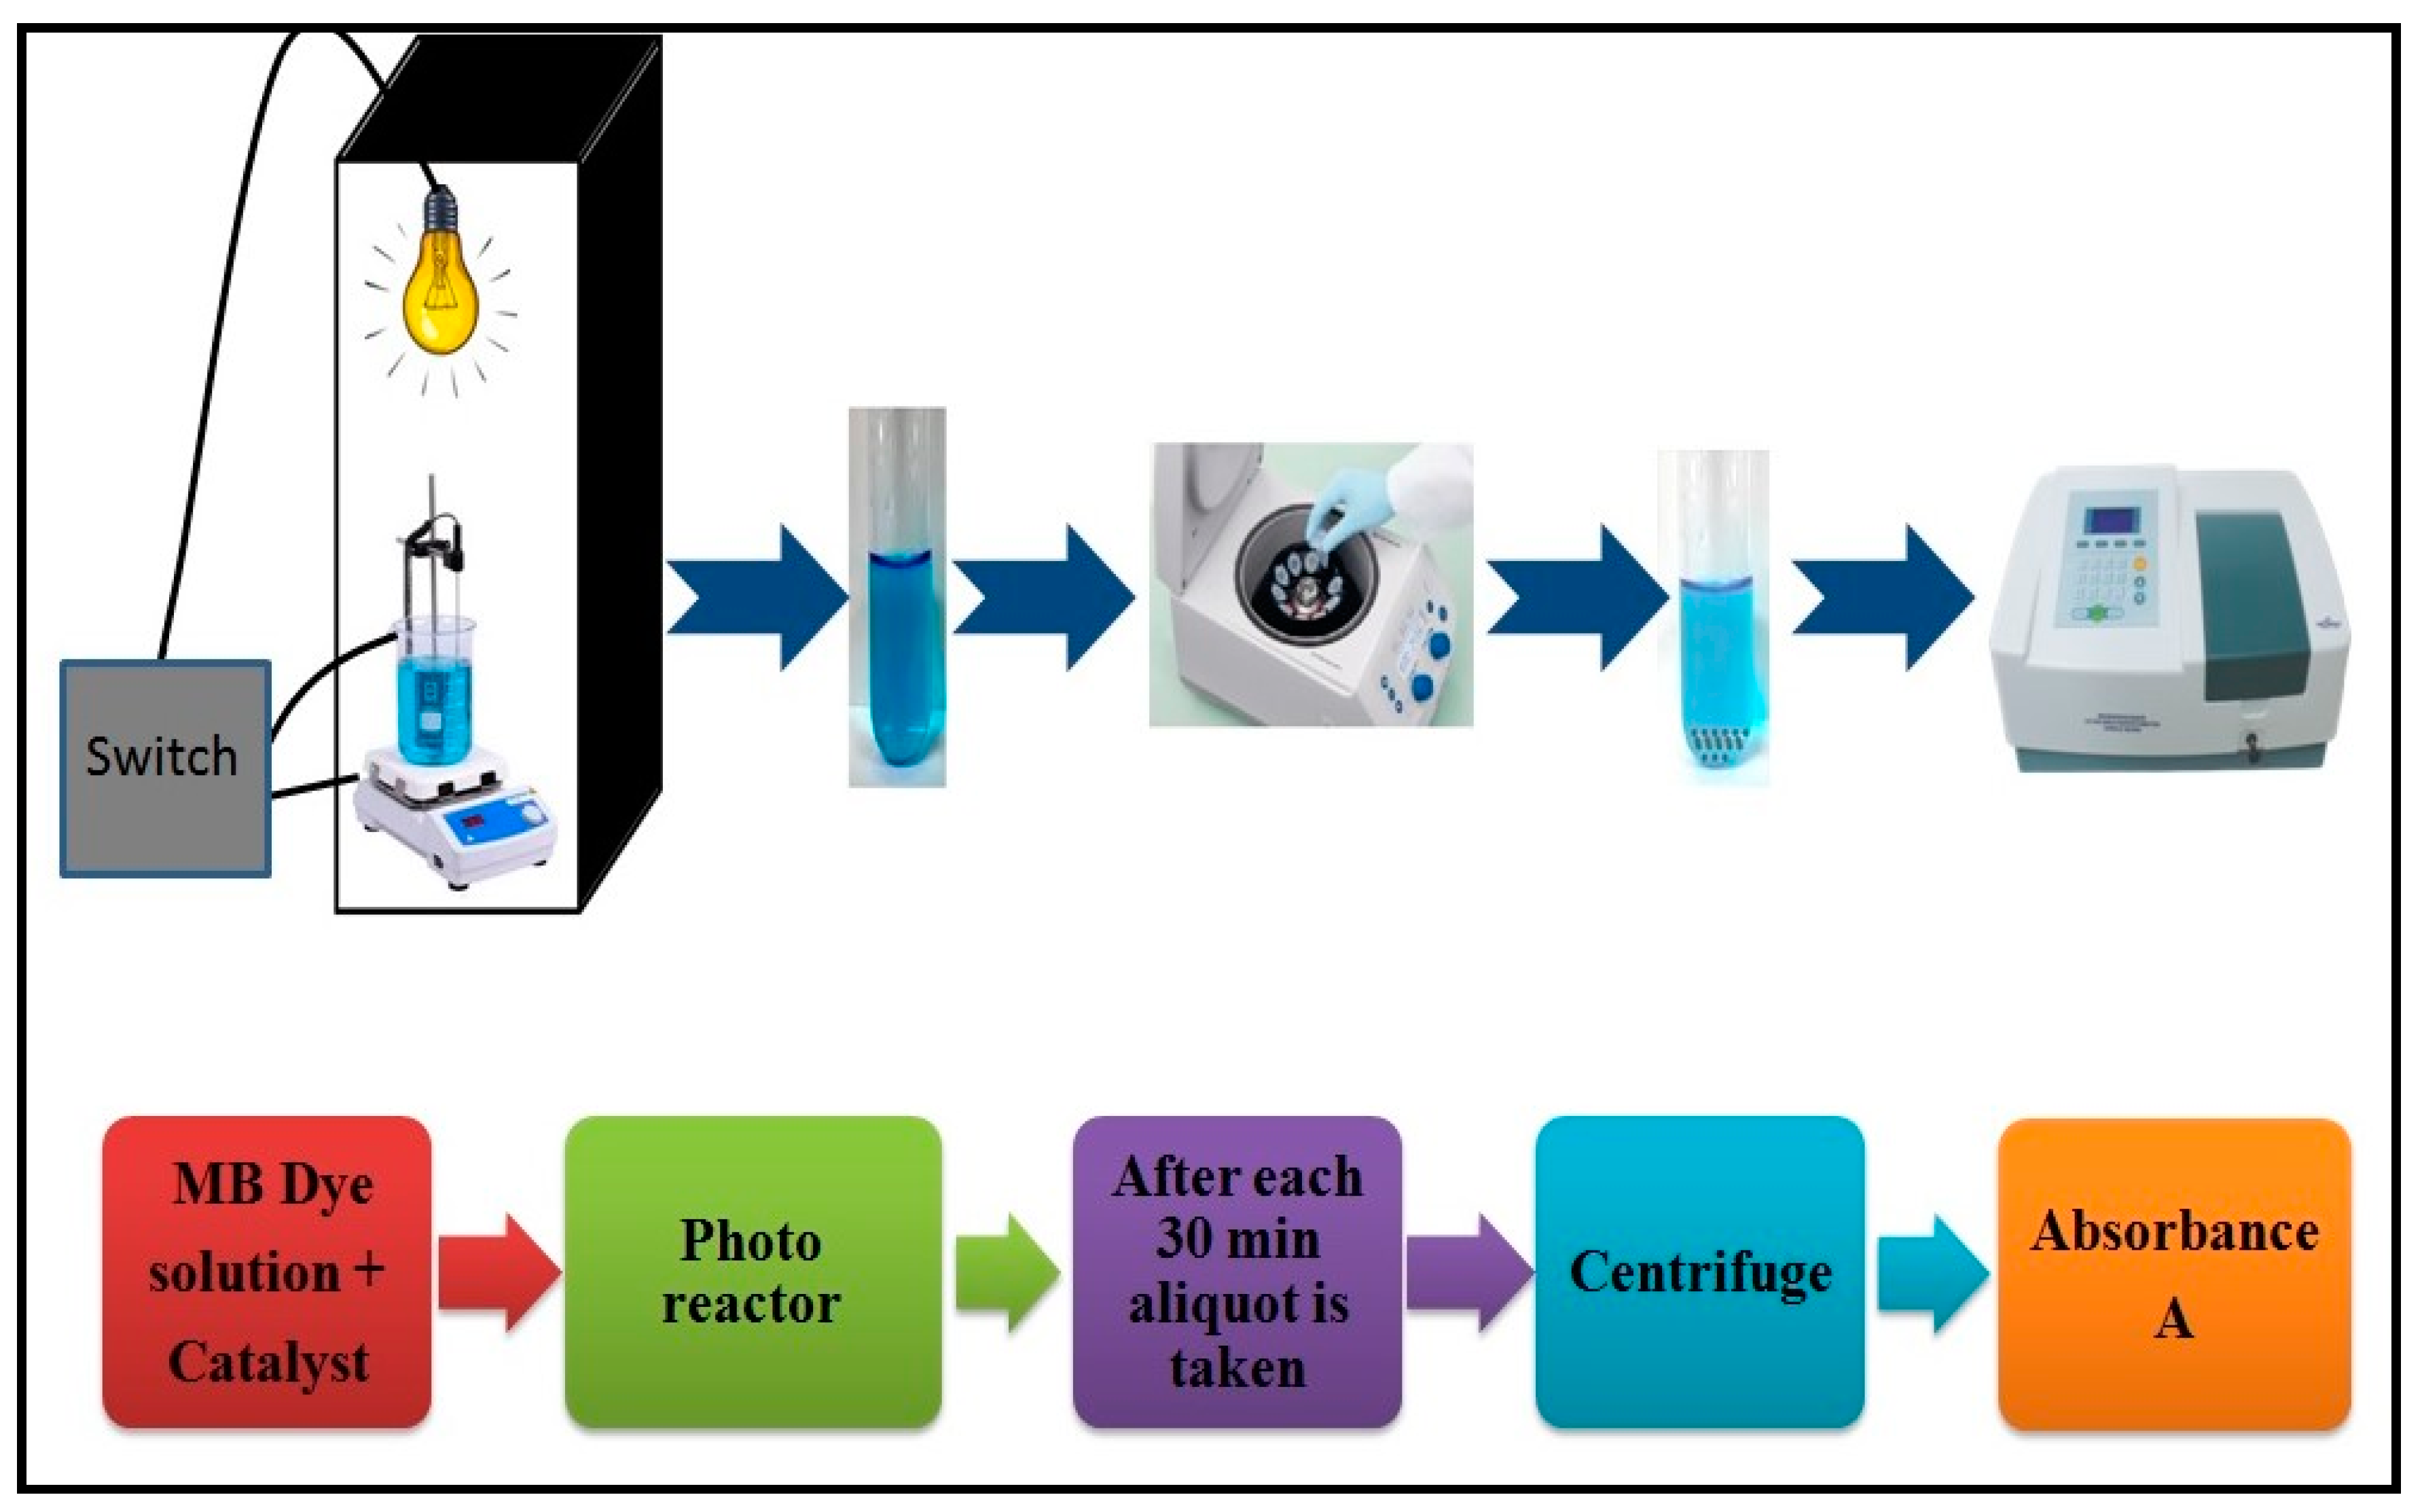
2.3. Degradation of MB Dye Using Synthesized Spinel Ferrites
- Ao is MB dye’s initial absorbance
- A is MB dye’s final absorbance, after irradiation.
2.4. Optimization of Different Variables Affecting Degradation of MB Dye
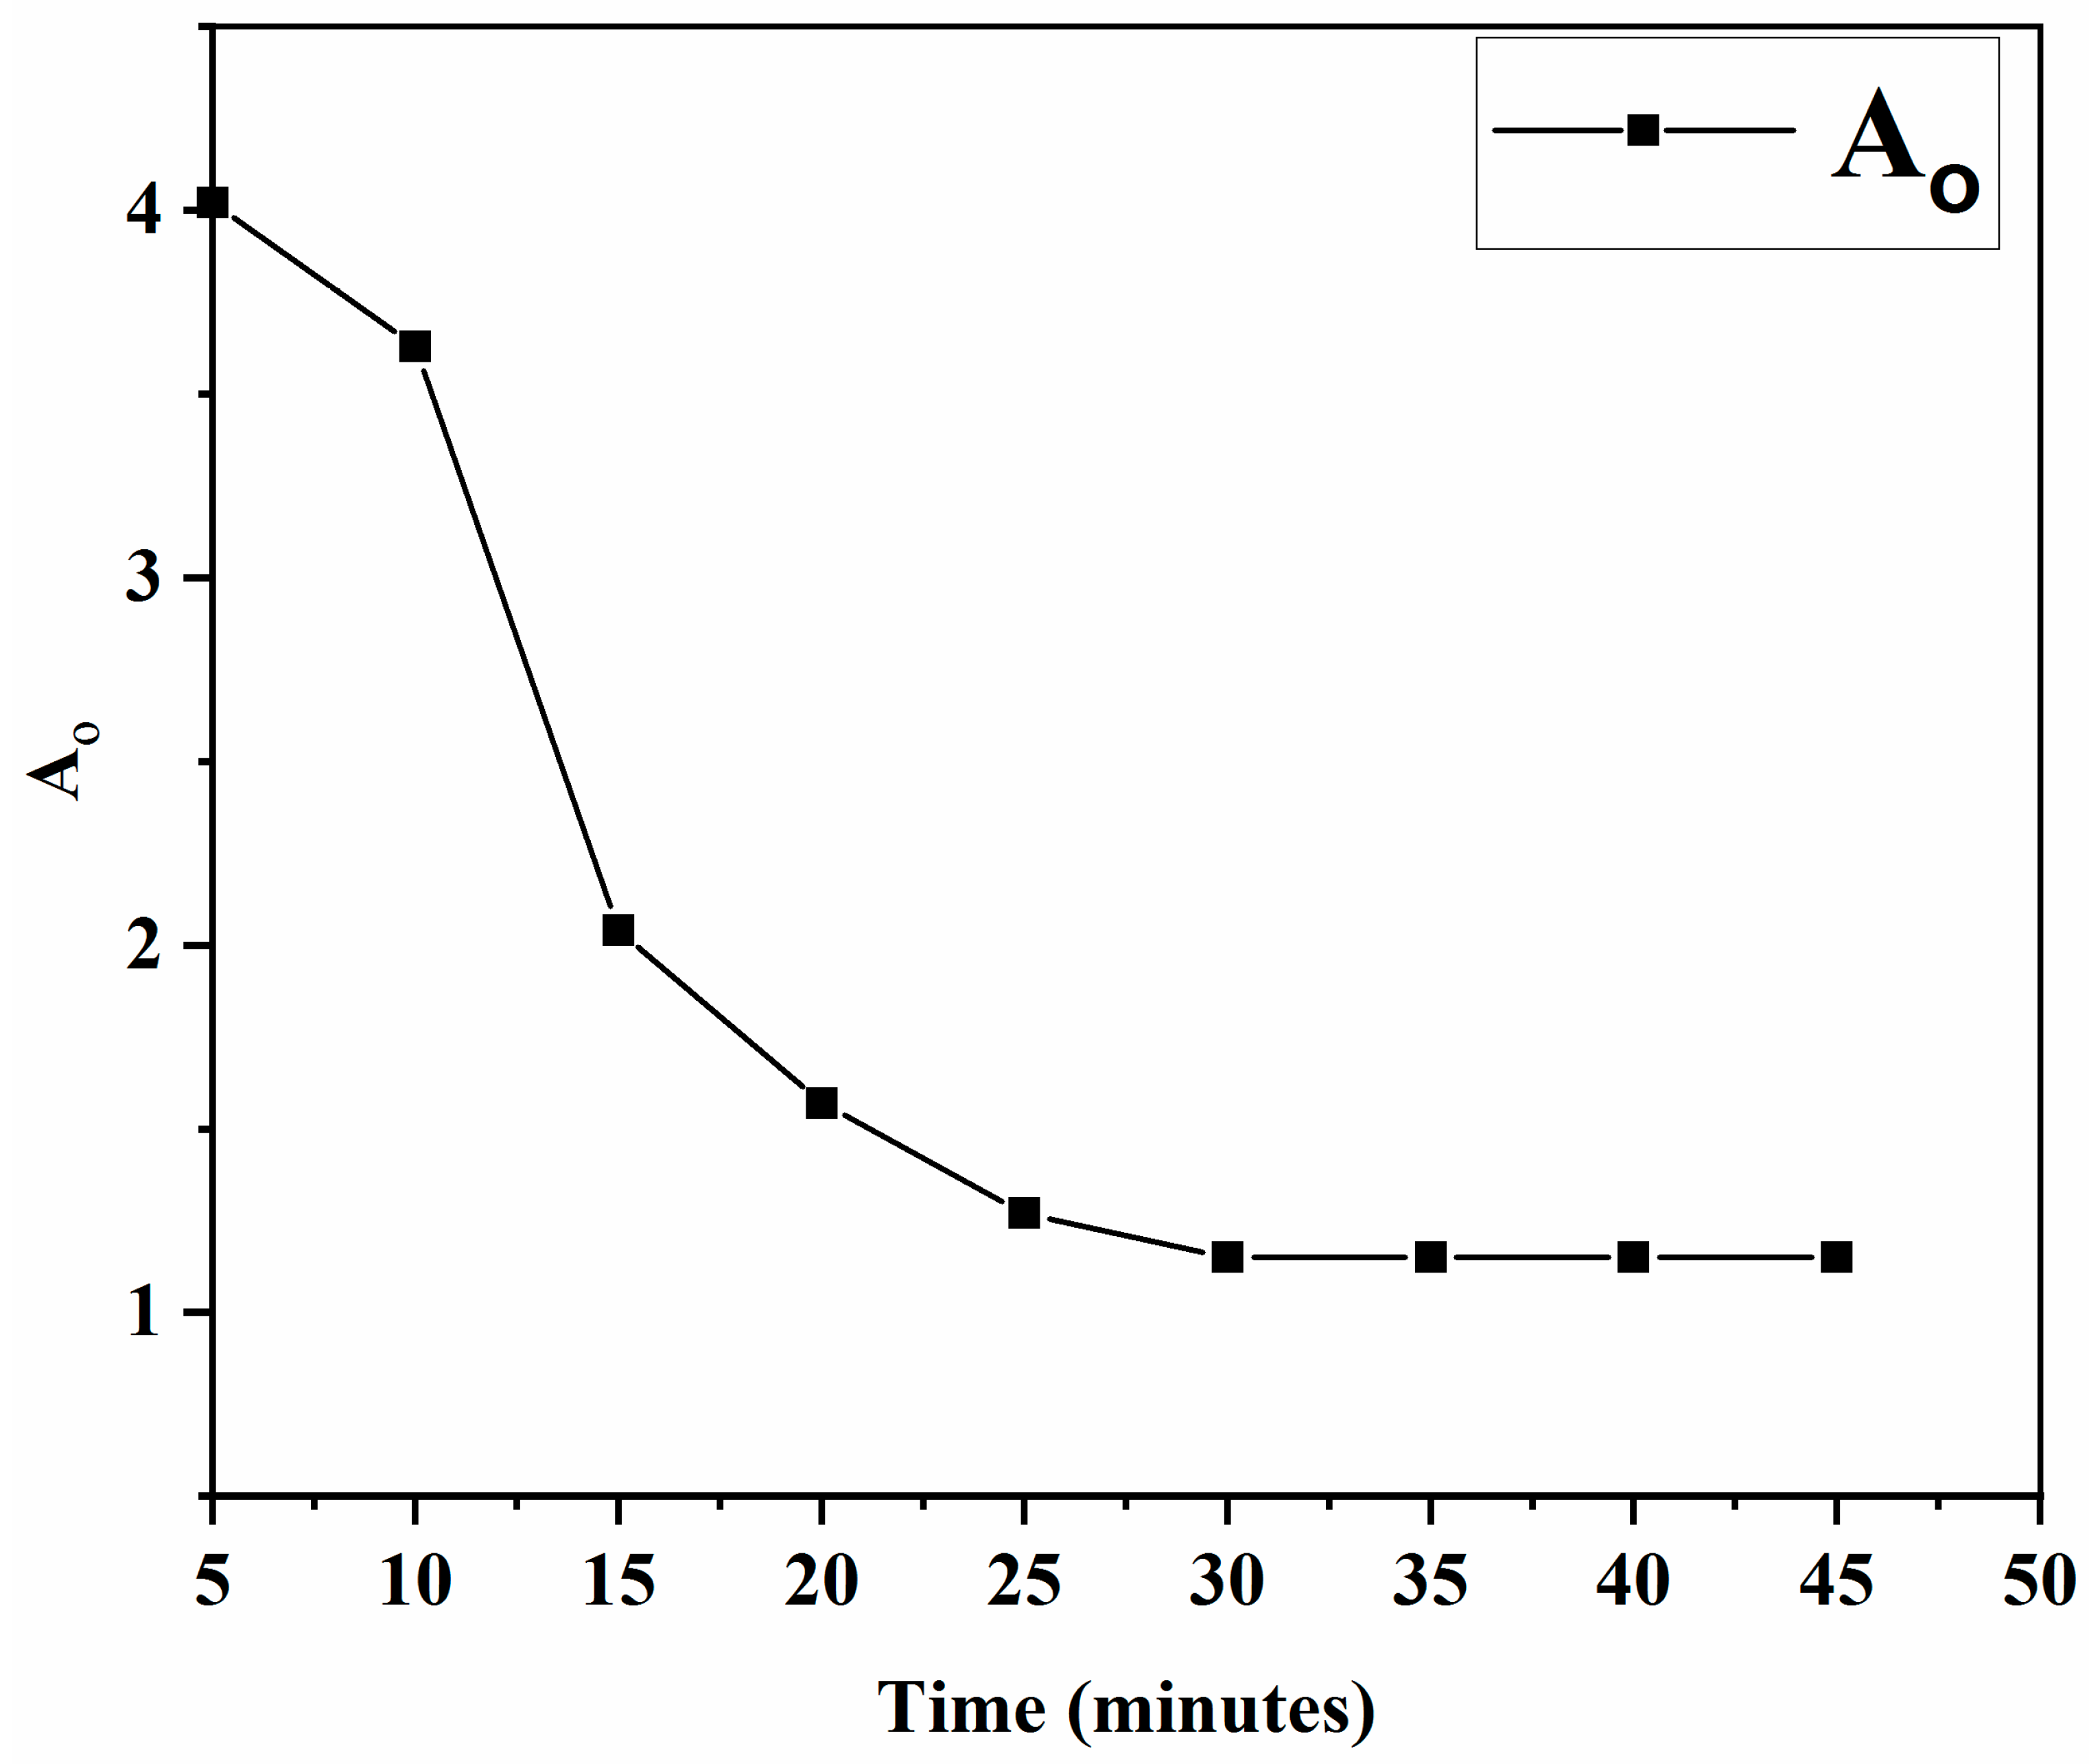
2.4.1. Effect of Time
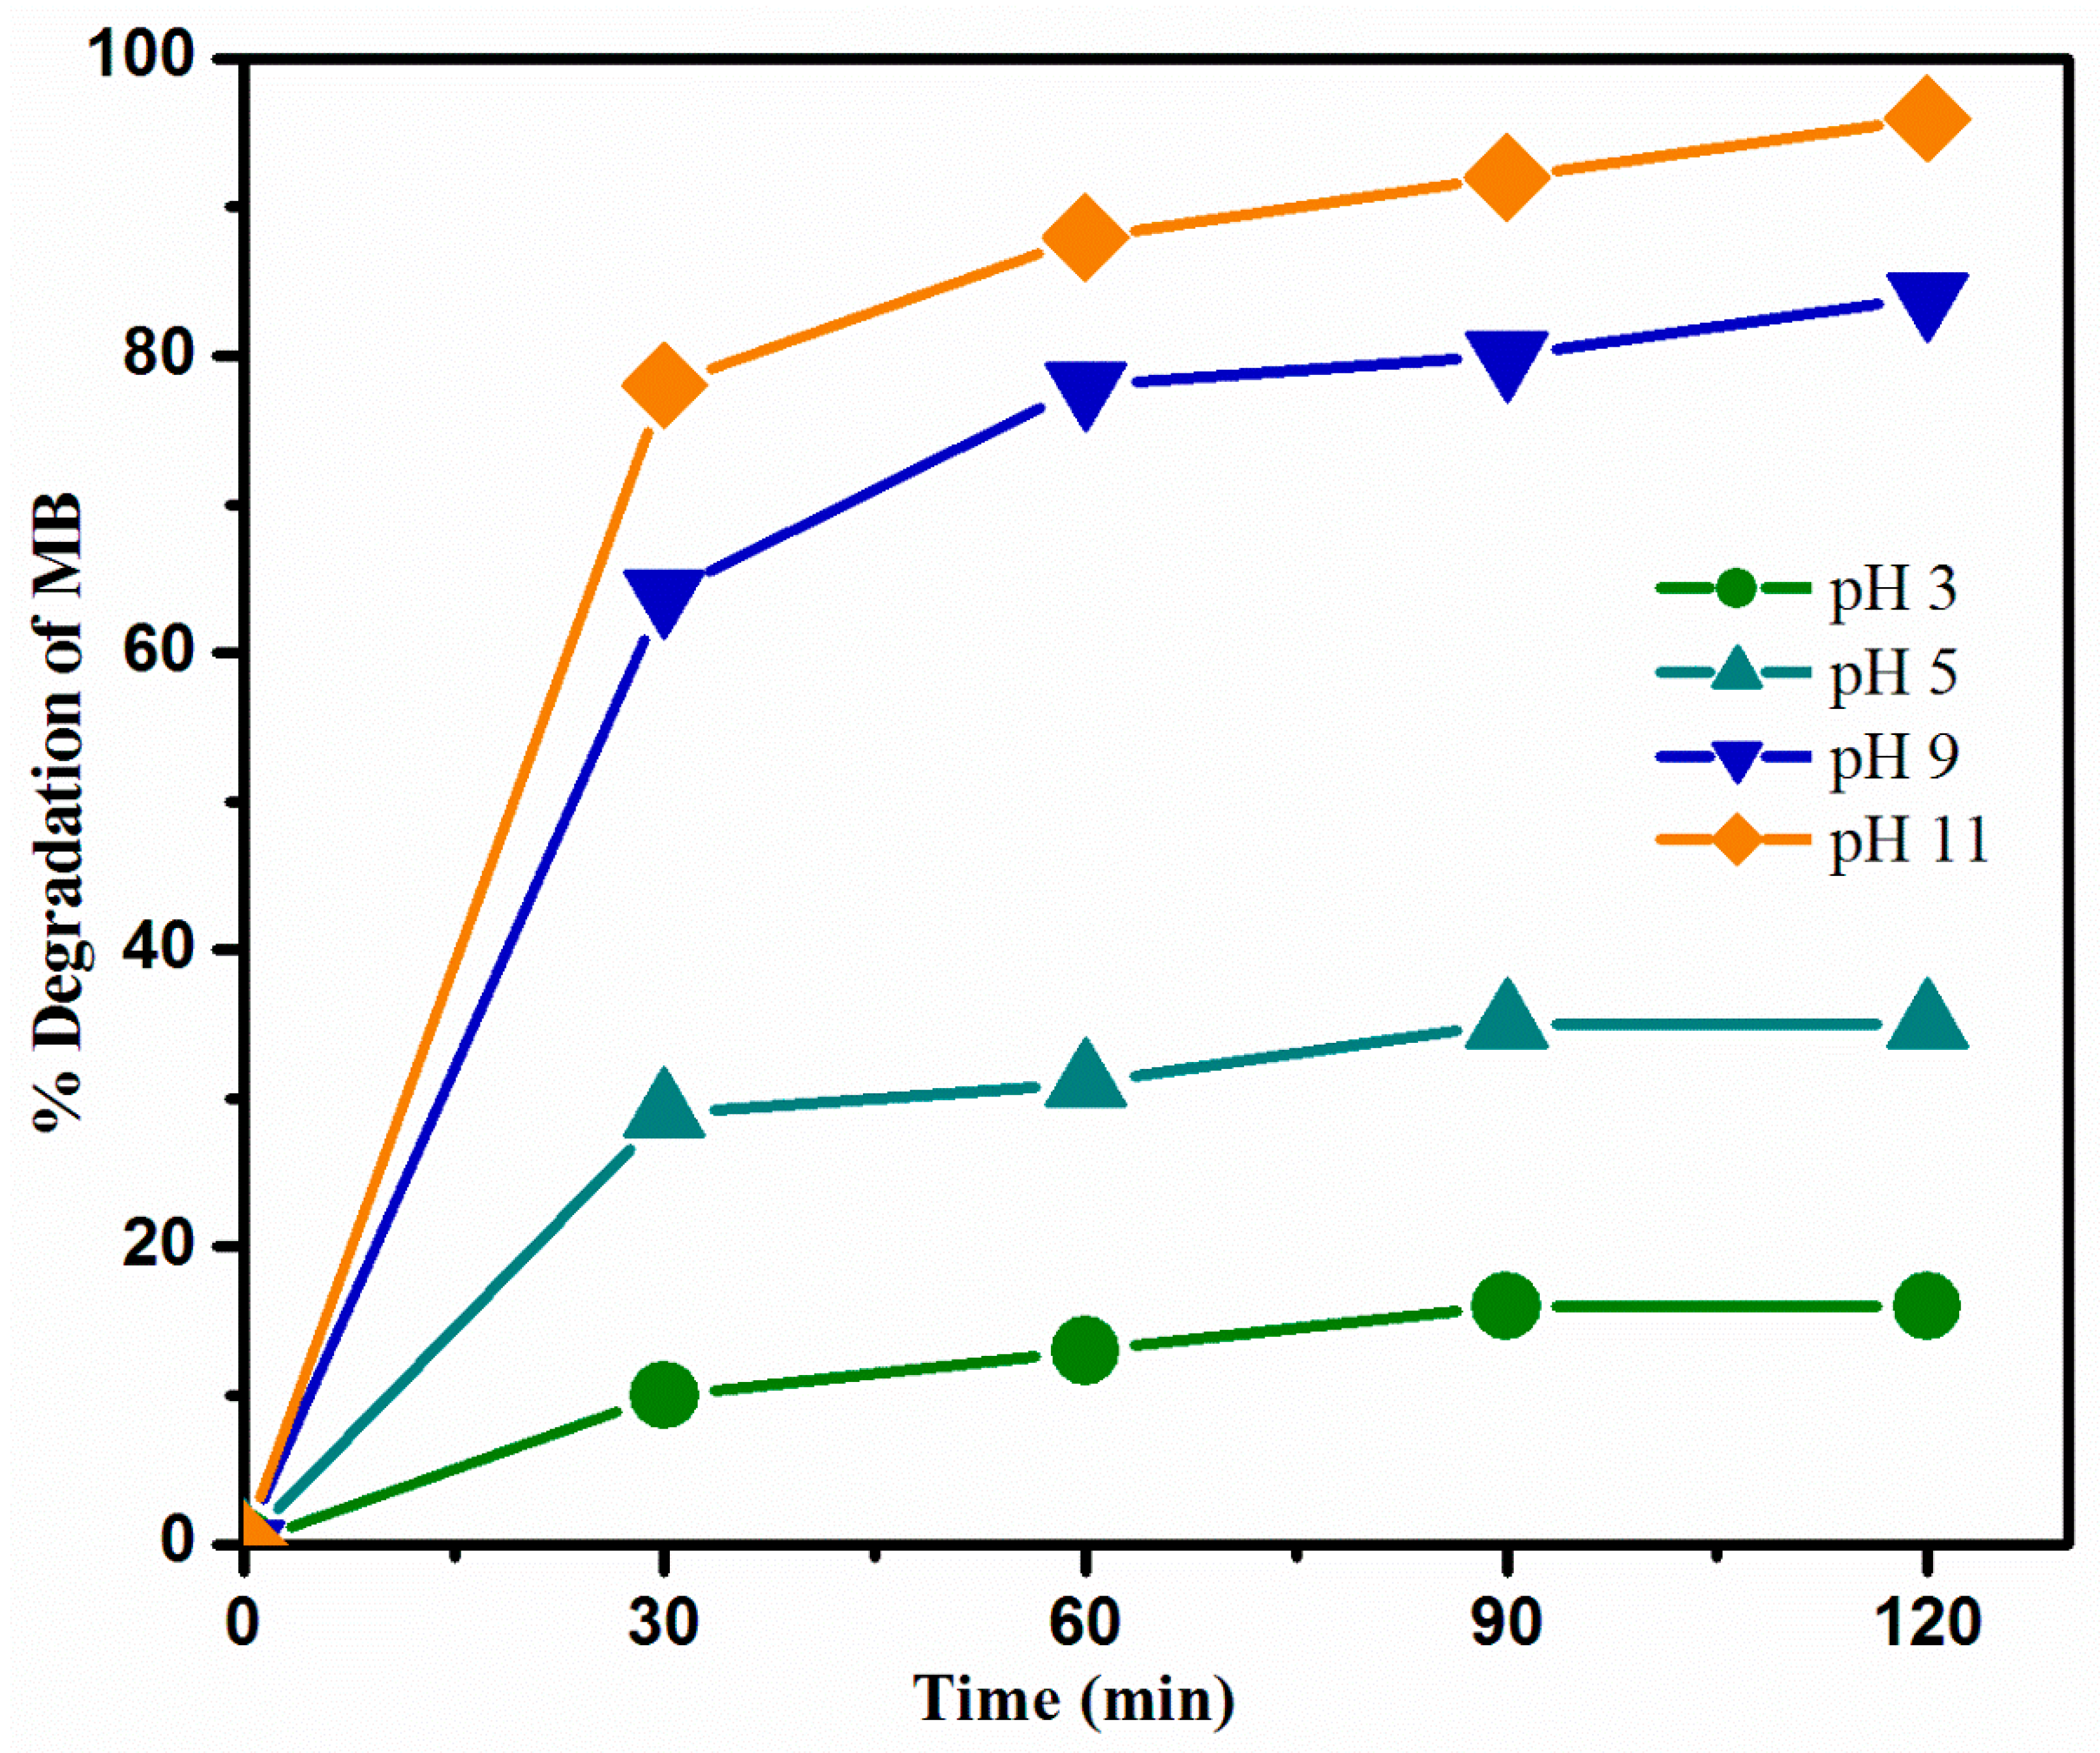
2.4.2. Effect of pH
2.4.3. Effect of dose of Catalyst
2.4.4. Effect of Initial Concentration of MB Dye Solution
2.4.5. Effect of Intensity of Light
2.5. Photostability Studies
3. Results and Discussion
3.1. Synthesis of CoFe2O4 and Doped CoAlFe2O4
3.2. Characterization
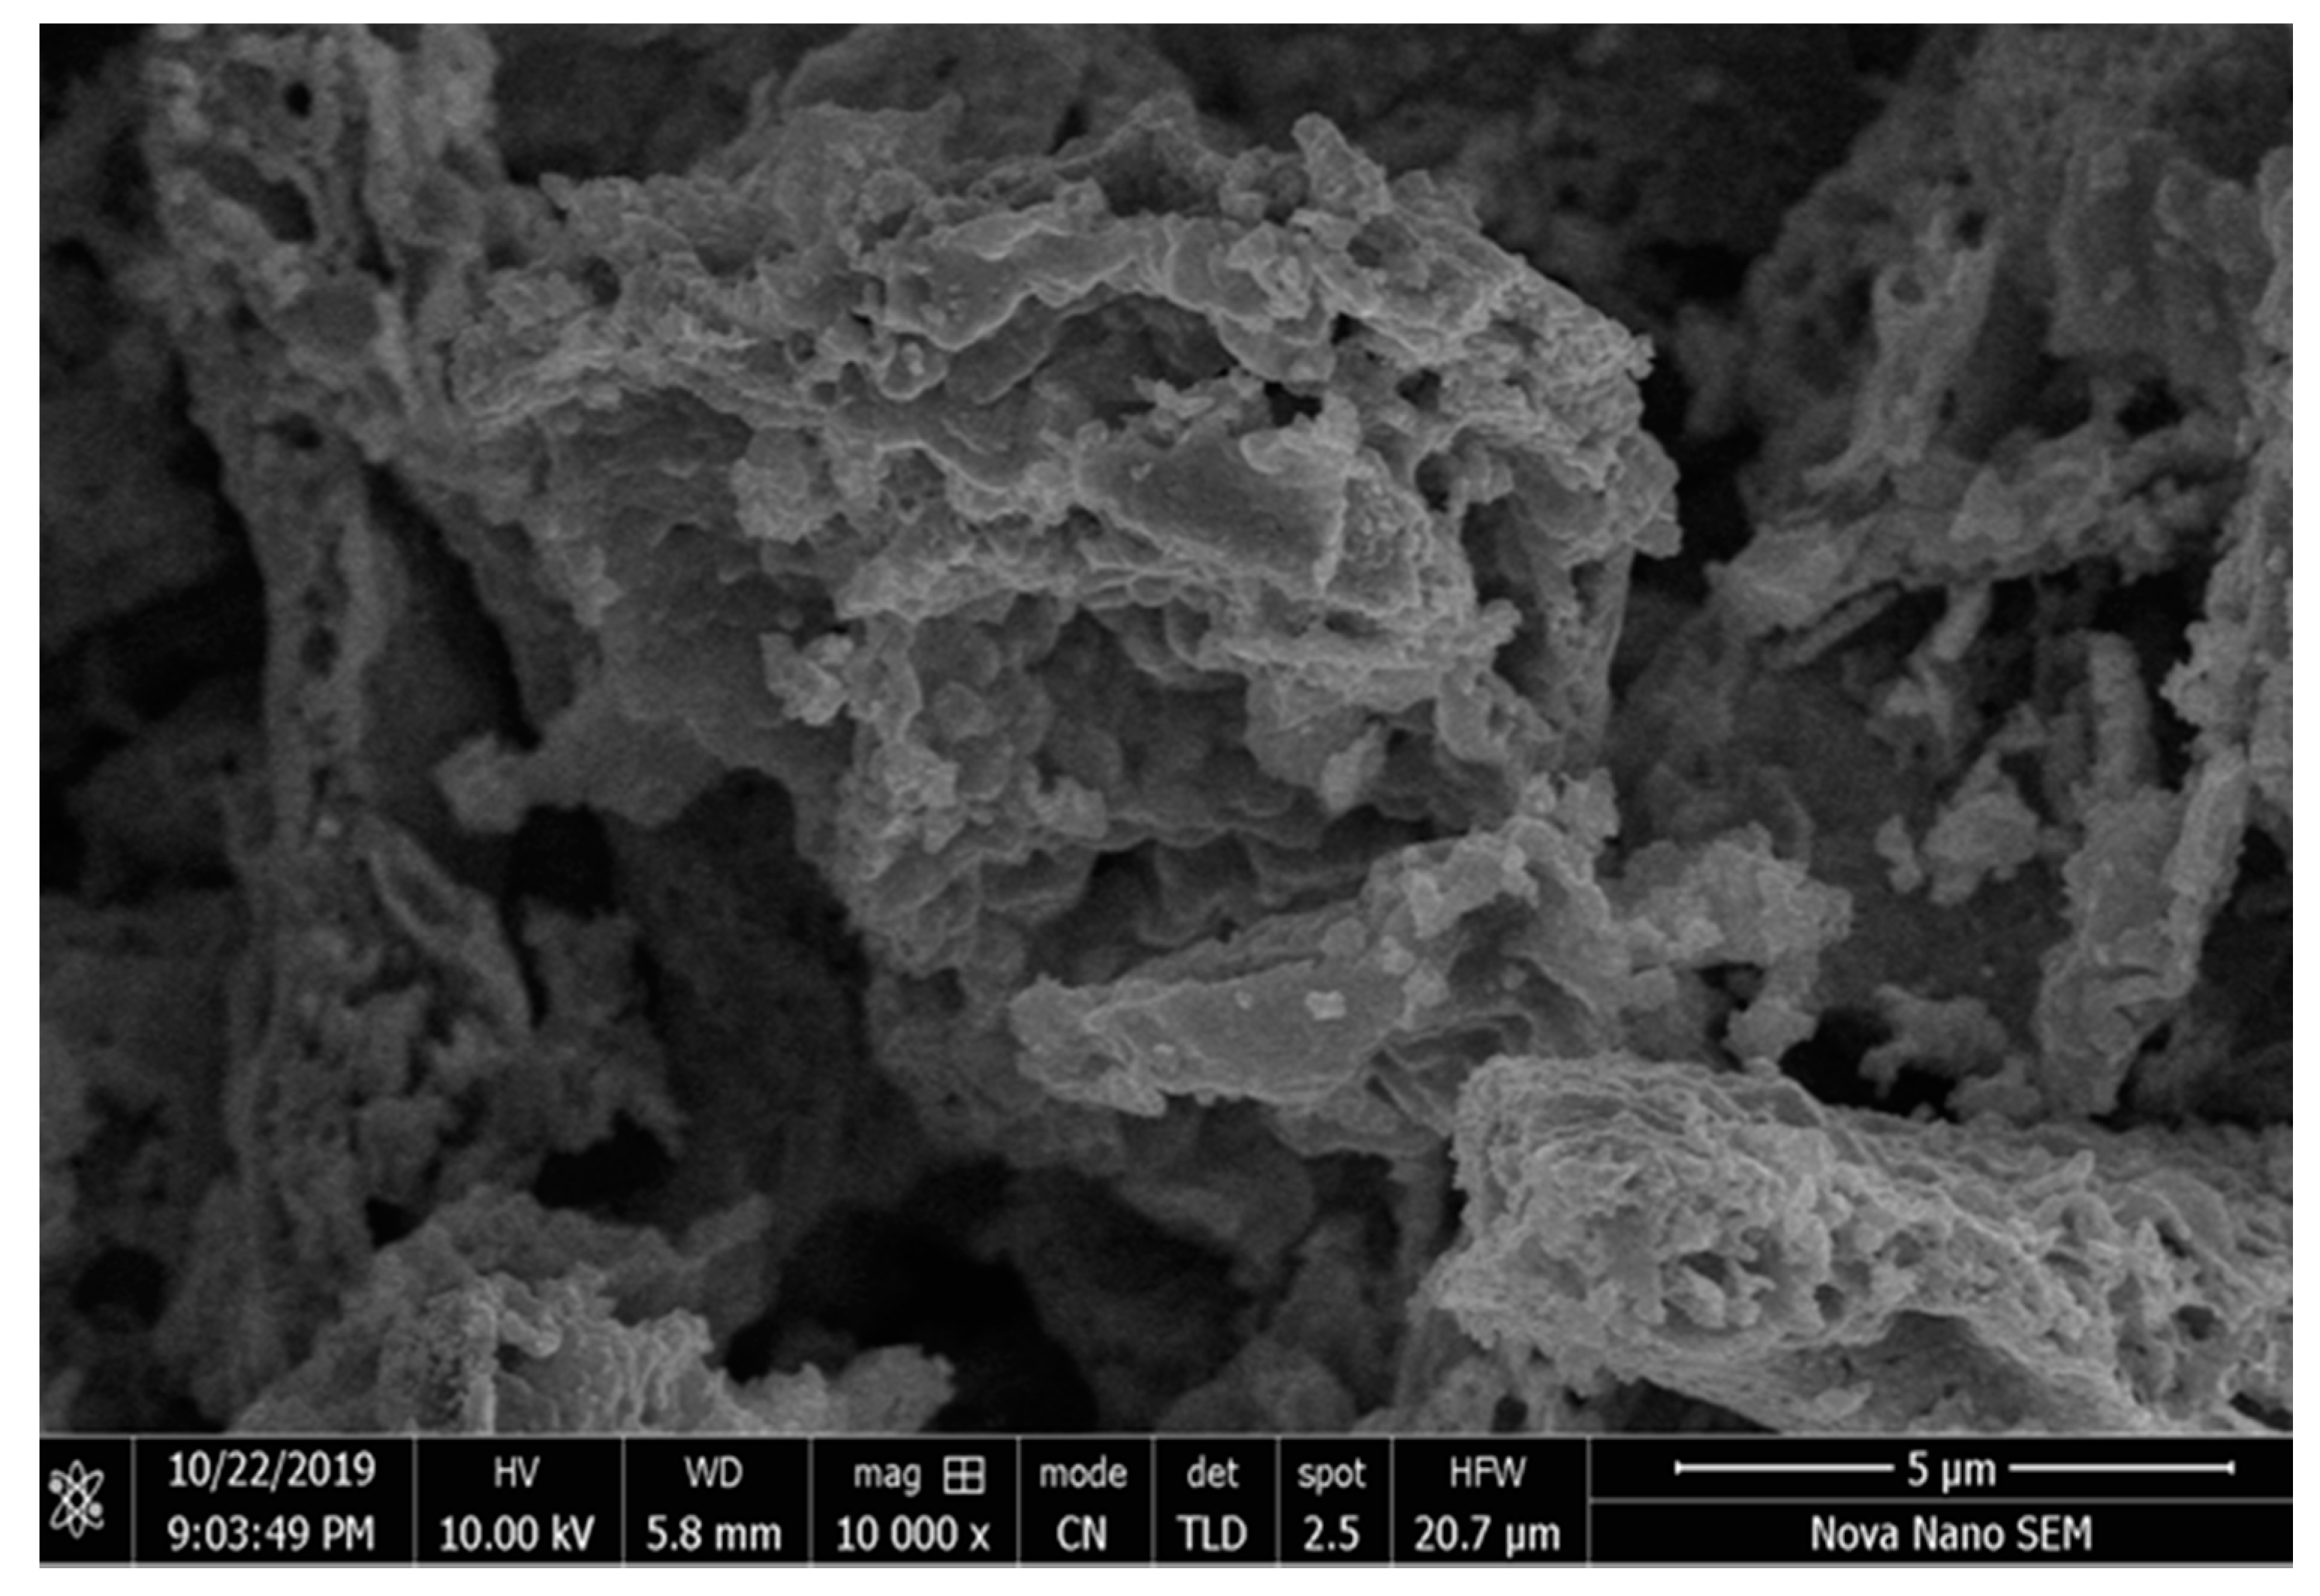
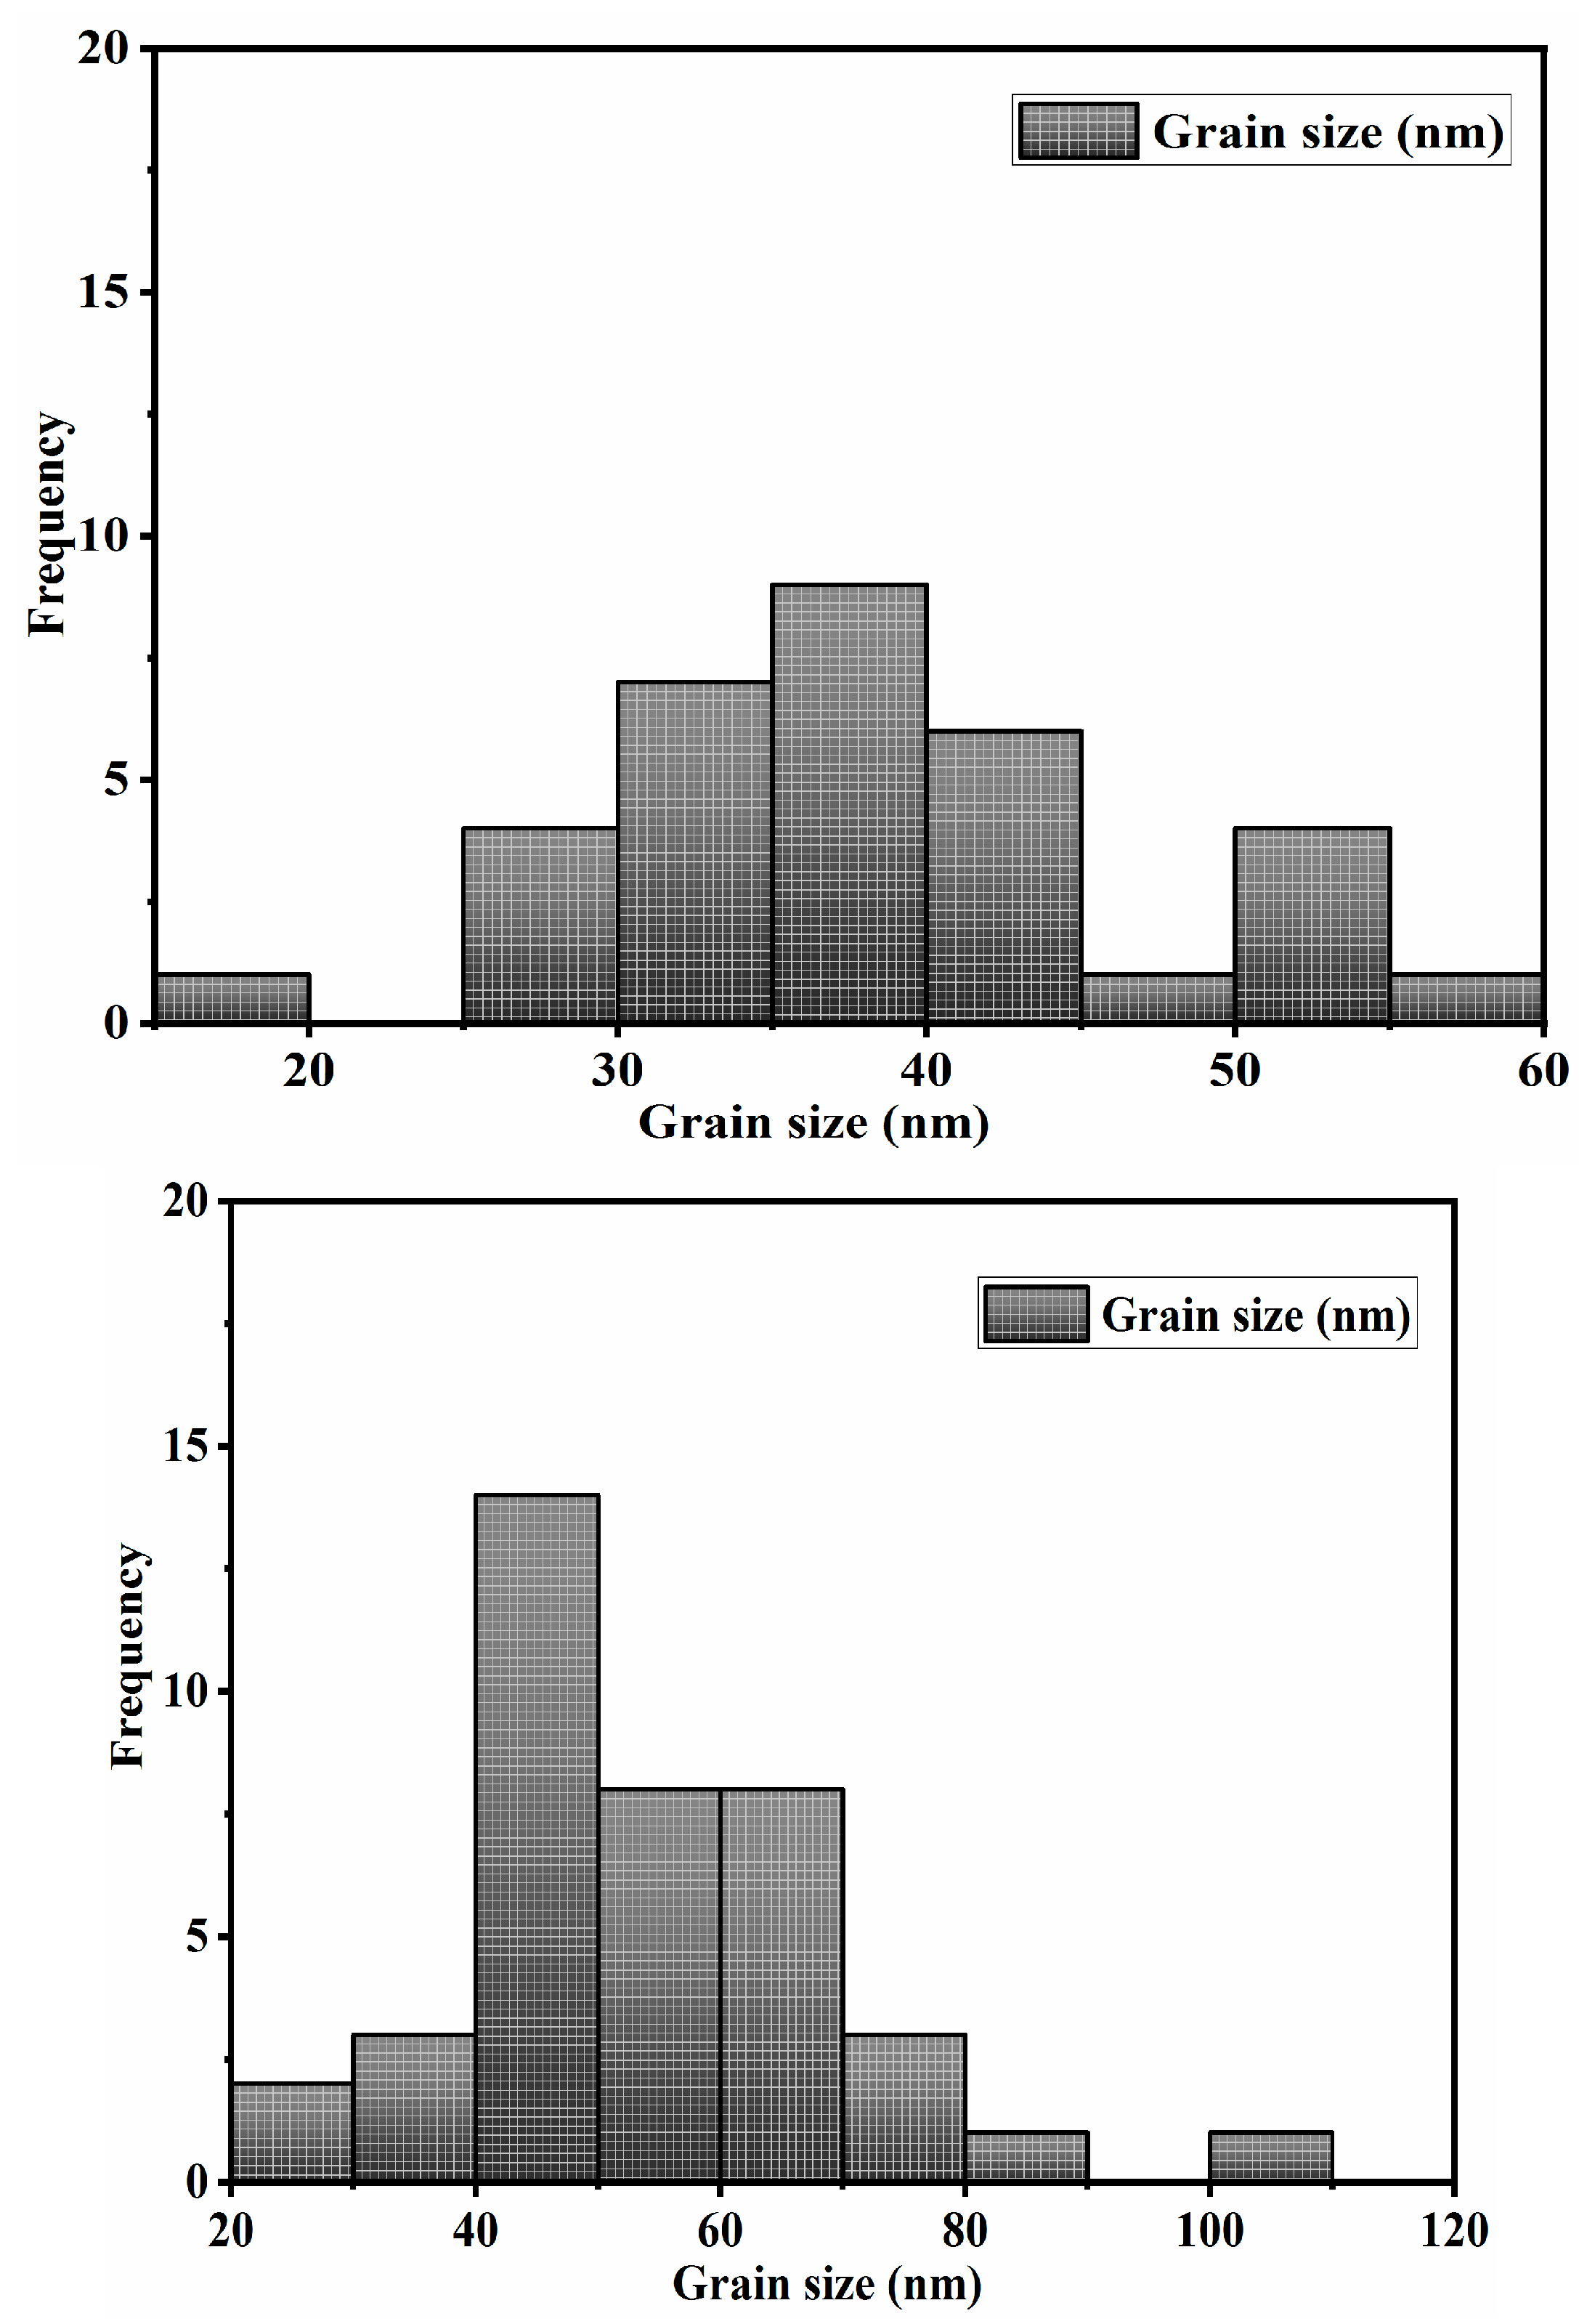
3.2.1. SEM Analysis
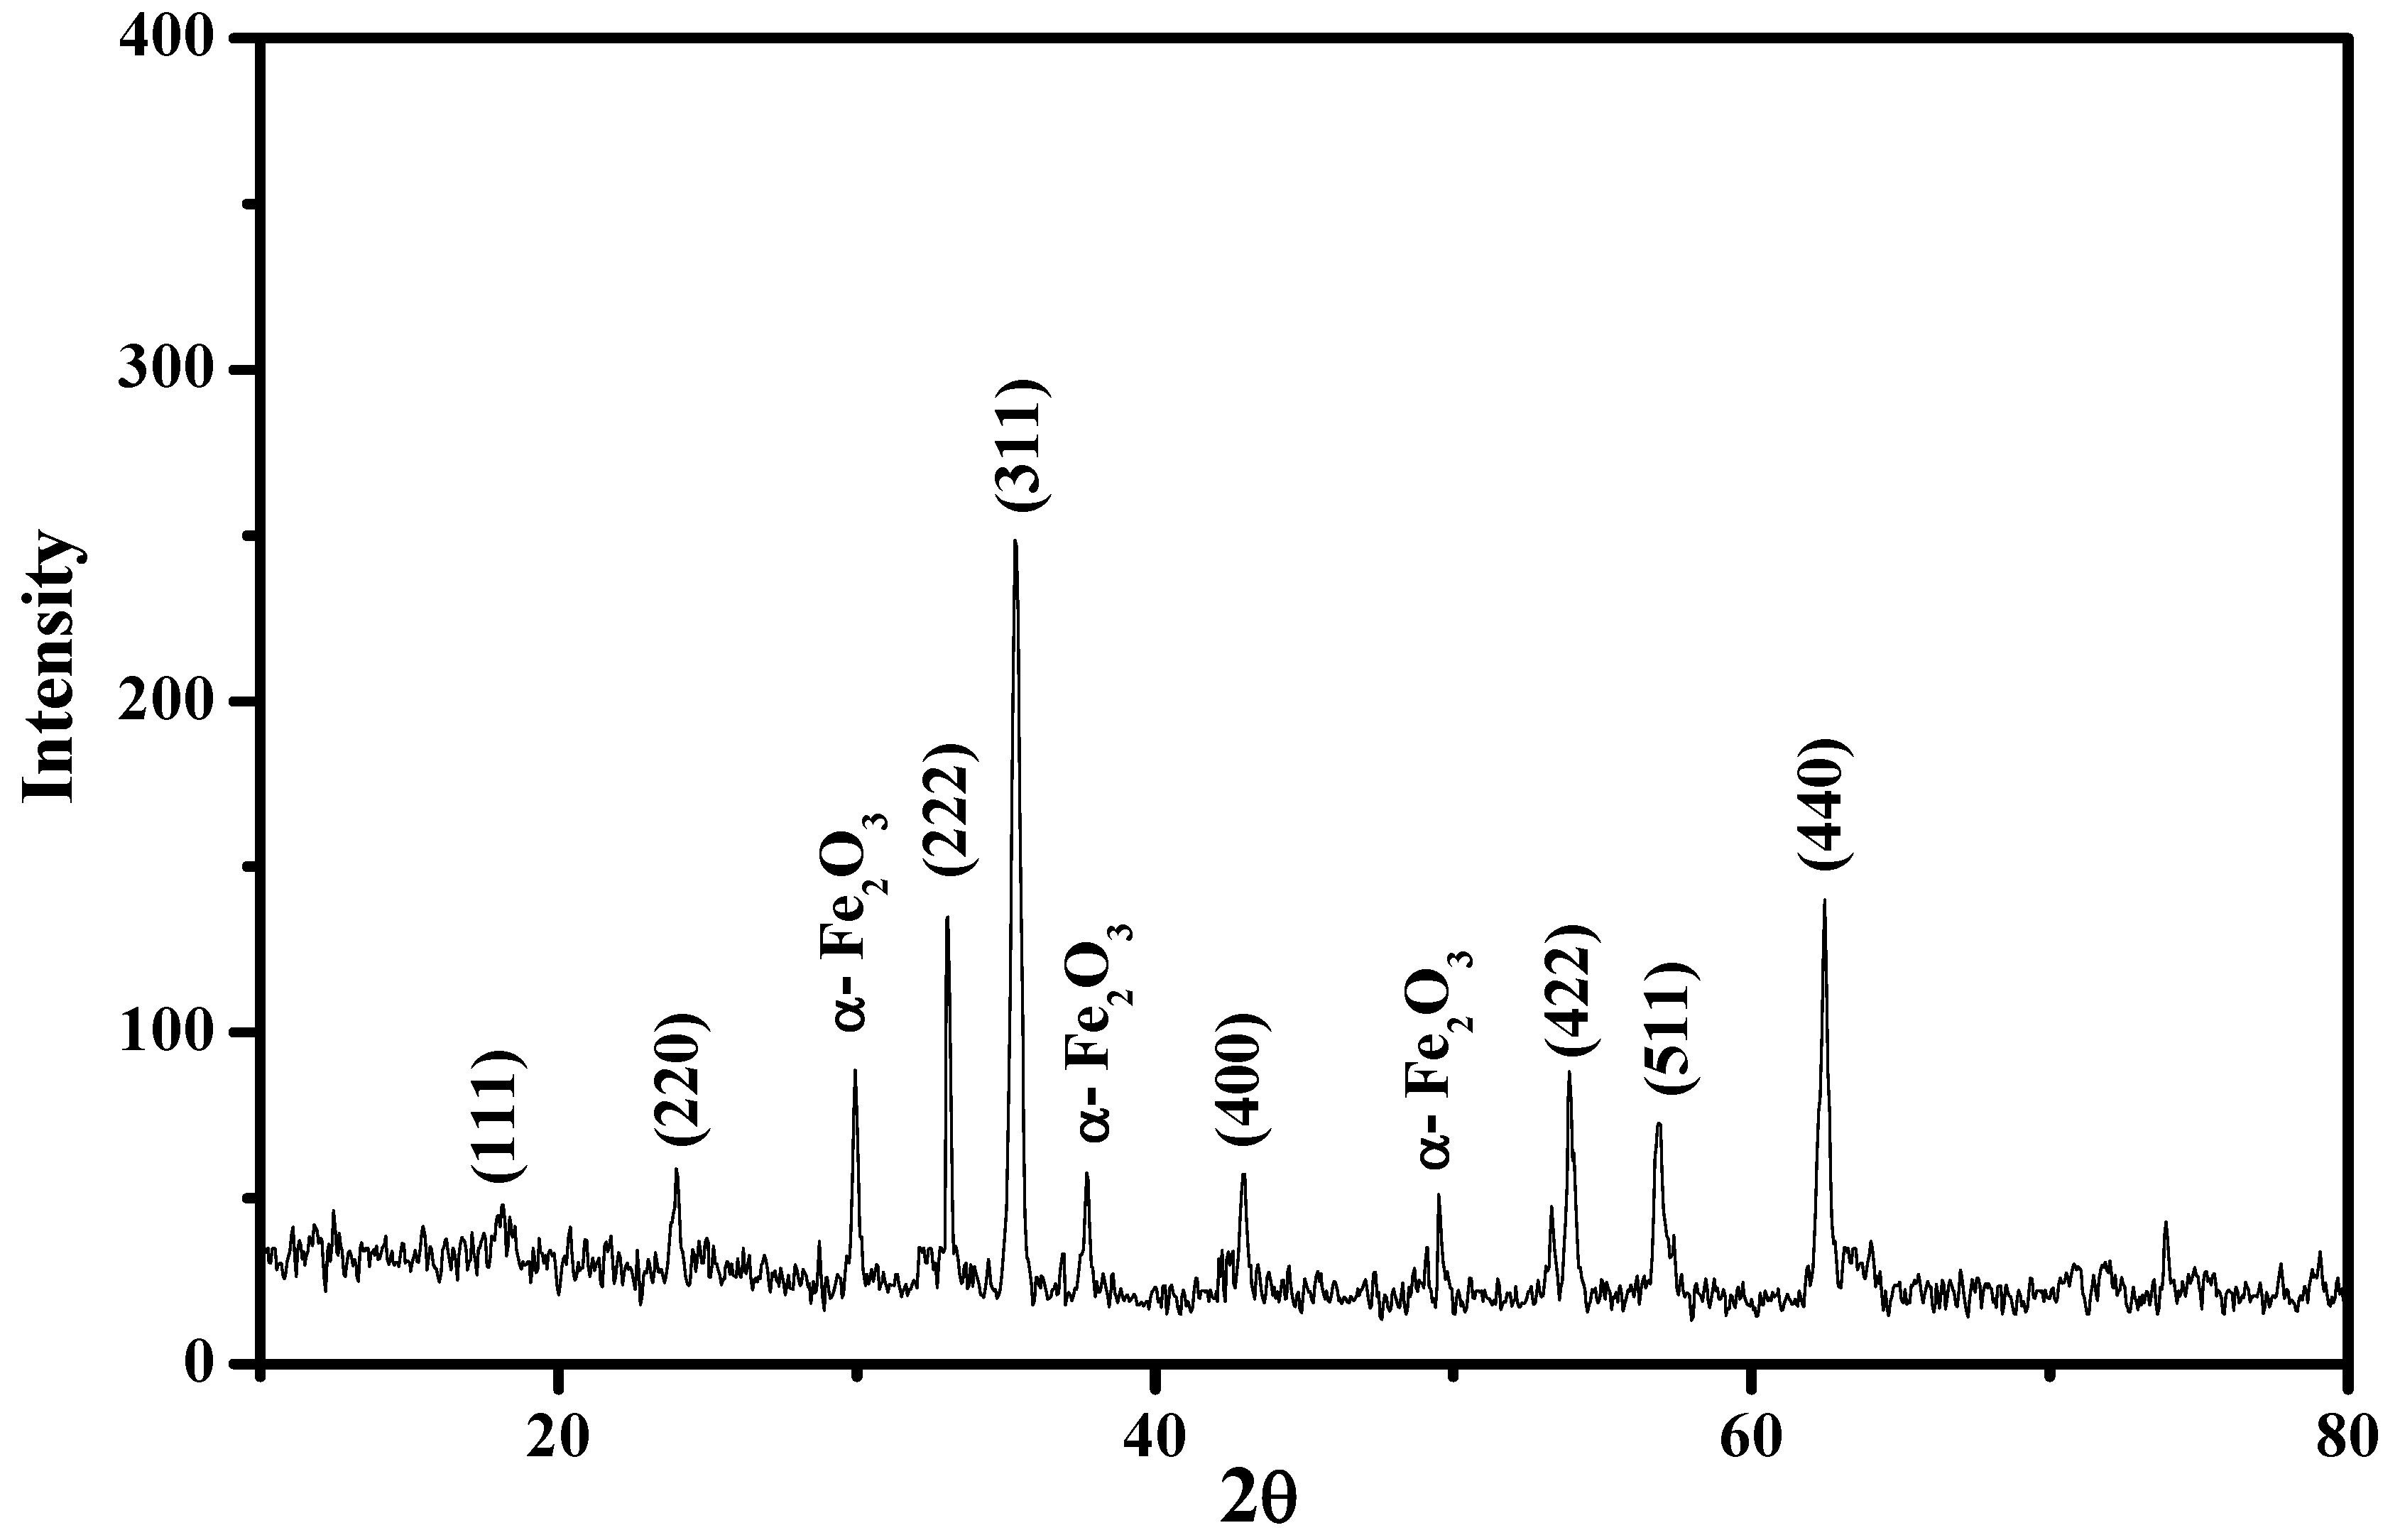
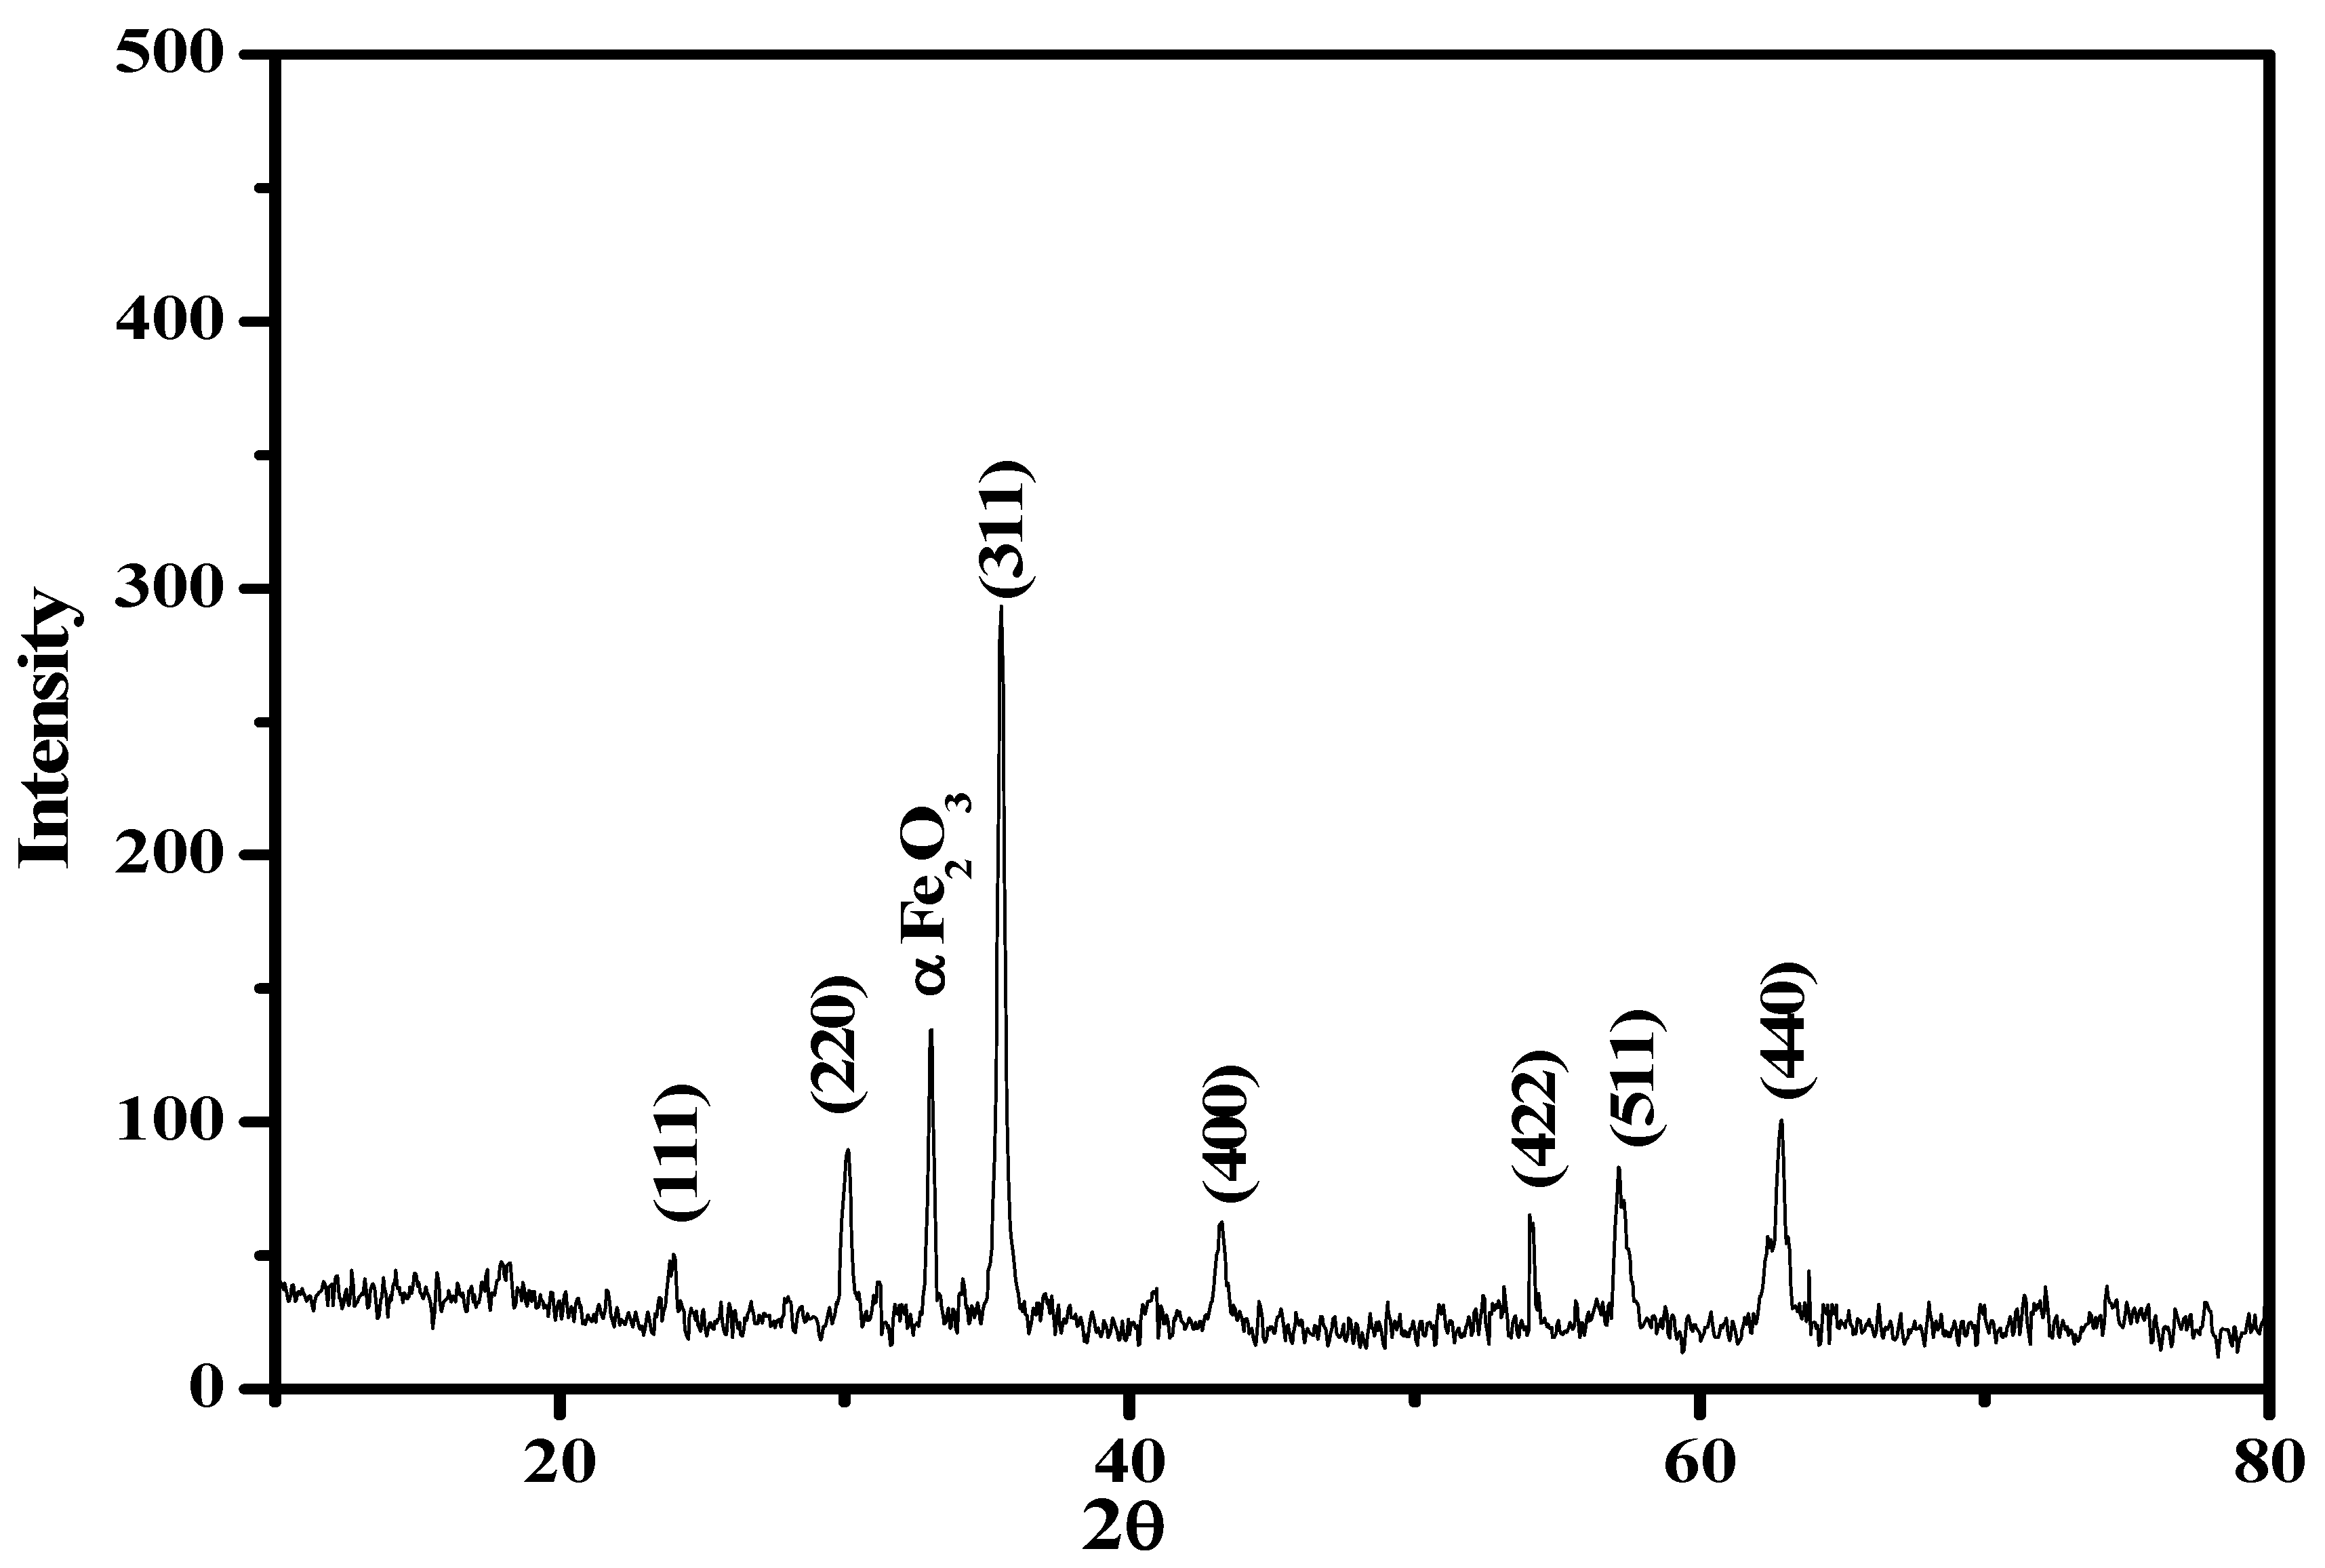
3.2.2. XRD Analysis
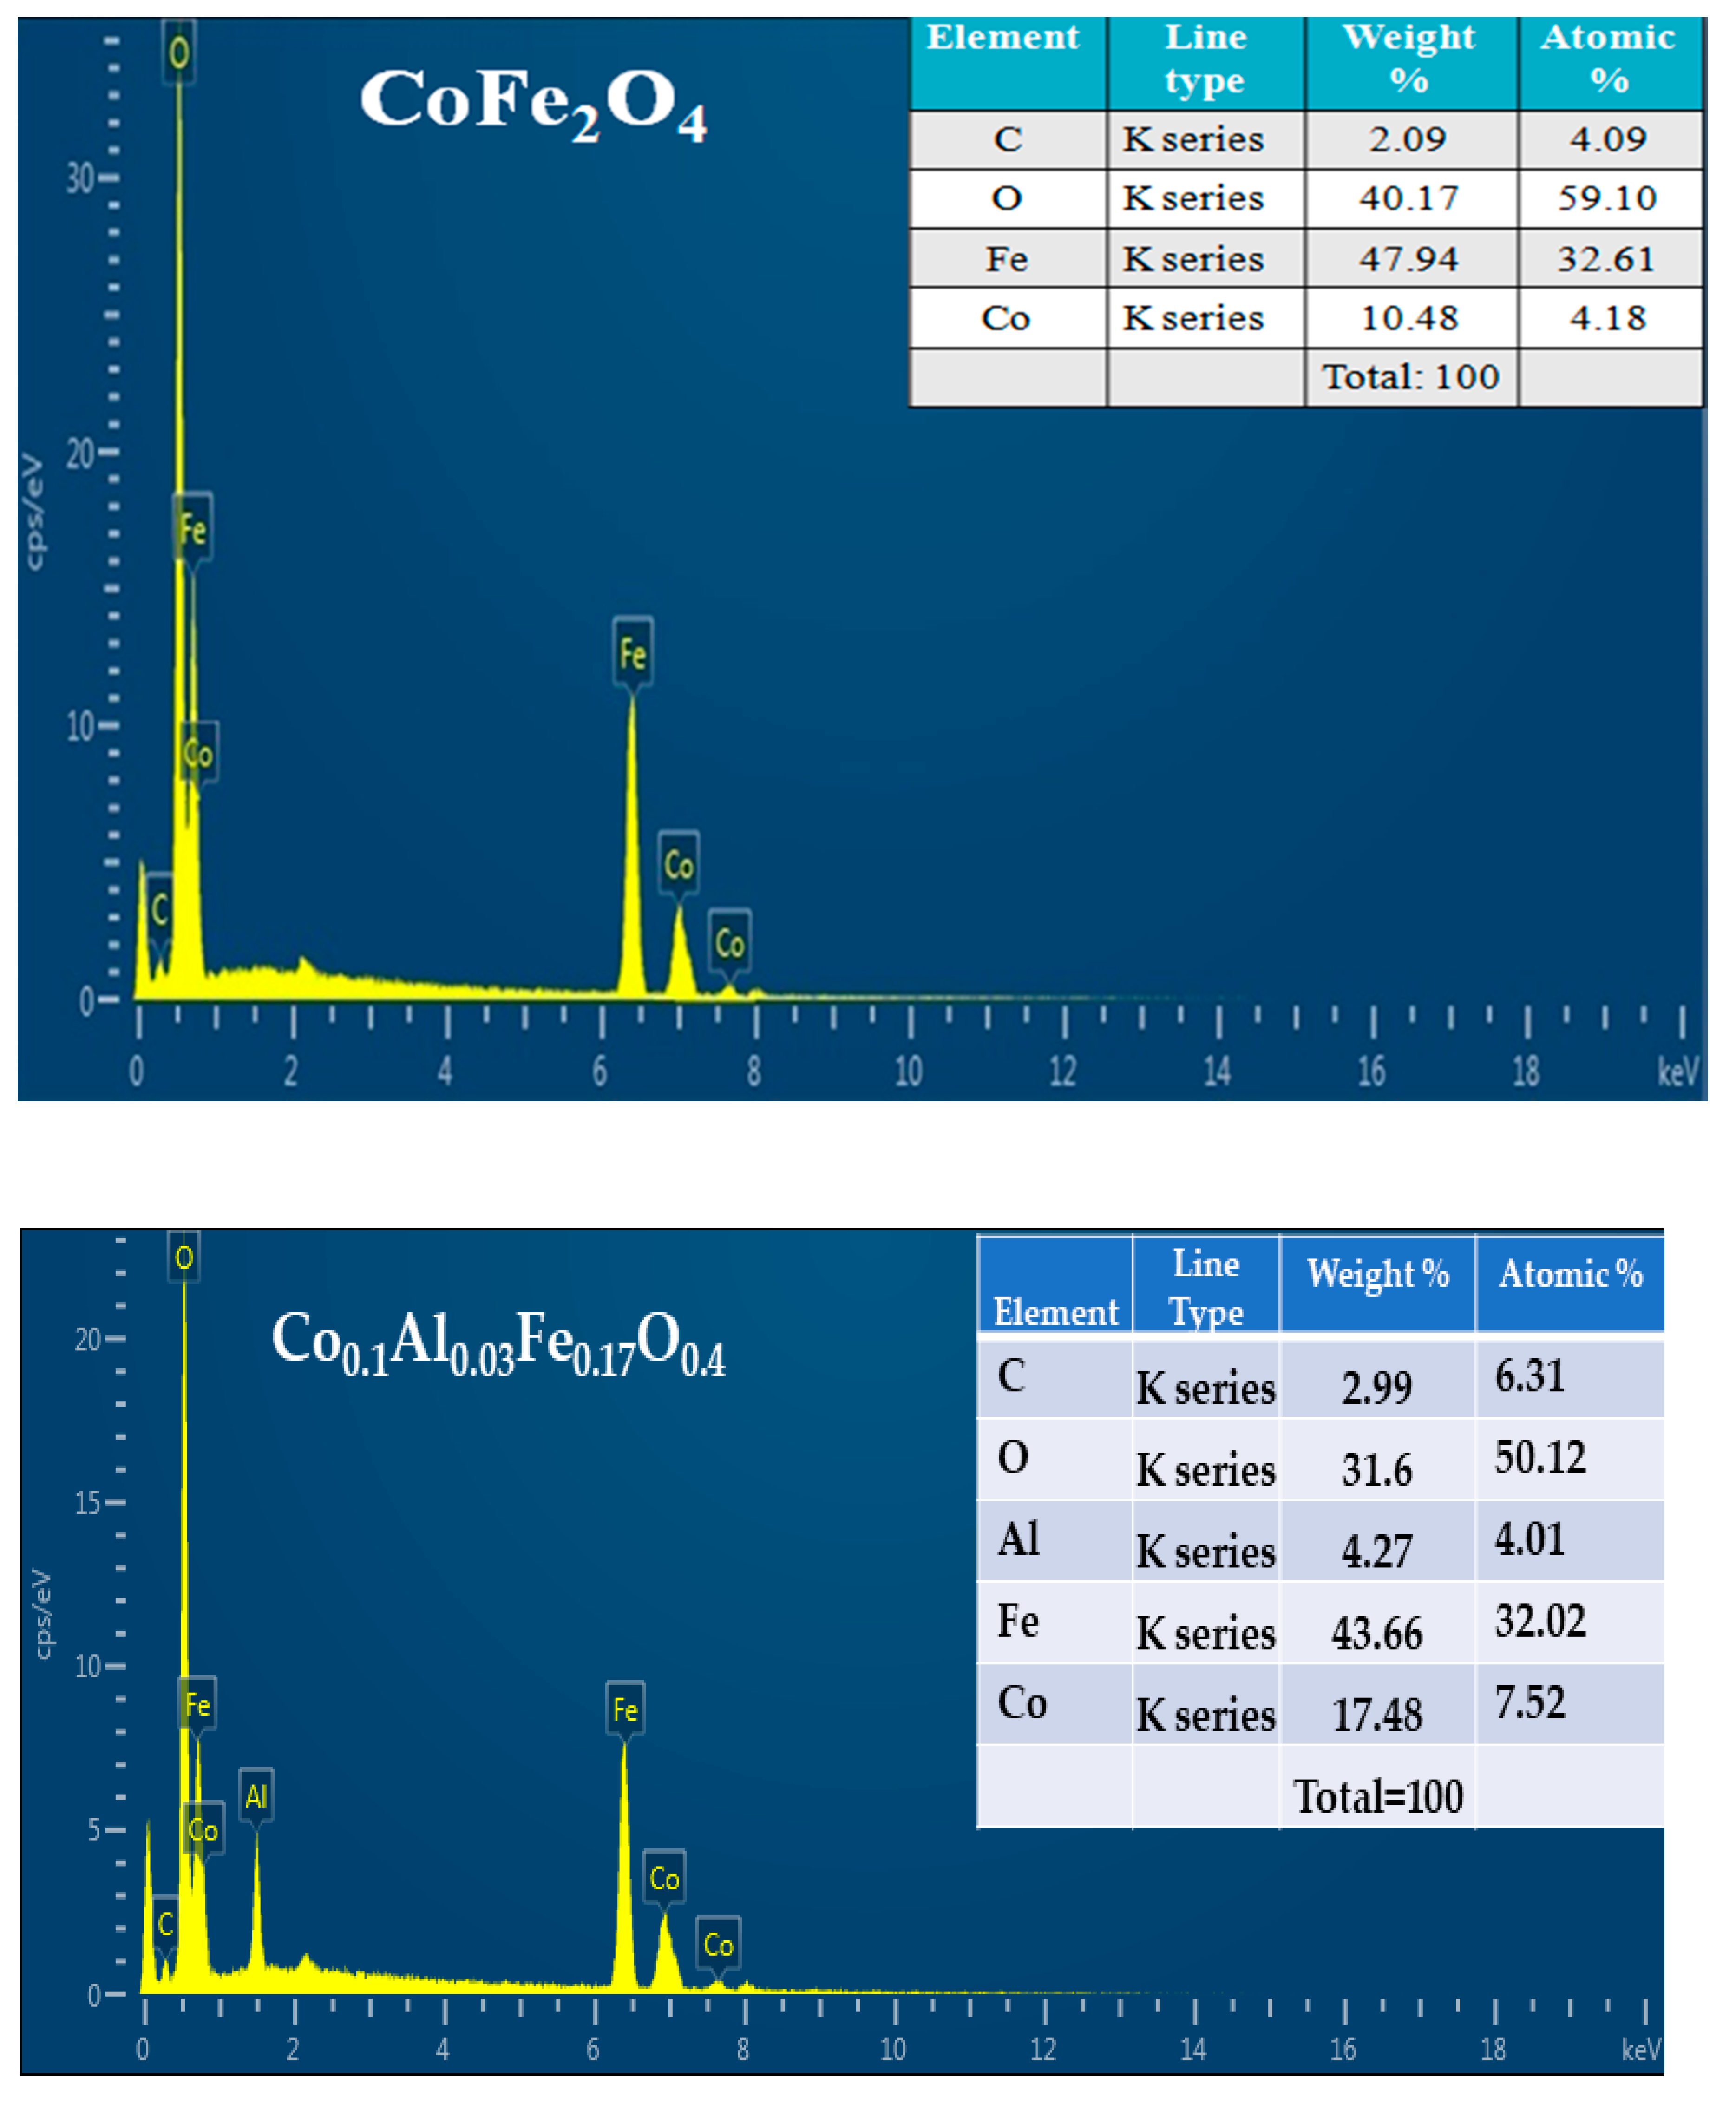
3.2.3. Energy-Dispersive X-ray Spectroscopy
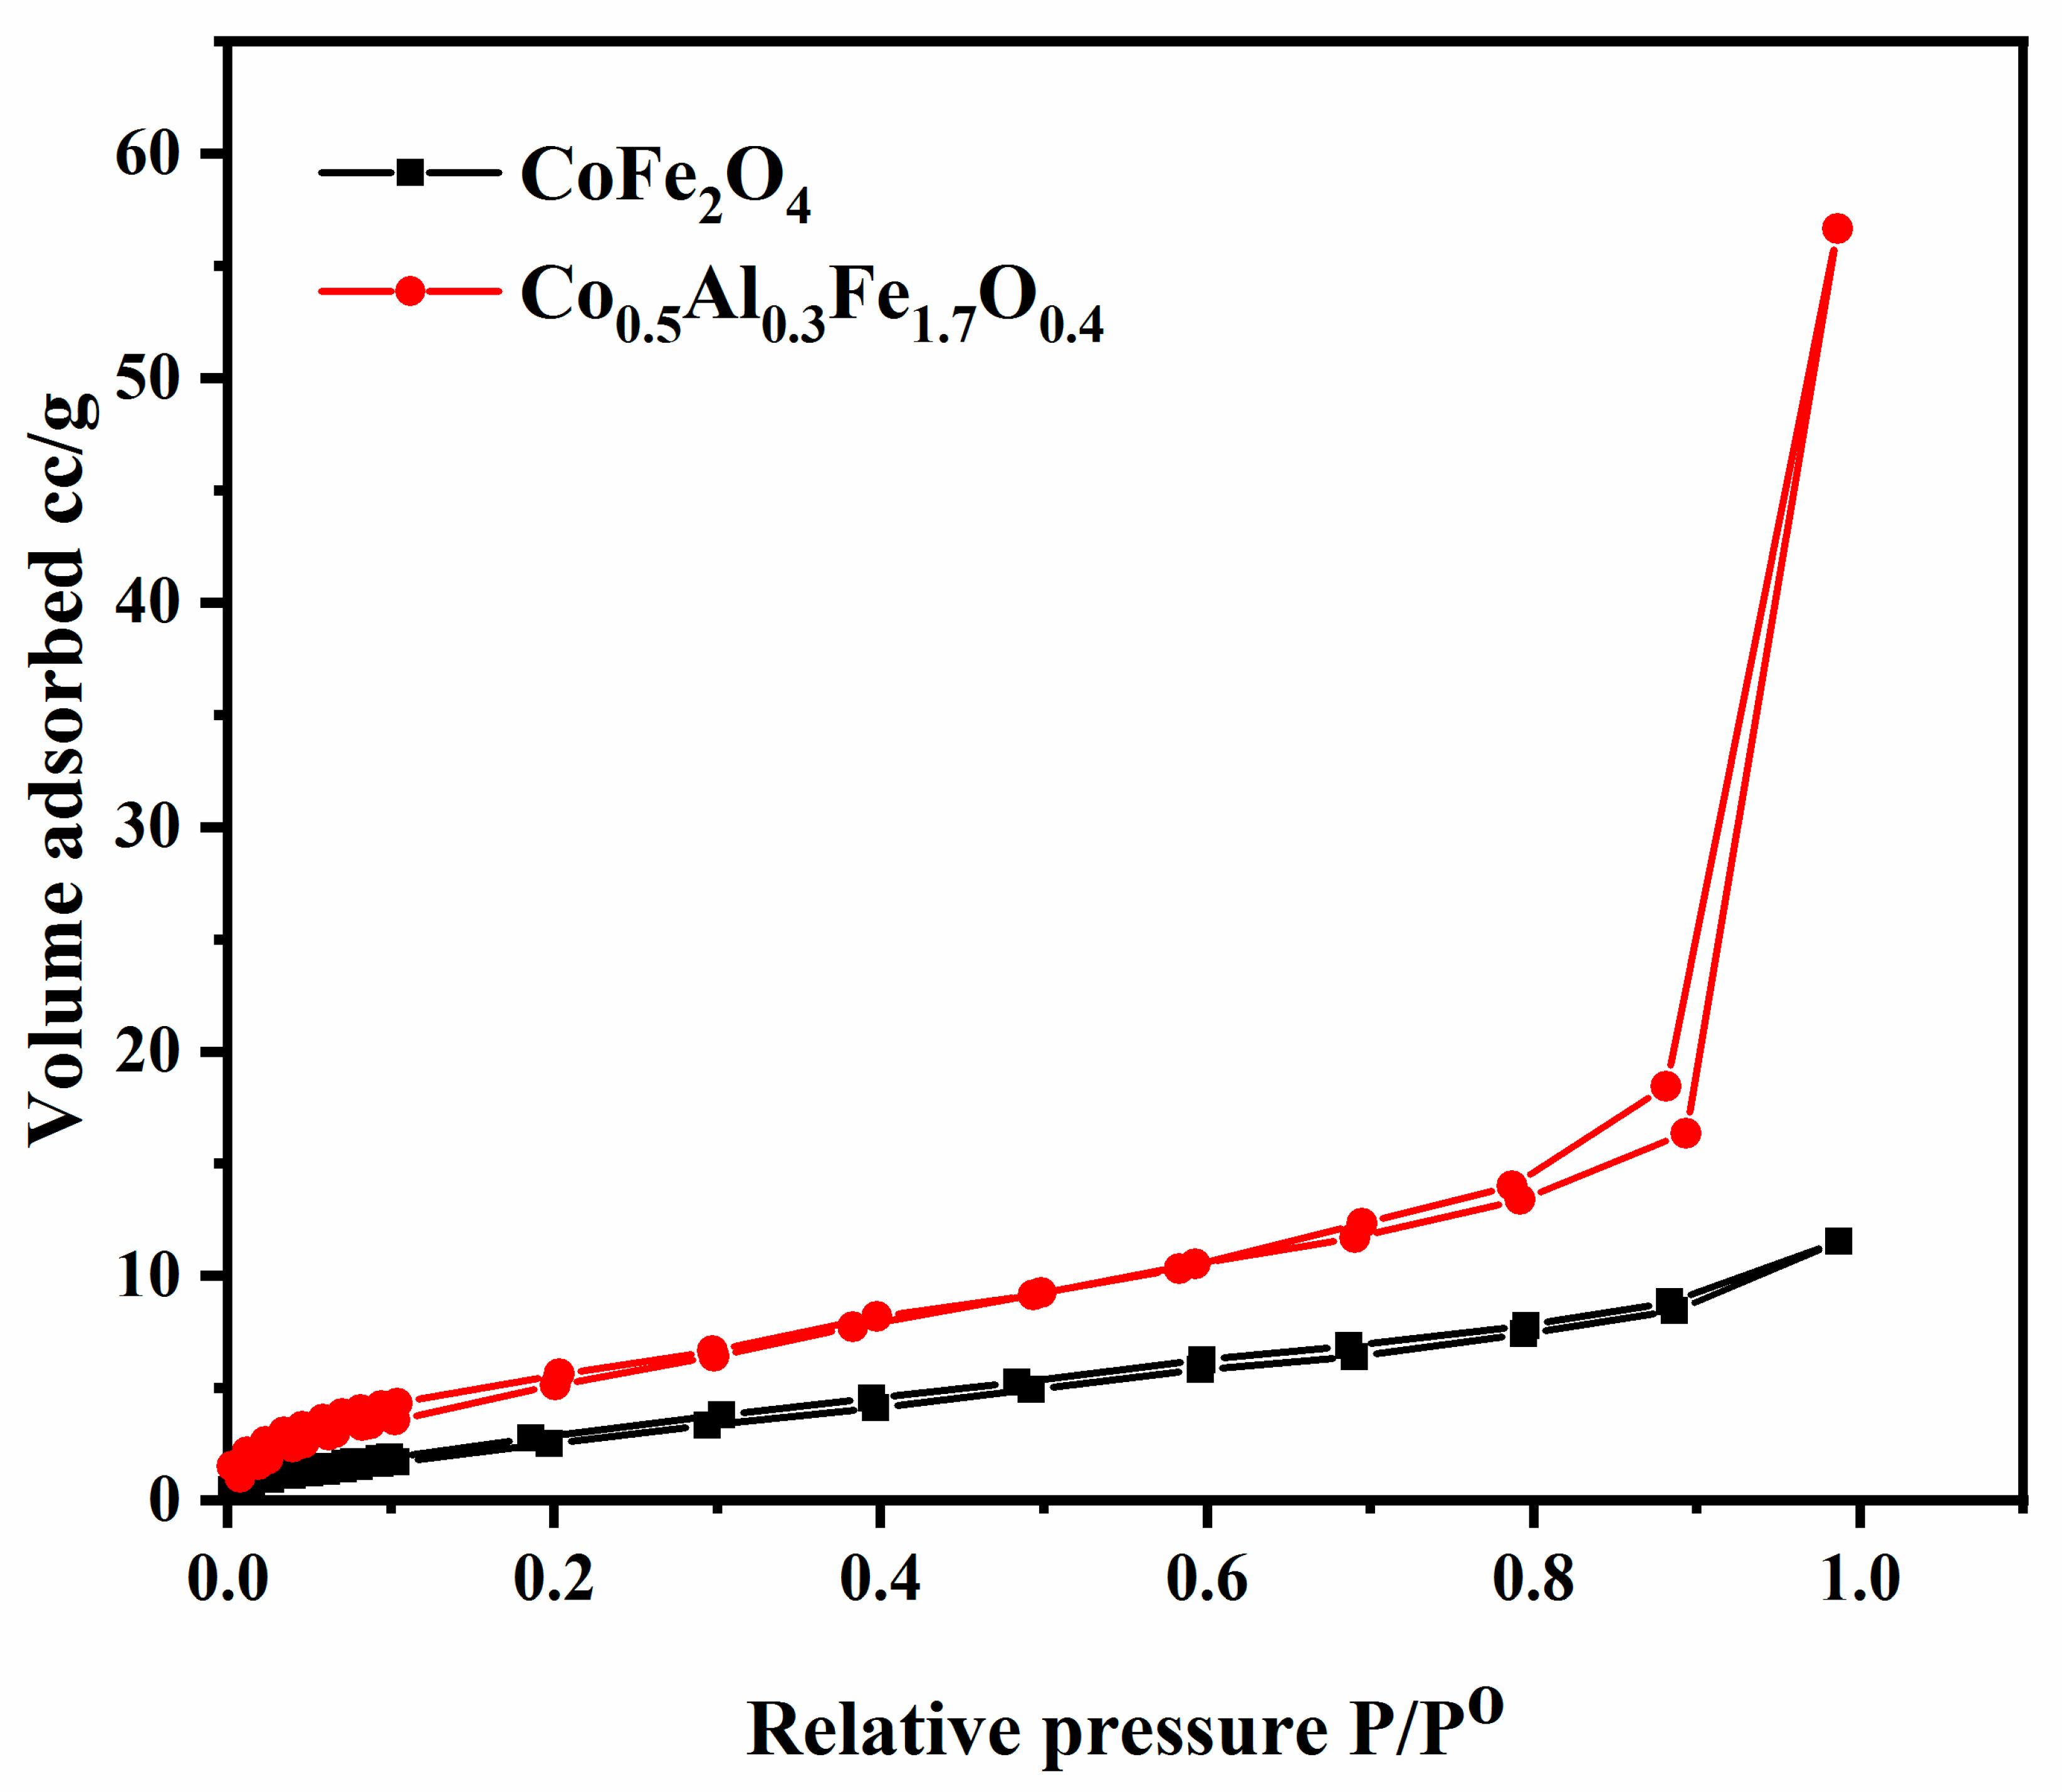
3.2.4. Nitrogen Adsorption/Desorption Studies
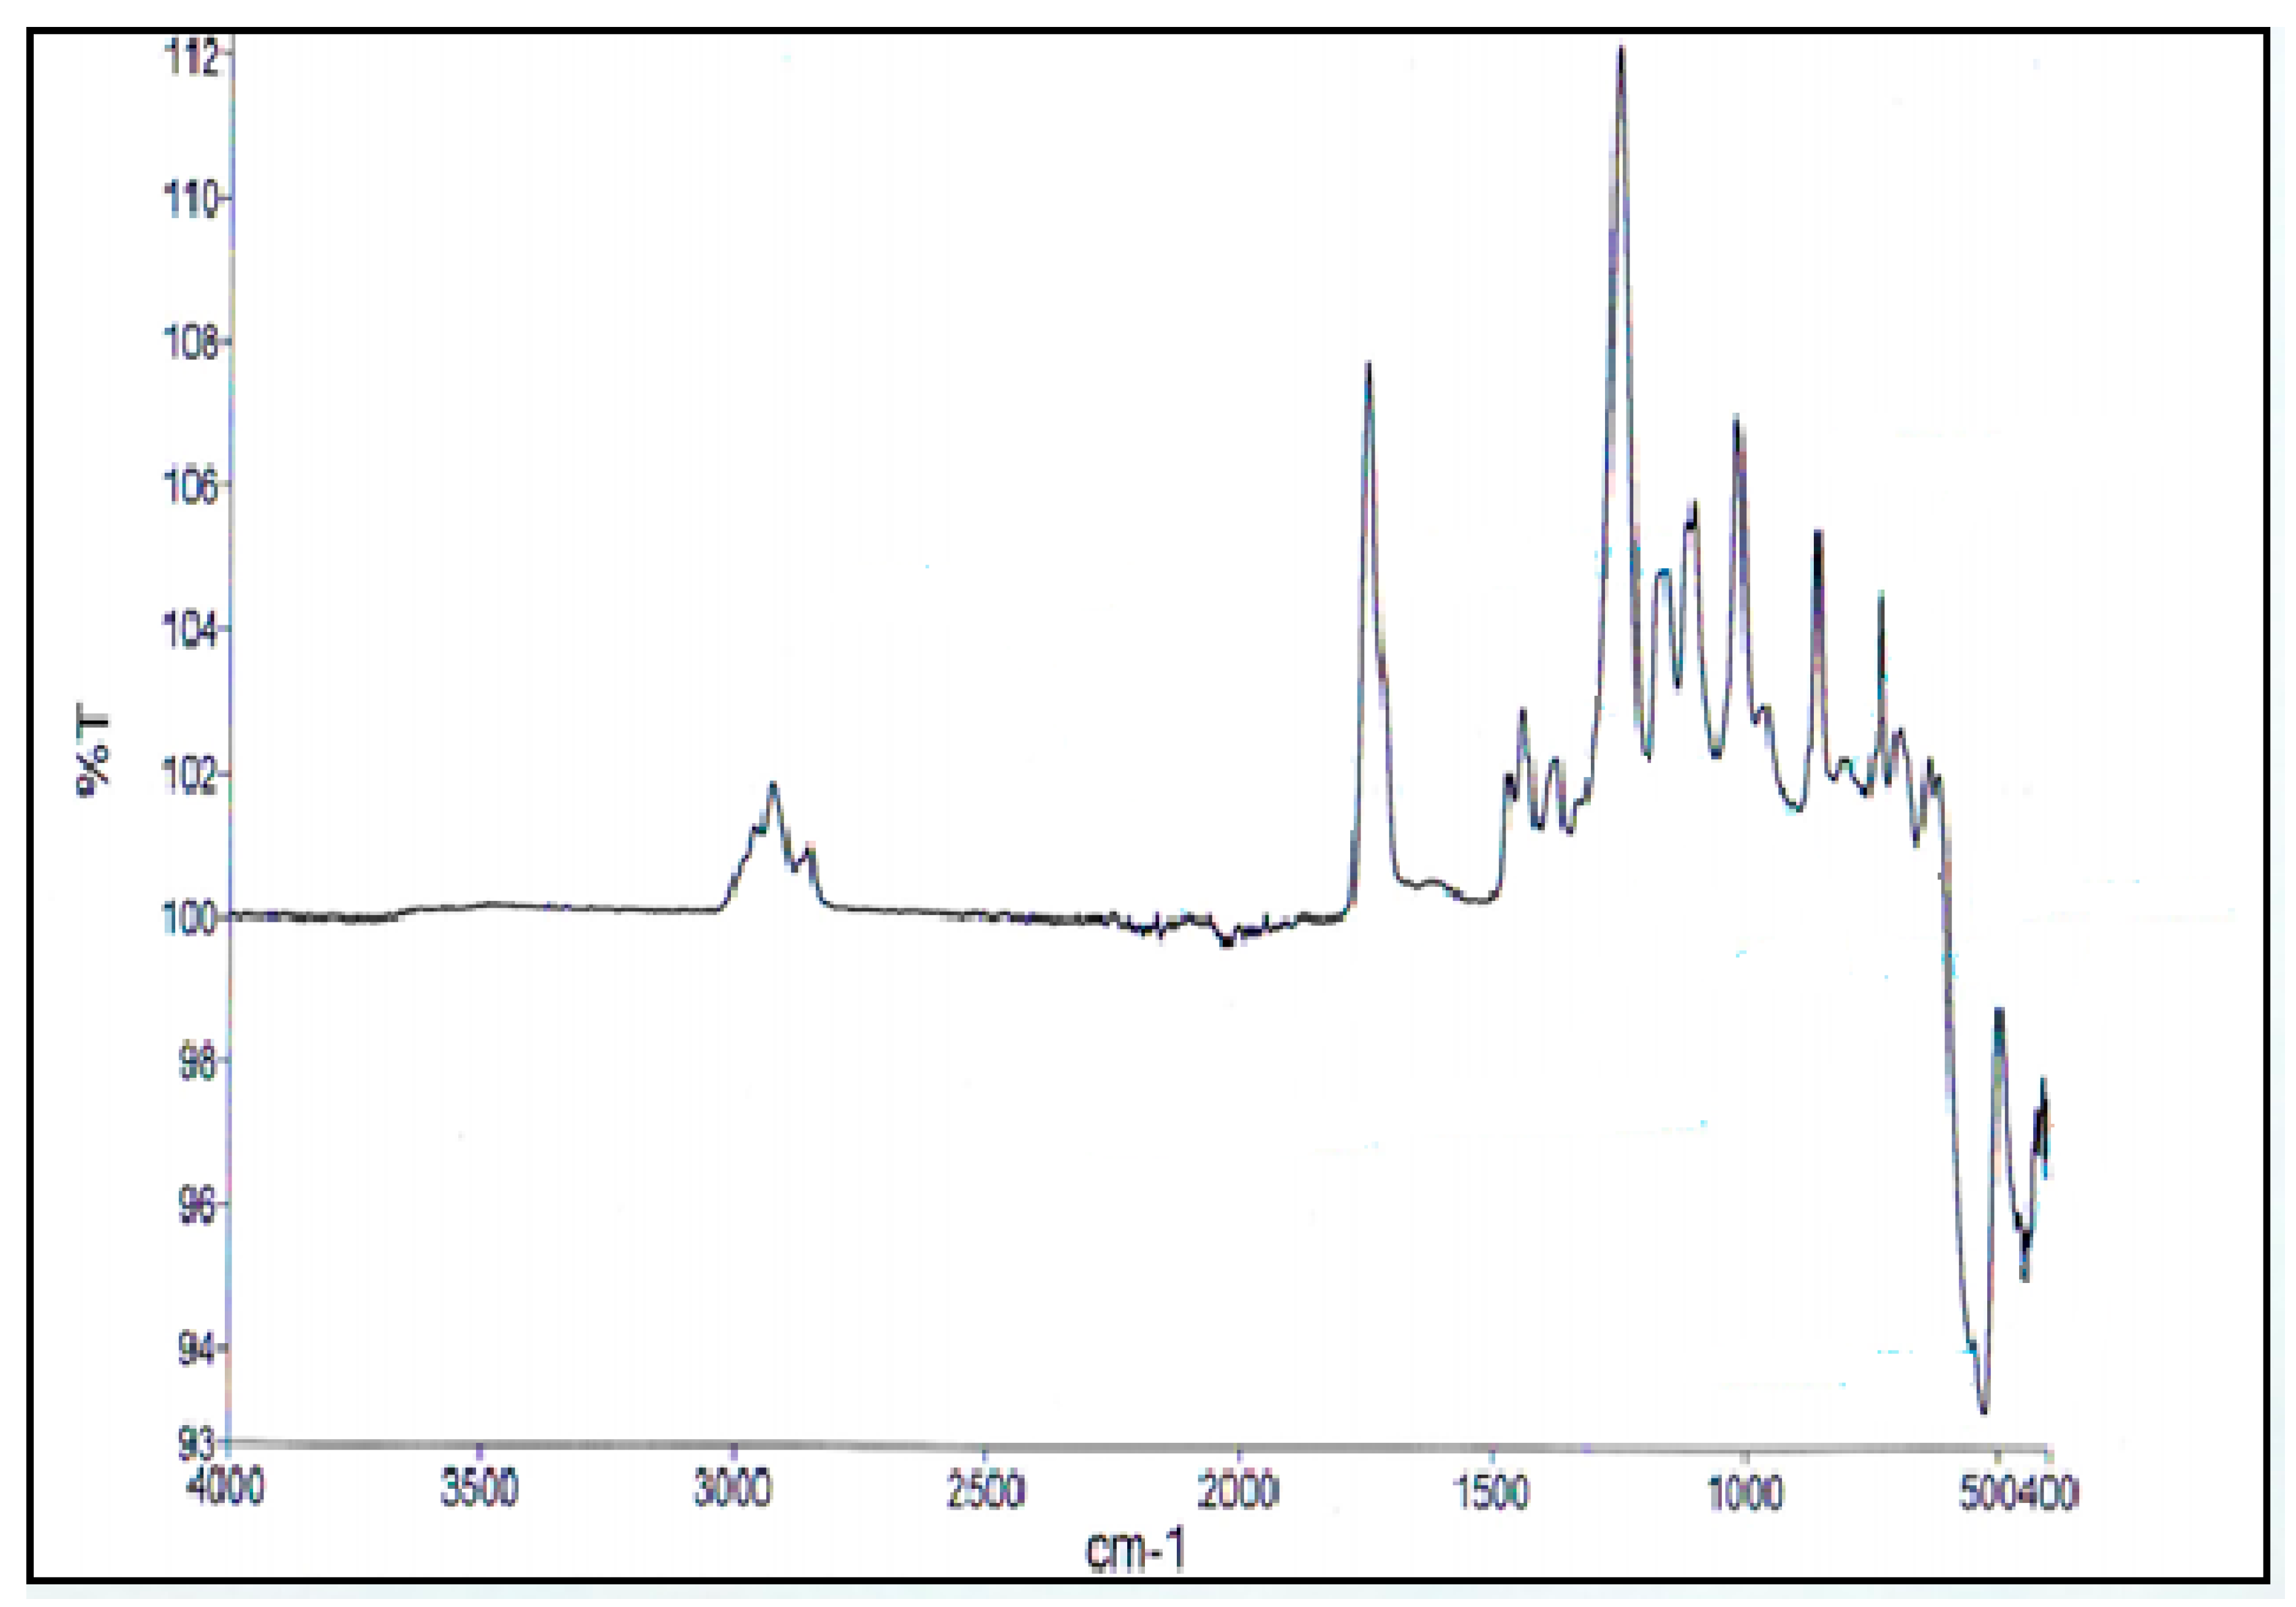
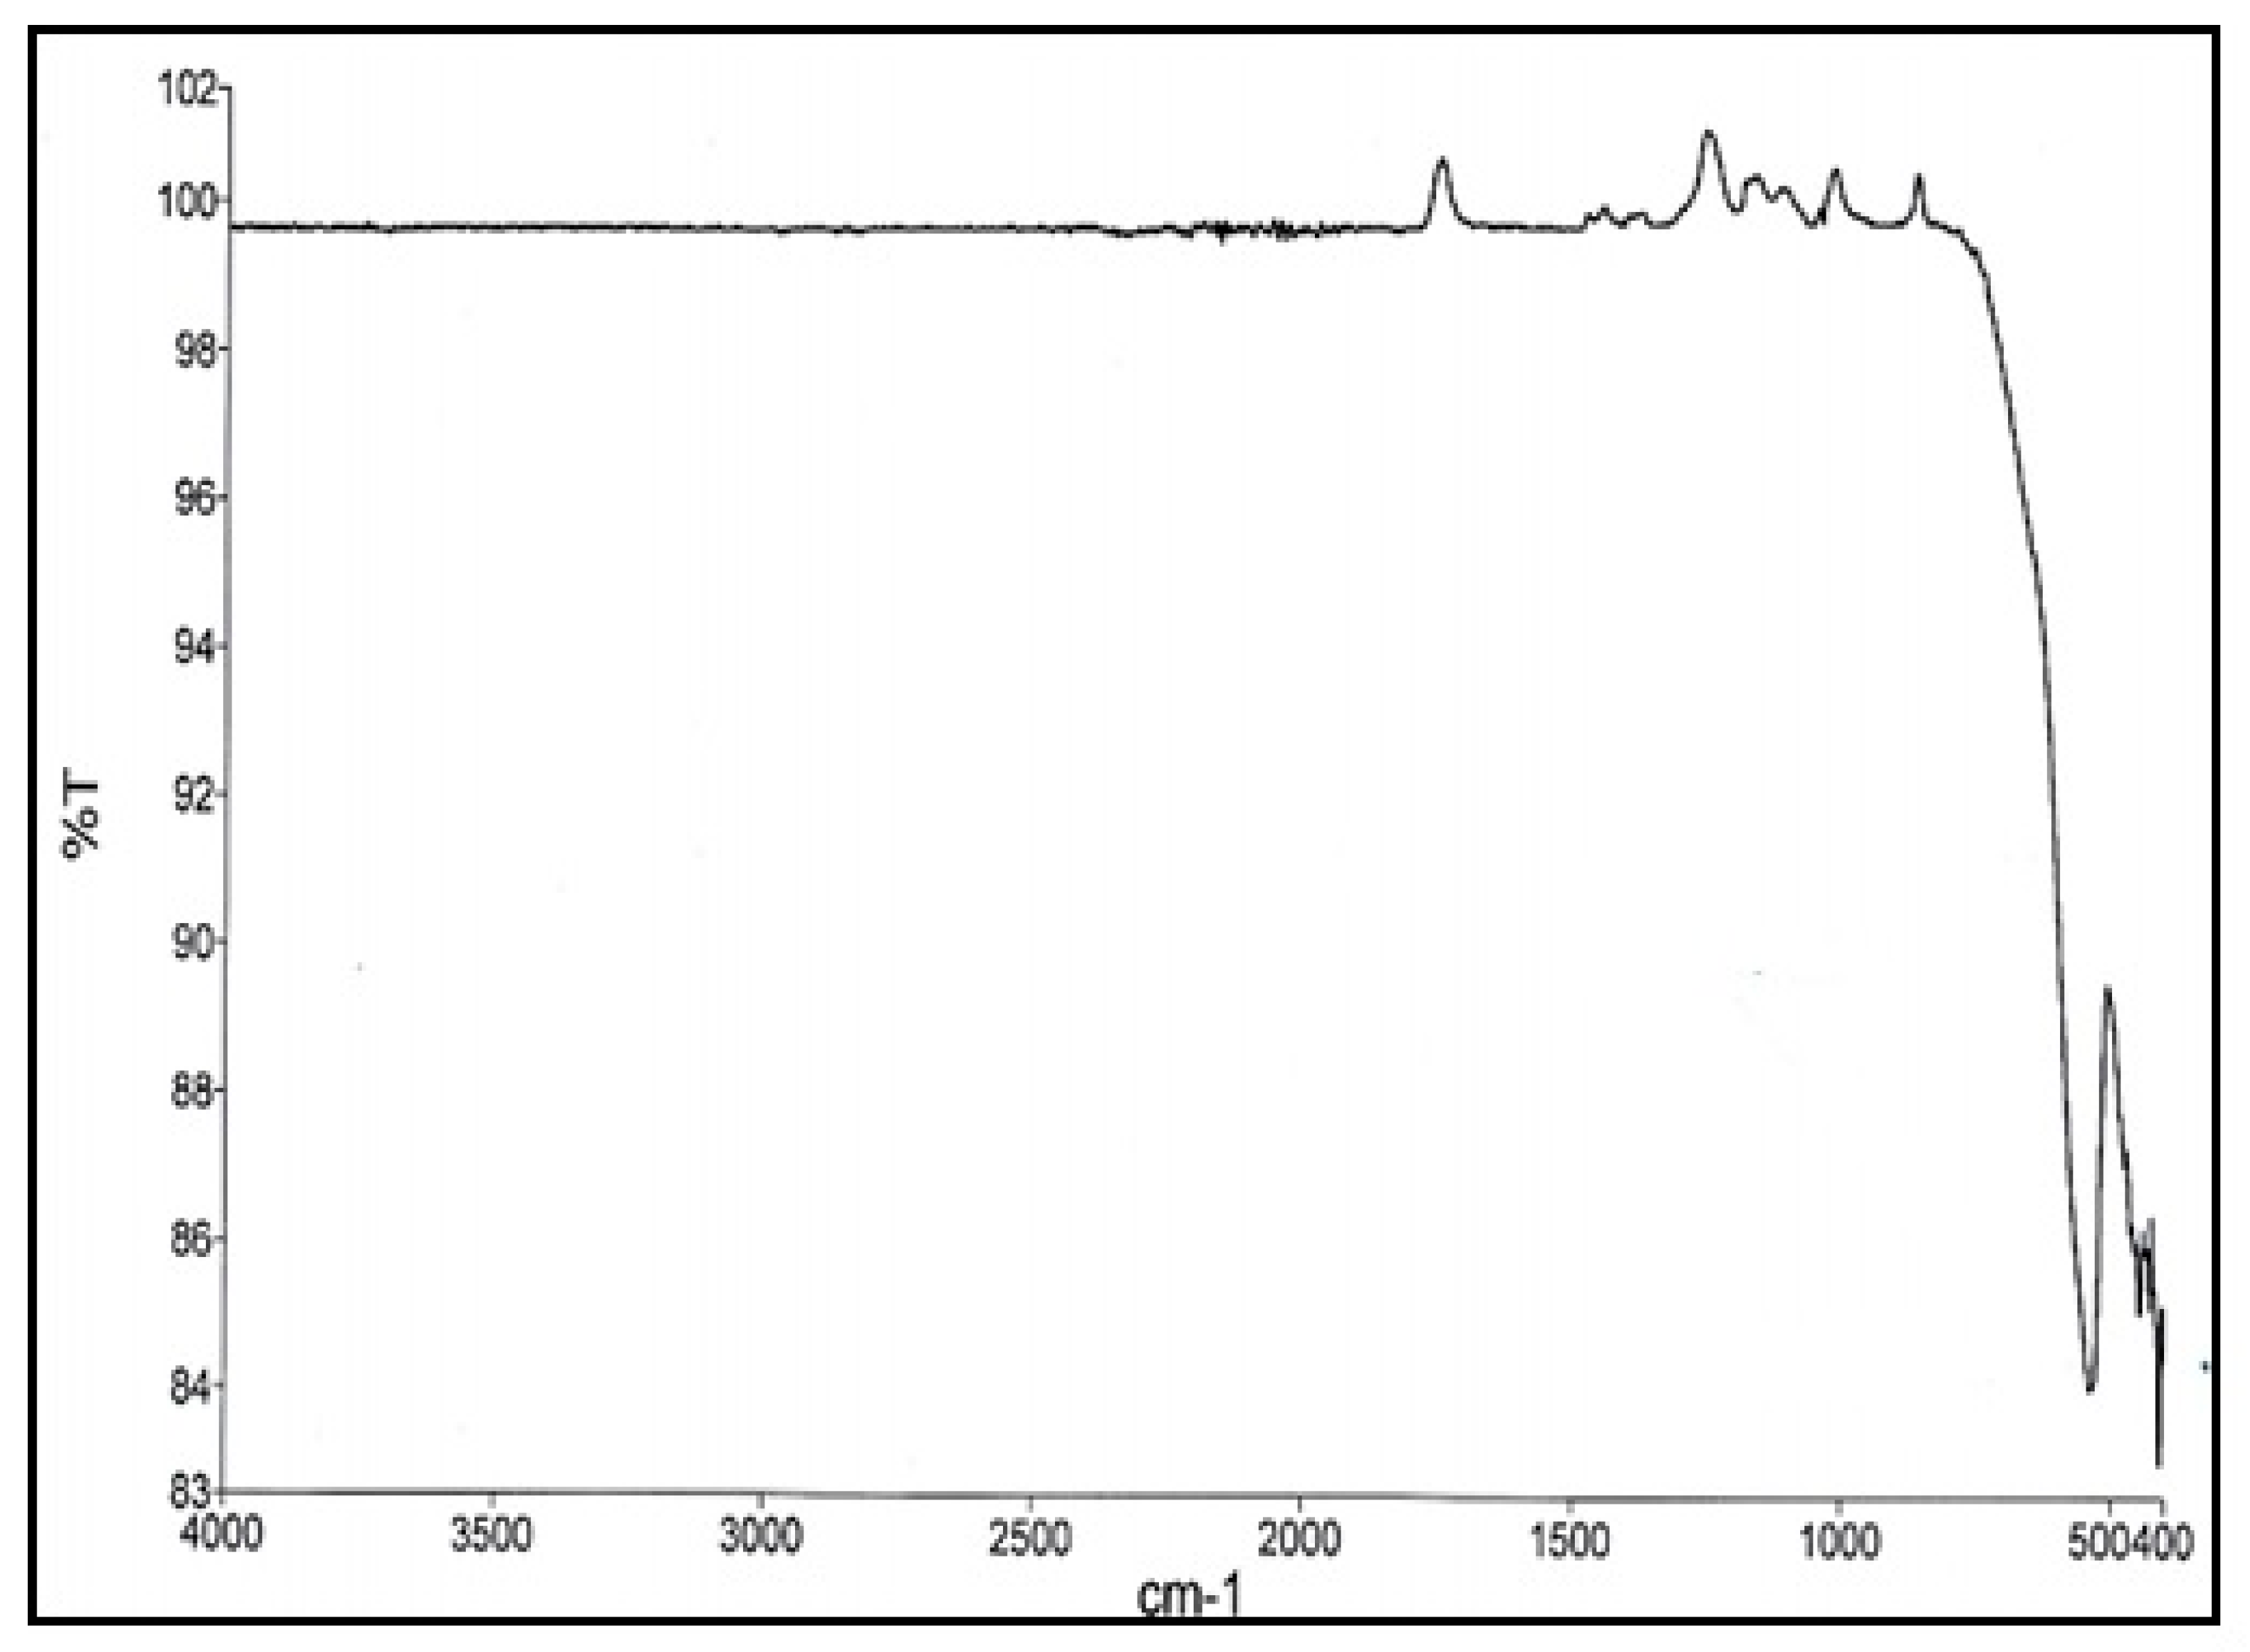
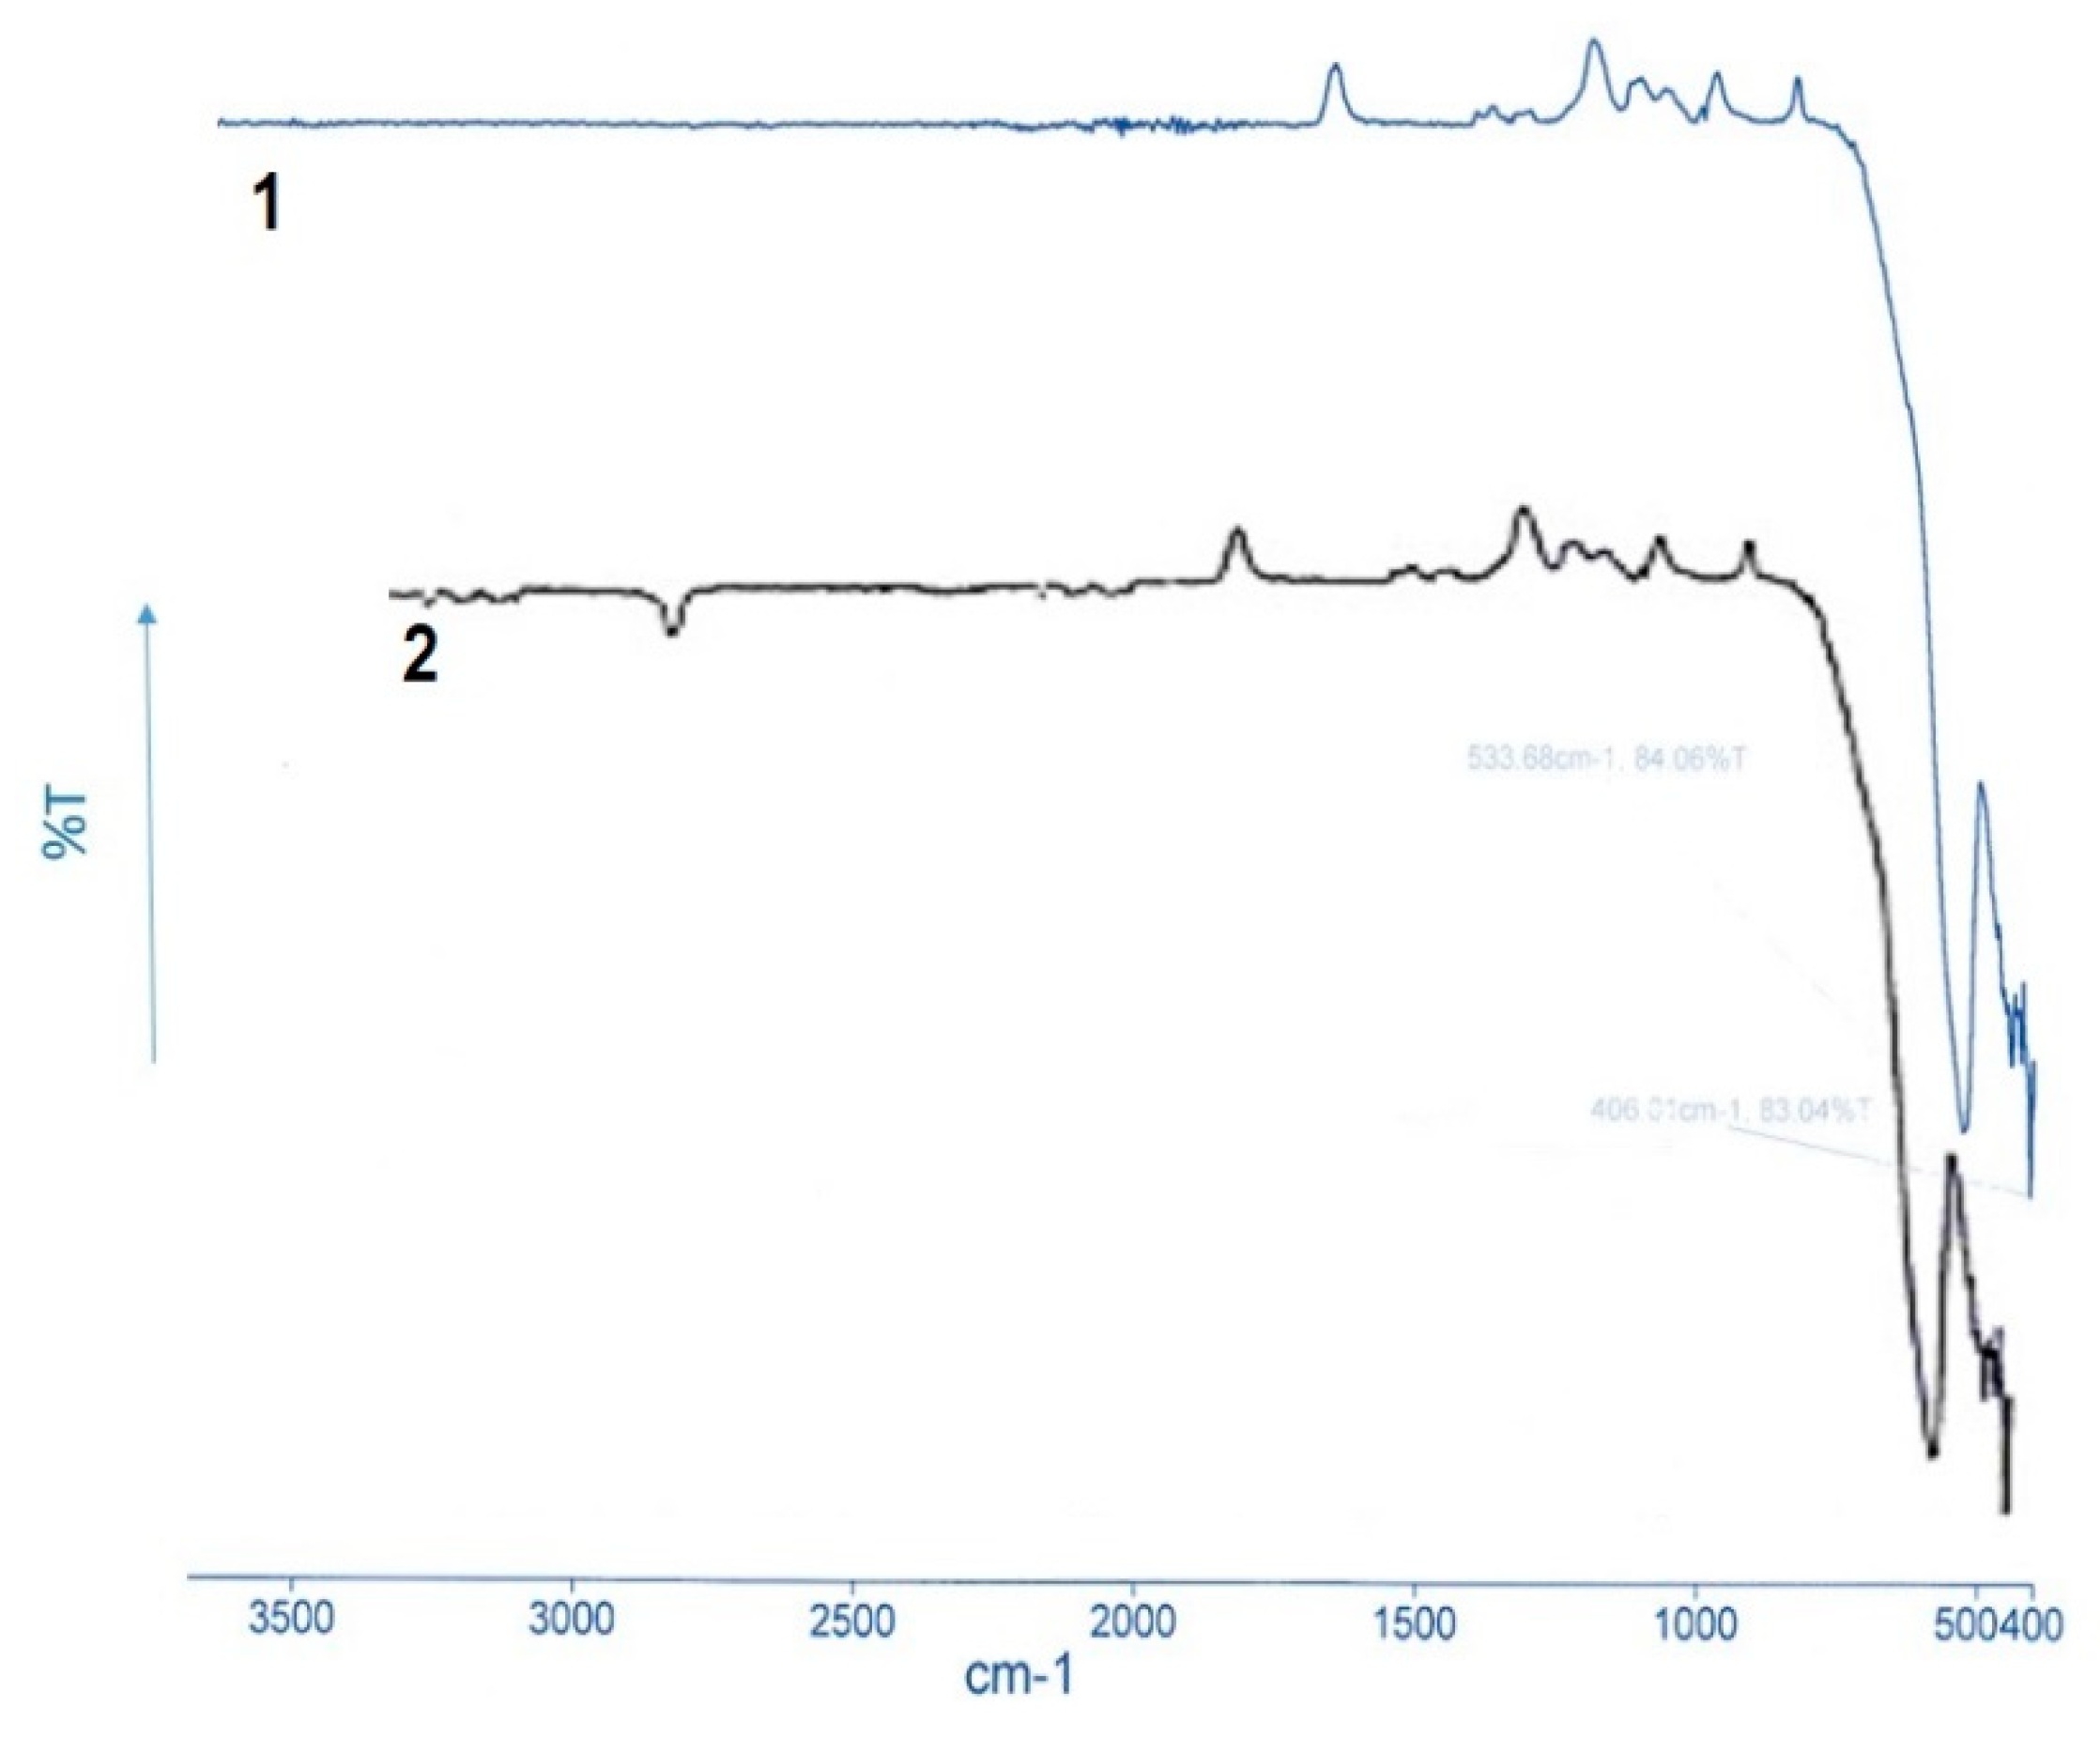
3.2.5. FTIR of Cobalt Ferrite
3.2.6. FTIR of Aluminum-Doped Cobalt Ferrite
3.3. Adsorption of MB on the Surface of Synthesized Catalysts
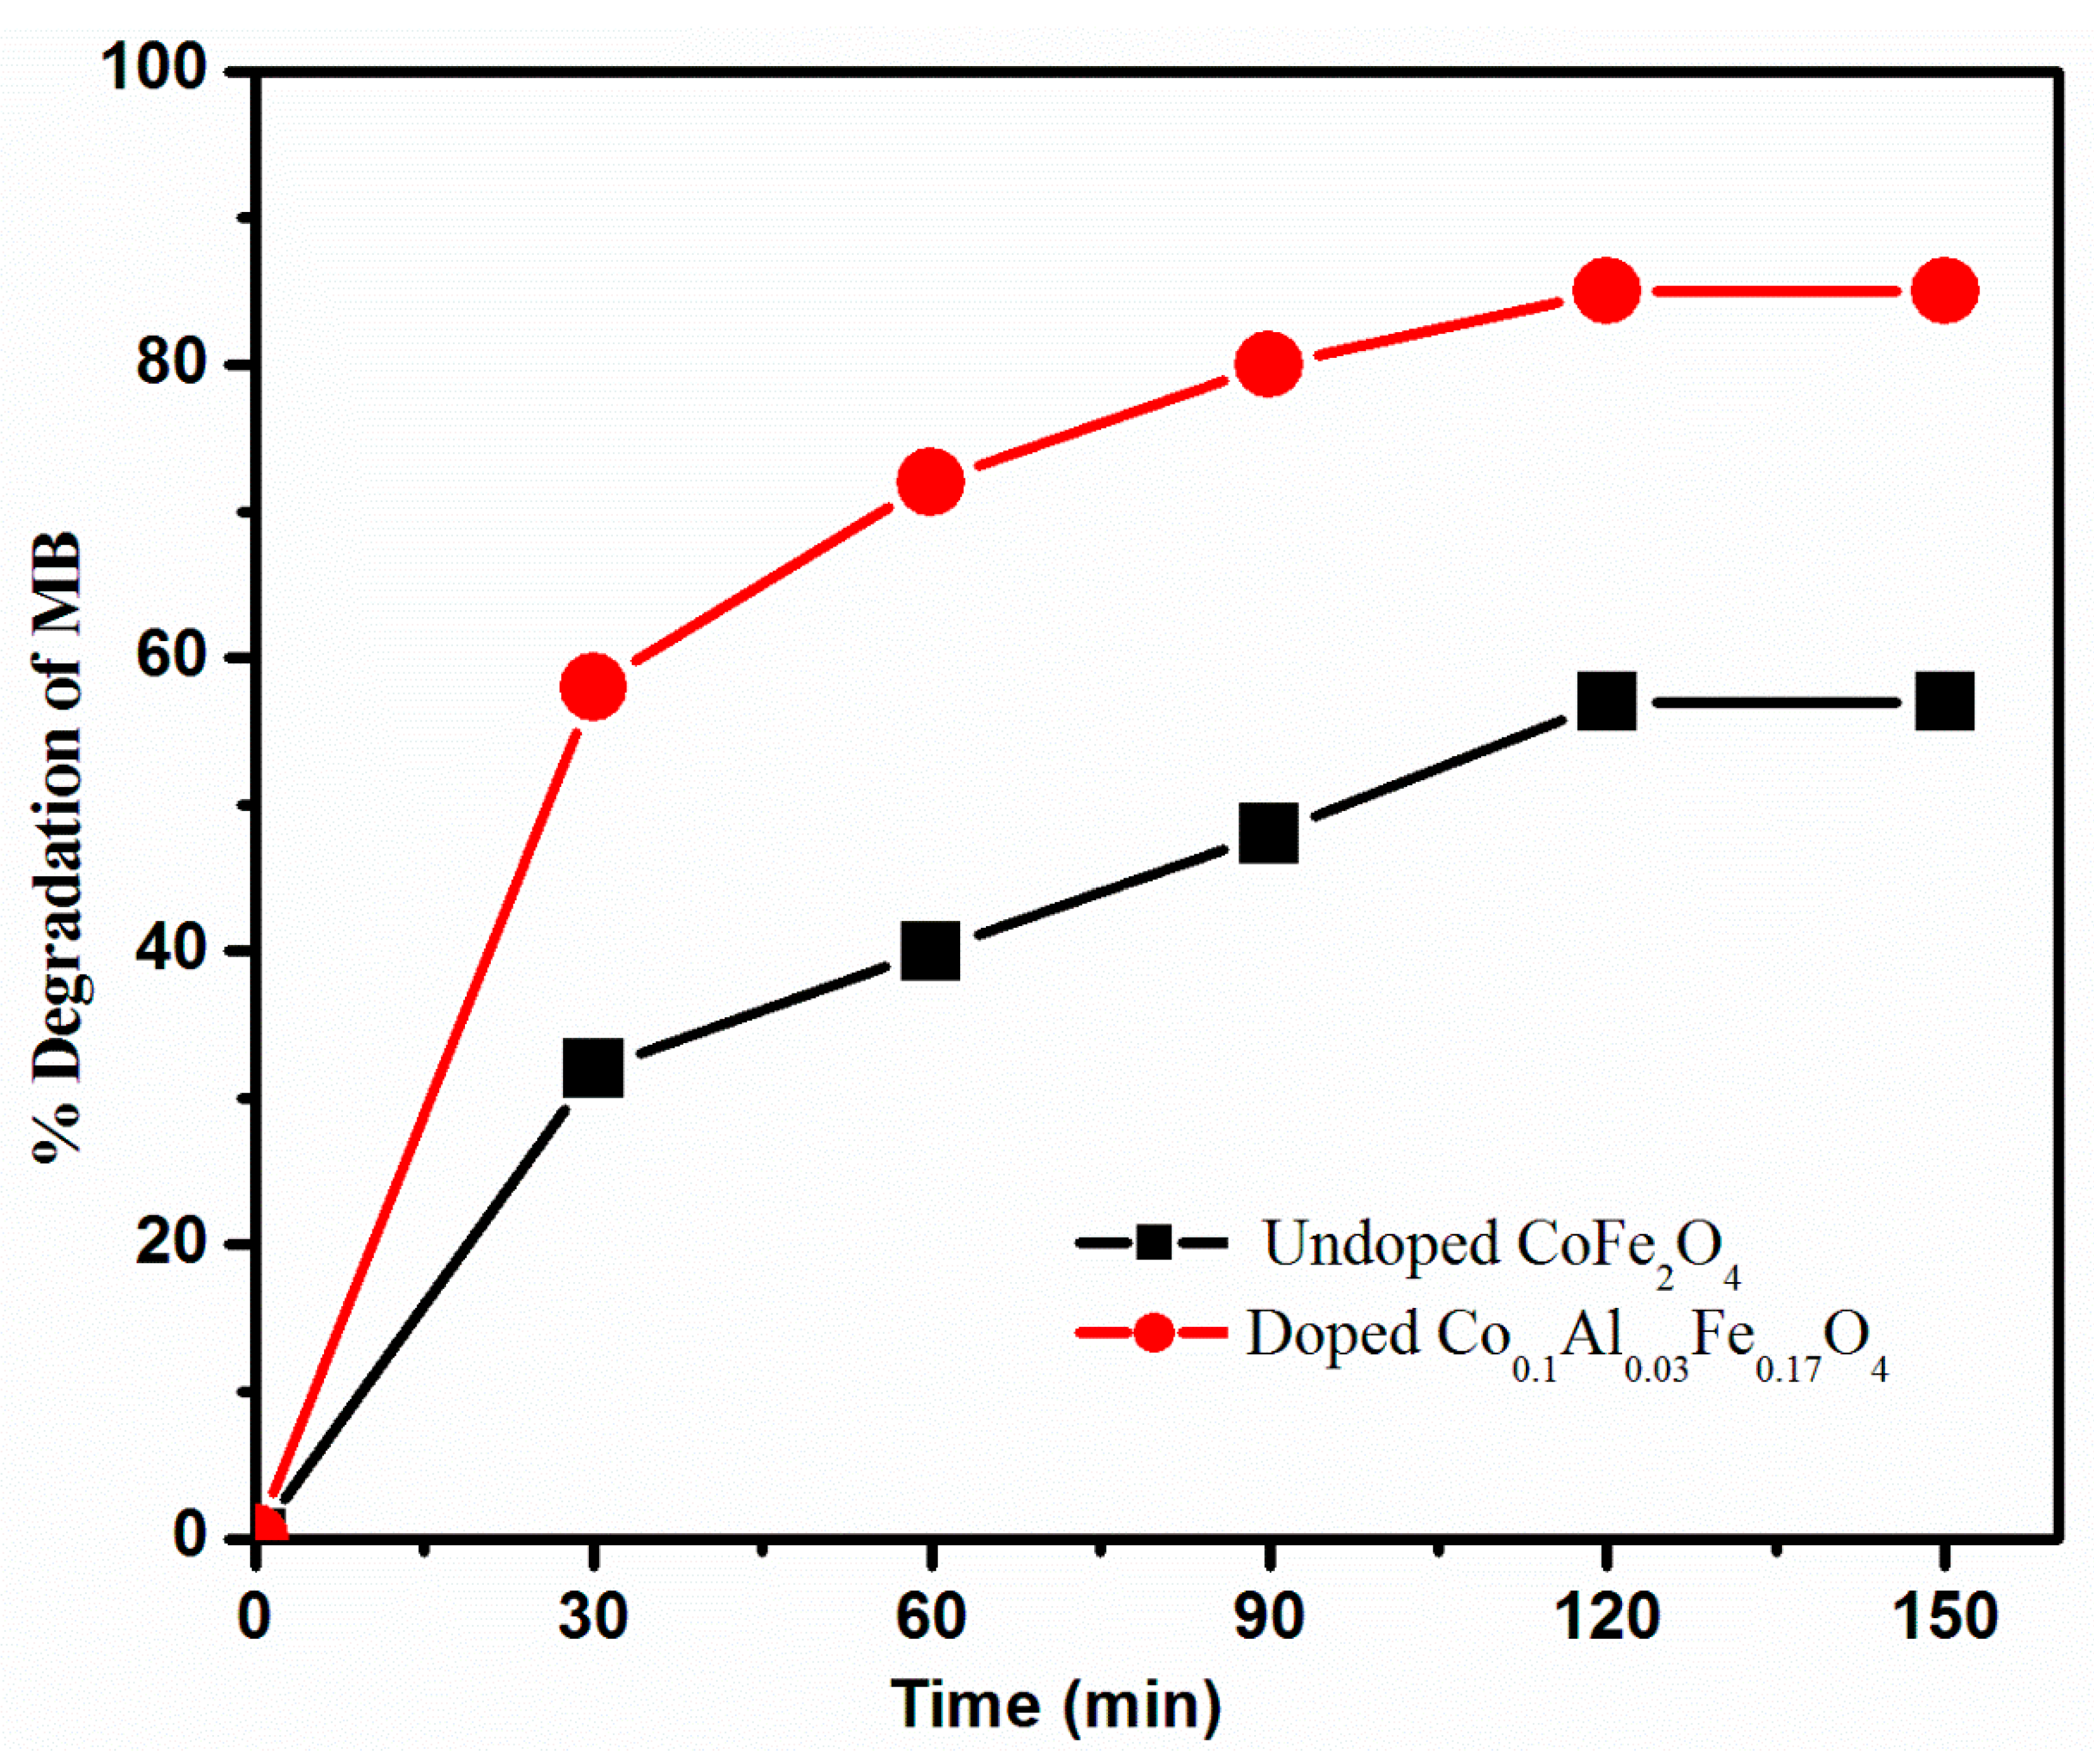
3.4. Photocatalytic Activity of Synthesized Catalysts
3.5. Optimization of Different Variables Affecting the Degradation of MB Dye
3.5.1. Effect of Time
3.5.2. Effect of pH
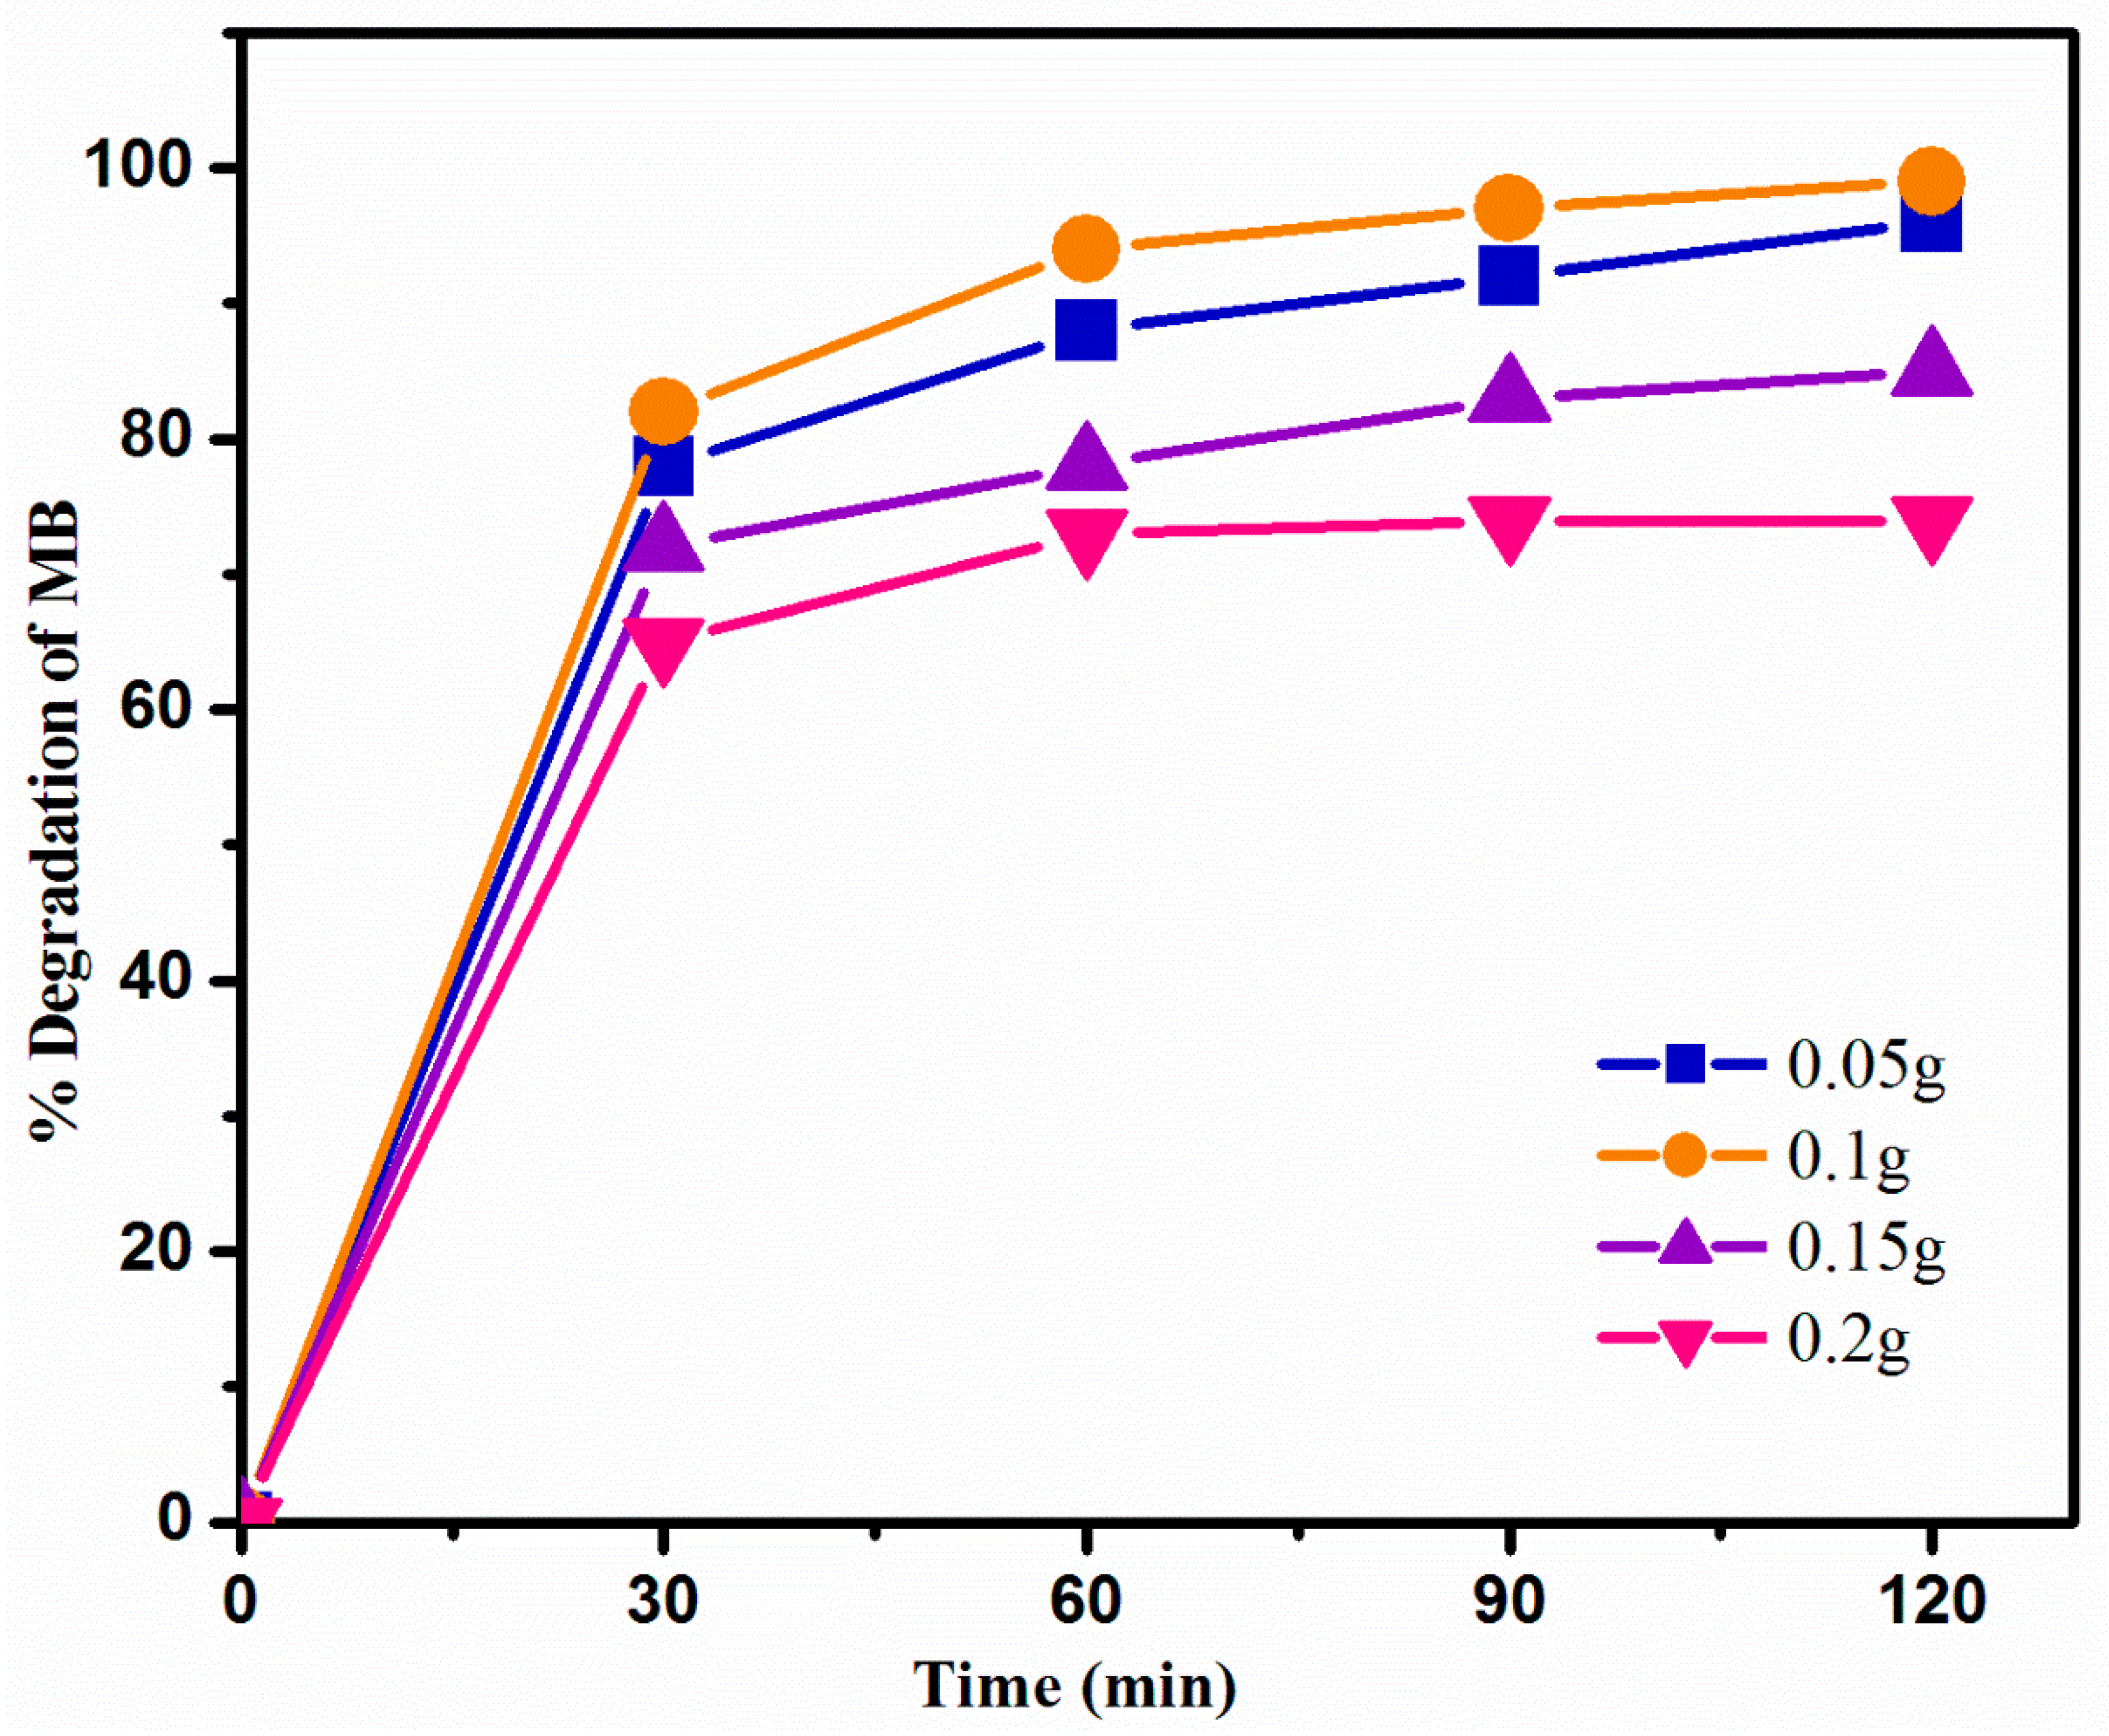
3.5.3. Effect of Catalyst Dose
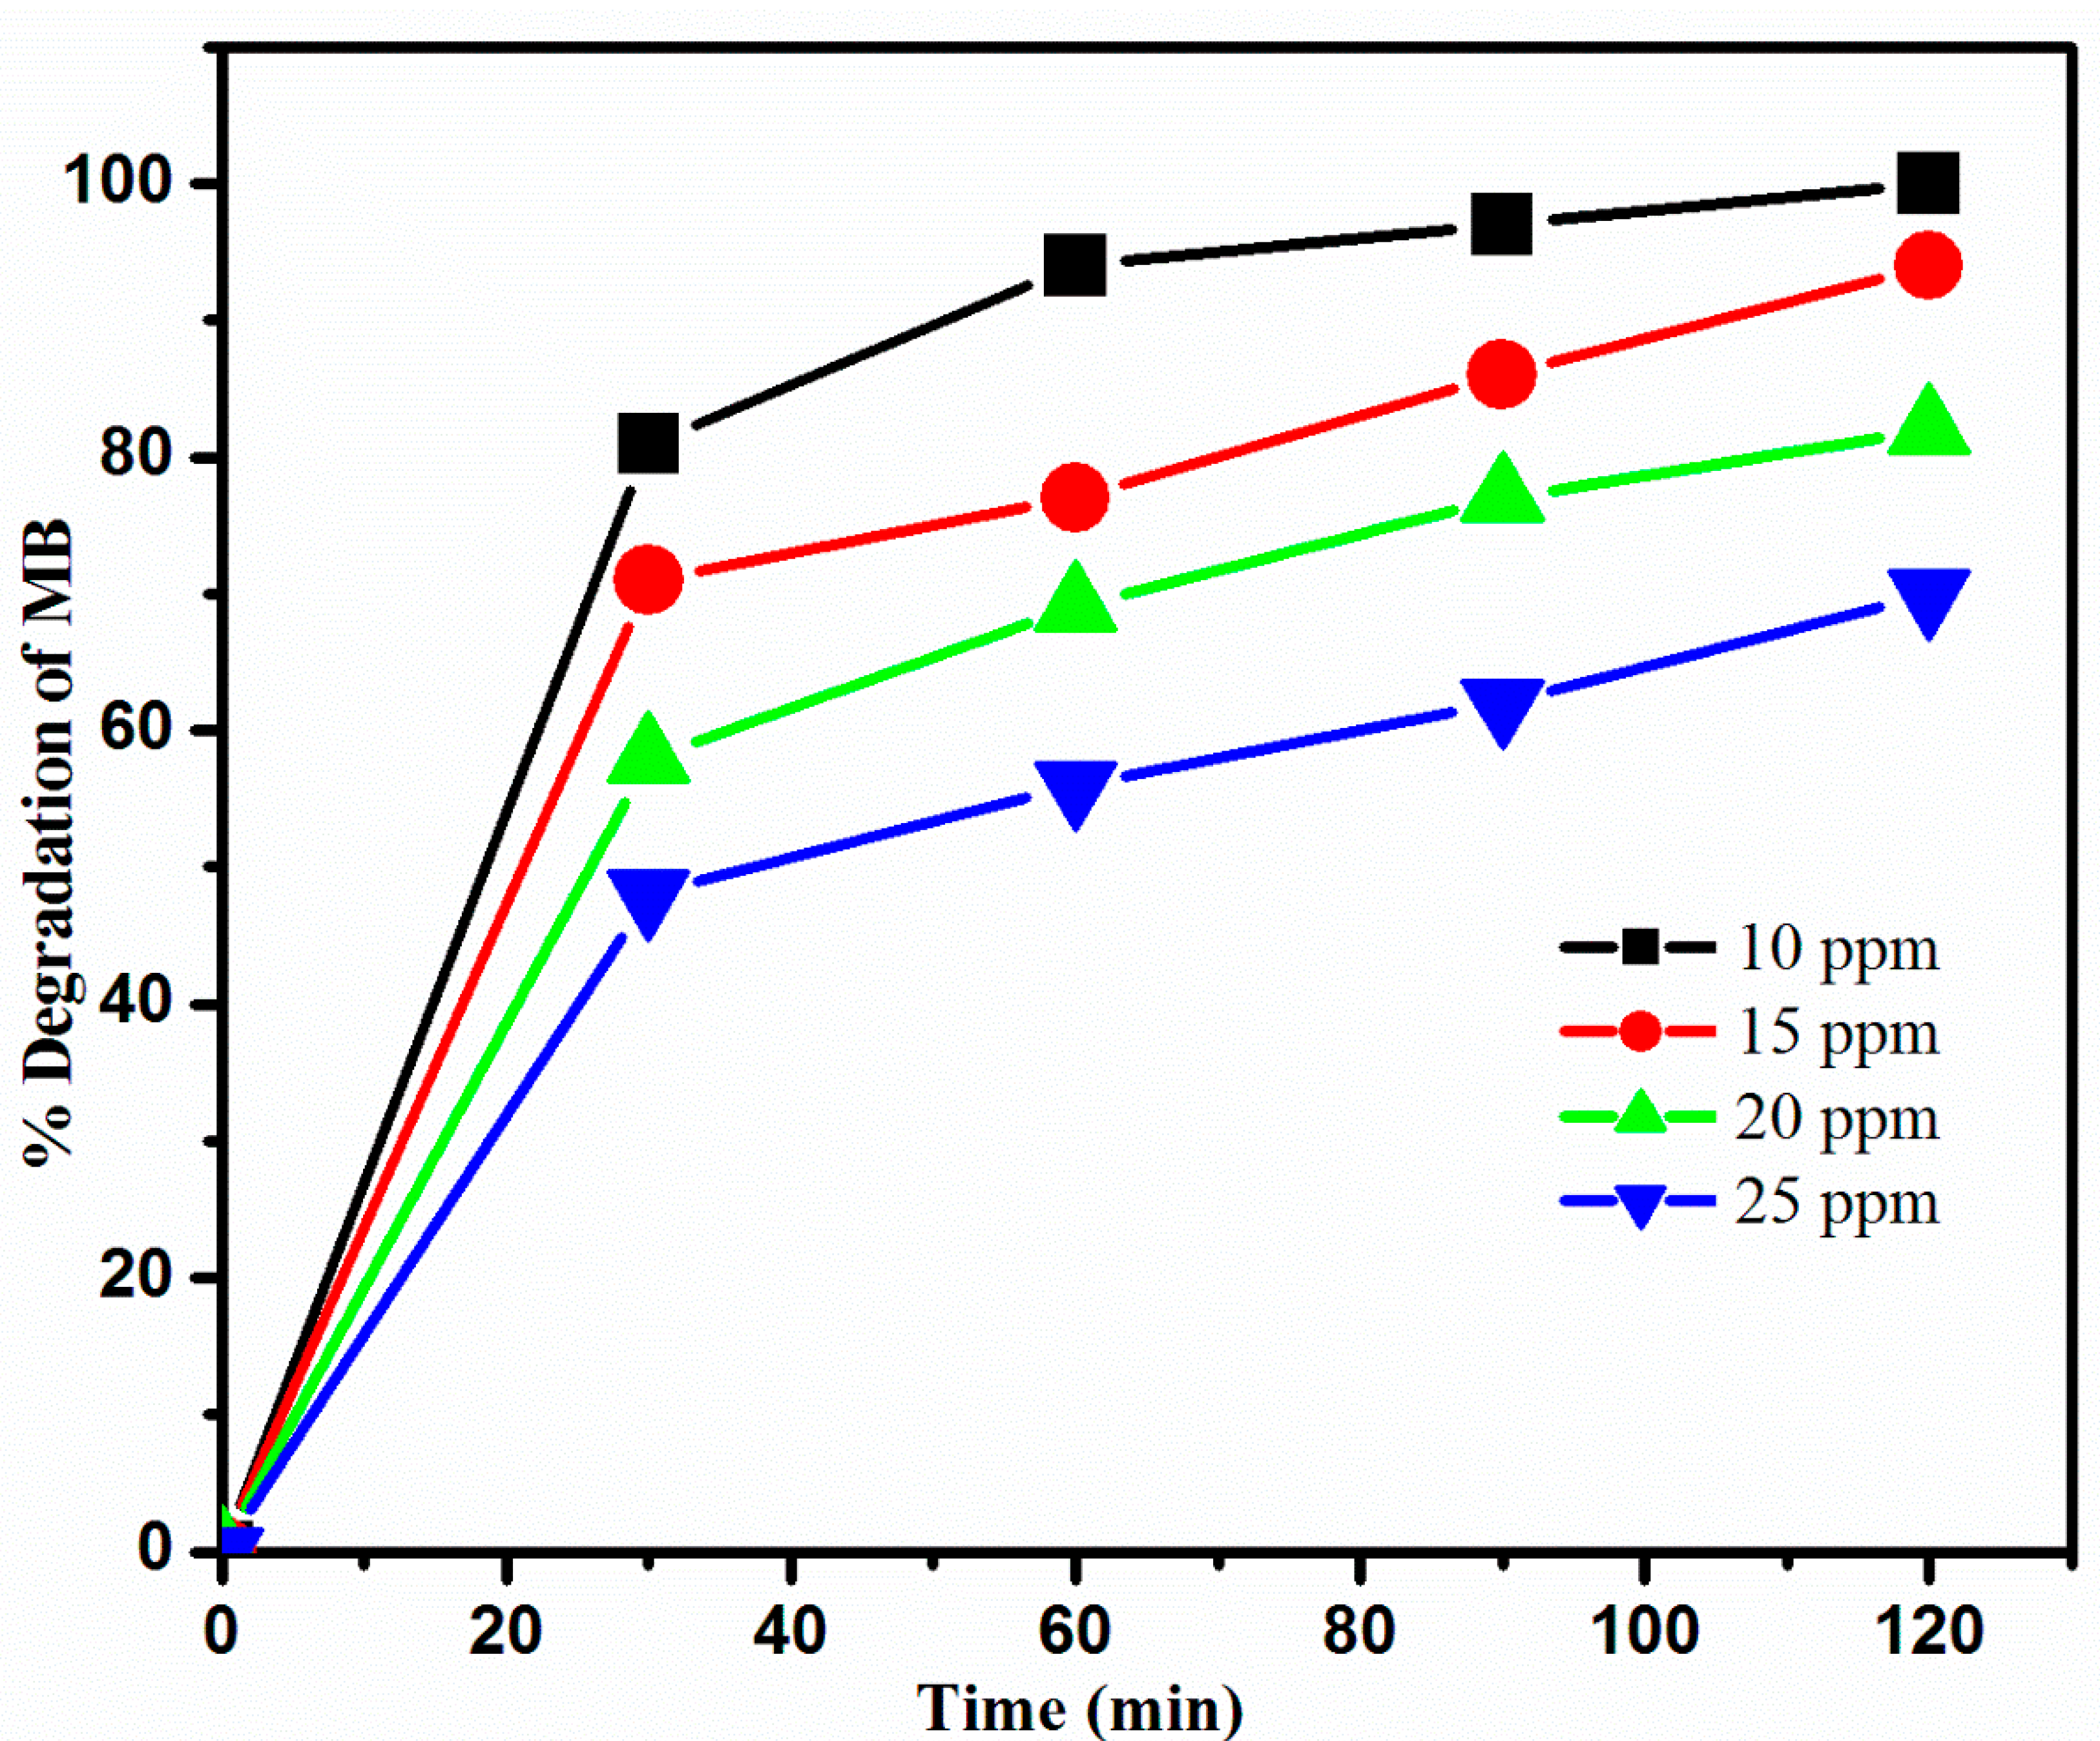
3.5.4. Effect of Initial Concentration of MB Dye Solution
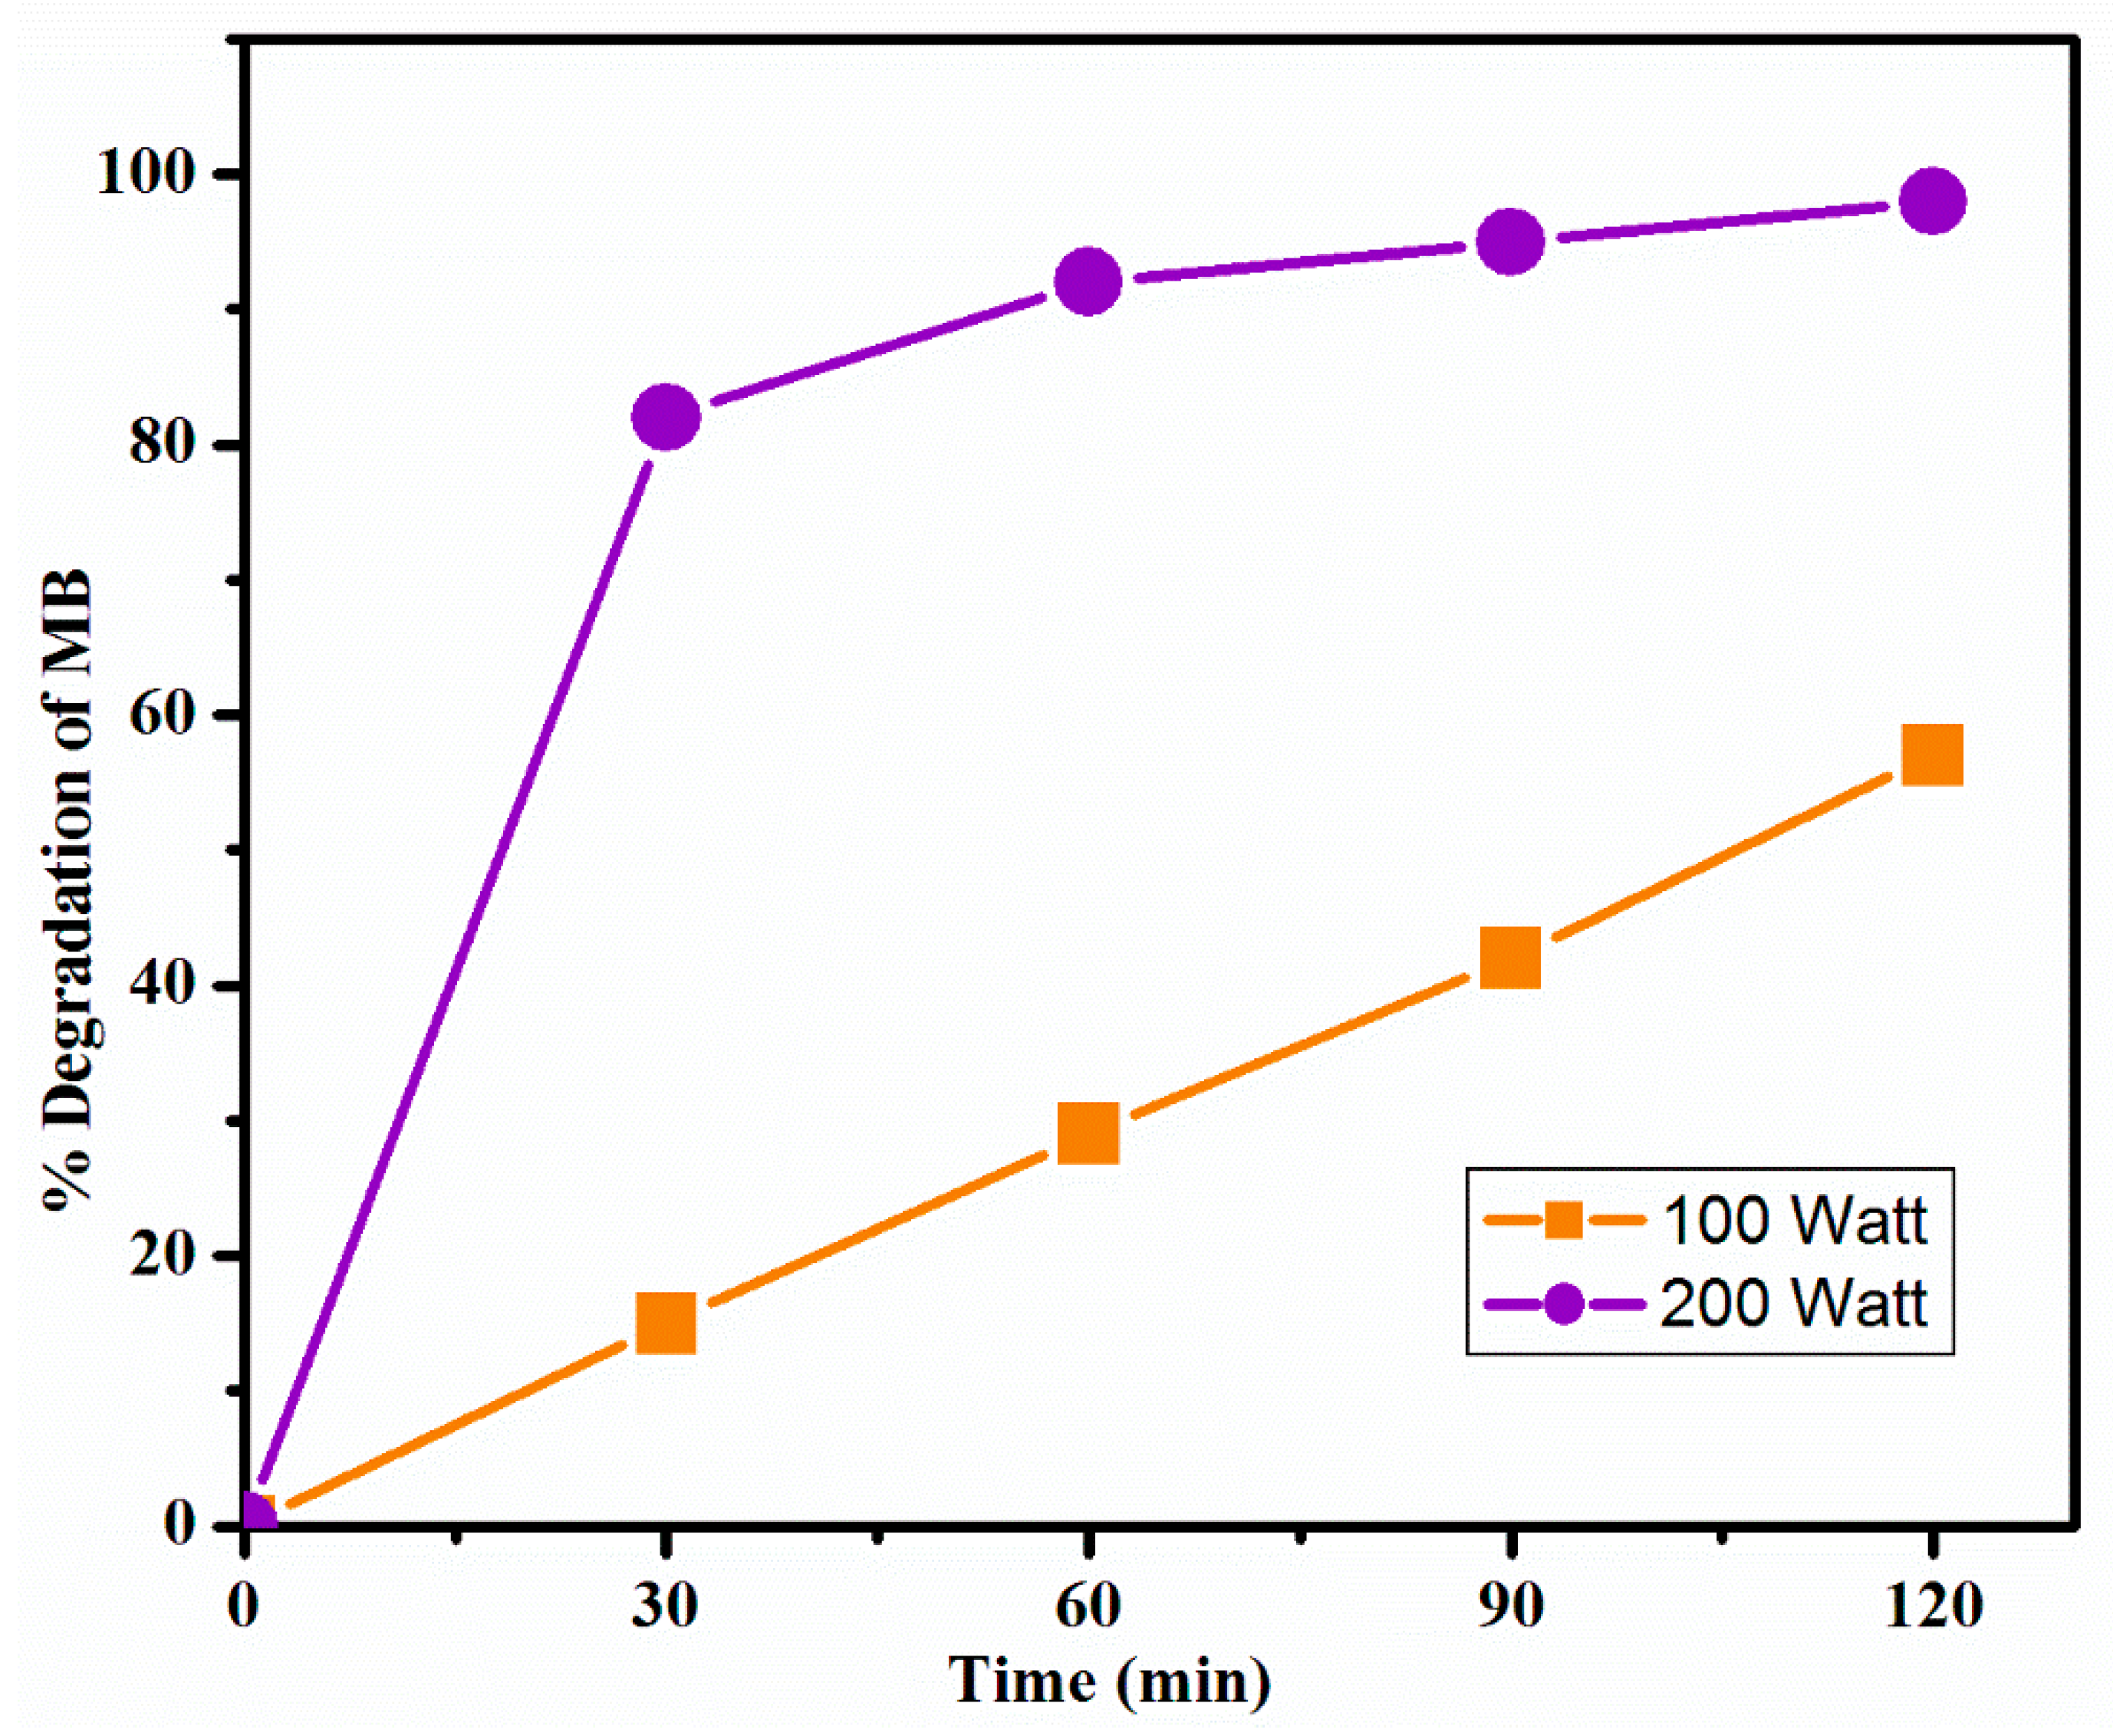
3.5.5. Effect of Intensity of Light
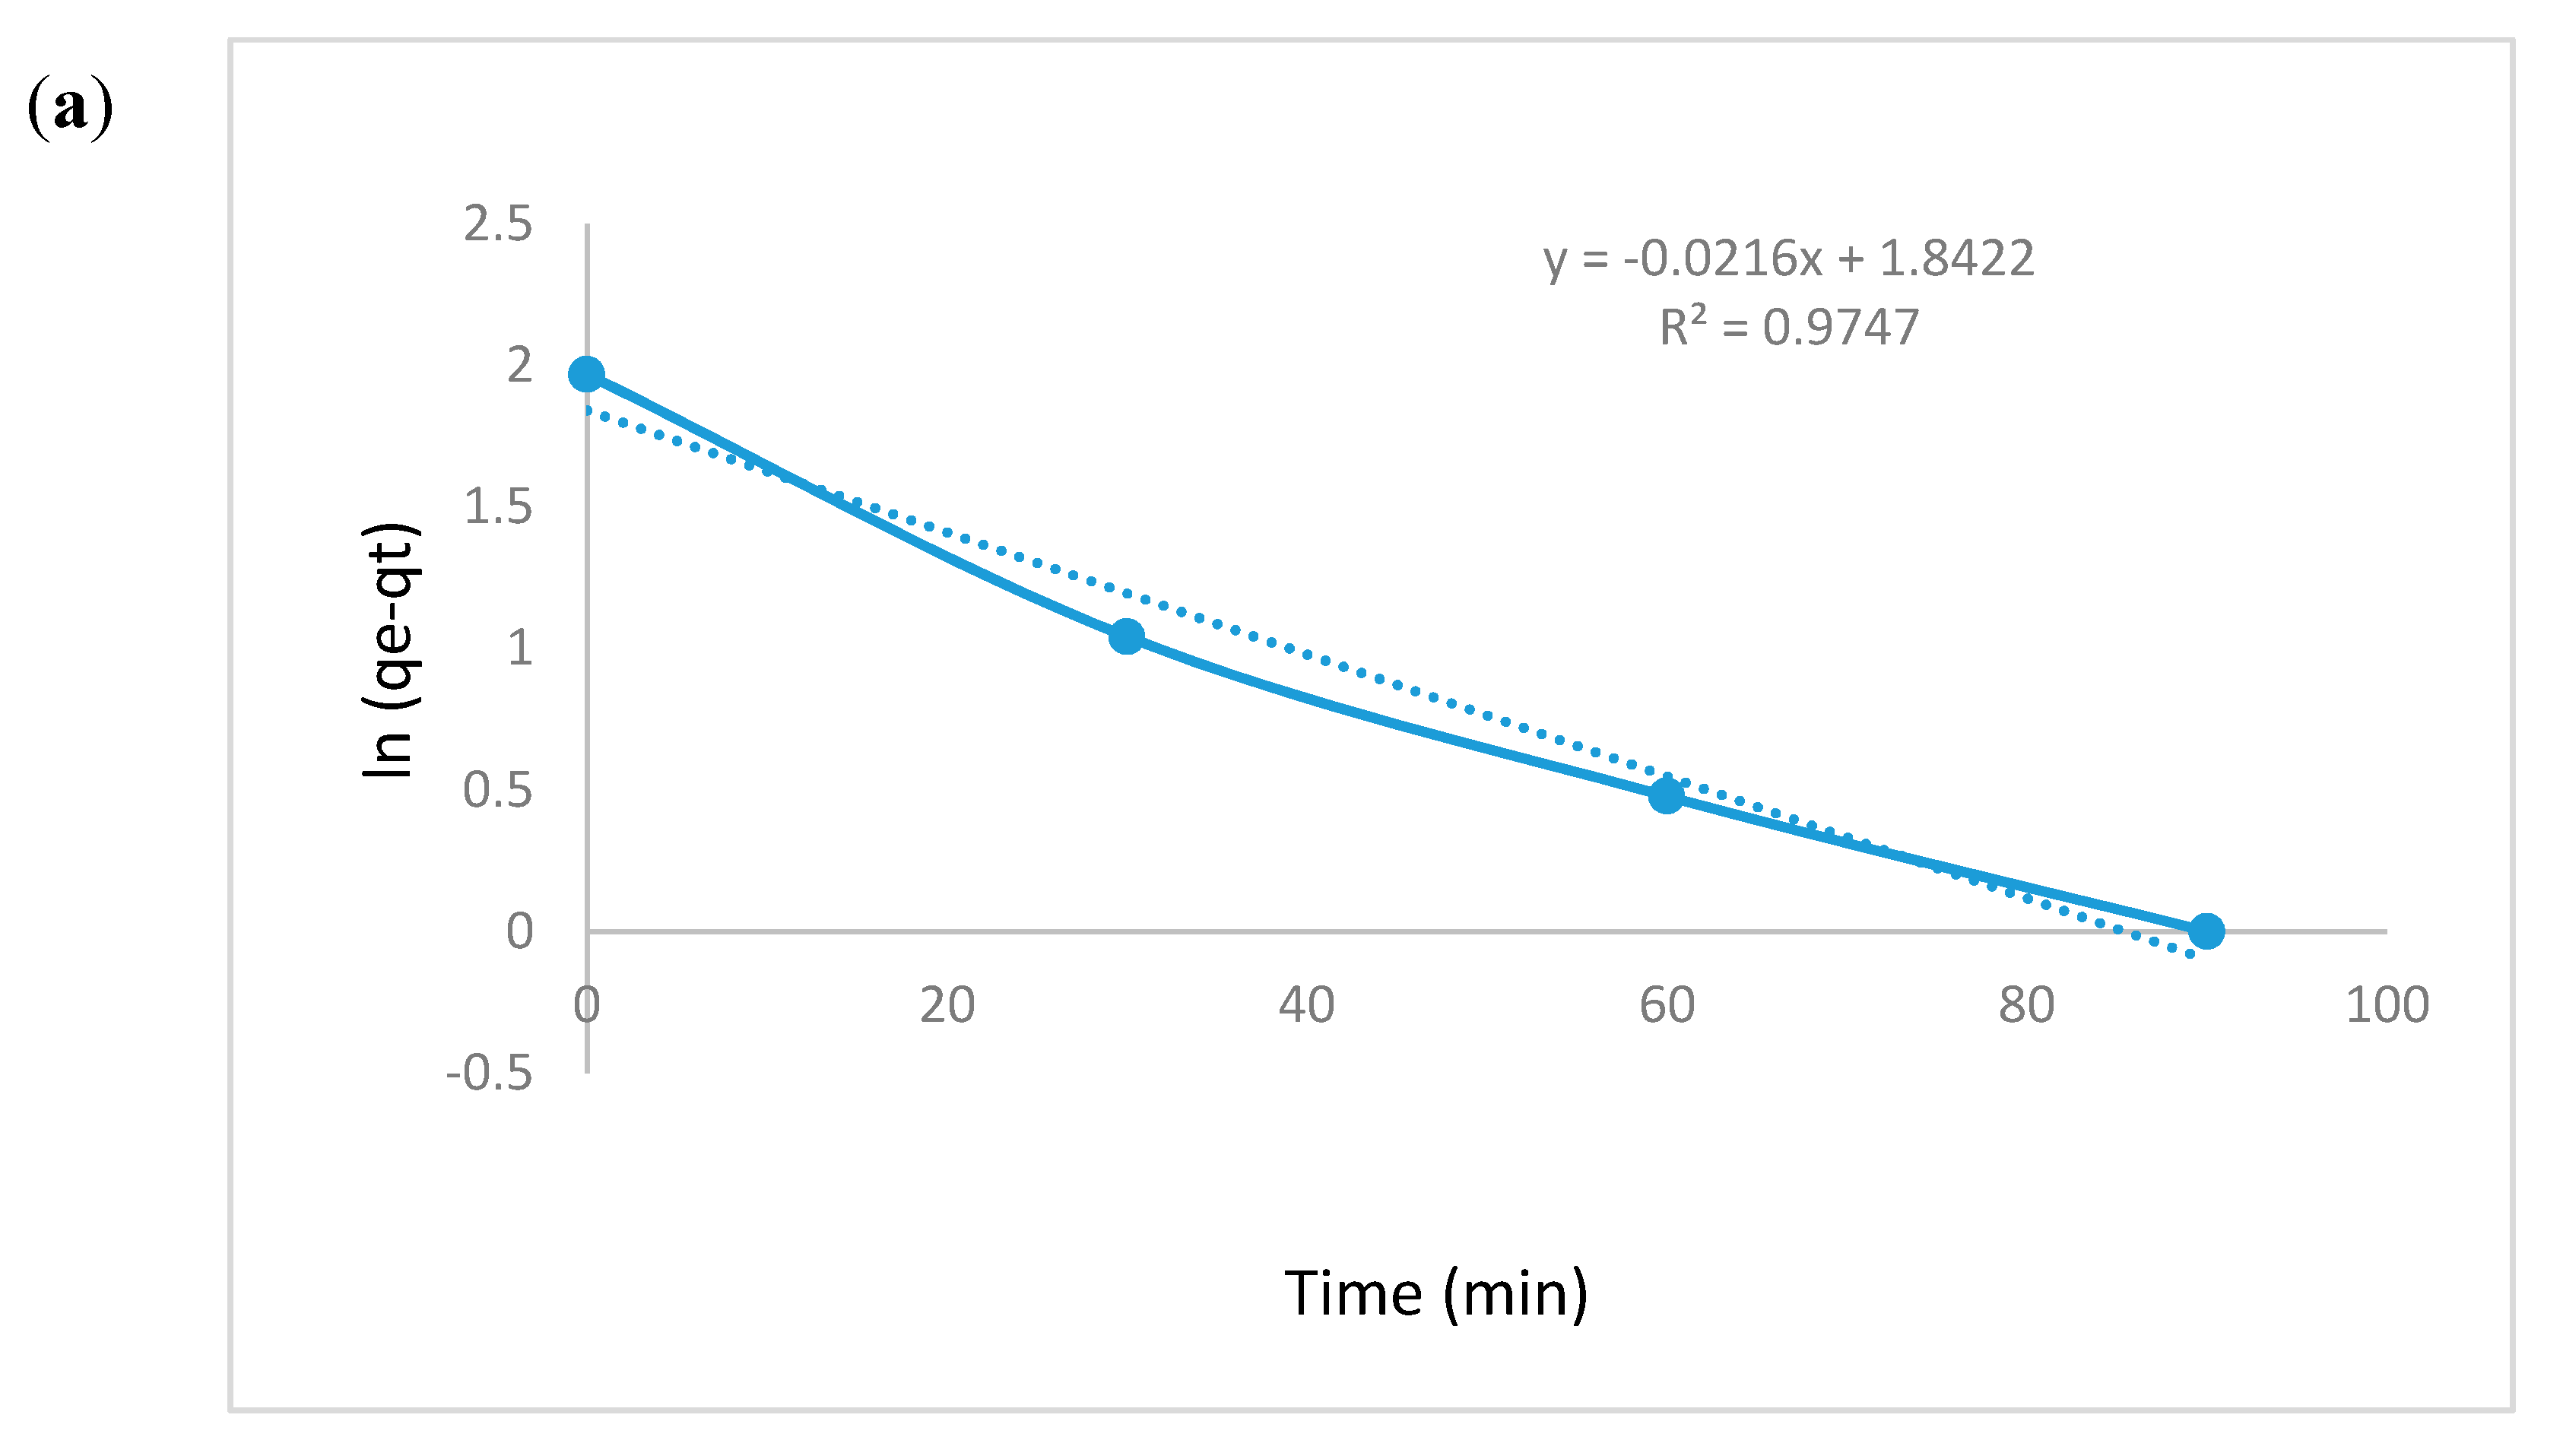
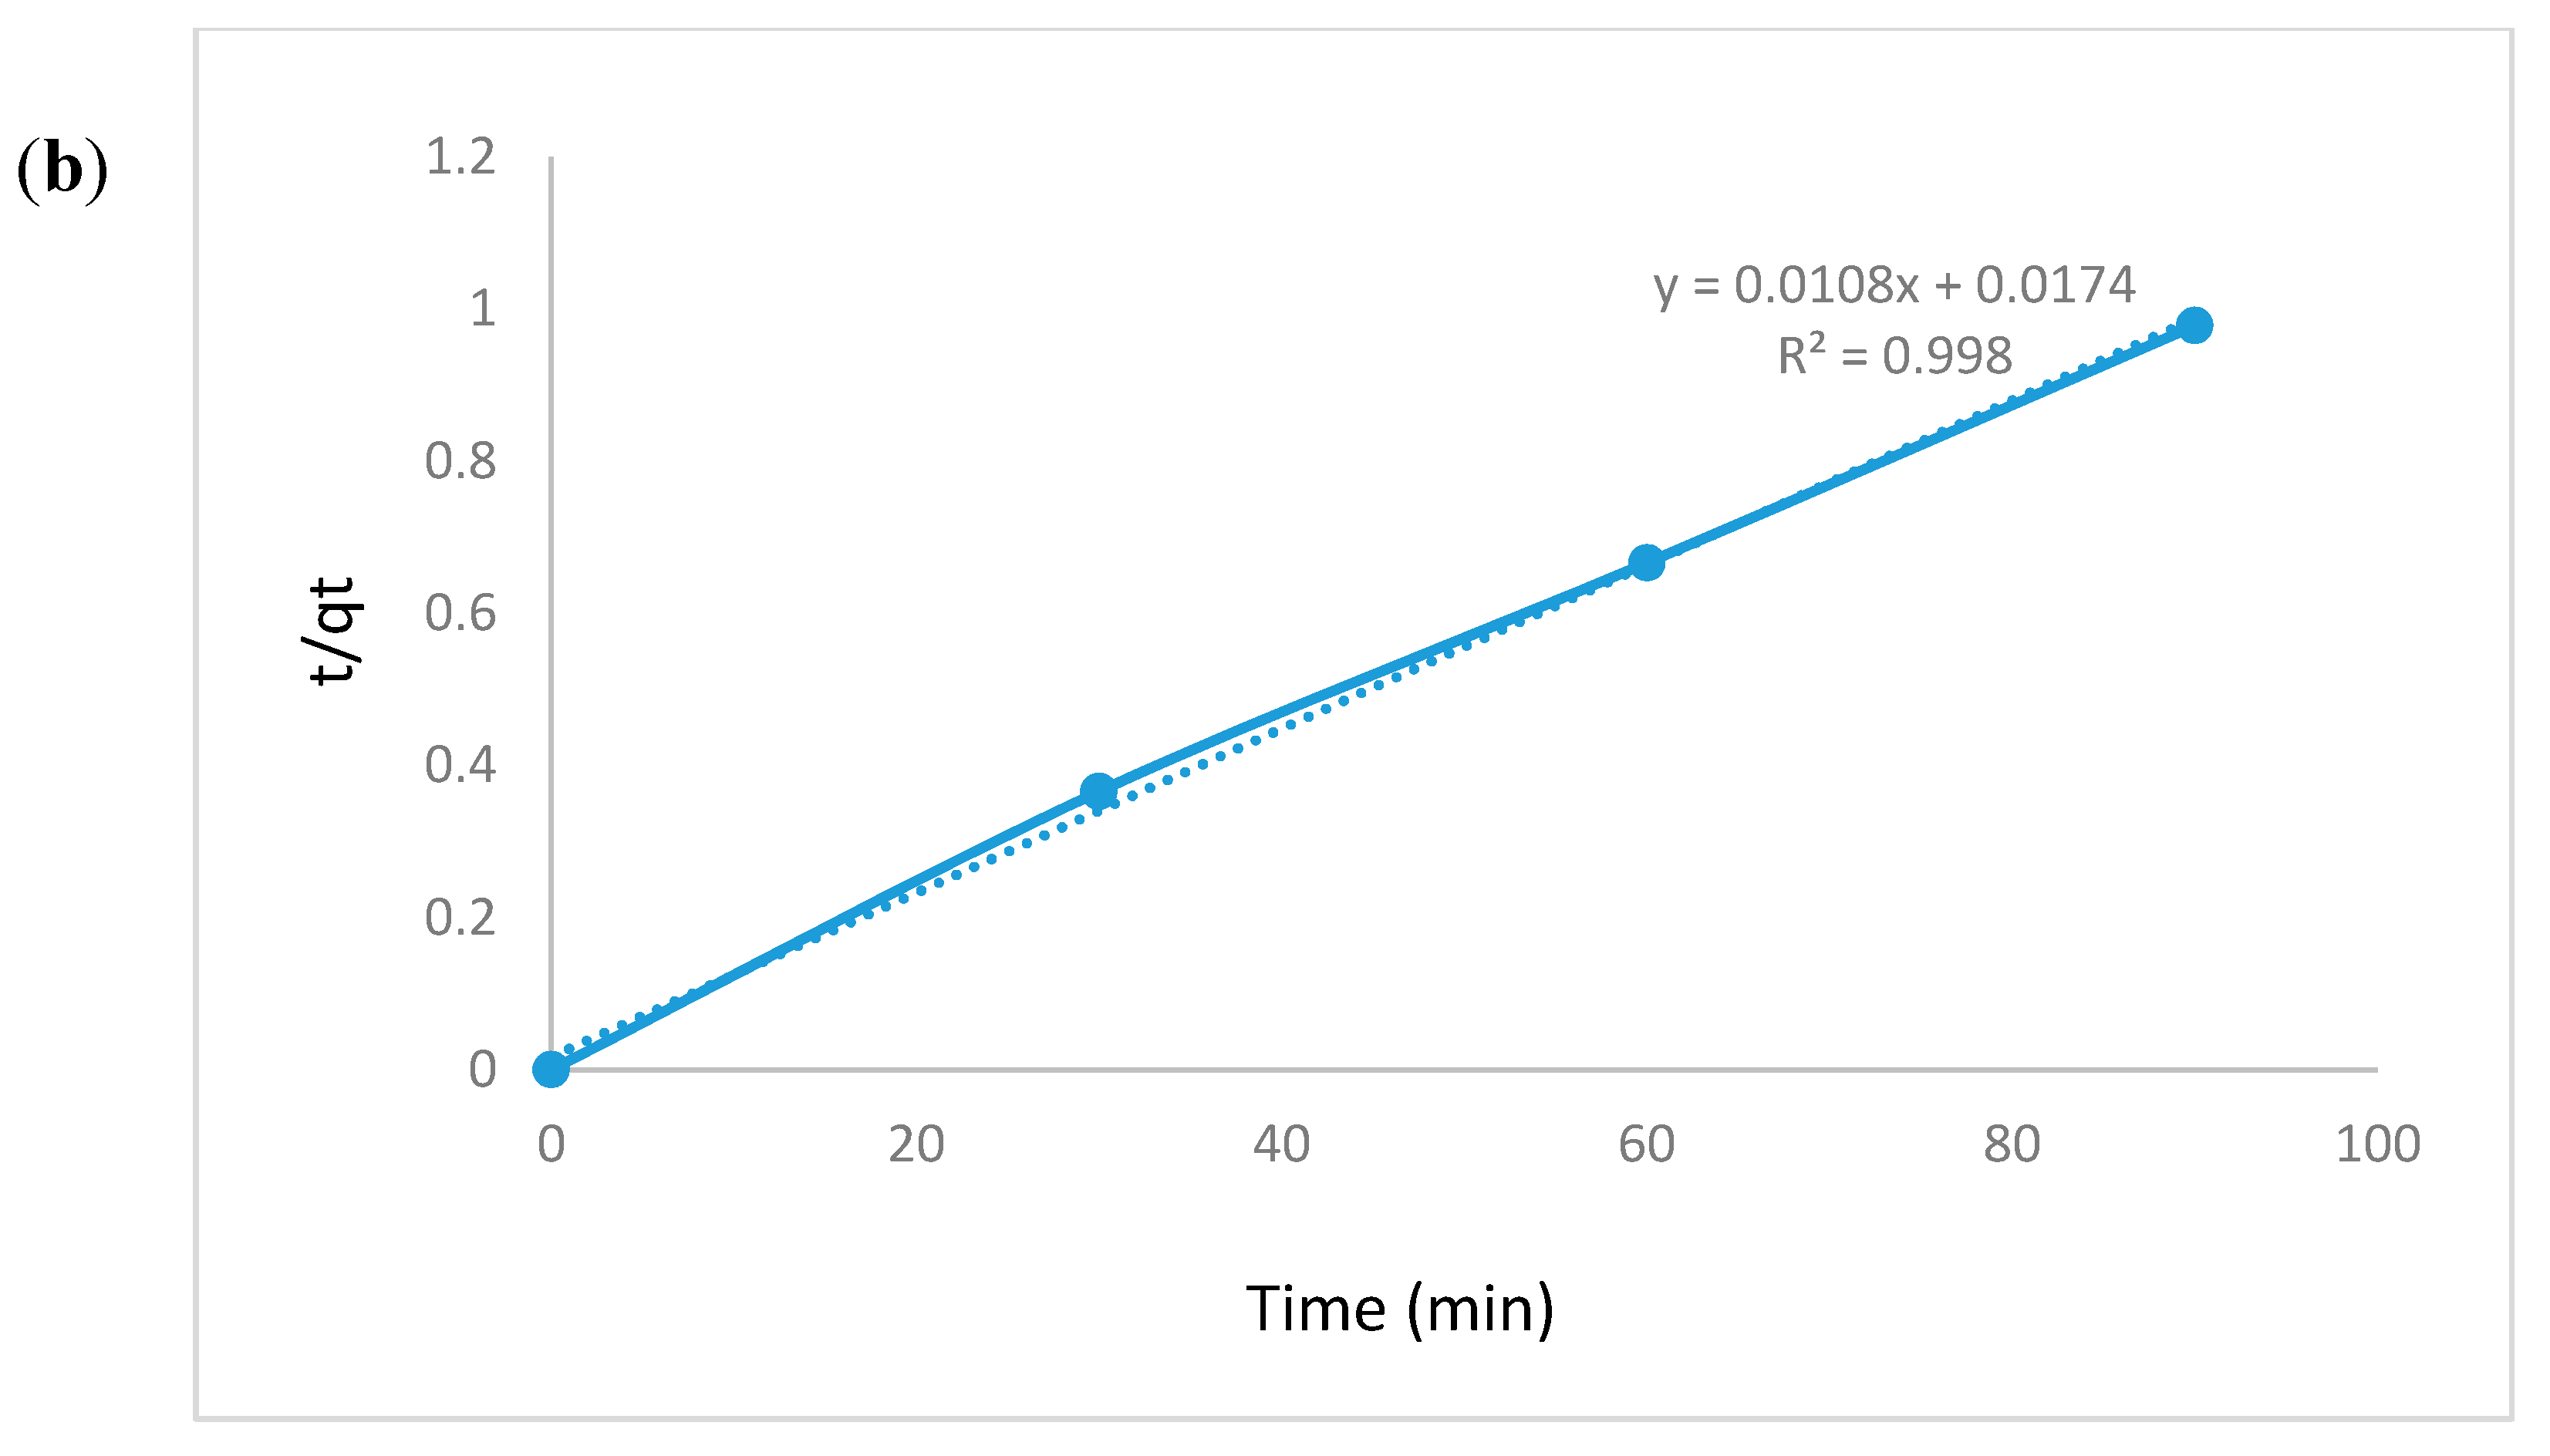
3.5.6. Kinetic Modeling
4. Conclusions
Author Contributions
Funding
Conflicts of Interest
References
- Liyanage, C.P.; Yamada, K. Impact of population growth on the water quality of natural water bodies. Sustainability 2017, 9, 1405. [Google Scholar] [CrossRef]
- Vieira, R.H.; Volesky, B. Biosorption: A solution to pollution. Int. Microbial. 2000, 3, 17–24. [Google Scholar]
- Christie, R.M. Environmental Aspects of Textile Dyeing, 1st ed.; Woodhead Publishing Limited and CRC Press: Cambridge, UK, 2007. [Google Scholar]
- Kant, R. Textile dyeing industry an environmental hazard. Nat. Sci. 2012, 4, 22–26. [Google Scholar] [CrossRef]
- Ali, N.; Zada, A.; Zahid, M.; Ismail, A.; Rafiq, M.; Riaz, A.; Khan, A. Enhanced photodegradation of methylene blue with alkaline and transition-metal ferrite nanophotocatalysts under direct sun light irradiation. J. Chin. Chem. Soc. 2019, 66, 402–408. [Google Scholar] [CrossRef]
- Sulak, M.T.; Yatmaz, H.C. Removal of textile dyes from aqueous solutions with eco-friendly biosorbent. Desalin. Water Treat. 2012, 37, 169–177. [Google Scholar] [CrossRef]
- Arora, C.; Soni, S.; Sahu, S.; Mittal, J.; Kumar, P.; Bajpai, P.K. Iron based metal organic framework for efficient removal of methylene blue dye from industrial waste. J. Mol. Liq. 2019, 284, 343–352. [Google Scholar] [CrossRef]
- Jack Clifton, I.I.; Leikin, J.B. Methylene blue. Am. J. Ther. 2003, 10, 289–291. [Google Scholar] [CrossRef]
- Ekambaram, S.P.; Perumal, S.S.; Rajendran, D.; Samivel, D.; Khan, M.N. New approach of dye removal in textile effluent: A cost-effective management for clean up of toxic dyes in textile effluent by water hyacinth. In Toxicity and Biodegradation Testing; Humana Press: New York, NY, USA, 2018; pp. 241–267. [Google Scholar]
- Ge, L.; Liu, J. Efficient visible light-induced photocatalytic degradation of methyl orange by QDs sensitized CdS-Bi2WO6. Appl. Catal. B Environ. 2011, 105, 289–297. [Google Scholar] [CrossRef]
- Sobczyński, A.; Dobosz, A. Water purification by photocatalysis on semiconductors. Pol. J. Environ. Stud. 2001, 10, 195–205. [Google Scholar]
- Sanpo, N.; Wen, C.; Berndt, C.C.; Wang, J. New Approaches to the Study of Spinel Ferrite Nanoparticles for Biomedical Applications; Springer International Publishing: Cham, Switzerland, 2015. [Google Scholar]
- Sugimoto, M. The past, present, and future of ferrites. J. Am. Ceram. Soc. 1999, 82, 269–280. [Google Scholar] [CrossRef]
- Singh, A.K.; Zaidi, M.G.H.; Saxena, R.; Suman, R.; Maheshwari, P.; Gangwar, H.P.; Verma, A. Effect of surface treatment on tribological characteristic of ferrite nanoparticles epoxy composites. In IOP Conference Series: Materials Science and Engineering; IOP Publishing: Bristol, UK, 2020; Volume 802, p. 012007. [Google Scholar]
- Harraz, F.A.; Mohamed, R.M.; Rashad, M.M.; Wang, Y.C.; Sigmund, W. Magnetic nanocomposite based on titania–silica/cobalt ferrite for photocatalytic degradation of methylene blue dye. Ceram. Int. 2014, 40, 375–384. [Google Scholar] [CrossRef]
- Cuiping, L.; Haodi, W.; Shijia, L.; Chen, L.; Binbin, C.; Qishe, Y. Preparation of magnetic Co0.5Zn0.5Fe2O4/AgBr hybrids for the visible-light-driven degradation of methyl orange. Mater. Sci. Semicond. Proc. 2018, 73, 67–71. [Google Scholar]
- López, J.; Camacho, M.; Solís, D.; González, C.; Carrillo, G.; Martinez, V.; Mijangos, R.; Cuevas, D. Toxicity assessment of cobalt ferrite nanoparticles on wheat plants. J. Toxicol. Environ. Health Part A 2018, 81, 604–619. [Google Scholar] [CrossRef] [PubMed]
- Kharisov, B.I.; Dias, H.R.; Kharissova, O.V. Mini-review: Ferrite nanoparticles in the catalysis. Arab. J. Chem. 2019, 12, 1234–1246. [Google Scholar] [CrossRef]
- Zayat, M.; Levy, D. Blue CoAl2O4 particles prepared by the sol−gel and citrate−gel methods. Chem. Mater. 2000, 12, 2763–2769. [Google Scholar] [CrossRef]
- Patterson, A.L. The Scherrer formula for X-ray particle size determination. Phys. Rev. 1939, 56, 978. [Google Scholar] [CrossRef]
- Bashir, A.; Hanif, F.; Yasmeen, G.; Mabood, F.; Hussain, A.; Abbas, N.; Manzoora, S. Polyaniline based magnesium nanoferrite composites as efficient photocatalysts for the photodegradation of Indigo Carmine in aqueous solutions. Desalin. Water Treat. 2019, 164, 368–377. [Google Scholar] [CrossRef]
- Mathew, D.S.; Juang, R.S. An overview of the structure and magnetism of spinel ferrite nanoparticles and their synthesis in microemulsions. Chem. Eng. J. 2007, 129, 51–65. [Google Scholar] [CrossRef]
- Gore, S.K.; Jadhav, S.S.; Jadhav, V.V.; Patange, S.M.; Naushad, M.; Mane, R.S.; Kim, K.H. The structural and magnetic properties of dual phase cobalt ferrite. Sci. Rep. 2017, 7, 1–9. [Google Scholar] [CrossRef]
- Mathubala, G.; Manikandan, A.; Antony, S.A.; Ramar, P. Photocatalytic degradation of methylene blue dye and magneto-optical studies of magnetically recyclable spinel NixMn1-xFe2O4 (x = 0.0–1.0) nanoparticles. J. Mol. Struct. 2016, 1113, 79–87. [Google Scholar] [CrossRef]
- Kambale, R.C.; Song, K.M.; Koo, Y.S.; Hur, N. Low temperature synthesis of nanocrystalline Dy3+ doped cobalt ferrite: Structural and magnetic properties. J. Appl. Phys. 2011, 110, 053910. [Google Scholar] [CrossRef]
- Bhavyashri, P.S.; Raveendra, R.S.; Jayasheelan, A.; Prakash, C.S.; Prasad, B.D.; Rewathkar, K.G.; Nagabhushana, B.M. Effect of temperature on electrical properties of auto combustion derived nano calcium ferrite. Int. J. Adv. Res. 2015, 5, 153–161. [Google Scholar]
- Kalam, A.; Al-Sehemi, A.G.; Assiri, M.; Du, G.; Ahmad, T.; Ahmad, I.; Pannipara, M. Modified solvothermal synthesis of cobalt ferrite (CoFe2O4) magnetic nanoparticles photocatalysts for degradation of methylene blue with H2O2/visible light. Results Phys. 2018, 8, 1046–1053. [Google Scholar] [CrossRef]
- Mishra, D.; Senapati, K.K.; Borgohain, C.; Perumal, A. CoFe2O4− Fe3O4 Magnetic nanocomposites as photocatalyst for the degradation of methyl orange dye. J. Nanotechnol. 2012, 1, 1–6. [Google Scholar] [CrossRef]
- Paliwal, A.; Banu, R.; Ameta, R.; Ameta, S.C. Photocatalytic degradation of methylene blue using undoped and Co-doped bismuth ferrite. J. Appl. Chem. 2017, 6, 967–975. [Google Scholar]
- Cabrera, A.F.; Torres, C.R.; Marchetti, S.G.; Stewart, S.J. Degradation of methylene blue dye under dark and visible light conditions in presence of hybrid composites of nanostructured MgFe2O4 ferrites and oxygenated organic compounds. J. Environ. Chem. Eng. 2020, 8, 104274. [Google Scholar] [CrossRef]
- Kefeni, K.K.; Mamba, B.B. Photocatalytic application of spinel ferrite nanoparticles and nanocomposites in wastewater treatment. SMT 2020, 23, e00140. [Google Scholar] [CrossRef]
- Fox, M.A.; Dulay, M.T. Heterogeneous photocatalysis. Chem. Rev. 1993, 93, 341–357. [Google Scholar] [CrossRef]
- Alene, A.N.; Abate, G.Y.; Adere, T.H. Bioadsorption of Basic Blue Dye from Aqueous Solution onto Raw and Modified Waste Ash as Economical Alternative Bioadsorbent. J. Chem. 2020, 2020, 8746035. [Google Scholar] [CrossRef]
- Zaini, M.A.A.; Sudi, R.M. Valorization of Human hair as mythelene blue dye adsorbents. Green Process Synth. 2017, 7, 344–352. [Google Scholar] [CrossRef]
- Konstantinou, I.K.; Albanis, T.A. TiO2-assisted photocatalytic degradation of azo dyes in aqueous solution: Kinetic and mechanistic investigations: A review. Appl. Catal. B Environ. 2004, 49, 1–14. [Google Scholar] [CrossRef]
- Sharma, R.; Singhal, S. Photodegradation of textile dye using magnetically recyclable heterogeneous spinel ferrites. J. Chem. Technol. Biotechnol. 2015, 90, 955–962. [Google Scholar] [CrossRef]
- Tunesi, S.; Anderson, M. Influence of chemisorption on the photodecomposition of salicylic acid and related compounds using suspended titania ceramic membranes. J. Phys. Chem. 1991, 95, 3399–3405. [Google Scholar] [CrossRef]
- Tang, W.Z.; An, H. UV/TiO2 photocatalytic oxidation of commercial dyes in aqueous solutions. Chemosphere 1995, 31, 4157–4170. [Google Scholar] [CrossRef]
- Saquib, M.; Muneer, M. Semiconductor mediated photocatalysed degradation of an anthraquinone dye, Remazol Brilliant Blue R under sunlight and artificial light source. Dyes Pigm. 2002, 53, 237–249. [Google Scholar] [CrossRef]
- Reddy, E.P.; Davydov, L.; Smirniotis, P. TiO2-loaded zeolites and mesoporous materials in the sonophotocatalytic decomposition of aqueous organic pollutants: The role of the support. Appl. Catal. B Environ. 2003, 42, 1–11. [Google Scholar] [CrossRef]
- Ilinoiu, E.C.; Pode, R.; Manea, F.; Colar, L.A.; Jakab, A.; Orha, C.; Sfarloaga, P. Photocatalytic activity of a nitrogen-doped TiO2 modified zeolite in the degradation of Reactive Yellow 125 azo dye. J. Taiwan Inst. Chem. Eng. 2013, 44, 270–278. [Google Scholar] [CrossRef]
- Kansal, S.K.; Singh, M.; Sud, D. Studies on TiO2/ZnO photocatalysed degradation of lignin. J. Hazard. Mater. 2008, 153, 412–417. [Google Scholar] [CrossRef]
- Curcó, D.; Giménez, J.; Addardak, A.; Cervera-March, S.; Esplugas, S. Effects of radiation absorption and catalyst concentration on the photocatalytic degradation of pollutants. Catal. Today 2002, 76, 177–188. [Google Scholar] [CrossRef]
- Karunakaran, C.; Senthilvelan, S. Photooxidation of aniline on alumina with sunlight and artificial UV light. Catal. Commun. 2005, 6, 159–165. [Google Scholar] [CrossRef]
- Faisal, M.; Harraz, F.A.; Jalalah, M.; Alsaiari, M.A.; Al-Sayari, S.A.; Al-Assiri, M.S. Polythiophene doped ZnO nanostructures synthesized by modified sol-gel and oxidative polymerization for efficient photodegradation of methylene blue and gemifloxacin antibiotic. Mater. Today Commun. 2020, 24, 101048. [Google Scholar] [CrossRef]
- Arifin, M.; Karim, K.; Abdullah, H.; Khan, M. Synthesis of Titania Doped Copper Ferrite Photocatalyst and Its Photoactivity towards Methylene Blue Degradation under Visible Light Irradiation. Bull. Chem. React. Eng. Catal. 2019, 14, 219–227. [Google Scholar] [CrossRef]
- Javed, H.; Rehman, A.; Mussadiq, S.; Shahid, M.; Khan, M.A.; Shakir, I.; Warsi, M.F. Reduced graphene oxide-spinel ferrite nano-hybrids as magnetically separable and recyclable visible light driven photocatalyst. Synth. Met. 2019, 254, 1–9. [Google Scholar] [CrossRef]
- Harifi, T.; Montazer, M. A novel magnetic reusable nanocomposite with enhanced photocatalytic activities for dye degradation. Sep. Purif. Technol. 2014, 134, 210–219. [Google Scholar] [CrossRef]
- Ciocarlan, R.G.; Seftel, E.M.; Mertens, M.; Pui, A.; Mazaj, M.; Tusar, N.N.; Cool, P. Novel magnetic nanocomposites containing quaternary ferrites systems Co0. 5Zn0. 25M0. 25Fe2O4 (M = Ni, Cu, Mn, Mg) and TiO2-anatase phase as photocatalysts for wastewater remediation under solar light irradiation. Mater. Sci. Eng. B 2018, 230, 1–7. [Google Scholar] [CrossRef]
- Zhang, H.; Liu, D.; Ren, S.; Zhang, H. Kinetic studies of direct blue photodegradation over flower-like TiO2. Res. Chem. Intermed. 2017, 43, 1529–1542. [Google Scholar] [CrossRef]


| Sr. No. | Sample | Lattice Parametera (Å) | Average Crystalline Size (nm) | Volume of Cell (Å3) | Inter Planar Spacing (d) |
|---|---|---|---|---|---|
| 1 | CoFe2O4 | 8.38615 | 37 | 589.77 | 2.515 |
| 2 | Co0.1Al0.03Fe0.17O0.4 | 8.3387 | 21.6 | 579.82 | 2.501 |
| Sample | BET Surface Area (m2/g) | Average Pore Radius (Å) | Total Pore Volume (cm3/g) |
|---|---|---|---|
| CoFe2O4 | 9.217 | 17.80 | 0.013 |
| Co0.1Al0.03Fe0.17O0.4 | 14,865 | 27.69 | 1.261.26 |
| Types of Synthesized Photocatalyst | Size (nm) | Pollutant/s | pH | Contact Time (min) | Catalyst Dose (g/L) | Pollutant (mg/L) | Light Source | Removal Capacity | Cycle | Ref. |
|---|---|---|---|---|---|---|---|---|---|---|
| CuFe2O4@TiO2 | 64 | MB | - | 180 | 0.5 | 20 | Vis | 40% | 3 | [46] |
| Ni0.65Zn0.35Fe2O4 | - | MB | - | 56 | 1 | 5 | UV–Vis | 55% | - | [47] |
| Fe3O4/TiO2 | 35 | MB | - | 240 | 0.2 | 10 | UV | 50% | 3 | [48] |
| Co0.5Zn0.25Ni0.25Fe2O4–TiO2 | - | MB | - | 80 | 1 | 12.79 | UV–Vis | 12.66% | - | [49] |
| Co0.1Al0.3Fe1.7O0.4 | 40 | MB | 11 | 120 | 0.5 | 10 | Vis | 83% | 5 | Current work |
© 2020 by the authors. Licensee MDPI, Basel, Switzerland. This article is an open access article distributed under the terms and conditions of the Creative Commons Attribution (CC BY) license (http://creativecommons.org/licenses/by/4.0/).
Share and Cite
Abbas, N.; Rubab, N.; Sadiq, N.; Manzoor, S.; Khan, M.I.; Fernandez Garcia, J.; Barbosa Aragao, I.; Tariq, M.; Akhtar, Z.; Yasmin, G. Aluminum-Doped Cobalt Ferrite as an Efficient Photocatalyst for the Abatement of Methylene Blue. Water 2020, 12, 2285. https://doi.org/10.3390/w12082285
Abbas N, Rubab N, Sadiq N, Manzoor S, Khan MI, Fernandez Garcia J, Barbosa Aragao I, Tariq M, Akhtar Z, Yasmin G. Aluminum-Doped Cobalt Ferrite as an Efficient Photocatalyst for the Abatement of Methylene Blue. Water. 2020; 12(8):2285. https://doi.org/10.3390/w12082285
Chicago/Turabian StyleAbbas, Naseem, Nida Rubab, Natasha Sadiq, Suryyia Manzoor, Muhammad Imran Khan, Javier Fernandez Garcia, Isaias Barbosa Aragao, Muhammad Tariq, Zeeshan Akhtar, and Ghazala Yasmin. 2020. "Aluminum-Doped Cobalt Ferrite as an Efficient Photocatalyst for the Abatement of Methylene Blue" Water 12, no. 8: 2285. https://doi.org/10.3390/w12082285
APA StyleAbbas, N., Rubab, N., Sadiq, N., Manzoor, S., Khan, M. I., Fernandez Garcia, J., Barbosa Aragao, I., Tariq, M., Akhtar, Z., & Yasmin, G. (2020). Aluminum-Doped Cobalt Ferrite as an Efficient Photocatalyst for the Abatement of Methylene Blue. Water, 12(8), 2285. https://doi.org/10.3390/w12082285