Article

Efficiency of the Drawdown Flushing and Partition Desilting of a Reservoir in Taiwan

1
Department of Hydraulic and Ocean Engineering, National Cheng Kung University, Tainan 701, Taiwan
2
Department of Environmental Engineering, National Cheng Kung University, Tainan 701, Taiwan
*
Author to whom correspondence should be addressed.
Water 2020, 12(8), 2166; https://doi.org/10.3390/w12082166
Submission received: 15 June 2020 / Revised: 26 July 2020 / Accepted: 28 July 2020 / Published: 31 July 2020
(This article belongs to the Section Water Resources Management, Policy and Governance)

Abstract

:
Sedimentation limits the benefits of storage reservoirs, especially in areas with higher sediment yields, such as Agongdian Reservoir in southern Taiwan. Although drawdown flushing is a known strategy that releases large amounts of fine sediment into a downstream channel, there is limited information on the long-term monitoring and multiple metrics being used to evaluate flushing efficiency. The objectives of this study were three-fold: (1) to continue collecting valuable long-term observed data, since Agongdian Reservoir is one of the few reservoirs currently conducting sediment flushing operations; (2) to evaluate and identify the hydrological parameters that are highly related to the flushing efficiency; (3) to execute numerical simulations of different reservoir flushing scenarios at multiple water levels to discuss potential strategies to improve the flushing efficiency. The findings of this study revealed that long-term monitoring data was valuable for identifying factors highly related to the flushing efficiency, which included the initial water level; average water level; average velocity. Based on simulations, compartmentalizing the reservoir is a proposed strategy that has demonstrated high levels of improvement in terms of the flushing efficiency, depending on particular scenarios involving partition desilting, empty flushing, or a combination of both. Recommendations to increase the flushing efficiency include lowering the initial water level, creating a narrower gorge-like geometry by partitioning, and further considering to modify the operation rules.

1. Introduction

Reservoirs play a vital role in providing a water supply for human usage, which includes irrigation practices. However, sedimentation limits the benefits of storage reservoirs and increases the risks of an aging infrastructure, especially for areas with a higher sediment yield. With such impacts becoming increasingly widespread, reservoir managers should implement practices to best sustain the storage capacity of a reservoir. Sustainable sediment management can be accomplished by a suite of strategies [1,2,3,4], all of which are aimed at maintaining the reservoir capacity.
The efficiency and feasibility of any particular sediment management strategy should vary according to its compatibility with the operations of an individual reservoir. Some specific factors to take into consideration include: reservoirs dealing with carryover storage; synchrony with the natural sediment supply; the water demand for each unit of sediment managed; the effectiveness of maintaining the reservoir capacity; the ability to meet the necessary infrastructure and hydraulic conditions. For instance, bypass channels not only require certain geological conditions at the site to be effective [1], but they are also best-adapted to situations where the geometry of the river and reservoir make a steeper short-cut route for the bypass channel possible, such as where the reservoir occupies a river bend. Similarly, despite its effectiveness, the drawdown flushing of sediment during the non-flood season is limited to hydrologically small reservoirs, which is where the ratio of storage capacity to the mean annual runoff does not exceed a certain range of values [2,3,4,5]. For instance, Kondolf et al. [2] suggest that the ratio should not exceed 4% for flushing to be successful. In hydrologically “large” reservoirs, where drawdown is not an option, major infrastructure modifications—as described in further detail by Morris and Fan [6], Harada et al. [1], and Kawashima et al. [7]—may be needed to manage sediment by venting the turbidity currents or bypassing the incoming sediment.
Drawdown flushing, one of the strategies for passing sediment downstream, involves scouring and resuspending sediment deposited in the reservoir and transporting it downstream through low-level outlets in the dam. This method works best in narrow reservoirs with steep longitudinal gradients and with flow velocities maintained above the threshold to transport sediment [2]. Flushing can release large amounts of fine sediment into the downstream channel during periods of relatively low flow, that is, when the river is unlikely to have sufficient energy to transport the sediment downstream. During the flood season, flushing provides the advantage of having greater discharges available. So, by implementing the strategy of drawdown flushing well into the flood season, more erosive energy and incoming sediment can be carried through the dam. In doing so, the sediment that is being eroded and the deposits formerly within the reservoir are then resuspended and passed further downstream [6]. However, it may not be appropriate to consider large floods as an applicable drawdown flushing event, especially since the discharge from a drawdown flushing event needs to pass through low-level outlets without appreciable backwater. Instead, the discharge of large floods often exceeds the maximum capacity of a low-level gate [2].
There are different parameters being used in the discussion of the efficiency of drawdown flushing, including the sediment release efficiency (SRE; [6]), sediment flushing efficiency (SFE; [8,9]), and sediment sluicing efficiency (SSE; [10]). All these parameters indicate the following factors to consider which could provide a greater flushing efficiency, including: a decreased water surface level, increased flow discharge, as well as larger and lower flushing outlets [11]. Other factors that have been reported to provide a greater flushing efficiency include: the elevation of sediment flushing gates, configuration of the reservoir, duration time from the start of drawdown flushing, discharge rate during sediment flushing, and volume and grain size of the deposited sediment [12]. As addressed [6], the operational flexibility for a greater efficiency can be provided by dividing the total storage volume into two components by using internal dikes or multiple reservoirs. Such storage compartmentation may allow portions of the total storage pool to be operated separately to enhance the overall sediment management. In addition to this, the flushing efficiency may further be impacted by factors that influence the outflow of sediment discharge. For example, experimental results from both the International Research and Training Center on Erosion and Sedimentation [13] and Lai and Shen [14] show that factors strongly associated with outflow sediment discharge include: the outlet discharge, water surface gradient and the width of the flushing channel.
Although there is a multitude of experimental research regarding flushing efficiency, on-site flushing has been practiced for decades in only a few sites in the world. These include reservoirs within Switzerland and Japan. In southern Switzerland, Gebidem Reservoir, which is used for hydropower generation, has been flushed annually from May to July since 1982 with the duration of flushing varying from 40 to 101 h. Although the reservoir has an average sediment inflow of 0.5 Mm3, the flushing of the reservoir has been kept virtually free of sediment, with an estimated long-term capacity ratio [9] of 0.99 [6,15], suggesting that for several decades Gebidem Reservoir has maintained a high flushing efficiency rate and remained 99% free of sediment [9]. Similarly, continued regular sediment flushing has also provided successful results in Japan. Located along the Kurobe River in north-central Japan, Unazuki Reservoir and Dashidaira Reservoir have been conducting coordinated sediment flushing and sluicing since 2001 [12]. Due to regular sediment flushing, the Dashidaira Dam is in a state of equilibrium, maintaining the present sedimentation volume equivalent of about 45% of the gross storage capacity. These practices in reservoirs throughout the world highlight the importance of field monitoring for understanding and enhancing the efficiency of flushing.
At the very few sites where sediment flushing has been conducted, there is a lack of information, specifically for the sediment monitoring of flushing events. As a result, there is a gap in the current scientific literature regarding the efficiency of drawdown flushing and its resulting changes. Therefore, this study aims to fill that gap by focusing on Agongdian Reservoir of southern Taiwan by better understanding the efficiency of the current practices based on monitoring data. The objectives of this study were three-fold: (1) to continue collecting valuable long-term data, since Agongdian Reservoir is one of the few reservoirs currently conducting sediment flushing operations; (2) to evaluate and identify the hydrological parameters that are highly related to the flushing efficiency; (3) to execute numerical simulations of different reservoir flushing scenarios at multiple water levels to discuss potential strategies to improve the flushing efficiency. These results will help determine various key factors that can maximize and potentially further preserve the long-term reservoir capacity. By using informed decision making based on research, this study can ultimately propose better operational strategies and help upgrade the operation protocol for future practices of the reservoir.

2. Materials and Methods

2.1. Study Area

Located in southern Taiwan with a drainage area of 29.6 km2, Agongdian Reservoir is a multi-purpose reservoir with its primary function being flood control, protecting the Yanchao area from flood levels predicted for a 250-year flood. Besides its primary function of flood regulation, the reservoir is also being managed for irrigation, recreation, as well as municipal and industrial water supplies [16]. The reservoir was built at the confluence of the Wanglai and Zhoushui Rivers, whose northern and southern inlets are located on opposite sides from each other, respectively (Figure 1). Two gauging stations, known as Doulao Temple and Bailing Culvert (hereafter referred to as simply Doulao and Bailing), are located 5.7 and 4.1 km upstream of the dam site of the Wanglai River and Zhoushui River, respectively (Figure 1).
Agongdian Reservoir itself consists of a dam, an intake tower, and an open-mouth spillway. Two outlets, the spill shaft and the irrigation shaft, are located near the dam face that may divert water and sediment out of the reservoir. An additional gauging station is located at the reservoir spill shaft. Note also that a rainfall gauging station is located near the dam, southeast of the reservoir spill shaft at the edge of Agongdian watershed (Figure 1).
The dam is a 31-m high reservoir constructed in 1953 within the Yanchao District, Kaohsiung City, Taiwan, that currently cannot reach full capacity due to it being filled with sediment. Agongdian Reservoir has a wide, short, and shallow configuration. In its original design, the maximum pool level was set at an elevation of 40 m, with a total storage capacity of 36.7 million m3. However, by 2000, over 53% of its initial storage capacity had been lost due to sedimentation [16], leaving only 17.2 million m3 available for storage capacity (Figure 2).
The high sedimentation rate is the main source of sediment management concerns regarding Agongdian Reservoir [17,18,19,20,21,22,23]. Such a rapid sedimentation rate is attributed to high sediment production from the reservoir’s southern confluence, the Zhoushui River, which has been noted to have two to three times the sediment load as the northern confluence, the Wanglai River [17,18,19,20,21,22,23], with mudstone being the primary culpable source [24]. Mudstone, which is composed by the compaction of composited silt and clay for long periods of time, is usually muddy when in contact with water. However, because mudstone becomes as hard as rock once it is dried, it makes vegetation difficult to form and remain on the mudstone substrate. Vegetation is consequently easily eroded by rain drops, producing average erosion rates of approximately 9 cm yr−1 during Taiwan’s rainy season (March to September) [25]. The Zhuoshui River also has a higher slope, and a narrower channel than the Wanglai River. This in turn leads to a higher inflow velocity and the formation of an erosion channel at its inlet [26]. The erosion channel, however, soon gets lost in the reservoir as the current configuration of the reservoir does not support the successful continuation of erosion into a flushing channel.
To restore the storage of Agongdian Reservoir, data from physical and numerical experiments conducted between 1997 and 2003 were used to help develop the engineering design of sediment management strategies [24]. The results from the physical experiments suggest that the sediment release efficiency—that is, the ratio of sediment outflow to sediment inflow—could be increased by up to 65.3%, only if the opening of the spillway is lowered and the internal diameter of the spillway is in fact enlarged [24]. Based on these results, an ongoing multi-phase renovation project was implemented from 1998 to 2006. The renovation aimed to make five major improvements: (1) the spill shaft was reconstructed to lower the sluice gate from 35.5 m to 27 m with an internal diameter of 2.8 m and a maximum discharge of 85 cms (cubic meter per second); (2) the irrigation shaft was redesigned and constructed with a new intake tower and three gates at the downstream side for municipal, irrigation, and sediment sluicing uses, providing a total maximum discharge of 100 cms when the spill shaft and irrigation shaft operate concurrently; (3) 11.6 million m3 of sediment that had been deposited over time was mechanically excavated and dredged to lower the reservoir bed to an elevation of 26 m; (4) to bypass the floodwaters going to Erren River—a watershed immediately north of Agongdian Reservoir—when the water surface level in the reservoir reaches 37 m, a weir with a design capacity of 431 cms was constructed upstream along Wanglai River; (5) to bring water from the Qishan River—a watershed immediately south of Agongdian Reservoir—during the drawdown period, a transbasin water diversion measuring 15 km was constructed. Completion of the renovation project addressed the main concerns of Agongdian Reservoir and protected the area for a 10,000-year flood as well as restored the storage capacity to 18.4 million m3.
Besides these major renovations, the storage capacity can further be maintained through flushing by sluicing the spillway. The operation protocol calls for the reservoir to be drawn down (water surface level = 27 m) and the sluicing spillway is kept open during the rainy season (1st June to 10th September); then it is closed to impound water for the remaining season (11th September to 31th May). Such operation protocols aid in creating an improved bathymetric geometry of the reservoir. However, due to various sources of pressure from tourism for a picturesque waterscape view and the concern of downstream safety, the operational pattern for the reservoir has been altered, thereby hindering the goal of increasing the flushing efficiency. Consequently, when there is no typhoon event, current operational modifications allow up to 3 m of water storage (water surface level = 30 m) [27]. In addition, when there is a typhoon or heavy rain event, the maximum allowable discharge is limited to 90 cms for the mitigation of downstream flooding [27].

2.2. Identifying the Sediment Release Efficiency Correlationships

2.2.1. Data Used and Analyses

In the first phase of this study, multiple variables from several rain events were analyzed and regression analyses were used to identify the relationship of these factors relative to the efficiency of flushing. The hourly discharge and hourly sediment concentrations were collected from three pairs of gauging stations throughout the Agongdian watershed—at Doulao Temple, Bailing Culvert, and the spill shaft. The data from the measurements recorded from 2010 to 2015 were obtained through Taiwan’s Water Resources Agency (WRA). These recorded measurements for the concentration were used to calculate the sediment inflow discharge and sediment outflow discharge. In addition to this, continued long-term rainfall data were collected during these multiple rain events. Hourly rainfall data from 2010 to 2015 were retrieved from the rainfall gauging station, located at the edge of Agongdian watershed. Rainfall data were provided by Taiwan’s Central Weather Bureau [28].

2.2.2. Statistics

Between 2010 and 2015, 18 specific rain events were selected based on the sufficiency and completeness of the data available. Based on the data collected, the initial boundary and surface conditions were tabulated, extrapolated and evaluated. The 14 variables used for the analysis can be categorized into three main groups: reservoir conditions, rainfall conditions, and inflow/outflow conditions.
For the reservoir conditions, data for the following variables were collected: initial water level and average water level. The initial water surface level was defined as the water surface level at the spill shaft at the first hour of each typhoon (rain) event. The average water level was calculated using the data collected hourly for the reservoir water surface level at the spill shaft during the flushing. The duration of flushing is defined as the interval of time elapsed between the beginning of the direct runoff occurring and ending when the outflow discharge falls back to base flow. Datasets for both variables were provided by the WRA [18,19,20,21,22,23].
For the rainfall conditions, hourly rainfall data were collected to calculate, analyze, and plot the following variables: the maximum 24-h rainfall, duration of effective rainfall, and accumulated rainfall. A maximum 24-h rainfall is a set of moving maxima values for a rain event and is particularly useful since strong rain events, such as typhoon events, commonly exceed a 24-h time span. The duration of rainfall is defined as the interval of time elapsed between the beginning and ending of a rainfall event, different form the duration of flushing. The accumulated rainfall for each rain event was based on the duration of rainfall. Hourly rainfall data from 2010 to 2015 from the Agongdian rainfall gauge station near by the dam were retrieved from the Central Weather Bureau [28].
For the inflow and outflow conditions, three major types of data were collected and used. The inflow conditions included the inflow of water, sediment, and sediment concentration. The outflow conditions included the outflow of water, sediment, and sediment concentration. The average discharge release and average velocity were further calculated. For values of sediment inflow and outflow, a rating curve must first be established. A rating curve for the water discharge (x) and sediment discharge (y) was created based on a total of 2114 analyzed samples [18,19,20,21,22,23]. Once the rating curve and sediment outflow volume were established, consequently the sediment flushing efficiency (SFE) and sediment release efficiency (SRE) were calculated. The SFE is defined as the ratio of the sediment outflow to water outflow [8,9], while the SRE is the ratio of the sediment outflow to sediment inflow [6]. The average discharge release is the amount of water inflow divided by the duration of flushing, while the average velocity is the average value of the discharge release divided by the cross-section area, i.e., the grey dashed line in Figure 1.
After the 14 variables describing the reservoir, rainfall, and inflow/outflow conditions were calculated for the 18 rain events, multiple values for the coefficient of determination (r2) were cross-calculated and evaluated. Furthermore, to better understand the factors involved in sediment removal, two-set regression analyses were performed—one for the SRE and SFE as well as for the SRE and volume of sediment outflow—for the 18 rain events.

2.3. Modeling Drawdown Scenarios

In the second phase of this study, of the 18 rain events analyzed earlier, four of these events were typhoon events that were analyzed in much greater detail. Four events, i.e., Typhoon Fanapi (2010), Typhoon Talim (2011), Typhoon Trami (2012), and Typhoon Kongrey (2013), were chosen for simulations due to the data availability. Detailed analyses involved the modeling and testing of numerical simulations for comparing different scenarios and drawdown strategies within Agongdian Reservoir. A two-dimensional numerical model was used to simulate scenarios based on changes in the drawdown strategy. Before executing the numerical simulations, the input or initial values were established based on collected and analyzed monitoring data.

2.3.1. Sedimentation and River Hydraulics (SRH-2D) Numerical Model

Two-dimensional models are useful to reservoir and water managers since these models are able to address more detailed topographies and flow features. The Sedimentation and River Hydraulics (SRH-2D) model is a numerical model useful for describing two-dimensional hydraulic and sediment transport. The model is capable of simulating a range of flows, cohesive states, and sediment transport sizes. For example, the simulated flow can range from steady, quasi-steady to unsteady flows; the state of cohesion for sediment transport can be cohesive or non-cohesive; options are available to choose multi-size sediment transport with bed sorting and armoring [29]. The SRH-2D model is able to predict bed changes by tracking the non-equilibrium sediment transport for suspended, mixed, and bed loads, and on granular, erodible rock, or non-erodible beds, and bank erosion [30].
The main limitations of the model are based primarily on its inability to properly describe three-dimensional flow fields as well as areas with drastic slopes, although these limitations do not necessarily apply to the research of this study. The SRH-2D model’s range of options and ability for prediction modeling is based on a finite-volume numerical method to solve two-dimensional dynamic wave equations (i.e., standard St. Venant equations) based on the average depth. Thus, the limitation of the model occurs because at only the two-dimensional level, it does not have the capability to accurately represent three-dimensional flow fields, like an ocean flow field. Furthermore, because the model uses an averaged depth, it has certain limitations in zones where there are drastic or sharp changes along the bed. Based on its applicability to a variety of scenarios, the model has previously been widely used for both hydraulic and sediment modeling in engineering projects since 2006. So, although the limitations of the two-dimensional model do not apply to the research of this study, the SRH-2D model has even been shown to be successfully applied in density current modeling of other areas within Taiwan, including Shihmen Reservoir [31].

2.3.2. Initial and Boundary Conditions

In this study, the application of the SRH-2D model required an input of the initial boundary/surface conditions that were identified and calculated in the previous phase of this study. The upstream boundary included hourly discharge hydrographs of both the Bailing Culvert gauging station at the Zhuoshui River and the Doulao Temple gauging stations at the Wanglai River, while the downstream boundary used discharge hydrographs of the spill shaft and the irrigation shaft. The sediment inflows at the two upstream gauging stations were used. According to a study conducted by WRA [23], the main sediment source to the reservoir is landslides from upstream catchment. We thus made the assumption that the sediment inflow from the downstream catchment can be reasonably neglected. The sediment transport between the gauging stations and the impoundment area was calculated by sediment transport capacity equations for non-cohesive sediment and the critical shear stress for surface and mass erosion for a cohesive sediment [32]. Besides this, other relevant information to input into the two-dimensional model include: a mesh network produced from a contour map, surface roughness, and the median sediment diameter size.
Because the numerical model requires the topography of the reservoir impoundment to be input as cells and nodes, the Surface Water Modeling System software based on the contour maps was used to generate meshes. Contour maps were first created by inputting the collected measurements from topography surveys of the reservoir impoundment before and after the period of empty flushing (i.e., May and September, respectively) for 2010, 2011, 2012 and 2013. The initial topography is based on the terrain measured either during May or June of 2010, 2011, 2012, and 2013, and represents the conditions prior to the typhoons of that particular year. The surveys were conducted in an area of 367 ha with a water surface level of 40 m. The contour maps generated during surveys were to a scale of 1:2000. Topographical survey data was conducted by the WRA [17,18,19,20,21,22,23]. Each mesh for numerical modeling has 18,316 nodes and 34,625 cells, with a cell size between 10 and 20 m.
Manning’s roughness coefficient of the reservoir was calibrated by comparing the observed and computed water surface profiles. Based on recommendations from Chow [33], Manning’s roughness coefficient should range between 0.025 and 0.100 for natural rivers wider than 30.5 m. So, in this study, the roughness coefficient values of 0.025, 0.035, and 0.045 were tested. In addition to the surface roughness values, the median diameter of sediment size throughout the impoundment area (which is denoted as dark gray in Figure 1) was analyzed to be rather uniform at approximately 1.33 μm [23]. Thus, information describing all the hydrological, topographical and sediment parameters was utilized so that the SRH-2D model could be successfully executed: the reservoir described as a mesh network, values in the roughness coefficient, sediment size, conditions for the reservoir, rainfall, and inflow/outflow. The SRH-2D model was conducted in two steps: first, a flow routine model was executed; second, a mobile-bed model helped produce concentration plots based on the specific scenario and drawdown strategy. The time step for the simulation and result output frequency was set up as one second and one hour, respectively.

2.3.3. Scenario Design

As noted, the rapid sedimentation rate is attributed to the high sediment production from the reservoir’s southern confluence, the Zhoushui River, which has two to three times the sediment load as the northern confluence. To understand how the concept of compartmentation [6] can be implemented in Agongdian Reservoir, we designed the partition desilting scenario by adding a 40-m-high dike from where the Zuoshui River enters the reservoir all the way to the location 50 m before the spillway in the modeling context. In general, four major different types of simulation scenarios were designed and created to observe the changes of the SRE and SFE based on variations in the drawdown strategies during four different typhoon events from 2010 to 2013.
(1)
Baseline scenarios: The first type involved the current management conditions in practice, and so were considered baseline scenarios (i.e., drawdown strategies A1, B1, C1, and D1 in Table 1).
(2)
Partition desilting scenarios: The second type involved partition desilting, where the reservoir is divided under incrementally changing water surface conditions. Specifically, simulations included Agongdian Reservoir being divided into two compartments to separate the inflow of the Zhoushui River and the Wanglai River. Each partition desilting scenario moves further away from the baseline conditions, and the initial water levels of the reservoir incrementally decrease from approximately 31 m to 27 m (i.e., drawdown strategies A2 to A5; B2 to B4; C2 to C3, and D2 to D4 in Table 1).
(3)
Empty flushing scenarios: The third type of scenario involved modeling for the reservoir to be entirely flushed when the reservoir is already empty and without any partitioning (i.e., drawdown strategies A7, B6, C5, and D5 in Table 1).
(4)
Empty flushing with partitioning scenarios: The fourth type of simulated operations involved a combination of partitioned desilting when the reservoir is already empty (i.e., drawdown strategies A6, B5, C4, and D4 in Table 1).

2.3.4. Statistics

To help evaluate the accuracy of each forecasted model, the mean absolute percentage error and root mean square error were calculated for each drawdown strategy for the four typhoon events. The mean absolute percentage error (MAPE) essentially defines the absolute range of error a model has predicted, in this case, the distance between the simulated and the actual observed thalweg of the flushing channel (Equation (1)) [34]. MAPE values of less than 10 indicate a “highly accurate” forecast; values between 10 and 20 can be categorized as a “good” forecast, while MAPE values between 20 and 50 are considered to provide a “reasonable” forecast; MAPE values exceeding 50 indicate that the model is an inaccurate forecast [34].
The root mean square error (RSME) is an index that helps evaluate the quality of fit for the particular variable being tested. So, when the RSME value for a particular variable, say the sediment concentration, is closer to zero, this indicates that there is less error in the simulation results. (Equation (2)).
M A P E = 1 n | T h a l w e g o b s e r v e d T h a l w e g s i m u l a t i o n T h a l w e g o b s e r v e d | × 100 %
R M S E = i = 1 n ( T h a l w e g o b s e r v e d T h a l w e g s i m u l a t i o n ) 2 n

3. Results

3.1. Flushing Efficiency and Its Relationship with Selected Factors

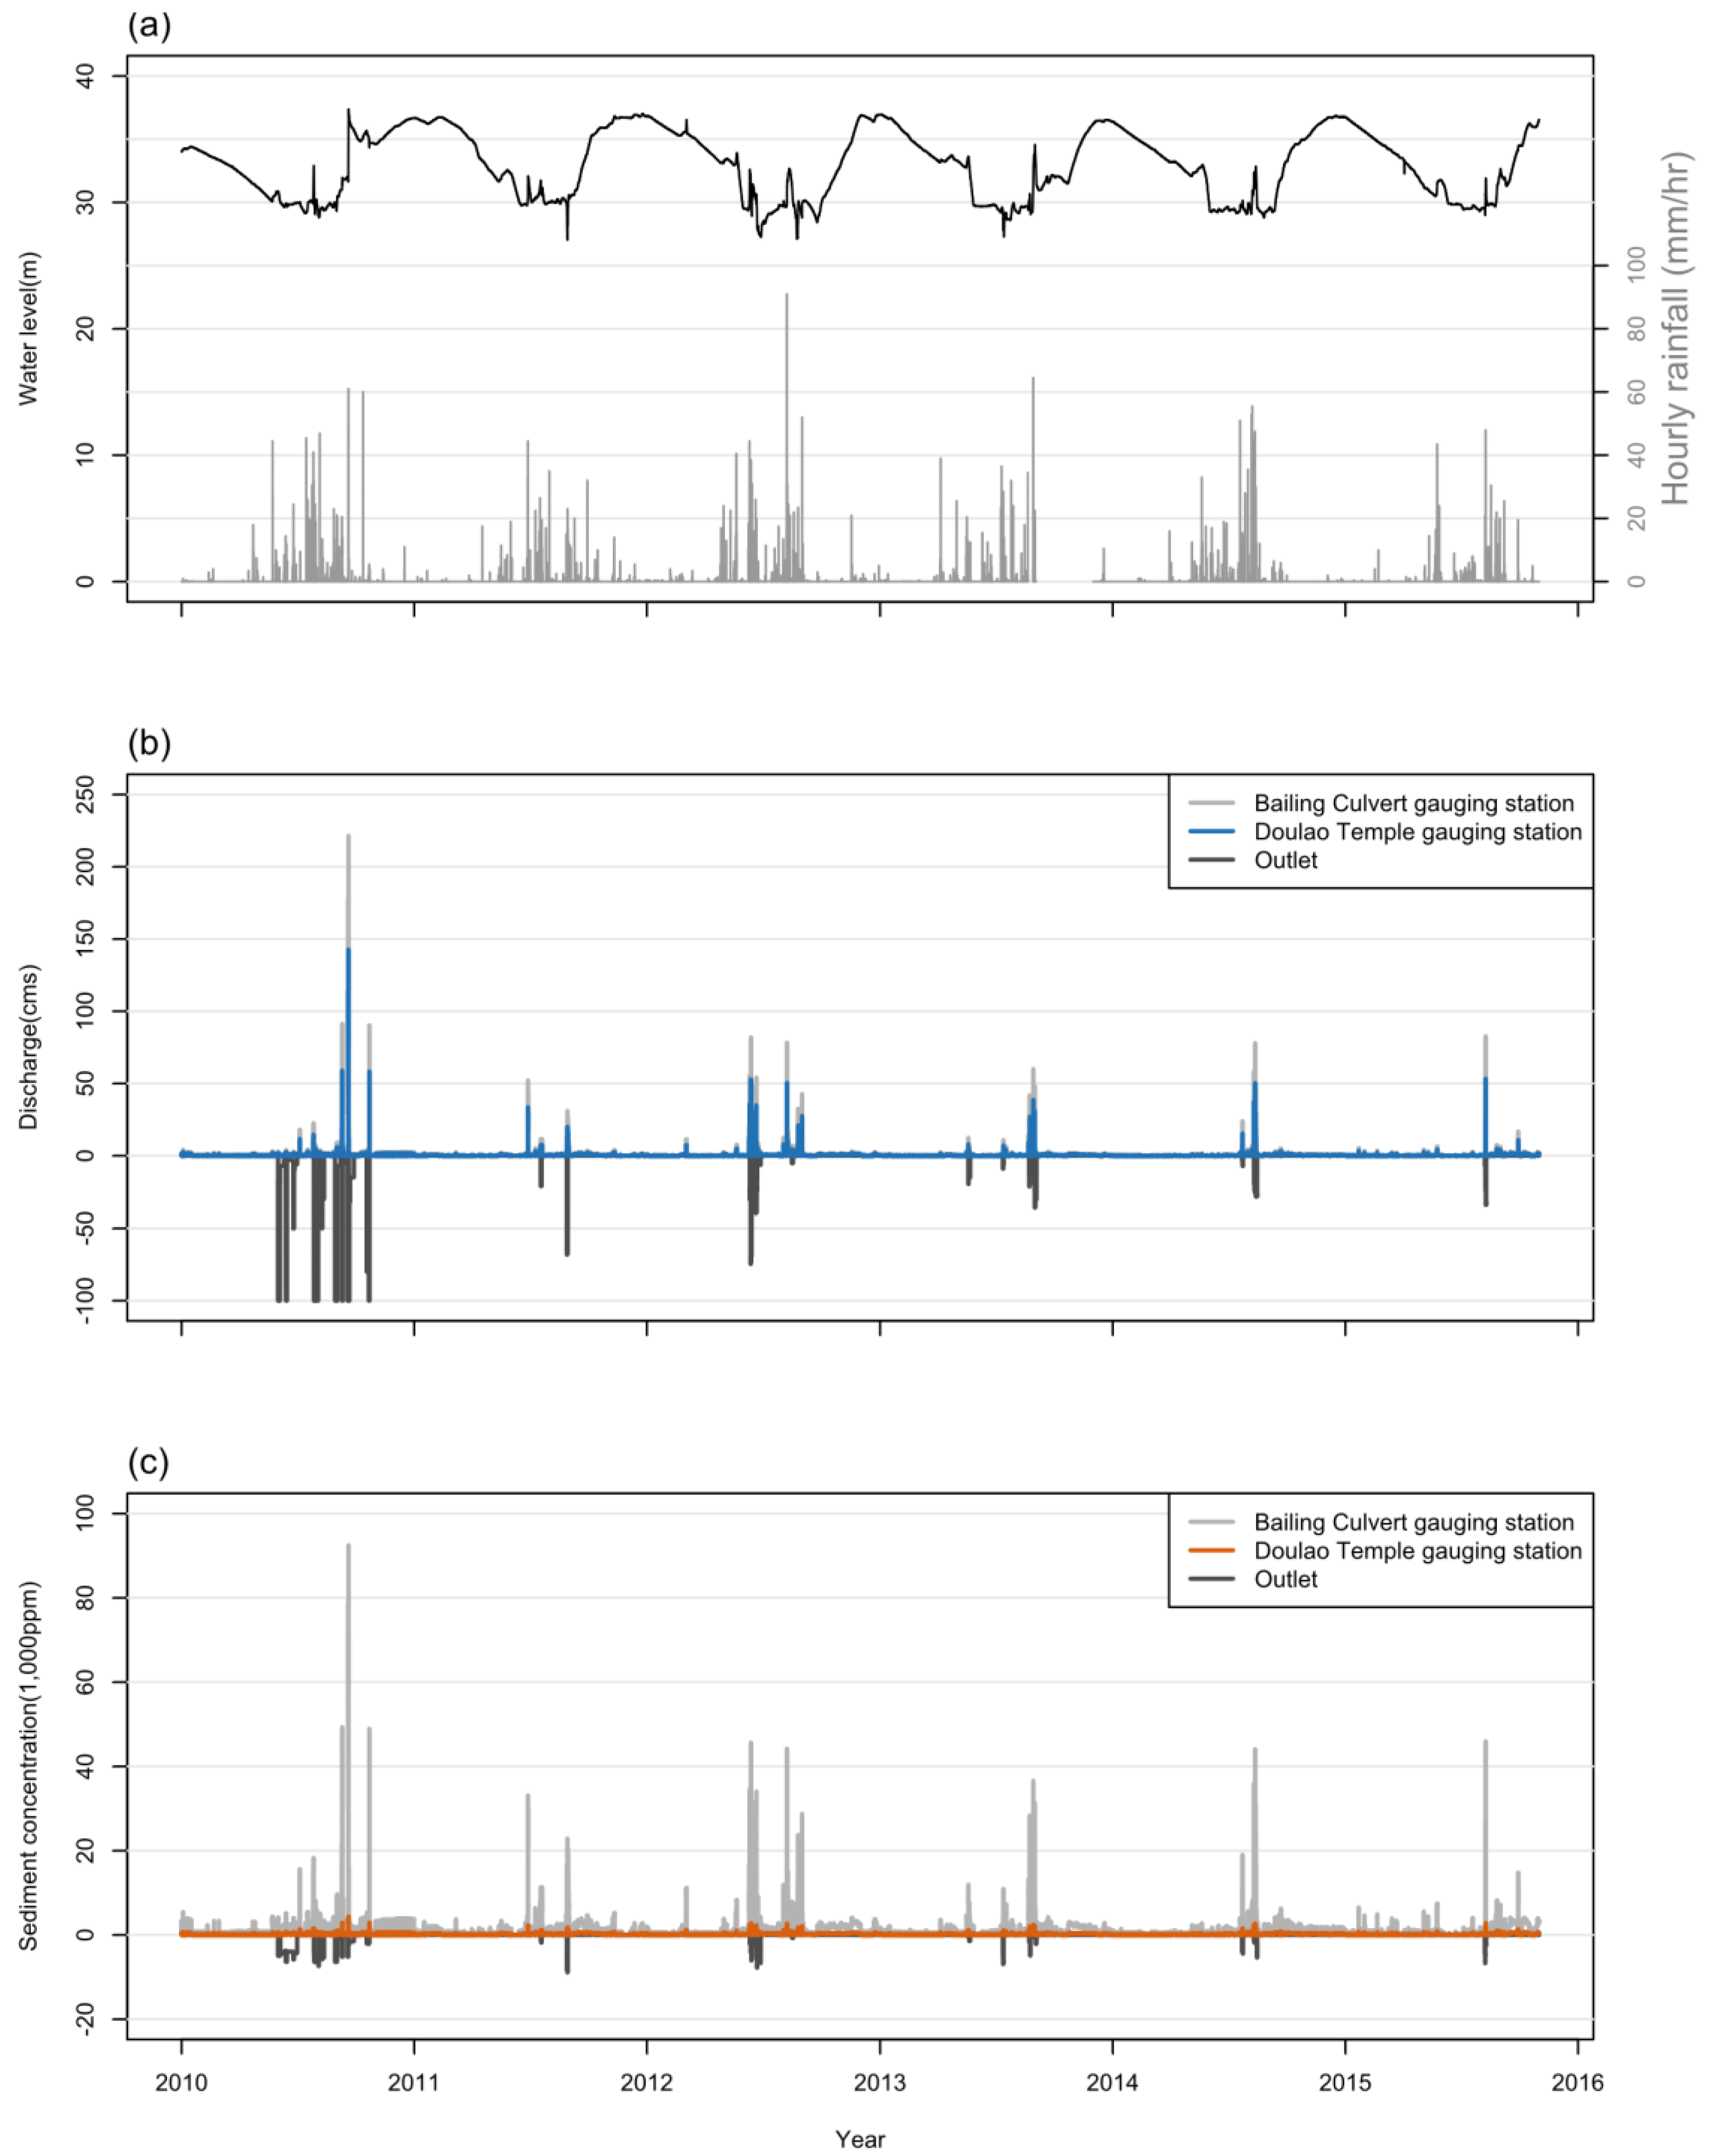
The long-term data observed in this study shows that Taiwan’s rainy season indeed starts in March and ends approximately in September (Figure 3a), similar to previous findings [24]. From 2010 to 2015, findings showed that 94% of the observed rainfall occurred in the rainy season (March to September), with 77% of the observed rainfall primarily occurring during the flushing period (June to September (Figure 3a)). The average annual rainfall for the Agongdian watershed from 2010 to 2015 was calculated as 1921 mm. The annual rainfall for those six consecutive years was 2403 mm; 1683 mm; 2542 mm; 1355 mm; 1716 mm; 1811 mm, respectively (Figure 3a).
Beyond this, the discharge for Wanglai and Zhuoshui tributaries, as well as the outlet for Agongdian Reservoir, were plotted (Figure 3b). Due to the location of the two gauging stations within each tributary, Bailing gauging station in the southern subcatchment of Zhuoshui had a higher discharge than Doulao gauging station, the gauging station in the northern subcatchment of Wanglai. In addition, the discharge of the outlet was determined by the reservoir water level at that moment and the proportion to which the spill shaft gate and irrigation shaft were opened. If the spill shaft gate is fully opened, the discharge of the spill shaft can reach a maximum of 85 cms. Similarly, the discharge of the irrigation shaft can reach a maximum of 15 cms. Because of these two flows, the outlet can only discharge a maximum of 100 cms, as seen to occur in late 2010 (Figure 3b).
The sediment concentration followed a similar trend as the discharge for Bailing and Doulao gauging stations as well as the Agongdian outlet (Figure 3c). It was observed that the sediment concentration for Bailing’s station was consistently higher than Doulao’s station. These results correspond with previous research [17,18,19,20,21,22,23].
The observed long-term discharge and sediment concentration were further extrapolated and analyzed by using a rating curve for the water discharge (x) and sediment discharge (y). Based on these values, the proportion of sediment inflow and outflow during each rain event was plotted (Figure 4). A total of 18 rain events occurring between 2010 and 2015 were selected based on the sufficiency and completeness of the data available (Figure 4). Out of these 18 events, 12 rain events occurred during the drawdown flushing period (1st June to 10th September) during which time the sluicing spillway was kept open. The remaining six rain events occurred during the non-flushing period, where water is impounded for the remaining season (11th September to 31st May). The initial water surface level of the 12 events during the drawdown flushing period ranged from 27.8 m to 30.6 m, while the initial water surface level of six events during the non-drawdown season ranged from 31.0 m to 36.2 m.
In general, the 12 flushing events had higher amounts of sediment outflow than compared to the six non-flushing events. Specifically, the six non-flushing rain events included: Meranti (2010), Fanapi (2010), rain event (2011), rain event (2011), rain event (2013), and Dujuan (2015 (which are denoted by asterisks and hatch marks in Figure 4)). Although Typhoon Fanapi is considered a non-flushing event, it does have a markedly higher amount of sediment outflow compared to the other non-flushing events. This is due to the extremely high amount of sediment inflow. Besides comparing flushing and non-flushing events in general, it should also be noted that the highest observed SRE rate was at 81%, occurring during Typhoon Namadol in 2011—when a drawdown flushing period was in effect (Figure 4). The average reservoir water surface level was at 29.6 m during this event, and the sediment inflow and outflow were recorded at 27,372 m3 and 22,049 m3, respectively.
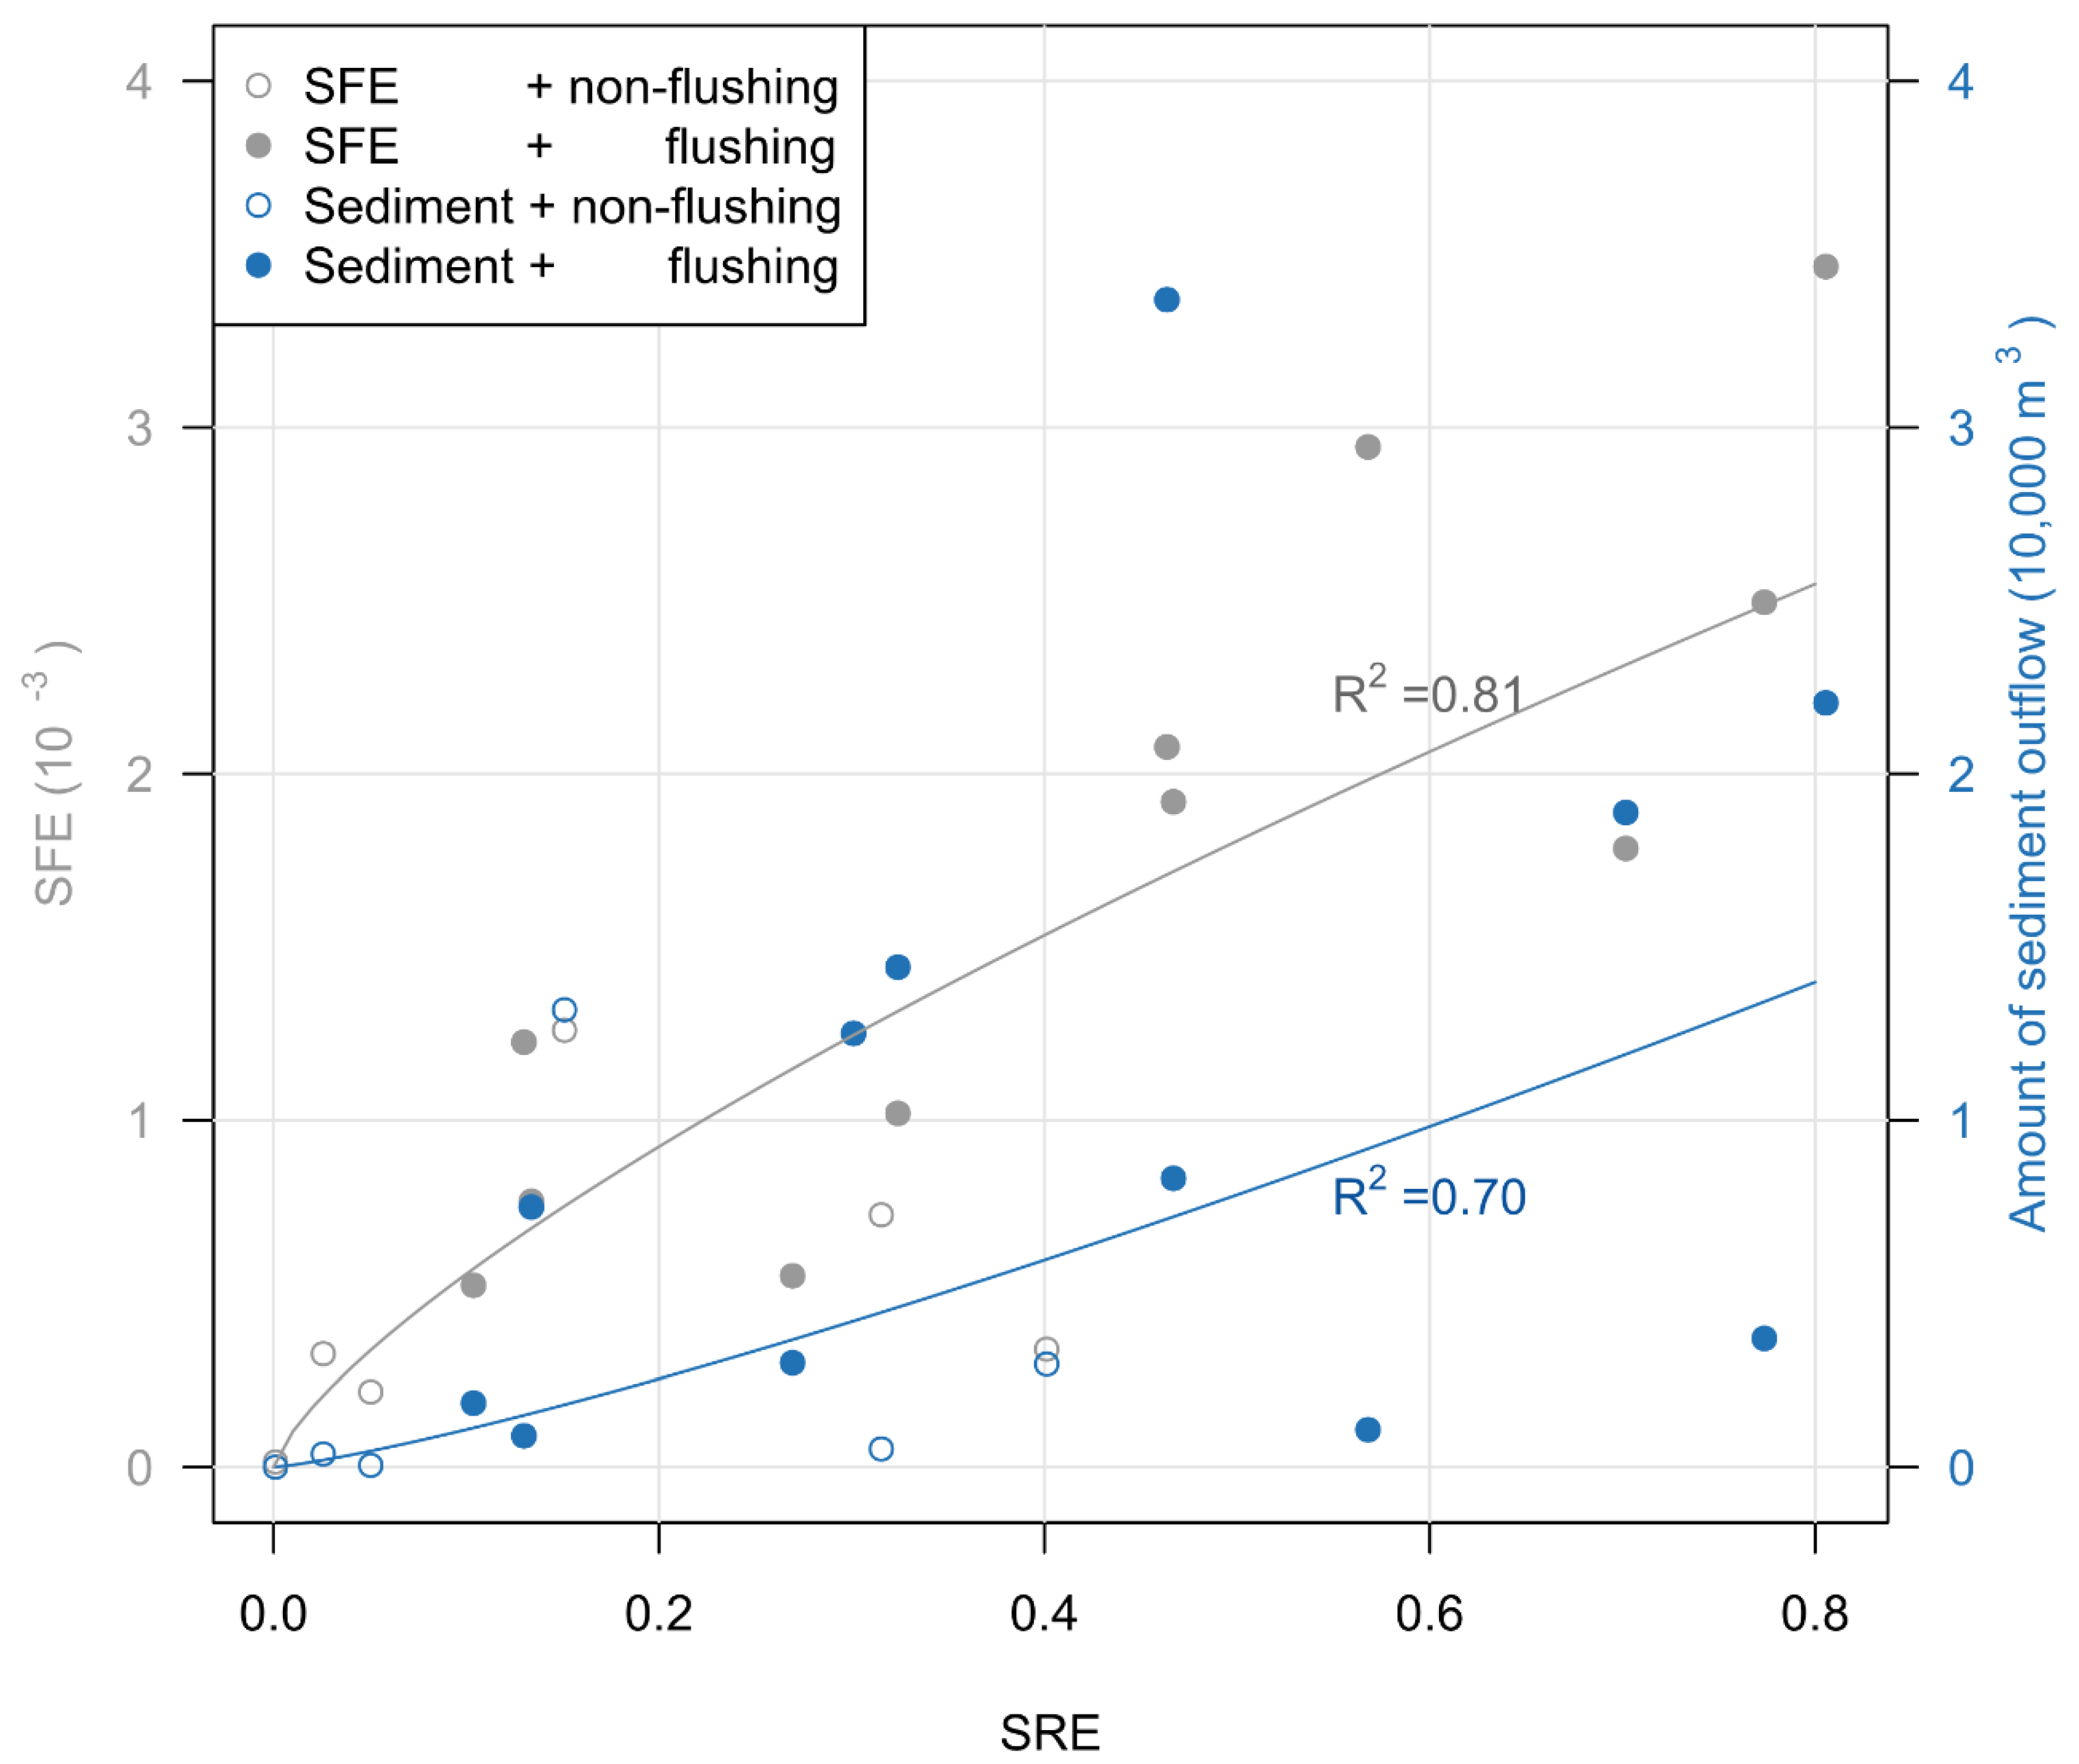
Since the correlation values of the SRE to both the sediment outflow and SFE might fluctuate based on whether there was drawdown flushing, these three variables were analyzed in further detail and plotted (Figure 5). Overall, the average SRE of Agongdian Reservoir for the 18 observed rain events was calculated as 33.3%. The average SRE for the 12 observed rain events occurring during the drawdown flushing period was calculated as 42% (denoted as closed circles in Figure 5). The average SRE for the six rain events occurring during the non-drawdown flushing period was calculated as 15.7% (denoted as open circles in Figure 5). As for the SFE, the average value for the 18 observed rain events was calculated as 0.14%. The average SFE for the 12 observed rain events occurring during the drawdown flushing period was calculated as 0.18%, while the average SFE for the six rain events occurring during the non-drawdown flushing period was calculated as 0.05%.
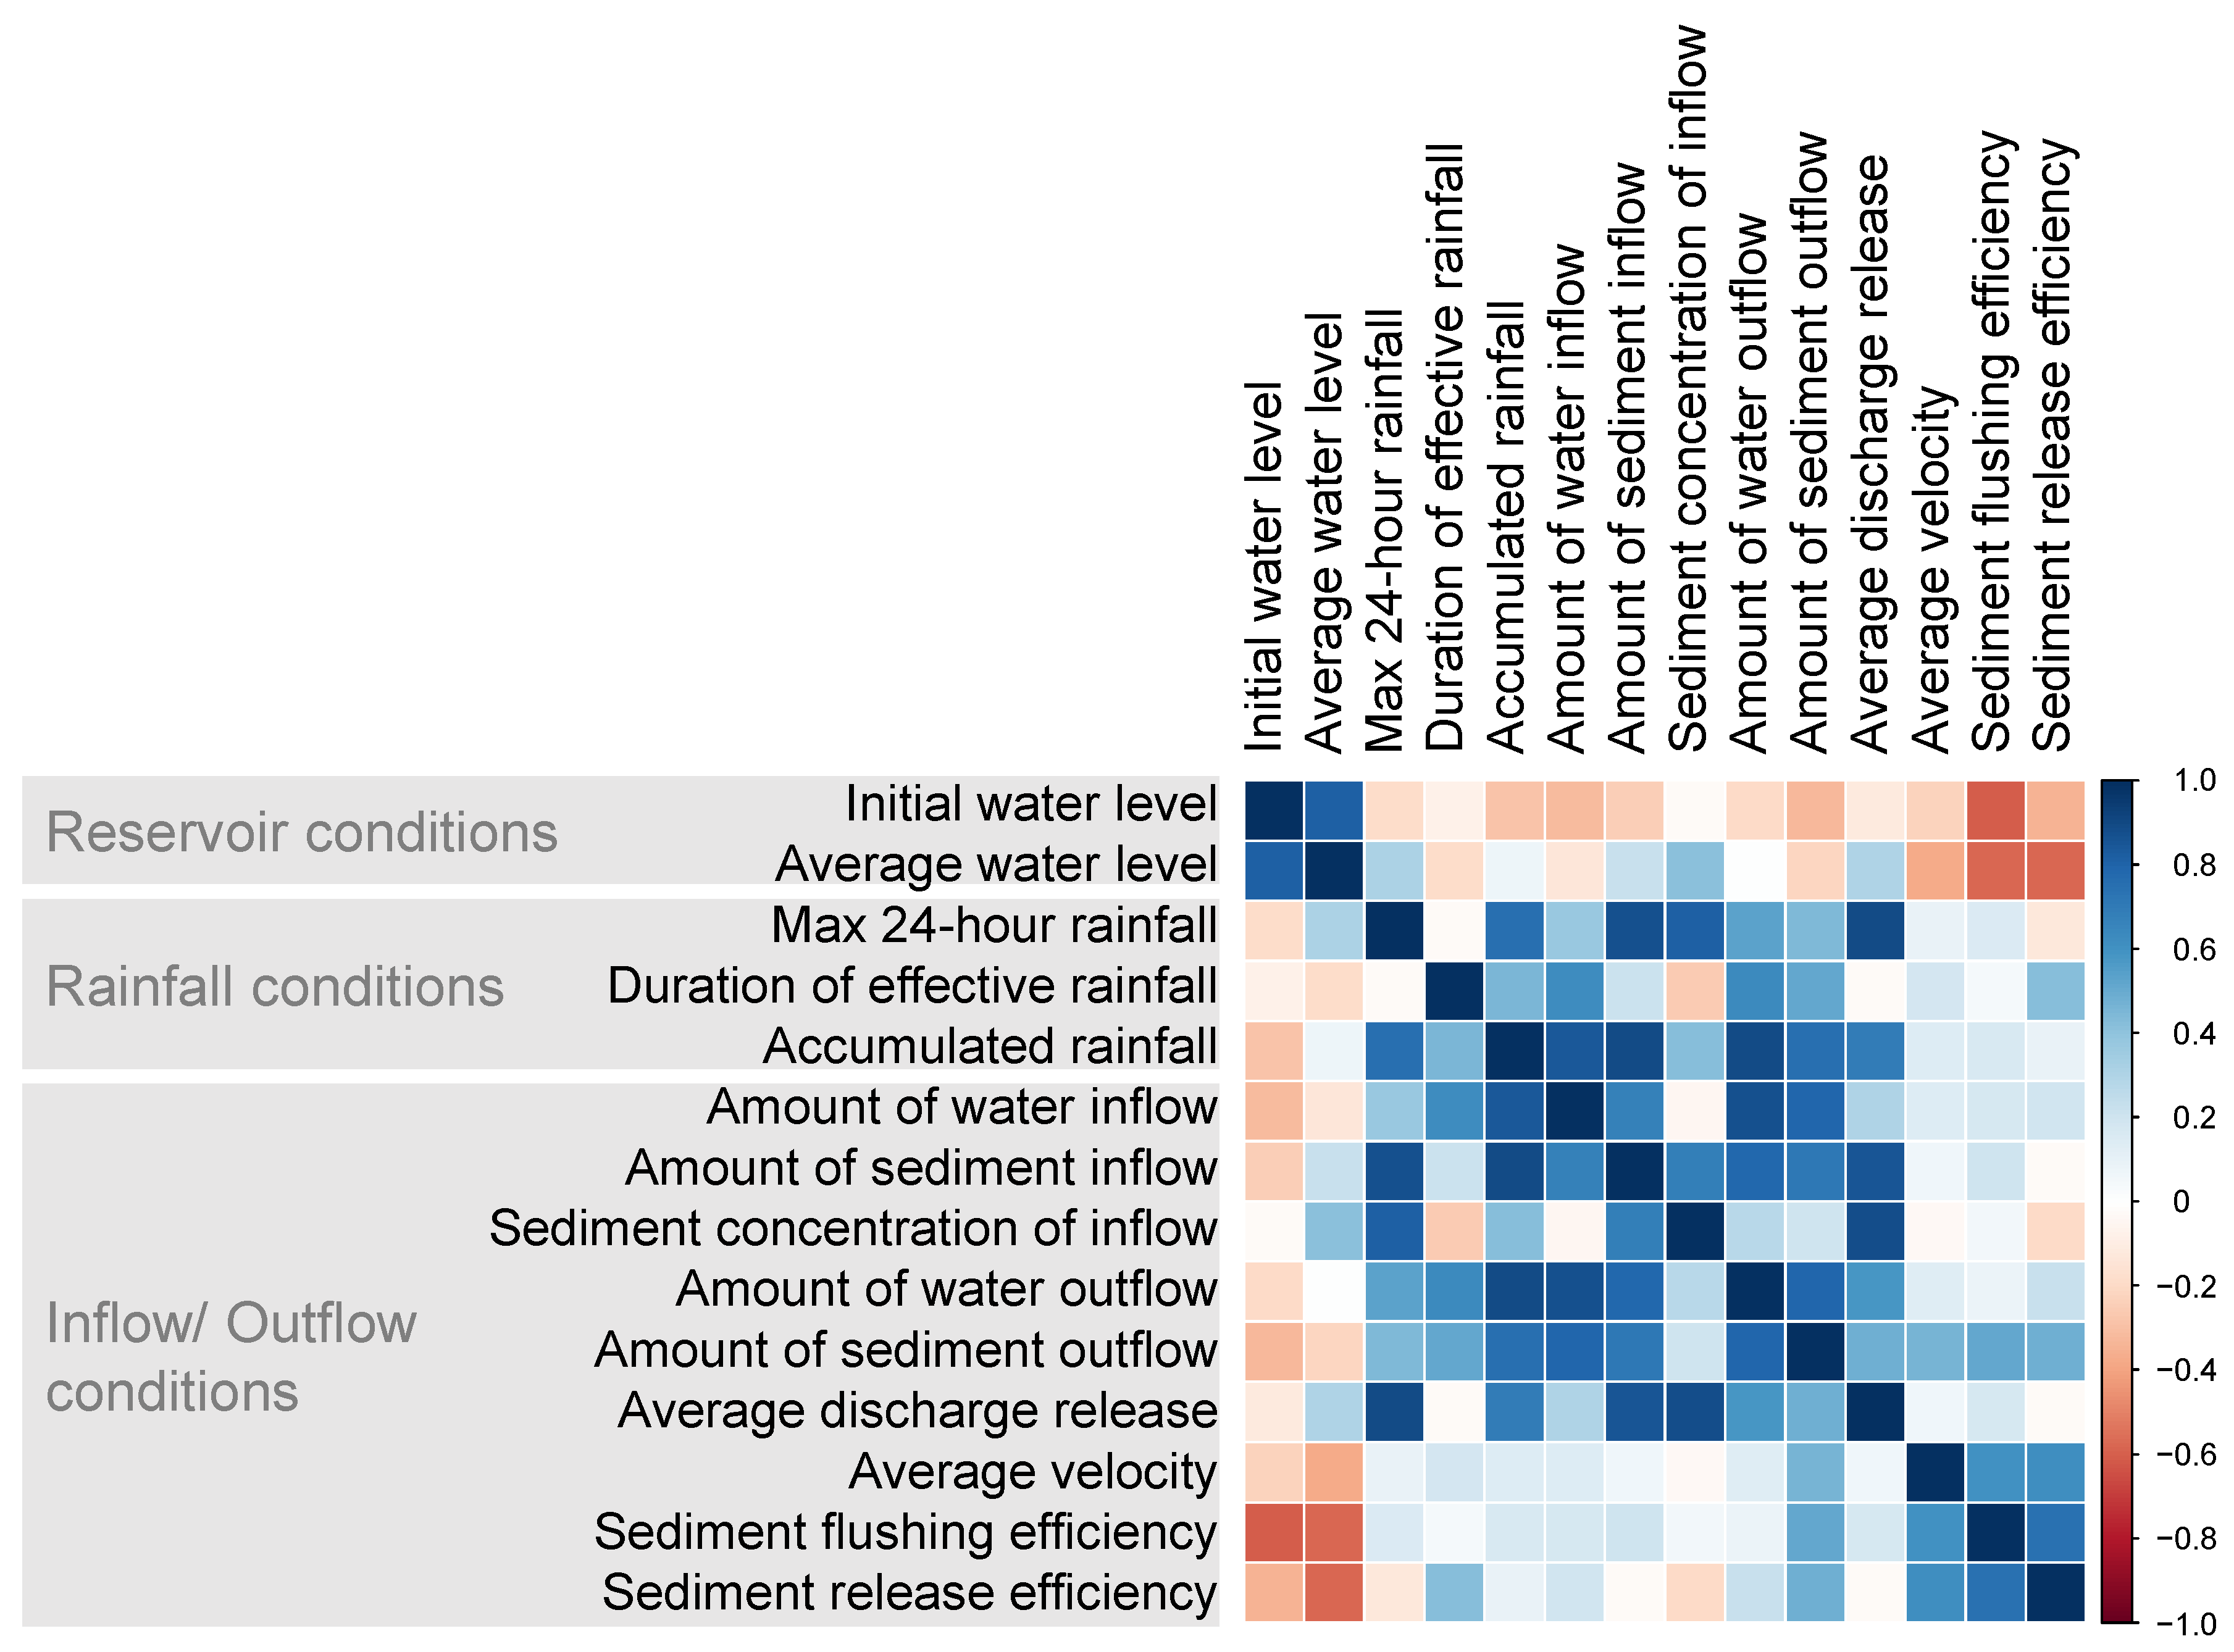
To better understand the factors involved in the specific proportions of sediment inflow and outflow amounts for all 18 rain events, a total of 14 variables which could be grouped into three categories—the reservoir conditions, rainfall conditions, and inflow/outflow conditions—were calculated (select data reported in Table 2) and then their coefficients of determination, r2, were determined (Figure 6). Generally, four variables that helped to describe the inflow/outflow conditions were mostly related to determining the efficiency of flushing, which included: the amount of sediment outflow, average velocity, initial water level and average water level (Figure 6).
The amount of sediment outflow was strongly correlated with the accumulated rainfall as well as the amounts of water inflow, sediment inflow, and water outflow, with r2 values of 0.76, 0.80, 0.72, and 0.80, respectively. The average discharge release was strongly correlated with the maximum 24-h rainfall, accumulated rainfall, amount of sediment inflow, and sediment concentration of inflow, with r2 values of 0.90, 0.69, 0.85, 0.89, respectively. The SFE was moderately correlated with the initial water level, average water level, amount of sediment outflow, average velocity, and SRE, with r2 values of −0.60, −0.57, 0.52, 0.61, 0.74, respectively. The SRE was moderately correlated with the average water level, duration of effective rainfall, amount of sediment outflow, average velocity, and SFE, with r2 = −0.57, 0.42, 0.48, 0.62, 0.74, respectively. Notably, both the SFE and SRE were moderately negatively correlated with the reservoir conditions.

3.2. Numerical Modeling Results

3.2.1. Calibration and Validation Results

Of the 18 rain events, there were four notable typhoon events that were selected for scenario designs and performing the simulation modeling as described below. The four typhoon events—Fanapi, Talim, Trami, and Kongrey—occurred in September 2010, June 2012, August 2013, and August 2013, respectively (Table 2). For the calibration of the numerical SRH-2D model, the baseline condition of Typhoon Fanapi (drawdown strategy A1) was used; for validation, the baseline conditions for Typhoons Talim, Trami, and Kongrey (drawdown strategies B1, C1, and D1, respectively) were used. The baseline observed data was compared to the baseline simulated data that was output by the model.
By comparing the observed and simulated water surface levels of Typhoon Fanapi (drawdown strategy A1), the calibration results show that the best fitting Manning’s coefficient was a value of 0.035. Based on the calibration of the water level, the RMSE and MAPE were calculated as 0.27 m and 0.60, respectively. Because the MAPE was less than a value of 10, this indicates a highly accurate forecast. Based on the calibration of the water level for Typhoon Fanapi, other input parameters such as the time step and bedload length were determined. The most appropriate time step was evaluated at 1-s increments, and the bedload adaption length was evaluated at 50 m. Furthermore, the observed sediment outflow concentrations were compared with the multiple simulated sediment concentrations that were obtained based on various sediment transport formulae. Based on the calibration of the sediment concentration, the Englund–Hansen function [35] was found to produce the lowest RMSE values at 1270 ppm, indicating a somewhat reasonable forecasting (MAPE = 50).
By comparing the observed and simulated water surface levels of Typhoons Talim (drawdown strategies B1), the water surface level validation results show that the RSME was calculated as 0.28 m. Because the MAPE value was less than 10, this again indicates a highly accurate forecast. For the validation of the sediment concentration for Typhoon Talim, the RSME was reported as 1563 ppm with a MAPE value of 40, which is considered a reasonable forecast.

3.2.2. Simulation Results

The numerical model produced hydrographs detailing the outflow sediment concentration based on different drawdown strategies (Figure 7). For all four typhoon events, the baseline conditions showed lower sediment concentration values than all other scenarios (Figure 7). While Typhoon Fanapi is a prime example illustrating an obvious shift in earlier sediment flushing, the three other typhoon events selected in this study had a more subtle overall shift. The recorded baseline conditions show that the inflow discharge for Typhoon Fanapi was highest among all the events with an average inflow discharge (129 cms), being two times higher than the average outflow discharge (65 cms). For Typhoon Fanapi, the hydrograph peak for the other scenarios (drawdown strategies A2 to A7) occurred earlier than the baseline scenario (drawdown strategy A1), indicating earlier signs of flushing (Figure 7a). Specifically, for partition desilting scenarios (drawdown strategies A2, A3, A4, and A5), the sediment concentration peaked at 11 h after the beginning of the operation with values of 9834 ppm, 8271 ppm, 10,210 ppm, 11,269 ppm, respectively. In addition, for scenarios involving any kind of empty flushing whatsoever (drawdown strategies A6 and A7), the sediment concentrations peaked 3 h after the beginning of the operation with values of 12,810 ppm, and 9172 ppm, respectively. The time values at which the peaks occurred is much earlier than the baseline scenario of A1, which peaked at 14 h after the beginning of the operation with a sediment concentration of 5764 ppm.
For Typhoon Talim, the hydrograph peak for the scenario involving empty flushing with partition (drawdown strategy B5) also occurred earlier than its respective baseline scenario (drawdown strategy B1). Specifically, the baseline conditions showed a peak occurring 50 h after the beginning of the operation with the outflow sediment concentration at 2841 ppm, whereas the empty flushing with partition showed a peak occurring 22 h after the beginning of the operation with the outflow sediment concentration at 21,232 ppm (Figure 7b). Although Typhoons Trami and Kongrey (scenarios C and D, respectively) followed a similar trend as Typhoon Talim (Scenario B) having subtle signs of the sediment concentration at the outflow, the two events showed even less distinct hydrograph peaks (Figure 7c,d).
To better understand the spatial context in which sediment flushing occurs, simulated sediment concentration fields throughout the reservoir based on different scenarios were plotted for Agongdian Reservoir (Figure 8). Since Typhoon Fanapi (Scenario A) provides the most clear-cut shift in sediment flushing compared to the other events, the reported results will focus on the effect of different drawdown strategies on the sediment concentration fields from only this event. The following three main drawdown strategies are outlined in Figure 8—the baseline conditions of 31.6 m (drawdown strategy A1), and partition desilting at 31.6 m (drawdown strategy A2)—that are, the same initial water level as the baseline scenario, and partition desilting at an initial water level of 28.0 m (drawdown strategy A5). These specific scenarios were chosen and highlighted for two main reasons. First, these three drawdown strategies best represent the differences between partitioning and non-partitioning. Second, beyond this, there is further illustration of the clear differences between the initial water level for conditions that involve partition desilting.
In comparison to the baseline conditions (drawdown strategy A1) and partition desilting (drawdown strategy A2) at 12 h after the beginning of operation, it is clear that the partition helped avoid the spreading of the high concentration flow from the southern confluence, the Zhuoshui River. In baseline conditions (drawdown strategy A1), the high concentration from the Zhuoshui River flows towards the mouth of the northern confluence, the Wanglai River. Beyond this, the high sediment concentration that has already mixed with the Wanglai River is pushed back and forms a circular flow pattern in Agongdian Reservoir. In contrast to this, the partition desilting (drawdown strategy A2) that occurred at the same initial water level as the baseline conditions shows the delivery of high sediment directly flowing towards the outlet spill shaft, although there is still some sediment concentration (5000 ppm) that leaks and heads towards the mouth of the Wanglai River.
Beyond this, the nuanced differences in the initial water levels at the beginning of operation were also analyzed. While the hydrograph for Typhoon Fanapi already illustrates that the non-baseline scenarios (drawdown strategies A2 and A5) do have an earlier peak in the sediment concentration (Figure 7a), geospatial outputs based on the SRH-2D model show that at 3 h after the beginning of the operation, the high concentration flows for drawdown strategy A5 (initial water level = 28 m) already reaches the outlet, unlike the sediment concentration flows for drawdown strategy A2 (initial water level = 31.6 (Figure 8)). This indicates that the lower initial water level in drawdown strategy A5 can help allow for more sediment to reach the outlet within the same timeframe. It is clear that the turbid water in the partition desilting simulations moved faster and carried more sediment than the baseline condition. The effect of sediment reaching the outlet is more obvious at the lower initial water surface levels (Figure 8; drawdown strategies A5 vs. A2).

4. Discussion

4.1. Factors Associated with the Efficiency of Flushing

The results show that continuous, thorough and long-term data for Agongdian Reservoir were successfully collected from 2010 to 2016 for this study (i.e., Figure 3). In particular, because Agongdian Reservoir is one of the few reservoirs in the world that currently conducts sediment flushing operations, it is vital to improve the understanding of its flushing efficiency and its interaction with hydrological parameters and potential engineering interventions. Thus, a critical examination of these multiple factors affecting the desilting efficiency is essential to maintain the storage capacity and potentially improve the operations of Agongdian Reservoir.
Results from this study showed that, similar to earlier studies [6,11], the initial water level, average water level, and average velocity were considered critical in influencing SRE and SFE. The two silting efficiency indicators, the SRE and SFE, were assessed by utilizing regression analysis methods to analyze hydrological parameters (Figure 6), which helped describe the initial and boundary conditions, rainfall conditions, and inflow/outflow conditions of the reservoir. It is important to emphasize that when the average water level is less than the initial water level, there is a noticeably higher SRE rate for that particular rain event. For example, Typhoons Nanmadol and Matmo occurring in 2011 and 2014, produced rather high SRE values of 81% and 77%, respectively (Figure 4). In both events, the average water surface levels did not exceed the initial water surface levels.
Furthermore, this trend of a lower average water level is also evident when analyzing the four typhoon events that were selected for the simulation modeling of the scenario designs (Table 2). For example, while Typhoon Talim produced an SRE rate of 70%, it was observed that the average water level of the reservoir was 29.2 m and the initial water level was 30.3 (Table 2). In contrast to this, Typhoons Fanapi and Kongrey produced very low SRE rates of 15% and 13%, respectively. In both instances, the average water level surpassed the initial water level by over 3 m (Table 2).
Besides this, the timing of whether the rain event occurred during the drawdown flushing period may also help to further encourage higher SRE rates. For example, the average SRE of 12 observed rain events occurring during the drawdown flushing period was higher than that of the six rain events occurring during the non-drawdown flushing period, with values calculated as 42% and 15.7%, respectively (Figure 5). These results provide further evidence that flushing events during a flushing period can allow for lower water levels, leading to higher flushing efficiency rates.
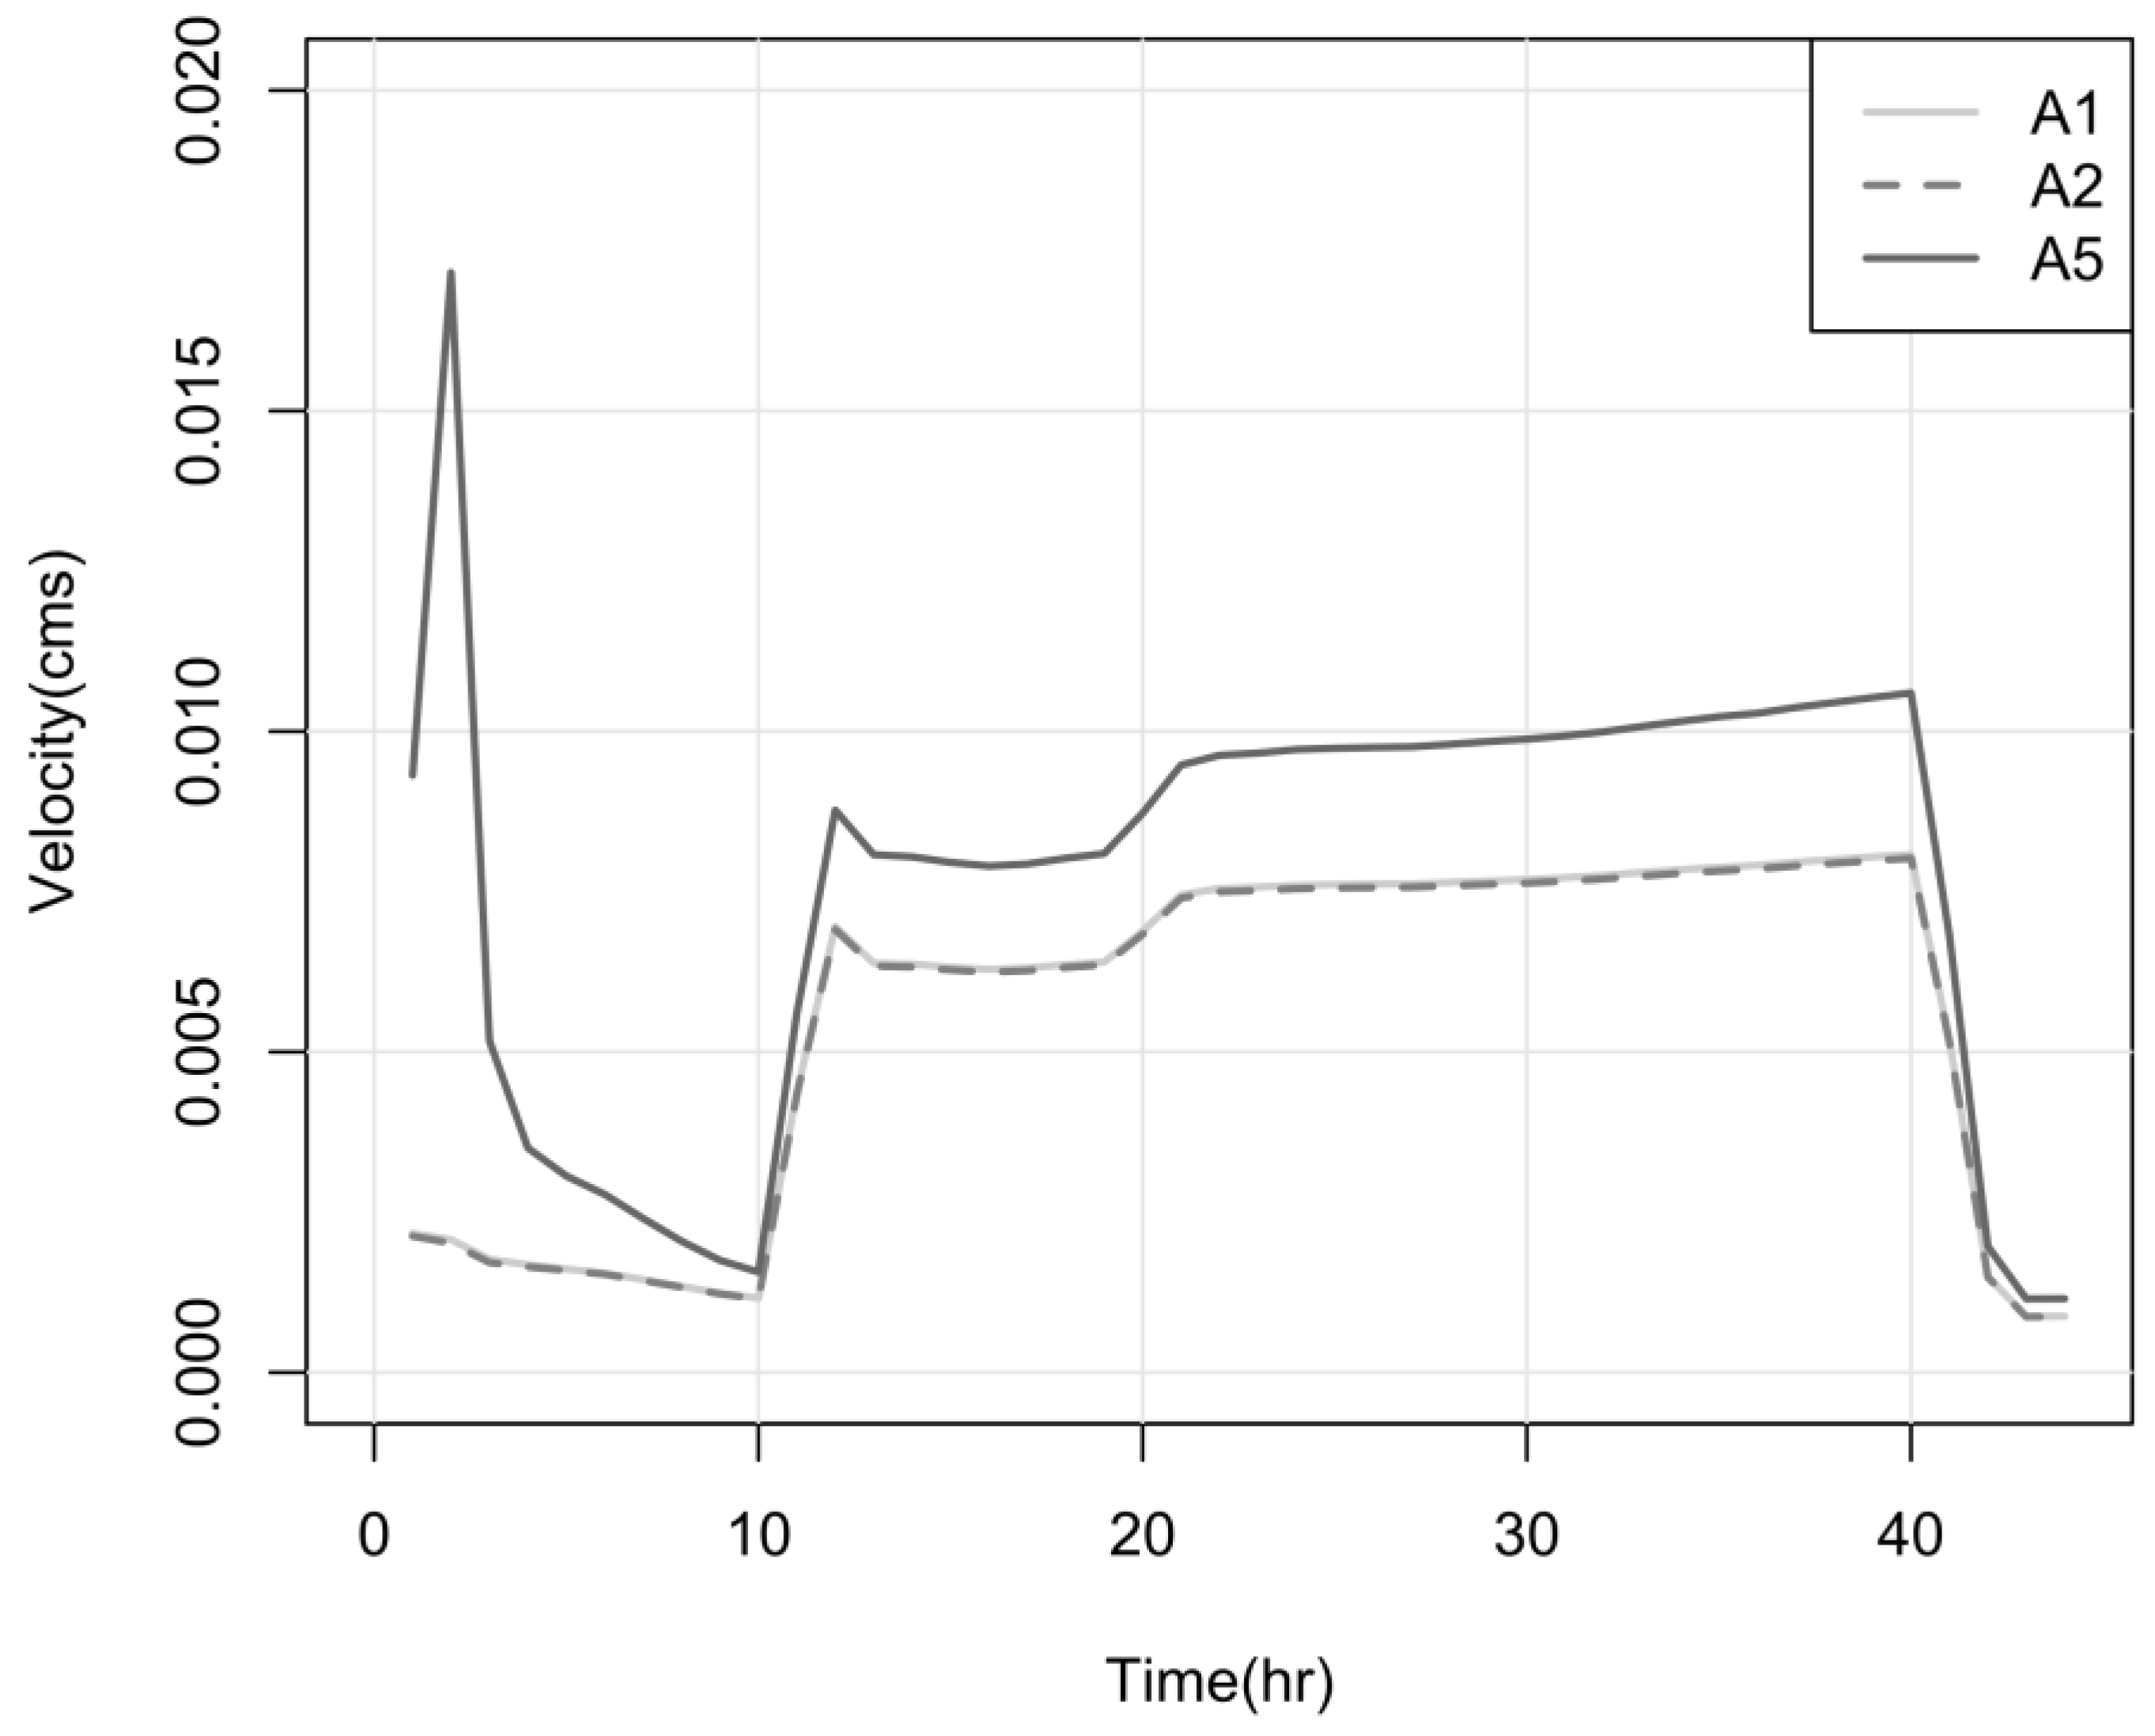
In addition to the initial water level and average water level, the average velocity of the reservoir is another factor that has been shown to influence flushing efficiency, but is dependent on the initial drawdown level. Based on the known cross-sectional area (denoted as a dotted line in Figure 1) that changes with the water level for each simulated scenario, and based on the known discharge value at the time, the velocity for Typhoon Fanapi was extrapolated and then calculated (Figure 9). Results from the numerical simulations show that the baseline scenario and one of the partition desilting scenarios, where the initial drawdown levels start at 31.6 m for both cases (drawdown strategies A1 and A2, respectively), produced overlapping velocity profiles (Figure 9). However, when the partition desilting scenario instead has an initial drawdown of 28.0 m (drawdown strategy A5), the average velocity was enhanced by 83% when compared to the average velocity of baseline conditions (A1 (Figure 9)). In turn, such increases in average velocities can lead to a 50% improvement in the SRE rates (Table 3), a higher peak concentration (Figure 7), and faster movement of higher peak concentrations throughout the reservoir (Figure 8).
In general, the results from this study have analyzed and identified multiple factors affecting the flushing efficiency indicators. Analyses of hydrological parameters reveals that the average water level, initial water level, and average velocity are key parameters. In particular, when the average water level is lower than the initial water level, there are noticeably higher SRE rates—especially if the event occurs during the flushing period. The average velocity is another hydrological parameter shown to influence the SRE values. Since the average velocity varies based on particular partition desilting scenarios, it is thereby dependent on each scenario’s different initial drawdown water level. As the initial water level decreased, the average velocity and SRE rates increased, thereby indirectly increasing both the concentration and speed of movement for sediment peaks. Beyond this, numerical simulations involved with any kind of empty flushing provided higher SRE rates than compared to any scenario. Thus, multiple factors affecting the flushing efficiency indicators were rigorously investigated in this study, which helped to highlight the framework in which both the operation and storage capacity of the reservoir can be maintained and potentially even improved.
While the results from this study have identified multiple factors that affect flushing efficiency, it is important to also consider the operational changes that managers of Agongdian Reservoir can actually enact and enforce, which potentially include altering the reservoir geometry and following operation rules more stringently. For example, by adjusting the reservoir geometry and operation rules, the discharge, especially during the flushing period, and the flushing efficiency can thereby be increased. Although, the flushing discharge itself may be limited by factors such as the natural inflows during the flushing season, outlet capacity, and downstream channel capacity [6], the goals of achieving an increased flushing discharge and greater flushing efficiency can be obtained, especially when managers of the reservoir operate on the principle of a low water surface level and a high discharge [11].

4.2. Reservoir Compartmentation

The sediment flushing practices of reservoirs around the world have highlighted the importance of a reservoir having a gorge-shaped geometry, which can help provide conditions conducive to a higher flushing efficiency and less sediment accumulation, and ultimately help maintain the capacity of a reservoir. For instance, Gebidem Reservoir in Switzerland has been emptied for two to four days annually between May and July since 1982. Because of its narrow gorge-type geometry and annual flushing policy, there is virtually no sediment accumulation [6]. Similarly, Tapu Reservoir, which is located in the Hsinchu region of northern Taiwan, experiences almost equal amounts of sediment influx and outflow. Even though Tapu Reservoir was built in 1960, its average annual sediment inflow of 136 × 103 m3 is almost equal to its average annual sediment sluicing [36]. With nearly equal amounts of sediment influx and outflow, the reservoir is sustainable because it is able to maintain its initial intended storage capacity of 9.26 Mm3 [36]. The success of such maintained sediment flushing is attributed to the reservoir’s gorge-shaped reservoir geometry [37].
Although the importance of the geometry of reservoirs throughout the world has been noted for successful sediment flushing, the study site of this paper at Agongdian Reservoir is not as optimally shaped. Agongdian Reservoir has a wide, short, and shallow configuration, not optimal for sediment flushing. The two rivers feeding Agongdian Reservoir, the Wanglai and Zhuoshui Rivers, have their inlets on opposite sides from each other. As Chen and Tsai [26] discussed, the higher slope of the Zhuoshui River could lead to a higher inflow velocity as well as the formation of an erosion channel at its inlet. However, this erosion channel would soon get lost in the reservoir and ultimately deposition would occur because the current configuration of the reservoir does not support factors conducive for a successful, continuous flushing channel.
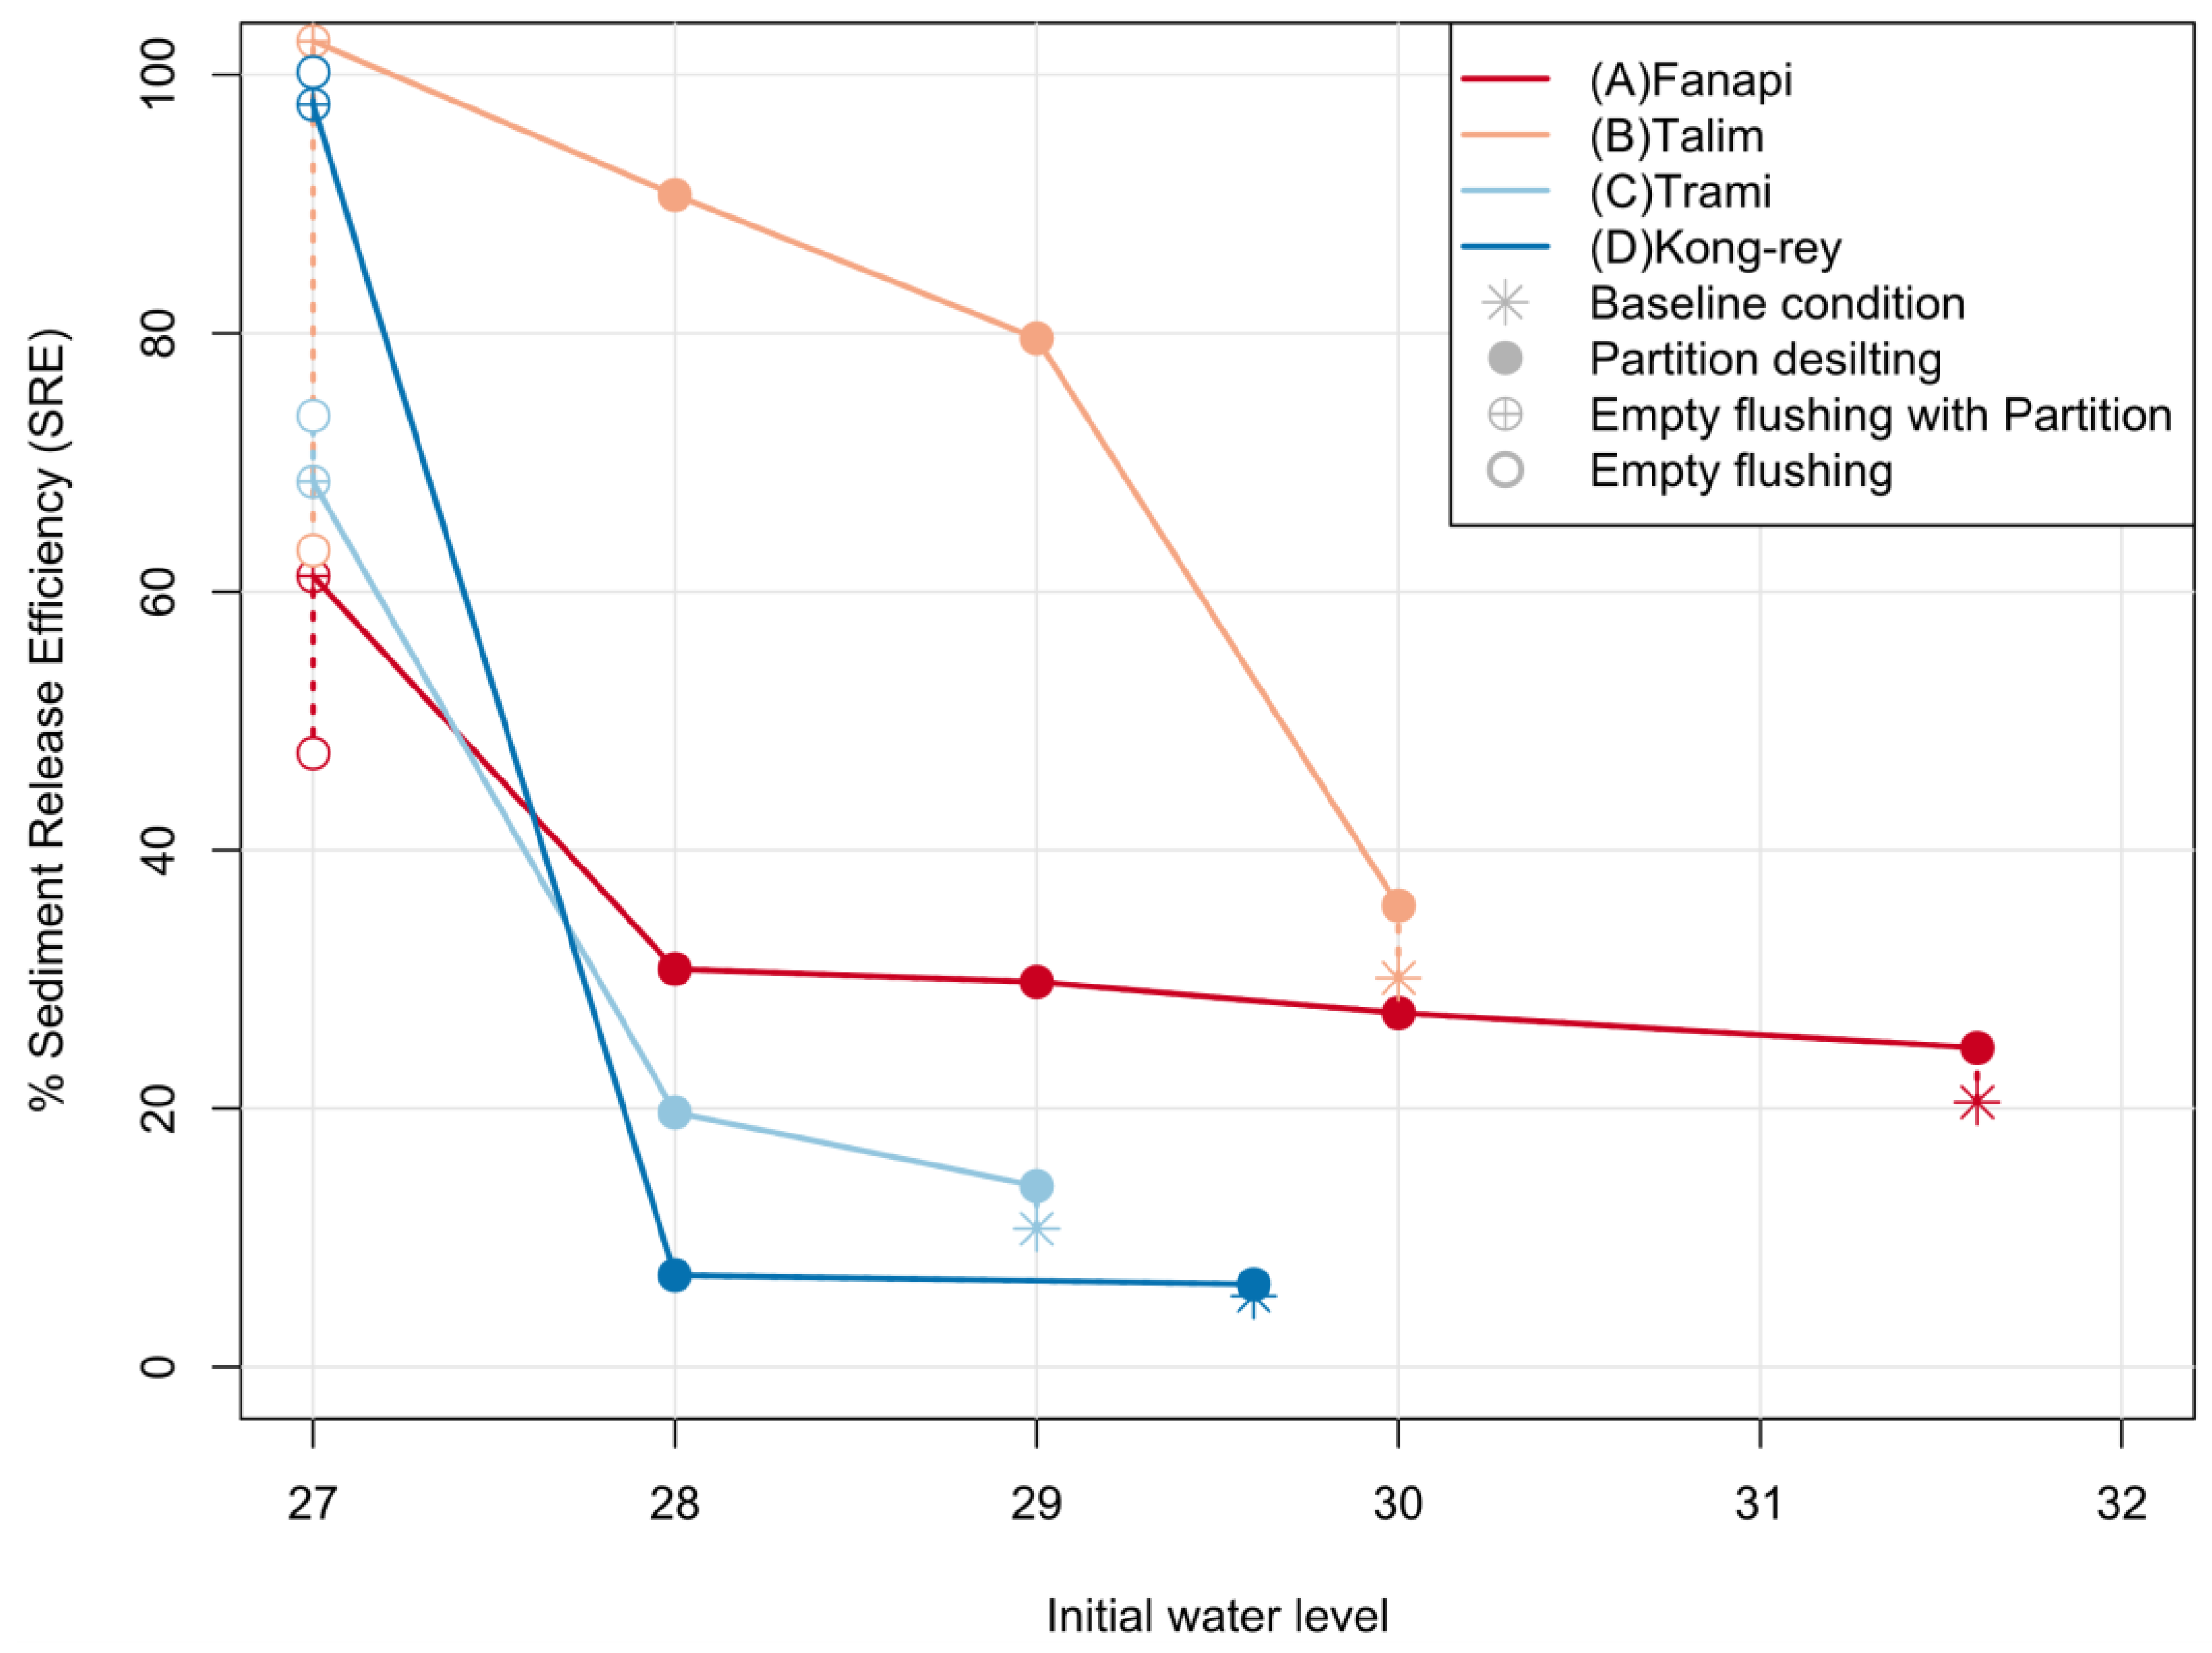
The numerical modeling of four different flushing scenarios performed in this study involved trying to divide the total storage volume into two compartments to create a gorge-shaped reservoir, especially at the Zhoushui River, where there is a higher sediment inflow at the southern inlet. The four scenarios utilized in this study included baseline conditions, partition desilting at varying initial water levels, empty flushing with partitioning, and empty flushing without partitioning. To better understand the effect of the SRE for each scenario, the SRE rates for all drawdown strategies were plotted (Figure 10).
In general, the partition desilting scenarios showed an overall trend of a slowly increasing SRE value as the initial water level decreases. The simulated SRE rate for the baseline scenario of Typhoon Fanapi (drawdown strategy A1), for example, was calculated to be approximately 21%, with initial water level being at 31.6 m. When the initial water level conditions remain the same as the baseline conditions at 31.6 m but the reservoir instead is divided into two compartments (drawdown strategy A2), the SRE value increased to about 25%. If the initial water surface level is then lowered to 30.0 m (drawdown strategy A3), and follows similar partition desilting compartmentalization to drawdown strategy A2, the SRE is increased further to about 27%. Other simulated scenarios showed a relatively similar trend, that is, as the initial water surface level decreased, the SRE slowly increased in value, which is depicted as a slow gradual slope for drawdown strategies A3, A4, and A5 (in Figure 10). Results for the other three simulated typhoon events, i.e., Typhoons Talim, Trami and Kongrey (drawdown strategies B1, C1, and D1, respectively), followed a similar trend, where there were gradual increases in the SRE rates as the initial water level decreased (Figure 10).
In contrast to this gradual increase, there are sudden increases in the SRE rates for empty flushing—regardless of whether or not partition desilting takes place. For example, the SRE rates for Typhoons Fanapi and Talim in scenarios involving empty flushing with partitioning showed higher values (drawdown strategies A6 and B5) than compared to empty flushing only (drawdown strategies A7 and B6), as depicted by the sudden decreases in SRE values (i.e., red and orange dashed lines) in Figure 10. On the other hand, the SRE rates for Typhoons Trami and Kongrey in scenarios that involved empty flushing only (drawdown strategies C5 and D5) instead showed slightly higher values than compared to empty flushing with partitioning (drawdown strategies C4 and D4), as depicted by small jumps in the SRE values (i.e., light and dark blue dashed lines) in Figure 10. Note that there were two scenarios where the SRE rates surpassed 100%. The SRE for the scenario involving empty flushing with partitioning for Typhoon Talim (drawdown strategy B5) reached a value of 102.6%, while the SRE for the scenario involving empty flushing only for Typhoon Kongrey (drawdown strategy D5) reached a value of 100.2% (Figure 10). With the preferred conditions, both the sediment from the inflow and sediment deposited within the reservoir can in fact be flushed and leave the reservoir in the form of sediment outflow, thereby producing dramatic SRE rates.
Our findings in partition desilting scenarios showed a general trend of SRE values increasing as the initial water level decreases. Compartmentalization spurs increased peak concentrations (Figure 7) and an improved velocity of these increased peak concentrations throughout the reservoir (Figure 8). Thus, the results from these simulations clearly suggest that reservoir compartmentalization can substantially increase SRE rates and provide conditions helpful to sustaining reservoir capacity.

4.3. Reservoir Policy Implications

Currently, managers are sometimes operating reservoirs based on past experiences as well as multiple and sometimes conflicting goals. To better implement sustainable reservoir management, Wang et al. [16] identified social, technical, and economic barriers that reservoir managers in Taiwan are experiencing at the present time and must address. For Agongdain Reservoir, a social barrier exists because current flushing operations are in direct conflict with pressures from tourism to maintain a scenic, picturesque water landscape. As a result, this has led managers to decide against completely emptying the reservoir and instead maintaining the water surface level at a minimum of 30 m when there is no typhoon event during the flushing period [16]. In addition to this, there are two technical issues: first, because of the potential flood hazard to the downstream reach, managers are currently limiting the outlet discharge to 35 cms; second, there is a concern for the loss of water supply associated with flushing operations. From our simulations, the lower the initial reservoir level scenario was, the fewer times the water level was found below 30 m. In addition, the empty flushing scenarios, for instance A6 and A7, would have twice the time, as the flood discharge exceeded the maximum outlet discharge compared to the other scenarios. These findings suggest that managers should be made fully aware of all the conflicting issues and possible solutions.
The current regulations of the reservoir state that the sluicing spillway is to be kept open during the rainy season (1st June to 10th September), and then closed to impound water for the dry season (11th September to 31th May). Based on these regulated dates for drawdown flushing presently in effect, the average SRE of Agongdian Reservoir was calculated to be 32.6% in this study (Figure 5), which is much lower than the WRA’s assessed value of 65.3% [24]. The drastic decrease in the SRE value is mainly attributed to an incomplete drawdown and the reservoir outlet not being fully opened. For example, because of the specific time at which Typhoon Kongrey occurred, starting in late August and lasting until early September 2013 (Table 2), which is at the tail end of the regulated flushing period, managers were suddenly concerned about water storage. As Typhoon Kongrey occurred, the initial water level was only at 29.6 m, an expected and reasonable value during the flushing period (Table 2). However, managers did not follow the regulations to open the gates to the maximum full capacity of 100 cms; instead, the gates were opened only to 35 cms, resulting in a relatively high average water level during Typhoon Kongrey at 32.9 m (Table 2).
Based on these observed data during the typhoon event, the SFE and SRE were calculated at relatively low values of 0.08% and 13%, respectively (Table 2). As water was impounded with a lowered outflow discharge, both the velocity and sediment peak concentrations decreased. Even when partition desilting scenarios occurred at a lower initial water levels of 28.0 m (i.e., drawdown strategies D3) as shown in our simulations, the SRE values barely increased from 5.5% at the baseline condition (drawdown strategy D1) to 7.1% (as denoted by the nearly flat solid dark blue line in Figure 10). Our findings highlight that the barriers mentioned above must be addressed by at least having stringent compliance with current reservoir regulations before managers can potentially implement sustainable policies.
Beyond the current baseline conditions, findings from this study further suggest that strategies—such as compartmentalization, empty flushing, or a combination of the two—can improve the flushing efficiency and help sustain the continued long-term use of Agongdian Reservoir. Managers should be made aware of the possible construction options available, and must consider the economic issue of the costs incurred during the construction of new facilities, such as those involved with compartmentalization and partition desilting scenarios. Findings in this study show that partition desilting, especially with lower initial water levels, provides increases in the SRE rates. In addition to this, another less costly alternative for managers to consider are drawdown strategies involving empty flushing, where partition desilting may or may not be incorporated.
Based on the syntheses of the findings from the observed and simulated data in this study, the following recommendations are made. First, for implementation in the near future, managers should be made fully aware of all the conflicting issues and possible solutions. The social, technical, and economic issues have been analyzed and can be dealt with by means other than altering the reservoir operation regulations. Short-term strategies for the improvement of the SRE rates include: more rigorous adherence to the reservoir regulations currently in effect, and making the public aware of the necessity of a muddy reservoir during a low flow or empty flushing (i.e., unappealing views and landscape). Another recommended guideline includes creating a narrower gorge-like geometry by way of partitioning. As managers may be concerned to store and impound water for water resources for the upcoming dry season, potentially modifying the duration of the flushing period and the outflow discharge in the future may be considered. It is recommended that the operation protocol that is currently in effect should be reviewed for optimal operation based on valuable, observed, continuous, long-term data. In doing so, the application of relevant results found in this study can more easily be identified and determined. Thus, an outline of viable and useful improvements can be suggested for implementation.

5. Conclusions

Water storage and the maintained reservoir capacity are crucial to help supply the domestic, industrial and agricultural demands of Taiwan, especially due to its long dry season and highly seasonal precipitation pattern. This study examined and determined factors that influence the flushing efficiency of Agongdian Reservoir, a reservoir located in southern Taiwan. These factors were based on in-depth analyses of field data from 18 typhoon events spanning from 2010 to 2015, which were recorded and observed by the WRA. Of these 18 typhoon events, four of these events were selected and more thoroughly analyzed for simulation modeling based on the SRH-2D numerical model.
Results in this study reveal the following major findings:
(1)
Long-term observed monitoring data was valuable in identifying factors highly related to flushing efficiency, which included the initial water level, average water level, and average velocity.
(2)
Compartmentalization of the reservoir is a proposed strategy that has demonstrated high levels of improvement in flushing efficiency in this study, depending on the particular scenario involving partition desilting, empty flushing, or a combination of both.
(3)
Recommendations to increase flushing efficiency include: lowering the initial water level, creating narrower gorge-like geometry by partitioning, and considering to modify the operation rules (i.e., duration of the flushing period, outflow discharge, etc.)
(4)
Experiences of practicing drawdown flushing should be documented more frequently to help inform existing and future practices.
(5)
Many types of barriers exist in practicing sustainable reservoir management, including social, technical, and economic issues. More scientifically-documented experiences, such as the findings in this study, ought to be accumulated.
Issues not discussed in the study but in need of investigation include: (1) understanding how the formation and evolution of flushing channels in a reservoir can influence flushing efficiency; (2) using long-term data, especially more time-sensitive hourly data, for suggesting future improvements of the operation rules.

Author Contributions

Investigation, B.-S.T.; Methodology, B.-S.T.; Project administration, H.-W.W.; Software, B.-S.T.; Supervision, H.-W.W.; Visualization, G.-W.C.; Writing—original draft, W.-C.K.; Writing—review and editing, C.H. and G.-W.C. All authors have read and agreed to the published version of the manuscript.

Funding

This research received no external funding.

Conflicts of Interest

The authors declare no conflict of interest.

References

  1. Harada, M. Operational results and effects of sediment bypass system. In Proceedings of the 20th ICOLD Conference, Beijing, China, 19–22 September 2000. [Google Scholar]
  2. Kondolf, G.M.; Gao, Y.; Annandale, G.W.; Morris, G.L.; Jiang, E.; Zhang, J.; Cao, Y.; Carling, P.; Fu, K.; Guo, Q.; et al. Sustainable sediment management in reservoirs and regulated rivers: Experiences from five continents. Earth’s Future 2014, 2, 256–280. [Google Scholar] [CrossRef]
  3. Basson, G. Hydraulic measures to deal with reservoir sedimentation: Flood flushing, sluicing and density current venting. In Proceedings of the 3rd International Conference on River Flood Hydraulics, Stellenbosch, South Africa, 5–7 November 1997. [Google Scholar]
  4. Palmieri, A.; Shah, F.; Annandale, G.; Dinar, A. Reservoir Conservation—Economic and Engineering Evaluation of Alternative Strategies for Managing Sedimentation in Storage Reservoirs: The RESCON Approach; World Bank: Washington, DC, USA, 2003; Volume 1. [Google Scholar]
  5. White, R. Evacuation of Sediments from Reservoirs; Thomas Telford: London, UK, 2001. [Google Scholar]
  6. Morris, G.L.; Fan, J.X. Reservoir Sedimentation Handbook: Design and Management of Dams, Reservoirs, and Watersheds for Sustainable Use; McGraw Hill Professional: New York, NY, USA, 1998. [Google Scholar]
  7. Kawashima, S.; Johndrow, T.B.; Annandale, G.W.; Shah, F. Reservoir Conservation—Economic and Engineering Evaluation of Alternative Strategies for Managing Sedimentation in Storage Reservoirs: RESCON Model and User Manual; World Bank: Washington, DC, USA, 2003; Volume 2. [Google Scholar]
  8. Sumi, T. Evalutation of Efficienca of Reservoir Sediment Flushing in Kurobe River. In Proceedings of the 4th International Conference on Scour and Erosion (ICSE-4), Tokyo, Japan, 5–7 November 2008. [Google Scholar]
  9. Atkinson, E. The Feasibility of Flushing Sediment from Reservoirs; Hydraulics Research: Wallingford, UK, 1996. [Google Scholar]
  10. Scheuerlein, H. Sediment Sluicing in Mountain Reservoirs. In Fluvial Hydraulics of Mountain Regions; Springer Berlin Heidelberg: Heidelberg, Germany, 1991; pp. 223–234. [Google Scholar]
  11. Brown, C.B. The Control of Reservoir Silting; United States Department of Agriculture, Miscellaneous Publication No. 521: Washington, DC, USA, 1944; p. 166.
  12. Kantoush, S.; Sumi, T.; Suzuki, T.; Murasaki, M. Impacts of sediment flushing on channel evolution and morphological processes: Case study of the Kurobe River, Japan. In Proceedings of the 5th River Flow Conference, Braunschweig, Germany, 8–10 June 2010. [Google Scholar]
  13. IRTCES. Lecture Notes of the Training Course on Reservoir Sedimentation; Tsinghua University: Beijing, China, 1985. [Google Scholar]
  14. Lai, J.-S.; Shen, H.W. Flushing sediment through reservoirs. J. Hydraul. Res. 1996, 34, 237–255. [Google Scholar] [CrossRef]
  15. Muhammad, A.; Habib, U. Worldwide Experience of Sediment Flushing Through Reservoirs. J. Eng. Technol. Mehran Univ. Res. 2012, 31, 395–408. [Google Scholar]
  16. Wang, H.-W.; Kondolf, M.; Tullos, D.; Kuo, W.C. Sediment management in Taiwan’s reservoirs and barriers to implementation. Water 2018, 10, 1034. [Google Scholar] [CrossRef] [Green Version]
  17. WRA. Effect Assessment of Empty Storage Operation for Sediment Prevention and Sand Observation Program of Agoden Reservoir in 2009; Southern Region Water Resources Office: Tainan, Taiwan, 2009.
  18. WRA. Effect Assessment of Empty Storage Operation for Sediment Prevention Observation Program of Agoden Reservoir in 2010; Southern Region Water Resources Office: Tainan, Taiwan, 2010.
  19. WRA. Effect Assessment of Empty Storage Operation for Sediment Prevention Observation Program of Agoden Reservoir in 2011; Southern Region Water Resources Office: Tainan, Taiwan, 2011.
  20. WRA. Sediment Observation and Efficiency Evaluation for desiltation of Agongdian Reservoir by using empty flushing in 2012; Southern Region Water Resources Office: Tainan, Taiwan, 2012.
  21. WRA. Sediment Observation and Efficiency Evaluation for Desiltation of Agongdian Reservoir by Using Empty Flushing in 2013; Southern Region Water Resources Office: Tainan, Taiwan, 2013.
  22. WRA. Sediment Observation and Efficiency Evaluation for Desiltation of Agongdian Reservoir by Using Empty Flushing in 2014; Southern Region Water Resources Office: Tainan, Taiwan, 2014.
  23. WRA. Sediment Observation and Efficiency Evaluation for Desiltation of Agongdian Reservoir by Using Empty Flushing in 2015; Southern Region Water Resources Office: Tainan, Taiwan, 2015.
  24. WRA. Hydraulic Model Studies on the Functions and Operations of Silting Prevention in A-Kung-Tien Reservoir—Final Report; Water Resources Planning Institute: Taichung, Taiwan, 2003.
  25. Lee, D.-H.; Chen, P.Y.; Wu, J.H.; Chen, H.L.; Yang, Y.E. Method of mitigating the surface erosion of a high-gradient mudstone slope in southwest Taiwan. Bull. Eng. Geol. Environ. 2013, 72, 533–545. [Google Scholar] [CrossRef]
  26. Chen, C.-N.; Tsai, C.-H. Estimating Sediment Flushing Efficiency of a Shaft Spillway Pipe and Bed Evolution in a Reservoir. Water 2017, 9, 924. [Google Scholar] [CrossRef] [Green Version]
  27. WRA. Directions on Agondian Reservoir Operation; Southern Region Water Resources Office: Tainan, Taiwan, 2011.
  28. CWB. Central Weather Bureau. Available online: https://www.cwb.gov.tw/V7/index.htm (accessed on 15 October 2016).
  29. Lai, Y. SRH-2D Version 2: Theory and User’s Manual, Sedimentation and River Hydraulics–Two-dimensional River Flow Modeling; US Department of the Interior, Bureau of Reclamation, Technical Service Center: Denver, CO, USA, 2008.
  30. Lai, Y.G. Numerical Model Development for River and Reservoir Applications—2014 Progress; Reclamation: Denver, CO, USA, 2014. [Google Scholar]
  31. Lai, J.-S.; Lee, F.Z.; Wu, C.H.; Tan, Y.C.; Sumi, T. Sediment Bypass Tunnels of the Shihmen Reservoir in Taiwan. In First International Workshop on Sediment Bypass Tunnels; VAW-Mitteilung 232 (Boes R M, ed.); Laboratory of Hydraulics, Hydrology and Glaciology (VAW): ETH Zurich, Switzerland, 2015. [Google Scholar]
  32. Lai, Y.G. Channel Morphology Prediction with and without a Temporary Channel Upstream of the Elephant Butte Reservoir. In Proceedings of the World Environmental and Water Resources Congress: Crossing Boundaries, Albuquerque, New Mexico, 20–24 May 2012. [Google Scholar]
  33. Te Chow, V. Open Channel Hydraulics; McGraw-Hill Book Company, Inc.: New York, NY, USA, 1959. [Google Scholar]
  34. Lewis, C.D. Industrial and Business Forecasting Methods: A Practical Guide to Exponential Smoothing and Curve Fitting; Butterworth-Heinemann: London, UK, 1982. [Google Scholar]
  35. Engelund, F.; Hansen, E. A Monograph on Sediment Transport in Alluvial Streams; Technical University of Denmark: Copenhagen, Denmark, 1967. [Google Scholar]
  36. WRA. The Rehabilitation Plan of Ta-Pu Reservoir; Northern Region Water Resources Office: Taoyuan, Taiwan, 2009.
  37. Chang, F.J.; Lai, J.S.; Kao, L.S. Optimization of operation rule curves and flushing schedule in a reservoir. Hydrol. Process. 2003, 17, 1623–1640. [Google Scholar] [CrossRef]
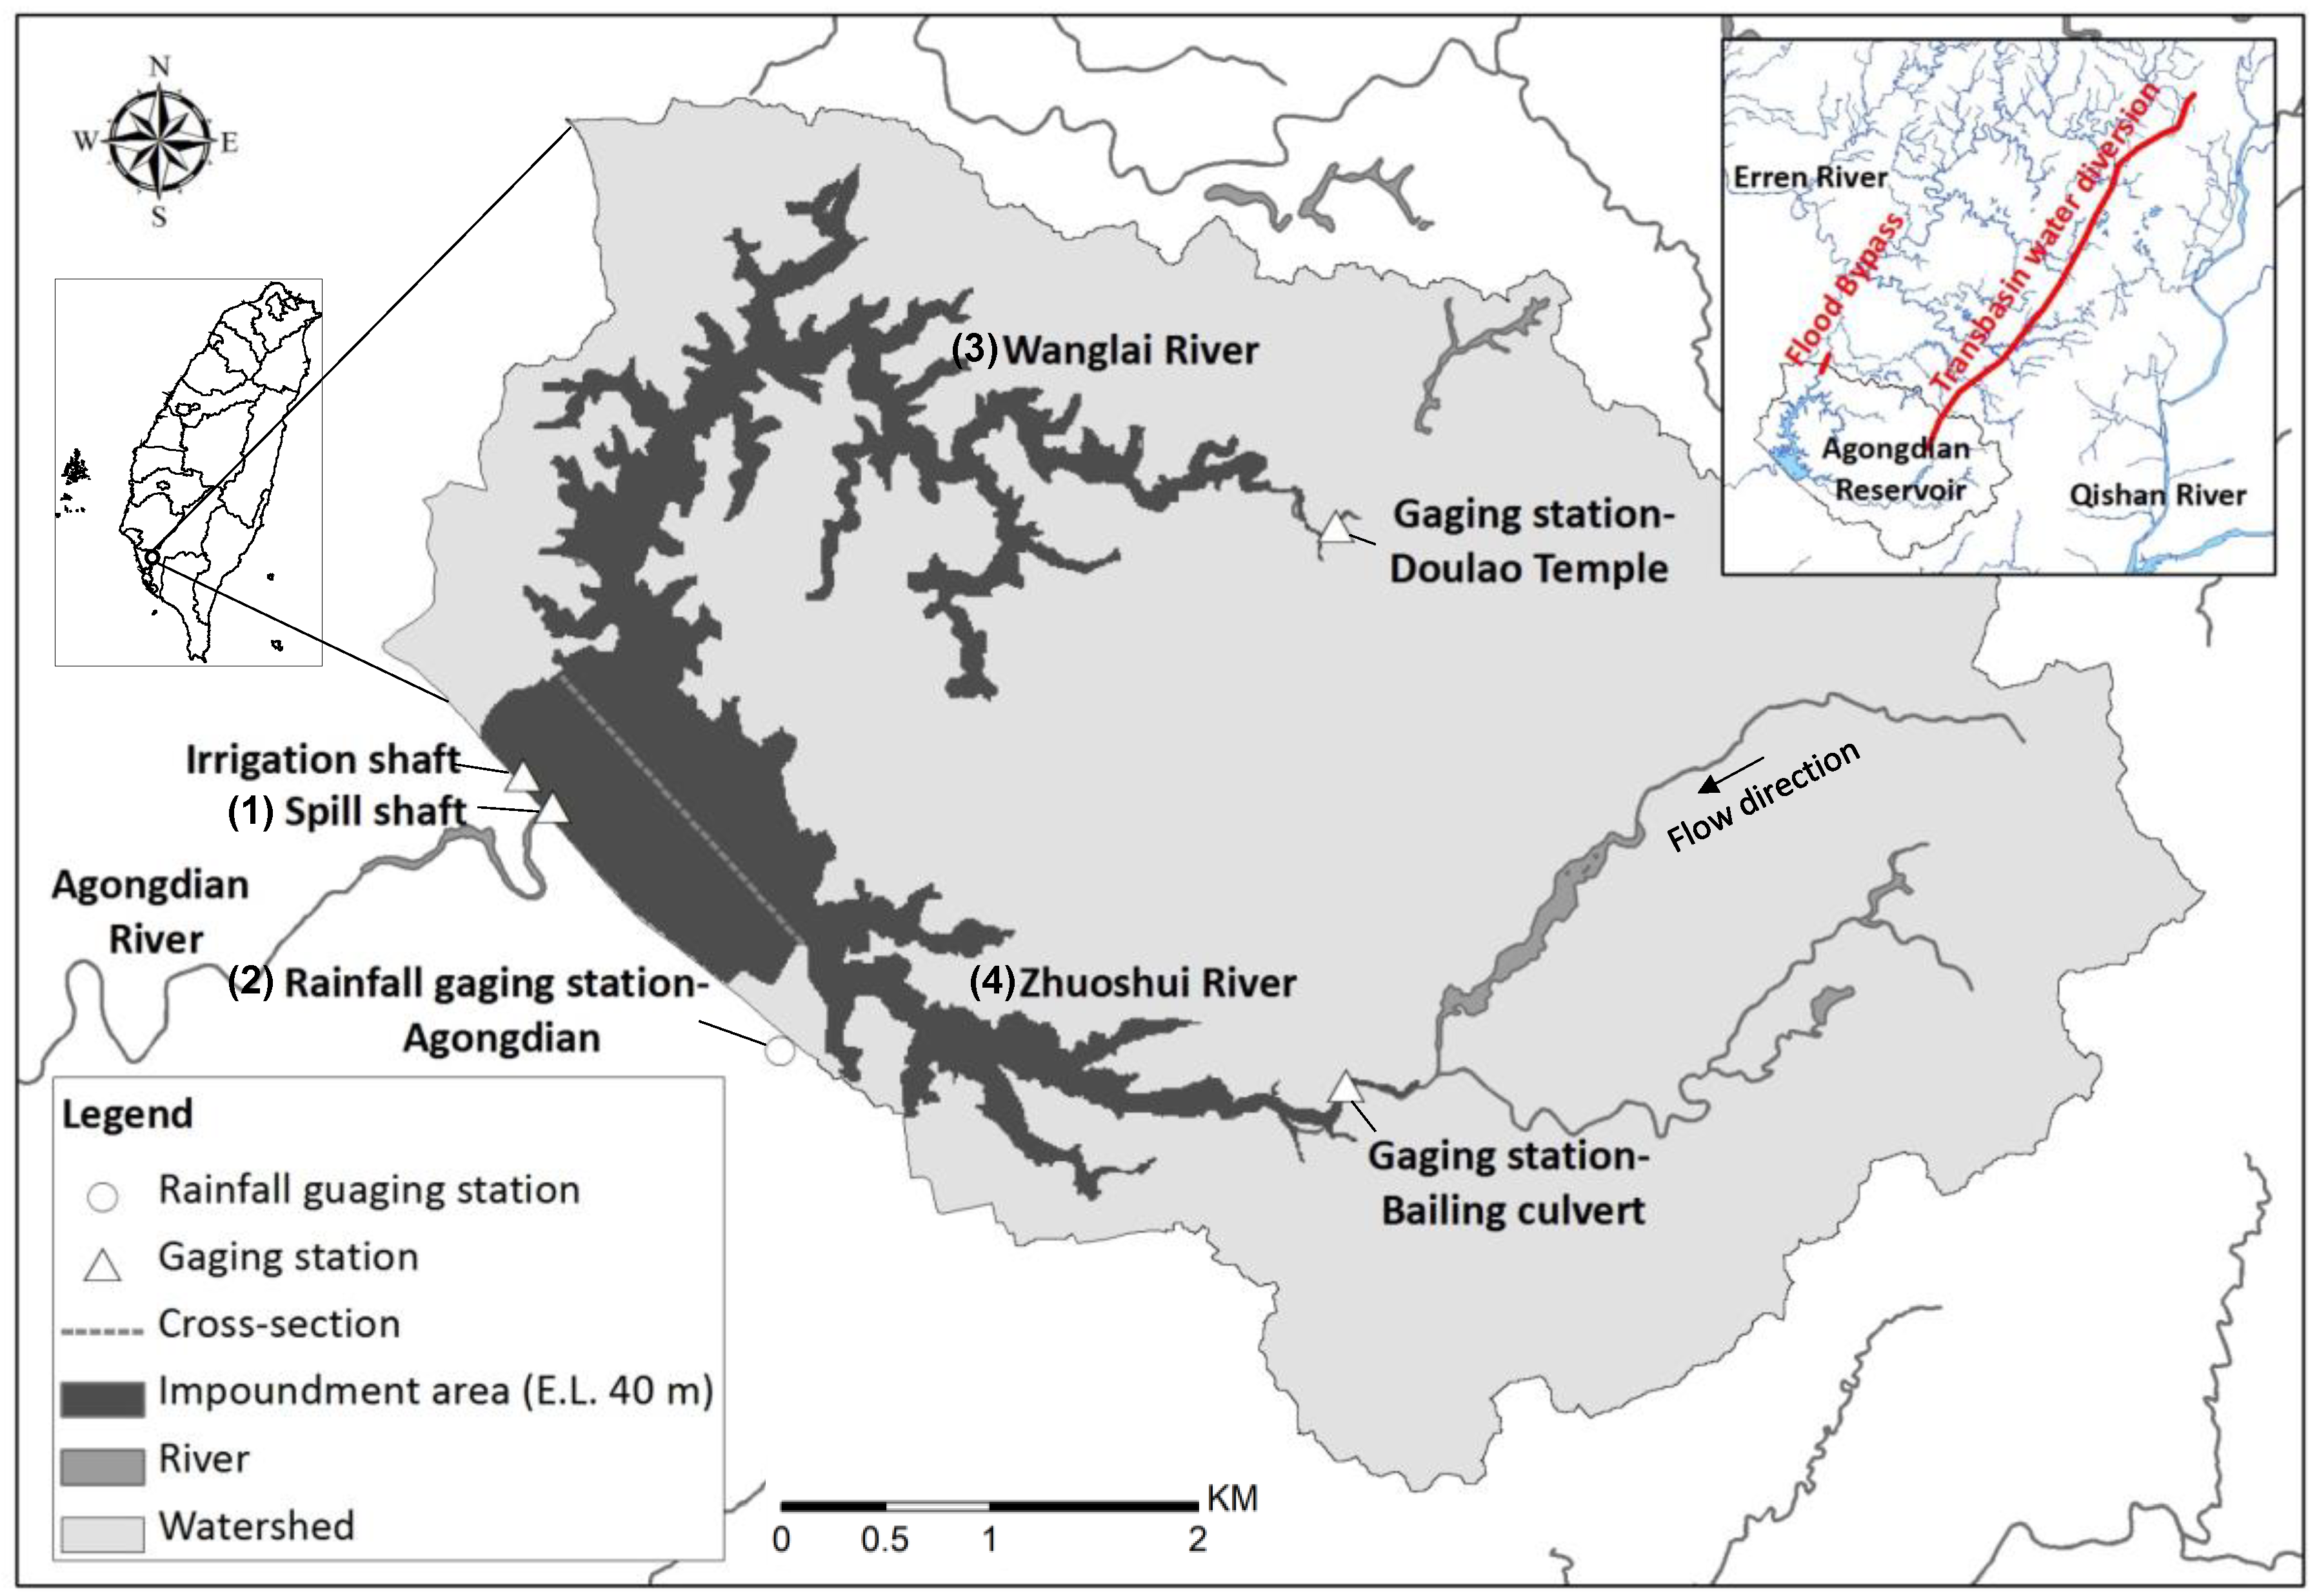
Figure 1. Aerial view of the Agongdian Reservoir watershed, southern Taiwan, includes: the (1) spill shaft within the reservoir; (2) rainfall gauging station; (3) Wanglai River (tributary) with a gauging station located at its headwaters near Doulao Temple; (4) Zhuoshui River (triburary) with a gauging station located at Bailing Culvert.
Water 12 02166 g001
Figure 2. Reservoir sedimentation and removal over time. Note, the sediment extraction began in the 2010s.
Water 12 02166 g002
Figure 3. Hydrograph of (a) the water surface level of the Agongdian watershed and rainfall intensity; (b) the discharge; (c) the sediment concentration of the inflow from Doulou and Bailing gauging stations and the outflow from Agongdian Reservoir. Doulou and Bailing stations represent Wanglai (north) and Zhuoshui (south) tributaries of Agongdian Reservoir.
Water 12 02166 g003
Figure 4. Amounts of the sediment inflow and outflow for the 18 observed rain events. Data provided by Taiwan’s Water Resources Agency.
Water 12 02166 g004
Figure 5. Coefficient of determination for the sediment release efficiency (SRE) to both the sediment flushing efficiency (SFE) and sediment outflow.
Water 12 02166 g005
Figure 6. Coefficients of determination, r2, for variables describing the reservoir, rainfall, and inflow/outflow conditions.
Water 12 02166 g006
Figure 7. Different outflow sediment concentrations for each typhoon event based on the different drawdown strategies.
Water 12 02166 g007
Figure 8. Example of the distribution of sediment concentration over time based on different drawdown strategies, including partition desilting, for Typhoon Fanapi of (a) drawdown strategy A1 after 3 hours; (b) drawdown strategy A1 after 12 hours; (c) drawdown strategy A2 after 3 hours; (d) drawdown strategy A2 after 12 hours; (e) drawdown strategy A5 after 3 hours; (f) drawdown strategy A5 after 12 hours;
Water 12 02166 g008aWater 12 02166 g008b
Figure 9. Different velocities based on numerical simulations using baseline conditions (A1) of Typhoon Fanapi compared to different types of scenarios, including partition desilting with the initial water level at 31 m (A2) and at 28 m (A5).
Water 12 02166 g009
Figure 10. Differences in sediment release efficiency (SRE) based on different drawdown water level strategies for four typhoon events.
Water 12 02166 g010
Table 1. Scenario designs based on the four selected typhoon events and their initial water levels.
Scenario (Target Level of Drawdown Water Surface)Typhoon Event
Fanapi TalimTramiKongrey
Baseline conditionA1 (31.6 m)B1 (30.0 m)C1 (29.0 m)D1 (29.6 m)
Partition desilting (31 m)A2 (31.6 m)
Partition desilting (30 m)A3 (30.0 m)B2 (30.0 m)
Partition desilting (29 m)A4 (29.0 m)B3 (29.0 m)C2 (29.0 m)D2 (29.6 m)
Partition desilting (28 m)A5 (28.0 m)B4 (28.0 m)C3 (28.0 m)D3 (28.0 m)
Empty flushing with Partition (27 m)A6 (27.0 m)B5 (27.0 m)C4 (27.0 m)D4 (27.0 m)
Empty flushing only (27 m)A7 (27.0 m)B6 (27.0 m)C5 (27.0 m)D5 (27.0 m)
Table 2. Characteristics of the four selected typhoon events used for the simulation.
Typhoon Event
FanapiTalimTramiKong-Rey
Period19 September 2010 11:00–21 September 2010 07:0018 June 2012 21:00–24 June 2012 01:0021 August 2013 18:00–25 August 2013 19:0028 August 2013 11:00–09 March 2013 07:00
Initial water level (m)31.6 30.3 29.4 29.6
Average water level (m)36.1 29.2 29.9 32.9
Max 24-h rainfall (mm)569 188 135 327
Duration of effective rainfall (h)27 123 96 97
Accumulated rainfall (mm)589 380 198 556
Water inflow (M m3)3.10 8.49 4.57 12.86
Sediment inflow (M m3)873.38 269.11 178.22 560.27
Water outflow (M m3)10.47 10.58 4.34 9.79
Sediment outflow (M m3)131.88 188.83 83.22 74.96
Average discharge release (m3/s)64.63 23.52 12.29 19.28
Average velocity (m/s)0.00540.1940.00480.0027
Sediment concentration of inflow 0.0281 0.0032 0.0039 0.0044
Sediment flushing efficiency (%)0.130.180.190.08
Sediment release efficiency (%)15704713
Table 3. Sediment release efficiency rates of each reservoir drawdown strategy. Note, A1, B1, C1, and D1 are observed values, while all other drawdown strategies are the results of numerical modeling.
Drawdown StrategySediment Inflow (103 m3)Initial Water Surface Level (m)Sediment Outflow (103 m3)Sediment Release Efficiency (%)Percentage of Improvement (%)
A187.331.617.920.5-
A231.621.624.721
A33023.927.434
A4292629.845
A52826.930.850
A62753.461.2198
A72741.547.5132
B126.9308.130.1-
B2309.635.719
B32921.479.6164
B42824.490.7201
B52727.6102.6241
B6271763.2110
C117.8291.910.7-
C2292.514.032
C3283.519.784
C42712.268.5542
C52713.173.6589
D156.129.63.15.5-
D229.63.66.416
D32847.129
D42754.897.71668
D52756.2100.21713