Article

Effect of Solar Canals on Evaporation, Water Quality, and Power Production: An Optimization Study

Civil and Infrastructure Engineering Program, Faculty of Engineering, Nile University, Giza 12677, Egypt
*
Author to whom correspondence should be addressed.
Water 2020, 12(8), 2103; https://doi.org/10.3390/w12082103
Submission received: 28 June 2020 / Revised: 18 July 2020 / Accepted: 22 July 2020 / Published: 24 July 2020

Abstract

:
Both energy and availability of water with good quality are essential for the well-being of humans. Thus, it is very important to study the parameters that would affect water quality, so as to come up with mitigation measures if water quality would be at risk or negatively affected. Moreover, it is very important to always search for new energy resources, especially if they are renewable. This research study is concerned with studying solar canals and their effect on evaporation and water quality variables of canals covered by solar cells, as well as the effect on power production. Both a mathematical model and an optimization study were done, in order to determine the previously mentioned effects, and thus, to determine the most favorable covering percentage of the case study canal’s area that would lead to minimum evaporation volumes, maximum power, and yet preserving and meeting the standards of the water quality variables of the covered waterway. Water quality variables that were investigated are dissolved oxygen concentration, algae, nutrients, and pH of the water. It was found that, between 33% and 50% covering of the canal, the optimum conditions will be met.

1. Introduction

Water and energy are the lead of the development of any nation. Therefore, the population increase and economic development that the world has witnessed recently caused an increase in the water and energy demands, which could lead to a global water and energy crisis. On the other hand, the depletion of non-renewable sources of energy and the increase in the CO2 emissions encourage the demand on finding renewable and clean sources of energy. As Egypt is one of the fastest population-growing countries, the energy demand increases rapidly to reach 2.6% annually according to the International Energy Agency (IEA) [1]. This increase in the energy demand, in addition to the depletion in the non-renewable resources of energy, gave strong signs that other renewable resources should be found in order to satisfy the increase in demand. As a result, photovoltaic solar energy became the most reliable solution, due to the good climate conditions of Egypt that allow long duration of sunshine during the day [2]. On the other hand, recent reports showed that Egypt is facing a serious water scarcity. The U.N. World Water Development report for 2018 indicated that the country is currently below the U.N.’s threshold of water poverty, facing water scarcity and dramatically heading towards absolute water scarcity [3]. These challenges that the Egyptian society is facing open the doors for creative contributions for decreasing the serious results of these two crises. One of these solutions is solar canals.
Solar canals are photovoltaic (PV) solar energy generating systems based on covering the top of water bodies, namely water canals with PV panels. Unlike land-based PV systems, this PV system does not occupy large land areas, which will save on land for the high demand of the increase of population in Egypt. Moreover, covering the top of the water canals with PV solar panels reduces the sun radiation that, when present, leads to decreasing the evaporation loss [4]. In addition, installing PV panels on water bodies increases the efficiency of the PV system, due to the cooling effect of the evaporated water [5].
Solar canals or floating photovoltaic (FPV) were applied for the first time in 2007 in Aichi, Japan, for research purposes with a capacity of 20 kW, then the implementations of this system spread in several countries like USA, Italy, Spain, South Korea, and China [6]. In the Gujarat region, in India, there are two solar canal photovoltaic power plants in service nowadays. The first one was constructed over a water body length of 750 m with a capacity of 1 MW and the other one was constructed over a water body length of 3.5 km with a capacity of 10 MW [7]. All these implementations were combined with many researches that studied the efficiency of this system and its effect on the surrounding environment. According to Tina et al., 2018, covering only 1% of the natural water surfaces bodies on the world with photovoltaic panels can provide around 25% of the global demand of electricity [8]. In 2013, covering irrigation reservoirs with photovoltaic panels to decrease evaporation and generate electricity was applied at the University of Valencia and showed promising results [9]. In addition, the idea was implemented in a large scale, with the purpose of reducing evaporation in California and Spain with capacities of 175 kW and 24 kW, respectively [6]. In his study, Santafé et al., 2014, studied covering a whole agricultural reservoir with 4490 m2 of photovoltaic panels and the results showed that the covering could save around 25% of the reservoir’s storage (5000 m3 of water) [10]. Despite all of these studies and implementations, solar canals are considered as a newborn idea that needs to be studied more from the environmental point of view, especially the effect of covering water bodies or irrigation canal on the quality of water.
Despite all the above-mentioned advantages of covering water bodies, this approach could greatly affect the quality of water in both a negative and a positive way. Although some researches were done to study solar canals from different perspectives, no research was done before to study the effect of solar canals on water quality, and hence, to optimize the covering area of canals in order to obtain best acceptable—within standard range—water quality parameters and at the same time get the least evaporation and the most power production out of the solar canal. Therefore, this research will be addressing this issue for the first time.
Although the drawn recommendations and general results of this research are general for any canal in the world, to get the exact simulated results and numbers, each canal case study has to be simulated alone to see the exact % covering of it. Thus, the simulating technique is the same for any canal, but the numbers are going to be different from one canal to the other, depending on the size of the canal and its hydrologic and hydraulics conditions. A case study in this research was conducted on covering the Sheikh Zayed canal in Egypt, which is an irrigation canal, with PV panels, in order to reduce evaporation and generate electricity. A new approach of this research study is to examine and simulate the effect of covering on the water quality parameters of the studied canal. This research aim is to do an optimization between water quality parameters’ standards, power production, and evaporation volumes, with the aim to minimize evaporation as much as possible and at the same time maximize power production and yet conserve or meet the water quality standards of the covered water, for it not to be harmed.

2. Site Description

The study is conducted on Sheikh Zayed irrigation canal. The canal’s inlet is at Lake Nasser in Upper Egypt governorate upstream the Aswan High Dam and reaching Toshka lakes (Figure 1). The canal will be responsible to convey water to the New Valley irrigation project in the Upper Egypt governorate. The New Valley project is meant to relocate three million individuals of the Egyptian population to the Toshka area to work in cultivating about 2,310,000,000 m2 (550,000 feddans) there [11]. The canal system consists of a main channel and many sub-branches with a total length of about 300 km. The canal system gets its water via the Mubarak Pumping Station on Lake Nasser [12]. The volume flow rate is 300 m3/sec and water velocity for the main canal is 1.2 m/sec. The study is concerned only with the main channel of the Sheikh Zayed canal system. The dimensions of the main canal are as follows: length is 50 km, wetted top width is 54 m, bottom width is 30 m, water depth is 6 m, and side slopes are 2:1 (H:V). Toshka area is particularly chosen for the case study, because Toshka is a very arid area to the extent that about 2.5 billion cubic meters of water were lost, due to evaporation during the period of 2004 to 2006. Thus, it is worth to cover canals there, in order to preserve the water. This is in addition to provide the community that would be relocated to the New Valley in Toshka with clean energy.

3. Mathematical Modeling

This study is investigating the effect of solar canals on evaporation rates, power production, and water quality standards. Although the case study for this research is chosen to be Sheikh Zayed canal in Toshka, the study results could generally be applied to any waterway anywhere, provided that this place’s hydrologic and meteorological conditions are used. Hydrologic conditions are such as volume flow rate, water velocity, and channel geometry, while meteorological conditions are such as air temperature, shortwave, atmospheric pressure, wind speed, etc. Thus again, the case study of the Sheikh Zayed canal is aiming at covering the canal with PV panels, in order to minimize the evaporation and generate electricity, with the minimal effect on the quality of water in the canal. By increasing the percentage covering of the canal, the generated solar energy will increase, but water quality variables in the water will change, as a result of covering the canal. Thus, in order to maintain the water quality standards at its desired levels, an optimization study is done in this research to reach minimum evaporation from the canal, while reaching maximum power through the maximum percentage area covering of the canal and at the same time minimally affecting its water quality.
As for the hydrodynamics, all calculations were done using the manning equations with the discharge condition that will be mentioned in the following paragraphs.

3.1. Evaporation Model

There are many evaporation calculating methods which rely on climatic data and are well known in the fields of hydrology and irrigation [13]. These methods vary from simple empirical formulas to complex methods, such as the physically based combination method by Penman [14]. The original Penman equation is widely used as the standard method in hydrologic engineering applications to estimate potential evaporation from surface water at different sites and under varying climatic conditions [15,16]. Monteith added a modification to the Penman equation that resulted in a more reliable equation, namely the Penman–Monteith equation [17].
Based on the study conducted by Elbaradei [11], the Penman–Monteith equation is the best and more reliable equation among the three previously mentioned equations to estimate the evaporation rates of the El Sheikh Zayed canal. The study compared the three models with site observations of the canal. The Penman–Monteith equation formula is [17]:
E = 1 λ w R n G + γ f u e w e a w + γ ,
where E is the open water evaporation (mm/day), λ is the latent heat of vaporization (MJ/kg), Δw is the slope of the temperature saturation water vapor curve (kPa/°C), Rn is the net radiation (MJ m −2 day−1), G is the change in heat storage in the water body (MJ/m2/day), f(u) is the wind function (MJ/m2/day/kPa), ew is the saturated vapor pressure at water temperature (kPa), ea is the vapor pressure at air temperature (kPa), and γ is the psychometric constant (kPa/°C).
A mathematical model was developed on an Excel spread sheet for calculating the evaporation rate using the Penman–Monteith equation at Sheikh Zayed Canal. The meteorological data used in the calculations, such as air temperature, wind speed, relative humidity, etc., for the study years 1997, 2007, and 2016 are obtained on an average daily basis from the American metreological organization, Weather Underground Organization (WUO) [18]. Those three years’ evaporation rates and volumes were compared with the calculated ones from the equations that calculate evaporation rates and volumes and, based on the most accurate result, the targeted equation was chosen, which was the Penman–Monteith equation. The years chosen were at a 10-year interval, but 2016 was used instead of 2017, because no data was available for 2017 at the time that the study was done. The choosing and calibration of the evaporation equations is discussed in details in the study done by Elbaradei in 2018 [11]. The observations are obtained at Aswan weather station, which is the nearest Toshka area. As for the solar radiation data, they were collected from the NASA website [19].

3.2. Solar Energy Model

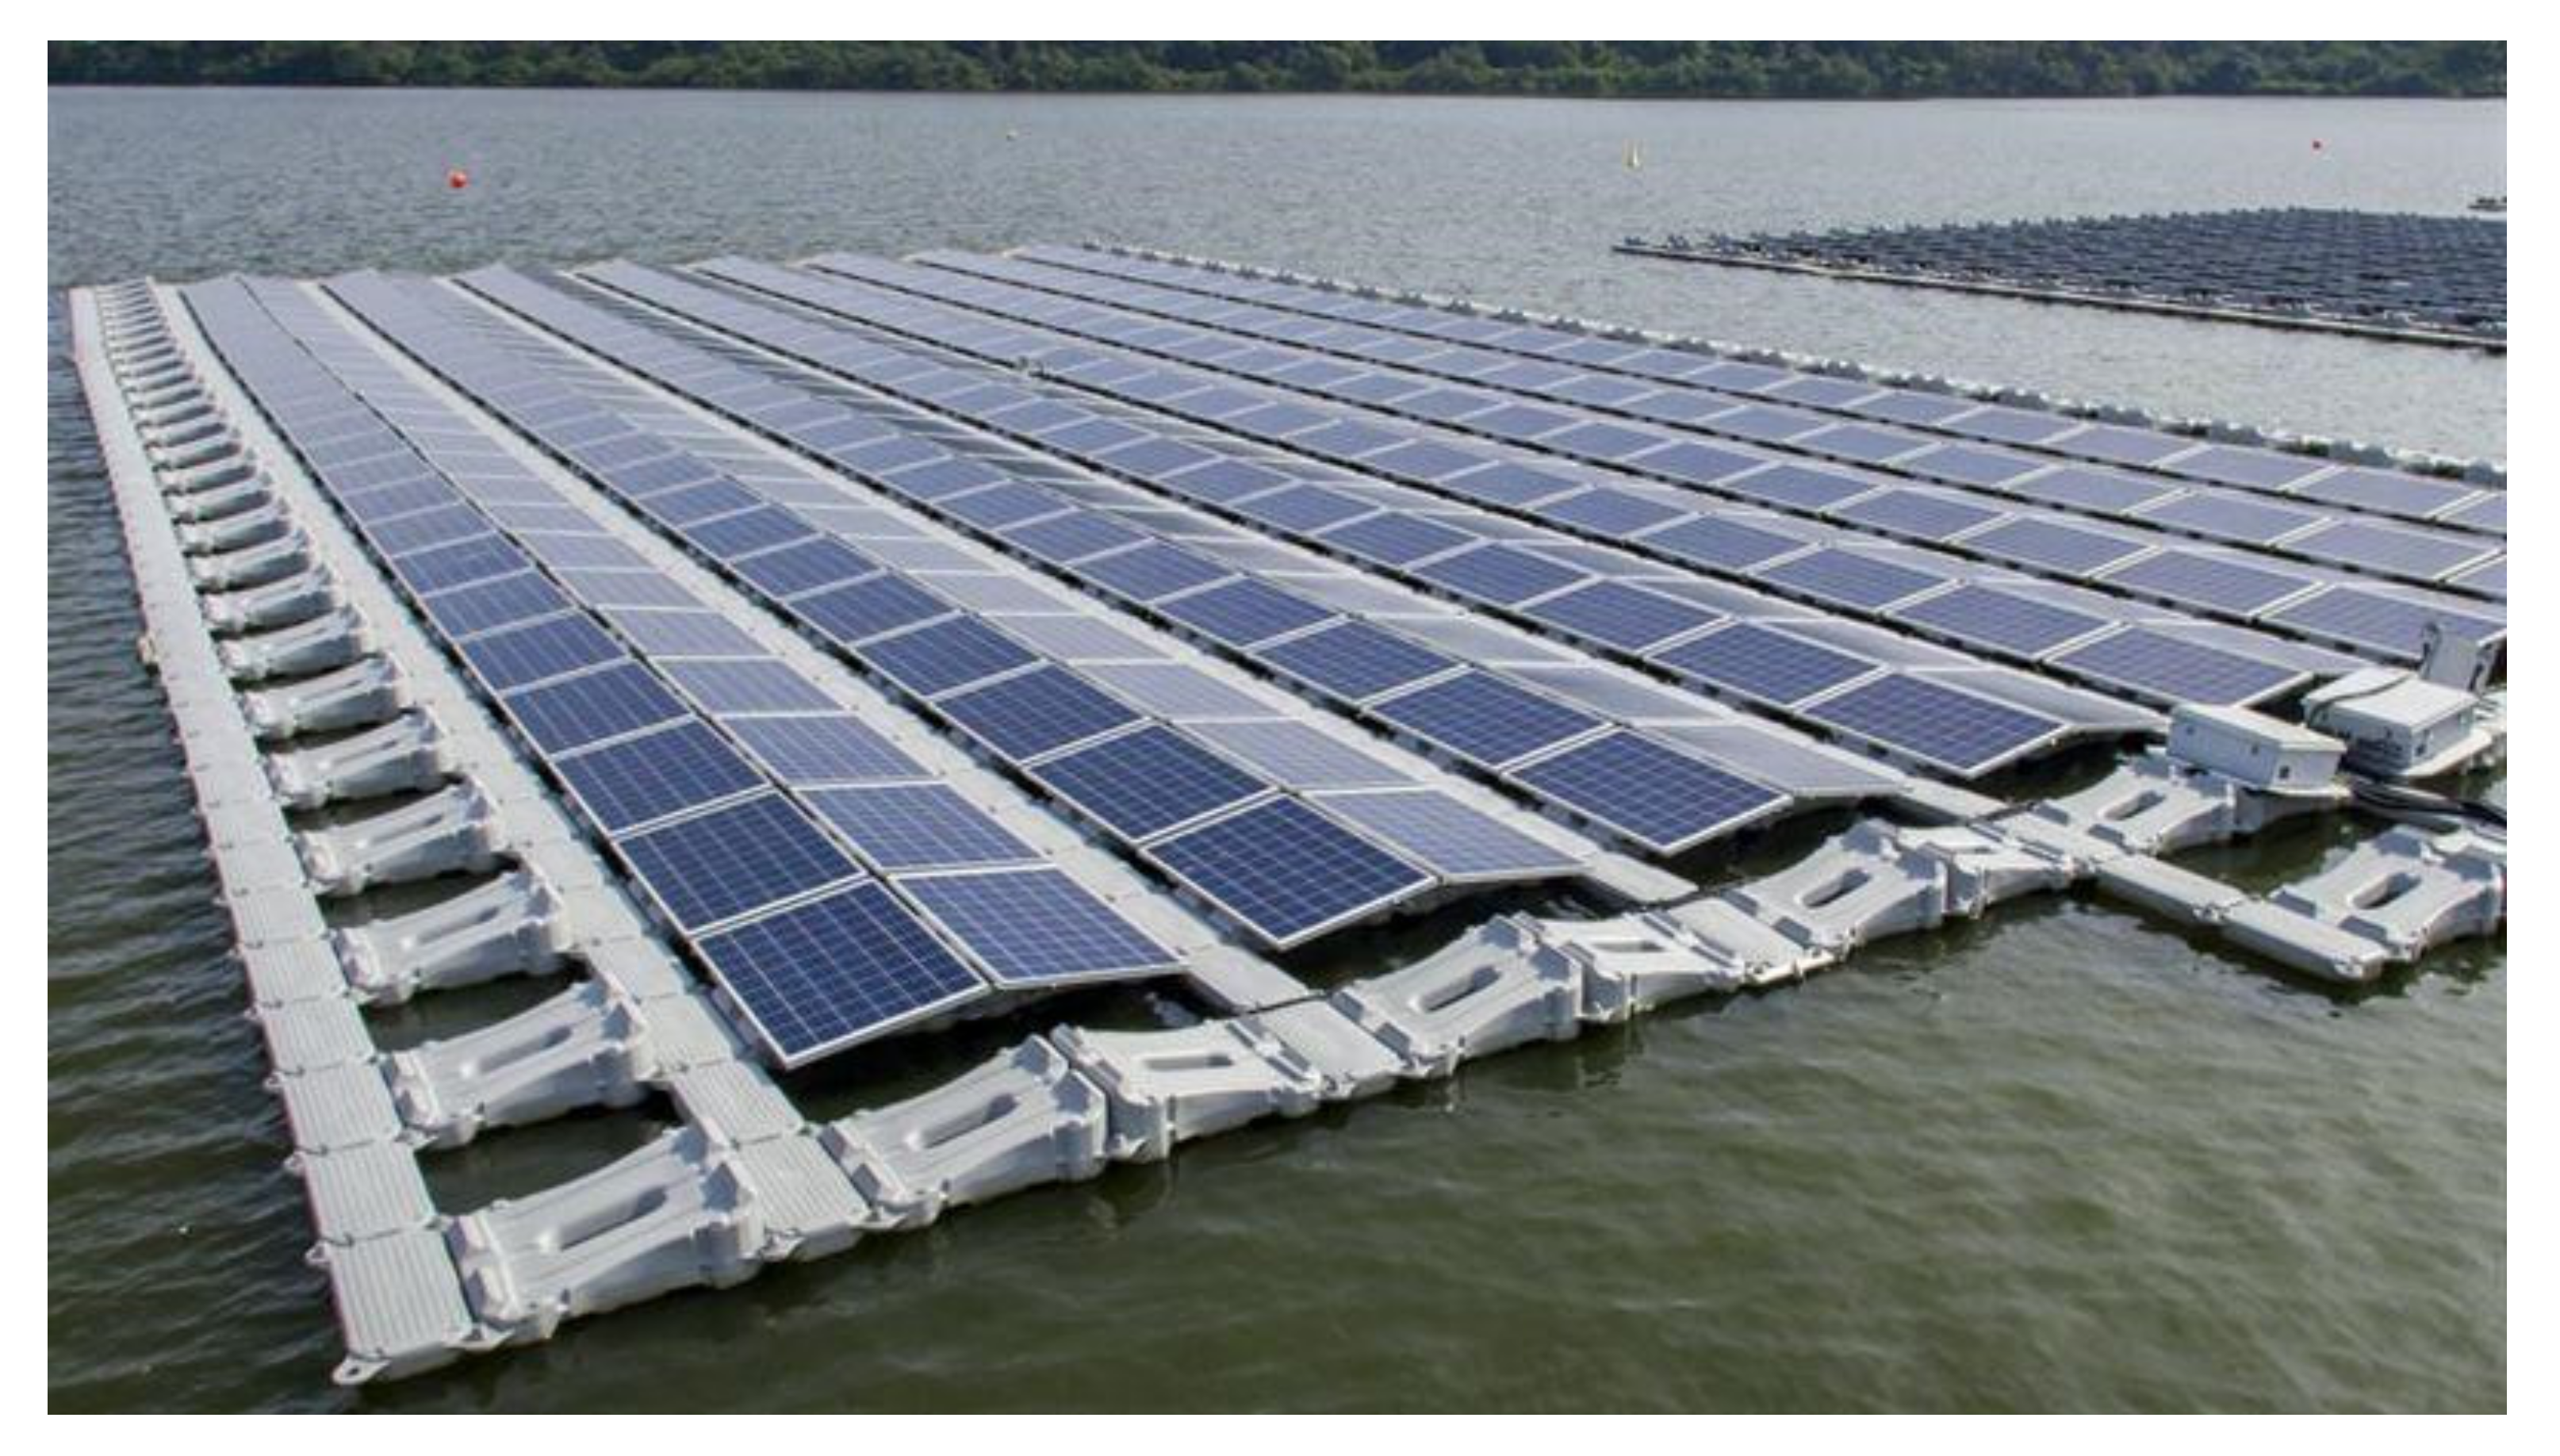
The solar panel cells were selected with dimensions 1.6 × 1 m. The solar panels are installed on floaters (floating pontoon platform) on top of the canal’s water surface, Figure 2. The solar cells are to be fixed on the floaters in rows and the 1.6 m length will be on long side of the canal and the 1 m on the width of the canal. The selection of floaters and its orientation will be defined in a later phase of the funded research project. Figure 1 is showing the floaters with the PV cells on top of them for another project. This project will have the same floater PV cells system, but for the Sheikh Zayed canal. The solar energy generation is calculated both in the winter and summer, due to the large difference in the sunny hours of the days between the summer season and the winter season. The calculations are based on the following assumptions: the PV cells efficiency is 10%, the sunny hours of the day in the winter are 8 h, while in the summer they are 15 h. The calculations are based on the assumption that, with every 10 m2 of canal covered area, almost 1 kWh/day of solar energy will be produced. The number of panel rows, covered area, uncovered area, and percentage coverage for every trial are summarized in Table 1.
In this research paper, the inclination angle is assumed to be zero—meaning the PV cells are oriented horizontally. In the complete work of this funded research, the optimum angle for PV cells installation are going to be determined according to the sunlight, as well as the effect of wind, because the PV cells are going to be installed on floaters. For the sake of this research paper, the angle is considered to be minimum—near zero—and this is to exclude any gaps between the rows–in order to calculate the evaporation due to covering all the space at each row. This will actually not affect the results, because we compare a trend and a percentage of covering and its effect on the evaporation, power, and water quality parameters. Thus, it is the trend that matters.

3.3. Water Quality Model

In this research, the studied and mathematically modeled water quality variables are dissolved oxygen (DO), algae, nutrients—including nitrogen and phosphate compounds—pH, and alkalinity. DO, algae, and nutrients are mathematically modeled using a developed Excel spreadsheet, while pH and alkalinity are modeled using a developed python model. The volume flow rate is considered to be constant throughout the canal. This assumption is based on the actual data coming from the Mubarak pumping station, which is feeding the Sheikh Zayed canal. This pumping station is operating with a constant volume flow rate of 300 m3/s all year long. The total length of the Canal (50 km) is then divided into control volumes every 100 m of the canal, as shown in Figure 3. The mass balance for each control volume for each water quality variable is modeled and written as follows:
Then, the general mass balance form of all constituents’ concentrations could be written as:
  C i + 1 = C i + A C Q i d x ,
where Ci is the initial constituent concentration, Ci+1 is the final constituent concentration at the end of control volume, Δx is the length of the control volume, and ΔC is the change in the constituent concentration. For each water quality parameter simulated, it must be noted that, as previously mentioned, the control volumes are taken at each 100 m throughout the 50 km length of the channel. It should also be noted that the hydrodynamics was calculated using Manning’s equation (where the Manning coefficient is taken for concrete lined canals), where the discharge is that generated by the pumping station and the velocity is calculated as a result of the wetted cross-sectional area of the canal and bed slope.

3.3.1. Water Quality Variables

  • Dissolved oxygen
Dissolved oxygen (DO) is one of the most important water quality variables. It reflects the quality of water and whether this water is safe for different usage purposes or not. The DO strongly affects the quality of water body, as it directly controls the chemical, physical, and biological processes. It plays a vital role for biological processes both directly through affecting the algae count and bacterial count in water (bacteria is not studied in this research) and indirectly through its effect on the nitrogen and carbon cycles which represent the chemical processes of water. It also controls the physical processes through re-aeration. The standards of DO concentration in water varies for different usage purposes. For irrigation, the standard DO concentration in water for edible crops is a minimum of 4 mg/L based on the Egyptian code [20], while in freshwater bodies such as rivers, the standard DO concentration is a minimum of 5 mg/L meant for aquatic plants and most fish species to be able to dwell [21]. These standards have to be met for different water usage purposes taking into account the effect of any external factors—like covering, for example—that may affect the DO concentration in water. Therefore, this is why it is significant to study the effect of canal coverage on DO concentrations along the canal.
Among the many sources and sinks of DO, the most important and affecting source and sink to DO are the Biological Oxygen Demand (BOD) and the re-aeration. DO is mainly affected by oxdizable organic substances (BOD) in the water body which consumes oxygen and decrease DO levels in water. DO is also affected by atmospheric re-aeration, which works as a source for DO and increases the concentration of DO in water. DO concentrations are also directly affected by temperature; because of that, the study took summer and winter values into consideration when simulating the DO concentrations in the canal. Both effects are determined by the Streeter–Phelps equation [22]:
w ( D = k d k d L o k r k d e k d t e k r t + D o e k r t ,
where D is the oxygen deficit in water (mg/L), L is the BOD concentration in water (mg/L), Lo is the initial BOD concentration in water (mg/L), Kd is the coefficient rate of biochemical decomposition of organic matter (day−1), Kr is the re-aeration rate coefficient (day−1), t is the travel time in the stream interpreted as t = x/v, where x is the distance (m), and v is the mean flow velocity of the stream (m/s).
L = L o k d t ,
D o = DO sat D o ,
DO sat = 14.61996 0.4042 T + 0.00842 T 2 + 0.00009 T 2 ,
where DOsat is the saturation oxygen concentration of water (mg/L) and T is the water temperature (°C). It has to be noted that the mass balance equation (2) was applied on the DO concentration calculation over the control volume.
DO and solar energy production are seasonally very dependent, and their concentrations vary with a considerable amount in the summer and winter. The DO in winter, for example, is at its highest concentrations, because DO increases with decreased temperature. On the other hand, the solar energy decreases in winter, because the sunlight duration and intensity are less than in the summer season. Considering that, DO concentrations and solar energy production are calculated for the summer and winter seasons in this research paper.
  • Algae and nutrients
Studying algae existence in water is important as the extensive growth of algae may cause algae blooms. The algae blooms can result in de-oxygenation of water which will lead to death and decomposition of algae; as well as worsening the quality of water. This will cause aquatic plants and animal death [23]. The death and decomposition of this large mass of algae results in depleting more dissolved oxygen from water. Algae always grow in the presence of nutrients. In Lake Nasser, the most existing algae groups are Diatoms, Chlophytes, Cyanophytes, and Dinoflagellates. The percentage existence of each type is 20%, 16.7%, 55.7%, and 7.5%, respectively, throughout the year [24]. In this research paper, the average concentration of all algae was used in the simulation.
Algae are conservative substances, so they are not subject to reactions. The algae concentration is increasing due to photosynthesis and it is decreasing due to respiration, death, and settling [25]. The change in algae concentration could be calculated by [26]:
S a p = p h y t o P h o t o p h y t o R e s p p h y t o D e a t h p h y t o S e t t l ,
where Sap is the change in algae concentration in the control volume, phytoPhoto is the phytoplankton photosynthesis rate, phytoResp is the amount of phytoplankton that lost due to respiration, phytoDeath is the amount of phytoplankton that lost due to death. and phytoSettl is the amount of settled phytoplankton. The photosynthesis is calculated by:
p h y t o P h o t o = μ p a p ,
where μp is the phytoplankton photosynthesis rate (/d), which is a function of temperature, nutrients, and light. The phytoplankton photosynthesis rate is calculated by:
μ p = k g p T ϕ N p ϕ L p ,
where kgp(T) is the maximum photosynthesis rate at temperature T (/d), ØNp is the phytoplankton nutrient attenuation factor (dimensionless number between 0 and 1), and ØLp is the phytoplankton light attenuation coefficient (dimensionless number between 0 and 1).
Nutrient Limitation: Michaelis–Menten equations are used to represent growth limitation for inorganic nitrogen and phosphorus. The minimum value is then used to compute the nutrient attenuation factor; it is calculated by [26]:
N p = m i n n a + n n k s N p + n a + n n , p i k s P p + p i ,
where nn is the nitrate nitrogen concentration, na is the ammonia nitrogen concentration, pi is the inorganic phosphorus concentration, ksNp is the nitrogen half-saturation constant (µgN/L), and ksPp is the phosphorus half-saturation constant (µgP/L).
The phytoplankton respiration is calculated as:
n p p h y t o R e s p = F a x p k r p T a p ,
where krp(T) is a temperature-dependent phytoplankton respiration/excretion rate (/d) and Faxp is the attenuation due to low oxygen (dimensionless). The phytoplankton death is calculated as:
n p p h y t o D e a t h = k d p T a p ,
where kdp(T) is a temperature-dependent phytoplankton death rate (/d). The phytoplankton settling is calculated as:
n p p h y t o S e t t l = v a H a p ,
where va is the phytoplankton settling velocity (m/d) and H is the water depth [m].
Moreover, modeling nutrients in water is significant especially in irrigation water. As in high nitrogen concentrations, it may cause excessive vegetative growth, lodging, and delayed crop maturity; unsightly deposits on fruit or leaves due to overhead sprinkler irrigation with high bicarbonate water, water containing gypsum, or water high in iron; and various abnormalities often associated with an unusual pH of the water [27].
Furthermore, in high levels of nutrients and under some conditions, algae may cause algal blooms. These blooms can result in de-oxygenation of water, which may lead to aquatic plants and animal death [23].
In this study, nutrients modeling includes nitrogen and phosphorus compounds. Nitrogen compounds include organic nitrogen, ammonia nitrogen, and nitrate nitrogen, whereas phosphorus is modeled in its organic and inorganic forms. During photosynthesis, algae consume nitrogen in ammonia or nitrate forms and phosphorus in its inorganic phosphate form [28]. All nutrients calculations are based on the assumption that the organic sediment store in the canal is neglected.
The organic nitrogen increases due to plant death and it is lost due to hydrolysis and settling. It is calculated by:
n p v S n o = f o n p q N p p h y t o D e a t h + f o n p q N p B o t A l g D e a t h H O N H y d r o O N S e t t l ,
where fonp is the fraction of the phytoplankton internal nitrogen which is in organic form, phytoDeath is the death rate of phytoplankton, BotAlgDeath is the death rate of bottom algae, H is the water depth, ONSettl is the organic nitrogen settling rate, and ONHydro is the rate of organic nitrogen hydrolysis; it is calculated by:
n p v O N H y d r = k h n T n o ,
where no is the organic nitrogen concentration and khn(T) is a temperature-dependent organic nitrogen hydrolysis rate (/d). The organic nitrogen settling is calculated as:
n p v O N S e t t l = v o n H n o ,
where von is the organic nitrogen settling velocity (m/d).
The ammonia nitrogen (na) increases due to organic nitrogen hydrolysis, plant death, and excretion, while it decreases via nitrification and plant photosynthesis. The ammonia nitrogen concentration is calculated by:
n p v v S n a = O N H y d r o + 1 f o n p q N p p h y t o D e a t h + 1 f o n p q N p B o t A l g D e a t h H + p h y t o E x N + B o t A l g E x N H N i t r i f P a p p h y t o U p N P a b B o t A l g U p N H N H 3 G a s L o s s ,
where ONHydro is the hydrolysis of organic nitrogen, phytoExN is the excretion rate of phytoplankton, Nitrif is the nitrification rate, Pap is the preference for ammonium as a nitrogen source for phytoplankton, phytoUpN is the intake rate of nitrogen by phytoplankton, BotAlgUpN is the intake rate of nitrogen by bottom algae, and NH3GasLoss is the NH3 gas loss into air.
The nitrate nitrogen (nn) increases due to nitrification of ammonia, while it is lost due to de-nitrification and plant uptake. Nitrification and de-nitrification rates are calculated by:
n p v v S n i = N i t r i f D e n i t r 1 P a b B o t A l g U p N H ,
where Denitr is the de-nitrification rate of nitrate nitrogen and Pab is preference for ammonium as a nitrogen source for bottom algae.
D e n i t r = 1 F o x d n k d n T n n ,
where Foxdn is the effect of low oxygen on de-nitrification and kdn(T) is a temperature-dependent de-nitrification rate of nitrate nitrogen (/d).
The organic phosphorus (po) increases due to plant death and excretion while it is lost through hydrolysis and settling. The organic phosphorus and hydrolysis rates are calculated by:
S P o = f o P P q P p P h y t o D e a t h H + f o P b B o t A l g D e a t h H O P H y d r o O P S e t t l ,
where fop is the fraction of phytoplankton internal phosphorus that is in organic form, qpp is the phytoplankton cell quotas of phosphorus (mgP/mgA) and it is calculated as qpp = IPp/ap, OPHydro is the organic phosphorus hydrolysis rate, and OPSettl the organic phosphorus settling rate.
  O P H y d r = k h p T P o ,
where khp(T) is the temperature-dependent organic phosphorus hydrolysis rate (/d). The organic phosphorus settling is calculated as:
  O P S e t t l = ʋ o p H P o ,
where vop is the organic phosphorus settling velocity (m/d).
The concentration of inorganic phosphorus (Pi) increases due to organic phosphorus hydrolysis and plant excretion, while it is lost due to plant uptake. Furthermore, a settling loss is included for cases in which inorganic phosphorus is lost due to sorption onto settle-able particulate matter.
S P i = O P H y d r + 1 f o P P ) q P p P h y t o D e a t h + ( 1 f o P b q P p B o t A l g D e a t h H + P h y t o E x P + B o t A l g E x P H P h y t o U p P P h y t o U p P H I P S e t t l ,
where IPSettl is the internal phosphorus settling, it is calculated by:
  I P S e t t l = ʋ i p H P i ,
where vip is the inorganic phosphorus settling velocity (m/d).
  • pH and alkalinity
pH states the solubility and biological availability of chemical constituents in water, such as nutrients and heavy metals, it also affects the aquatic life in water body. The pH is determined by:
p H = l o g 10 H + ,
where vi is the inorganic suspended solids settling velocity (m/d).
Then, the root of the equation is determined numerically using Newton–Raphson method [29]:
f H + = α 1 + 2 α 2 C T + K w H + H + A l k ,
where α1 and α2 are the fraction of total inorganic carbon in bicarbonate and carbonate, respectively, CT is the total inorganic carbon concentration, Kw is acidity constant, and Alk is the alkalinity of water.
To solve Equation (26) numerically using the Newton–Raphson method, a python model is constructed to determine the pH along the Canal [30]. Python is an open source interpreted high-level programming language for general-purpose programming which provides constructs that enable clear programming on both small and large scales [31].
α 1 = K 1 H + [ H + ] 2 + K 1 H + + K 1 K 2   ,
α 2 = K 1 K 2 [ H + ] 2 + K 1 H + + K 1 K 2   ,
where α1 and α2 are the fraction of total inorganic carbon in bicarbonate and carbonate, respectively, and the equilibrium constants K1 and K2 are temperature dependent and calculated using empirical equations by Appelo [32].
Algae photosynthesis consumes nitrogen in ammonia or nitrate forms and phosphorus in its inorganic phosphate form. If ammonia is the primary nitrogen source, this leads to a decrease in alkalinity, because the uptake of the positively charged ammonium ions is much greater than the uptake of the negatively charged phosphate ions [29]. In the case where nitrate is the primary nitrogen source, then alkalinity will increase, because both nitrate and phosphate are negatively charged. The change in alkalinity (Alk) in the mass balance equation is solved by:
d s = S a n i t + S a d e n i t + S a O N h + S a O p h + S a p h y t p + S a p h y t u p + S a p E x ,
where ds is the change in alkalinity in the control volume, Sanit is the change in alkalinity due to nitrification, Sadenit is the change in alkalinity due to de-nitrification, SaONh is the change in alkalinity due to hydrolysis of organic nitrogen, SaOph is the change in alkalinity due to organic phosphorus hydrolysis, Saphytp is the change in alkalinity due to algae photosynthesis, Saphytup is the change in alkalinity due to algae nutrients excretion, and SapEx is the alkalinity change due to algae nutrients uptake.

3.3.2. Initial Concentrations

The initial concentrations of the studied water quality variables the Sheikh Zayed canal are measured at Toshka, which is the nearest observation station to Sheikh Zayed Canal on Lake Nasser. The initial concentrations are measured by the Egyptian Ministry of Water Resources and Irrigation, as shown in Table 2 [33]. The measurements of water quality variables are: dissolved oxygen (DO) in summer and winter, biological oxygen demand (BOD) in summer and winter, algae concentration (ap), organic nitrogen (no), ammonia nitrogen (na), nitrate nitrogen (nn), organic phosphorus (po), and inorganic phosphorus (pi). The average air temperature at Toshka in winter is 20 °C and in summer is 33.3 °C [18], whereas the average solar radiation in winter is 342 cal/cm2/day, and in summer it is 652 cal/cm2/day [19].

3.3.3. Water Quality Standards

Meeting water quality standards are important in different usages such as drinking, irrigation, and also for fauna and flora in water streams. The world became in need for all good quality water supplies to meet the high demand of food. To avoid problems when using poor quality water supplies, there must be sound planning to ensure that the quality of water available is put to the best use [28]. The water quality standards set by the Food and Agriculture Organization (FAO) are summarized in Table 3.

3.3.4. Model Validation

The developed simulation models are validated for Sheikh Zayed Canal with real life values. The evaporation model is validated with real values of the evaporation rate approved by the Ministry of Water Resources and Irrigation at Toshka. The validation result shows a negligible error of 2% [11].
There are no models that study or simulate the effect of covering channels on DO concentrations. Thus, the developed excel sheet of the DO simulation is validated against the example by Chapra at his book ‘Surface water-quality modeling’ [34]. The validation gives an exact result with zero percentage error for the DO [11]. All validations for all water quality variables and evaporation are done at the case of not covering the canal.
All other water quality variables are validated against the Qual2K water quality model. Qual2K is a modeling framework for simulating stream water quality developed by Chapra [29]. Qual2K is validated and calibrated by many researches who found it to be a reliable computer package [35,36]. Thus, it could be concluded that Qual2K is a reliable method for validation in this research paper. The constructed model validation output for each variable and its percentage error is summarized in Table 4.
The modeled water quality parameters’ values obtained by the developed spread sheets are for the DO, algae, and nutrients, while the water quality parameters modeled by the python are those for the pH and alkalinity. All water quality parameters’ reference values—except for the DO—are values measured through monitoring stations belonging to the Ministry of Water Resources and Irrigation near Sheikh Zayed Canal. The DO, on the other hand, is validated against Chapra’s example [34]. The percentage error for all the studied water quality parameters ranges from 0–2.19%. Based on the study done by Radwan et al. in 2007, which studied the uncertainty in water quality simulation models in rivers, it was found that the acceptable errors are 2% for DO, 20% for BOD, and 15% for nutrients [37]. In light of that, the errors in this study are accepted and could be even considered as negligible.

3.4. Optimization Model

The aim of this research is to determine the optimum coverage area at which the minimum evaporation volume and the maximum energy generation—without affecting the water quality—is reached. In order to do that, an optimization model is developed using the Python programming language.
The solar panel cells are chosen to be with dimensions 1 × 1.6 m. The installation of these solar panels will be that the 1.6 m side is in the same direction of the channel’s length. It is assumed, at this stage of the research that the angle of inclination of the solar cells is zero. Actually, at the end phase of the research, that the PV cells are planned to be placed on top of floaters that are always designed to have PV cells fixed at 12 degrees of inclination on top of them. This particular angle is the best angle from the point of view of the influence of the wind. This is going to be further investigated in the coming stages of this research grant. Thus, as 12 degrees is not expected to make the great effect on the solar power production as compared with the 0 degree, it could be assumed that the inclination angle is zero degree for the time being. Additionally, this is not going to affect the results of the research—as general trend—as here, the general trend of covering % and its effect on water quality parameters, evaporation, and solar power production is going to be investigated; and thus, if the values are changed, then it does not matter, as the trend is maintained. The simulation is based on fixing a number of panel rows on the canal’s surface and then changing the number of panel rows. All the calculations are done for each number of panel rows, until reaching the full coverage of the canal.
The optimization model is analyzed as the following steps: first, the canal is divided into sections, then different covering area proposals are applied. Evaporation volume, energy generation, and water quality variables are calculated, then the condition of water quality variables is applied with a tolerance factor in case of crash. The tolerance factor is added when finding out that the optimal shading percentage as having a DO factor equal to a specified value, for example, for the condition of DO of 4 mg/L, the tolerance factor is defined to ease the conditional statement for optimization termination, for instance, if at one iteration step, the DO = 4.2 mg/L and in the next, it is 3.95 mg/L; then, the limit will be a little bit flexible, so that the model can get the 3.95 as an accepted DO, since the sharp 4 is not achievable. The same explanation holds, when DO is simulated for the value of 5 mg/L. After that, different water quality variables are plotted against the percentage covering. The point of intersection of the curves is the optimal percentage covering.

4. Results

4.1. Evaporation Volume

The evaporation calculation results of Sheikh Zayed Canal using the Penman–Monteith model are shown in Figure 4. The results indicate that the maximum evaporation volume of the canal is at the totally uncovered case, while the minimum is at the totally covered case. The maximum evaporation volume is 8.64 million m3/year. This evaporation volume is very high, due to the dry weather in Toshka where the Sheikh Zayed Canal is located. The evaporation volume is decreasing by increasing the percentage coverage, until reaching almost zero evaporation at full canal coverage.

4.2. Solar Energy Generation

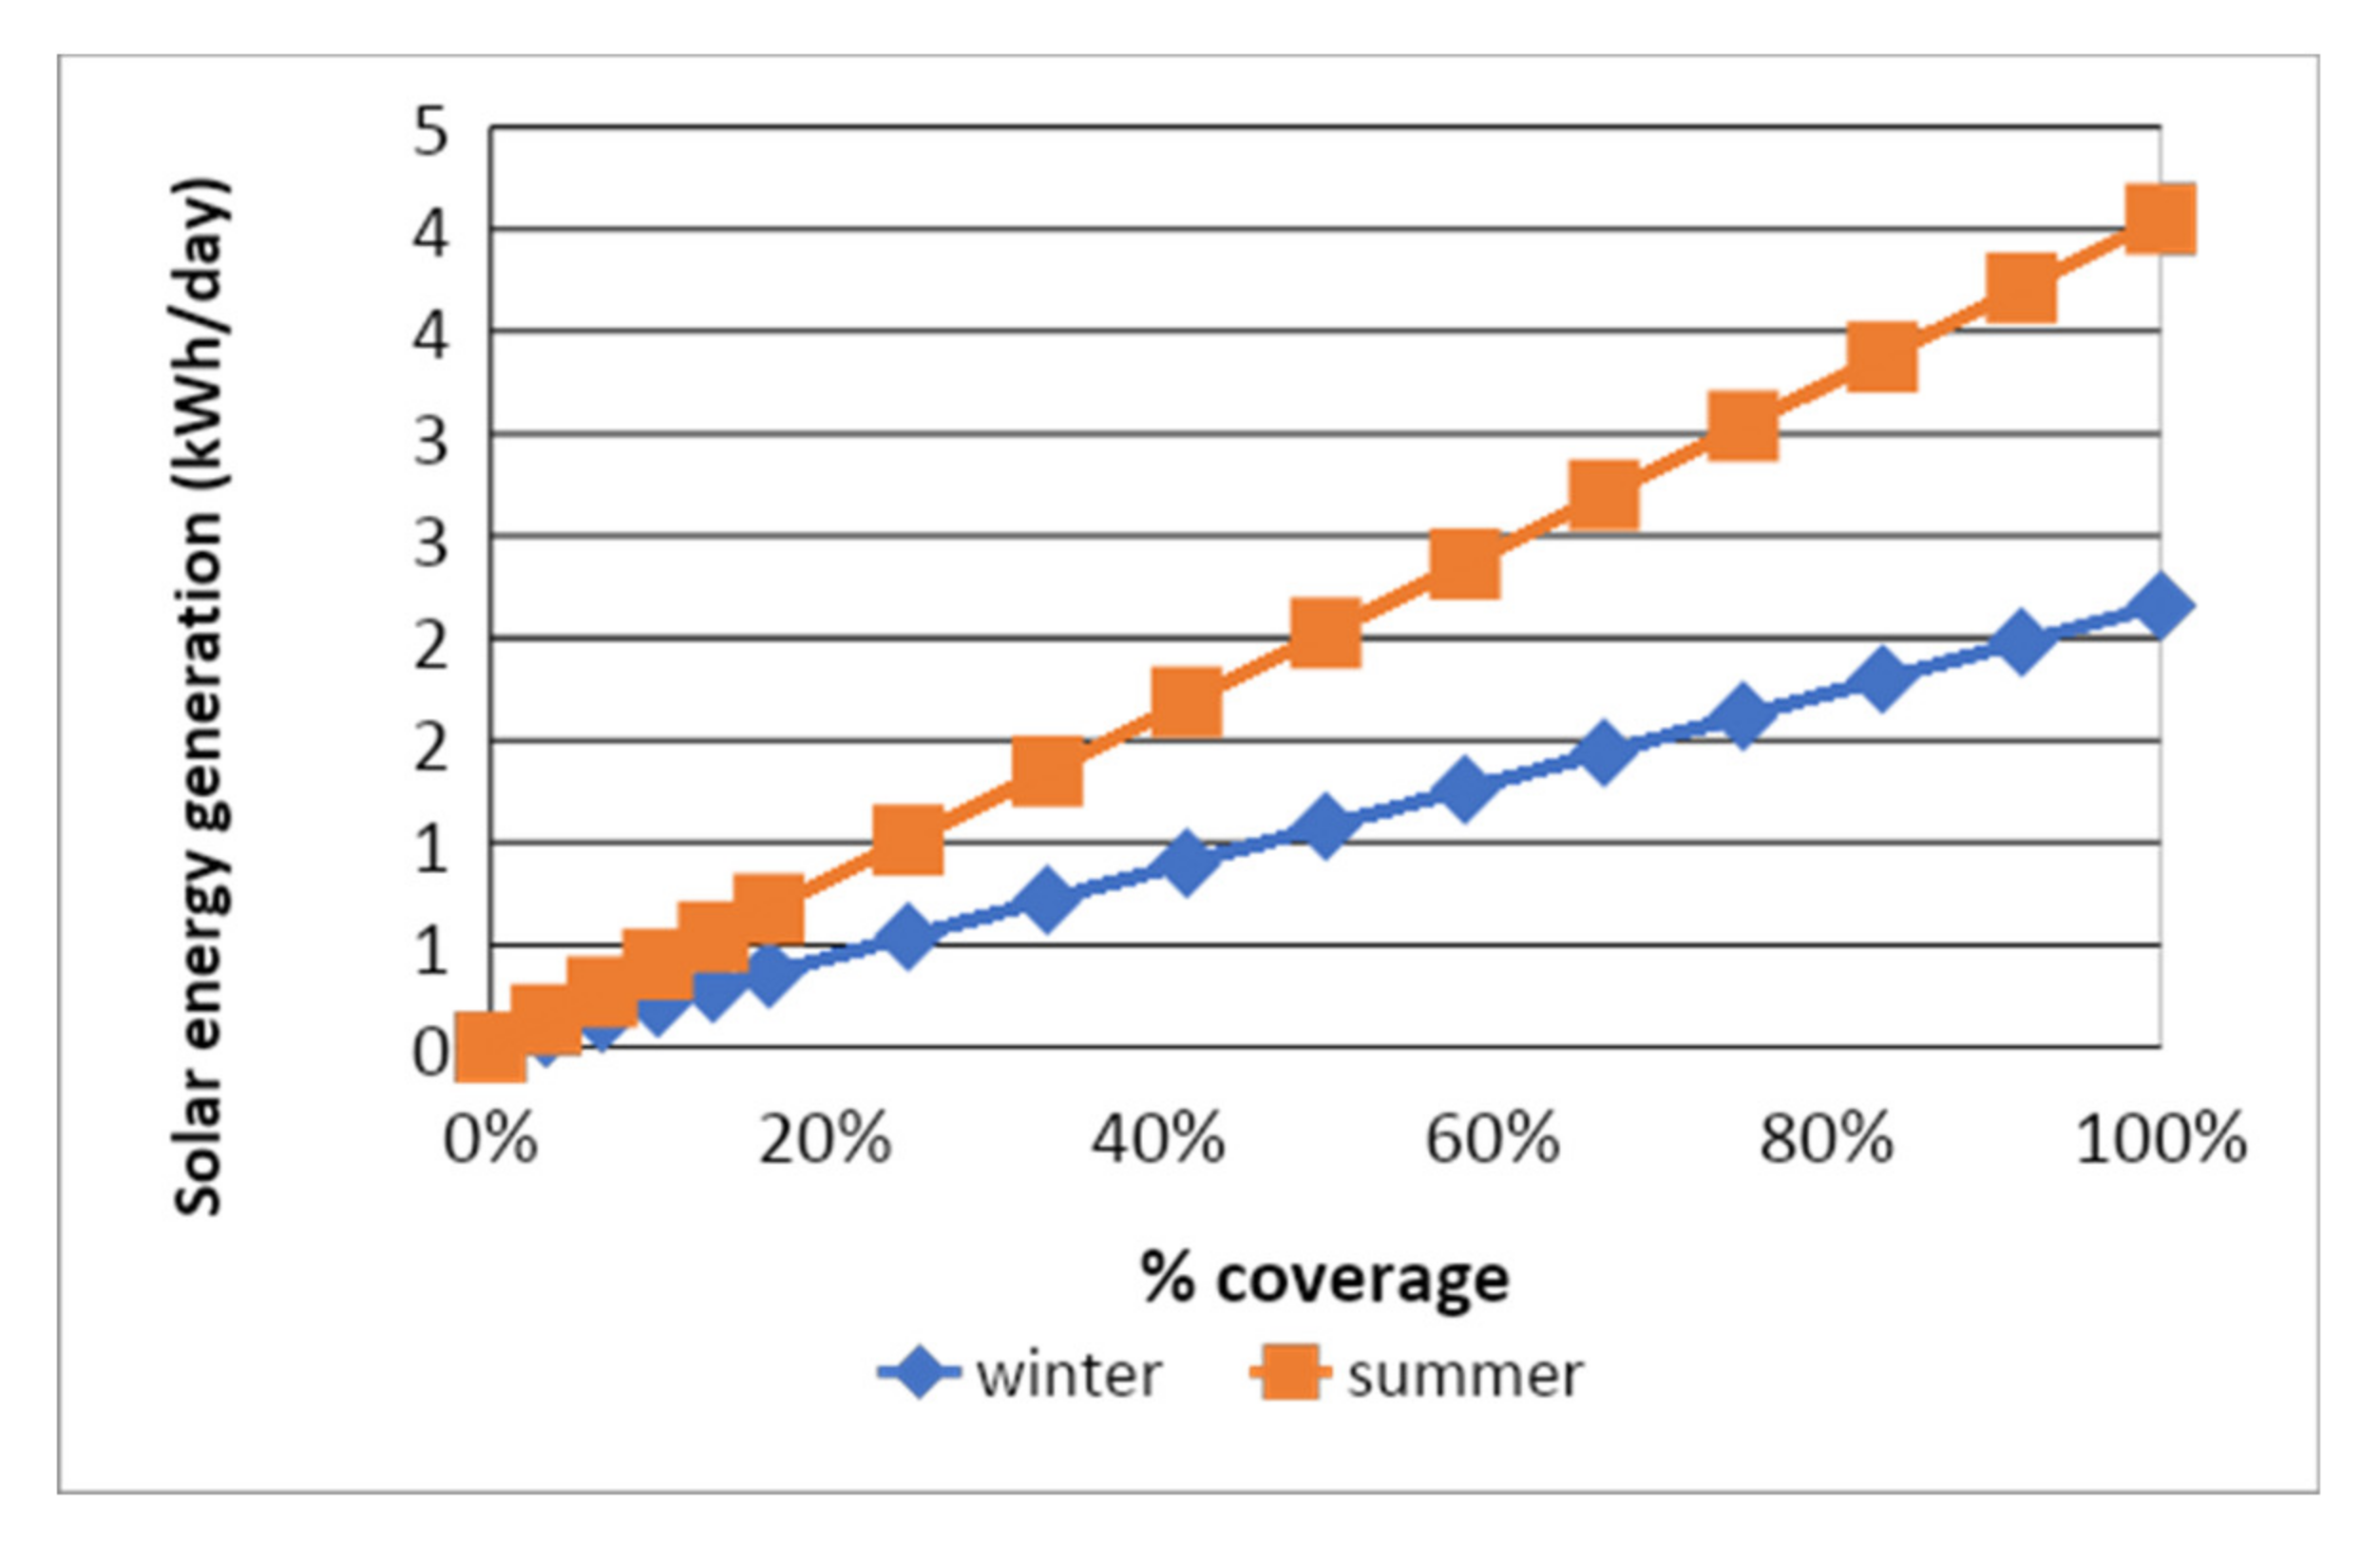
As coverage percentage increases, evaporation volume decreases and solar energy generation increases, as shown in Figure 5. The maximum solar energy generated by solar panels located over the canal cover is 4,050,000 kWh/day in the summer, in the case of total canal coverage, and the maximum energy generated in the winter is 2,160,000 kWh/day.

4.3. Water Quality Simulation

4.3.1. Dissolved Oxygen

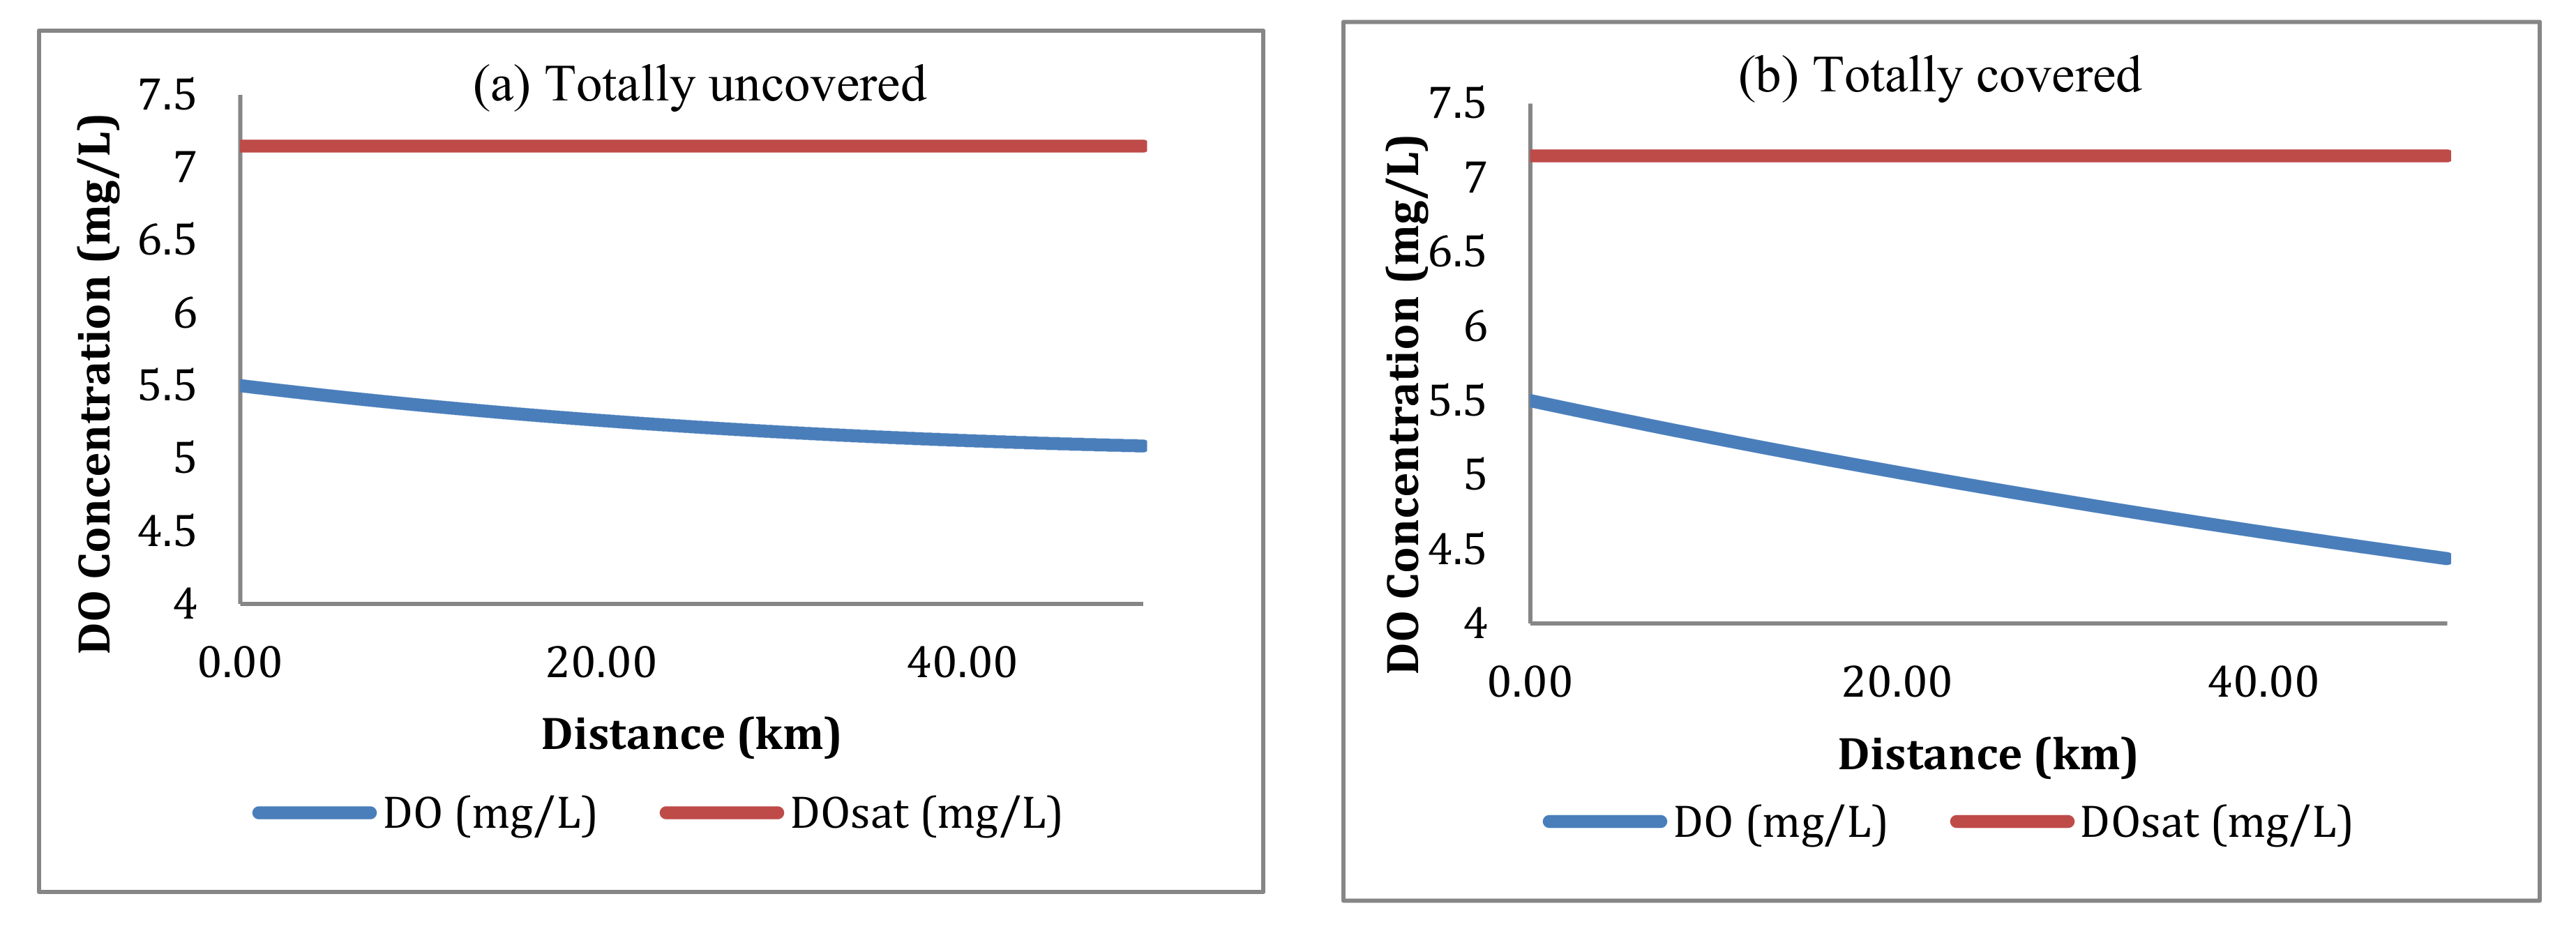
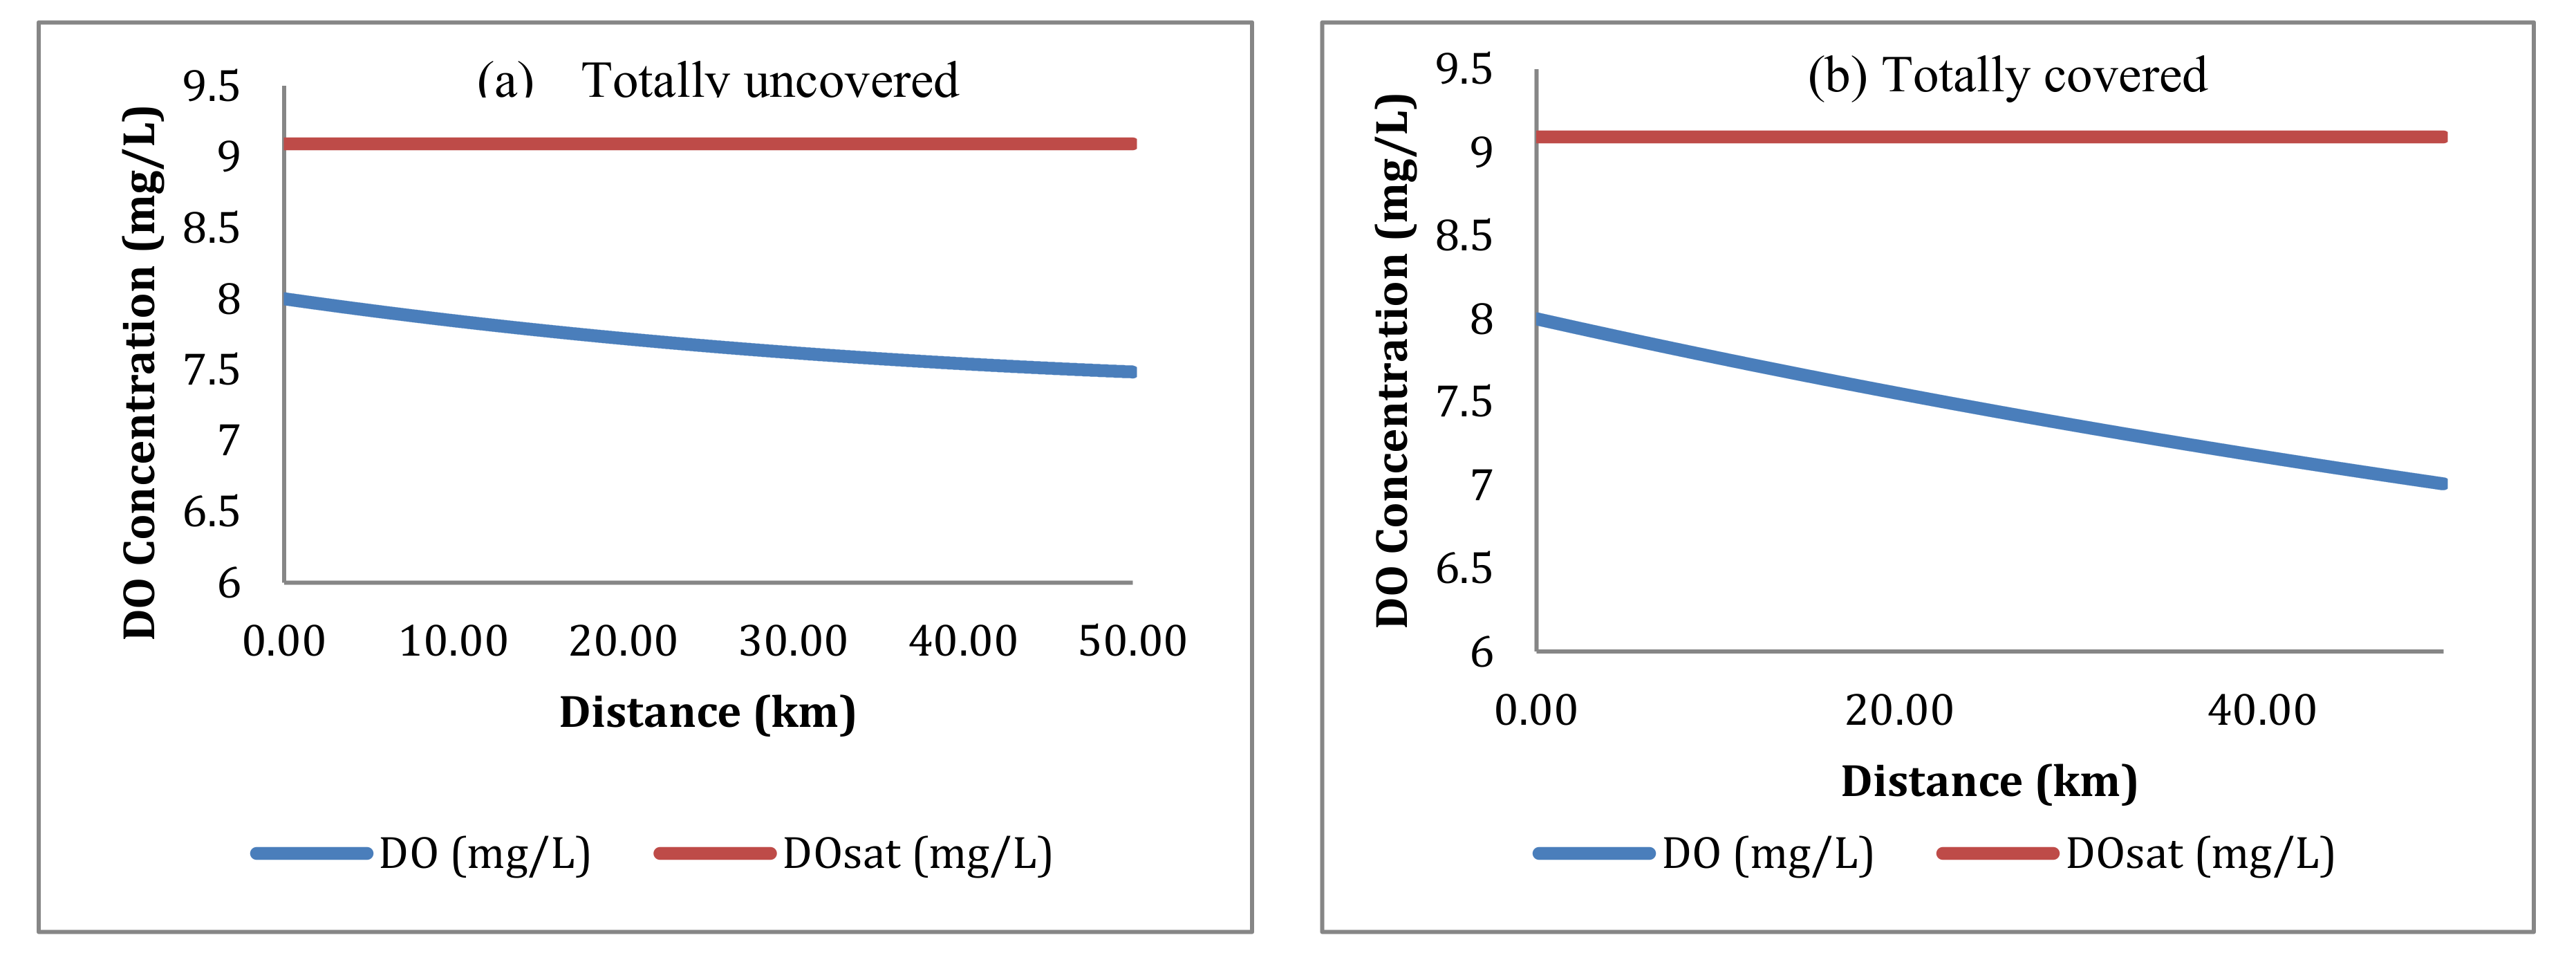
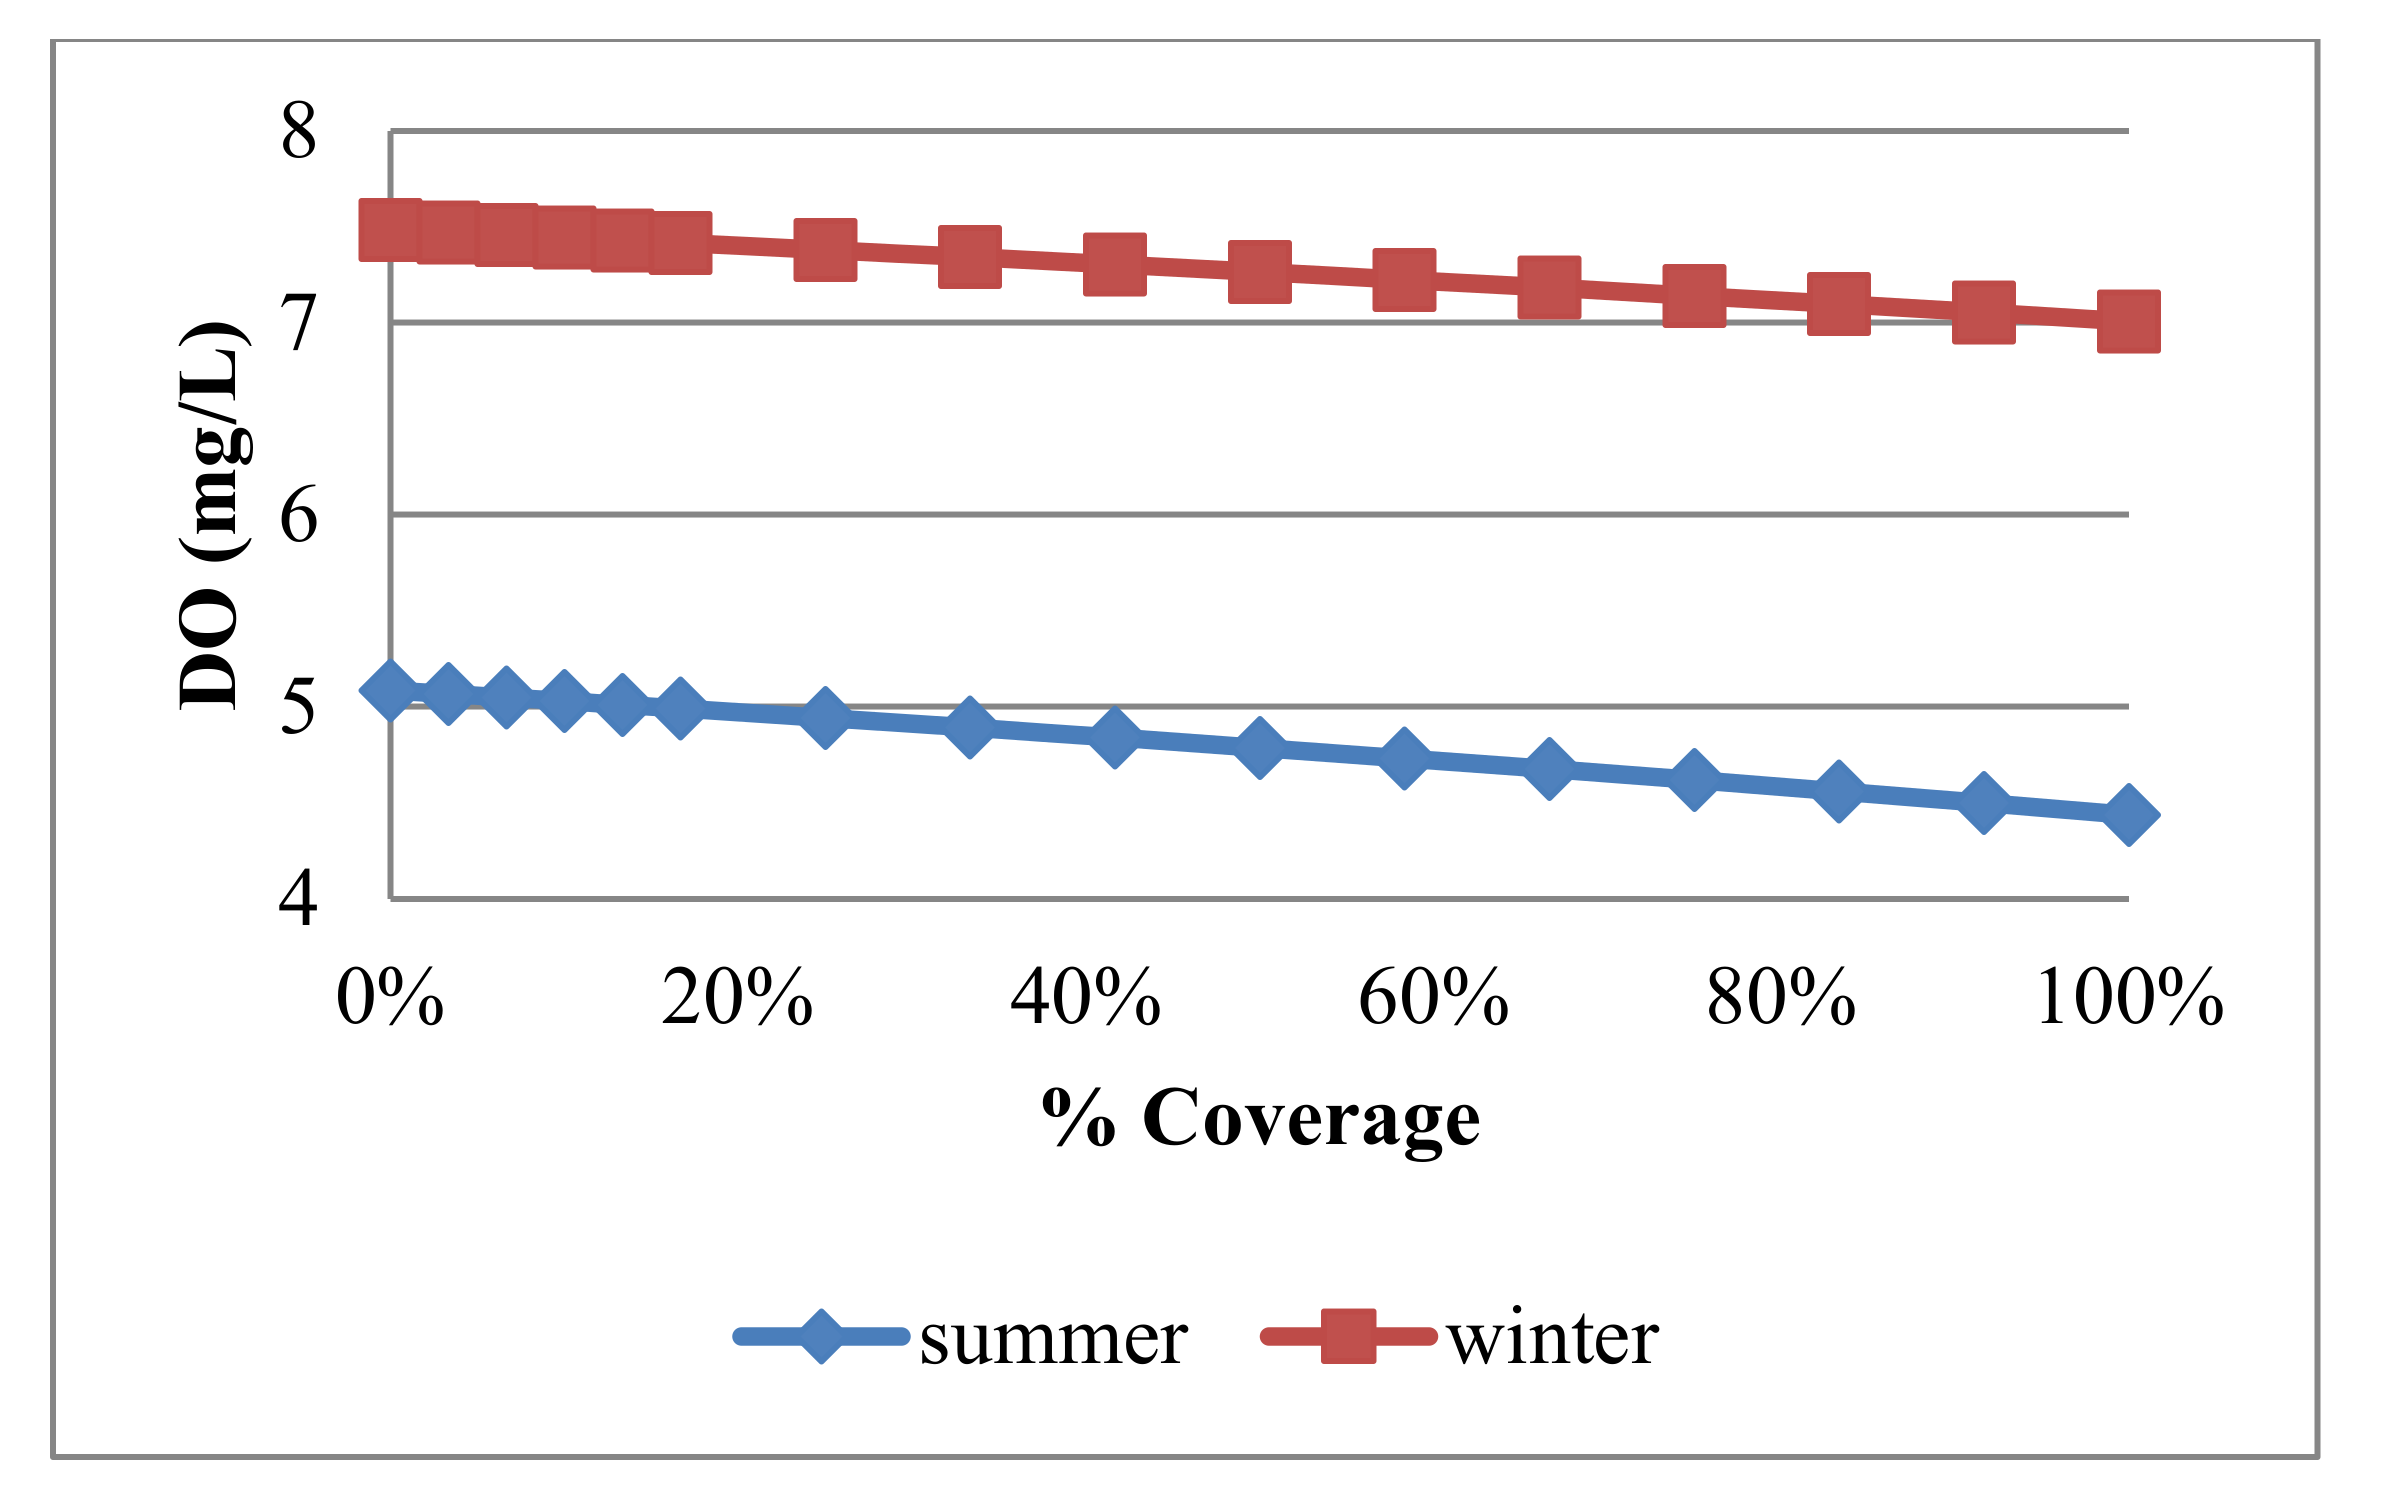
The saturation concentration of DO depends on the temperature, thus in the summer, it is 7.15 mg/L and in the winter, it is 9.09 mg/L. It could be observed from Figure 6 and Figure 7 that in the case of totally covering the 50 km of the canal, DO concentrations are lower than in the case of totally uncovering the canal. This is because, as the covering increases (i.e., spacing between covering rows decreases), the atmospheric re-aeration decreases, which in turn results in a decrease in the concentration values of the DO. In the summer, the DO concentration at the canal end in case of totally uncovering is 5.09 mg/L, while in case of totally covering, it is 4.47 mg/L, as shown in Figure 6. On the other hand, in the winter, the DO concentration in case of totally uncovered is 7.49 mg/L, while in the case of totally covered, it is 7.01 mg/L, as shown in Figure 7. As previously mentioned, the values of DO concentration written are those at the end section of the canal after simulating it throughout its whole 50-km length.
After evaluating the DO concentration against the percentage covering in the summer and winter, it could be seen that DO concentrations in the summer are lower than in the winter, Figure 8. This is due to the difference in the initial concentration of DO and BOD, which are mainly depending on temperature. Therefore, as the average temperature in Toshka varies between 33 °C in the summer and 20 °C in the winter, the DO concentration in the summer varies between 7.48–7.01 mg/L, while in the winter it varied between 5.09–4.44 mg/L.

4.3.2. Algae and Nutrients

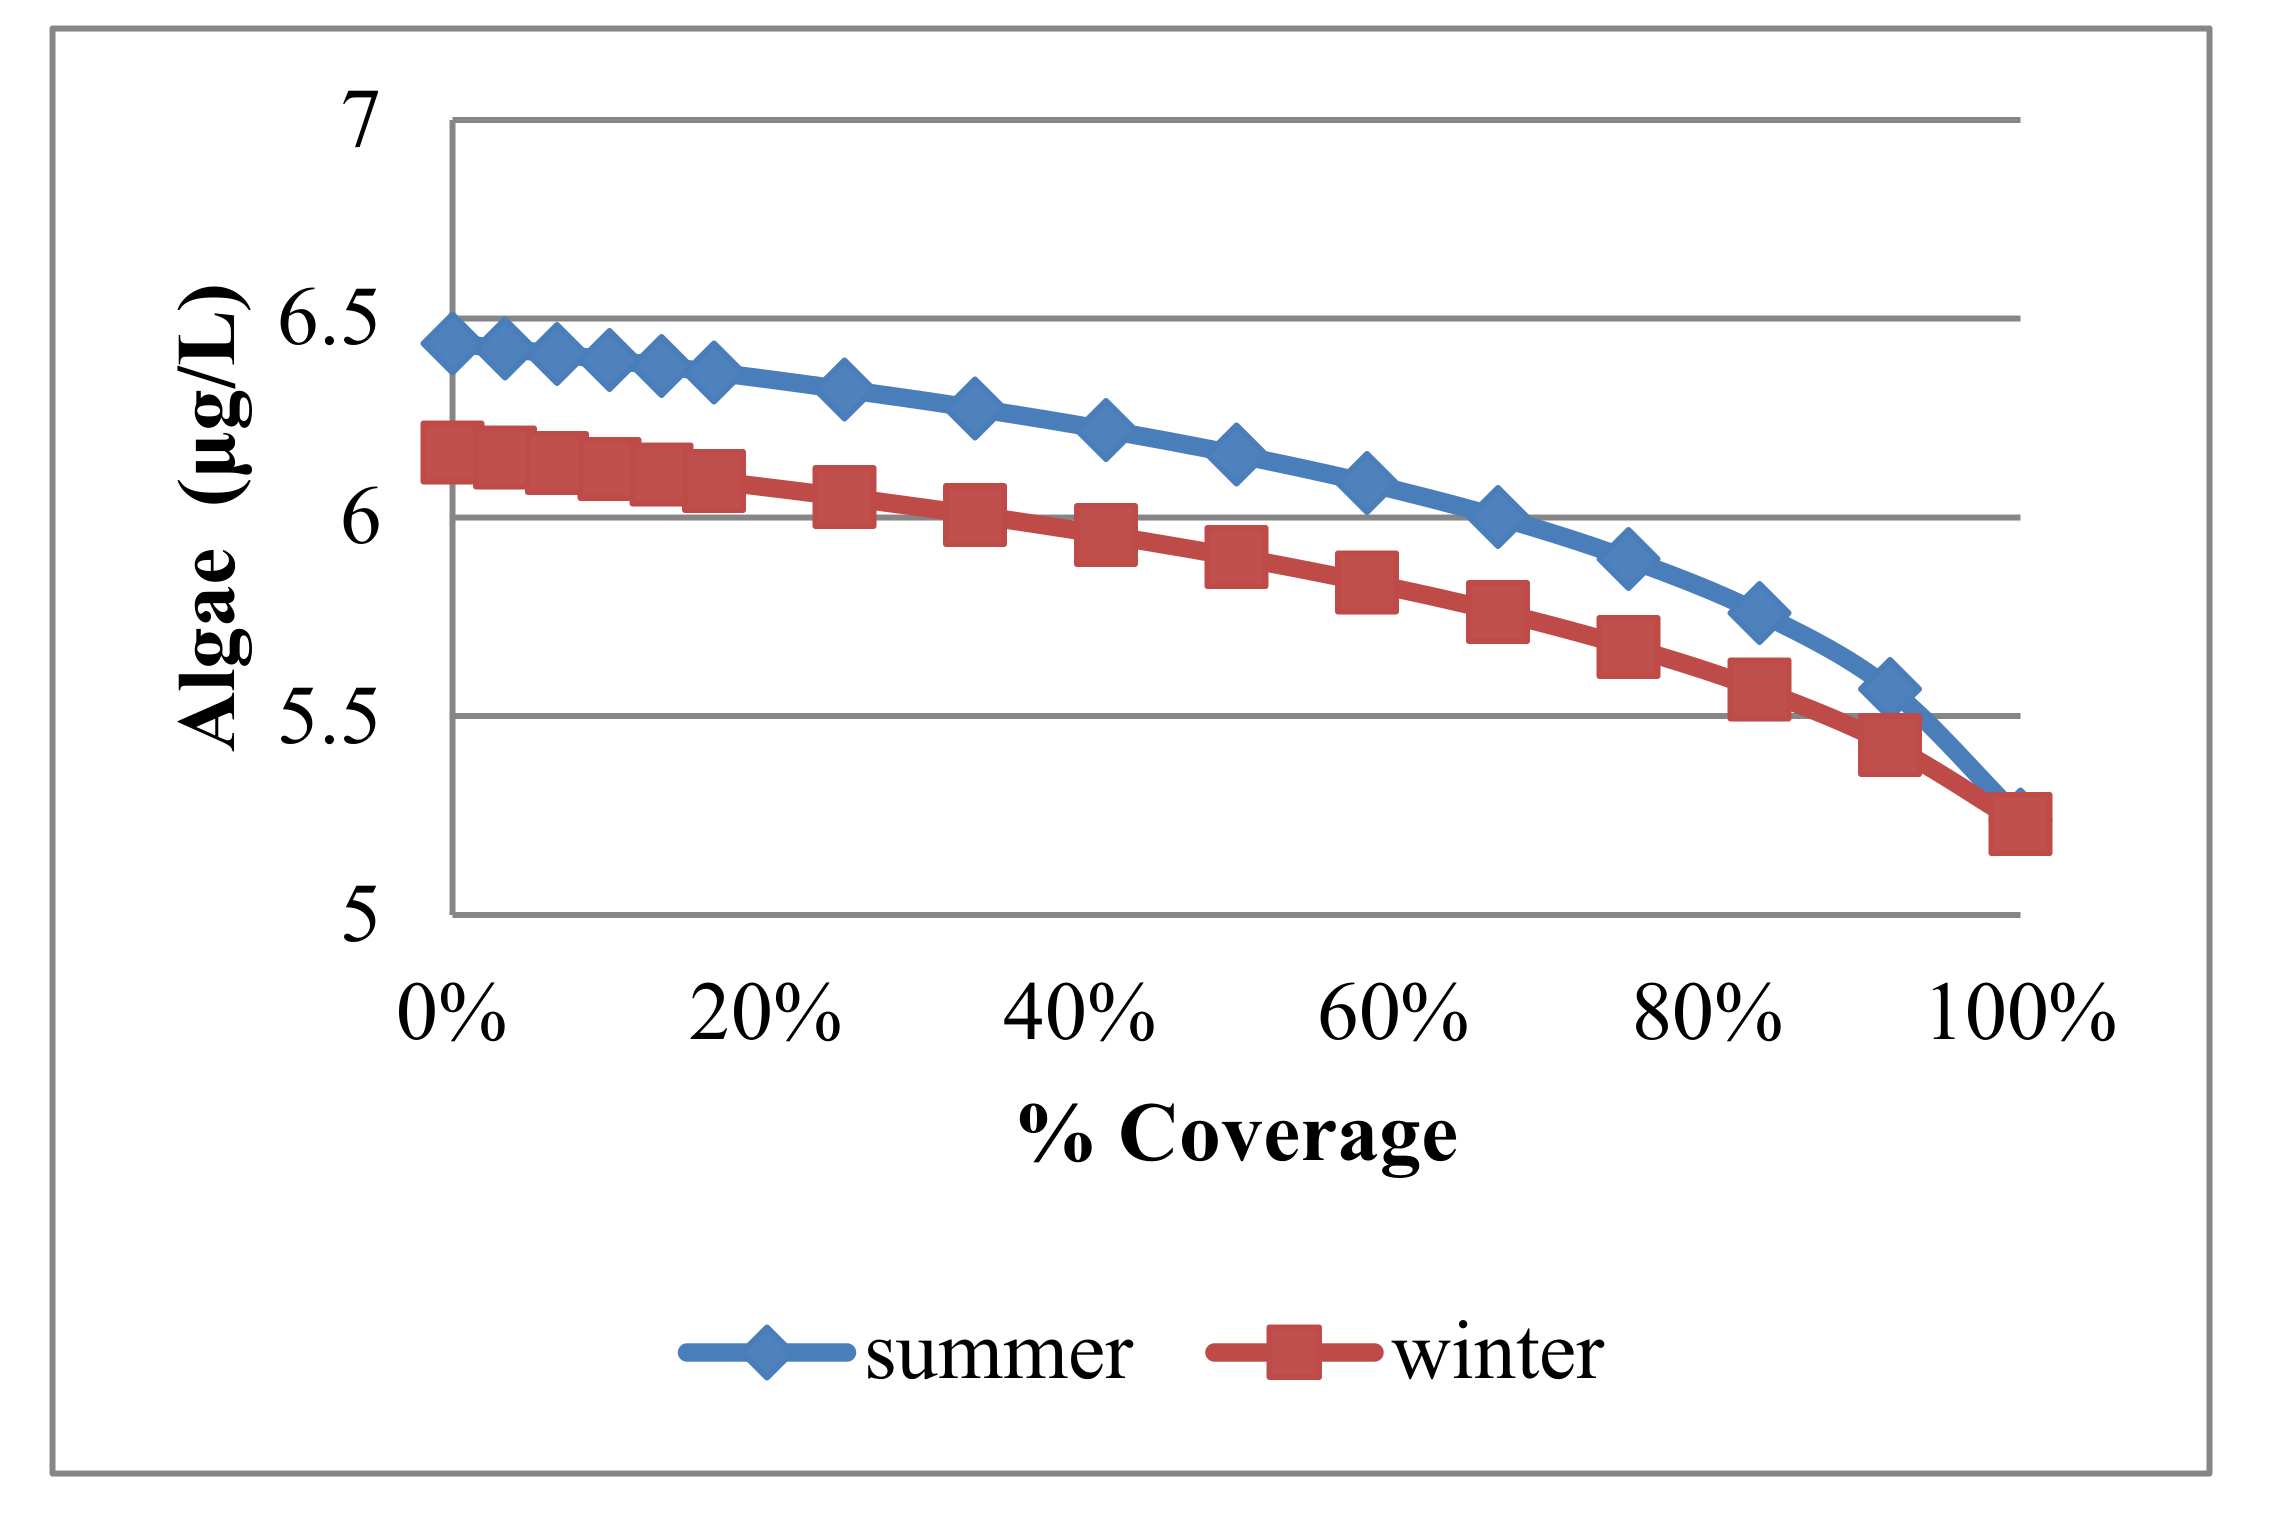
The algae results indicate that the algae concentration is highly influenced by covering the canal, as shown in Figure 9. It is also highly affected by solar radiation which directly influences the photosynthesis. Moreover, it is affected and affects the seasonal DO concentrations. The initial concentration of algae at fully uncovering is 6.44 μg/L in the summer, while it is 6.16 μg/L in the winter. It is decreasing with covering until it reaches 5.23 μg/L in the summer and winter in the case of full covering. The photosynthesis rate could explain the effect of covering on algae concentration. The more the canal is covered with solar panels, the less solar radiation can pass into the canal. As a result, the less photosynthesis rate for more coverage.
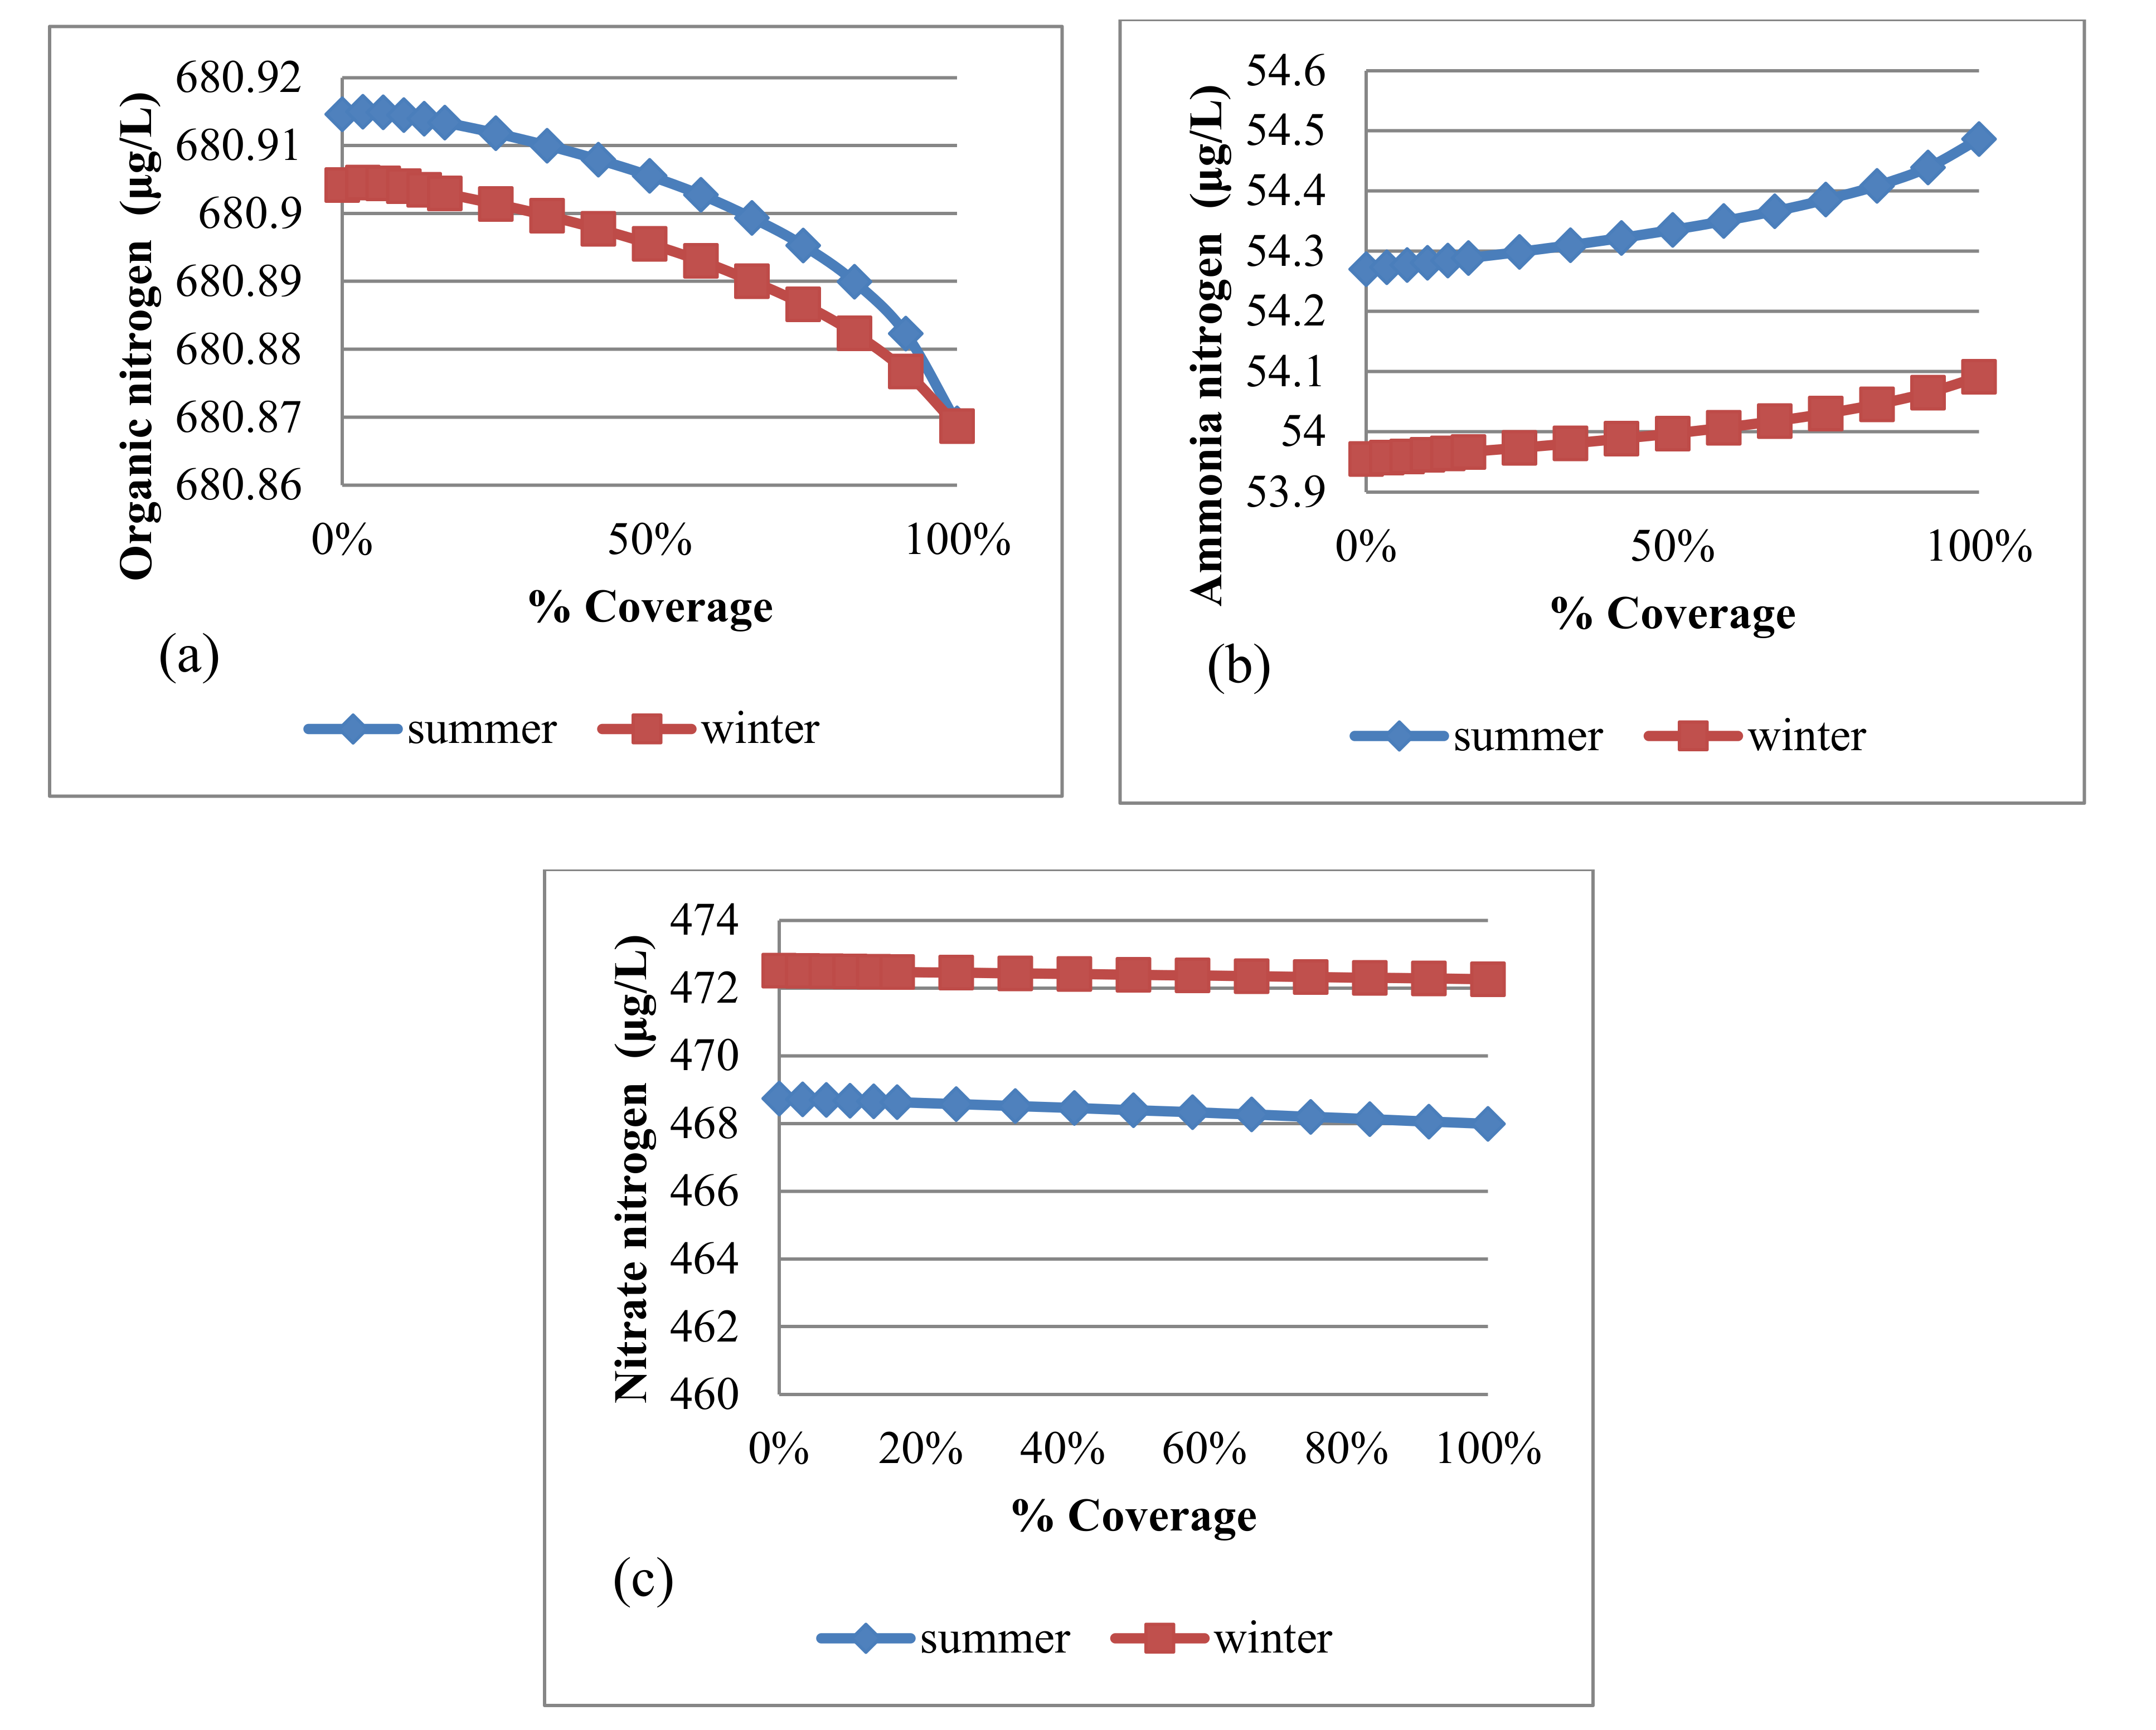
As shown in Figure 10, the nitrogen simulation results indicate that the organic nitrogen acts in the same way as algae. The effect of canal covering on organic nitrogen is less sensitive than algae. It is decreasing with covering from 680.91 to 680.87 μg/L, at full coverage in the summer. In the winter, it is decreasing from 680.90 to 680.87 μg/L. The effect of solar radiation change between seasons is minor on the organic nitrogen. The nitrate nitrogen acts in the same way as organic nitrogen. It decreases from 468.74 to 467.99 μg/L at full coverage of the canal in the summer. In the winter, it decreases from 472.51 to 472.27 μg/L.
The ammonia nitrogen behaves differently as compared with algae, nitrate, and organic nitrogen. It is increasing with coverage from 54.27 to 54.49 μg/L at full coverage of the canal in the summer. In the winter, it increases from 53.96 to 54.09 μg/L. The explanation of this increase is that algae consume ammonia nitrogen during photosynthesis.
Studying the water quality variables’ trend with coverage is the main objective of this study. The differences in values of the water quality variables are relatively small, so for other water bodies (other than the studied one in this research), the values could vary, but the general trend of increase or decrease with covering will be the same. This was checked further through constructing a prototype canal at the Nile University in Egypt to validate the model outputs. It was found that the same trends are always maintained the same as the model output, but values are different, because the water body is different in size and hydraulic conditions. Therefore, it could be safely concluded that the model used in this research can support making the conclusions that it reached for any water body.
The bacterial quality of water is expected to directly affect the DO and nutrients as any organic substance; as it enters the water, it will consume DO, which will lead to a decrease in the DO levels, which in turn affects the nitrification and de-nitrification processes.
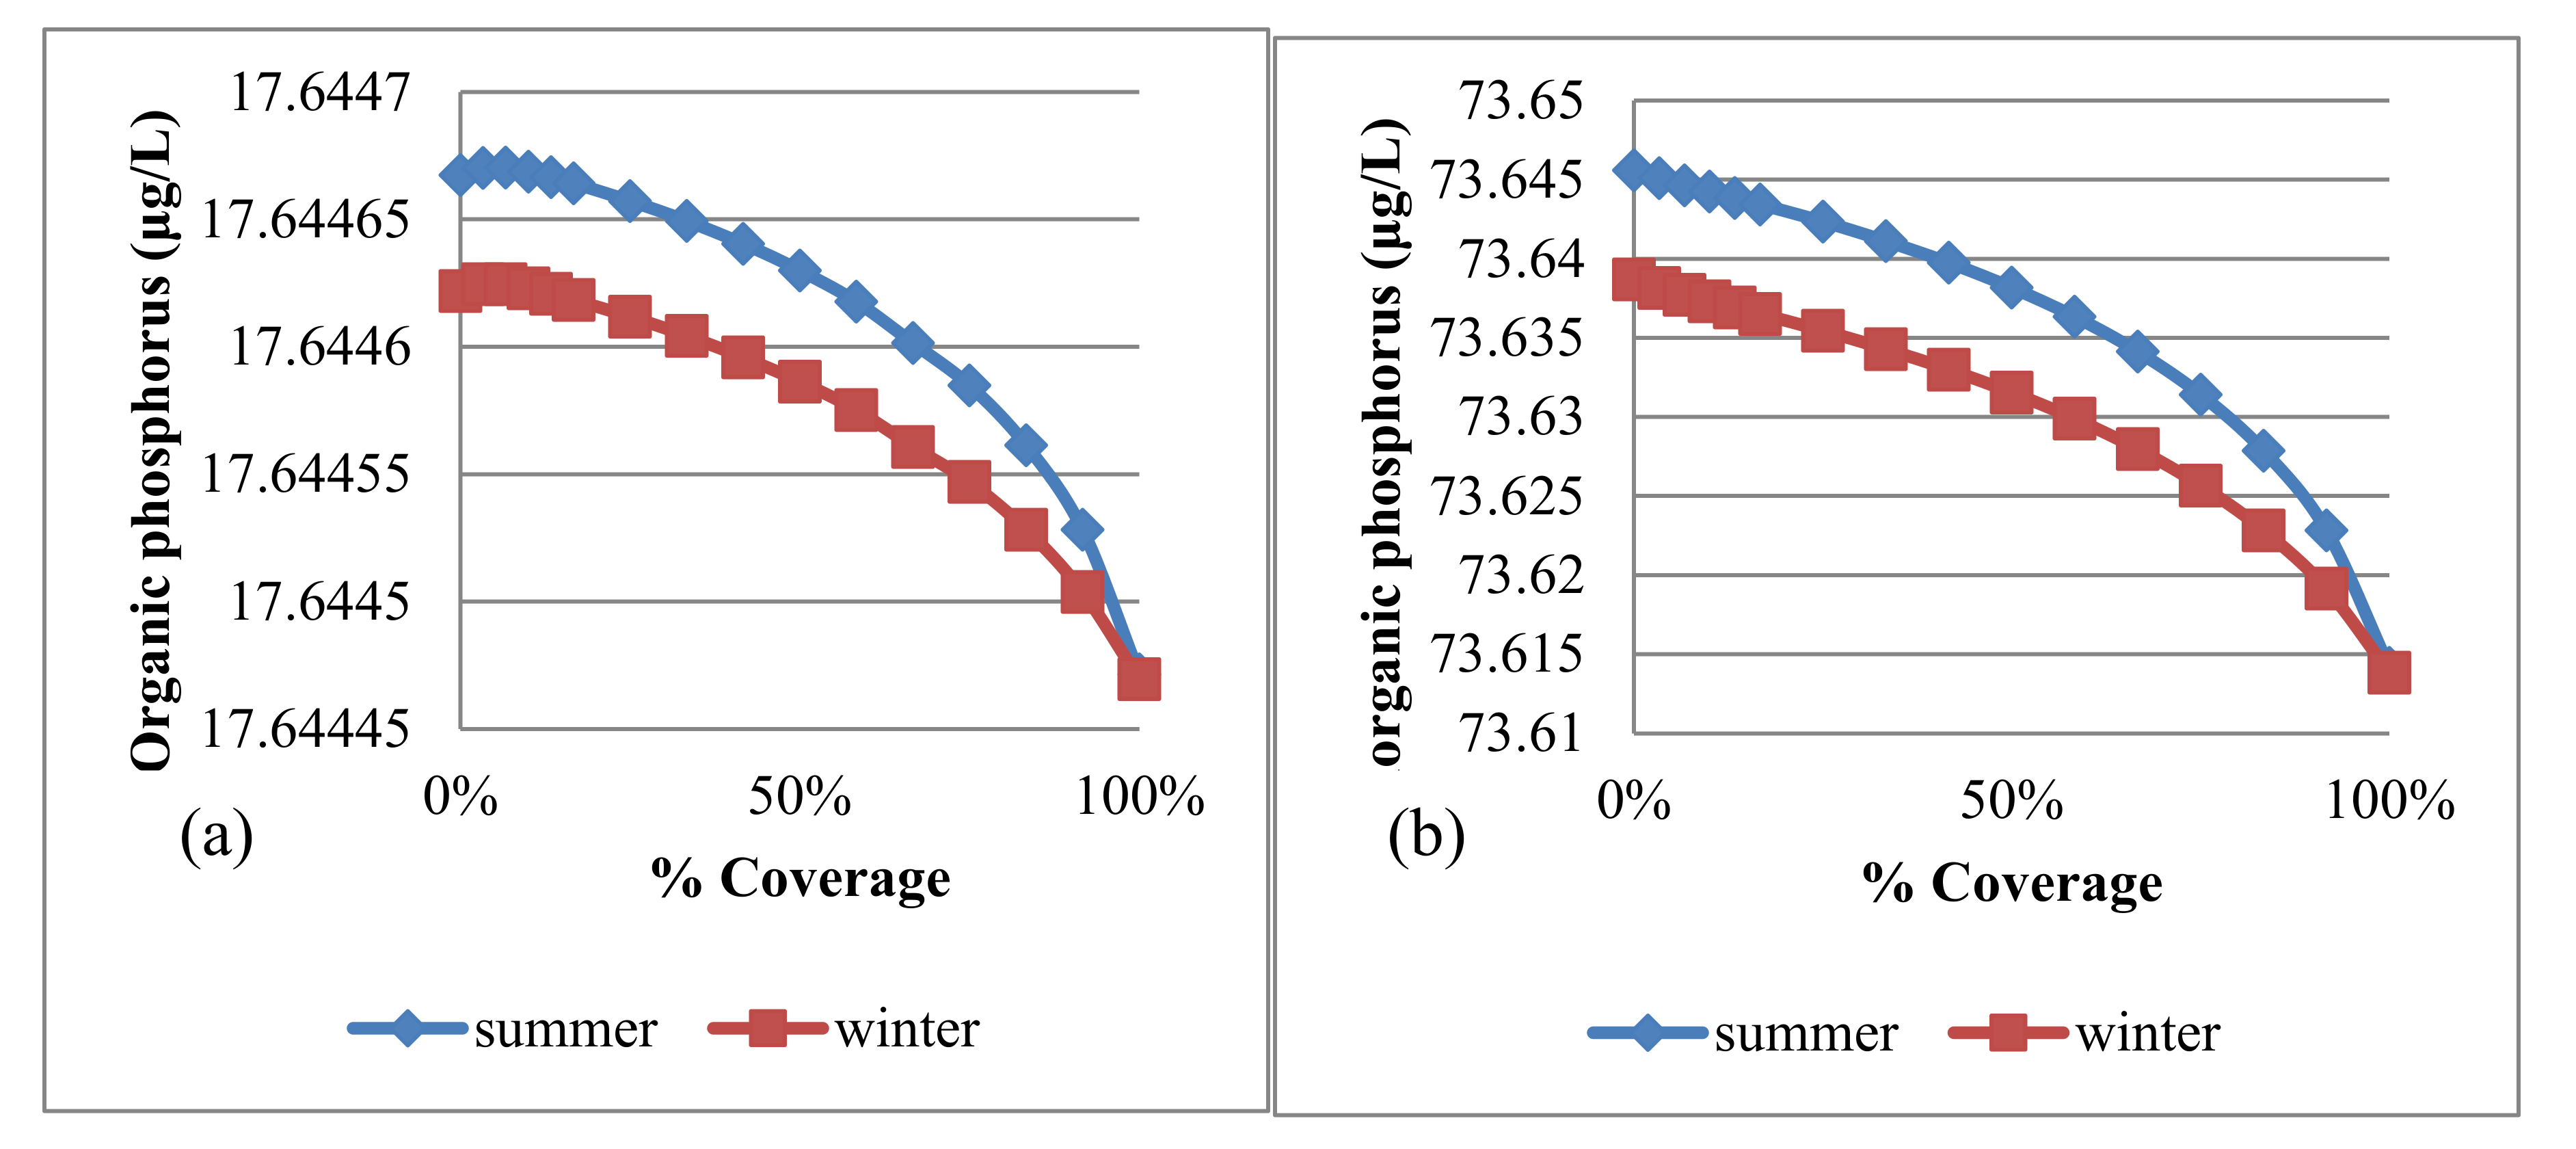
The organic and inorganic phosphorus results indicate that they are decreasing with increasing the coverage ratio, as shown in Figure 11. These results indicate that it acts the same way as algae. It thrives with light. The organic phosphorus almost does not change from summer to winter, it decreases from 17.65 to 17.64 μg/L. In addition, the inorganic phosphorus is not affected by temperature, as it decreases from 73.64 to 73.61 μg/L in the summer and winter. The phosphorus results seem to be less sensitive to coverage than algae.

4.3.3. pH and Alkalinity

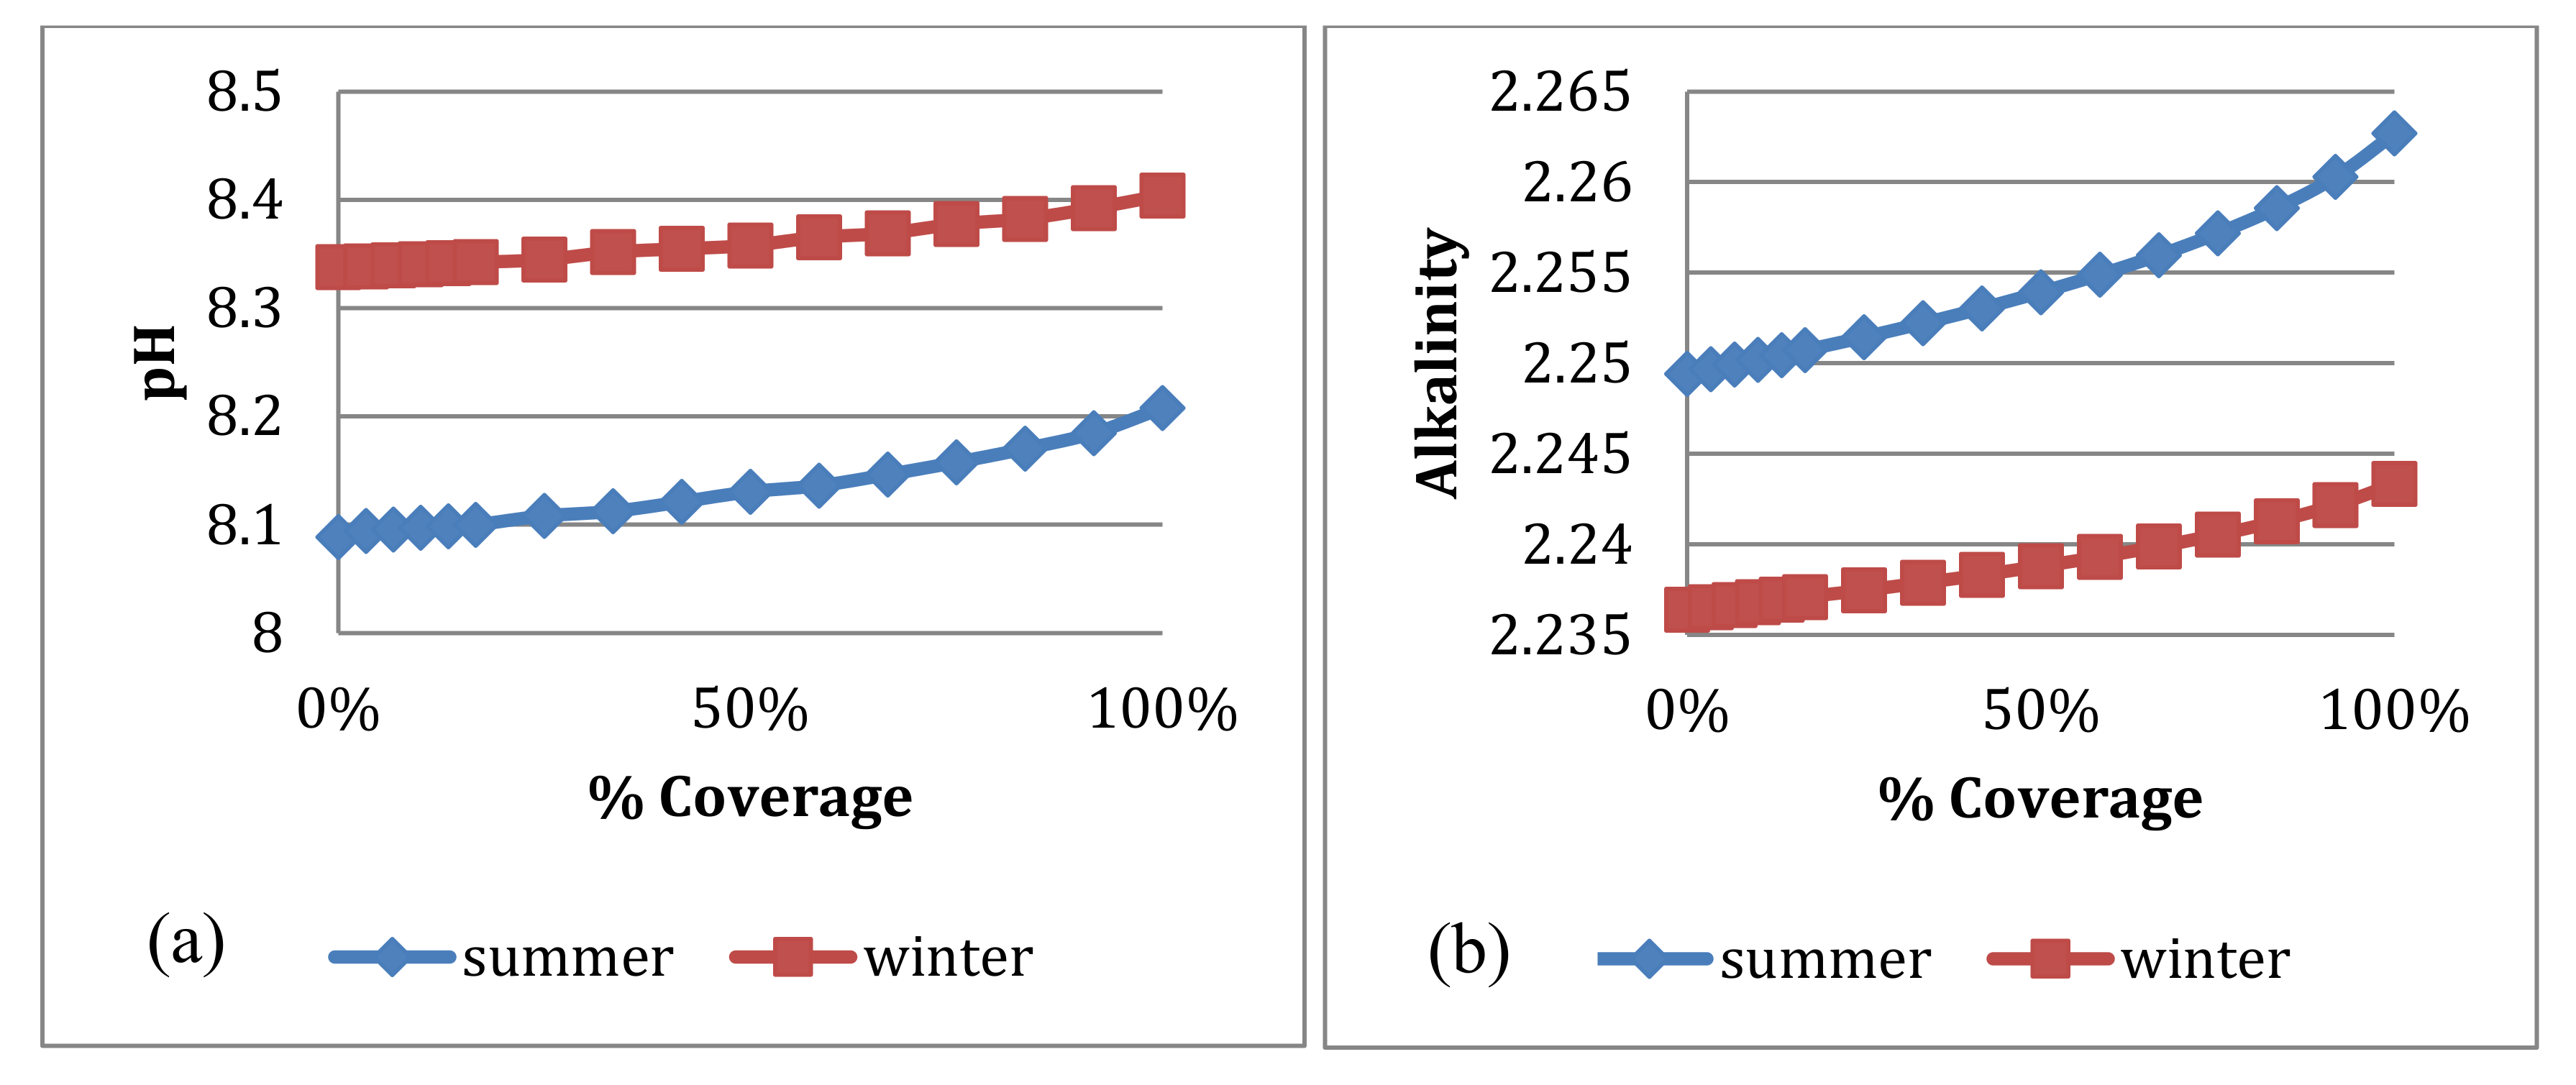
The pH results show a considerable difference between the summer and winter seasons, as shown in Figure 12. It is increasing with the increasing coverage percentage. The pH ranges between 8.089–8.21 in the summer, while in the winter, it ranges between 8.34–8.40. On the other hand, the alkalinity is slightly affected by the air temperature and solar radiation difference between summer and winter, as shown in Figure 12. The alkalinity ranges between 2.25–2.26 meq/L in the summer and 2.23–2.24 meq/L in the winter, yet it increases with increased covering.
The pH is directly influenced by the alkalinity of water, which in turn is influenced by the chemical and biological processes. Chemical processes are such as nitrification and de-nitrification, while biological processes, such as of algae, include photosynthesis, respiration, nitrogen uptake, and phosphorus uptake. By covering the canal, some processes will increase and others will decrease, so the resultant will make the alkalinity increase; as a result, the pH will also increase, as it depends on the alkalinity, as previously mentioned.

4.4. Optimized Canal Coverage

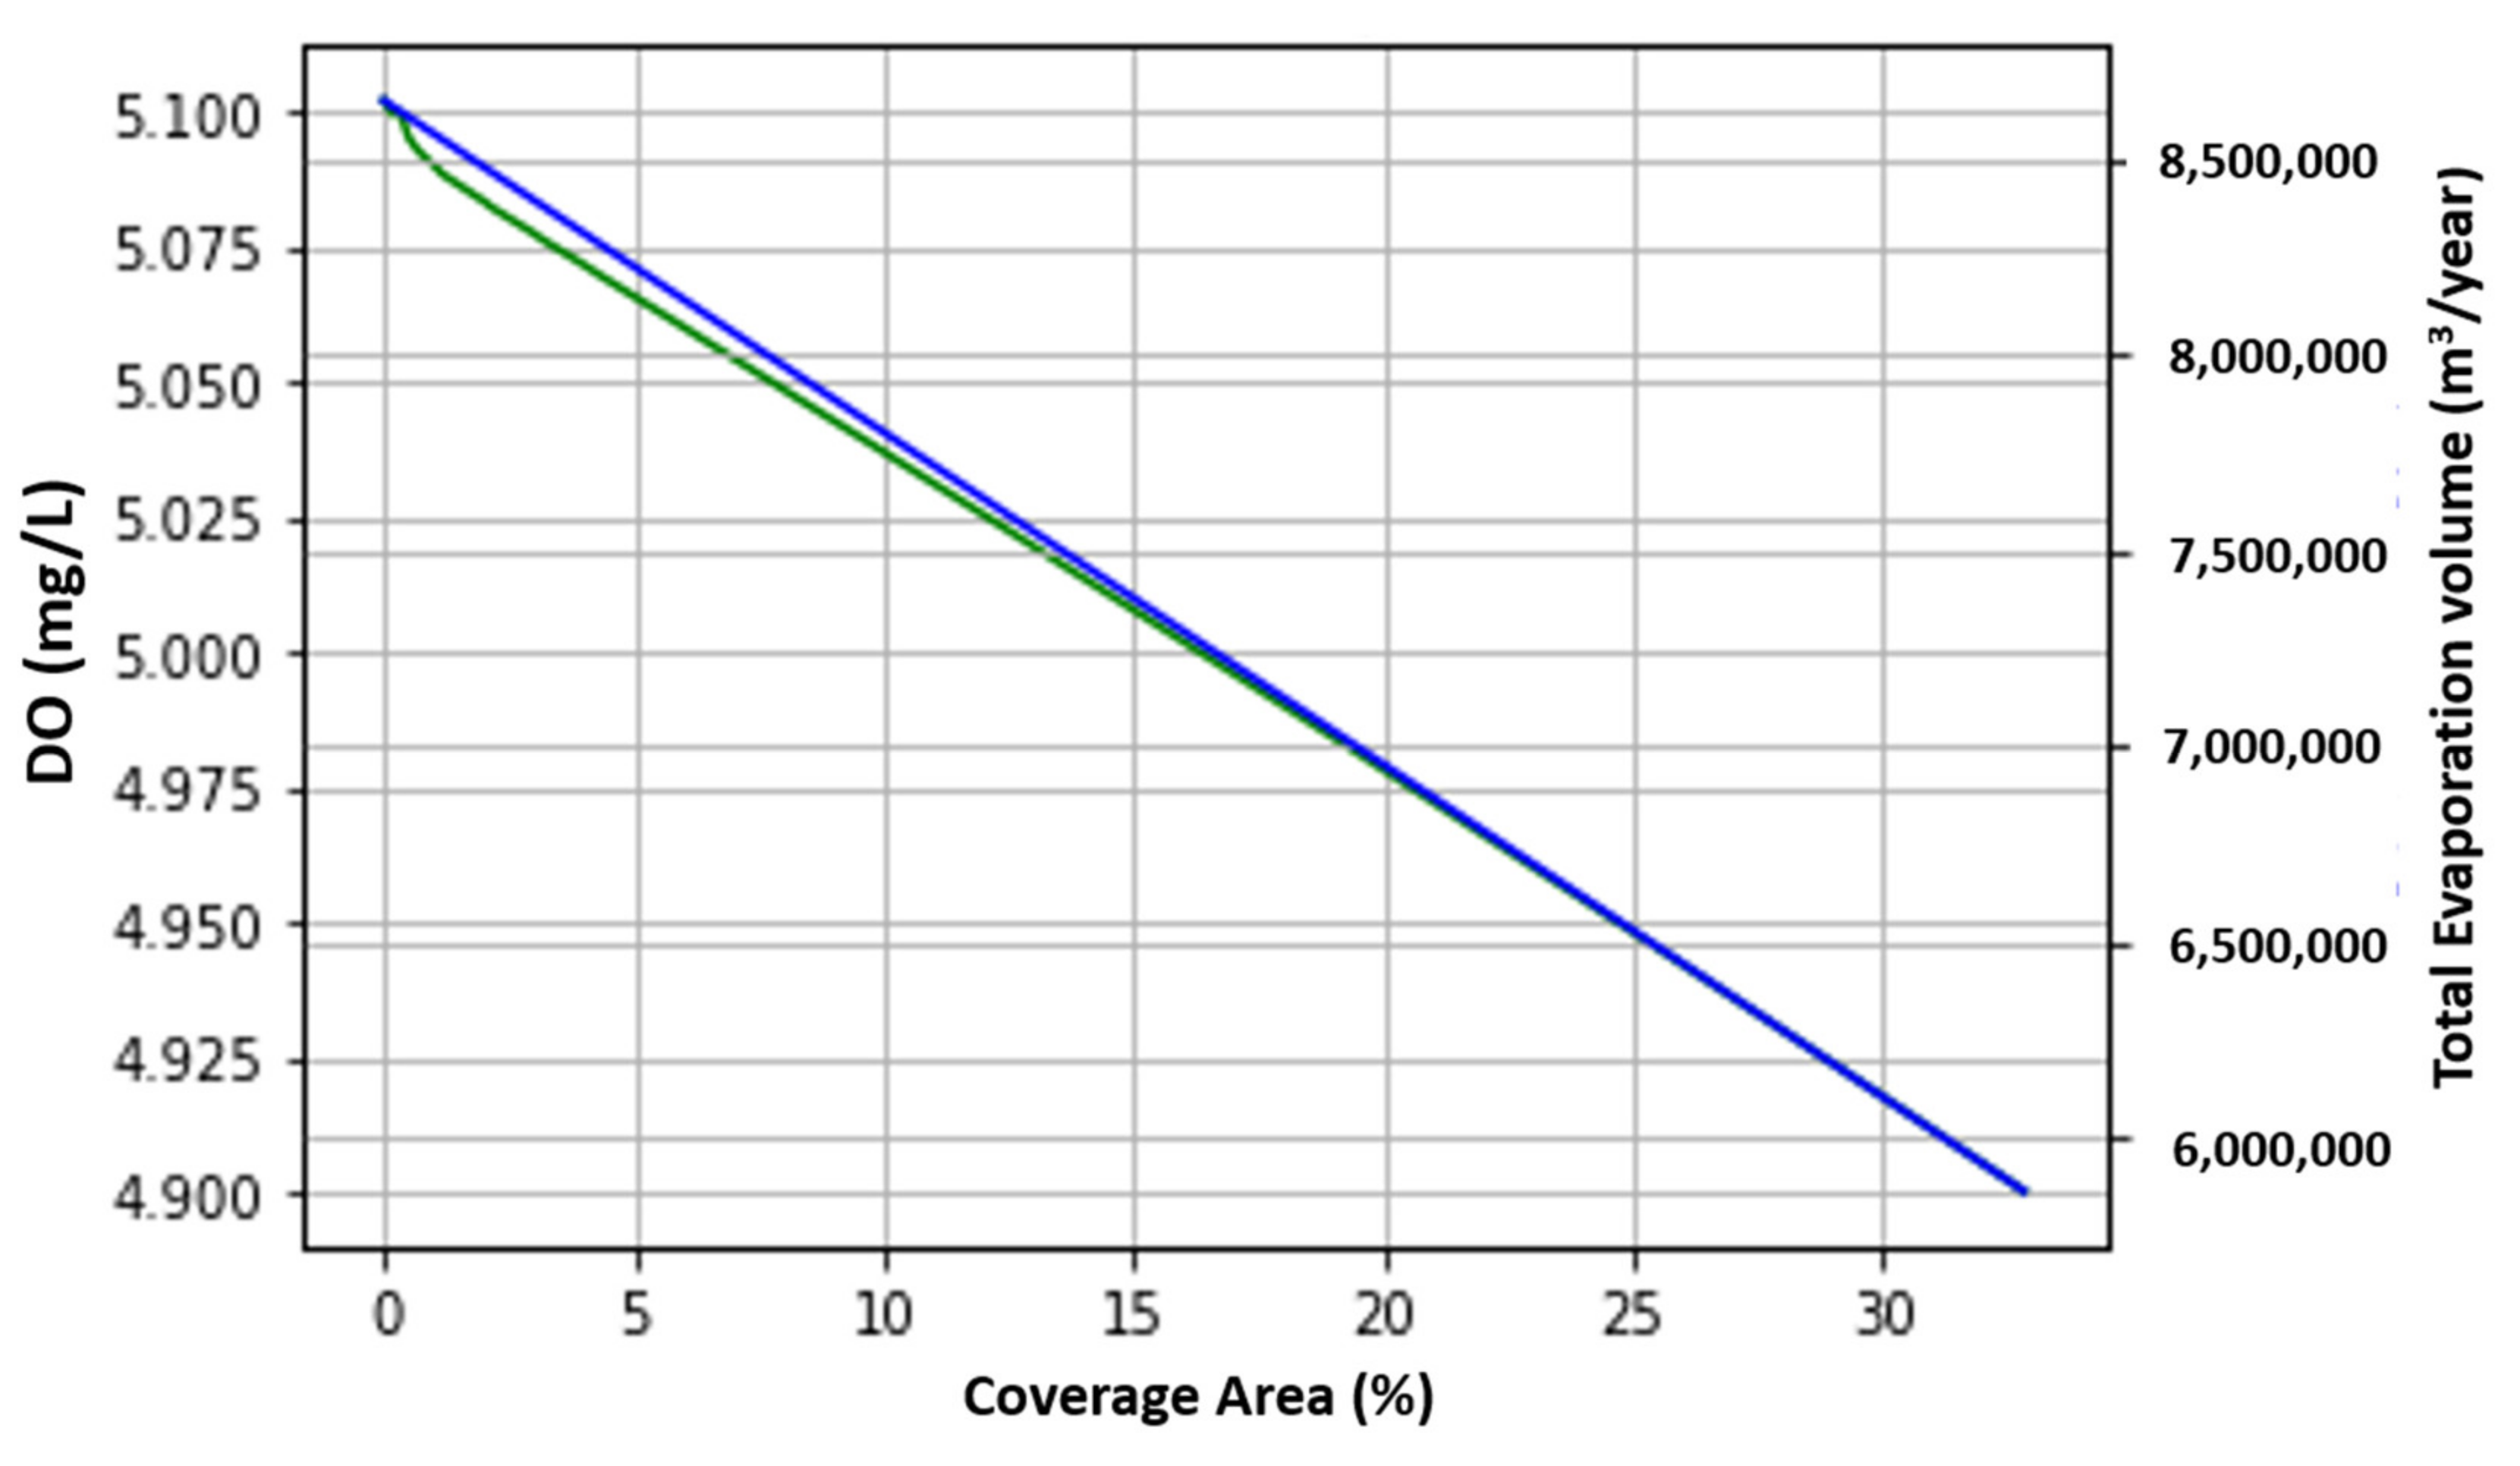
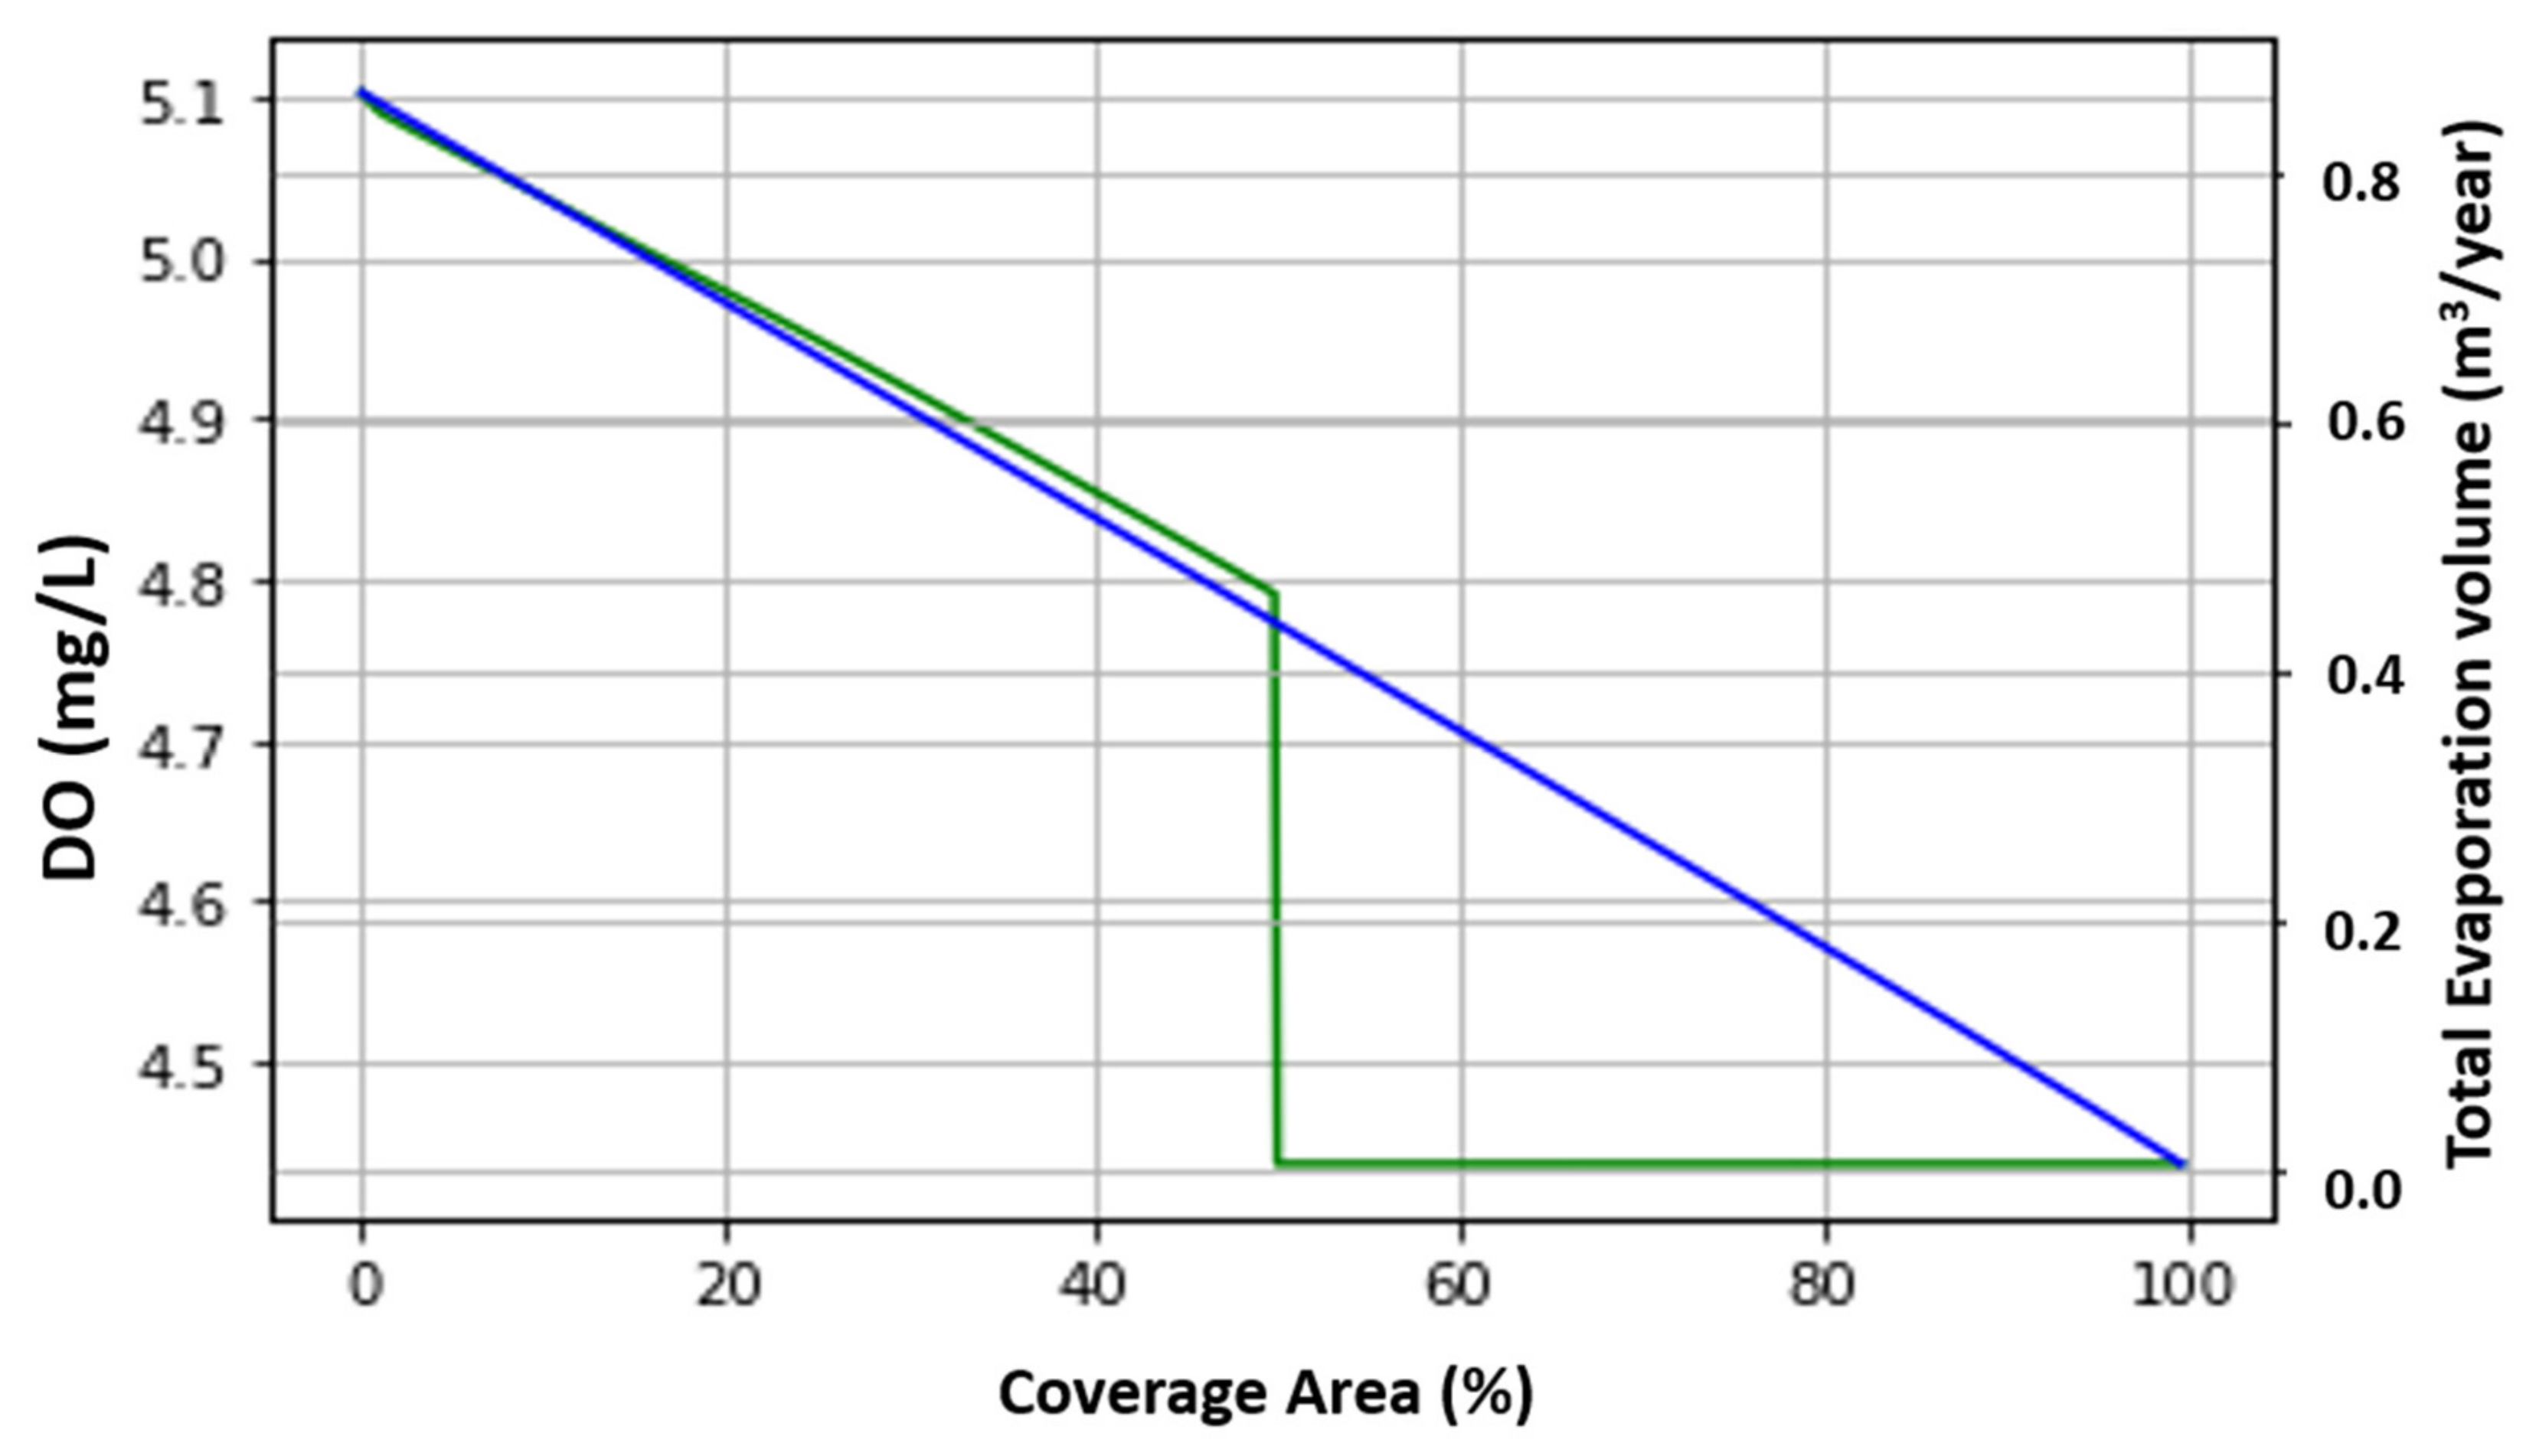
It could be noticed, from the water quality standards and water quality simulation results along the canal, that all water quality standards are met except the DO in summer. Thus, the optimization is mainly done to meet the DO concentration standards for irrigation and fresh water channels in the summer. The optimization results for covering for the two cases are summarized in Table 5. The table illustrates the initial values of DO and BOD, the applied condition at the end of the channel, the DO concentration at the end of the channel in case of covering, the evaporation volume in case of covering, the optimum covering percentage of the channel, and finally, the energy generation by solar panels. It is worth to mention that there is a 20% tolerance taken as a flexible margin for the optimization simulation to make the developed model more flexible. As it could be observed, the covering percentage by applying the condition for aquatic life is 32.8%, while for irrigation water, it is 50% of the channel. The solar energy generated by applying these covering percentages is 720,000 kWh/day in the winter and 1,350,000 kWh/day in the summer for fresh water, which is represented as case a in the table. For irrigation water, it is 1,080,000 kWh/day in the winter and 2,025,000 kWh/day in the summer, which represented as case b in the table.
Figure 13 and Figure 14 are showing the optimal coverage percentage which occurs at the intersection between the evaporation volume and the DO curves. If the optimum coverage is applied, a good water quality will be guaranteed at the end of the channel with the least evaporation losses.

5. Discussion

Some water quality parameters are greatly affected by covering canals, whereas others are slightly affected. DO and algae concentration seem to be highly affected by canal coverage. As a result, the nutrients and phosphorus are highly impacted, as they are influenced by algae concentration in water. In the case study of this research, the canal coverage will not harm some water quality variables such as algae, nutrients, phosphorus, pH, and alkalinity. They still are within the irrigation water standards and it will fit for irrigation purposes. But DO will be affected, so that an optimization is applied in order to attain the minimum evaporation and the maximum power generation under the condition of keeping water safe for irrigation and aquatic life. The optimum covering % for irrigation water is 50%, while for fresh water, it is 32.8%. The corresponding evaporation volume is 4,391,269 m3/year and 5,846,884 m3/year for irrigation and fresh waters, respectively. The average solar energy generated by covering is 1,035,000 kWh/day in irrigation water and 1,552,500 kWh/day in fresh water.

6. Conclusions

This research studies the effect of covering irrigation canals with solar panels on evaporation volume, as well as some of the major water quality parameters such as DO, algae, nutrients, pH, and alkalinity concentrations in water. The studied irrigation canal is the Sheikh Zayed canal which is in the Toshka area in Upper Egypt. Toshka is located in a very arid region. Thus, the evaporation rate as well as evaporation volume are very high. It could be concluded from the research that the evaporation volume without coverage is 8.64 million m3/year for the full length of the canal (50 km). By covering the canal, this huge amount of water that is lost in evaporation decreases and, hence, covering irrigation canals especially in arid areas like Toshka has a considerable impact on minimizing evaporation volumes, and it is more significant to cover the canal with solar cells, because this type of coverage will be able to produce power.
As mentioned before, although the drawn recommendations and general results of this research are general for any canal in the world, to get the exact simulated results and numbers, each canal case study has to be simulated alone to see the exact % covering of it. Therefore, the simulating technique is the same for any canal, but the numbers are going to be different from one canal to the other, depending on the size of the canal and its hydrologic and hydraulics conditions.
For future research, it is recommended that for larger scale water bodies that are supposed to be covered with solar panels, a water quality simulation should be done, in order to meet the water quality standards. As for these large water bodies, covering water will affect the quality of water more than the case study canal of this research. The same trends of increase and decrease in concentration of water quality parameters with covering are going to occur, but maybe the change in geometry will affect the changes in water quality parameters’ concentration values. This is especially true, if the limitations of the developed model are not applied such as the steady state condition n, the water in the water body is not well mixed vertically and literally, and if there are point sources of pollution on the water body.
In general, other water quality parameters, such as total dissolved solids, electric conductivity, and total suspended solids, could be studied and simulated in future researches.

Author Contributions

S.E.B. devised the research work, the main conceptual ideas, and proof outline. Both authors designed the model and the computational framework and S.E.B. analyzed the data and was responsible for the driven conclusions. M.A.S. performed the calculations and S.E.B. supervised and checked them. M.A.S. did the literature review. S.E.B. and M.A.S. wrote the manuscript with input from both authors. All authors have read and agreed to the published version of the manuscript.

Funding

The research is funded by Misr El Kheir Agency. The grant number is CIS-001-1819. Misr El Kheir Foundation (MEK) is an Egyptian non-profit development institution established in 2007 with the objective of developing the Egyptian individual in a comprehensive manner.

Acknowledgments

This research is part of a larger funded research titled “Irrigation canals covered with solar cells”.

Conflicts of Interest

The authors declare no conflict of interest. Also, the funders had no role in the design of the study; in the collection, analyses, or interpretation of data; in the writing of the manuscript, or in the decision to publish the results.

References

  1. IEA. International Energy Agency, World Energy Outlook; IEA: Paris, France, 2010; ISBN 978-92-64-08625-8. Available online: https://webstore.iea.org/world-energy-outlook-2010 (accessed on 10 March 2020).
  2. Shouman, E.R.; Khattab, N.M. Future economic of concentrating solar power (CSP) for electricity generation in Egypt. Renew. Sustain. Energy Rev. 2015, 41, 1119–1127. [Google Scholar] [CrossRef]
  3. WWAP. World Water Assessment Programme; UNESCO: Paris, France, 2018; Available online: http://www.unesco.org/new/en/natural-sciences/environment/water/wwap/ (accessed on 10 March 2020).
  4. Kumar, M.; Kumar, A. Experimental validation of performance and degradation study of canal-top photovoltaic system. Appl. Energy 2018, 243, 102–118. [Google Scholar] [CrossRef]
  5. Ranjbaran, P.; Yousefi, H.; Gharehpetian, G.B.; Astaraei, F.R. A review on floating photovoltaic (FPV)power generation units. Renew. Sustain. Energy Rev. 2018, 110, 332–347. [Google Scholar] [CrossRef]
  6. Trapani, K.; Redón Santafé, M. A review of floating photovoltaic installations: 2007–2013. Prog. Photovolt. Res. Appl. 2015, 23, 524–532. [Google Scholar] [CrossRef] [Green Version]
  7. Colmenar-Santos, A.; Buendia-Esparcia, Á.; de Palacio-Rodríguez, C.; Borge-Diez, D. Water canal use for the implementation and efficiency optimization of photovoltaic facilities: Tajo-Segura transfer scenario. Sol. Energy 2016, 126, 168–194. [Google Scholar] [CrossRef]
  8. Tina, G.M.; Cazzaniga, R.; Rosa-clot, M.; Rosa-clot, P. Geographic and technical floating. Therm. Sci. 2018, 22, 831–841. [Google Scholar] [CrossRef] [Green Version]
  9. Ferrer-Gisbert, C.; Ferrán-Gozálvez, J.J.; Redón-Santafé, M.; Ferrer-Gisbert, P.; Sánchez-Romero, F.J.; Torregrosa-Soler, J.B. A new photovoltaic floating cover system for water reservoirs. Renew. Energy 2013, 60, 63–70. [Google Scholar] [CrossRef] [Green Version]
  10. Santafé, M.; Soler, J.B.; Romero, F.J.; Gisbert, P.S.; Gozálvez, J.J.; Gisbert, C.M. Theoretical and experimental analysis of a floating photovoltaic cover for water irrigation reservoirs. Energy 2014, 67, 246–255. [Google Scholar] [CrossRef]
  11. El Baradei, S.A.; AlSadeq, M. Optimum coverage of irrigation canals to minimize evaporation and maximize dissolved oxygen concentration: Case study of Toshka. Egypt. Int. J. Environ. Sci. Technol. 2018, 16, 4223–4230. [Google Scholar] [CrossRef]
  12. Wahby, S.W. The Toshka project of Egypt: A multidisciplinary engineering education case study. In Proceedings of the American Society for Engineering Education Annual Conference & Exposition, Montreal, QC, Canada, 16–19 June 2002. [Google Scholar]
  13. Valiantzas, J.D. Simplified versions for the Penman evaporation equation using routine weather data. J. Hydrol. 2006, 331, 690–702. [Google Scholar] [CrossRef]
  14. Penman, H.L. Natural evaporation from open water, bare soil and grass. Proc. R. Soc. London A 1948, 193, 120–145. [Google Scholar] [CrossRef] [Green Version]
  15. Shuttleworth, J.W. Infiltration and soil water movement. In Handbook of Hydrology; Maidment, D.R., Ed.; McGraw-Hill: New York, NY, USA, 1992; pp. 4.1–4.53. [Google Scholar]
  16. Dingman, S.L. Physical Hydrology; Prentice Hall: Englewood Cliffs, NJ, USA, 1994; p. 646. [Google Scholar]
  17. Monteith, J.L. Evaporation and the Environment. In The State and Movement of Water in Living Organisms; Fogg, G.E., Ed.; Cambridge University Press: London, UK, 1965; pp. 205–234. [Google Scholar]
  18. WUO, Weather Underground Organization. 2018. Available online: www.wunderground.com (accessed on 15 February 2017).
  19. NASA, National Aeronautics and Space Administration, 2016. Available online: https://power.larc.nasa.gov (accessed on 17 February 2017).
  20. Egyptian Code for the Reuse of Treated Wastewater in the Agriculture Field; Code number ECP 501; National Research Center: Cairo, Egypt, 2005.
  21. Stiff, M.J.; Cartwright, N.G.; Crane, R.I. Environmental Quality Standards for Dissolved Oxygen; BS 12 4UD; National Rivers Authority Rivers House Waterside Drive Almonds bury Bristol: Almondsbury, UK, 1992. [Google Scholar]
  22. Streeter, H.W.; Phelps, E.B. A Study of the Pollution and Natural Purification of the Ohio River, Factors Concerned in the Phenomena of Oxidation and Reaeration; Public Health Bulletin no. 146; U.S. Department of Health, Education and Welfare, Public Health Service: Washington, DC, USA, 1958.
  23. Zhenli, H. Mechanisms and assessment of water eutrophication. J. Zhejiang Univ. 2008. [Google Scholar] [CrossRef]
  24. Hussian, A.M.; Napiórkowska-Krzebietke, A.; Toufeek, M.E.; Abd El-Monem, A.M.; Morsi, H.H. Phytoplankton response to changes of physicochemical variables in Lake Nasser. Egypt. J. Elem. 2015, 20, 855–871. [Google Scholar] [CrossRef]
  25. Chapra, S.C.; Pelletier, G.J. QUAL2K: A Modelling Framework for Simulating River and Stream Water Quality: Documentation and User’s Manual; Tufts University: Medford, MA, USA, 2003. [Google Scholar]
  26. Rutherford, J.C.; Scarsbrook, M.R.; Broekhuizen, N. Grazer control of stream algae: Modeling temperature and flood effects. J. Environ. Eng. 2000, 126, 331–339. [Google Scholar] [CrossRef] [Green Version]
  27. Michaelis, L.; Menten, M.L. Die Kinetik der Invertinwirkung. Biochem. Z. 1913, 49, 333–369. [Google Scholar]
  28. Ayers, R.S.; Westcot, D.W. Water Quality for Agriculture, FAO Irrigation and Drainage Paper; 29 Rev. 1; FAO: Rome, Italy, 1994. [Google Scholar]
  29. Chapra, S.C.; Pelletier, G.J.; Tao, H. QUAL2K: A Modelling Framework for Simulating River and Stream Water Quality; Version 2.11: Documentation and user’s manual; Tufts University: Medford, MA, USA, 2008. [Google Scholar]
  30. Chapra, S.C. Canale, Numerical Methods for Engineers, 4th ed.; McGraw-Hill: New York, NY, USA, 2002. [Google Scholar]
  31. Kuhlman, D. A Python Book: Beginning Python. Advanced Python Exercises. 2009. Available online: https://web.archive.org/web/20130513070515/http://cutter.rexx.com/~dkuhlman/python_book_01.txt (accessed on 12 September 2018).
  32. Appelo, C.A.J. Geochemistry, Groundwater and Pollution; A.A. Balkema: Rotterdam, The Netherlands, 1999. [Google Scholar]
  33. Toufeek, M.F.; Korium, M.A. Physicochemical characteristics of water quality in Lake Nasser water. National Institute of Oceanography and Fishier, Egypt. Glob. J. Environ. Res. 2009, 46, 141–148. [Google Scholar]
  34. Chapra, S.C. Surface Water Quality Modelling; McGraw-Hill: New York, NY, USA, 1997; pp. 393–396. ISBN 0-07-011364-5. [Google Scholar]
  35. Hadgu, L.T.; Nyadawa, M.O.; Mwangi, J.K.; Kibetu, P.M.; Mehari, B.B. Application of Water Quality Model QUAL2K to Model the Dispersion of Pollutants in River Ndarugu, Kenya. Comput. Water Energy Environ. Eng. 2014, 3, 162–169. [Google Scholar] [CrossRef] [Green Version]
  36. Fang, X.; Jianying Zhang, J.; Yingxu Chen, Y.; Xu, X. QUAL2K Model Used in the Water Quality Assessment of Qiantang River. China Water Environ. Res. 2008, 80, 2125–2133. [Google Scholar] [CrossRef] [PubMed]
  37. Radwan, M.; Willems, P. Sensitivity and uncertainty analysis for river water quality modelling. In Proceedings of the Eleventh International Water Technology Conference, IWTC11, Sharm El-Sheikh, Egypt, 1 December 2007. [Google Scholar] [CrossRef] [Green Version]
Figure 1. Location of Sheikh Zayed canal, its branches, and the pumping station on Lake Nasser in Upper Egypt governorate.
Water 12 02103 g001
Figure 2. Proposed pontoon solar platform.
Water 12 02103 g002
Figure 3. Control volume representing the mass balance equation.
Water 12 02103 g003
Figure 4. Evaporation volume in million m3/year versus percentage coverage of Sheikh Zayed Canal for the 50-km length of the Canal.
Water 12 02103 g004
Figure 5. Solar energy generation by solar panels vs. percentage coverage of Sheikh Zayed Canal for the 50-km length of the Canal.
Water 12 02103 g005
Figure 6. (a) and (b) The dissolved oxygen (DO) sag curve for the totally uncovered and totally covered cases in the summer.
Water 12 02103 g006
Figure 7. (a) and (b) The DO sag curve for the totally covered and totally uncovered cases in the winter.
Water 12 02103 g007
Figure 8. The DO concentration at the Canal end in the winter and summer versus percentage coverage for the 50-km length of the Canal.
Water 12 02103 g008
Figure 9. Algae concentration at the canal end in the winter and summer versus percentage coverage for the 50-km length of the Canal.
Water 12 02103 g009
Figure 10. (a) The organic nitrogen concentration at the Canal end in the winter and summer vs. percentage coverage for the 50-km length of the Canal, (b) the ammonia nitrogen concentration at the Canal end in the winter and summer vs. percentage coverage for the 50-km length of the Canal, and (c) the nitrate nitrogen concentrations at the canal end in the winter and summer vs. percentage coverage for the 50-km length of the Canal.
Water 12 02103 g010
Figure 11. (a) The organic phosphorus concentration at the canal end in the winter and summer vs. percentage coverage for the 50-km length of the Canal, (b) the inorganic phosphorus concentration at the canal end in the winter and summer vs. percentage coverage for the 50-km length of the Canal.
Water 12 02103 g011
Figure 12. (a) pH values at the canal end in the summer and winter vs. percentage coverage for the 50-km length of the Canal, (b) the alkalinity of water at the canal end in the summer and winter vs. percentage coverage for the 50-km length of the Canal.
Water 12 02103 g012
Figure 13. Case (a): The relation between covered area, DO, and evaporation volume by applying the condition of DO concentration of 5 mg/L.
Water 12 02103 g013
Figure 14. Case (b): The relation between no. of panels, DO, and evaporation volume by applying the condition of DO concentration of 4 mg/L.
Water 12 02103 g014
Table 1. Number of panel rows and corresponding covered and uncovered area, and % covering of the Canal.
Trial No.No. of Panel RowsUncovered Area (m2)Covered Area (m2)% Covering
002,700,00000%
110422,610,00090,0003%
220832,520,000180,0007%
331252,430,000270,00010%
441672,340,000360,00013%
552082,250,000450,00017%
678132,025,000675,00025%
710,4171,800,000900,00033%
813,0211,575,0001,125,00042%
915,6251,350,0001,350,00050%
1018,2291,125,0001,575,00058%
1120,833900,0001,800,00067%
1223,438675,0002,025,00075%
1326,042450,0002,250,00083%
1428,646225,0002,475,00092%
1531,25002,700,000100%
Table 2. Initial concentrations of the studied water quality variables.
Water Quality VariableInitial ValueUnit
DOsummer5.5mg/L
DOwinter8mg/L
BODsummer3mg/L
BODwinter2.8mg/L
ap6.338μg/L
no700μgN/L
na50.533μgN/L
nn469μgN/L
po18.15μgP/L
pi73.46μgP/L
pHsummer7.7
pHwinter8.85
Alkalinity2.24meq./L
Table 3. Water quality standards approved by the Food and Agriculture Organization (FAO).
ParameterValueunit
DOirrigation4mg/L
DOfreshwater5mg/L
Total Nitrogen5mg/L
Total Phosphorus0−2mg/L
pH6.5−8.4-
Table 4. Water quality variable validation results.
Water Quality variablesConstructed Model OutputsReference Value%Error
DO7.507.500.00
ap6.446.430.13
na54.2753.391.65
no469.27471.260.42
Pi73.6573.670.03
Po17.6418.042.19
pH6.506.621.86
Alk2.252.221.33
Table 5. Percentage covering results of the DO optimization.
Case #Initial ValuesConditionDO
(mg/L)
Evaporation (m3/year) Covering %Power Generation in Winter (kWh/day)Power Generation in Summer (kWh/day)
DO (mg/L)BOD (mg/L)
a5.535 ± 20%4.95,846,88432.8720,0001,350,000
b4 ± 20%4.794,391,269501,080,0002,025,000