Article

Spatiotemporal Variations in Drought and Wetness from 1965 to 2017 in China

1
Key Laboratory of Land Surface Pattern and Simulation, Institute of Geographic Sciences and Natural Resources Research, Chinese Academy of Sciences, Beijing 100101, China
2
College of Resource and Environment, University of Chinese Academy of Sciences, Beijing 100049, China
3
CAS Center for Excellence in Tibetan Plateau Earth Sciences, Chinese Academy of Sciences (CAS), Beijing 100101, China
4
Institute of Tibetan Plateau Research, Chinese Academy of Sciences, Beijing 100101, China
5
School of Land Science and Technology, China University of Geosciences, Beijing 100083, China
6
Beijing Key Laboratory of Urban Hydrological Cycle and Sponge City Technology, College of Water Sciences, Beijing Normal University, Beijing 100875, China
7
National Engineering Laboratory for Efficient Utilization of Soil and Fertilizer Resources, Key Laboratory of Agricultural Environment in Universities of Shandong, College of Resources and Environment, Shandong Agricultural University, Taian 271018, China
*
Authors to whom correspondence should be addressed.
Water 2020, 12(8), 2097; https://doi.org/10.3390/w12082097
Submission received: 21 June 2020 / Revised: 19 July 2020 / Accepted: 22 July 2020 / Published: 24 July 2020
(This article belongs to the Section Hydrology)

Abstract

:
Drought and extreme precipitation events can have major environmental and socioeconomic impacts. Yet, how drought and wetness are changing in China in the context of climate change is still under debate. Here, the standardized precipitation evapotranspiration index (SPEI) was calculated based on high-quality and more densely distributed daily meteorological observation data from 655 stations across China during the period of 1965–2017. National and regional trends in drought and wetness and their various characteristics, including intensity, duration, frequency, and percentage of area affected, were investigated at multiple timescales. We found that (1) China as a whole has undergone a significant (p < 0.01, trend significant at the level of 0.01) wetting trend, with an annual SPEI increase of 0.5 per decade from 1965 to 2017. A seasonal wetting trend was also observed, with summer being particularly significant (p < 0.01). (2) Regionally, each subregion also showed a wetting trend during the study period except for southwest China, and these wetting trends were significant in the western region of northwest China (p < 0.05, trend significant at the level of 0.05), the Tibetan Plateau (p < 0.05), and eastern China (p = 0.06). (3) Decadal trends in drought and wetness intensity, frequency, duration, and affected areas indicated that the drought events also became more severe and more frequent in the last two decades, and the areas showing drying trends were mainly located in southwest China (especially for the autumn drought) and the southwestern parts of eastern northwest China (spring drought). Our results highlight the fact that although a wetting trend was observed in most regions of China, the frequent occurrence of severe drought in southwest China and the southwestern parts of eastern northwest China still present a considerable threat to both the environment and society. Therefore, how to effectively coordinate the allocation of regional water resources to cope with drought risk under future climate change will be particularly important.

1. Introduction

Global warming coupled with intensifying human activities (e.g., water reservoir construction, urbanization, and deforestation) are expected to accelerate the global hydrological cycle [1,2], and thus alter the spatiotemporal patterns of precipitation, which in turn will result in an increased occurrence of extremes, including severe droughts or floods, in many regions of the world [3,4]. Droughts and floods have devastating impacts on regional agriculture, water resources, and the environment, with substantial ecological and social consequences [5]. They have been recognized around the world as the costliest natural disasters [6]. Therefore, it is particularly critical to analyze the variations in drought and wetness, given that they can provide the epistemological foundation for understanding drought and flood events and preparing for their consequences.
Like many other regions around the world, China has frequently experienced severe flood and short- or long-term drought events in recent years. For instance, an extremely severe drought struck Chongqing and Sichuan provinces (located in southwest China) during the summer of 2006, which devastated crops in more than 2.5 million hectares of farmland and caused 30% of these areas to be harvestless [7]. A flash drought during the summer of 2013 affected 13 provinces in southern China and damaged more than 2 million hectares of crops in Guizhou and Hunan provinces alone [8]. In parallel, 748 flooding events occurred in China from 2000 to 2008, which affected 783.83 million people, damaged 3.6 million houses, and destroyed more than 50 million hectares of crops [9]. The occurrence of these extremely severe drought and flood events in different regions of China and during different time periods is a real expression of climate variability, which is closely related to the long-term trends in drought and wetness. Yet, overall, whether China has become drier or wetter under global warming still remains elusive, as indicated by the apparently conflicting results from several recent studies. One viewpoint suggested that no obvious change has occurred in drought events and that there has even been a significant wetting trend across China. For example, Li et al. [10] evaluated the variations in drought by using satellite-based data in 10 basins covering the entire country for the growing seasons in the 1982–2005 period and found that the entire country was generally becoming wetter. Wang et al. [11] used the self-calibrating Palmer drought severity index to investigate the drought variations in China. Their results revealed that all of China has experienced a significant wetting trend at both annual and seasonal scales. Other researchers have suggested that drought in China has displayed a considerable increasing trend under climate change, a viewpoint that has been widely supported by other studies. For example, Wu et al. [12] reconstructed the history of drought in China by using daily soil moisture values. They found a significant increasing trend in drought-affected areas from 1951 to 2009, particularly in northern China. Zou et al. [13] revealed that most of northern China (except the western region of northwest China) has experienced unprecedented severe and prolonged dry periods since the late 1990s, based on the Palmer drought severity index (PDSI), whereas Xu et al. [14] concluded that the western part of the north China Plain had a significant drying trend based on the standardized precipitation index (SPI), the reconnaissance drought index, and the standardized precipitation evapotranspiration index (SPEI).
These discrepancies can be explained by their use of different drought indices and data sets to calculate the potential evapotranspiration (PET). Generally, different indices measuring drought can emphasize distinct factors; thus, using different climatic factors can lead to inconsistent results [11]. For instance, the SPI proposed by McKee et al. [15] has increasingly been used during the two last decades because of its simplicity and versatility in calculating drought analyses. However, a severe shortcoming of the SPI is that it is based only on precipitation data. In the context of global warming, drought indices should preferably include the dynamics of temperature [16]. The PDSI considers precipitation, temperature, PET, and even soil moisture data. Therefore, the PDSI may produce a more realistic result than the SPI. However, it lacks the multiscale character essential for differentiating various types of drought (e.g., meteorological, agricultural, hydrological, and socioeconomic drought) and analyzing the drought–wetness variations at seasonal timescales, which play an important role in managing agricultural production [17,18]. Therefore, the newly proposed drought index by Vicente-Serrano et al. [19], the SPEI, which combines the sensitivity of the PDSI with changes in the evaporation demand and the multitemporal nature of the SPI, is particularly appropriate for characterizing and accurately reflecting the drought conditions in the context of global climate change. Some studies have utilized the SPEI, in which the PET is calculated by the Thornthwaite equation, to analyze the variations and trends in drought across China [7]. The Thornthwaite equation calculates the PET based only on temperature data. However, it is well established that evaporation is a function of more than just temperature. Other factors, such as radiative and aerodynamic temperatures, also control evaporative demand [20]. Therefore, under global warming, the Thornthwaite equation may overestimate the impact of temperature, thus resulting in incorrect drought–wetness trends. A more accurate, comprehensive, and physically based model of PET calculation, the Penman–Monteith equation, has thus been increasingly accepted because it considers the radiative and aerodynamic controls.
To date, most previous studies using the SPEI have been focused mainly on revealing the annual drought–wetness variations in China [7,21]. Little attention has been paid to the seasonal trends in drought and wetness, which can reflect more important roles in regulating agricultural production [17,18]. To resolve these discrepancies and to provide an improved estimate of changes in drought and wetness in China over the past 53 years based on a better understanding of the physical mechanism underlying the occurrence of drought and wetness, we first analyzed the yearly and seasonal trends in the SPEI, in which the PET was calculated by the Penman–Monteith equation, at national and regional scales. We then investigated the changes and decadal trends in various drought–wetness characteristics, including the intensity, frequency, duration, and percentage of affected areas, from 1965 to 2017 with the aim of further improving our understanding of warming-induced drought and wetness changes in China.

2. Data and Methodology

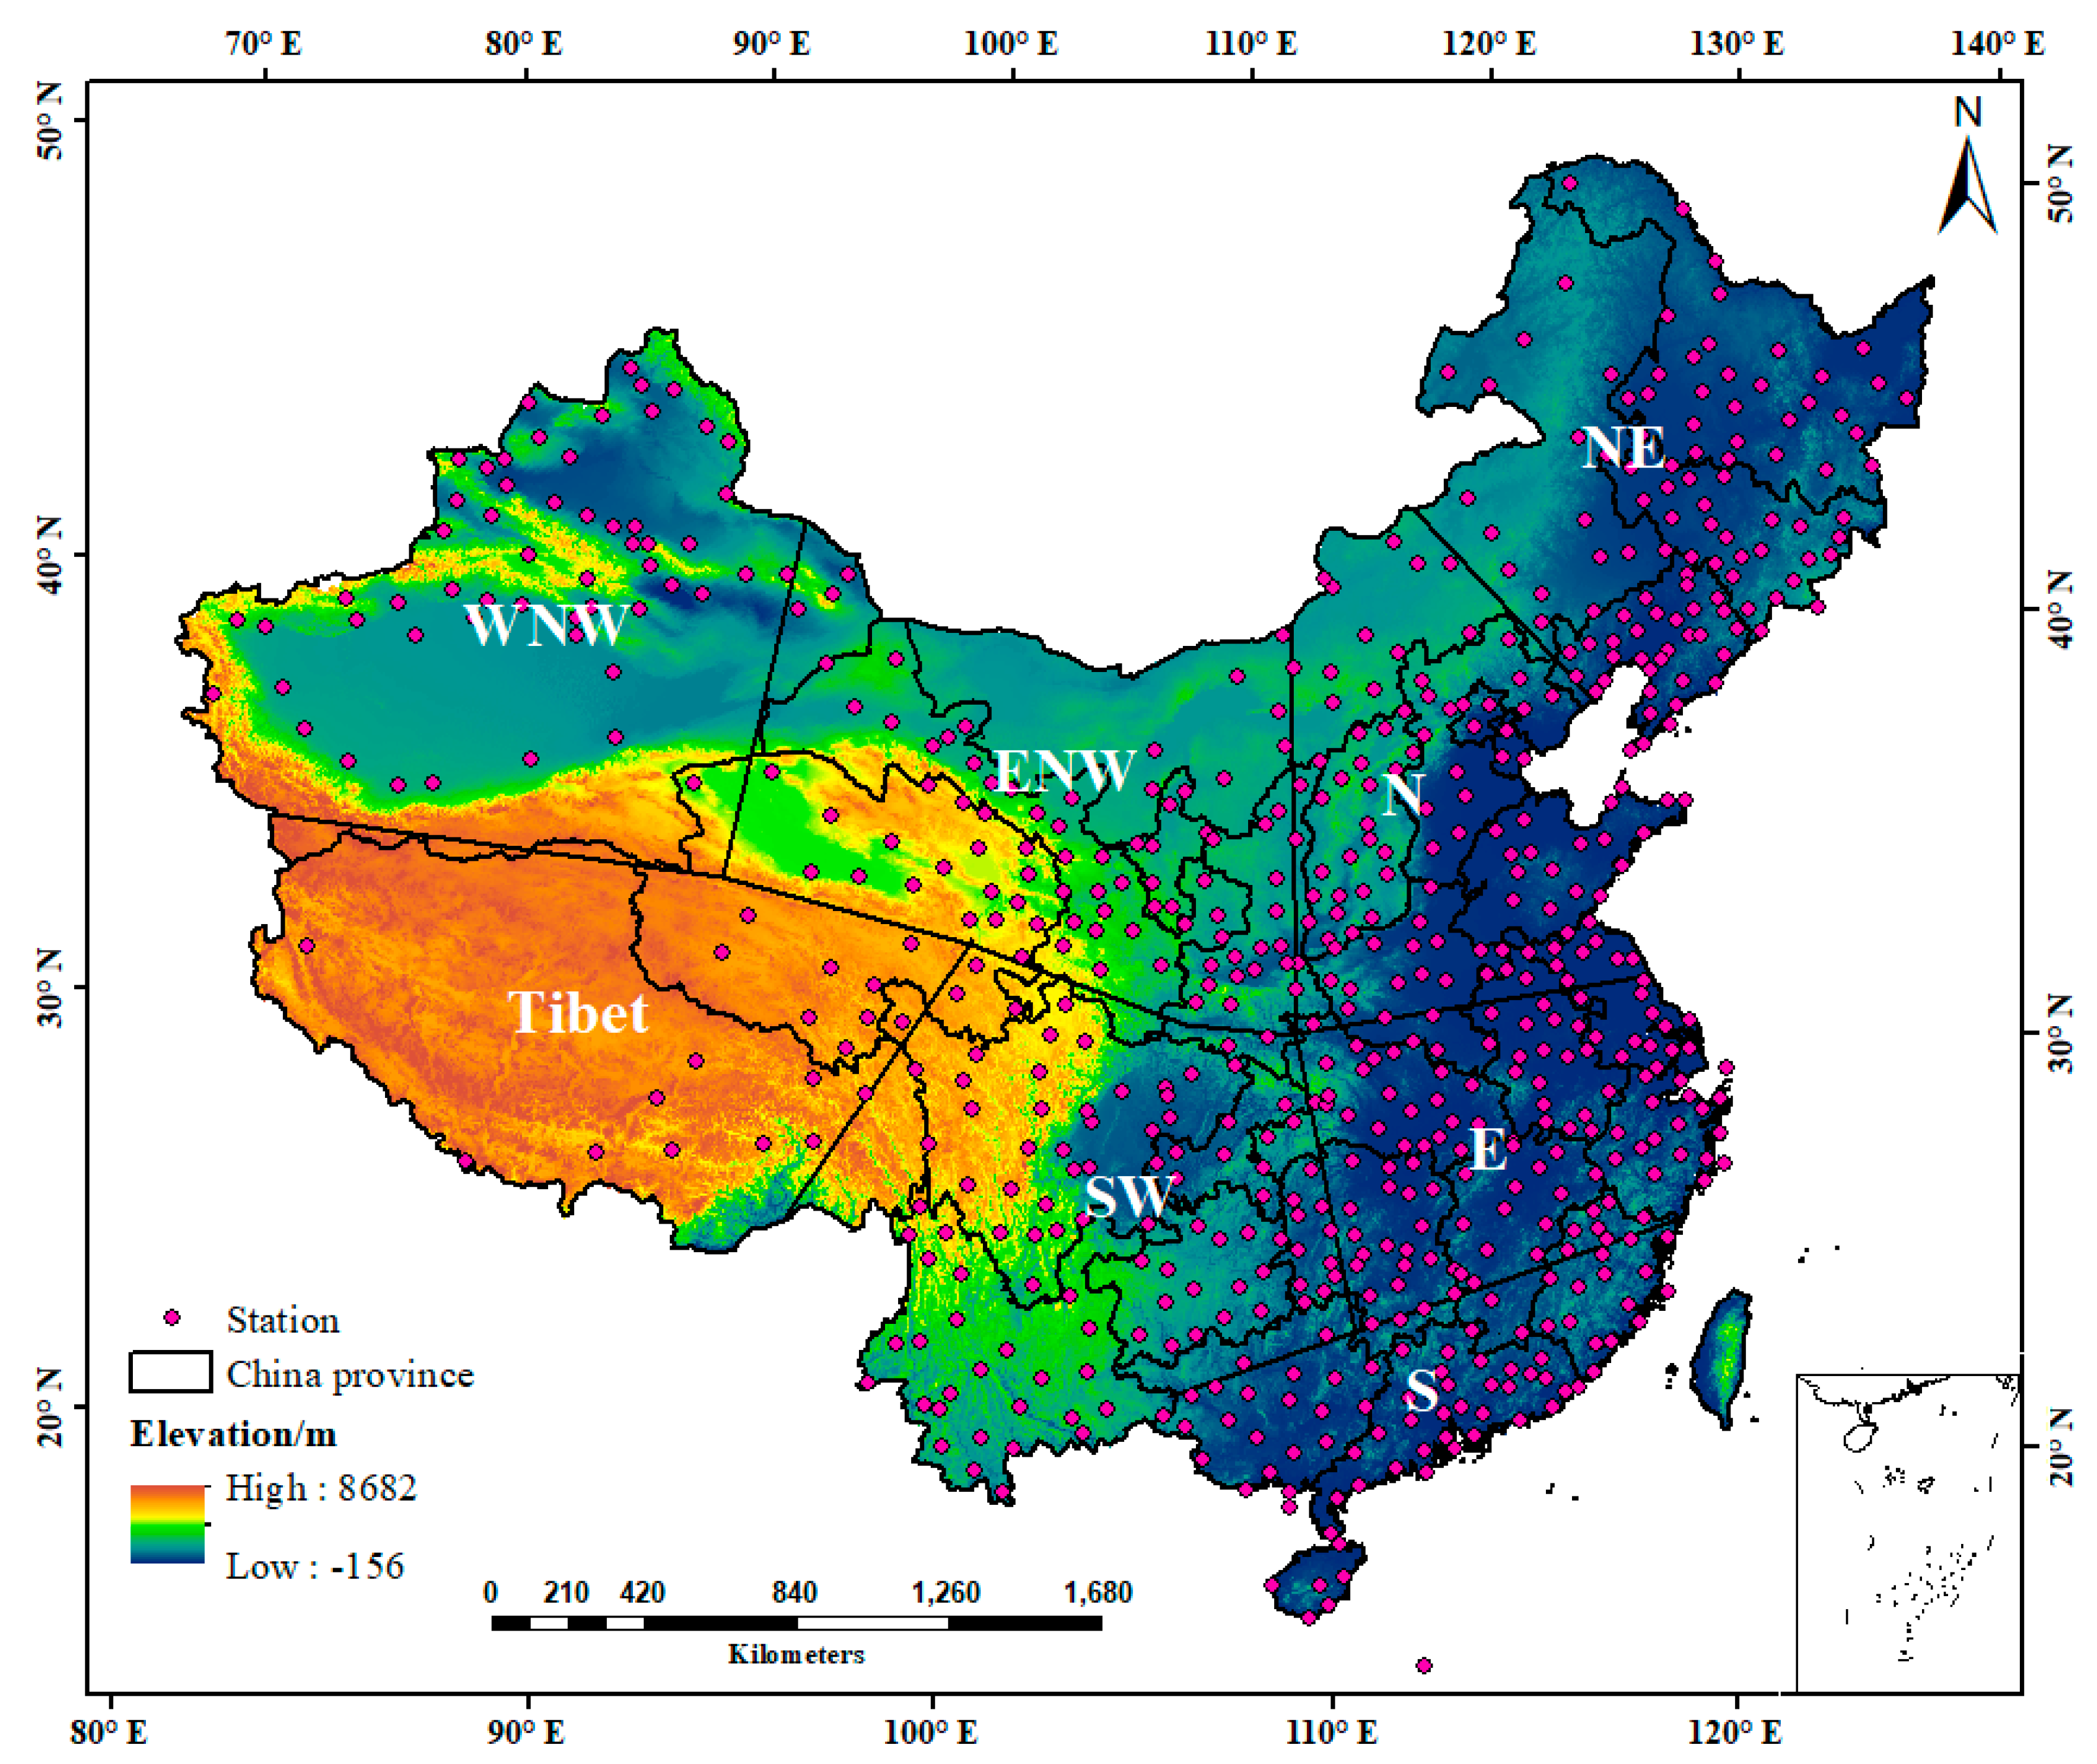
2.1. Study Area and Data

China is the third-largest country in the world, with a remarkable regional diversity of natural conditions. Temperature and precipitation are the critical factors influencing regional ecological systems, but the features of these regional ecological systems in China show an uneven distribution. Semi-humid and humid climates primarily prevail over the eastern part of China, with annual precipitation ranging from 800 to 2000 mm, whereas a dry climate generally dominates in the western and northern parts of China, with the annual precipitation ranging from 200 to 800 mm [13]. To explore the spatial pattern of drought and wet conditions in detail, we divided China into three parts: Southern China, northern China, and the Tibetan Plateau, according to previous articles [7,13]. As shown in Figure 1, southern China consists of southwest (SW), east (E), and south (S) China; northern China consists of northeast (NE), north (N), eastern northwest (ENW), and western northwest (WNW) China; and the Tibetan Plateau is marked as Tibet.
The daily ground-based meteorological observation data from 839 stations in China for the period from 1965 to 2017 were provided by the China Meteorological Administration (http://data.cma.cn), including the mean temperature, maximum temperature, minimum temperature, precipitation, relative humidity, hours of sunshine, and wind speed. Among the 839 stations, 655 stations with a few missing records (no more than 1% of the total data) were finally chosen for further calculations based on strict selection criteria, including the quality of the data, the continuity of the data, and the length of the records. The daily data were then integrated into a monthly scale for drought and wetness analyses, and the few missing data were filled in by the linear regression method. All the selected stations are displayed in Figure 1.

2.2. Calculation of PET

The Penman–Monteith equation has been successfully applied at scales from a single basin to all of China [22,23,24], as recommended by the Food and Agriculture Organization of the United Nations in 1998 [25]. This model integrates the mass transfer and energy balance while considering the physiological characteristics of vegetation that are valid in both humid and arid climates; it is thus widely used around the world. The following equation was used to calculate the PET at the 655 observation stations:
ET = 0.408 Δ ( R n G ) + γ ( 900 T mean + 273 ) U 2 ( e s e a ) Δ + γ ( 1 + 0.34 U 2 ) ,
where PET is the potential evapotranspiration (mm·day−1); R n is the net radiation at the reference crop surface (MJ·m−2·day−1); G is the soil heat flux density (MJ·m−2·day−1); T mean is the mean air temperature at a height of 2 m (°C); U 2 is the wind speed at a height of 2 m (m·s−1); e s is the saturation water vapor pressure (kPa); e a is the actual water vapor pressure (kPa); Δ is the slope of the vapor pressure curve (kPa·°C−1); and γ is the psychometric constant (kPa·°C−1). The net radiation was estimated by using the sunshine hours and the maximum and minimum air temperature data. Detailed equations for R n , G , e s , Δ , and γ can be found in the study by [25].

2.3. Calculation of SPEI

The SPEI was calculated based on the degree of deviation from dry and wet conditions by standardizing the difference between precipitation and the PET. This method revealed that a decreasing SPEI may be caused by an abnormal decrease in precipitation, an increase in the PET, or both. The calculation of SPEI can be briefly described as follows:
The monthly difference between the precipitation and the PET is calculated by:
D j = P j PET j ,
where P j is the total precipitation in month j (mm) and PET j is the total PET in month j (mm).
The accumulated difference between precipitation and the PET at different timescales (3 and 12 months) was calculated. The accumulated difference ( X i , j k ) in a given month j and year i depends on the chosen timescale k . For example, the accumulated difference for one month in a particular year i at the 12-month timescale is calculated by using:
X i , j k = l = 13 k + j 12 D i 1 , l + l = 1 j D i , l      if   j < k , X i , j k = l = j k + 1 j D i , l      if   j k ,
where D i , l (mm) is the p − PET difference in the first month of year i .
The X i , j k data sequence is normalized into a log-logistic probability distribution to obtain the SPEI index series. The SPEI uses the three-parameter log-logistic probability distribution suggested by Vicente-Serrano et al. [19]. For the data sequence of all timescales, the cumulative function of the log-logistic probability distribution F(X) is:
F ( X ) = [ 1 + ( α X γ ) β ] 1 ,
where α , β , and γ are the scale, shape, and origin parameters, respectively.
The SPEI can thus be obtained as the standardized values of F ( X ) . P is the probability of a defined X i , j k value:
SPEI = W C 0 + C 1 W + C 2 W 2 1 + d 1 W + d 2 W 2 + d 3 W 3 ,
where W = 2 ln ( P ) for P ≤ 0.5 and P = 1 − F ( X ) . If P > 0.5, then P is replaced by 1 − P and the sign of the resultant SPEI is reversed. The constants are as follows: C 0 = 2.515517, C 1 = 0.802853, C 2 = 0.010328, d 1 = 1.432788, d 2 = 0.189269, and d 3 = 0.001308. The categorization of wetness/dryness severity by the SPEI is shown in Table 1, in which the more positive the SPEI value, the more severe the wetness, and vice versa. In addition, because the SPEI has different implications at different timescale, 12-month SPEI was calculated for the annual trend and annual affected area analysis, and 3-month SPEI was calculated for the seasonal trend, seasonal affected area, and drought/wet characteristics analysis.

2.4. Mann–Kendall Trend Test for Trend Analysis

The Mann–Kendall test is a rank-based nonparametric method for assessing the significance of a trend, and it has been widely used for the analysis of hydrological and meteorological trends [26,27]. Because the Mann–Kendall method does not require any assumptions regarding the distribution of data, it is highly recommended for general use by the World Meteorological Organization. The following procedures were used to calculate the statistical value of S and the standardized test statistic Z:
S = i = 1 n 1 j = i + 1 n s g n ( x j x i ) ,
where n is the number of observations, and x i and x j are the values of years i and j in the time series, and:
s g n ( x j x i ) = { 1    if   ( x j x i ) > 0 0    if   ( x j x i ) = 0 1   if   ( x j x i ) < 0 ,
Var ( S ) = n ( n 1 ) ( 2 n + 5 ) i = 1 m t i ( t i 1 ) ( 2 t i + 5 ) 18 ,
where m is the number of tied groups, t i is the number of data values in the pth group, and:
Z = { S 1 Var ( S )   i f   S > 0 0         i f   S = 0 S + 1 Var ( S )   i f   S < 0 ,
where the Z value is used to evaluate the statistical trend of the time series data, such that if Z < 0, the data show a decreasing trend, and vice versa. If | Z | > Z ( 1 a / 2 ) , the null hypothesis is rejected at a given confidence level a . In other words, there is a significant trend in the time series data. An absolute Z value of the MK test exceeding 1.64, 1.96, and 2.58 indicated that the factors to be tested have a significant change trend at the 90%, 95%, and 99% confidence level, respectively.

2.5. Defining the Drought/Wet Characteristics

To examine yearly or seasonal drought–wetness characteristics, three different parameters were identified according to [21,28]: (1) Frequency, the ratio of the occurrences of drought (SPEI < −1), or wetness (SPEI > 1) to the total number of months during each study period; (2) duration, the longest number of consecutive months with SPEI less than −1 (drought duration) or more than 1 (wetness duration); and (3) intensity, the average SPEI value for a drought (SPEI < −1) or wet (SPEI > 1) event. The seasonal scale was divided into spring (March–May), summer (June–August), autumn (September–November), and winter (December–February). In addition, to provide a complete picture of how the drought and wetness characteristics have changed over the last 53 years, we split the time into five decadal intervals: 1965–1974, 1975–1984, 1985–1994, 1995–2004, and 2005–2017. The linear trends in decadal drought–wetness characteristics were also explored in each station. In addition, for the temporal variations in the annual and seasonal drought- or wetness-affected areas analyzed, time series of the annual and seasonal SPEI were interpolated into the 1-km grid scale by using the inverse distance weighting method from 1965 to 2017, and the percentage of drought- or wetness-affected areas for all study areas was calculated based on the ratio of the number of grid points with SPEI less than −1 (drought) or SPEI greater than 1 (wetness) to the total number of grid points. Furthermore, because of the lack of data in western Tibet and western Inner Mongolia, these two regions were removed before interpolation to reduce error.

3. Results

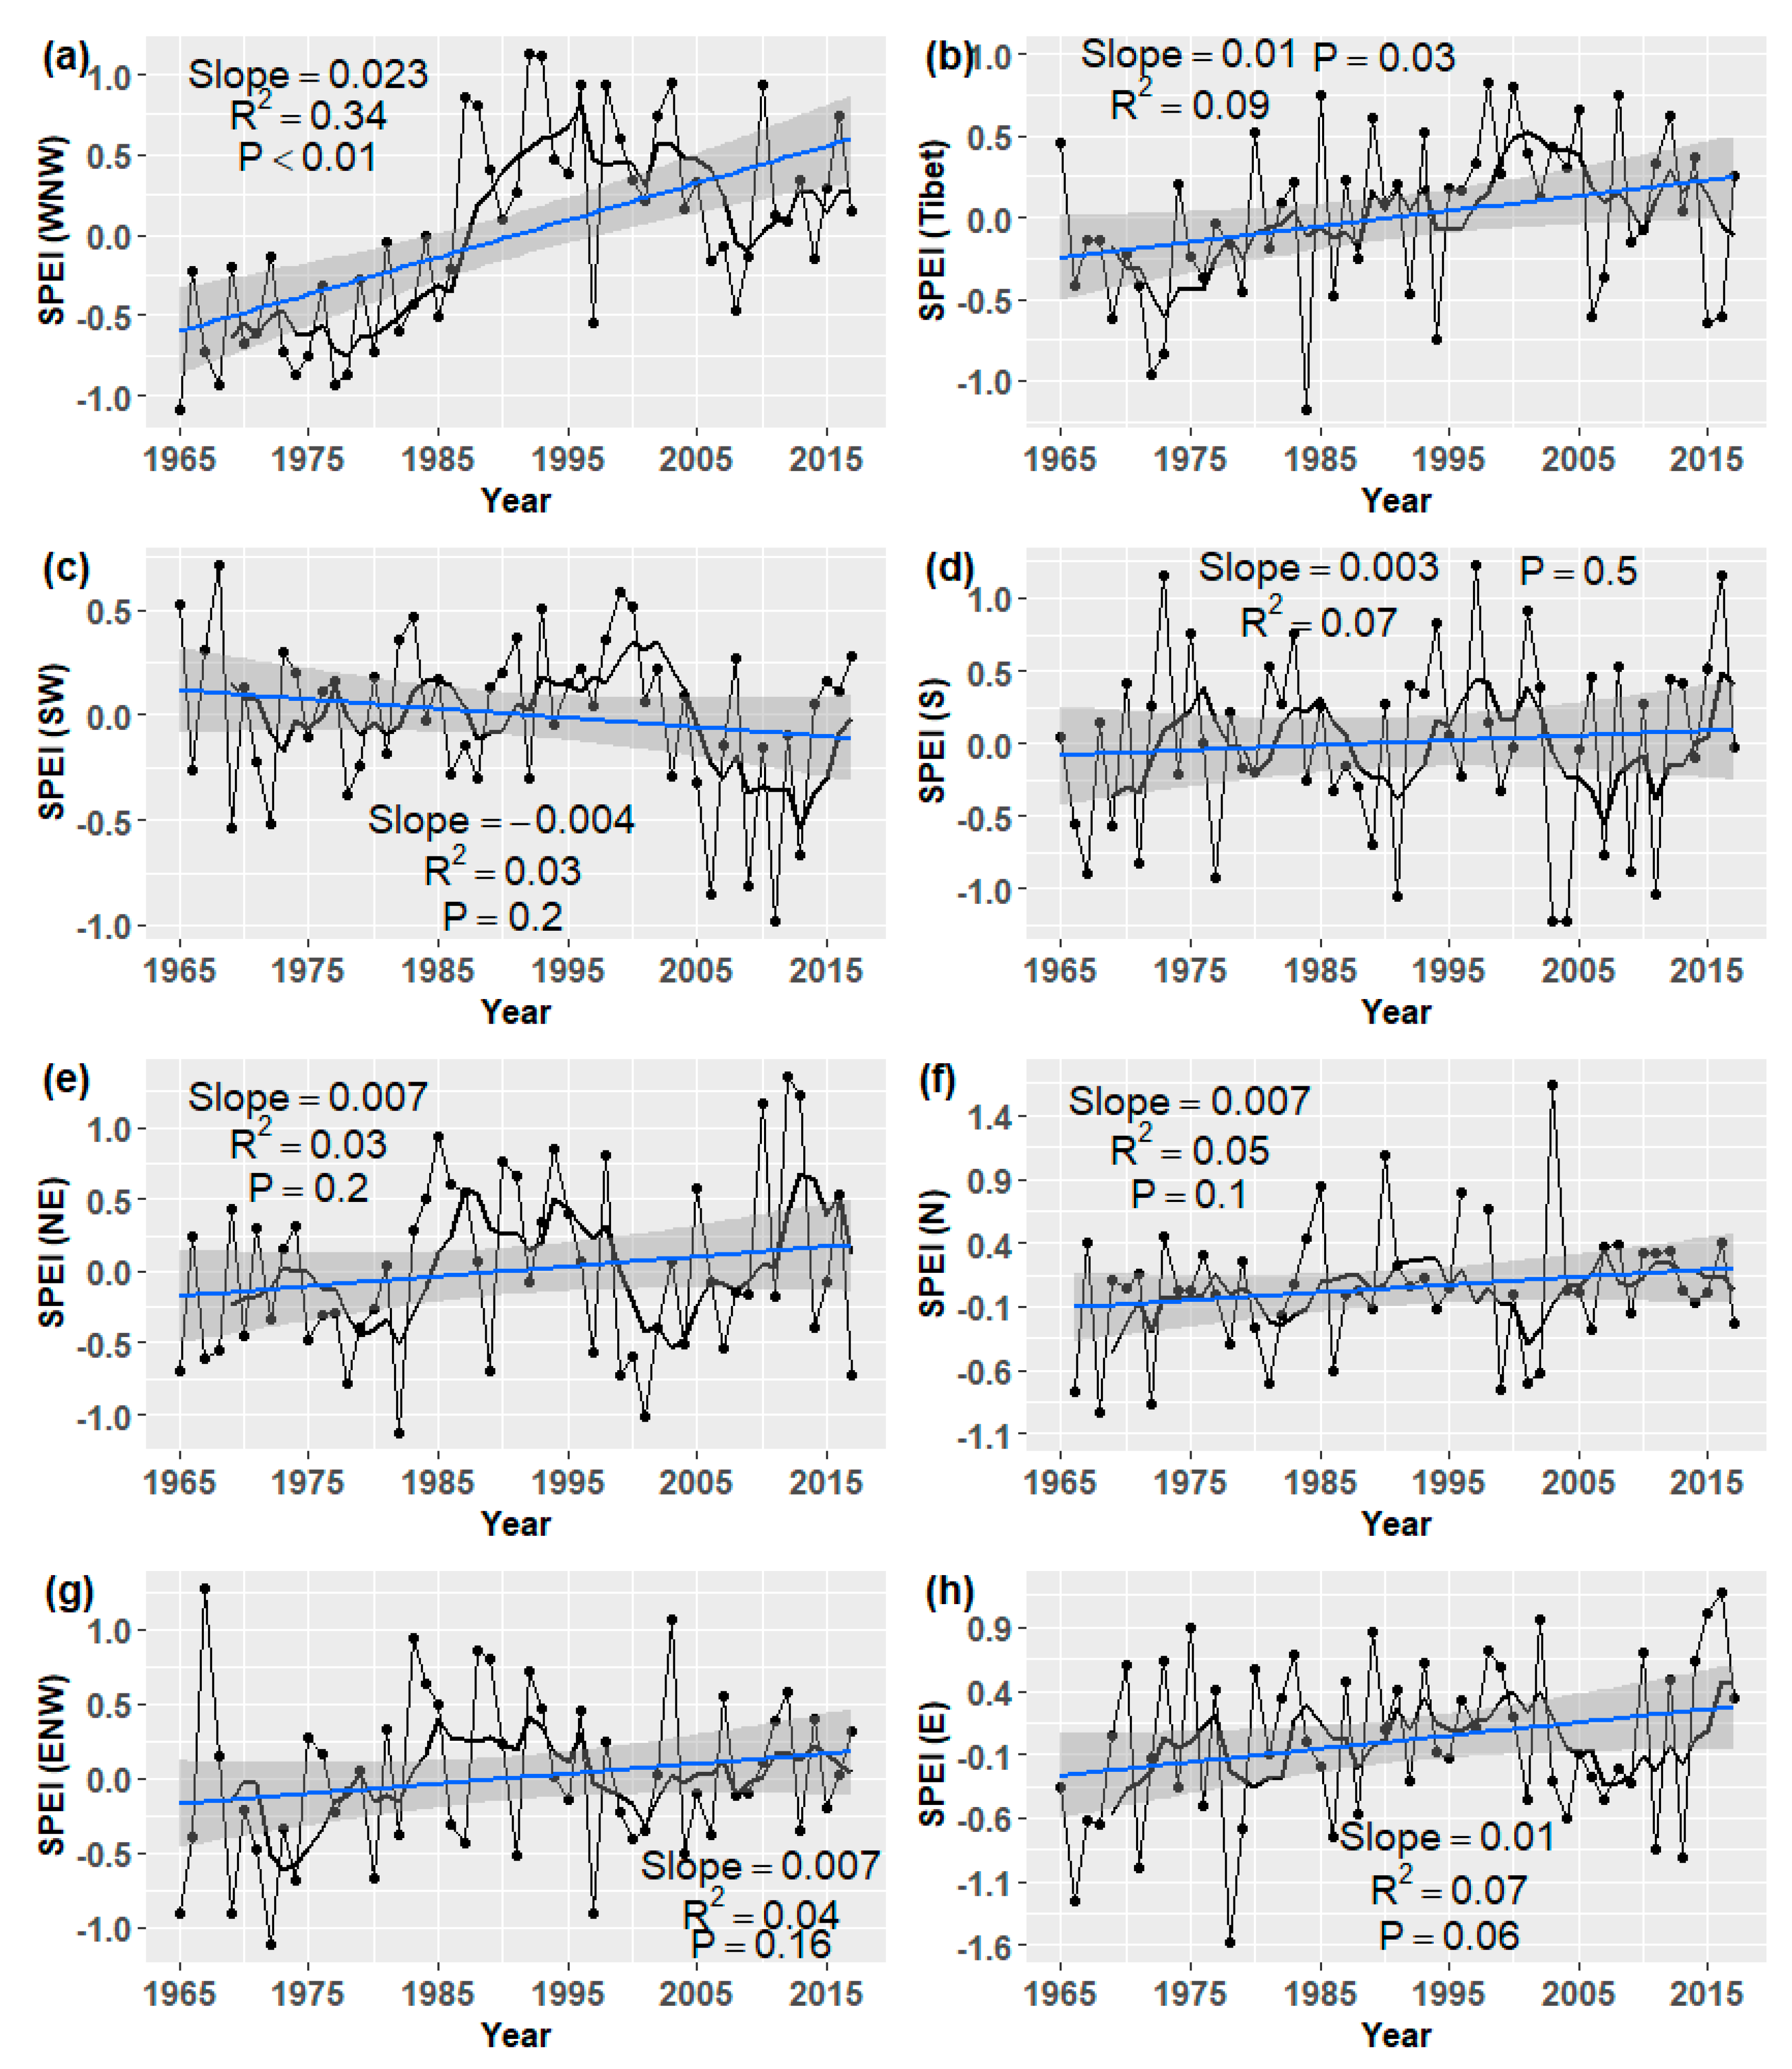
3.1. Spatial and Temporal Patterns of Annual Trends in SPEI and its Climatic Driving Factors

For the entire study time series, annual precipitation showed a statistically nonsignificant (p > 0.05) increase, by 7.7 mm per decade (Figure 2a). The Tmean showed a significant (p < 0.01) increasing trend of 0.3 °C per decade during the period from 1965 to 2017 (Figure 2b). Potential evapotranspiration decreased (p < 0.01) continuously and significantly by −32 mm per decade from 1965 to 1993, but this trend was reversed and became increasingly nonsignificant, by 8.9 mm per decade, afterward (Figure 2c). The annual SPEI increased significantly over the entire study period (p < 0.05), by 0.5 per decade, and the SPEI trend was roughly opposed to the annual variation in the PET, with an inflection point that also occurred in 1993 (Figure 2d).
Spatially, nearly all the stations displayed a significant (p < 0.05, trend significant at the level of 0.05) increasing trend in Tmean during the study period, with the maximum Z value reaching 8.07 (p < 0.01, trend significant at the level of 0.01), and only one station, located in SW China, exhibited a significant (p < 0.01) decreasing trend in Tmean (Figure 3a). With respect to the PET, 62.9% of the stations showed a decreasing trend (Figure 3b). Among them, the number of stations registering a significant (p < 0.05) downward trend reached 219, and these stations were predominantly in NE, N, WNW, and west-central E China. In addition, 79 stations showed a significant (p < 0.05) increase in the PET, and these stations were located mainly in southeastern ENW, north and southwestern SW, southern S, and the coastal regions of E China. The annual precipitation displayed remarkable spatial heterogeneity, with stations showing an increasing trend being located mainly in WNW, E, west-central ENW, southern and eastern S, and eastern NE China and Tibet, whereas stations showing a decreasing trend were observed mainly in SW and southwestern NE China (Figure 3c). Only 10 stations displayed a significant (p < 0.05) decrease in precipitation, and 6 of the 10 were located in SW China. The spatial patterns of trends in the SPEI were somewhat coincident with the distribution of trends in precipitation, with the majority of the stations (68.6%) showing a wetting trend during the study period. These stations were located mainly in WNW, N, E, and NE China and Tibet. The stations that showed a drying trend were located mainly in southeastern ENW and SW China (Figure 3d); among them, only 22 stations exhibited a significant (p < 0.05) drying trend.

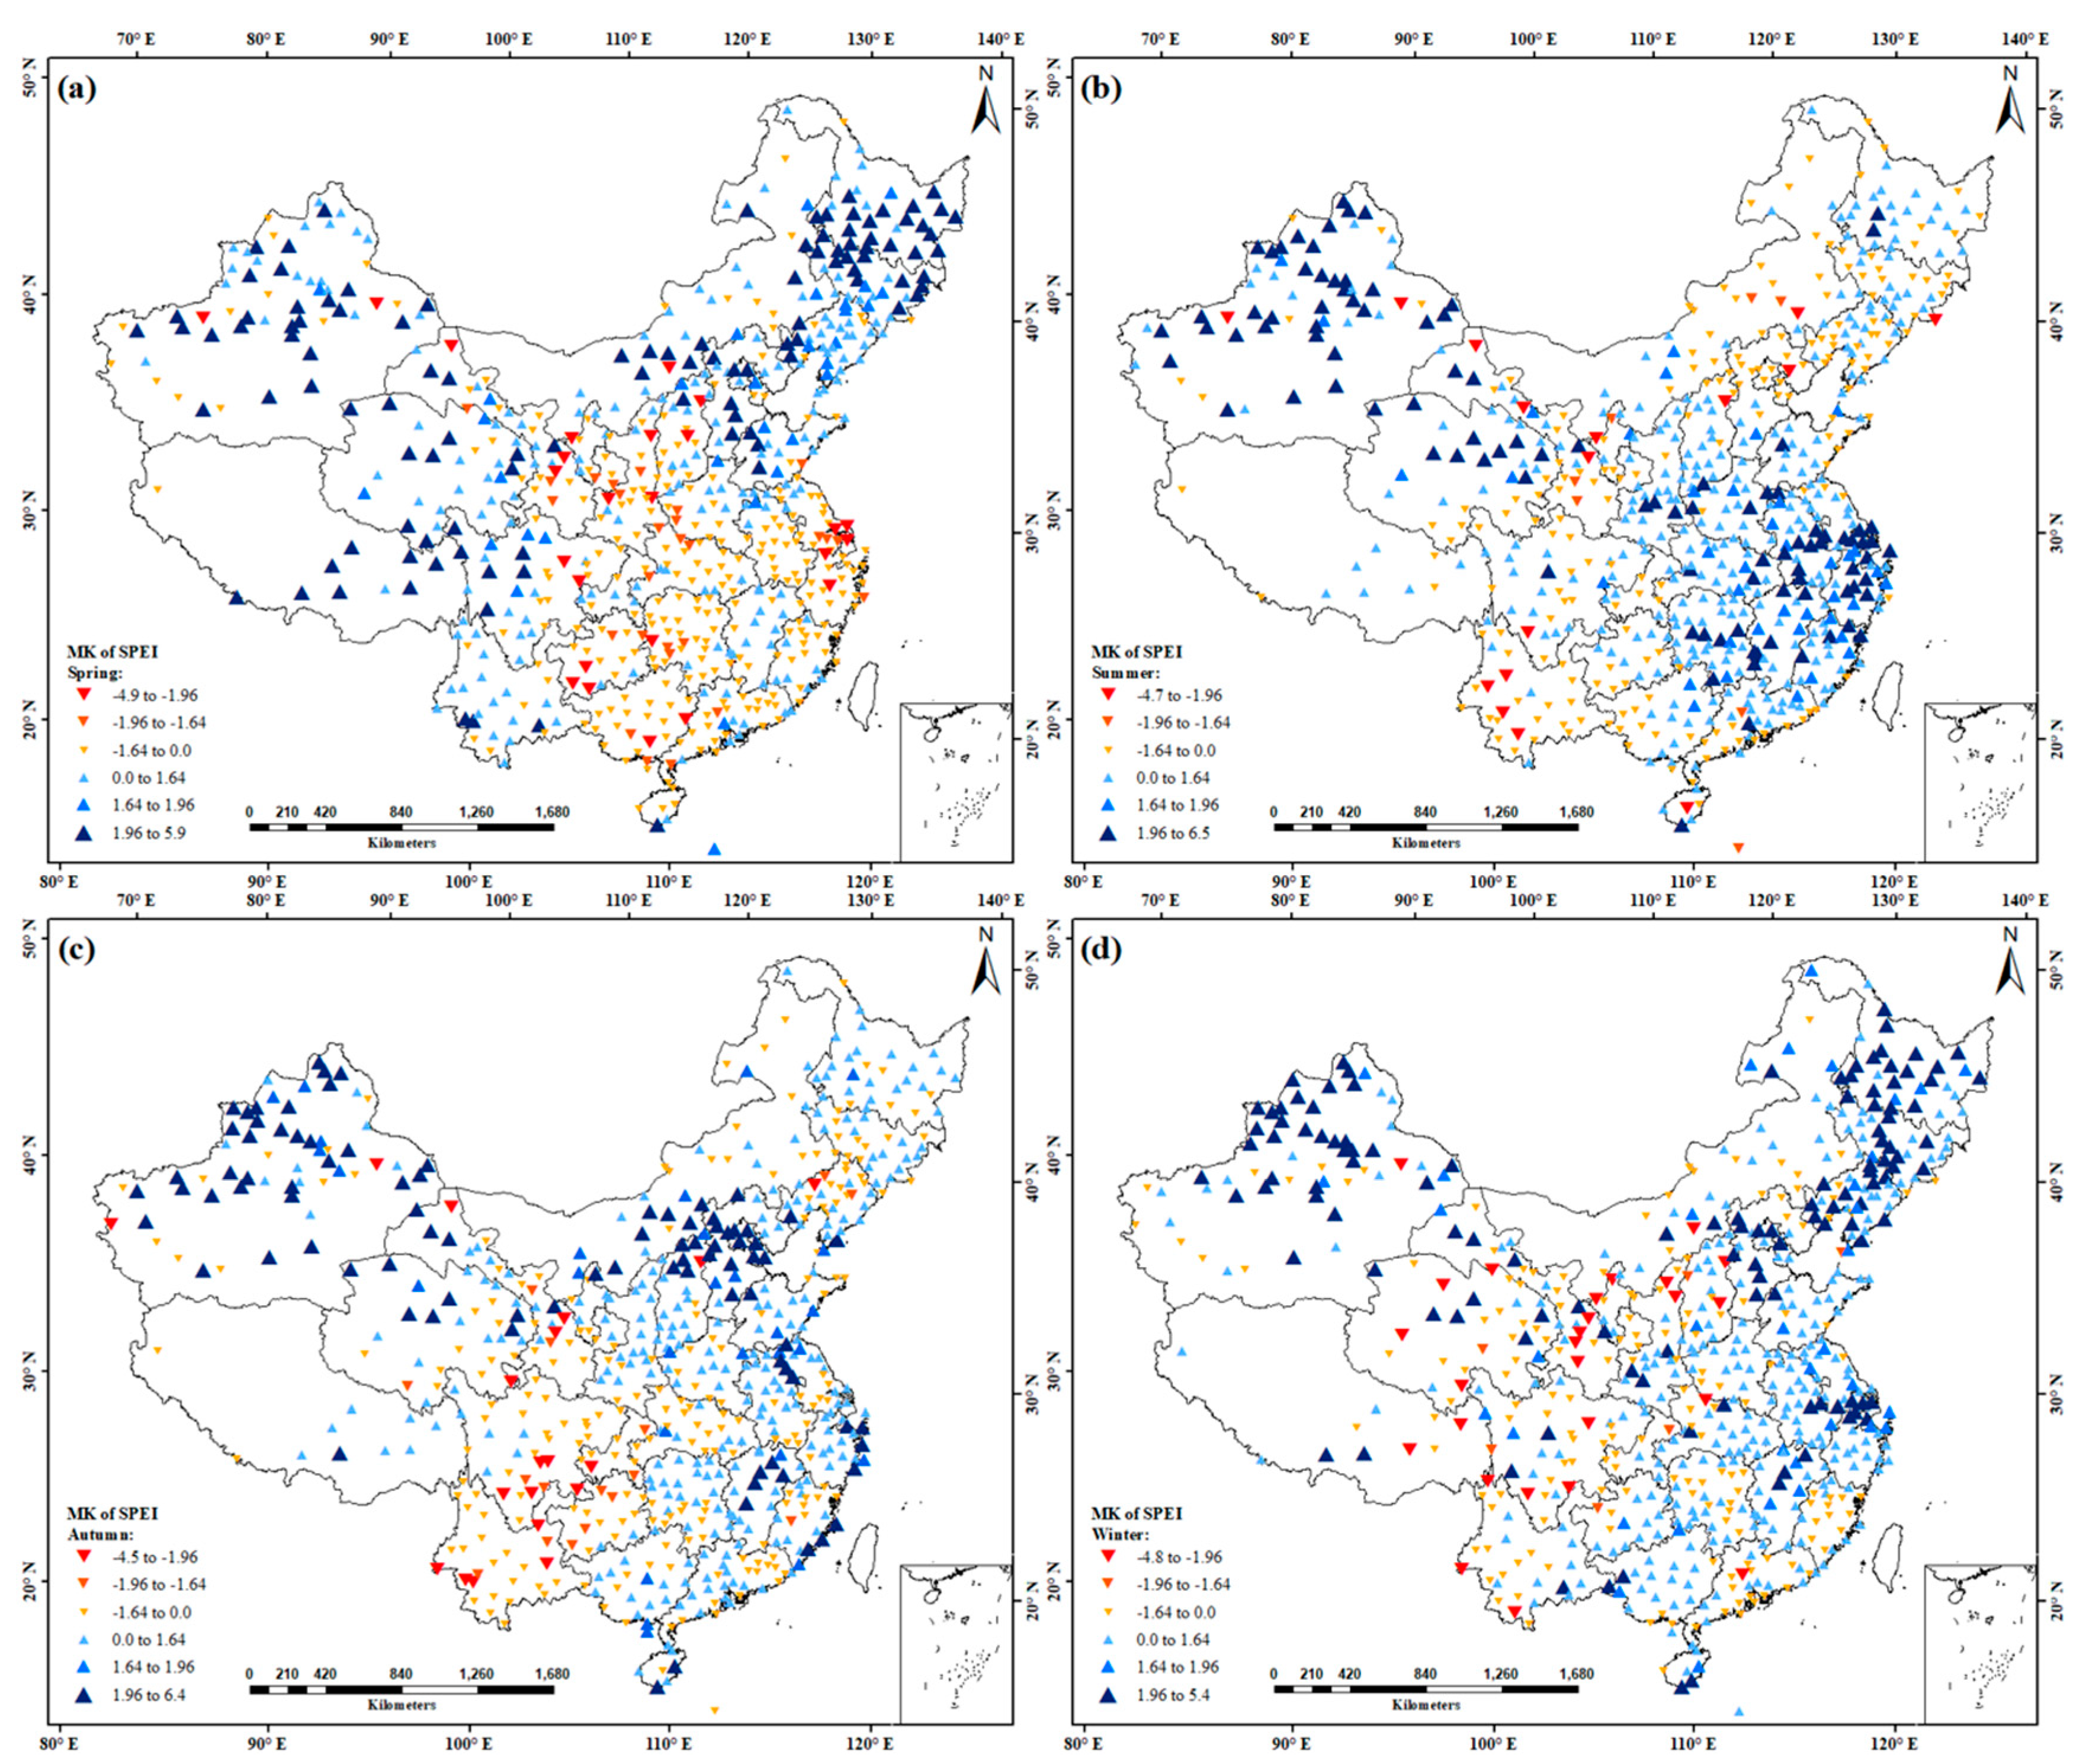
3.2. Spatial and Temporal Patterns of Seasonal Trends in SPEI

Overall, the wetting trends were observed in all seasons during the 1965–2017 period in China as a whole (Figure 4). Especially for summer, the wetting trend was more obvious and steadier, with the SPEI increasing significantly (p < 0.01), by 0.06 per decade (Figure 4b). In autumn, the SPEI showed a nonsignificant trend before 2000, but afterward, it showed a sharp increase, by 0.4 per decade (Figure 4c). The wetting trend showed a nonsignificant trend in spring and winter, with the SPEI increasing by 0.03 and 0.06 per decade, respectively (Figure 4a,d).
Spatially, 46.5% of the stations displayed a drying trend during the 1965–2017 period in spring (Figure 5a), but this drying trend was statistically significant (p < 0.05) in only 8.2% of the stations. Those showing a drying trend were located mainly in southeastern ENW, eastern SW, S, and E China, whereas the stations showing a significant wetting trend (18.2%, p < 0.05) were mainly concentrated in Tibet and WNW, southeastern ENW, northeastern N, and NE China. Unlike the spatial patterns in spring, the majority of stations that showed a wetting trend in summer were located in central and southern N, E, S, and WNW China and Tibet (Figure 5b). The stations showing a drying trend accounted for 32.3% of the total stations and were mainly located in southwestern SW and southwestern NE China; among them, the drying trend was significant (p < 0.05) at only 16 stations. In autumn, 60.2% of the stations displayed a wetting trend, and these were located mainly in Tibet and WNW, N, E, and S China (Figure 5c). In the stations showing a statistically significant wetting trend in autumn, the spatial distributions had moved northward and were mainly located in N China compared with the distributions in spring. In addition, only 19 stations showed significant drying trends, and these were located mainly in SW China. In winter, the majority of stations (about 68.3%) also displayed a wetting trend, and these were located mainly in WNW, E, central and southern N, and NE China (Figure 5d).

3.3. Trend Analysis of Regional Drought/Wetness at the Annual and Seasonal Timescale

When investigating each sub-region of China as a whole, the results showed that areas with a significant wetting trend were located in WNW China (p < 0.01), Tibet (p < 0.05), and E China (p = 0.06). Here, the SPEI increased by 0.23, 0.1, and 0.1 per decade, respectively (Figure 6a,b,h). Areas in ENW, N, NE, and S China also exhibited a wetting trend, but these wetting trends were nonsignificant during the 1965–2017 period (Figure 6d–h). Overall, only SW China displayed a drying trend during the study period. This drying trend was steeper during the 1998–2011 period, with the SPEI decreasing significantly, by 0.72 per decade (Figure 6c).
Seasonally, WNW China showed a wetting trend in all seasons, and these wetting trends were statistically significant in summer, autumn, and winter, with the SPEI increasing by 0.13 (p < 0.01), 0.07 (p < 0.05), and 0.09 (p < 0.05), respectively (Table 2). Tibet displayed a wetting trend in spring and summer and a drying trend in autumn and winter, but these changes in trend were all nonsignificant. Areas in ENW, S, and E China exhibited a drying trend in spring and a wetting trend in summer, autumn, and winter. The wetting trends in ENW and E China were both significant in summer, with the SPEI increasing by 0.09 (p < 0.05) and 0.15 (p < 0.01), respectively. Northeast and N China also showed a wetting trend in all seasons. These wetting trends were significant (p < 0.05) in spring and winter for NE China but in autumn for N China. Only SW China displayed a drying trend in spring, autumn, and winter, and this drying trend was significant in autumn, with the SPEI decreasing by 0.065 per decade (p < 0.05).

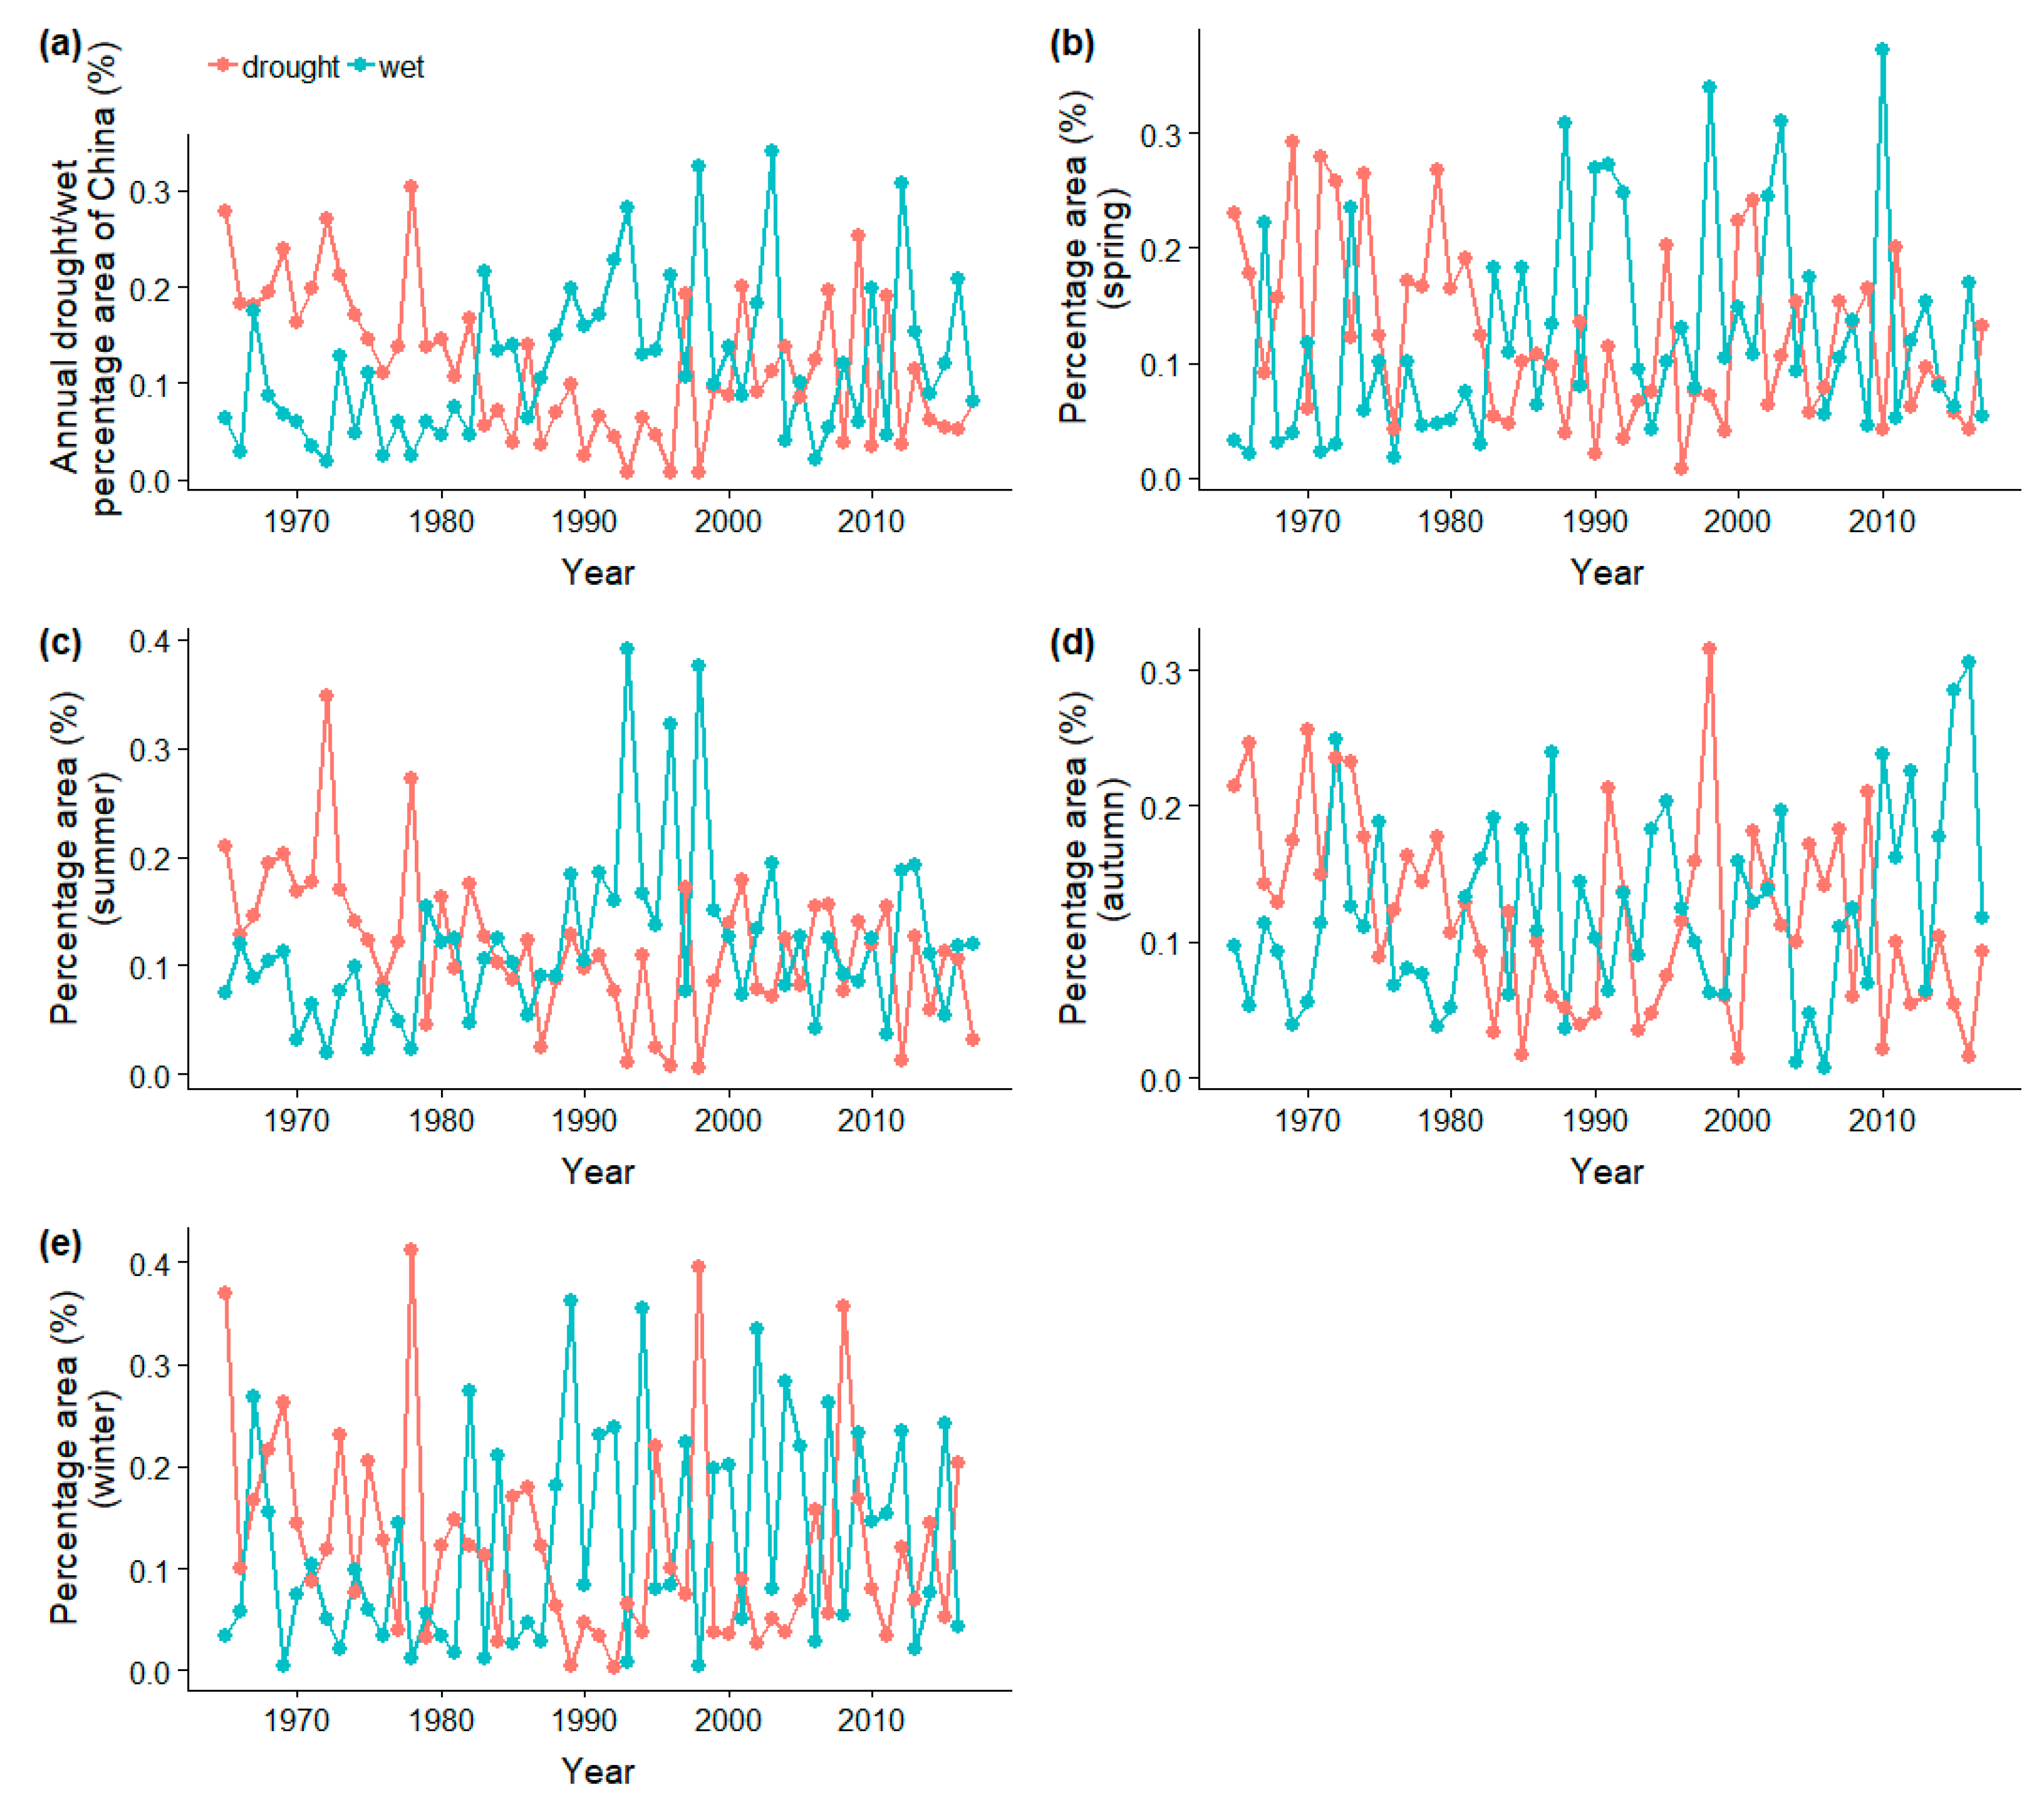
3.4. Temporal Variations of Drought and Wet Characteristics at the Yearly and Seasonally Timescale

The average values for the drought and wetness intensity, frequency, and duration during each decadal interval for the 655 stations are shown in Figure 7. The drought intensity increased during the first three decades (1965–1994) but decreased abruptly after 1995 (Figure 7a). Both the drought frequency and drought duration showed a continuous and considerable decrease during the first three decades (1965–1994), with the highest mean drought frequency being about 21.5% and the duration lasting 4 months in the first decade (Figure 7b,c). Afterward, however, sharp increases were observed in the drought frequency and drought duration. Overall, the mean wetness intensity and wetness duration exhibited continual increases during the entire study period, and the highest rates of increase for both occurred in the third decade (Figure 7d,f). In contrast to the changes in drought frequency, the wetness frequency increased steadily during the first three decades, with the highest mean values reaching 20% (Figure 7e). An abrupt decrease in the mean wetness frequency was then found during the most recent decade.
The decadal temporal variations of drought and wetness frequency and intensity at a seasonal timescale are provided in Figure 8. As shown in Figure 8a, the decadal variation in the mean drought frequency was roughly the same in different seasons. The drought frequency decreased during the first three decades and then increased significantly during the fourth decade. The decadal variations in the mean drought severity values exhibited similar trend changes in different seasons as well (Figure 8b). However, the downward trend that occurred in the fourth decade and the upward trend that was observed in the most recent decade were more significant in spring and autumn, respectively. The mean wetness frequency was relatively higher in the last three decades (1985–2017) than in the first two decades (1965–1984) in all seasons (Figure 8c). Especially in spring, there was a considerable increase in the wetness frequency, from 14% in the 1975–1984 period to 24% in the 1985–1994 period. Furthermore, the mean wetness frequency increased continuously, from 15% to 22%, during the first four decades in summer, and the median frequency remain unchanged in the last decade. With regard to the decadal variations in wetness intensity, an overall increasing trend was observed in spring and summer over the past 53 years, but no significant trend was found in autumn and winter (Figure 8d).
Figure 9 shows the temporal variations in the percentage of areas of China experiencing annual and seasonal wet (SPEI > 1) and dry (SPEI < −1) conditions from 1965 to 2017. A significant decreasing trend in annual dry areas was observed in the 1965–1993 period (−0.75%/year, p < 0.01, calculated from a linear regression), but afterward, this trend was reversed and the percentage of dry areas increased steadily from 1994 to 2009 (0.72%/year, p = 0.061; Figure 9a). During the same period from 1965 to 2009, variations in the percentage of wet areas were exactly opposite the changes in drought. However, the percentage of both drought and wet areas has exhibited nonsignificant trends in recent years.
Seasonally, the percentage of wet areas showed a significant increase in the 1965–2010 period (0.28%/year, p < 0.01) in spring, whereas the percentage of drought areas decreased considerably (−0.21%/year, p < 0.05; Figure 9b). Since then, however, the percentage of both drought and wet areas has exhibited no obvious trend. In summer, the percentage of drought areas displayed a significant decrease during the entire study period (−0.18%/year, p < 0.01), especially for the 1965–1996 period, when this decreasing trend was even more pronounced (−0.5%/year, p < 0.01; Figure 9c). In addition, the percentage of wet areas increased considerably during the 1965–1996 period (0.49%/year, p < 0.01), but after an abrupt decrease in 1997, the percentage of wet areas showed a nonsignificant trend in the last decade. In autumn, no continuous trend change in the percentage of wet areas was found before 2003, but after a dramatic decrease in 2004, the percentage of wet areas increased significantly in the last decade (1.6%/year, p < 0.01; Figure 9d). Furthermore, the percentage of drought areas decreased during the study period, especially for the periods from 1965 to 1990 (−0.72%/year, p < 0.01) and 2001 to 2017 (−0.69%/year, p < 0.05). In winter, the percentage of drought areas showed a nonsignificant decrease over the entire study period (−0.16%/year, p = 0.085), and the percentage of drought areas showed an abnormal increase over the 10- or 20-year cycle (Figure 9e). In addition, the mean value for the percentage of wet areas increased from 8.4% in 1965–1988 to 16.2% in 1989–2017.

3.5. Major Drought Events Identified in Past 53 Years for Each Subregion

The top three drought events ranked by their duration for each subregion are listed in Table 3. It showed that the longest drought duration in northwest China (including WNW and ENW) lasted even more than two years, while the longest drought duration in southeastern China was usually in the one-year timescale. The most severe drought events occurred in WNW, with the drought duration being 28 months and intensity being −1.68. In addition, two out of the three major drought events occurred in the recent decade in WNW, N, and SW, which indicated that drought continues to pose a significant threat to some areas of these regions.

3.6. Spatial Patterns of Trends in Drought and Wetness Characteristics

Of the total number of stations in China, 58.5% exhibited an increase in the decadal drought intensity value (Figure 10a), and the stations exhibiting these wetting trends were located mainly in the regions of WNW, N, and E China and Tibet. However, only 33 stations showed trend changes that were statistically significant (p < 0.05), and 21 of the 33 stations that showed an increasing trend were located mainly in WNW and E China. An increase in the decadal drought frequency was identified in 64.4% of the total stations, and these stations were located mainly in SW and southeastern ENW China (Figure 10b). Among them, the increasing trend in decadal drought frequency was significant at only five stations. A significant (p < 0.05) decrease in decadal drought frequency occurred at 44 stations, which were located mainly in WNW and E China and Tibet. The number of stations that showed increases and decreases in drought duration was roughly the same, with the stations having significant (p < 0.05) increases in drought duration being located mainly in SW China (Figure 10c). Regarding trends in the decadal wetness characteristics, stations that showed increases in wetness intensity, frequency, and duration accounted for 65.3%, 68.3%, and 75.8% of the total stations, respectively; these stations showed roughly the same spatial patterns and were located mainly in the regions of WNE, NE, N, and E China and Tibet (Figure 10d–f). In addition, stations that displayed decreases in wetness intensity, frequency, and duration were located mainly in SW and ENW China.

3.7. Spatial Pattern of the Difference of Drought and Wet Characteristics Between Two Periods: 1993–2017 Minus 1965–1992

As mentioned, abrupt changes in the drought and wetness characteristics (intensity, frequency, and duration) occurred in about 1993. Figure 11 shows the spatial pattern of differences in the mean drought and wetness intensity, frequency, and duration between two periods, 1993–2017 and 1965–1992. The drought intensity increased mainly in southwestern and northeastern SW, southeastern ENW, southwestern N, and northwestern NE China (Figure 11a), and drought affected these regions more frequently as well. In addition to these regions, areas of increased drought frequency also expanded to China’s coastal areas (Figure 11b). Relative to the drought frequency, the areas of increased drought duration further expanded and now cover almost all of SW, northwestern and southwestern NE, southeastern ENW, central E, and southern S China (Figure 11c). These areas of increased drought duration were located mainly in SW China, with the longest duration reaching 24 months.
With respect to wetness characteristics, the areas of increased wetness intensity occurred mainly surrounding WNW, northern S, and NE China and southeastern Tibet (Figure 11d). The highest value reached 0.32, and this area was located mainly in northwestern NE China. Furthermore, areas of relatively high increases in wetness frequency (with an increased range of 14.8% to 36.7%) and duration (ranging from 12 to 41 months) showed roughly the same spatial pattern, and these areas were distributed mainly in central and northeastern NE and WNW China (Figure 11e,f).

4. Discussion

4.1. Trends of Drought/Wet Influenced by the Evapotranspiration Calculated Method

The main reason for the divergence of views on whether China has become drier or wetter was that different researchers used different drought indices and data sets to calculate the potential evapotranspiration (PET). In general, temperature, precipitation, and evapotranspiration are the three key variables that make up the SPEI, and these variables affect drought–wetness variations considerably. The change in temperature was believed to have influenced the variation in drought primarily by affecting the change in evapotranspiration, given that several studies have reported that the impact of evapotranspiration on drought can be equivalent to or even higher than that from precipitation [29,30]. Because of the lack of observed evapotranspiration data, the PET is generally used to estimate the actual evapotranspiration. However, different PET estimation methods may produce significantly different results. For example, the Thornthwaite method calculates the PET based on the hypothesis that an increase in temperature exactly results in an upward trend in the PET; thus, the Thornthwaite equation uses only the temperature as input data. In fact, however, even as an increase in air temperature has been observed across China in the last few decades, several regions of China have reported that the PET or pan evaporation has shown a steady downward trend [31,32], which was also identified by our results (Figure 3b). This trend is contrary to the general expectation that global warming will be accompanied by an increase in terrestrial evaporation, a phenomenon known as the “evaporation paradox”. This phenomenon has been reported not only in China but also in other countries, such as India [33], Canada [34], Italy [35], New Zealand [36], or even globally [37]. An important study that analyzed the contribution of various meteorological variables to the observed PET changes has indeed shown that the duration of sunshine, wind speed, and relative humidity have greater impacts on PET than temperature in most regions of China [38].
Therefore, we can conclude that estimating PET by the Thornthwaite method would have exaggerated the drying trend during the 1965–2017 period in mainland China because it overestimates the impact of temperature. This view is supported by the research of Sheffield et al. [20]. In this context, previous studies that analyzed the variation in drought based on using the Thornthwaite equation to calculate the PET should be treated with caution. For example, Yu et al. [7] calculated the SPEI, in which the PET was calculated by the Thornthwaite equation, for a drought analysis, and their results revealed that severe and extremely severe drought had become more serious across China since the late 1990s. Zou et al. [13] analyzed the drought variations in China during 1951–2003 based on the PDSI, which was calculated by only precipitation and temperature data. In this way, the effects of other climate factors (such as wind, relative humidity, and solar radiation) on evapotranspiration were also overlooked. They thus suggested that a warmer climate resulted in long-lasting and more severe drought in China due to enhanced evaporation. These results that showed that China has experienced an overall drying trend were the opposite of our findings. Our results revealed that most regions of China experienced a significant wetting trend at annual and seasonal scales during the 1965–2017 period, which was based on more compound physics. This result would be more consistent with the real-life situation and was mutually authenticated by the results of Wang et al. [11].

4.2. Trends in Drought/Wetness and Its Possible Driving Factors

A significant wetting trend was found in the central and western parts of arid and semiarid regions of China (including WNW and northwestern ENW China and Tibet), but the eastern parts of these semiarid regions showed a significant drying trend (Figure 3d). Because the dry or wet conditions in these regions are more dominated by the amount of precipitation, this heterogeneous distribution may be further deepened under global warming. As several studies have indicated, the amount of precipitation will increase further in the western part of China (west of 93° E) but will decrease in the eastern part (east of 93 °E) of China’s arid and semiarid regions in future decades [39]. Therefore, the efforts made to coordinate the allocation of available water resources between the western and eastern parts of this region will play an important role in resisting drought in the future. In addition, the Tibetan Plateau and its surrounding areas contain the largest number of glaciers outside the polar regions [40], and snowmelt and mountain glaciers are the predominant water resources in these regions. However, the rapid retreat of mountain glaciers and the shrinkage of the snow cover induced by global warming are likely to pose unprecedented and serious threats to the availability of water in this region. Furthermore, our results revealed that precipitation increased significantly in the Tibetan Plateau and surrounding regions, and Huang et al. [41] pointed out that increases in precipitation and temperature both have negative feedback effects on the attenuation of snow cover in the Tibetan Plateau. Therefore, although these regions currently show a wetting trend, the increase in precipitation and especially the increase in temperature are not conducive to the accumulation of water resources in the long run.
Southeastern ENW China revealed a drying trend, although the precipitation displayed an increasing trend, which indicates that the dry or wet conditions in this region were dominated more by changes in the PET. In addition, the study also indicated that the nature of the land surface, such as through a scarcity of trees and deforestation, could be another important contributor in ENW China because it increases the probability of soil erosion when severe drought occurs [42]. In addition, it is worth noting that a wide drying trend has occurred even in humid and sub-humid regions of China (including E, S, and eastern SW China) in spring (Figure 5a), which may be dominated by a significant decrease in precipitation. As the work of Qiu et al. [43] also revealed, the late spring rainfall over southeastern China has decreased by more than 30% from its long-term average since 1951.
The general atmospheric circulation also exerts a strong effect on drought and wetness variations in time and space because it can bring moisture from the oceans into the continental regions and generate rainfall over large areas. For example, many studies have shown that the El Niño–Southern Oscillation (ENSO) phenomenon exhibits the greatest influence on the interannual variability in the global climate [44,45]. The mature phase of El Niño events often occurs in boreal winter and is usually accompanied by a weaker than normal east Asian winter monsoon [46,47]. Consequently, the climate over China will be warmer, but with precipitation being significantly higher and lower than normal in southern and northern China, respectively. In other words, a great part of north and northwest China could easily experience drought during El Niño events [48]. Our results showed that the percentage of drought areas in winter increased sharply in 1986, 1998, 2007, and 2016 (Figure 9e), which highly coincidentally were also recent El Niño years. Therefore, we deduced that the abnormal increase in the percentage of drought areas in winter might be related to strong El Niño events.
In addition, our results indicated that the areas showing a drying trend were predominantly located in SW China (Figure 3d and Figure 6c), which is consistent with the fact that extremely severe droughts have struck this region frequently in recent years, such as the devastating summer drought in 2006 and autumn drought in 2009. These extreme drought events were also recognized as the result of ENSO. For example, Zhang et al. [49] pointed out that El Niño events were presumed to be a principal factor in the strong autumn drought that occurred in SW China in 2009. Generally, the current understanding of the relationships among atmospheric circulation and extreme precipitation [50], extreme temperature [51], and changes of monsoon [52] has progressed a great deal and has provided a unique perspective from which to understand the variations in climate. Other processes, however, such as local feedback, may also have played a role in drought or wetness. Therefore, detailed mechanistic explanations for the relationship between the periodicity of regional drought or wetness and large-scale circulation will require further observational, theoretical, and modeling studies.

5. Conclusions

Viewpoints differ regarding whether China has become drier or wetter. To resolve this discrepancy, we evaluated the yearly and seasonal drought and wetness conditions in China quantitatively by using the SPEI during the period from 1965 to 2017. We found that (1) China as a whole showed a significant wetting trend in both the yearly and seasonally timescale. Specifically, the stations showing a wetting trend accounted for 68.6% of the total stations, and these were located mainly in WNW, N, E, NE, and Tibet. (2) Seasonally, the stations showing a drying trend were also in the minority and located mainly in SE China in the spring. However, for the other seasons, the stations showing a drying trend were concentrated mainly in SW China, and their autumn drying trend was particularly significant. (3) The wetness intensity and duration and the affected areas showed continuous increases during the study period, but the wetness frequency decreased sharply from 2005 to 2017. The drought frequency and duration and the affected areas decreased during the 1965–1994 period, but they have increased considerably over the last two decades. These indicated that although a wetting trend was observed in most regions of China, the frequent occurrence of severe drought in the recent decade (especially for SW) still presented a considerable threat to both the environment and society. Our findings can provide a reference for the reasonable allocation of water resources and the implementation of countermeasures to cope with drought risk in the context of continuous global warming in China.

Author Contributions

Z.Z. (Zhaoqi Zeng) and W.W. designed the research and performed the analysis, and Z.Z. (Zhaoqi Zeng). wrote the first draft. Z.Z. (Zhaoqi Zeng), W.W., Y.L., Z.L., Y.Z. and Z.Z. (Zhengtao Zhang) reviewed and edited the draft. Z.Z. (Zhaoqi Zeng), S.Z., Y.G., and H.H. collected the data. All authors have read and agreed to the published version of the manuscript.

Funding

This research was funded by the Strategic Priority Research Program of the Chinese Academy of Sciences (XDA19040304, XDA19040101) and the National Key Research and Development Program of China.

Conflicts of Interest

The authors declare no conflict of interest.

References

  1. Zhang, Q.; Li, J.; Singh, V.P.; Xu, C.Y. Copula-based spatio-temporal patterns of precipitation extremes in China. Int. J. Climatol. 2013, 33, 1140–1152. [Google Scholar] [CrossRef]
  2. Vicente-Serrano, S.M.; Azorin-Molina, C.; Sanchez-Lorenzo, A.; Revuelto, J.; Moran-Tejeda, E.; Lopez-Moreno, J.I.; Espejo, F. Sensitivity of reference evapotranspiration to changes in meteorological parameters in Spain (1961–2011). Water Resour. Res. 2014, 50, 8458–8480. [Google Scholar] [CrossRef] [Green Version]
  3. Milly, P.C.D.; Wetherald, R.T.; Dunne, K.A.; Delworth, T.L. Increasing risk of great floods in a changing climate. Nature 2002, 415, 514–517. [Google Scholar] [CrossRef] [PubMed]
  4. Cai, W.; Cowan, T.; Briggs, P.; Raupach, M. Rising temperature depletes soil moisture and exacerbates severe drought conditions across southeast Australia. Geophys. Res. Lett. 2009, 36. [Google Scholar] [CrossRef]
  5. Sternberg, T. Regional drought has a global impact. Nature 2011, 472, 169. [Google Scholar] [CrossRef]
  6. Wilhite, D.A. Drought as a Natural Hazar—Concepts and Definitions; University of Nebraska: Lincoln, NE, USA, 2000; pp. 3–18. [Google Scholar]
  7. Yu, M.; Li, Q.; Hayes, M.J.; Svoboda, M.D.; Heim, R.R. Are droughts becoming more frequent or severe in China based on the Standardized Precipitation Evapotranspiration Index: 1951–2010? Int. J. Climatol. 2014, 34, 545–558. [Google Scholar] [CrossRef]
  8. Yuan, X.; Ma, Z.; Pan, M.; Shi, C. Microwave remote sensing of short-term droughts during crop growing seasons. Geophys. Res. Lett. 2015, 42, 4394–4401. [Google Scholar] [CrossRef]
  9. Li, K.; Wu, S.; Dai, E.; Xu, Z. Flood loss analysis and quantitative risk assessment in China. Nat. Hazards 2012, 63, 737–760. [Google Scholar] [CrossRef]
  10. Li, B.; Su, H.; Chen, F.; Wu, J.; Qi, J. The changing characteristics of drought in China from 1982 to 2005. Nat. Hazards 2013, 68, 723–743. [Google Scholar] [CrossRef]
  11. Wang, Z.; Li, J.; Lai, C.; Zeng, Z.; Zhong, R.; Chen, X.; Zhou, X.; Wang, M. Does drought in China show a significant decreasing trend from 1961 to 2009? Sci. Total Environ. 2017, 579, 314–324. [Google Scholar] [CrossRef]
  12. Wu, Z.-Y.; Lu, G.-H.; Wen, L.; Lin, C. Reconstructing and analyzing China’s fifty-nine year (1951–2009) drought history using hydrological model simulation. Hydrol. Earth Syst. Sci. 2011, 15, 2881–2894. [Google Scholar] [CrossRef] [Green Version]
  13. Zou, X.K.; Zhai, P.M.; Zhang, Q. Variations in droughts over China: 1951–2003. Geophys. Res. Lett. 2005, 32. [Google Scholar] [CrossRef]
  14. Xu, K.; Yang, D.; Yang, H.; Li, Z.; Qin, Y.; Shen, Y. Spatio-temporal variation of drought in China during 1961–2012: A climatic perspective. J. Hydrol. 2015, 526, 253–264. [Google Scholar] [CrossRef]
  15. McKee, T.B.; Doesken, N.J.; Kleist, J. The relationship of drought frequency and duration to time scales. In Proceedings of the 8th Conference on Applied Climatology, Anaheim, CA, USA, 17–22 January 1993; pp. 179–183. [Google Scholar]
  16. Zeng, Z.; Wu, W.; Li, Z.; Zhou, Y.; Guo, Y.; Huang, H. Agricultural Drought Risk Assessment in Southwest China. Water 2019, 11. [Google Scholar] [CrossRef] [Green Version]
  17. Stark, J.; Love, S.; King, B.; Marshall, J.; Bohl, W.; Salaiz, T. Potato cultivar response to seasonal drought patterns. Am. J. Potato Res. 2013, 90, 207–216. [Google Scholar] [CrossRef]
  18. Alamgir, M.; Mohsenipour, M.; Homsi, R.; Wang, X.; Shahid, S.; Shiru, M.S.; Alias, N.E.; Yuzir, A. Parametric assessment of seasonal drought risk to crop production in Bangladesh. Sustainability 2019, 11, 1442. [Google Scholar] [CrossRef] [Green Version]
  19. Vicente-Serrano, S.M.; Beguería, S.; López-Moreno, J.I. A multiscalar drought index sensitive to global warming: the standardized precipitation evapotranspiration index. J. Clim. 2010, 23, 1696–1718. [Google Scholar] [CrossRef] [Green Version]
  20. Sheffield, J.; Wood, E.F.; Roderick, M.L. Little change in global drought over the past 60 years. Nature 2012, 491, 435. [Google Scholar] [CrossRef]
  21. Chen, H.; Sun, J. Changes in drought characteristics over China using the standardized precipitation evapotranspiration index. J. Clim. 2015, 28, 5430–5447. [Google Scholar] [CrossRef]
  22. Zhang, K.-X.; Pan, S.-M.; Zhang, W.; Xu, Y.-H.; Cao, L.-G.; Hao, Y.-P.; Wang, Y. Influence of climate change on reference evapotranspiration and aridity index and their temporal-spatial variations in the Yellow River Basin, China, from 1961 to 2012. Quat. Int. 2015, 380, 75–82. [Google Scholar] [CrossRef]
  23. Wang, Z.; Ye, A.; Wang, L.; Liu, K.; Cheng, L. Spatial and temporal characteristics of reference evapotranspiration and its climatic driving factors over China from 1979–2015. Agric. Water Manag. 2019, 213, 1096–1108. [Google Scholar] [CrossRef]
  24. Liu, X.; Zhang, D. Trend analysis of reference evapotranspiration in Northwest China: The roles of changing wind speed and surface air temperature. Hydrol. Process. 2013, 27, 3941–3948. [Google Scholar] [CrossRef]
  25. Allen, R.G.; Pereira, L.S.; Raes, D.; Smith, M. Crop evapotranspiration-Guidelines for computing crop water requirements-FAO Irrigation and drainage paper 56. FaoRome 1998, 300, D05109. [Google Scholar]
  26. Gocic, M.; Trajkovic, S. Analysis of changes in meteorological variables using Mann-Kendall and Sen’s slope estimator statistical tests in Serbia. Glob. Planet. Chang. 2013, 100, 172–182. [Google Scholar] [CrossRef]
  27. Gao, X.; Zhao, Q.; Zhao, X.; Wu, P.; Pan, W.; Gao, X.; Sun, M. Temporal and spatial evolution of the standardized precipitation evapotranspiration index (SPEI) in the Loess Plateau under climate change from 2001 to 2050. Sci. Total Environ. 2017, 595, 191–200. [Google Scholar] [CrossRef] [PubMed]
  28. Leng, G.; Tang, Q.; Rayburg, S.J.G.; Change, P. Climate change impacts on meteorological, agricultural and hydrological droughts in China. Global Planet. Change 2015, 126, 23–34. [Google Scholar] [CrossRef]
  29. Hu, Q.; Willson, G.D. Effects of temperature anomalies on the Palmer Drought Severity Index in the central United States. Int. J. Climatol. 2000, 20, 1899–1911. [Google Scholar] [CrossRef] [Green Version]
  30. Sun, S.; Chen, H.; Ju, W.; Wang, G.; Sun, G.; Huang, J.; Ma, H.; Gao, C.; Hua, W.; Yan, G. On the coupling between precipitation and potential evapotranspiration: contributions to decadal drought anomalies in the Southwest China. Clim. Dyn. 2017, 48, 3779–3797. [Google Scholar] [CrossRef]
  31. Wang, W.; Shao, Q.; Peng, S.; Xing, W.; Yang, T.; Luo, Y.; Yong, B.; Xu, J. Reference evapotranspiration change and the causes across the Yellow River Basin during 1957-2008 and their spatial and seasonal differences. Water Resour. Res. 2012, 48. [Google Scholar] [CrossRef]
  32. Zhang, Y.; Liu, C.; Tang, Y.; Yang, Y. Trends in pan evaporation and reference and actual evapotranspiration across the Tibetan Plateau. J. Geophys. Res. Atmos. 2007, 112. [Google Scholar] [CrossRef]
  33. Jhajharia, D.; Dinpashoh, Y.; Kahya, E.; Singh, V.P.; Fakheri-Fard, A. Trends in reference evapotranspiration in the humid region of northeast India. Hydrol. Process. 2012, 26, 421–435. [Google Scholar] [CrossRef]
  34. Burn, D.H.; Hesch, N.M. Trends in evaporation for the Canadian prairies. J. Hydrol. 2007, 336, 61–73. [Google Scholar] [CrossRef]
  35. Moonen, A.; Ercoli, L.; Mariotti, M.; Masoni, A.J.A. Climate change in Italy indicated by agrometeorological indices over 122 years. Agric. For. Meteorol. 2002, 111, 13–27. [Google Scholar] [CrossRef]
  36. Roderick, M.L.; Farquhar, G.D. Changes in New Zealand pan evaporation since the 1970s. Int. J. Climatol. 2005, 25, 2031–2039. [Google Scholar] [CrossRef]
  37. Roderick, M.L.; Farquhar, G.D. The cause of decreased pan evaporation over the past 50 years. Science 2002, 298, 1410–1411. [Google Scholar] [PubMed]
  38. Gao, G.; Chen, D.; Ren, G.; Chen, Y.; Liao, Y. Spatial and temporal variations and controlling factors of potential evapotranspiration in China: 1956–2000. J. Geogr. Sci. 2006, 16, 3–12. [Google Scholar] [CrossRef]
  39. Jin, L.; Fu, J.; Chen, F. Spatial Differences of Precipitation over Northwest China During the Last 44 Years and Its Response to Global Warming. Sci. Geogr. Sin. 2005, 25, 567–572. [Google Scholar]
  40. Yao, T.; Ren, J.; Xu, B. Map of Glaciers and Lakes on the Tibetan Plateau and the Surroundings; Xi’an Cartographic Publishing House: Xi’an, China, 2008. [Google Scholar]
  41. Huang, X.; Deng, J.; Wang, W.; Feng, Q.; Liang, T. Impact of climate and elevation on snow cover using integrated remote sensing snow products in Tibetan Plateau. Remote Sens. Environ. 2017, 190, 274–288. [Google Scholar] [CrossRef]
  42. Zhang, B.; He, C.; Burnham, M.; Zhang, L. Evaluating the coupling effects of climate aridity and vegetation restoration on soil erosion over the Loess Plateau in China. Sci. Total Environ. 2016, 539, 436–449. [Google Scholar] [CrossRef]
  43. Qiu, Y.; Cai, W.; Guo, X.; Pan, A. Dynamics of Late Spring Rainfall Reduction in Recent Decades over Southeastern China. J. Clim. 2009, 22, 2240–2247. [Google Scholar] [CrossRef]
  44. Sun, X.; Renard, B.; Thyer, M.; Westra, S.; Lang, M. A global analysis of the asymmetric effect of ENSO on extreme precipitation. J. Hydrol. 2015, 530, 51–65. [Google Scholar] [CrossRef] [Green Version]
  45. Trenberth, K.E.; Dai, A.; Van Der Schrier, G.; Jones, P.D.; Barichivich, J.; Briffa, K.R.; Sheffield, J. Global warming and changes in drought. Nat. Clim. Chang. 2014, 4, 17. [Google Scholar] [CrossRef]
  46. Wang, L.; Chen, W.; Huang, R. Interdecadal modulation of PDO on the impact of ENSO on the east Asian winter monsoon. Geophys. Res. Lett. 2008, 35. [Google Scholar] [CrossRef] [Green Version]
  47. Wang, B.; Wu, R.G.; Fu, X.H. Pacific-East Asian teleconnection: how does ENSO affect East Asian climate? J. Clim. 2000, 13, 1517–1536. [Google Scholar] [CrossRef]
  48. Xu, Z.; Li, J.; Takeuchi, K.; Ishidaira, H. Long-term trend of precipitation in China and its association with the El Niño–southern oscillation. Hydrol. Process. Int. J. 2007, 21, 61–71. [Google Scholar] [CrossRef]
  49. Zhang, W.; Jin, F.-F.; Zhao, J.-X.; Qi, L.; Ren, H.-L. The possible influence of a nonconventional El Niño on the severe autumn drought of 2009 in Southwest China. J. Clim. 2013, 26, 8392–8405. [Google Scholar] [CrossRef]
  50. Toreti, A.; Xoplaki, E.; Maraun, D.; Kuglitsch, F.G.; Wanner, H.; Luterbacher, J. Characterisation of extreme winter precipitation in Mediterranean coastal sites and associated anomalous atmospheric circulation patterns. Nat. Hazards Earth Syst. Sci. 2010, 10, 1037–1050. [Google Scholar] [CrossRef]
  51. Horton, D.E.; Johnson, N.C.; Singh, D.; Swain, D.L.; Rajaratnam, B.; Diffenbaugh, N.S. Contribution of changes in atmospheric circulation patterns to extreme temperature trends. Nature 2015, 522, 465. [Google Scholar] [CrossRef] [Green Version]
  52. He, S.; Wang, H. Oscillating Relationship between the East Asian Winter Monsoon and ENSO. J. Clim. 2013, 26, 9819–9838. [Google Scholar] [CrossRef] [Green Version]
Figure 1. Locations of 655 rain-gauge stations in China. Southwest, east, and south China are marked by SW, E, and S, respectively. These three regions constitute southern China. Northeast, north, eastern northwest, and western northwest China are marked by NE, N, ENW, and WNW, respectively. These regions constitute northern China. The Tibetan Plateau is marked as Tibet.
Water 12 02097 g001
Figure 2. Annual variation of average (a) precipitation, (b) mean air temperature (Tmean), (c) potential evapotranspiration (PET), and (d) standardized precipitation evapotranspiration index (SPEI) of China from 1965 to 2017. The bold black line shows the 5-year moving average value. The blue line shows the trend lines at a 95% confidence interval. p indicated that the significance levels (p < 0.01 indicated the significant level of 0.01).
Water 12 02097 g002
Figure 3. Spatial patterns of trends in the (a) annual mean air temperature (Tmean), (b) potential evapotranspiration (PET), (c) precipitation (Pre), and (d) standardized precipitation evapotranspiration index (SPEI) from 1965 to 2017. Triangles of different sizes indicate trends of different magnitudes. MK, Mann–Kendall test.
Water 12 02097 g003
Figure 4. Linear trends of the seasonal standardized precipitation evapotranspiration index (SPEI) from 1965 to 2017: (a) spring, (b) summer, (c) autumn, and (d) winter SPEI. The bold black line shows the 5-year moving average value. The blue line shows the trend lines at a 95% confidence interval. p indicated that the significance levels (p < 0.01 indicated the significant level of 0.01).
Water 12 02097 g004
Figure 5. Spatial distribution of seasonal trends in the standardized precipitation evapotranspiration index (SPEI) from 1965 to 2017: (a) spring, (b) summer, (c) autumn, and (d) winter SPEI. Triangles of different sizes indicate trends of different magnitudes. MK, Mann–Kendall test.
Water 12 02097 g005
Figure 6. Trends in annual standardized precipitation evapotranspiration index (SPEI) for different regions of China from 1965 to 2017. (a) WNW, western Northwest China; (b) Tibet, Tibetan Plateau; (c) SW, Southwest China; (d) S, South China; (e) NE, Northeast China; (f) N, North China; (g) ENW, eastern Northwest China; (h) E, East China. The bold black line shows the 5-year moving average value. The blue line shows the trend lines at a 95% confidence interval. p indicated that the significance levels (p < 0.01 indicated the significant level of 0.01).
Water 12 02097 g006
Figure 7. Temporal variation in the drought and wetness intensity (a,d), frequency (b,e), and duration (c,f) across China for the periods from 1965 to 1974 (decade1), 1975 to 1984 (decade2), 1985 Table 1994. (decade3), 1995 to 2004 (decade4), and 2005 to 2017 (decade5), respectively. For each box, the central black line is the median, the black square point is the average, the upper and bottom edge of the box correspond to the 25th and 75th percentiles, and the whiskers show the range of the data.
Water 12 02097 g007
Figure 8. Temporal variation of seasonal drought and wet frequency (a,c) and intensity (b,d) over China for the periods 1965–1974 (decade1), 1975–1984 (decade2), 1985–1994 (decade3), 1995–2004 (decade4), and 2005–2017 (decade5), respectively. For each box, the central black line is the median, the black square point is the average, the upper and bottom edge of the box correspond to the 25th and 75th percentiles, and the whiskers show the range of the data.
Water 12 02097 g008
Figure 9. Temporal variations in the annual (a) and seasonal (be) percentage of areas in drought (standardized precipitation evapotranspiration index (SPEI) < −1) and wet (SPEI >1) conditions over the whole of China.
Water 12 02097 g009
Figure 10. Spatial patterns of trends in drought and wetness intensity (a,d), frequency (b,e), and duration (c,f) in the years 1965–2017. The stations marked by a black cross symbol indicate that the Table 0.
Water 12 02097 g010
Figure 11. Spatial pattern of the difference in drought and wetness intensity (a,d), frequency (b,e), and duration (c,f) between two periods: 1992–2017 minus 1965–1991.
Water 12 02097 g011
Table 1. Categorization of the drought and wetness severity by the standardized precipitation evapotranspiration index (SPEI).
SPEISeverity
[2.0, +∞)Very severe wet
[1.5, 2.0)Severe wet
[1.0, 1.5)Moderate wet
(−1.0, 1]Near normal
(−1.5, −1.0]Moderate drought
(−2.0, −1.5]Severe drought
(−∞, −2]Very severe drought
Table 2. Seasonal trends in the standardized precipitation evapotranspiration index (SPEI) from 1965 to 2017 over different regions of China.
RegionSpringSummerAutumnWinter
WNW0.0030.013 **0.007 *0.009 *
Tibet0.0010.0009−0.005−0.0009
SW−0.00050.0007−0.0065 *−0.0005
S−0.00090.0040.00350.007
NE0.013*0.00150.0030.015 *
N0.0030.0030.01 *0.005
ENW−0.00080.009 *0.0080.004
E−0.0080.015 **0.0050.0075
1 The value for each season is the average of all stations in that specific region. WNW, western Northwest China; Tibet, Tibetan Plateau; SW, Southwest China; S, South China; NE, Northeast China; N, North China; ENW, eastern Northwest China; E, East China. * Significance levels of 0.05 (p < 0.05), ** Significance levels of 0.05 (p < 0.01).
Table 3. Major drought (top 3) events ranked by duration for each subregion in the past 53 years.
RegionRankPersistent Period
(yyyy.mm)
Duration
(month)
IntensityCentroid
(lon: ° E, lat: ° N)
WNW12013.09–2015.1228−1.6884.25, 41.78
21969.05–1971.525−1.687.7, 40.63
32016.01–2017.1224−2.2689.2, 42.93
Tibet11971.09–1972.0913−1.5792.07, 31.48
21973.01–1974.1212−1.5195.6, 31.42
31974.11–1975.0810−1.9391.77, 29.25
SW12012.02–2013.0415−1.51102.6, 24.35
21980.12–1982.0114−1.54101.98, 23.6
32009.10–2010.1012−1.84102.27, 27.9
S11998.08–1999.0712−1.67113.05, 23.67
22003.03–2004.0212−1.46119.28, 26.08
31977.03–1978.0111−1.81110.03, 18.5
NE12001.07–2002.1117−1.6122.83, 41.98
21975.04–1976.0312−1.5130.28, 46.82
31967.01–1967.1212−1.45131.15, 44.38
N11998.08–1999.0813−1.8113.53, 39.03
22017.01–2018.1212−1.94114.95, 44.02
32013.03–2014.0111−1.71111.6, 33.78
ENW11966.01–1969.0137−1.6493.52, 42.82
21974.12–1976.0821−1.49109.85, 40.67
32005.06–2006.1017−1.48104.68, 36.57
E11967.06–1968.0411−1.7122.1, 30.03
21976.06–1977.0310−1.44110.42, 33
32011.12–2012.0910−1.38114.1, 31.57

