Article

Optimization of Combined Submerged Macrophyte Planting Conditions for Inhibiting Algae by Response Surface Methodology

1
School of Ecology and Environmental Science, Yunnan University, Kunming 650504, Yunnan, China
2
Environmental Simulation and Pollution Control State Key Joint Laboratory, State Environmental Protection Key Laboratory of Microorganism Application and Risk Control (SMARC), School of Environment, Tsinghua University, Beijing 100084, China
3
Institute of International Rivers and Eco-Security, Yunnan University, Kunming 650504, Yunnan, China
4
KunMing DianChi Water Treatment Co., Ltd., Kunming 650228, Yunnan, China
*
Authors to whom correspondence should be addressed.
Water 2020, 12(8), 2093; https://doi.org/10.3390/w12082093
Submission received: 2 June 2020 / Revised: 20 July 2020 / Accepted: 21 July 2020 / Published: 23 July 2020
(This article belongs to the Special Issue Water Pollution Control Using Eco-treatment Systems)

Abstract

:
Combined planting of submerged macrophytes could be an effective way of controlling algal blooms in landscape waters. In this study, the algal inhibition of single and combined planting of Hydrilla verticillata (A) and Myriophyllum spicatum (B) were explored. The optimized combined planting conditions were investigated using the central composite design. The results showed that the combined planting had a synergistic algal-inhibiting effect. Its inhibition (I (K)) is about 10.8% higher than that of single planting with the same density. The synergism of the combined planting may be due to the different ways in which the two plants inhibit the algal growth. H. verticillata inhibited the algal biomass and M. spicatum inhibited the algal specific growth rate. When the density of H. verticillata and M. spicatum were 7.2 g/L and 6.7 g/L, the value of I (K) reached a maximum 92.2%. Although increasing planting density would improve the algal inhibition, high planting density was not beneficial for the growth of plants. Moreover, no further significant improvement was shown with the increasing planting density when the value of I(K) was higher than 90%. Therefore, the cost-effective combined macrophyte density was 11.6 g/L and the value of A/B ranged from 1.05 to 1.07, where the value of I (K) could achieve 90%. This study can provide a practical basis for using macrophytes to control algal blooms.

1. Introduction

At present, landscape waters play an indispensable role in regulating the urban microclimate, improving the living environment and enhancing urban water storage and drainage functions [1]. However, the concentrations of nitrogen (N) and phosphorus (P) in landscape waters are intensified gradually with the development of the economy, which aggravates the risk of water blooms [2,3,4]. Although reducing nutrients is an effective way to control algal reproduction, it is difficult to reduce N and P to the level that algae have low growth potential due to technical considerations [5,6]. Moreover, it is evident that most of the landscape waters have poor fluidity and fragmented ecosystem currently, all of these promote the outbreak of blooms [7]. Therefore, submerged macrophytes may be an effective way of solving water blooms, rather than using physical, chemical and biomanipulation methods, as their use is ecologically safe and stable [8,9,10].
Submerged macrophytes can inhibit the growth of algae, and also assist in maintaining the health of aquatic systems and the aesthetic function of urban water landscapes [11]. Submerged macrophytes have three algal inhibition mechanisms. Firstly, submerged macrophytes can compete directly with algae for nutrients and light. Secondly, macrophytes are beneficial for constructing a microecological environment, in which aquatic animals and organisms cooperate with plants to inhibit algae [12,13]. Thirdly, the allelopathy of submerged macrophytes maintains the algal biomass at a low level [14]. Allelochemicals, such as polyphenols, oxy fatty acids and alkaloids have been identified and extracted from plants [10], and they are known to have inhibiting effects on photosynthesis and enzyme activity [15,16] or destroy the cellular structure and physiological processes in algal cells [17]. To date, submerged macrophytes and allelochemicals have been applied successfully in the suppression of algae on laboratory and field scales [18].
However, the algal-inhibiting ability of a single macrophyte may not be as stable as that formed by the plant community. Allelochemicals secreted by a single macrophyte may show specific selectivity in algal inhibition [19]. Moreover, the single macrophyte is susceptible to external factors, such as nutritional levels and biological invasions [20]. In contrast, it has been reported that the combined planting of different macrophytes has a synergistic effect on algal inhibition [21]. However, due to a lack of relevant research, it is necessary to further determine this synergistic effect. Besides, synergism of combined planting is closely related to the species, density and ratio of the macrophytes employed [22]. Therefore, it is necessary to know the optimum combined planting conditions required to affect the efficient synergistic inhibition of algae.
Central composite design (CCD) of the response surface methodology (RSM) is a statistical method that uses multiple quadratic regression equations to fit the relationship between factors and response values. The optimal process parameters can be obtained by analyzing the response surface contours [23]. The method has been used to optimize various experimental conditions for the lipid energy production of algae, bio-oil production from sewage sludge [24] and extraction conditions [25,26].
Therefore, this study aimed to use the CCD model to explore the algal-inhibiting effect of combined submerged macrophyte planting, and the optimized combined planting conditions required to suppress algae. To the authors’ knowledge, this is the first time that the CCD methodology has been used to determine an ecological method for suppressing algae. The results of the present study can be applied in the use of macrophytes to solve algal blooms in landscape waters sourced from reclaimed water, and they provide a method of determining the optimum planting conditions required to inhibit algal blooms using plant pioneer combinations.

2. Materials and Methods

2.1. Material and Cultivation

2.1.1. Algae

Algae was separated and concentrated from lake water on the north shore of Dianchi Lake, Kunming city in Yunnan province. According to the microscopy, 5 phylum and 26 genera of the component of phytoplankton were detected from the lake of Dianchi. Chlorophyta, Cyanophyta and Bacillariophyta were the main algal phyla. The abundance of Cyanophyta was the highest, accounting for 61.2%, followed by Chlorophyta, accounting for 27.5%. Microcystis was the dominant genus in Dianchi Lake. The percentages of the main algal taxon in Dianchi Lake were shown in Table 1.
BG-11 medium was used to preserve the algae. The culture conditions were as follows: light intensity 4000 ± 10 lx, light-to-dark ratio 12 h:12 h, temperature 25 ± 2 °C, and the medium was shaken regularly twice a day. One week before conducting experiments, 500 mL of algal liquid was precultured to encourage its rapid growth. Thereafter, the algae liquid in a fast-growing state was washed three times with 15 mg/L NaHCO3 solution and then subjected to high-speed centrifugation at 4000 rpm for 10 min; it was then used for each experiment.

2.1.2. Submerged Macrophytes

Hydrilla verticillata and Myriophyllum spicatum are two pioneer species that were used in previous studies (unpublished) due to their efficient algal-suppressing abilities. M. spicatum is an aquatic plant with high allelopathic potential. It can release various types of polyphenols, such as ellagic acid, gallic acid and (+)-catechin, at high dosages [15,27]. The effective phenolic acid dose secreted by H. verticillata is lower than that of M. spicatum [28], but it can secrete fatty acids, which work synergistically with phenolic acids in algae suppression [29]. Both plants are indigenous species in many water bodies, and they have strong adaptability and pollution resistance [30]. Therefore, they were chosen for use in this present study.
H. verticillata and M. spicatum were collected from a lakeside in the wetland area. The fresh macrophytes were rinsed with tap water to remove zooplankton and phytoplankton, planted in 20 L glass cylinder with a soilless cultivation base and pebbles (to fix the plants). They were grown in a greenhouse for at least two weeks to ensure their adaptation to laboratory conditions. Healthy plants were then selected and rinsed with tap water again to confirm that any attached phytoplankton was removed [31]. Before experimenting, the plants underwent aerated culture in tap water for three days.

2.1.3. Tested Water

The actual landscape water was used for the experiment, which was taken from Kunming city, Yunnan province. A 0.45 μm filter membrane was used in the actual landscape water pretreatment to remove algae and other suspended solids.

2.2. Experimental Method

Submerged macrophytes in the same growth states were fixed to a plastic base in quartz sand and placed in a beaker containing 1000 mL of landscape water. An initial inoculation amount of 105 cell/mL pretreated algae was employed. Beakers from each experimental group were sealed with sterile air filters to prevent external microorganisms and bacteria from entering the coculture system. The control group was not coculture with submerged macrophytes. The experimental groups were set in the following three ways: (1)–(3). All groups were repeated three times.
(1)
The single planting density of H. verticillata and M. spicatum was set as 0, 5, 10, 15 and 20 g/L to determine the suitable combined planting density range. The planting density was set according to previous studies, it had reported significant allelopathic effects on algae with a plant density of 1–10 g, or 14.38 g wet weight/L [19,32], so the tested planting density was 0–20 g/L;
(2)
The two submerged macrophytes were combined and planted according to the planting experimental scheme. It was obtained using the CCD unit in the Design Expert software. The scheme was set based on the suitable combined planting density range;
(3)
To verify the reliability of the model and the synergistic algal-inhibiting effect of the plant assemblage, the following was applied: single planting groups EG1 (H. verticillata = x + y g/L) and EG2 (M. spicatum = x + y g/L) and an optimum combined planting group, EG3, acquired from the results of CCD model analysis (H. verticillata = x g/L, M. spicatum = y g/L).
Each experimental group was placed in an artificial climate incubator. The optimum temperature and light intensity for the algae pretested (Figure S1) was combined with the actual climatic conditions of Dianchi Lake (Figure S2). The experimental conditions were as follows: light intensity 4000 ± 10 lx, light-to-dark ratio 12 h:12 h, temperature 25 ± 2 °C. The experimental period was approximately 30 days, and samples were taken every three days at 10:00 am. Indicator measurements were completed within one day of sampling. The algal density was measured by a hemocytometer. The algal abundance was measured by a microscope and PHYTO-PAM-II. The fresh weight of submerged macrophytes was measured by an electronic balance.

2.3. Data Analysis

2.3.1. Kinetic Analysis of Algal Growth

The inhibitory effect on algal growth parameters was evaluated by the inhibitory ratio defined in Equation (1) [33],
I = (N0 − N)/N0 × 100
The logistic growth model in Equation (2) was used to fit kinetic parameters to algal growth and nutrient uptake data and is expressed as follows [34,35],
Nt = 1/K + exp (art)
where Nt (cell/mL) is the algal density at time t; K (cell/mL) represents the maximum algal biomass; r (d−1) is the specific growth rate of the culture; a is the model parameter and t (d) is time.
The maximum growth rate of the population (Rmax) of a culture can be determined by Equation (3),
Rmax = r × K/4
and according to the definition of specific growth rate, it can be calculated by Equation (4).
μ = dN/Ndt = r × (KN)/K
However, μmax was employed as the major analytical indicator of the specific growth rate in this study, as it represents the growth rate occurring when the limiting substrate concentration tended to infinity.

2.3.2. Macrophyte Growth Analysis

The relative growth yield (RGY) can directly reflect the growing trend of plants. RGY represents the proportion of net growth biomass to the initial biomass within a certain period, and its expression is shown in Equation (5),
RGY = (W2 − W1)/W1 × 100
where W1 (g) is the initial fresh weight of plants, and W2 (g) is the fresh weight of plants at the end of the experiment.

2.3.3. Response Surface Methodology

The experimental design was created using the CCD unit in Design Expert software 10.0. Experimental results were input, and the model was then fitted and analyzed. According to the principle of CCD and research contents, the planting densities of H. verticillata (A) and M. spicatum (B) were designed as two factors. The three response variables were the inhibitory rate of algal biomass (I(K)), and the relative growth yield (RGY) of the two plants, respectively. The limit levels of the two factors were obtained concerning the effects of planting density on algal suppression and the growth of the two plants. The experimental scheme involving the two factors and five levels was then further designed by CCD. The program consisted of 13 experimental groups (2k + 2k + m; where k is the number of factors (here 2) and m is the number of replications conducted at the central repoints (here 5)), eight of which were used to analyze the influence of different factors on the response variables, and the other five groups were used to evaluate the errors relating to the central experimental group.
Based on the experimental results, a quadratic polynomial regression model (Equation (6)) was established,
Y = β 0 + i = 1 2 β i X i + i = 1 2 β i i X i 2 + i = 1 2 j = 1   ( i j ) 2 β i j X i X j + ε
where Y is the response variable, β0 is the interception coefficient, β i and β i i are model coefficients of the first and second order, respectively, β i j is the linear model coefficient for interaction between the independent variables i and j; X i and X j are factors, respectively and ε is random error [36]. The relationship between the independent variables and response variables were then further revealed using the equation. The optimal conditions were obtained by deriving the partial derivatives of Equation (6).
SPSS 18.0 and Origin 8.5 software was used to conduct statistical analyses and to prepare figures, respectively. The significant differences of the effects of treatments were assessed by the analysis of variance (ANOVA) with multiple comparisons (Tukey’s test), where a significant level of p < 0.05 was accepted for all statistical analyses.

3. Results

3.1. Effect of Different Planting Densities

3.1.1. Growth Characteristics of Algae

H. verticillata and M. spicatum significantly inhibited the algal density from Day 4 (p = 0.006), which was the period when the algae began to enter the logarithmic growth stage (Figure 1a). The inhibitory effect on algal growth increased with the increase of planting density under the planting density of 0–15 g/L. Above this critical planting level of 15 g/L, the growth curve for algae was similar for both coculture groups. When algal growth entered a relatively stable stage, the inhibitory effect of H. verticillata was better than M. spicatum at the same planting level.
To further study, the logistic model (Equation (2)) was used to fit algal growth kinetics. Results showed that two plants not only significantly inhibited the algal biomass (K) but also the growth rate (Rmax, μmax; Figure 1b–d). The K, Rmax and μmax decreased with the increase of macrophyte density in the 0–15 g/L groups. There were no significant differences between the 15 g/L group and 20 g/L group in these three parameters. Under the same planting density, the K value in the H. verticillata group was lower than that in the M. spicatum group (p = 0.044), but the μmax value in the H. verticillata group was higher than that in the M. spicatum group (p = 0.042).

3.1.2. Growth Characteristics of Submerged Macrophytes

The higher planting density of submerged macrophytes had a negative impact on themselves. The relative growth yield (RGY) of the two macrophytes rose slightly and then decreased sharply with an increase in planting density (Figure 2). H. verticillata achieved a maximum RGY value of 75.17% at a planting density of 15 g/L, which was significantly higher than that in the 20 g/L group (41.29%). For M. spicatum, the highest RGY value was obtained at a planting density of 10 g/L density (which reached 46.67%), and this was significantly higher than that of the 15 g/L and 20 g/L groups (14.19% and 12%, respectively).
According to the above experimental results, the most suitable density for the planting of two plants was 5–15 g/L, which can achieve an effective algal-inhibiting ability and plant growth status. Additionally, 15 g/L was a maximum planting density for practical applications, as it had a similar inhibitory effect on algal growth when the planting density was higher than this value.

3.2. Optimization of Algal Suppression Using Combined Plants

3.2.1. Design of CCD and Associated Results

CCD was further used to determine the optimal combined conditions for the two macrophytes. Since 5–15 g/L was the suitable planting density range of the two plants, the maximum combined planting density was 15 g/L and the minimum value was 5 g/L. According to the principle of CCD and the range of planting density, the maximum level of the two factors (planting density of H. verticillata (A) and M. spicatum (B)) of 7.5 g/L, the minimum level of 2.5 g/L, the central level of 5 g/L and the α value were obtained using the CCD, respectively. The combined planting experiment was carried out on the basis of the CCD experimental scheme, and the algal biomass and the relative growth index of two plants were measured as the response variables. The particular level of factors, experimental scheme and results were shown in Table 2.

3.2.2. Analysis of I (K) in Different Treatments Based on the CCD Model

The binary quadratic regression equation with the response value I(K) and the two independent factors were obtained, as shown in Equation (7). The ANOVA analysis was evaluated prior to using the equation, it showed that the eigenvalue F was 289.74, R2 and Adj-R2 were 0.9952 and 0.9918, respectively, and the lack of fit F-value was 3.19 (p = 0.1461; Table S1). The precision value of the model (51.37) was larger than Criterion 4, which showed it was highly reliable for use in forecasting. Therefore, the predicted equation could be used instead of the measured value to evaluate the algal-inhibiting effect of the mixed planting.
I(K) = 14.24 + 11.94 × A + 10.46 × B − 0.56 × A × B − 0.57A2 − 0.48B2
Through visual analysis, the degree of interaction between various factors and the trend of response variables with a change in factors was obtained (Figure 3). The value of I (K) increased with a rise in the plant density. When factors A (7.17 g/L) and B (6.73 g/L), the optimal combined planting condition was obtained. The maximum I (K) value was 92.2%, which was significantly higher than the maximum inhibition rate under the 20 g/L single planting condition (85.5%).
The contour of the model was an ellipse. It demonstrated that the interaction between A and B had a significant impact on the response variable [37], which was identical to the ANOVA result (p (AB) = 0.0001). Therefore, the value of I (K) was greatly affected by the two plants jointly, and the effect of the combined ratio (A/B) could not be neglected.
According to Equation (7), the relationship between the combined planting density, planting ratio (A/B) of two plants under different I (K) values were obtained (Figure 4a). At the same I (K) value, the combined planting density decreased sharply and then increased slowly with an increase in the planting ratio (A/B). So, the inflection point of contour line represented the minimum planting density at the same I (K) value. Furthermore, the minimum planting density that corresponded to the x-axis was the optimal planting ratio by default. The relationship between the optimal planting ratio and minimum planting density with the change in I (K) was analyzed (Figure 4b). With a rise in the value of I (K), the optimal planting ratio decreased gradually and tended to be 1.05, the minimum planting density increased linearly at first. However, the minimum planting density rose exponentially when the I (K) value exceeded 90%. The minimum planting density was 11.6 g/L, and the optimal planting ratio (A/B) was 1.08 when the I (K) value was 90%.

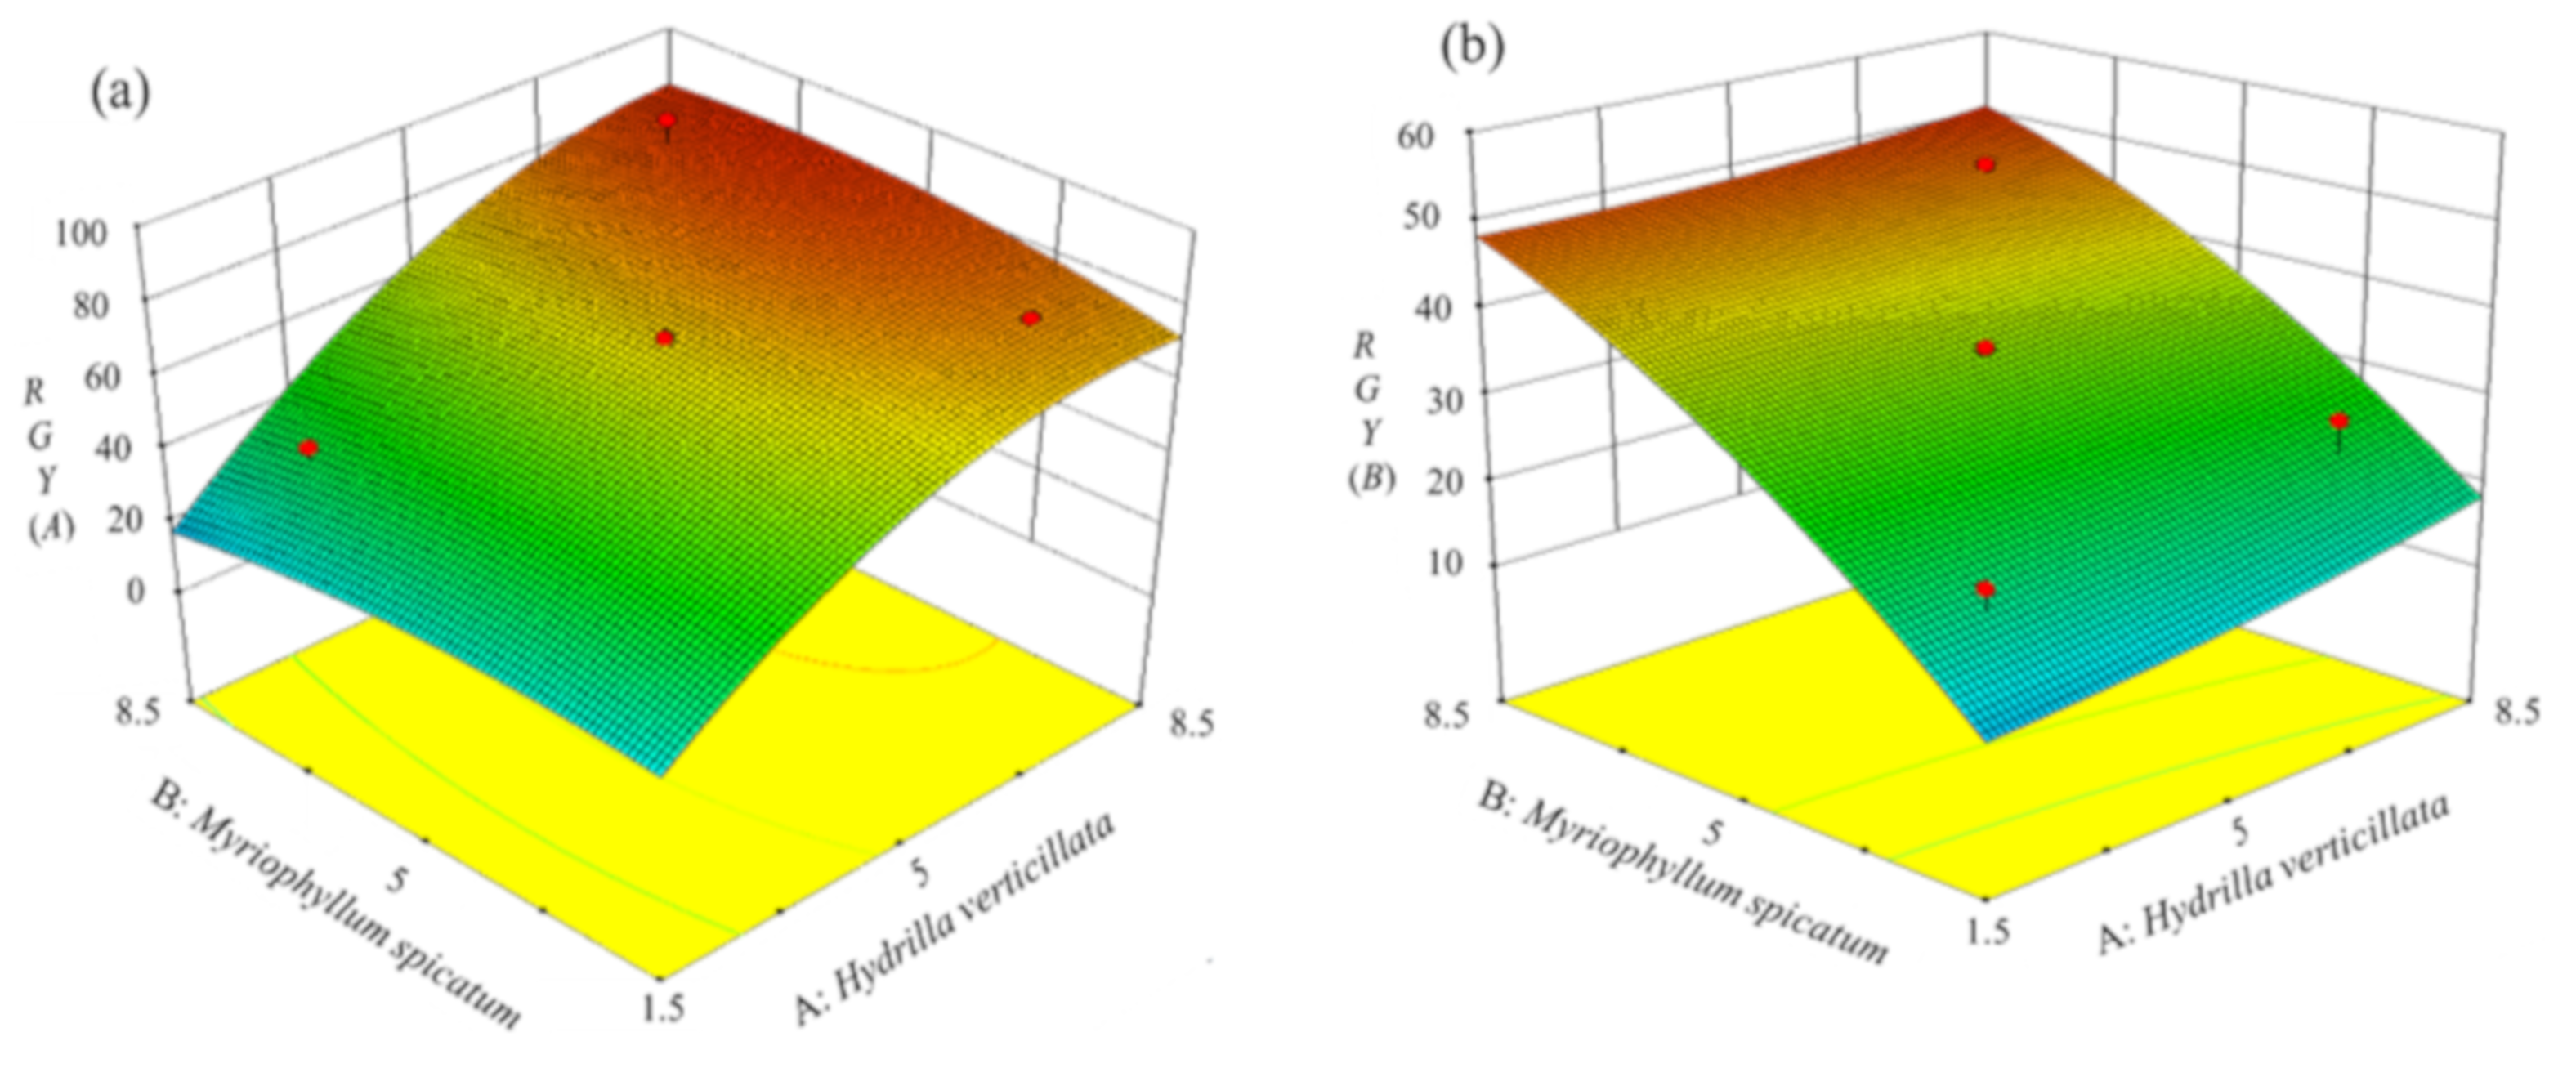
3.2.3. Analysis of RGY in Different Treatments Based on the CCD Model

The binary quadratic regression equations of RGY (A) and RGY (B) were shown as Equations (8) and (9) respectively.
RGY (A) = −8.95 + 19.10 × A + 4.11 × B + 0.078 × A × B − 1.14A2 − 0.44B2
RGY (B) = 5.61 − 2.21 × A + 8.44 × B − 0.06 × A × B + 0.29A2 − 0.32B2
For the two equations, the eigenvalue F was 120.1 and 72.68, respectively. Additionally, R2 was 0.9885 and 0.9802, respectively. Furthermore, the misstated fit F-value of the RGY (A) model was 1.84, (p = 0.2803) and RGY (B) model was 2.47 (p = 0.2010; Table S2, Table S3). The precision values of both models were greater than Criterion 4. Therefore, the two equations could be used instead of the measured data to evaluate the growth of two plants in combined planting.
With the increase of planting density, the RGY of both plants firstly increased and then leveled out (Figure 5). According to the two equations, RGY(A) reached 80.88% and RGY(B) reached 44.08% under optimal conditions. These values were within the error of values obtained by a single planting.

3.3. Verification Test of the CCD Model

To test the reliability of the CCD method and the synergistic effect of combined planting, four symbiosis experiments were conducted with a control group (CG): 13.9 g/L H. verticillata (EG1), 13.9 g/L M. spicatum (EG2) and 7.2 g/L H. verticillata + 6.7 g/L M. spicatum (EG3). The theoretical values of RGY(A), RGY(B) and I(K) were calculated by CCD, it was consistent with the verified values within a reasonable error range (Table 3). Thus, the CCD methodology can be applied to determine algal suppression optimization.
The values of algal density, μmax, K and Rmax in the EG3 group were significantly lower than the EG1 and EG2 groups during the entire culture period (Figure 6a–c). The value of I (K) in the EG3 group was higher at 10.8% and 14.1% than those in the EG1 and EG2 groups. The μ value of algae in the EG3 group was 39.9% and 53.5% lower than that of EG1 and EG2 groups. Moreover, the algae in the EG3 group had a significantly shorter logarithmic growth period than that of the other groups. These results indicated that combined planting maintained a strong synergistic effect on algal inhibition throughout the test period, both in terms of biomass and on the growth rate of algae.
According to the percentage of algal abundance in each group, Cyanophyta and Chlorophyta were dominant during the experimental period (Figure 6d). Compared with the control group, the results shown that the proportion of Cyanophyta gradually decreased and Chlorophyta gradually increased. However, the percentage of algal abundance remained stable under a single planting and combination planting.

4. Discussion

4.1. Synergistic Effect of Combined Submerged Macrophyte Planting

The combined planting of H. verticillata and M. spicatum had a synergistic effect on algal inhibition, due to the results that show combined planting had a stronger algal inhibition than single planting at the same plant density. The synergism may be related to the following reasons. First, the two plants have different dominant anti-algal characteristics. According to the results, the effect of H. verticillata on inhibiting algal biomass was superior to that of M. spicatum, but M. spicatum provided superior inhibition of the specific growth rate of algae. The different anti-algal properties of these two macrophytes can then be further analyzed with respect to their growth characteristics. H. verticillata has a competitive advantage in shading, as the light crowns form rapidly. It can also reproduce readily via fragmentation and tubers, which increases its ability to uptake nutrients [38,39,40]. Thus, it can control algal biomass by limiting the external conditions required for algal growth [7]. In contrast, M. spicatum can secrete more allelochemicals at effective dosages and repeatedly throughout a culture cycle [41]. These substances can cause irreversible damage to algal cells [31]. This will lead to the growth rate of algae decrease [42]. Therefore, H. verticillata and M. spicatum have their dominant inhibitory effects on algal biomass or growth rate. Additionally, the algal growth is inhibited synergistically in the process of combined planting of the two plants.
It is also considered that the synergistic inhibitory effect of combined planting may be related to the various types of allelochemicals secreted by the two plants. Different allelochemicals have diverse targets and mechanisms for the algal cells. For example, polyphenols released by M. spicatum mostly act on the PSII system and inhibit photosynthetic electron transport [15] H. verticillata excels in secreting substances that damage the cellular ultrastructure, especially the destruction of the plasma membrane and thylakoid lamellae [18].
Moreover, macrophytes can produce secondary metabolites under stress due to interspecific competition, which may be detrimental to algal growth [43]. Our previous research showed that H. verticillata had a higher potential absorption of P, which is the main limiting index of algal growth [44]. TP in the H. verticillata group decreased to below 0.01 mg/L sharply in the early stage, creating a low phosphorus environment. However, M. spicatum can release more polyphenols at low levels of P, which enhances the inhibition of alkaline phosphatase in algal cells and reduces its P absorption capacity [19]. Therefore, the combined planting of the two plants can achieve synergistic algal inhibition.

4.2. Stability of Combined Planting

The stability of plant combination is a problem that is inevitable in a practical application. Although the biomass accumulation of H. verticillata was significantly higher than that of M. spicatum (p = 0.002) at the same planting level, and this association is also found in the study of Wang [33]. However, that does not mean that H. verticillata has an interspecific advantage when mixed planted with M. spicatum. The contours of RGY (A) and RGY (B) models were found to be round, and the shape of contours showed that the two macrophytes had a minimal effect on each other [37]. Therefore, the growth of H. verticillata and M. spicatum was less interfered by each other and the plant combination composed of the two plants is stable.
Furthermore, M. spicatum and H. verticillata have good adaptability and greater pollution resistance in polluted landscape water bodies. The two plants can overcome the inhibition of insufficient light through stem elongation. Moreover, M. spicatum has a strong resistance to waves in flowing water due to its morphological characteristics of tenacious stems [45], while H. verticillata has little deficiency in this respect. Therefore, the combined planting of the two macrophytes may compensate for their disadvantages when planted separately.

4.3. Optimization of Plant Combination in Practical Application

Although the plant combination achieved the highest I (K) value (92.2%) using optimal planting conditions, the effect of further improving algal inhibition by increasing the planting density is limited when I (K) > 90%. Compared with the optimal planting conditions, the planting density of submerged plants decreased by 16.5% when the I (K) value achieved 90%. In consideration of the practical application, the following are suggested: the density of combined planting is set as 11.6 g/L and the planting ratio (A/B) should be 1.05–1.07. Under the optimized conditions, the plant combination can also achieve a higher inhibitory effect (I (K) = 90%).
The study shows that the upper planting density provided a stronger algal inhibitory ability in a certain range. However, plant biomass may exceed the range of suitable planting density during the experimental period. It may not be possible to maintain efficient relative growth ability and have a negative impact on the growth of submerged macrophytes [46]. Thus, a quantitative harvest is essential for maintaining plants at the appropriate planting density to enable a better growth state. Previous studies have shown that both H. verticillata and M. spicatum are well tolerant of periodic reaping [47], and they are useful for removing N and P from the water and sediment [48]. Moreover, aquatic plants are more likely to release allelochemicals in their vigorous growth period [18]. At present, it is considered that a harvesting frequency of 2–3 times is the most appropriate frequency during a plant’s growth cycle [49]. Therefore, in practical applications, appropriate harvesting should be conducted to ensure the suitable planting density. It can be beneficial for maintaining the stability of plant growth and algal inhibition when the plant density is kept at below 15 g/L.

5. Conclusions

The synergistic effect on algal growth effects of combined planting of H. verticillata and M. spicatum was evaluated in this study. The optimum combined planting condition was determined. The results indicated that the interaction between the two plants had a significant effect on algal inhibition, the growth of plants was less interfered with by each other in the combined planting. Although an increased planting density improved the inhibitory effect on the algal biomass, the higher density was not beneficial for macrophyte growth. The planting density of 7.2 g/L H. verticillata and 6.7 g/L M. spicatum was the optimum combined planting condition, with this, the I (K) value could reach 92.2%. However, the effect of algal inhibition was not significantly improved with the increase of planting density when I (K) > 90%. Thus, to make this application cost-effective, it was recommended that the combined planting density should be 11.6 g/L, and the planting ratio (A/B) should be 1.05–1.07, the value of I (K) could achieve 90%. The combined planting had a synergistic algal-inhibiting effect, the inhibition higher than 10.8% of single planting with the same density. The synergism may be caused by the different anti-algal properties of the two plants. H. verticillata is good at inhibitory properties at algal biomass, and M. spicatum was advantageous for inhibiting the specific growth rate of algae. Moreover, different allelochemicals and secondary metabolites produced by plants may also be the reasons for the synergistic effect.
The present study confirms the synergistic effect of combined macrophyte planting on inhibiting algae. It provided an optimized method of plant combinations that can be used to achieve algal suppression. It also represents a theoretical basis for restoring aquatic plant communities in landscape waters. However, it is necessary to research the application of plant combinations with algal inhibition in field conditions. Therefore, the optimization method proposed in this study can be further used to determine the synergistic effect on algal inhibition of various plant combinations in different field landscape waters.

Supplementary Materials

The following are available online at https://www.mdpi.com/2073-4441/12/8/2093/s1, Figure S1: I Growth curve of algae in Dianchi Lake under different culture temperature (a) and light intensity (b), Figure S2: Changes of water temperature in Dianchi Lake during the past twenty years, Table S1: ANOVA for CCD, Table S2: ANOVA for CCD, Table S3: ANOVA for CCD.

Author Contributions

Conceptualization, H.H., Y.L. and G.D.; methodology, S.W. and G.D.; software, S.W.; validation, S.W., L.Y. and G.D.; formal analysis, S.W., G.D.; investigation, S.W., J.Y., Y.L. and G.D.; resources, F.G., G.P., L.Z. and Y.L.; data curation, S.W. and J.Y.; writing—original draft preparation, S.W.; writing—review and editing, S.W., J.Y., Y.L. and G.D.; visualization, D.G.; supervision, Y.L. and F.G.; project administration, F.G., H.H. and Y.L.; funding acquisition, F.G., G.P., L.Z. and H.H. All authors have read and agreed to the published version of the manuscript.

Funding

This research was funded by [Science and Technology Department of Yunnan Province] grant number [2018BC001-3], [National Key Research and Development Program of China] grant number [2018YFC0406300], [Kunming Dianchi Water Treatment Co., Ltd.]. And The APC was funded by [Kunming Dianchi Water Treatment Co., Ltd.].

Conflicts of Interest

The authors declare that they have no conflicts of interests or personal relationships that could have appeared to influence the work reported in this paper.

References

  1. Sun, R.; Chen, L. How can urban water bodies be designed for climate adaptation? Landsc. Urban Plan 2012, 105, 27–33. [Google Scholar] [CrossRef]
  2. The United Nations. World Water Development Report: Leaving No One Behind; The United Nations: Geneva, Switzerland, 2019. [Google Scholar]
  3. Wei, D.; Tan, Z.; Du, Y. A Biological Safety Evaluation on Reclaimed Water Reused as Scenic Water Using a Bioassay Battery. Environ. J. Sci. 2019, 23, 1611–1618. [Google Scholar] [CrossRef]
  4. Zhang, J.; Wei, Z.; Jia, H.; Huang, X. Factors Influencing Water Quality Indices in a Typical Urban River Originated with Reclaimed Water. Front. Environ. Sci. Eng. 2017, 11, 8. [Google Scholar] [CrossRef]
  5. Hampel, J.J.; McCarthy, M.J.; Gardner, W.S. Nitrification and Ammonium Dynamics in Taihu Lake, China: Seasonal Competition for Ammonium between Nitrifiers and Cyanobacteria. Biogeosciences 2018, 15, 733–748. [Google Scholar] [CrossRef] [Green Version]
  6. Paerl, H.W.; Scott, J.T.; Mccarthy, M.J. It Takes Two to Tango: When and Where Dual Nutrient (N & P) Reductions are Needed to Protect Lakes and Downstream Ecosystems. Environ. Sci. Technol. 2016, 50, 10805–10813. [Google Scholar] [CrossRef] [PubMed] [Green Version]
  7. Huisman, J.; Codd, G.A.; Paerl, H.W. Cyanobacterial Blooms. Nat. Rev. Microbiol. 2018, 16, 471–483. [Google Scholar] [CrossRef]
  8. Lau, S.; Lane, S.N. Nutrient and Grazing Factors in Relation to Phytoplankton Level in a Eutrophic Shallow Lake: The Effect Of Low Macrophyte Abundance. Water Res. 2002, 36, 3593–3601. [Google Scholar] [CrossRef]
  9. Paerl, H.W.; Otten, T.G. Harmful Cyanobacterial Blooms: Causes, Consequences, and Controls. Microb. Ecol. 2013, 65, 995–1010. [Google Scholar] [CrossRef]
  10. Nakai, S.; Zou, G.; Okuda, T.; Nishijima, W.; Hosomi, M.; Okada, M. Polyphenols and Fatty Acids Responsible for Anti-Cyanobacterial Allelopathic Effects of Submerged Macrophyte, Myriophyllum Spicatum. Water Sci. Technol. 2012, 66, 993. [Google Scholar] [CrossRef]
  11. Wu, Q.; Hu, Y.; Li, S.; Peng, S.; Zhao, H. Microbial Mechanisms of Using Enhanced Ecological Floating Beds for Eutrophic Water Improvement. Bioresour. Technol. 2016, 211, 451–456. [Google Scholar] [CrossRef]
  12. Espinosaortiz, E.J.; Rene, E.R.; Pakshirajan, K.; Van Hullebusch, E.D.; Lens, P.N. Fungal Pelleted Reactors in Wastewater Treatment: Applications and Perspectives. Chem. Eng. J. 2016, 283, 553–571. [Google Scholar] [CrossRef]
  13. Sun, R.; Sun, P.; Zhang, J.; Esquivel-Elizondo, S.; Wu, Y. Microorganisms-Based Methods for Harmful Algal Blooms Control: A Review. Bioresour. Technol. 2018, 248, 12–20. [Google Scholar] [CrossRef] [PubMed]
  14. Scheffer, M. Ecology of shallow lakes. In Population & Community Biology; Springer Science & Business Media: Berlin, Germany, 1997. [Google Scholar] [CrossRef]
  15. Zhu, J.; Liu, B.; Wang, J.; Gao, Y.; Wu, Z. Study on the Mechanism of Allelopathic Influence on Cyanobacteria and Chlorophytes by Submerged Macrophyte (Myriophyllum Spicatum) and its Secretion. Aquat. Toxicol. 2010, 98, 196–203. [Google Scholar] [CrossRef] [PubMed]
  16. Wang, R.; Hua, M.; Yu, Y.; Zhang, M.; Xian, Q.-M.; Yin, D.-Q. Evaluating the Effects of Allelochemical Ferulic Acid on Microcystis Aeruginosa by Pulse-Amplitude-Modulated (Pam) Fluorometry and Flow Cytometry. Chemosphere 2016, 147, 264–271. [Google Scholar] [CrossRef]
  17. Wu, Z.; Shi, J.; Yang, S. The Effect of Pyrogallic Acid on Growth, Oxidative Stress, and Gene Expression in Cylindrospermopsis Raciborskii (Cyanobacteria). Ecotoxicology 2012, 22, 271–278. [Google Scholar] [CrossRef]
  18. Mohamed, Z.A. Macrophytes-Cyanobacteria Allelopathic Interactions and their Implications for Water Resources Management-A Review. Limnology 2017, 63, 122–132. [Google Scholar] [CrossRef]
  19. Hilt, S.; Gross, E.M. Can Allelopathically Active Submerged Macrophytes Stabilise Clear-Water States in Shallow Lakes? Basic Appl. Ecol. 2008, 9, 422–432. [Google Scholar] [CrossRef] [Green Version]
  20. Cheng, F.; Cheng, Z.H. Research Progress on the Use of Plant Allelopathy in Agriculture and the Physiological and Ecological Mechanisms of Allelopathy. Front. Plant Sci. 2015, 6, 1697. [Google Scholar] [CrossRef]
  21. Zuo, S.P.; Wan, K.; Ma, S.; Ye, L.T. Combined Allelopathic Potential of Aquatic Plants Species to Control Algae. Allelopath. J. 2014, 34, 315–323. [Google Scholar]
  22. Rojo, C.; Segura, M.; Rodrigo, M.A. The Allelopathic Capacity of Submerged Macrophytes Shapes the Microalgal Assemblages from a Recently Restored Coastal Wetland. Ecol. Eng. 2013, 58, 149–155. [Google Scholar] [CrossRef]
  23. Schamphelaere, K.; Vasconcelos, F.M.; Heijerick, D.G.; Tack, F.M.; Delbeke, K.; Allen, H.E.; Janssen, C.R. Development and Field Validation of a Predictive Copper Toxicity Model for the Green Alga Pseudokirchneriella Subcapitata. Environ. Toxicol. Chem. 2003, 22, 2454–2465. [Google Scholar] [CrossRef] [PubMed]
  24. Arazo, R.O.; Genuino, D.A.D.; De Luna, M.D.G.; Capareda, S.C. Bio-Oil Production from Dry Sewage Sludge by Fast Pyrolysis in An Electrically-Heated Fluidized Bed Reactor. Sustain. Environ. Res. 2017, 27, 7–14. [Google Scholar] [CrossRef]
  25. Dastkhoon, M.; Ghaedi, M.; Asfaram, A.; Arabi, M.; Ostovan, A.; Goudarzi, A. Cu@Sns/Sno2 Nanoparticles as Novel Sorbent for Dispersive Micro Solid Phase Extraction of Atorvastatin in Human Plasma and Urine Samples by High-Performance Liquid Chromatography with Uv Detection: Application of Central Composite Design (CCD). Ultrason. Sonochem. 2017, 36, 42–49. [Google Scholar] [CrossRef] [PubMed]
  26. Asfaram, A.; Ghaedi, M.; Yousefi, F.; Dastkhoon, M. Experimental Design and Modeling of Ultrasound Assisted Simultaneous Adsorption of Cationic Dyes Onto Zns: Mn-Nps-Ac From Binary Mixture. Ultrason. Sonochem. 2016, 33, 77–89. [Google Scholar] [CrossRef] [PubMed]
  27. Techer, D.; Fontaine, P.; Personne, A.; Viot, S.; Thomas, M. Allelopathic Potential and Ecotoxicity Evaluation of Gallic and Nonanoic Acids to Prevent Cyanobacterial Growth in Lentic Systems: A Preliminary Mesocosm Study. Sci. Total. Environ. 2016, 547, 157–165. [Google Scholar] [CrossRef] [PubMed]
  28. Zhang, T.T.; Zheng, C.Y.; Hu, W.; Xu, W.-W.; Wang, H.-F. The Allelopathy and Allelopathic Mechanism of Phenolic Acids on Toxic Microcystis Aeruginosa. J. Appl. Phycol. 2010, 22, 71–77. [Google Scholar] [CrossRef]
  29. Zuo, S.P.; Zhou, S.; Ye, L.; Ma, S. Synergistic and Antagonistic Interactions among Five Allelochemicals with Antialgal Effects on Bloom-Forming, Microcystis Aeruginosa. Ecol. Eng. 2016, 97, 486–492. [Google Scholar] [CrossRef]
  30. Liu, F.; Zhang, S.; Luo, P.; Zhuang, X.; Chen, X.; Wu, J. Purification and Reuse of Non-Point Source Wastewater via, Myriophyllum -Based Integrative Biotechnology: A Review. Bioresour. Technol. 2018, 248, 3–11. [Google Scholar] [CrossRef]
  31. He, Y.; Zhou, Q.H.; Liu, B.Y.; Cheng, L.; Tian, Y.; Zhang, Y.-Y.; Wu, Z.-B. Programmed Cell Death in the Cyanobacterium Microcystis Aeruginosainduced by Allelopathic Effect of Submerged Macrophyte Myriophyllum Spicatumin Co-culture . Environ. Boil. Fishes 2016, 28, 2805–2814. [Google Scholar] [CrossRef]
  32. Korner, S.; Nicklisch, A. Allelopathic Growth Inhibition of Selected Phytoplankton Species by Submerged Macrophyes. J. Phycol. 2002, 38, 862–871. [Google Scholar] [CrossRef]
  33. Wang, J.W.; Yu, D.; Xiong, W.; Han, Y.-Q. Above- And Belowground Competition between Two Submersed Macrophytes. Hydrobiology 2008, 607, 113–122. [Google Scholar] [CrossRef]
  34. Park, Y.T.; Lee, H.; Yun, H.S.; Song, K.-G.; Yeom, S.-H.; Choia, J. Removal of Metal from Acid Mine Drainage Using a Hybrid System Including a Pipes Inserted Microalgae Reactor. Bioresour. Technol. 2013, 150, 242–248. [Google Scholar] [CrossRef] [PubMed]
  35. Huang, S.; Kong, W.; Yang, Z.; Yu, H.; Li, F. Combination of Logistic and Modified Monod Functions to Study Microcystis Aeruginosa Growth Stimulated by Fish Feed. Ecotoxicol. Environ. Saf. 2019, 167, 146–160. [Google Scholar] [CrossRef] [PubMed]
  36. Banerjee, A.; Guria, C.; Maiti, S.K.; Banerjee, C.; Shukla, P. Carbon Bio-Fixation, Effect of Physicochemical Factors and Carbon Supply Strategies by Nannochloropsis Sp. Using Flue Gas and Fertilizer. Biomass Bioenergy 2019, 125, 95–104. [Google Scholar] [CrossRef]
  37. Priyadharshini, S.; Bakthavatsalam, A.K. Optimization of Phenol Degradation by the Microalga Chlorella Pyrenoidosa Using Plackett-Burman Design and Response Surface Methodology. Bioresour. Technol. 2016, 207, 150–156. [Google Scholar] [CrossRef] [PubMed]
  38. Barrow, J.L.; Beisner, B.E.; Giles, R.; Domaizon, I.; Gregory-Eaves, I. Macrophytes Moderate the Taxonomic and Functional Composition of Phytoplankton Assemblages during a Nutrient Loading Experiment. Freshw. Boil. 2019, 64, 1369–1381. [Google Scholar] [CrossRef]
  39. Blindow, I.; Hargeby, A.; Andersson, G. Seasonal Changes of Mechanisms Maintaining Clear Water in a Shallow Lake with Abundant Chara Vegetation. Aquat. Bot. 2002, 72, 315–334. [Google Scholar] [CrossRef]
  40. Mony, C.; Koschnick, T.J.; Haller, W.T.; Muller, S. Competition between Two Invasive Hydrocharitaceae (Hydrilla Verticillata (l.f.) (Royle) and Egeria Densa (Planch)) as Influenced by Sediment Fertility and Season. Aquat. Bot. 2007, 86, 236–242. [Google Scholar] [CrossRef]
  41. Gao, Y.N.; Ge, F.J.; Zhang, L.P.; He, Y.; Lu, Z.Y.; Zhang, Y.Y.; Liu, B.Y.; Zhou, Q.H.; Wu, Z.B. Enhanced Toxicity to the Cyanobacterium Microcystis Aeruginosa by Low-Dosage Repeated Exposure to the Allelochemical N-Phenyl-1-Naphthylamine. Chemosphere 2017, 174, 732–738. [Google Scholar] [CrossRef]
  42. Kayombo, S.; Mbwette, T.; Katima, J.; Jorgensen, S. Effects of Substrate Concentrations on the Growth of Heterotrophic Bacteria and Algae in Secondary Facultative Ponds. Water Res. 2003, 37, 2937–2943. [Google Scholar] [CrossRef]
  43. Phillips, G.; Willby, N.; Moss, B. Submerged Macrophyte Decline in Shallow Lakes; What have We Learnt in the Last Forty Years? Aquat. Bot. 2016, 135, 37–45. [Google Scholar] [CrossRef] [Green Version]
  44. Schindler, D.W.; Hecky, R.E.; Findlay, D.L.; Stainton, M.P.; Parker, B.R.; Paterson, M.J.; Beaty, K.G.; Lyng, M.; Kasian, S.E.M. Eutrophication of Lakes Cannot be Controlled by Reducing Nitrogen Input: Results of a 37-Year Whole-Ecosystem Experiment. Proc. Natl. Acad. Sci. USA 2008, 105, 11254–11258. [Google Scholar] [CrossRef] [Green Version]
  45. Barrat-Segretain, M.H. Biomass Allocation in Three Macrophyte Species in Relation to the Disturbance Level of Their Habitat. Freshw. Boil. 2001, 46, 935–945. [Google Scholar] [CrossRef]
  46. Bornette, G.; Puijalon, S. Response of Aquatic Plants to Abiotic Factors: A Review. Aquat. Sci. 2010, 73, 1–14. [Google Scholar] [CrossRef]
  47. Richardson, R.J. Aquatic Plant Management and the Impact of Emerging Herbicide Resistance Issues. Weed Technol. 2008, 22, 8–15. [Google Scholar] [CrossRef]
  48. Kuiper, J.J.; Kuiper, J.J.; Verhofstad, M.J.; Louwers, E.L.; Bakker, E.S.; Brederveld, R.J.; van Gerven, L.P.; Janssen, A.B.; de Klein, J.J.; Mooij, W.M. Mowing Submerged Macrophytes in Shallow Lakes with Alternative Stable States: Battling the Good Guys? Environ. Manag. 2017, 59, 619–634. [Google Scholar] [CrossRef] [PubMed] [Green Version]
  49. Verhofstad, M.; Poelen, M.; Van Kempen, M.; Bakker, E.S.; Smolders, A. Finding the Harvesting Frequency to Maximize Nutrient Removal in a Constructed Wetland Dominated by Submerged Aquatic Plants. Ecol. Eng. 2017, 106, 423–430. [Google Scholar] [CrossRef]
Figure 1. Changes in the (a) growth curve, (b) maximum algal biomass, K, (c) maximum population growth rate, Rmax and (d) maximum specific growth rate, μmax of algae with changes in planting density from 0 to 20 g/L. Results are expressed as average ± SD (n = 3).
Water 12 02093 g001
Figure 2. Relative growth yield (RGY) of submerged macrophytes with planting densities of 5 g/L to 20 g/L. Results are expressed as average ± SD (n = 3).
Water 12 02093 g002
Figure 3. 3D surface graph of factors A and B and response variable I(K).
Water 12 02093 g003
Figure 4. Relationship between the (a) planting ratio (A/B) and planting density and (b) optimal planting ratio and minimum planting density of two plants with a change in I(K).
Water 12 02093 g004
Figure 5. 3D surface plots showing interactions between the planting density of (A) H. verticillata and (B) M. spicatum with respect to the relative growth yield (RGY) ((a) RGY (A) and (b) RGY (B)).
Water 12 02093 g005
Figure 6. Changes in algal growth curves: (a) maximum algal biomass K, (b) maximum population growth rate Rmax and (c) specific growth rate, μ and (d) algal abundance, under single planting and combined planting treatments. Results are expressed as average ± SD (n = 3).
Water 12 02093 g006
Table 1. The list of the main algal taxon with the percentage of abundance in Dianchi Lake.
NumberNamePercentage of Abundance (%)NumberNamePercentage of Abundance (%)
Cyanophyta61.210Ulothrix0.25
1Microcystis58.5411Crucigenia0.19
2Anabaena0.7412Cosmarium0.14
3Aphanizomenon1.5913Chlamydomonas0.10
4Dactylococcopsis0.23Bacillariophyta9.73
5Chroococcus0.0971Melosira4.79
Chlorophyta27.52Cyclotella4.39
1Scenedesmus20.733Navicula0.34
2Pediastrum1.644Navicula0.22
3Oocystis2.08Pyrrophyta0.37
4Chodatela0.101Ceratium0.16
5Strurastrum0.252Peridinium0.21
6Schroederia0.07Cryptophyta1.2
7Selenastrum1.741Cryptomonas0.94
8Closterium0.172Chroomonas0.26
9Tetraedron0.05
Table 2. Calculation results of central composite design (CCD).
NumberFactorsResponse Variable
Coded LevelData Level
ABABI (K)%RGY (A)%RGY (B)%
1−1−12.52.561.4238.721.2
21−17.52.584.8977.0227.2
3−112.57.582.0141.543.67
4117.57.591.4589.7747.2
5−α01.46565.8625.6726.84
6α08.54592.1683.8639.04
70−α51.4668.7965.637.06
80α58.5490.6666.5453.4
9005585.9871.6335.59
10005586.1467.734.9
11005585.426934
12005585.6967.132.16
13005587.1371.535.72
Table 3. Results of the CCD verification experiment.
Theoretical Value (%)Verified Value (%)
I(K)92.2091.45 ± 1.60
RGY(A)80.8881.05 ± 1.88
RGY(B)44.0842.80 ± 2.96

