Article

The Effect of a Sand Interlayer on Soil Evaporation during the Seasonal Freeze–Thaw Period in the Middle Reaches of the Yellow River

1
College of Water Resources Science and Engineering, Taiyuan University of Technology, Taiyuan 030024, China
2
Taigu Water Balance Experimental Field, Bureau of Hydrology and Water Resources Survey of Shanxi Province, Taigu 030800, China
*
Authors to whom correspondence should be addressed.
Co-first author: Jing Xue and Huijun Feng contributed equally to this work.
Water 2020, 12(8), 2092; https://doi.org/10.3390/w12082092
Submission received: 15 June 2020 / Revised: 20 July 2020 / Accepted: 21 July 2020 / Published: 23 July 2020
(This article belongs to the Section Water, Agriculture and Aquaculture)

Abstract

:
Reducing soil evaporation in arid and semi-arid areas of the Yellow River Basin greatly benefits the efficient utilization of water resources in winter and spring, particularly during the seasonal freeze–thaw period. We conducted a field experiment in winter to understand the influences of different sand interlayers (depths of 5, 10, and 15 cm and particle sizes of 0.5–1.5 mm and 2.0–2.5 mm) on soil evaporation during the seasonal freeze–thaw period. The results show that the sand interlayer reduced soil evaporation during the seasonal freeze–thaw period. Decreasing the depth of the sand layer was more effective at reducing the evaporation than increasing the grain size. Soil evaporation reduced as the sand interlayer approached the surface. With constant particle size, total soil evaporation decreased by 40%, 20%, and 18% for sand interlayer depths of 5, 10, and 15 cm, respectively, compared to the homogeneous soil column. With a constant sand interlayer depth, the inhibition of soil evaporation for a particle size of 0.5–1.5 mm was clear. That is significant for improving the efficient utilization of water resources and sustainable development of agriculture in the Yellow River Basin.

1. Introduction

The Jinzhong Basin, located in the middle reaches of the Yellow River, is a major grain production base in Shanxi Province [1]. Recently, water scarcity has become an important limiting factor for agricultural development in the province due to the influence of climate change and increasing human activities [2]. In seasonally frozen regions, soil water content prior to spring sowing is largely dependent on soil evaporation characteristics during the freeze–thaw period [3,4]. In the absence of autumn irrigation, soil evaporation from a bare plot was approximately 30 mm during the freeze–thaw period in this region [5]. Relatively high soil evaporation in the winter and spring create serious water resource shortages for spring sowing and summer planting. To mitigate these drought-related impacts, many methods to inhibit soil evaporation have been investigated [6]. Sand-layered soil is a common soil structure in the alluvial areas of the Jinzhong basin, greatly influencing soil evaporation [7]. Thus, to improve water use efficiency, it is important to study the effects of sand-layered soil on soil evaporation during the freeze–thaw period.
Many studies on measures to reduce soil evaporation for sand-layered soil have been focused on decreasing evaporation by hydraulic properties in layered soil [8,9]. Recent studies have mainly concentrated on two-layered and multi-layered soil evaporation [10,11,12]. Layered soil systems with coarse-over-finer material exhibited lower soil evaporation than homogeneous soil, as the gas phase preferentially invaded the larger pores in the coarse material. Systems with finer-over-coarse material could either increase or decrease soil evaporation, depending on the characteristic length of the fine material [13,14,15,16]. Water loss from soil evaporation mainly originated from the coarser material, whether in fine-over-coarse or coarse-over-fine material systems, until the coarser material was dry [17,18]. For soil columns with a sand interlayer each, soil evaporation has significantly been impacted by groundwater depth, grain composition, and the position of the interlayer [19,20]. Unger [21] confirmed that soil columns experienced smaller evaporative losses when the gravel layer was placed 5 cm below the surface, while the opposite occurred with a deeper interlayer. Shi et al. [22] studied soil evaporation of sand-layered soil columns with a water table of 50 cm. They found that soil evaporation in these columns was greatly influenced by the distance between the sand layer and water table. Due to the series of changes in soil physical properties from soil freezing and thawing that make the measurement of evaporation and mechanisms difficult [23,24], there has been less attention placed on sand-layer soil evaporation during the seasonal freeze–thaw period, especially in field experiments.
The objectives of this study were (a) to explore the distribution of soil water and temperature for sand-layered soil during the seasonal freeze–thaw period; (b) to analyze the effects of the depth and particle size of the sand interlayer on soil evaporation during the seasonal freeze–thaw period.

2. Materials and Methods

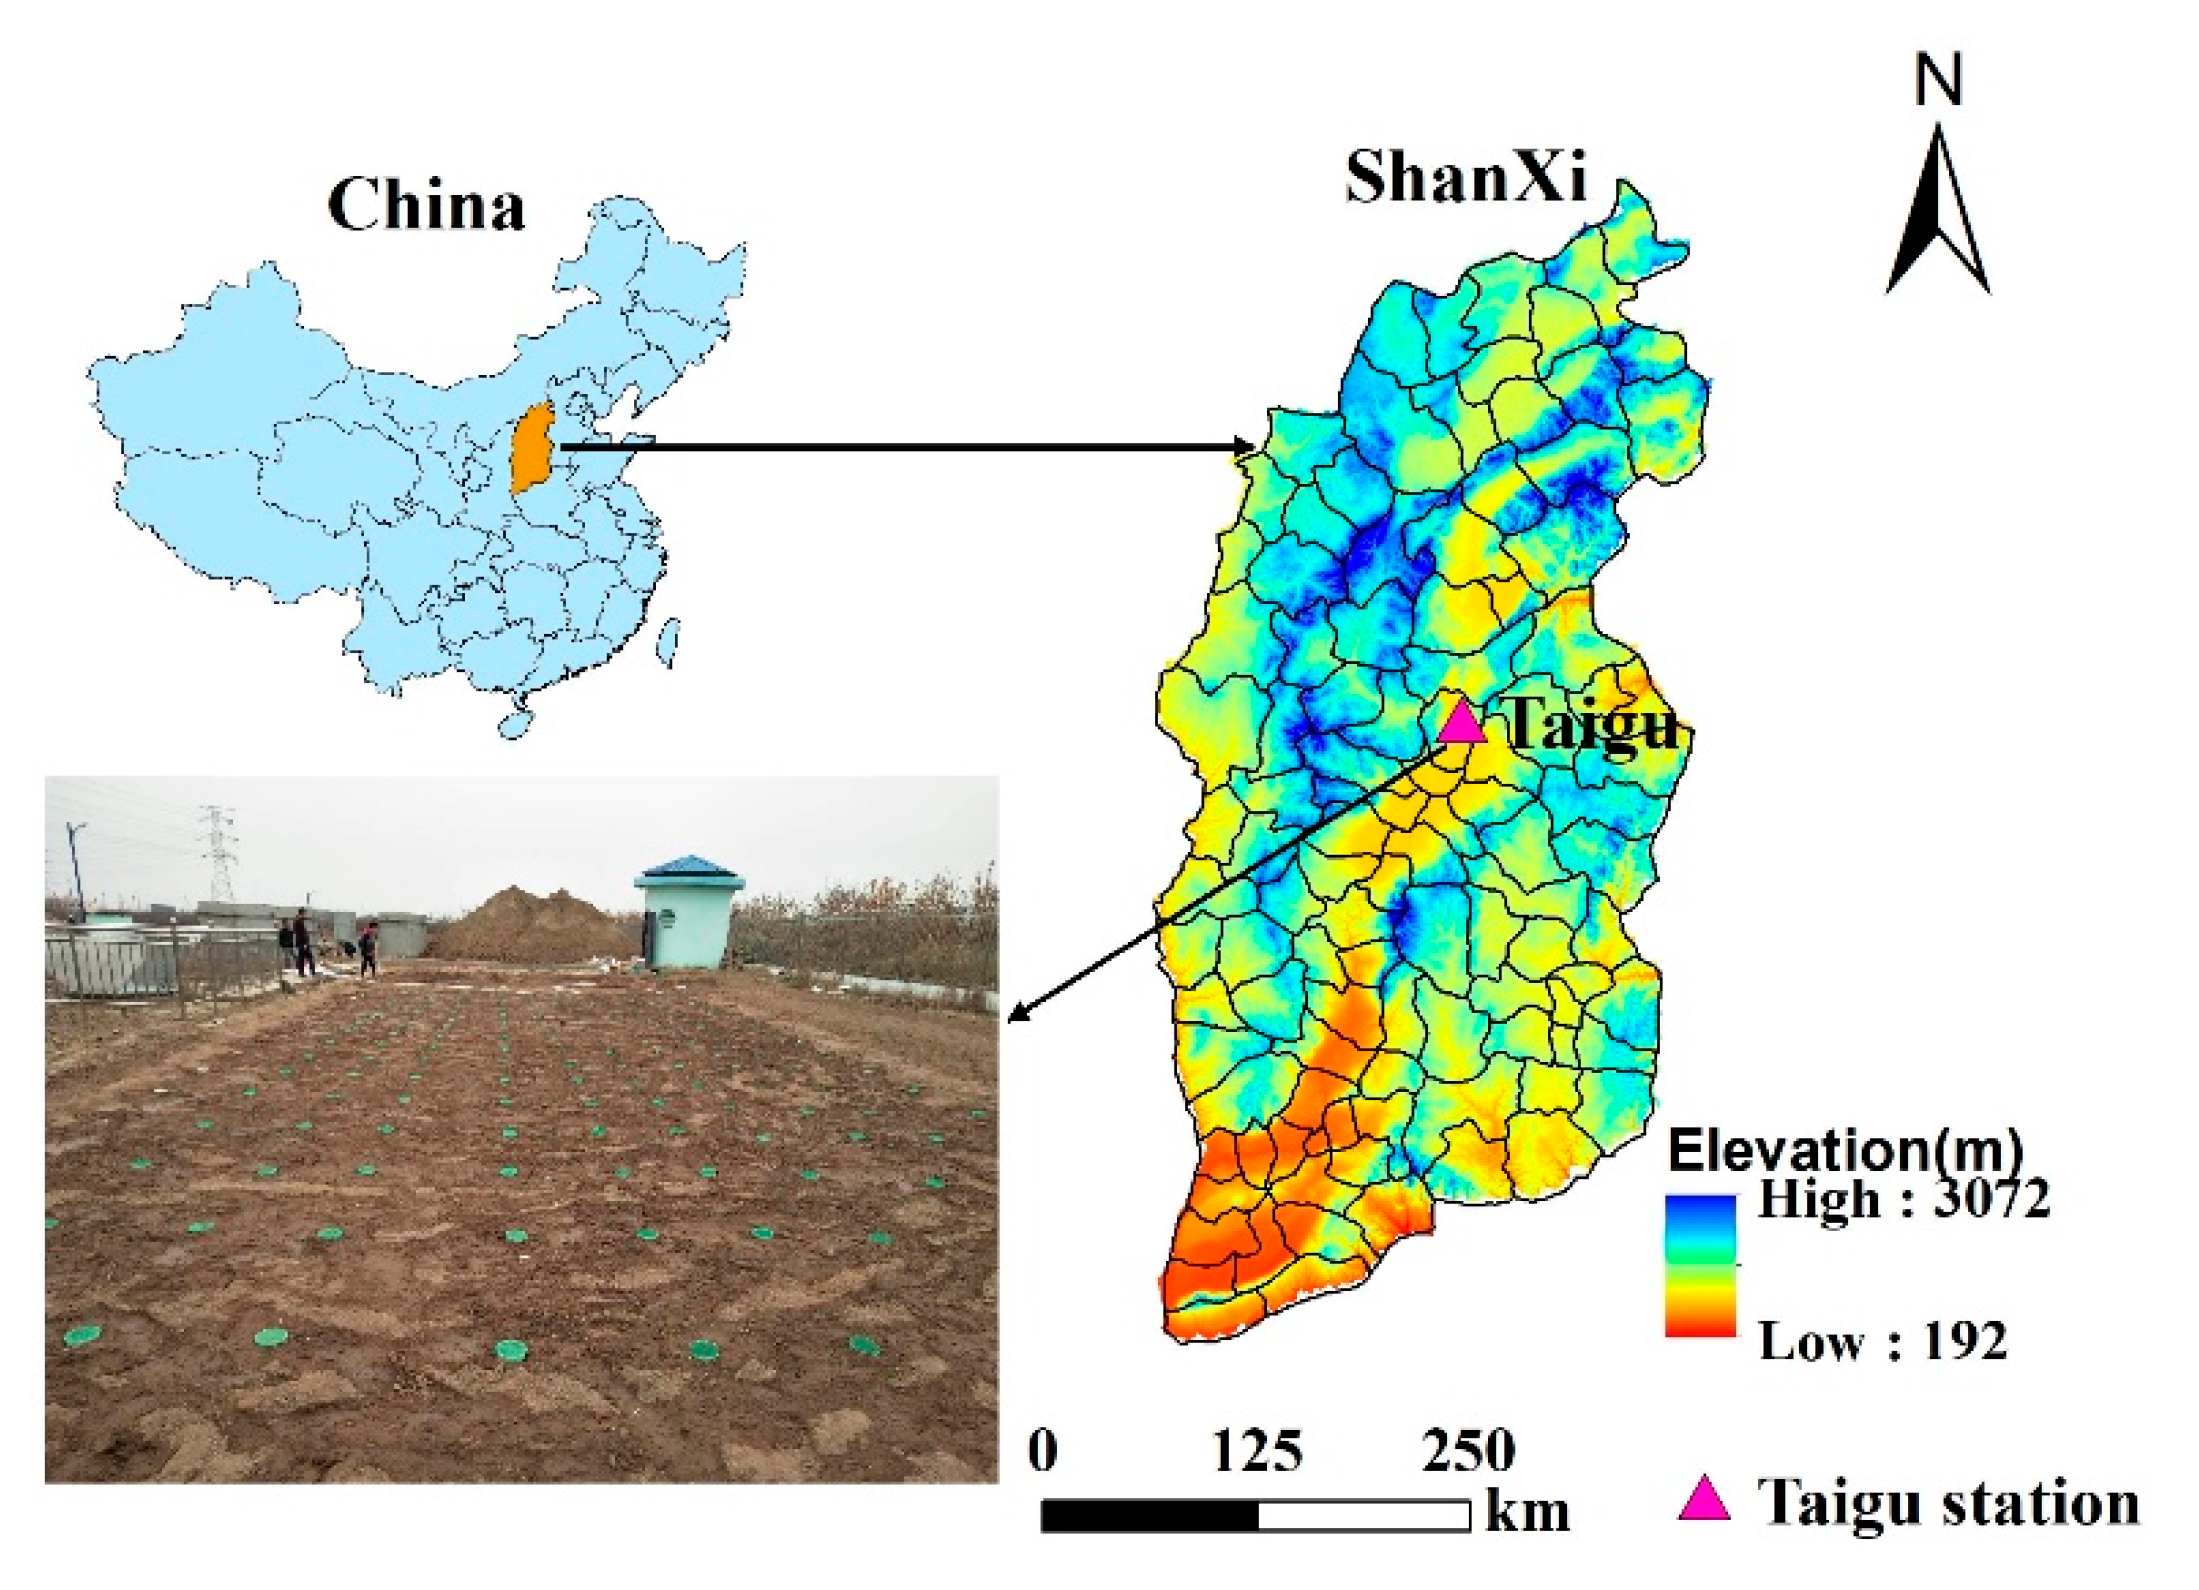
2.1. Site Description

Field experiments were conducted at the Taigu Water Balance Experimental Field located in the east of Jinzhong Basin (37°26′–37°27′ N, 112°30′–112°33′ E), Shanxi Province, from November 2018 to March 2019 (Figure 1). Taigu is characterized by a continental semi-arid climate, with annual average precipitation and pan evaporation of 415 and 1642 mm, respectively. The total solar radiation was 120.0 kJ·cm−2 from November 2018 to March 2019. The coldest month was December with mean air temperature and solar radiation of −5.2 °C and 18.6 kJ·cm−2 (Figure 2a), respectively. The maximum observed frost depth was 62 cm between 18 and 23 January 2019 (Figure 2b), and groundwater depth was 25.0 m. The soil freeze–thaw process was divided into three stages based on the natural freeze–thaw characteristics on bare land; P1 was the unstable freezing stage (11 November to 4 December 2018), P2 was the stable freezing stage (5 December 2018 to 23 January 2019), and P3 was the thawing stage (24 January to 21 March 2019).

2.2. Experimental Design and Measurement

Field experiments were conducted in a fallow plot from 18 November 2018 to 21 March 2019. The soil physical properties from depths between 0 and 100 cm in the plot are summarized in Table 1. The initial soil water content in the top 0–100 cm was approximately 0.20·cm−3 cm3, measured on 18 November 2018.
There were seven treatments in a single 30 × 21 m plot: a sand layer with particle sizes between 0.5–1.5 mm (S1) and 2.0–2.5 mm (S2) embedded at 5, 10, and 15 cm depths corresponding to D5, D10 and D15, respectively. These treatments were referred as D5S1, D10S1, D15S1, D5S2, D10S2, and D15S2, and the homogeneous soil column (HS) as the control; all treatments were replicated twice (Figure 3). The thickness of the sand layer was set at 2 cm for all treatments. The experimental procedure consisted of five steps:
(1)
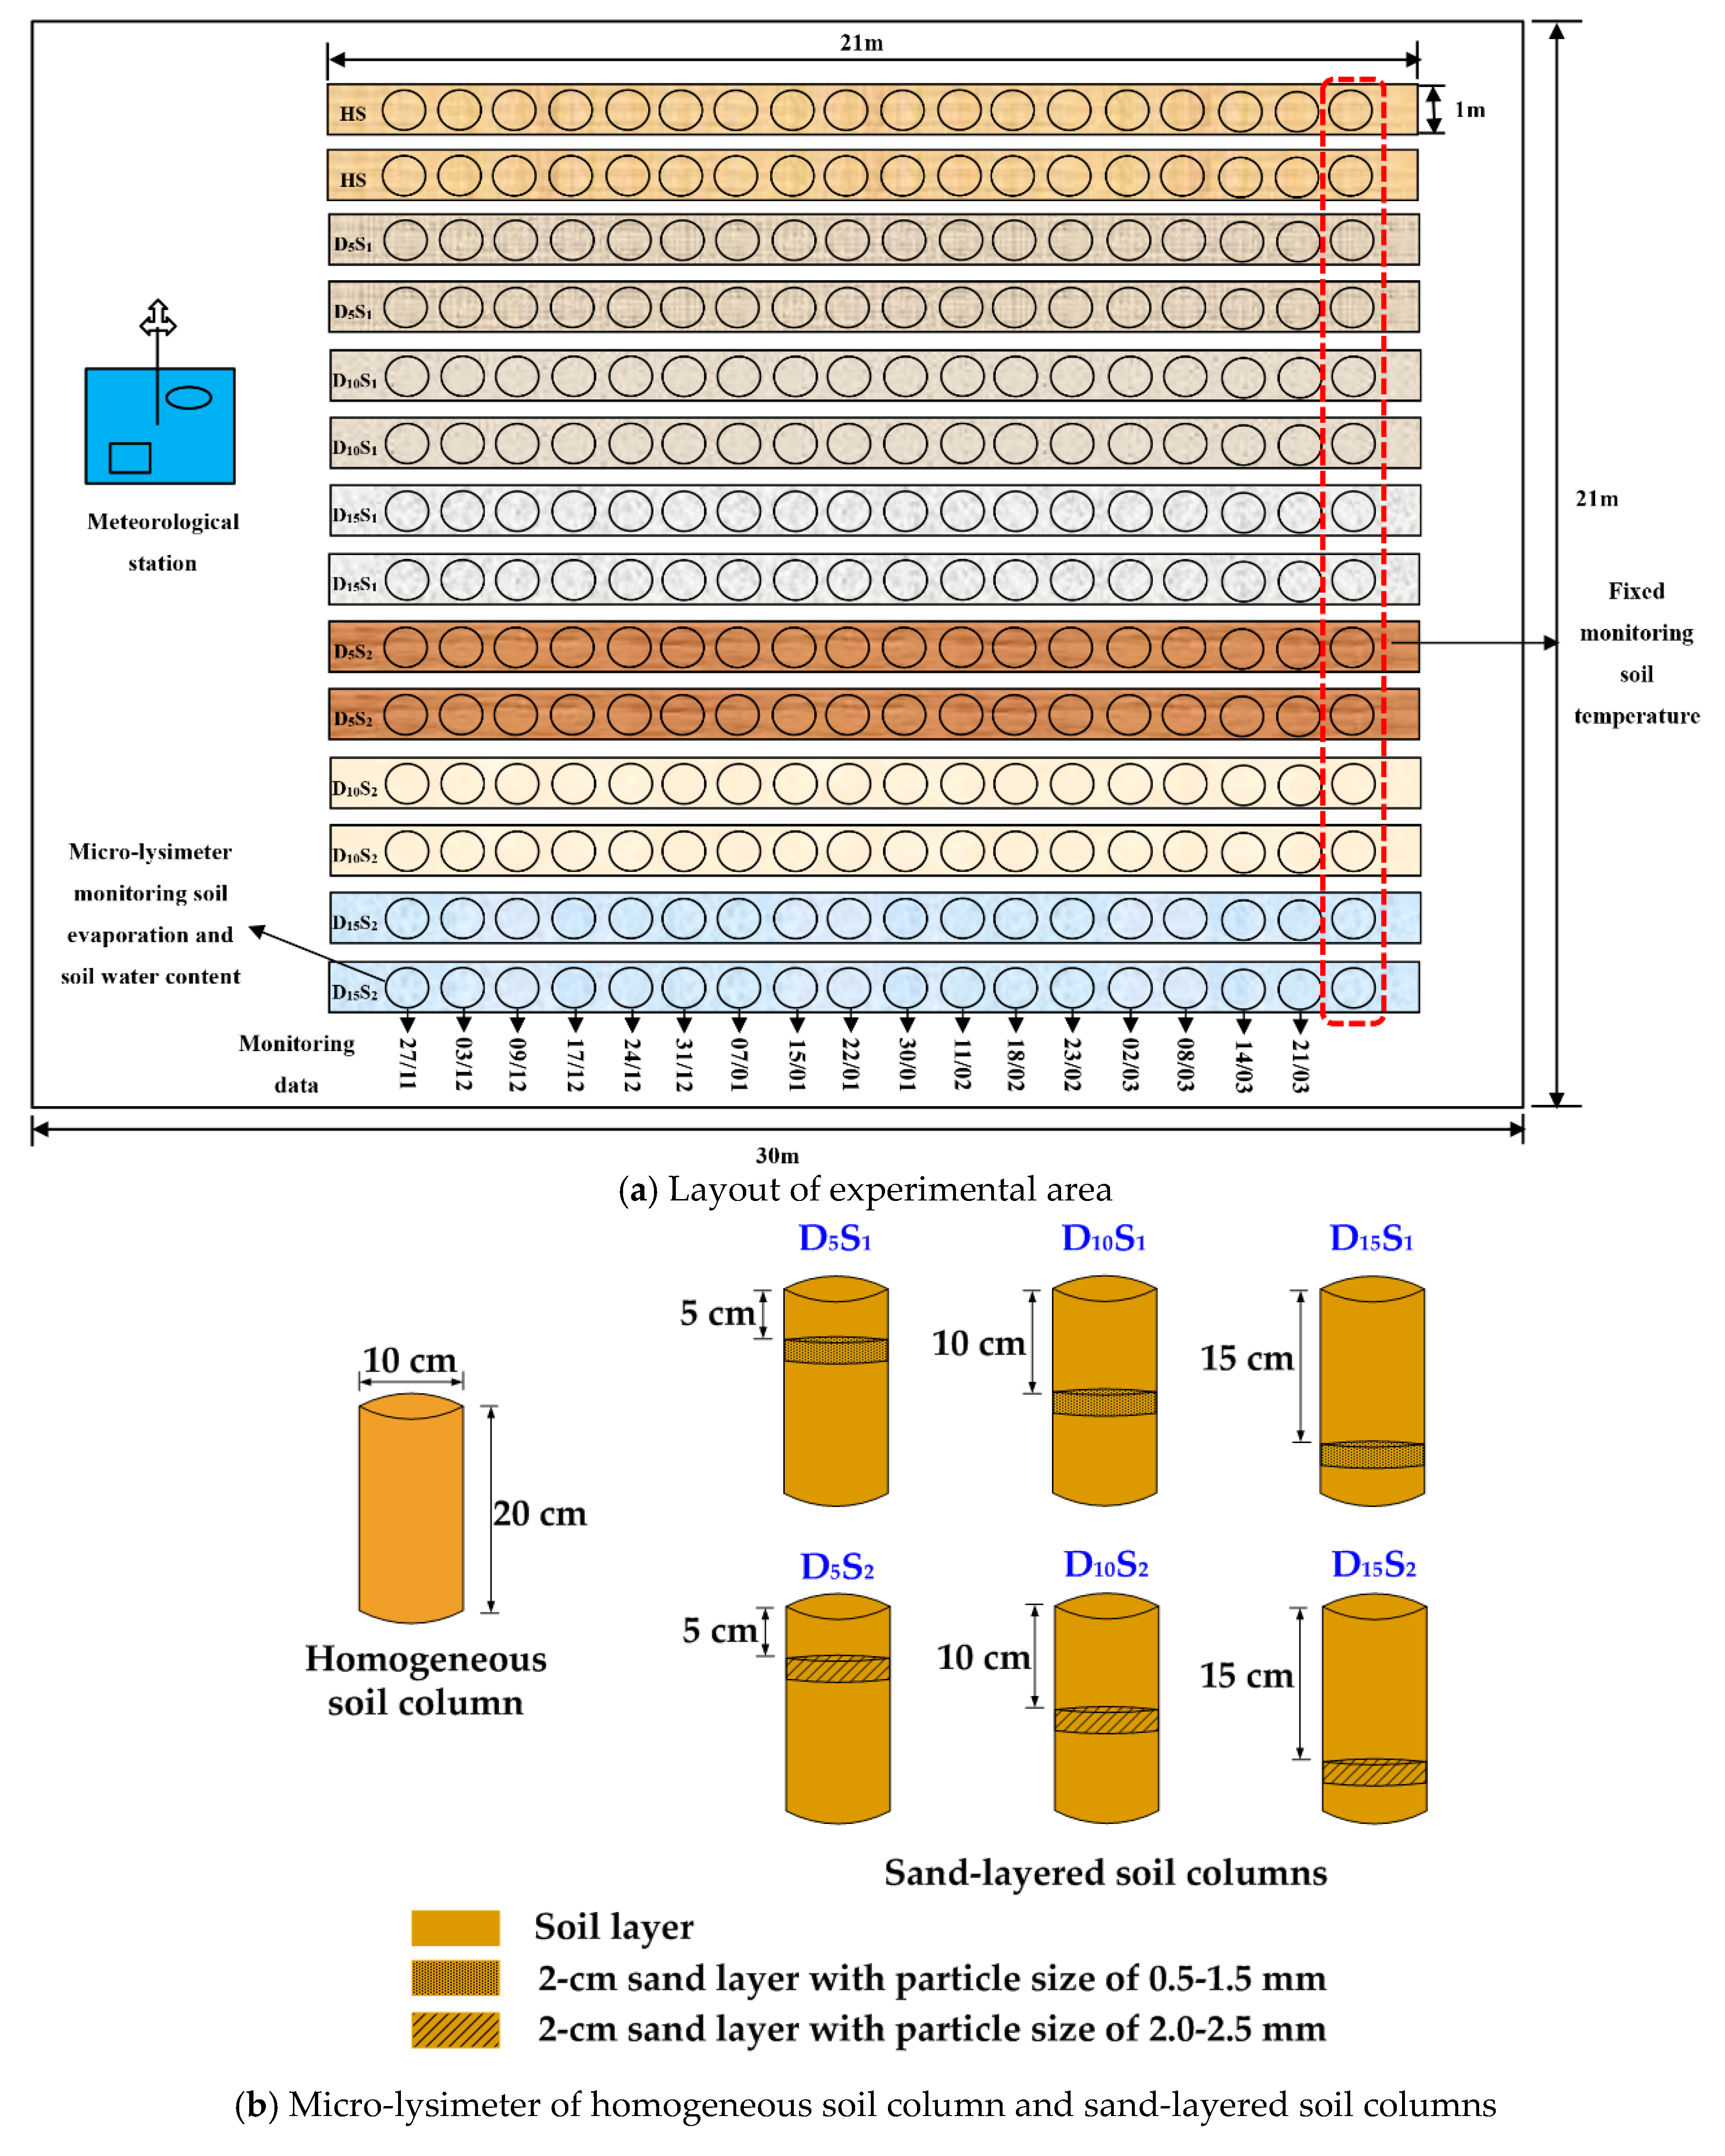
Preparing soil and sand samples. Micro-lysimeters that were 10 cm in diameter and 20 cm tall were used to measure soil evaporation. Soil filled in micro-lysimeters were sampled from the surface 20 cm in an idle plot, mixed well, and then passed through a 2 mm sieve to eliminate large soil chunks. Sand samples with particle sizes between 0.5–1.5 mm and 2.0–2.5 mm were also obtained by sieving sand. The initial water content of soil and sand was controlled at about 0.2 cm3·cm−3. The two particle sizes of the sand layer were classified as coarse sand and gravelly sand, based on the United States Department of Agriculture classification standard for soil particles.
(2)
Filling soil columns into micro-lysimeters. Following the preparation of the soil and sand samples, weighed soil and sand samples were layered into the micro-lysimeters with a bulk density of 1.40 g·cm−3. When packing soil columns, the bottoms of the micro-lysimeters were covered with a perforated gauze, which prevented the soil from falling out of the micro-lysimeters during the digging process, and enabled soil water exchange between micro-lysimeters and the underlying soil in the plot. Prior to the experiment, the 252 micro-lysimeters (7 treatments × 18 groups × 2 replications), were buried in the experimental field on 28 October 2018 with their top surface at the same elevation.
(3)
Measuring soil evaporation. Soil evaporation was measured by weighing micro-lysimeters using an electronic scale at 5–7 d intervals; the scale had a capacity of 15 kg and a readout of ±0.1 g. At the beginning of the experiment, the first seven micro-lysimeters corresponding to seven treatments were excavated, weighed, and buried in their previous positions until the second weighing after 5–7 d. The difference between the two weights was considered to be soil evaporation during this period, assuming that soil water migration was zero between the soil columns in the micro-lysimeters and the plot during this interval. Following the second weighing, these columns were discarded as the soil was damaged from monitoring soil water content. The second group of micro-lysimeters was used to measure soil evaporation in the next 5–7 d, and this process was repeated until soil evaporation at different times throughout the entire experimental period was obtained, equal to the sum of evaporations at different times.
(4)
Measuring soil water content and temperature. The soil water content for the seven treatments was monitored following the second weighing of the micro-lysimeters. Soil was sampled at 3 cm intervals from the micro-lysimeters; when sampling near the sand layer, this layer and the adjacent upper and lower soil layers were also sampled. All gravimetric water contents were calculated by oven drying at 105 °C for more than 10 h, and conversion into volumetric water content according to bulk density. Soil temperature was also measured at 3 cm intervals by thermistors installed in the last row of micro-lysimeters; these were only used to monitor the temperature.
(5)
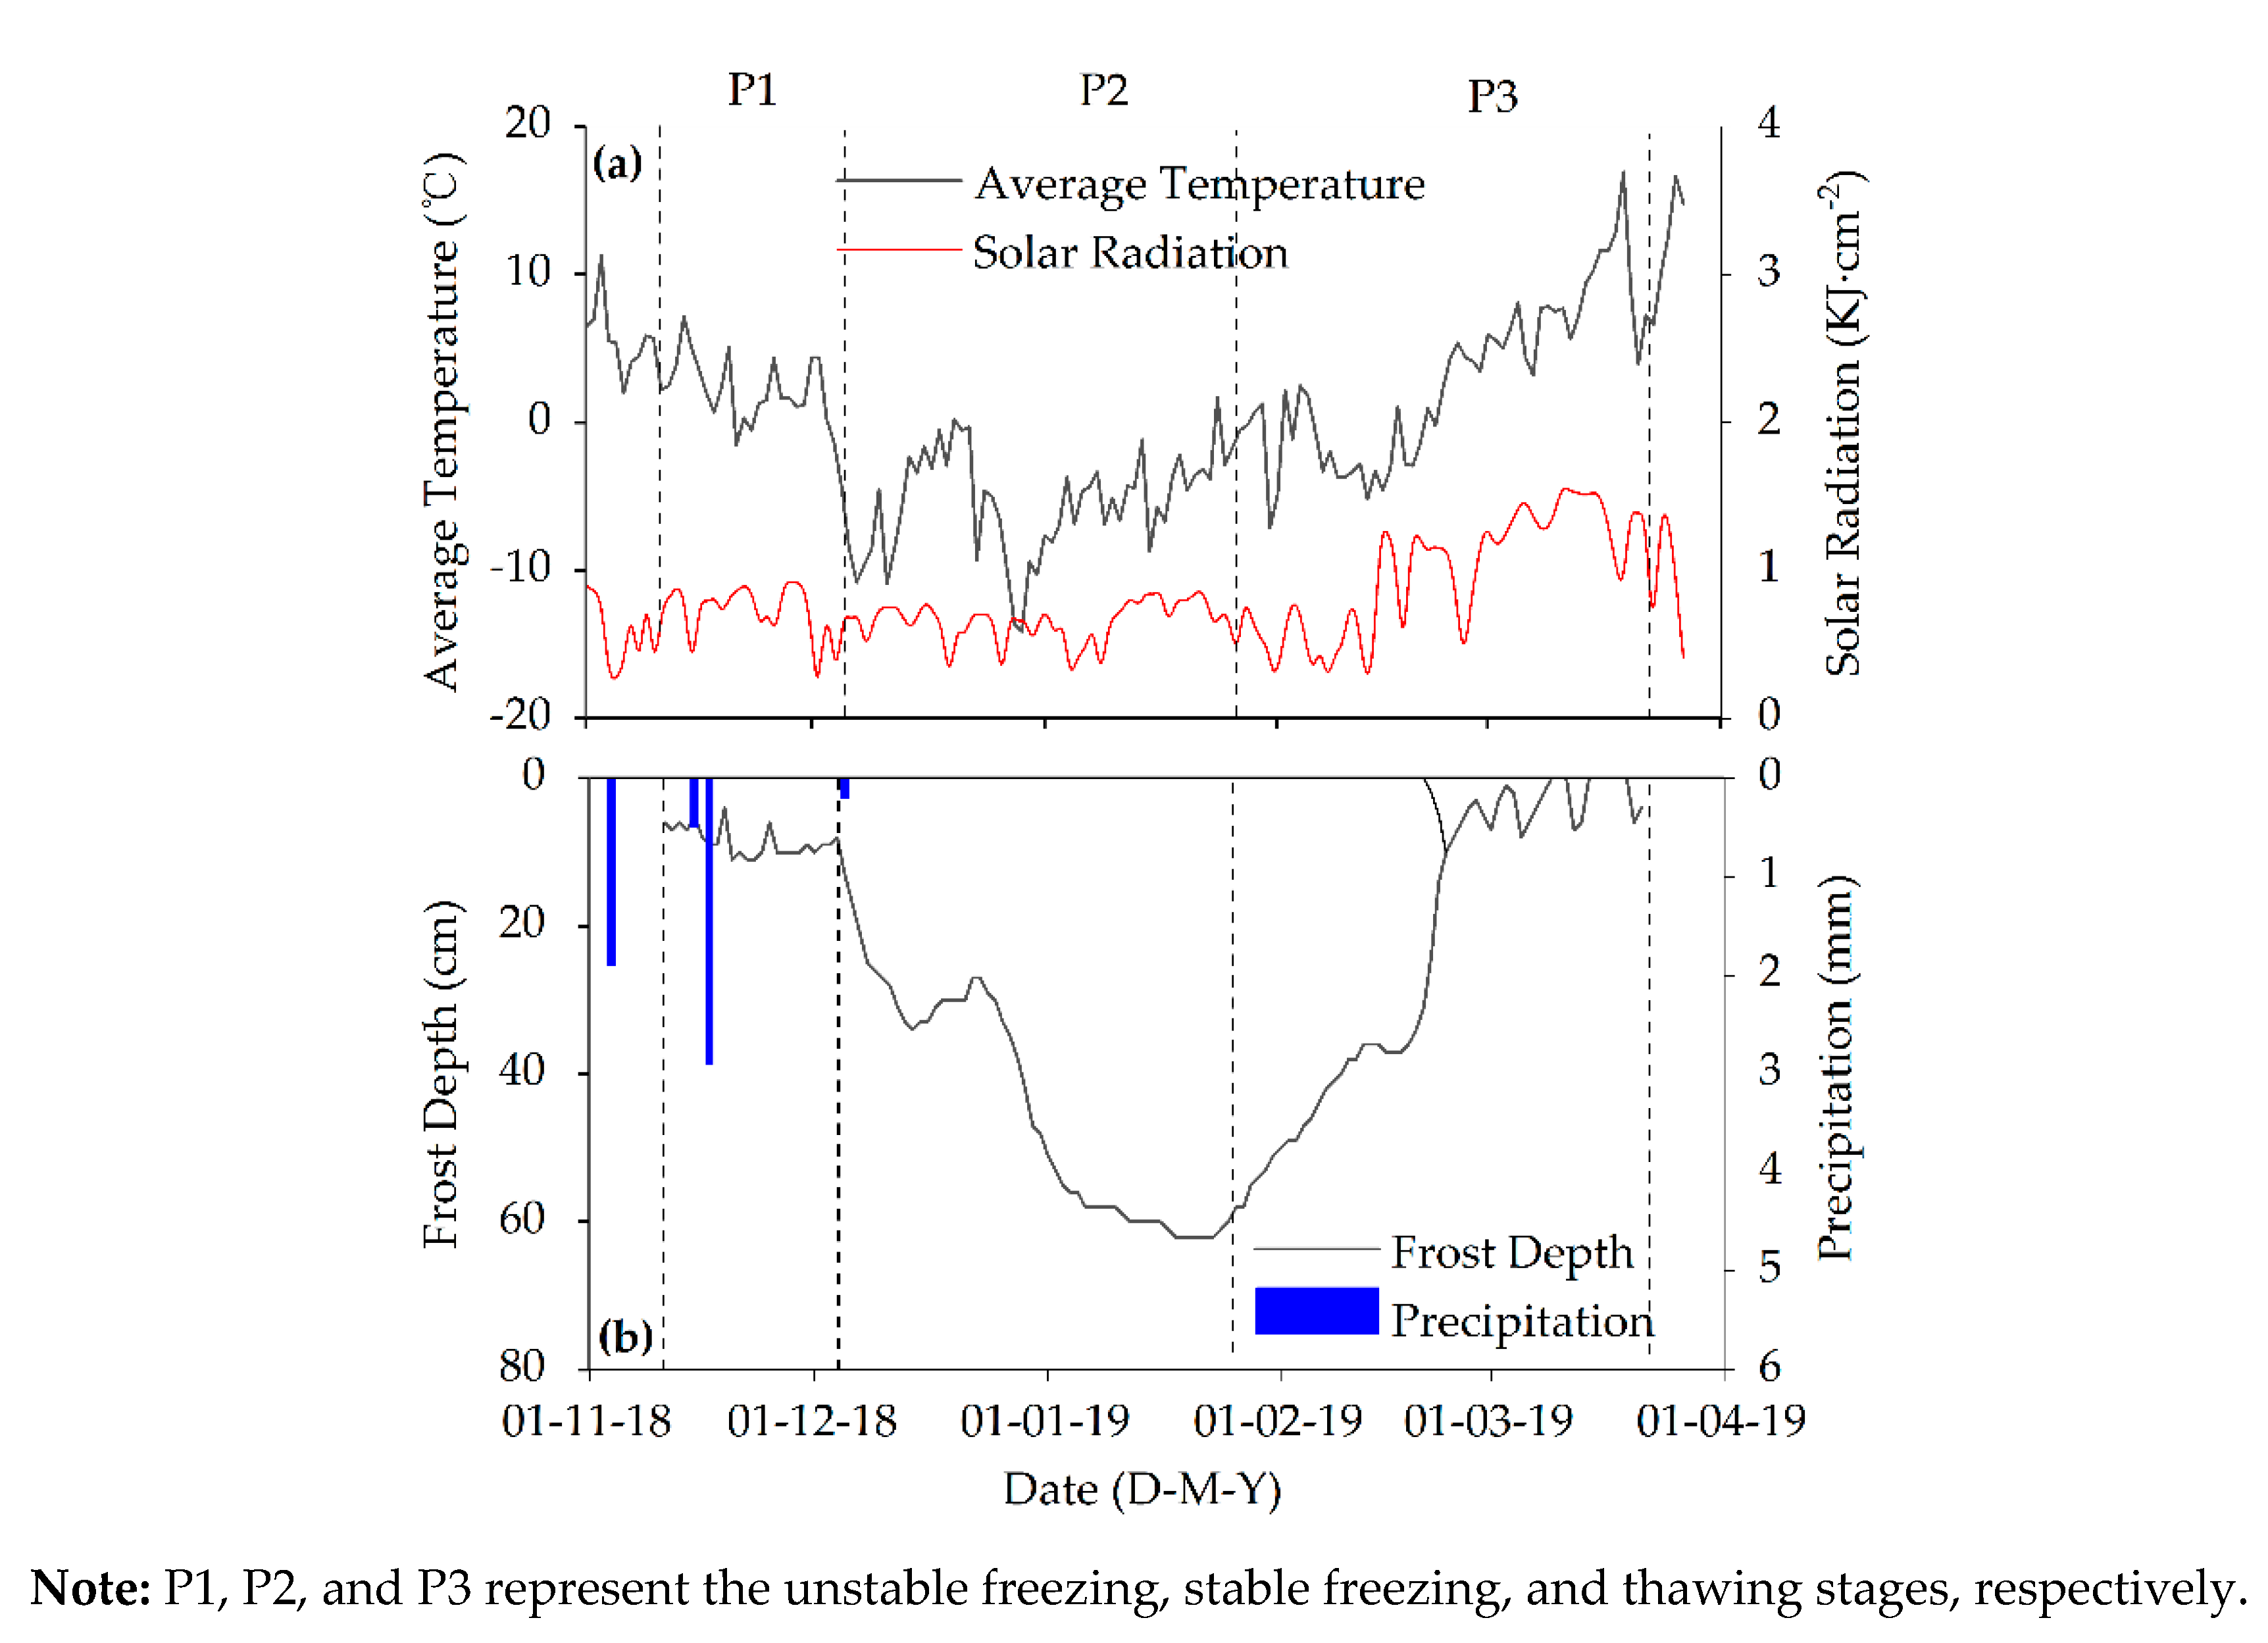
Measuring daily meteorological data. Daily meteorological data were measured using the automatic weather station at the Taigu Water Balance Experimental Field. Measurements included air temperature, frost depth, precipitation, and sunshine duration.

2.3. Data Analysis

(1) Evaporation calculation
The total evaporation at any period was calculated based on the following formula of Feng et al. [5]:
E i = ( M 2 M 1 ) / ( π r 2 ρ w )
where Ei is the evaporation value for a period (mm); M1 and M2 are the masses of micro-lysimeters in the first and second weighing (g), respectively; i is the sampling time (i = 1, 2,…, 16); r is the radius of the micro-lysimeters (cm); and ρw is water density (g/cm3).
The evaporation rate at any period was calculated using Equation (2):
E r = E i / T i
where Ti is the number of days corresponding to Ei, (d).
(2) Statistical analysis
The stage-evaporation and total evaporation of HS and sand-layered soil columns (D5S1, D10S1, D15S1, D5S2, D10S2, and D15S2) were subjected to analysis of variance in a confidence band of 95% (p < 0.05) using SPSS ver.18.0. The means were tested by least-significant-difference procedures for each treatment. The letters after the values of soil evaporation were used to represent whether there was significant difference between different treatments (p < 0.05). The same letter represented no significant difference.

3. Results and Discussion

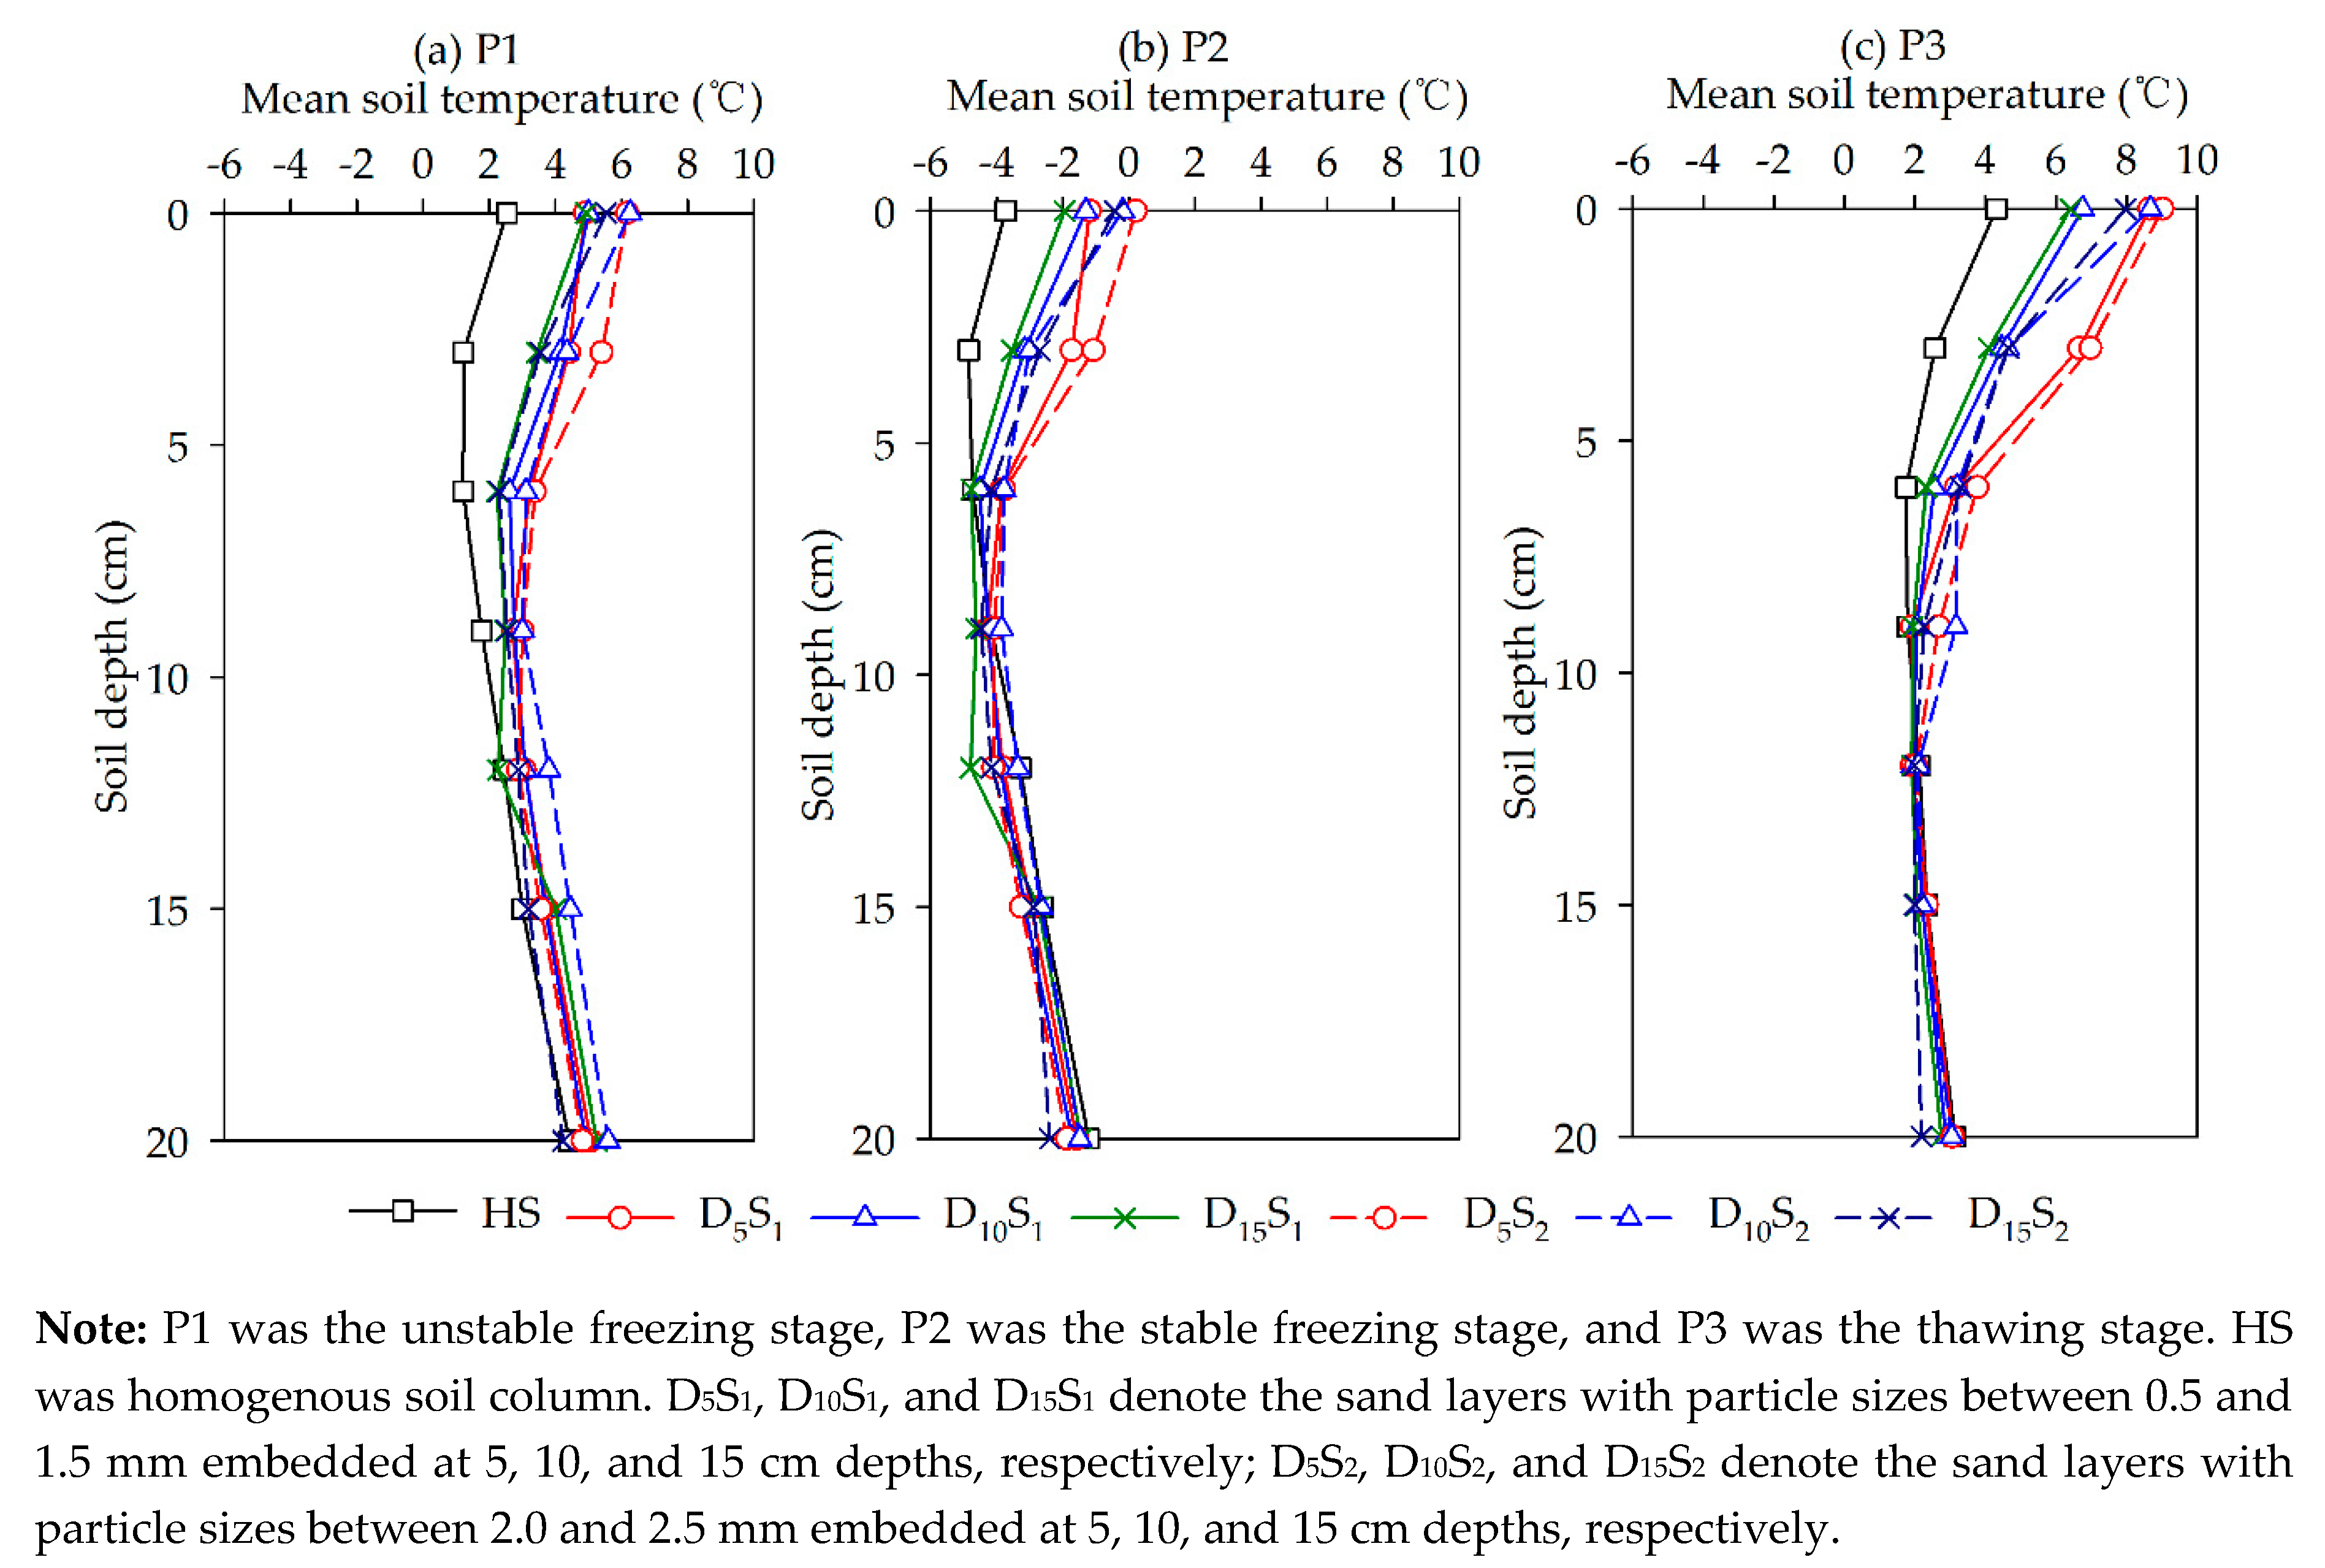
3.1. Soil Temperature

The mean soil temperature of the sand-layered soil profiles was higher in the HS in P1, particularly near the soil surface. This indicates that the sand interlayer reduced the heat loss in the soil profiles. The difference in soil temperature between the HS and sand-layered soil columns gradually reduced with soil depth. With the constant sand particle size, the soil temperatures of treatments with shallower sand layer depth were higher those than of other treatments, particularly the sand layer at a depth of 5 cm. The soil temperature for depths between 0 and 6 cm was 0.26–1.20 °C in D5S1 and D5S2; this was higher than in other sand-layered treatments. Furthermore, it was clear that the temperatures of the sand layer (0.18–2.17 °C) were relatively higher than that of the HS soil layer at the same depth, particularly for the sand layer placed at 5 cm, with a difference of more than 2 °C. With constant sand layer depth, surface soil temperature was relatively higher in the treatments where the sand particle size was between 2.0 and 2.5 mm (Figure 4a).
The soil temperature for depths of 0–20 cm was lower than 0 °C in P2. With the exception of D15S1 and D15S2, the soil temperatures of the overlying layer in the sand-layered soil columns were higher than for HS at the same depth, while the opposite occurred in the underlying layer (Figure 4b). The results illustrate that the shallower sand interlayer preferred heat preservation for the overlying layer. This may be attributed to the lower heat conductivity of the sand layer which slowed the velocity of heat absorbed by the soil surface. The temperatures of the sand layer in D5S1 and D5S2 increased 0.88 and 0.96 °C, compared to the HS soil layer at the same depth. However, the temperatures of the sand layer in D15S1 and D15S2 was lower (0.12 and 0.28 °C, Figure 4b), as the deeper sand layer had a reduced impact on soil heat transfer.
In P3, the soil temperature patterns for all soil columns were similar to P2, whereby soil temperature at depths between 0–9 cm was higher than HS in the sand-layered soil columns. The differences in soil temperature between the HS and sand-layered soil columns in P3 were relatively larger than differences in P2, because of the rapidly rising air temperature, particularly for D5S1 and D5S2. The temperature of the sand layer in D15S1 and D15S2 was lower (0.27 and 0.35 °C) than the soil layer in the HS at the same depth, and higher (1.42 and 2.02 °C) than in D5S1 and D5S2 (Figure 4c).

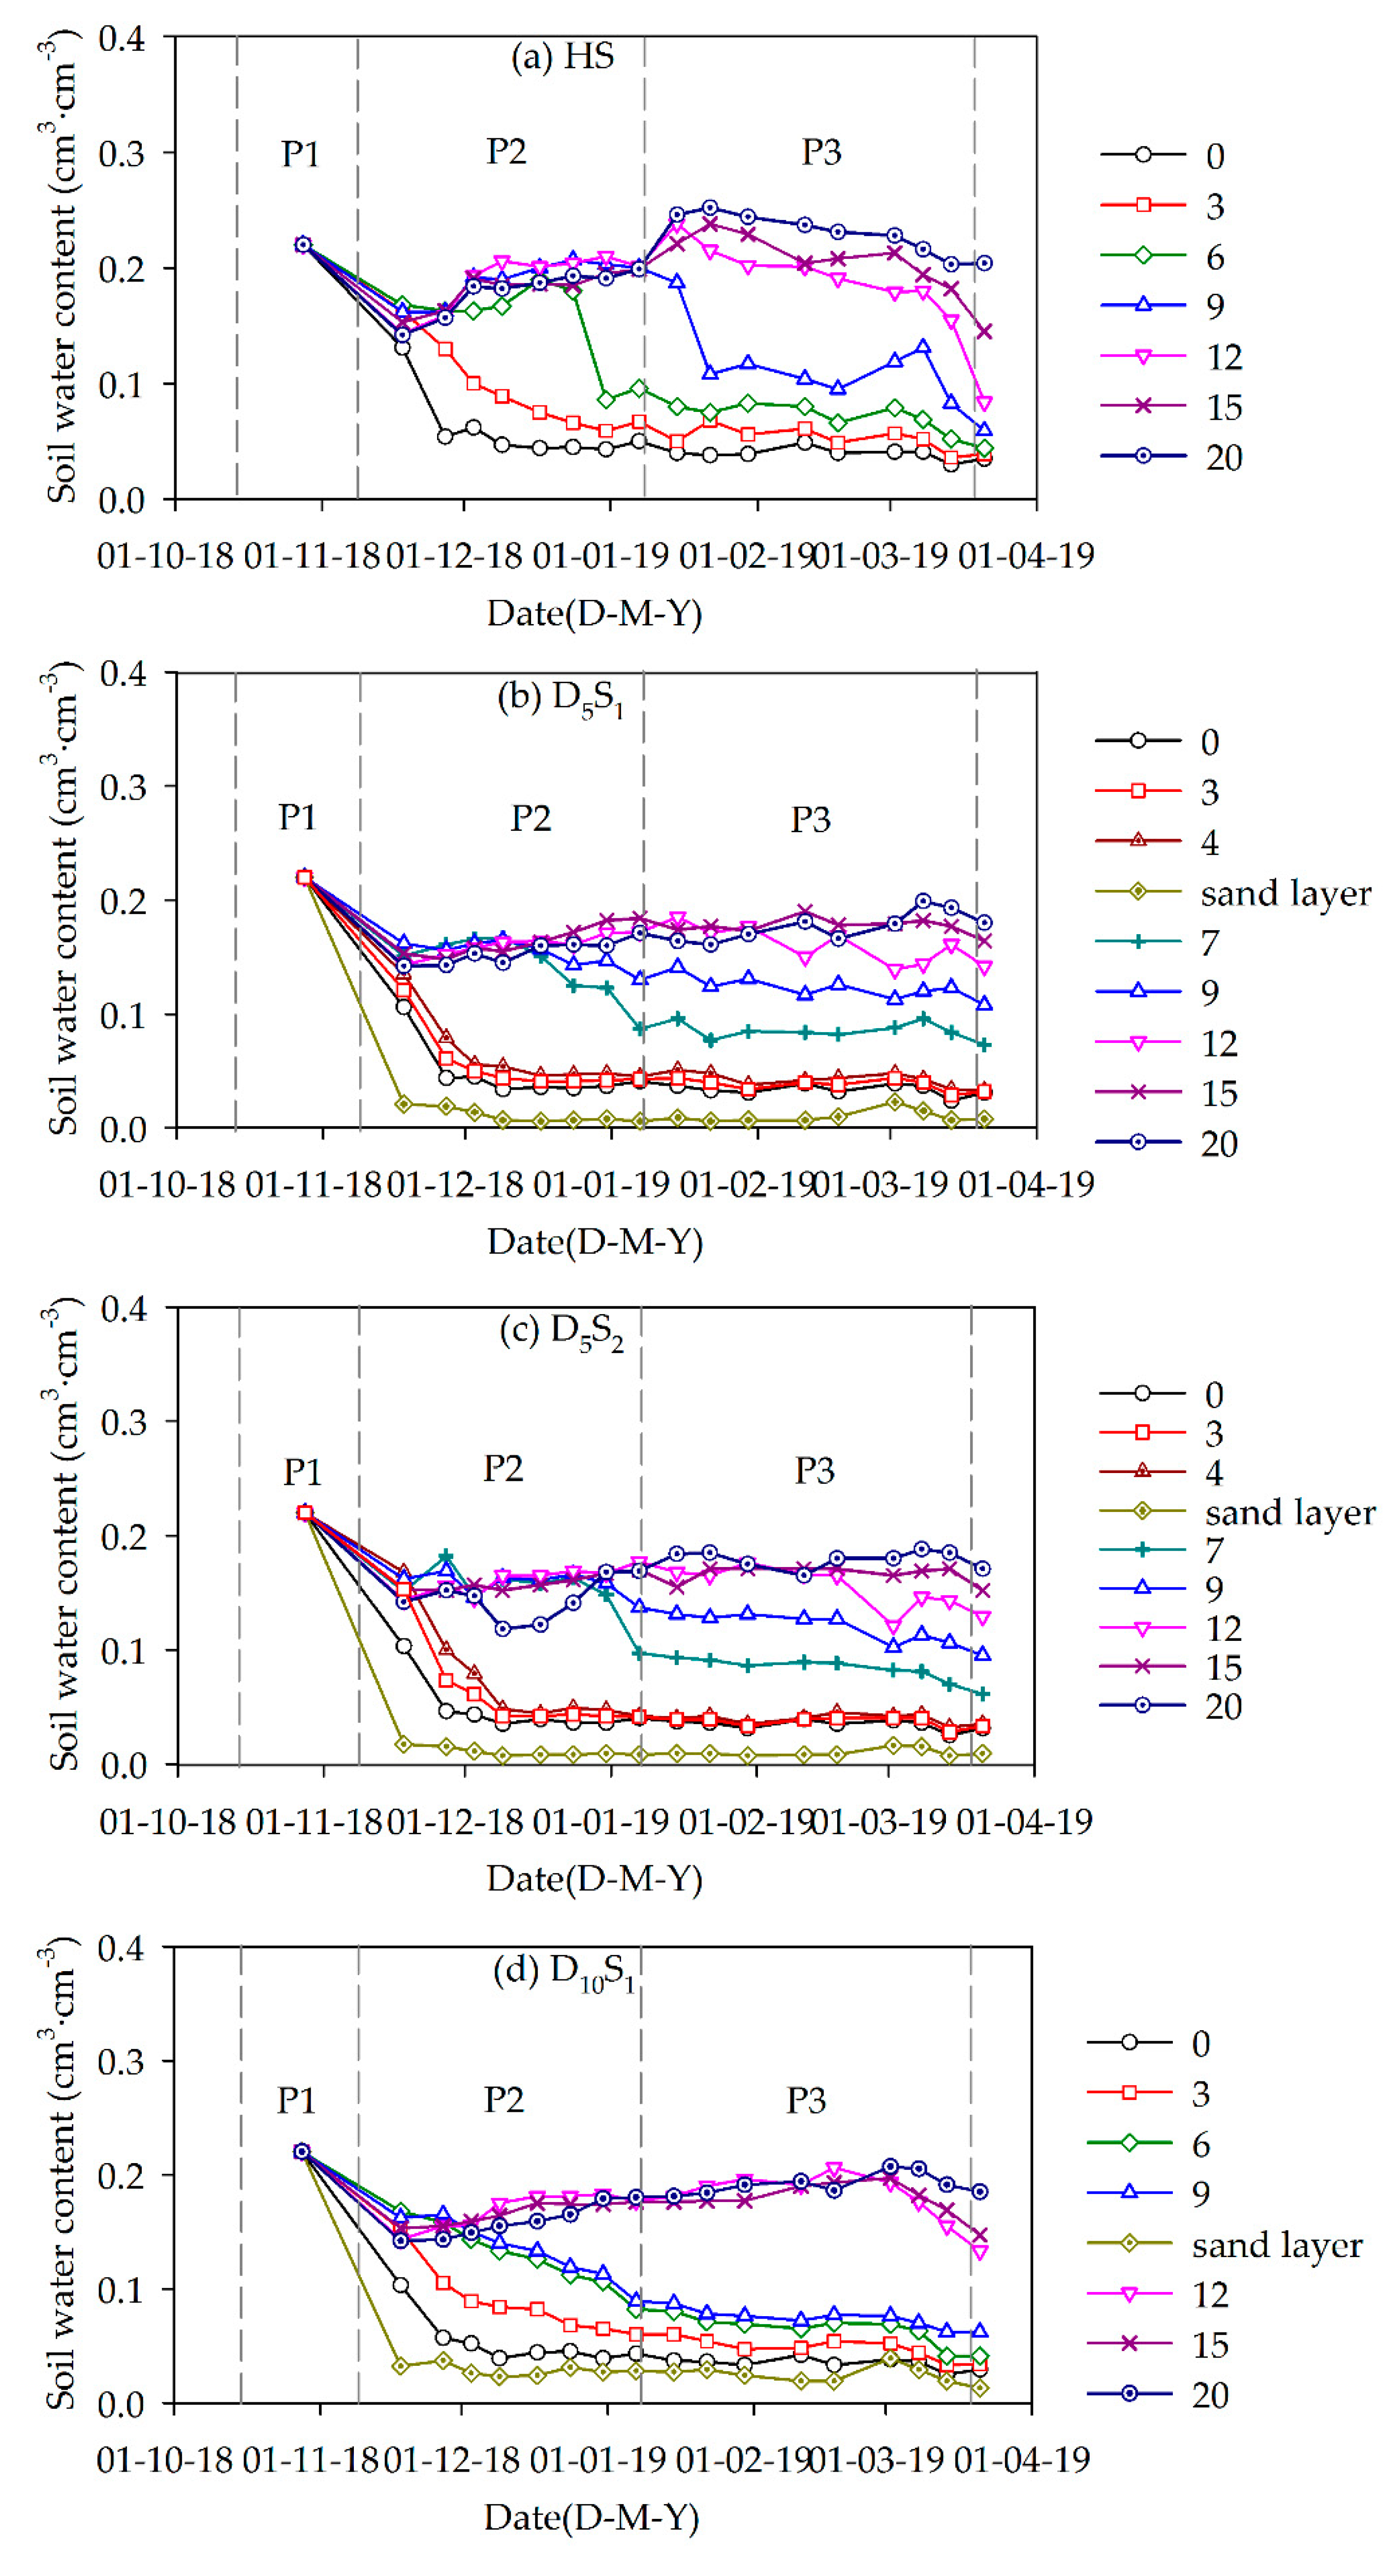
3.2. Soil Water Distributions

The surface soil water content of HS reduced from 0.13 to 0.04 cm3·cm−3, and then fluctuated around 0.04 cm3·cm−3 (Figure 5a). The average soil water contents for depths of 12–20 cm increased from 0.15 to 0.24 cm3·cm−3 in the HS, as a result of soil water migration from soil freezing. It then decreased to 0.15 cm3·cm−3 at the end of experiment under the dual influence of soil evaporation and the downward migration of soil water. These results are consistent with those reported by Larson et al. [25], who observed soil water migration in frozen soil at certain initial soil water contents. The sand-layer soil columns with differing sand-layer particle sizes exhibited similar variations in the soil water content when the sand layer was placed at the same depth. With constant sand layer depth, the sand particle size had a slight influence on soil water content, whereby differences were less than 0.02 cm3·cm−3 during the freeze and thaw period (Figure 5b–g). In this study, the water stored in the sand layer was defined as the sand water content; this form of water was extremely low in all sand-layered soil columns (Figure 5b–g). The six sand-layer soil profiles were separated into three parts—the overlying layer (above the sand layer), the sand layer, and the underlying layer (the layer beneath the sand layer).
In the overlying layer, the soil water contents of all sand-layer soil columns quickly declined within the first 20 d, following by a slow decline later. The mean soil water content of the overlying layer varied from 0.13 to 0.03 cm3·cm−3 for the sand layer placed at 5 cm, 0.15 to 0.04 cm3·cm−3 for the sand layer placed at 10 cm, and from 0.15 to 0.07 cm3·cm−3 for the sand layer placed at 15 cm (Figure 5b–g).
The sand water contents of the six sand-layer soil columns were all low, with mean values of 0.01, 0.03, and 0.03 cm3·cm−3 for D5S1, D10S1, and D15S1, respectively, and 0.01, 0.03, and 0.03 cm3·cm−3 for D5S2, D10S2, and D15S2, respectively (Figure 5b–g). The results indicate that the finer sand embedded at a deeper position had relatively higher sand water content, as the finer sand could adsorb more water.
In the underlying layer, the soil water contents of D10S1, D10S2, D15S1, and D15S2 increased over time due to the soil water migration caused by soil freezing. The soil water content at 12 cm in the sand-layer soil columns reached a peak around 18 February, which represented a delay of approximately 30 d compared with the HS (Figure 5a–g). The peak soil water content at 20 cm depth was delayed for approximately 40 d, indicating that the sand interlayer prolonged the period leading up to the peak of soil water content as this layer affected the normal soil water movement. For D5S1 and D5S2, the soil water contents at 7 and 9 cm gradually increased, and then sharply declined because of soil evaporation. The soil water contents at 12, 15, and 20 cm all showed slight changes, indicating that the sand layer depth had an obvious effect on soil water content.

3.3. Soil Evaporation

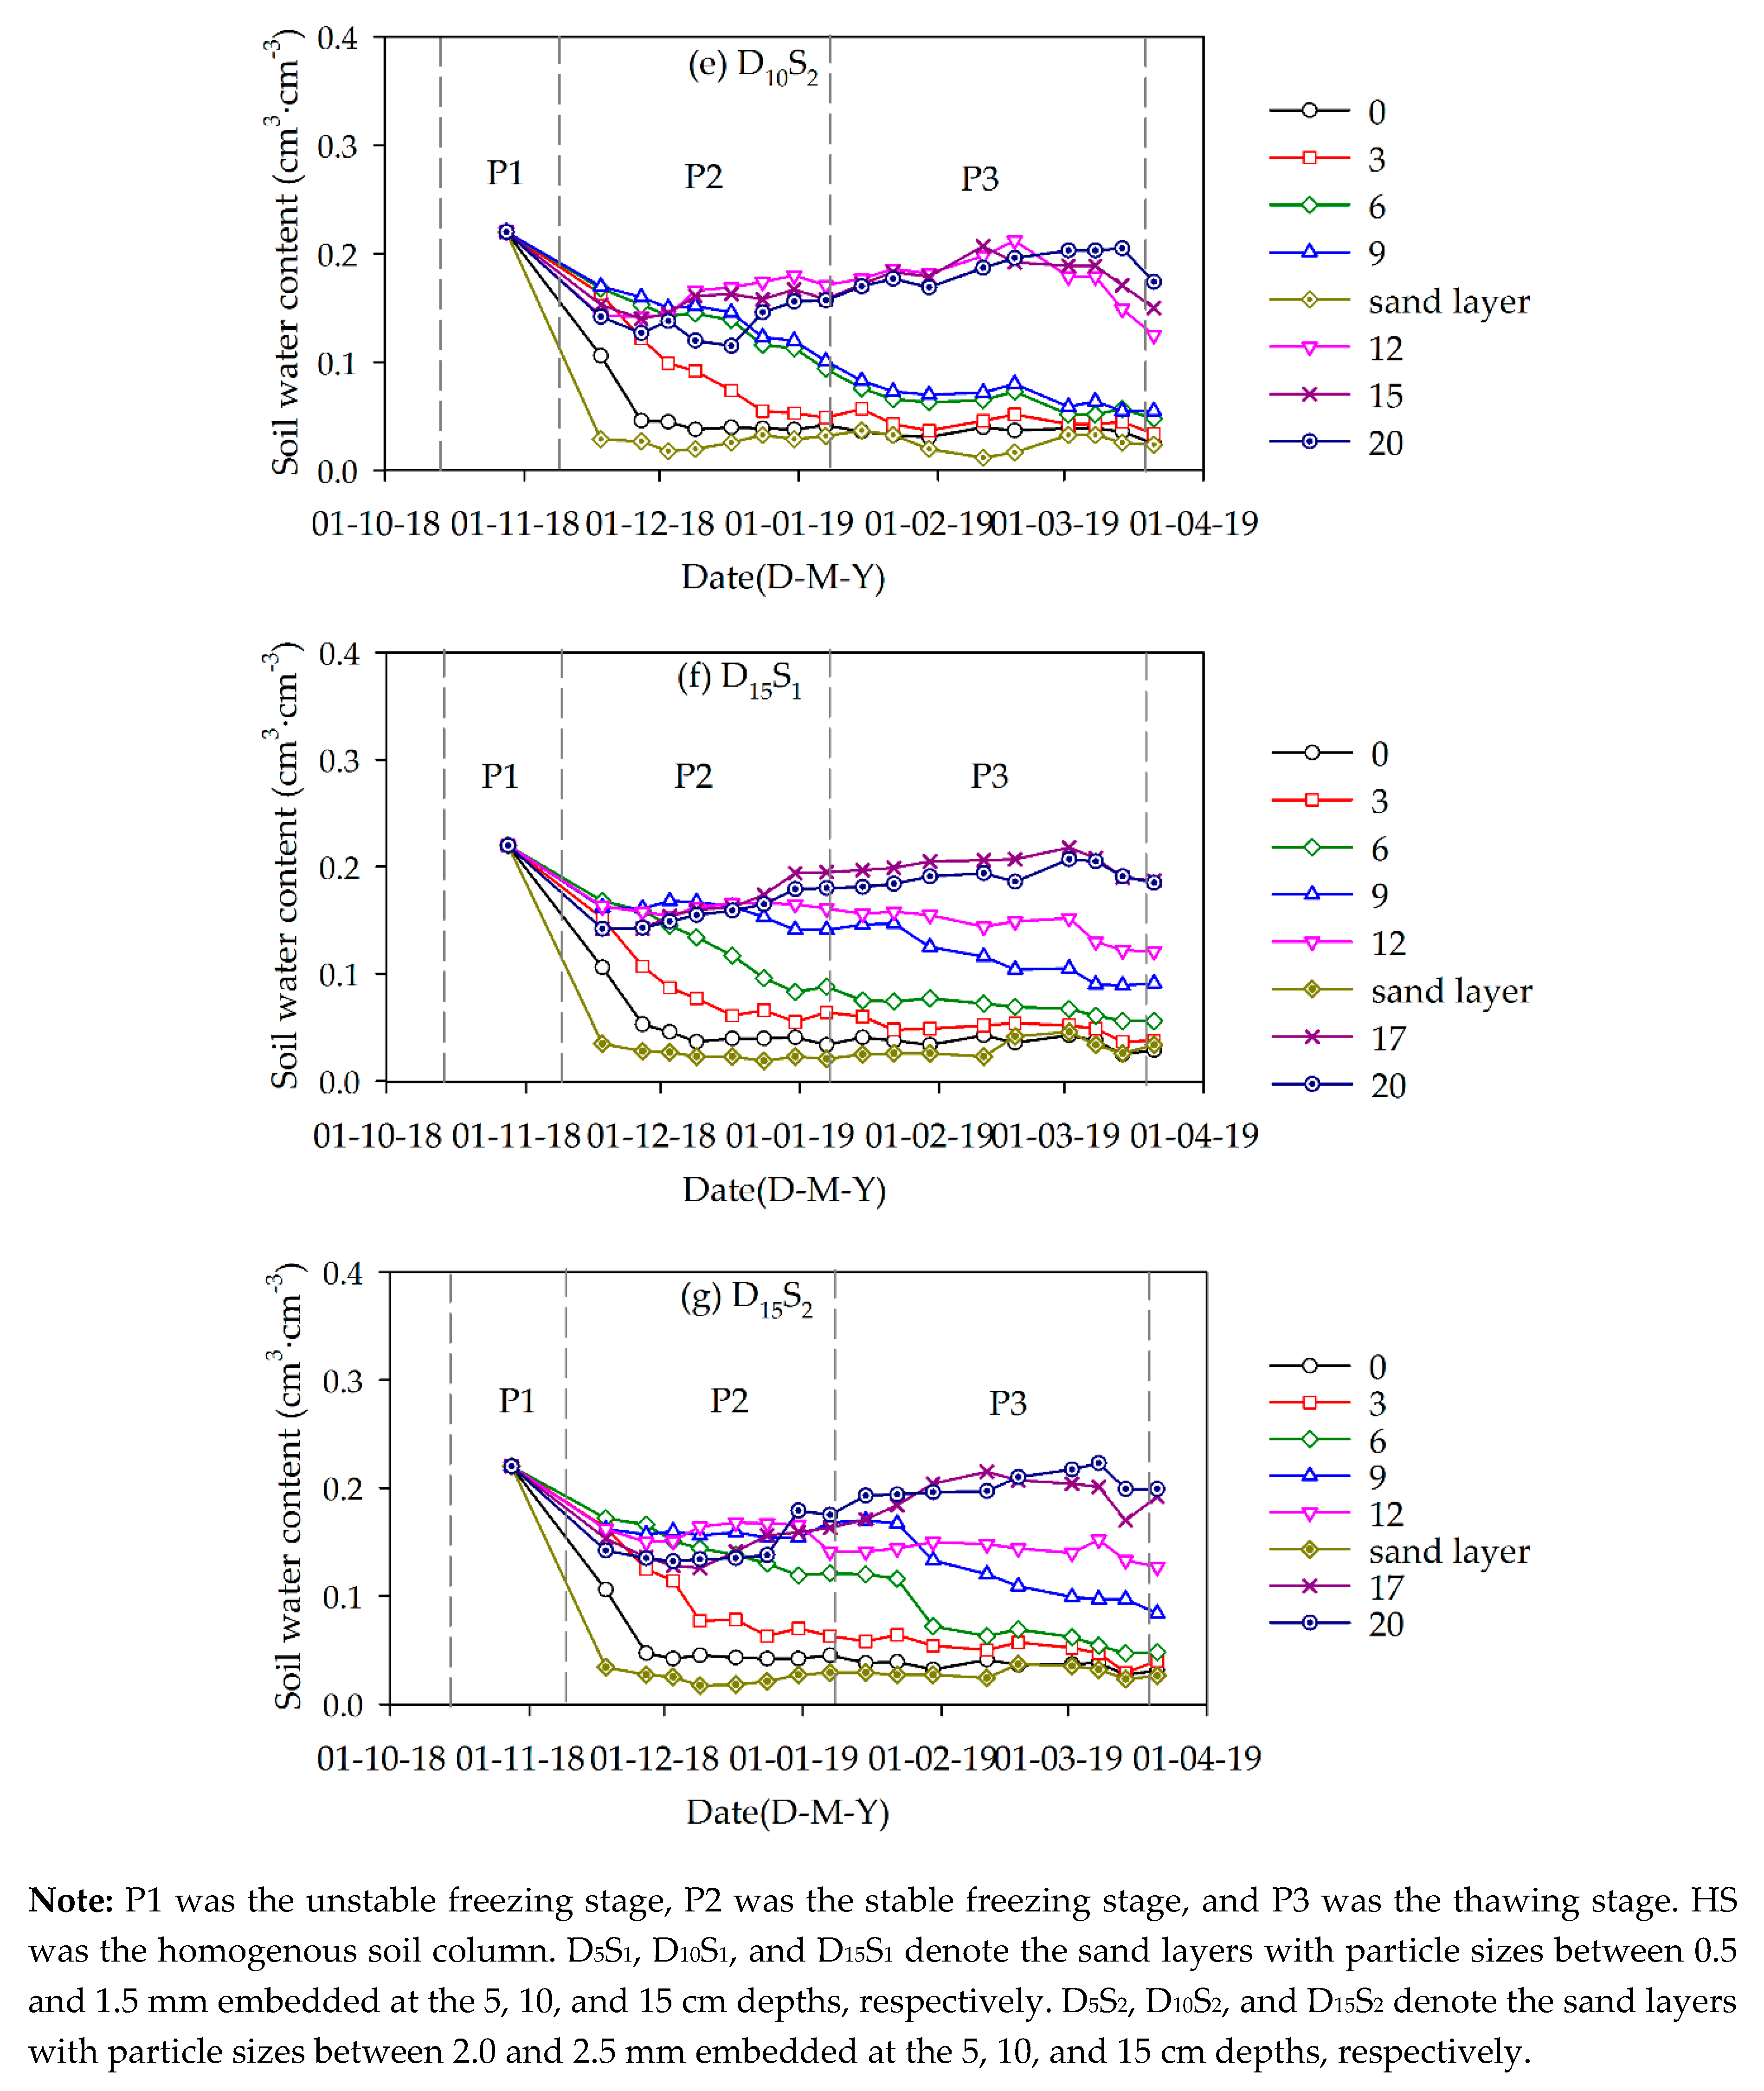
3.3.1. The Evaporation Fronts

According to Darcy’s law, soil evaporation may be regarded as the water flux upward through the evaporation front. The evaporation front is an interface between water flow and water vapor, located in the unsaturated zone [26]. In general, the evaporation front is characterized by critical water content (θe). Therefore, the shapes of soil water content in all columns were set as the criteria to determine θe [27]. As shown in Figure 5a, the minimum soil water content was approximately 0.04 cm3·cm−3 in the upper part of all soil columns, which may be considered θe. When soil water content at a certain depth reduced to the water content limit of 0.04 cm3·cm−3 in the development of the drying zone, the evaporation front moved down into this position.
In P1, the evaporation front for all soil columns was located at the soil surface (Figure 6a–d). The phase of soil evaporation was in transition from the evaporation reduction phase to the water vapor diffusion phase. In P2, the evaporation front of D5S1 and D5S2 developed at a depth of 1 cm on 9 December and reached a depth of 3 cm on 17 December 2018 (Figure 6b). Evaporation fronts for the other treatments moved down to a depth of 1 cm below the surface on 17 December and remained in this position to the end of P2. In P3, the soil water contents of the overlying layer in D5S1 and D5S2 had completely reduced to the water content limit on 15 and 30 January 2019. In this case, the evaporation front was located at the bottom of the overlying layer until the end of the study. For HS, the evaporation front reached a depth of 3 cm on 8 March and then continued to a depth of 6 cm at the end of the experiment (Figure 6a). For other sand-layered soil columns, the evaporation front also moved to a depth of 6 cm in this stage. Among them, the evaporation fronts of D10S1 and D10S2 moved at a more rapid pace than that of D15S1 and D15S2 (Figure 6b–d).

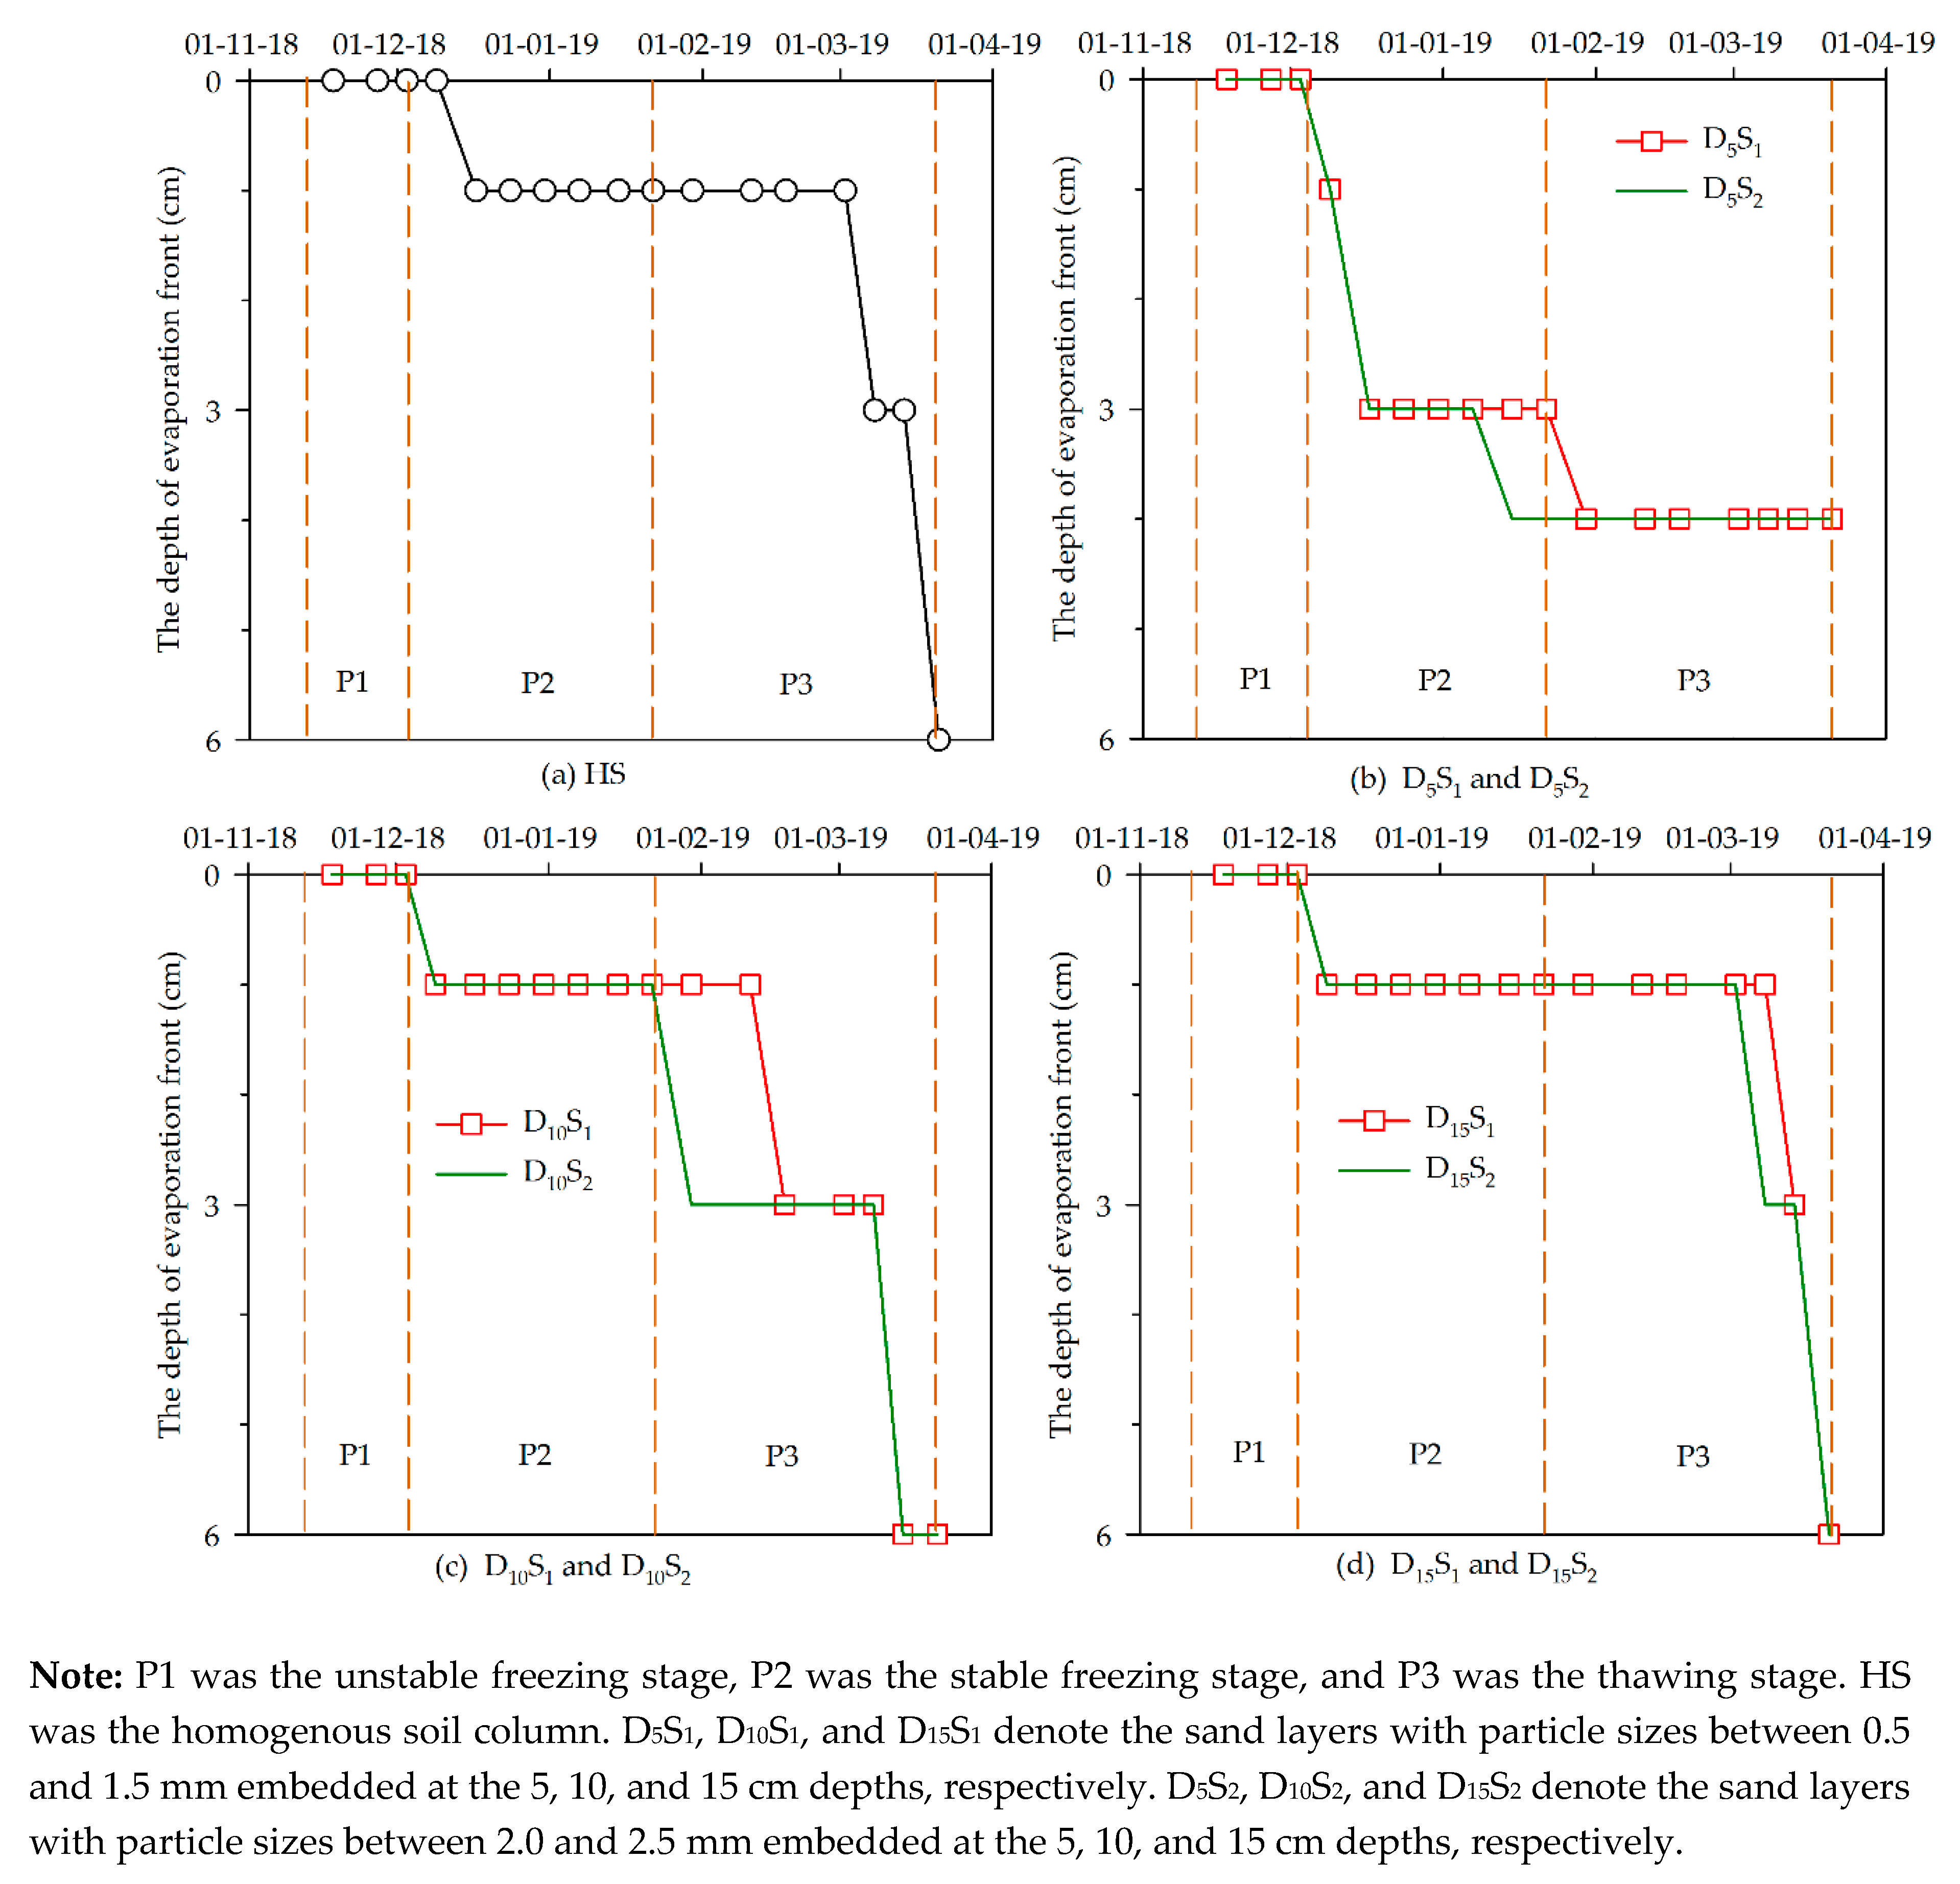
3.3.2. Cumulative Soil Evaporation

The total soil evaporation followed the order: HS > D15S2 > D15S1 > D10S2 > D10S1 > D5S2 > D5S1, with 13.7, 11.3, 11.1, 11.0, 10.9, 8.3, and 8.2 mm of evaporation, respectively (Figure 7). The shallower the sand layer, the lower the total soil evaporation. The effect of the sand layer position on soil evaporation was greater than particle size. Compared with HS, total soil evaporation decreased by 40% and 40% for D5S2 and D5S1, 19% and 21% for D10S2 and D10S1, and 18% and 19% for D15S2 and D15S1, respectively. This indicates that the sand interlayer could prevent soil evaporation during the seasonal freeze–thaw period. The results corroborate the findings of Unger [21] who argued that greater cumulative evaporation occurs with successively deeper depths of gravel layer placement. During the whole freeze–thaw period, there were significant differences between soil evaporation of six sand-layer soil columns and HS, as shown in Table 2. For same particle size of sand layer, there were significant differences (p < 0.05) between the soil evaporation in the treatments of D5 and D10, D10 and D15. For same depth of sand layer, soil evaporation in the treatment of sand particles of size 0.5–1.5 mm and 2.0–2.5 mm had no significant differences (p < 0.05).
In P1, the position and particle size of the sand interlayer had different impacts on soil evaporation. Compared to HS, the total stage-evaporation reduced by 30%, 22%, and 21% for D5S1, D10S1, and D15S1, respectively, and by 23%, 16%, and 9% for D5S2, D10S2, and D15S2, respectively (Table 2). In P1, there were significant differences between soil evaporation of sand-layer soil columns and HS except D15S2 (p < 0.05). The results demonstrate that the sand interlayer reduced water loss from the soil columns, especially for the sand layer placed at 5 cm. This outcome is in agreement with the results reported in Unger [21]. The evaporative losses for treatments with particle sizes between 0.5 and 1.5 mm were lower than those with particle sizes between 2.0 and 2.5 mm; this was unlike findings from Shi et al. [28]. They found that when the water table was 50 cm, sufficient water could pass through the sand layer, resulting in higher evaporation in the treatment with a finer sand interlayer. However, the water table in this study was approximately 25 m, with little effect on the upper soil water. Therefore, the relatively lower soil water content and lack of precipitation meant that the sand particle size had a slight effect on soil evaporation.
In P2, the largest soil evaporation was still in HS with a value of 4.1 mm. The sand interlayer could also reduce in soil evaporation, particularly in D5S1 and D5S2, with evaporative losses of 2.1 and 2.0 mm, respectively. Compared to HS, the total stage-evaporation had reduced by 49%, 15% and 5% for D5S1, D10S1 and D15S1, respectively and by 52%, 15%, and 6% for D5S2, D10S2 and D15S2, respectively (Table 2). The results demonstrated the inhibition effect to evaporation became more obvious with the shallower sand layer, similarly to P1. However, the effect of particle size on soil evaporation was in contrast to P1, as treatments with coarser sand had reduced evaporation following the higher soil evaporation of the previous stage. Compared with P1, the effect of preventing soil evaporation in D5S1 and D5S2 was more obvious during P2. This is because the evaporation fronts were deeper in the two treatments, creating a longer pathway of water vapor through the drying layer. As shown in Table 2, there were significant differences among the soil evaporation in the treatments with same sand particle size (i.e., D5S1, D10S1, and D15S1). For same sand layer depth, soil evaporation in treatment with different sand particle sizes had no significant differences (p < 0.05), such as D5S1 and D5S2, D10S1 and D10S2, and D15S1 and D15S2.
In P3, the sand interlayer had also reduced soil evaporation. The position of the sand layer had a larger effect on soil evaporation compared with particle size. Compared with the HS, the total stage-evaporation had reduced by 41%, 24%,, and 29% for D5S1, D10S1, and D15S1, respectively and by 44%, 26%, and 34% for D5S2, D10S2, and D15S2, respectively (Table 2). In this stage, the soil evaporation of D10S1 and D10S2 was greater than for other sand-layered soil columns. As shown in Table 2, there were significant difference between soil evaporation of sand-layer soil columns and HS in P3 (p < 0.05). In addition, the soil evaporation in the treatments with same sand particle size had significant differences (i.e., D5S1, D10S1, and D15S1).

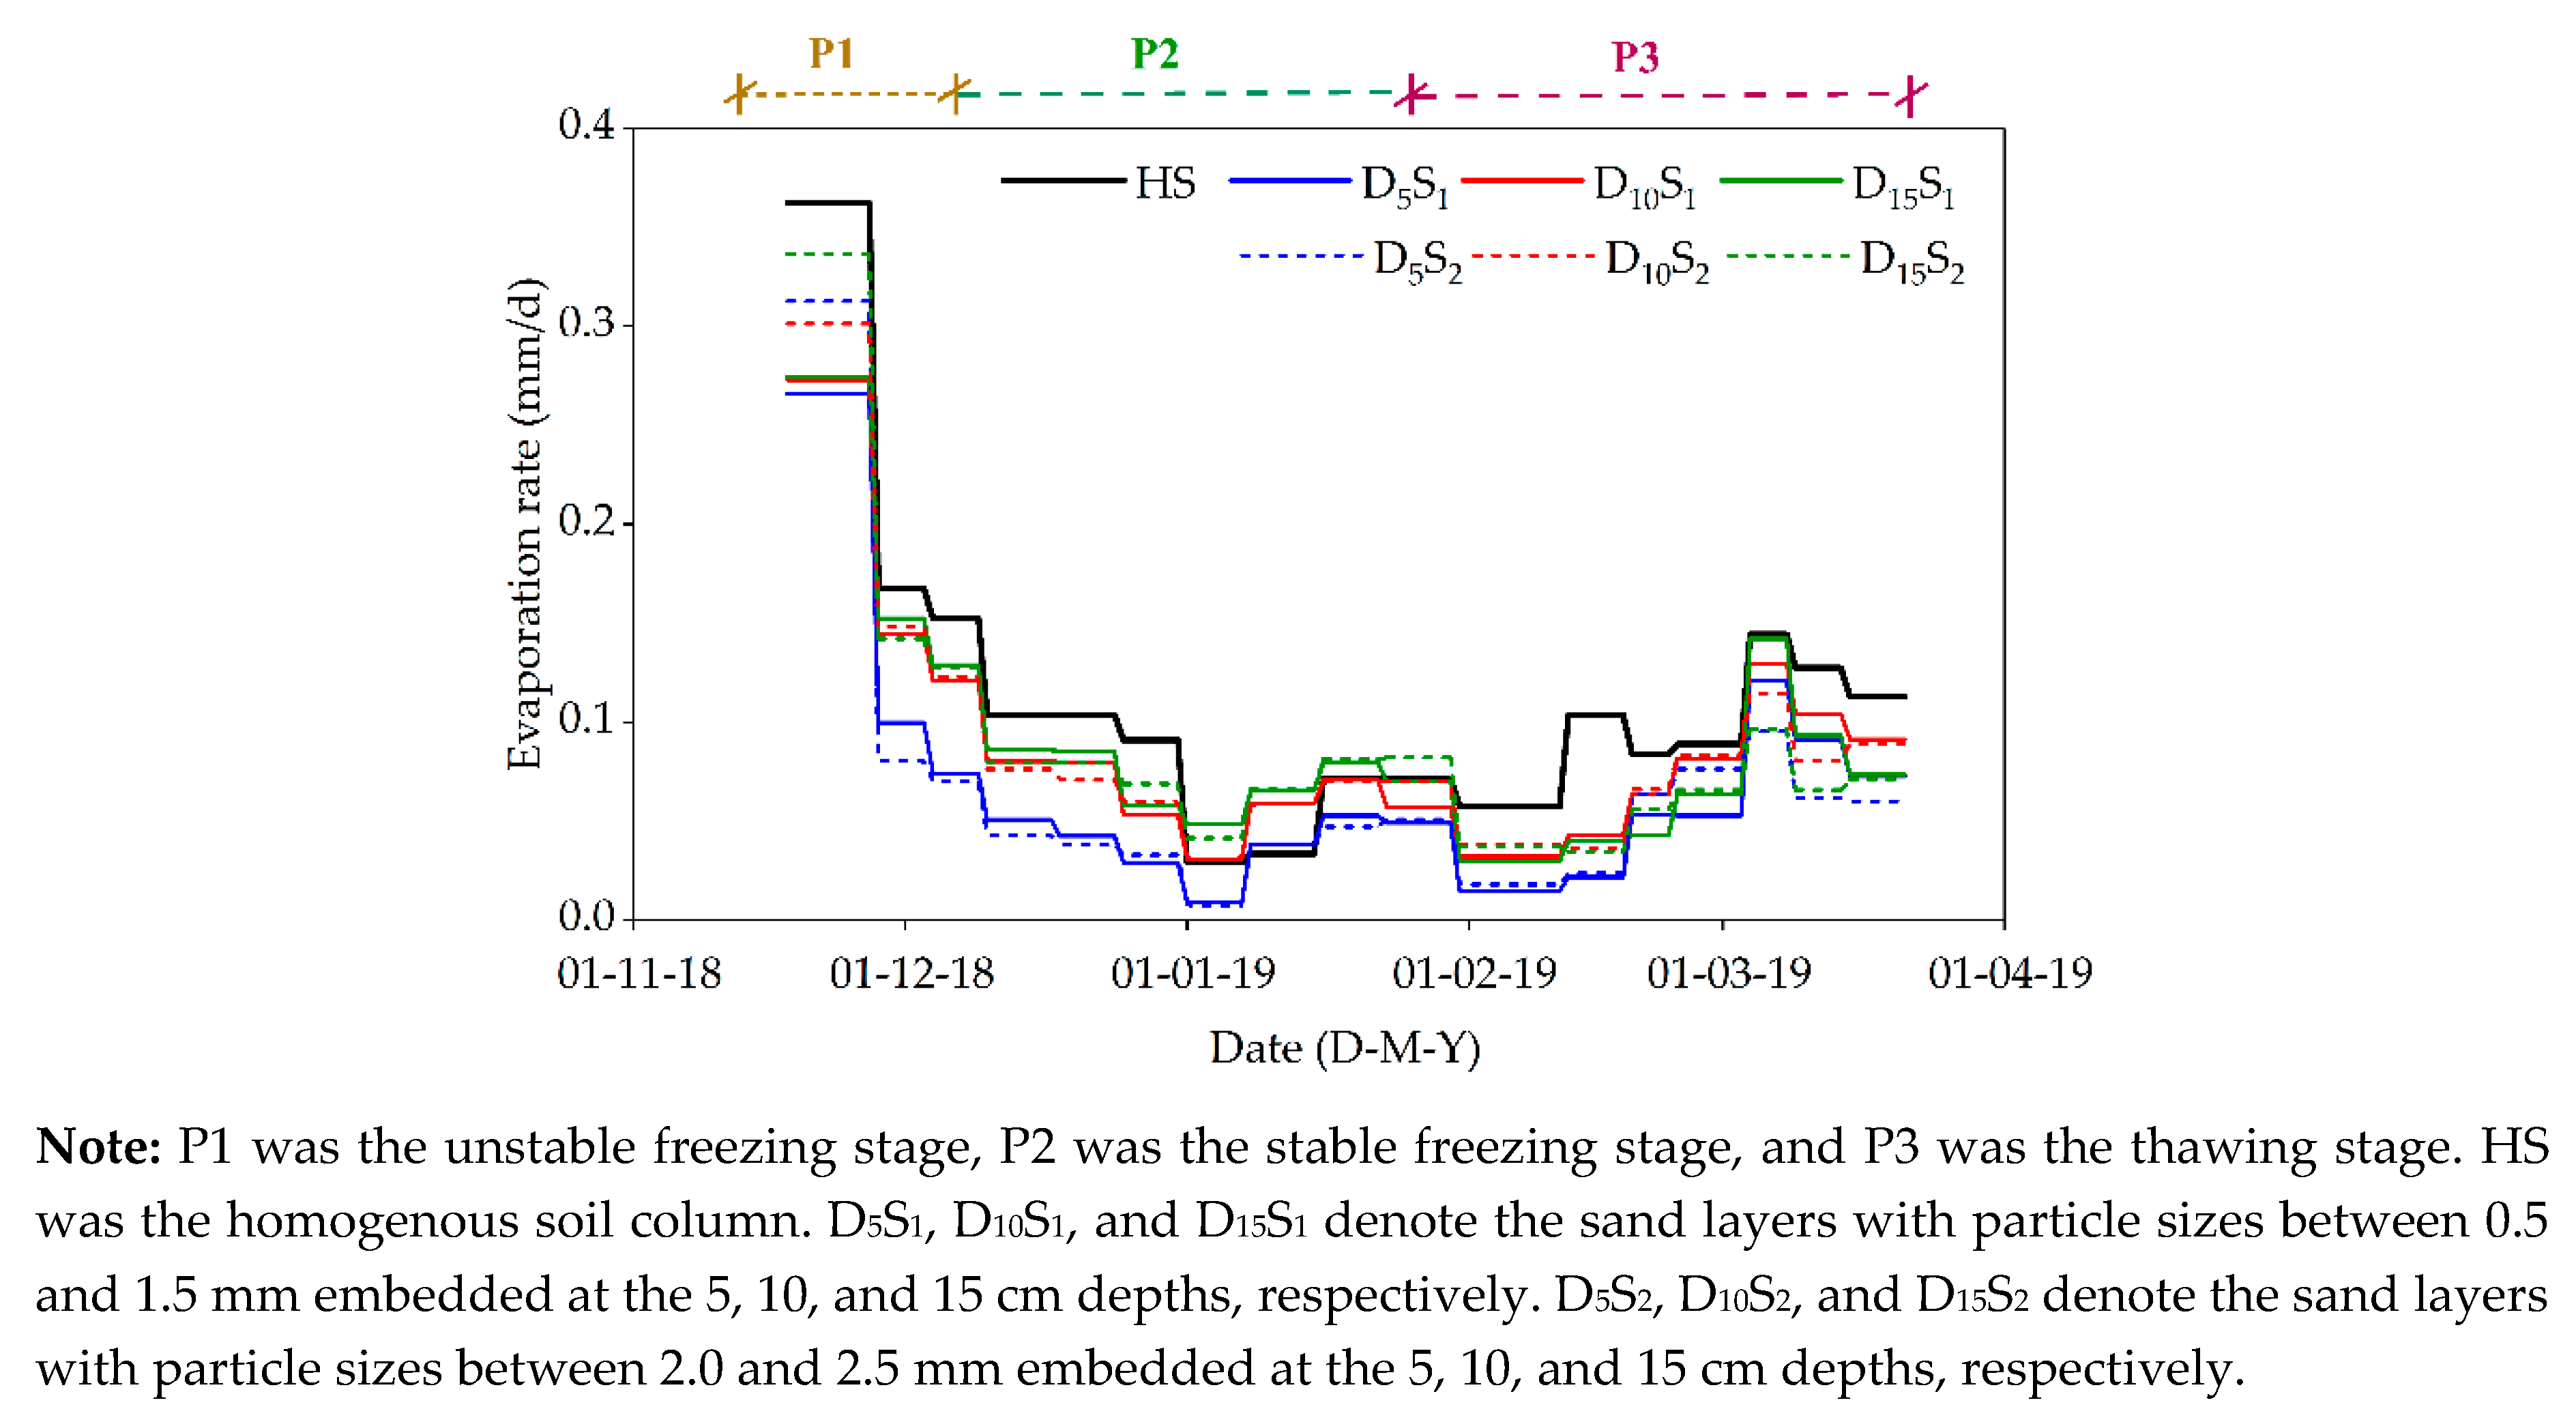
3.3.3. Soil Evaporation Rates

During the freeze–thaw period, the soil evaporation rate in HS was larger than the sand-layered soil columns, as shown in Table 3.
(1) The unstable freezing stage
In P1, the stage-evaporation rates were 0.20, 0.22, and 0.23 mm·d−1 for D5S1, D10S1, and D15S1, respectively, and 0.22, 0.24, and 0.26 mm·d−1 for D5S2, D10S2, and D15S2 (Table 3), respectively. The differences in the evaporation rate between D5 and D10 and D5 and D15 were greater than that between D10 and D15, which indicates that when the sand layer was deeper, evaporation rates were close to that of HS (Table 3).
The largest evaporation rate ranged from 0.27 to 0.36 mm·d−1 within the first 10 d in all soil columns (Figure 8). With the downward spiral of air temperature, the freeze–thaw cycles occurred at the soil surface or near-surface. As a result, soil evaporation had decreased in all soil columns, with evaporation rates less than 0.15 mm·d−1. This was related to the decrease of unsaturated hydraulic conductivity after soil freezing. As the continuity of the soil profiles had been broken by the sand interlayers, the water supply capacity was relatively poor, and the lower evaporation rate occurred in the sand-layered soil columns. The shallower the sand interlayer, the lower the water supply capacity in the soil profile. Therefore, with a deeper sand interlayer, a greater volume of water was available for soil evaporation in the overlying layer. The lower evaporation rates were also attributed to the loss of hydraulic connectivity in the drying zone. As soil water content was less than 0.10 cm3·cm−3, the drying layer gradually formed on the surface. In this case, the water supply capacity was poor on the soil surface or near-surface, resulting in lower evaporation rates in soil columns.
(2) The stable freezing stage
In P2, the stage-evaporation-rate for HS was the lowest at 0.08 mm·d−1. The evaporation rates of D5S1 and D5S2 continued to be the lowest at 0.04 mm·d−1, respectively, while the evaporation rates of D15S1 and D15S2 were the highest at 0.08 mm·d−1 (Table 3), respectively. Treatments with coarser sand particle size had relatively lower evaporation rates, because of the thicker drying layers formed by the substantial evaporation in the previous stage.
The evaporation rates of all soil columns gradually decreased with the development of evaporation fronts, with evaporation being in the form of water vapor (Figure 8). Lower evaporation rates mainly contributed to the loss of hydraulic connectivity in the drying zone [29]. The evaporation rates of all soil columns reached a minimum from 1 to 7 January 2019. The evaporation rate of HS was 0.03 mm·d−1, and evaporation rates of D5S1 and D5S2 were the lowest at less than 0.01 mm·d−1 (Figure 8). This was because the evaporation fronts of D5S1 and D5S2 were deeper than HS. Moreover, the evaporation rate of HS had gradually become lower than that of the sand-layered soil columns in P2. This may be attribute to the soil water content between 12 and 20 cm in HS was larger than the sand-layered soil columns, and soil temperature was lower, creating relatively lower unsaturated hydraulic conductivity and higher ice content in HS. In freezing soil, unsaturated hydraulic conductivity decreased with the unfrozen water content; this has been directly linked to negative soil temperature [30]. Soil profiles with lower negative temperature have less liquid water content and unsaturated hydraulic conductivity [31,32,33]. Although vapor diffusion flux through the evaporation front was influenced by the soil-water potential gradient and soil temperature gradient in the soil profile in P2, the unsaturated hydraulic conductivity below the evaporation front continued to impact soil water movement [34,35,36]. The decrease of unsaturated hydraulic conductivity below the evaporation front from soil freezing also affected the liquid water movement from the unfrozen zone to the evaporation front [34,37]. Thus, the unfrozen water that had transferred to the evaporation front in HS was relatively lower than that of the sand-layered soil columns. In P2, the soil evaporation of D5S2, D10S2, and D15S2 was relatively lower than evaporation in D5S2, D10S2, and D15S2. This was because the drying layer in D5S2, D10S2, and D15S2 was relatively thicker, and water vapor passed through a longer pathway prior to entering the atmosphere.
(3) The thawing stage
In P3, HS experienced the highest soil evaporation rate with a mean evaporation rate of 0.09 mm·d−1, while the soil evaporation rates of D5S1 and D5S2 were the lowest at 0.05 mm·d−1 (Table 3), respectively.
Although the evaporation rates gradually increased with soil thawing, they were still less than rates in P1 (Figure 8). After 11 February 2019, the evaporation rates for D10S1 and D10S2 became gradually higher than D15S1 and D15S2. The evaporation rate of D5S2 was higher than D5S1 during the early stage of P3, as sand particle size influenced pore space size and the connectivity of the sand layer when the evaporation front was located at the lower boundary of overlying layer; this produced a different pathway length for the water vapor to traverse [38]. A lower evaporation rate for D5S2 occurred later in P3 due to the relatively thick drying layer. The evaporation rates of D10S1 and D10S2 were relatively higher that of D15S1 and D15S2; these results were the opposite of those in P1 and P2.
The evaporation rates of D5S1 and D5S2 in P3 were slightly higher than P2, because of the increase of water supply capacity below the evaporation front after soil melting. Compared to P1, the evaporation rates of D5S1 and D5S2 were much lower due to the thick drying zone. As opposed to D5S1 and D5S2, the evaporation rate of D10 and D15 in P3 were relatively lower than P2 from the deeper evaporation fronts. During this stage, the difference in the evaporation rate among the sand-layered columns was less than that for P1 and P2, and the difference between columns with different sand particle sizes was also less than that of P1 and P2 due to the deeper evaporation fronts.

3.3.4. The Source of Water Loss in the Sand-Layered Soil Columns

The source of water loss was analyzed in the sand layered soil columns using the water balance method that combines the soil water content, soil evaporation, and precipitation. Soil water storage was calculated via the soil water content measured at various depths. Soil water storage declined over time in the overlying layer (Figure 9b).
During the seasonal freeze–thaw period, the sand water content was extremely low, indicating that there was little liquid soil-water exchange between the overlying and underlying layers. This study assumes the liquid soil-water exchange was zero between the overlying and underlying layers, and water loss from evaporation was from the overlying layer. There was an absence of crop growth, irrigation, and lateral recharge during the test. As such, the water balance method in each soil column was expressed as:
△W = P − E + M
where ΔW was the change in soil water storage for the soil column (mm); P was the precipitation (mm); E was the soil evaporation (mm); and M was the upward migration of soil water from the plot into soil columns (mm). Soil evaporation is detailed in Table 2, where precipitation was only 0.2 mm. The changes to soil water storage were calculated using soil water content; thus, soil water migrating from the plot into soil columns could be determined using Equation (3). This amount was equal to the increment of soil water storage in the underlying soil.
For D5S1 and D5S2, the total evaporation was 8.2 and 8.3 mm, and the reduction of soil water storage in the overlying layer was only 3.4 and 4.2 mm (Table 4); this is less than 50% of the soil evaporation. The results showed that water losses in D5S1 and D5S2 originated from two parts: the overlying layer and the underlying layer. Soil water content gradually decreased in the underlying layer after soil water content in the whole overlying layer of D5S1 and D5S2 was less than 0.04 cm3·cm−3. As such, the soil water content in the underlying layer could pass through sand layer into the overlying soil for soil evaporation. However, the sand layer was extremely dry over the entire experimental period, and the liquid soil water in the underlying layer found it difficult to pass through the sand layer. Therefore, the soil water content in the underlying layer could pass through the sand layer only in the form of vapor, indicating that vapor diffusion occurred in frozen soil should not be neglected.
In D10S1 and D10S2, soil evaporation values were 10.9 and 11.0 mm, while the reductions of soil water storage values were approximately 10.0 and 10.4 mm in the overlying layer, respectively. It was clear that most of the water loss originated from the overlying layer in these columns, and extremely low evaporation was from the underlying layer. In D15S1 and D15S2, soil evaporation was 11.1 and 11.2 mm, while the reduction of soil water storage was approximately 11.5 and 12.1 mm in the overlying layer, respectively. These results demonstrate that the soil water amount was approximately 0.4–0.8 mm, as it migrates from the overlying to the underlying layers, and water loss by soil evaporation was primarily mainly sourced from the overlying layer. These analysis results proved that there was little water exchange between the overlying and underlying layers during the seasonal freeze–thaw period. As such, it may compared to total soil evaporation.
In summary, the interfaces between the sand layer and the overlying or underlying layers introduced discontinuity to soil water movement during this experiment, when evaporation fronts were located at the surface or inside the overlying layer. The sand interlayer could prevent liquid water exchange between the overlying and underlying layers during the freeze–thaw period of 2018–2019. Some reports have found that soil water movement had changed at the interfaces of different soil layers, whether soil systems were coarse-over-fine material, fine-over-coarse material, multi-layered material, or in sandwiched configuration [8,9,21]. The soil water movement at the interface widely varied depending on the texture of the soils with contrasting hydraulic properties. When evaporation fronts were located at the bottom of the overlying layer, part of the soil water content in the underlying layer could pass through the sand layer for evaporation in the form of vapor; this accounted for a large proportion of evaporation. The reduction of soil water storage in the whole columns was lower than for the overlying layer (Table 4), indicating that a component of the soil water content migrated from the plot into soil columns.

4. Conclusions

Soil evaporation in sand-layered soil columns was analyzed during the seasonal freeze–thaw period using a field experiment with lower initial soil water content and a groundwater depth of more than 25 m. The key findings of this study are summarized as follows:
(1)
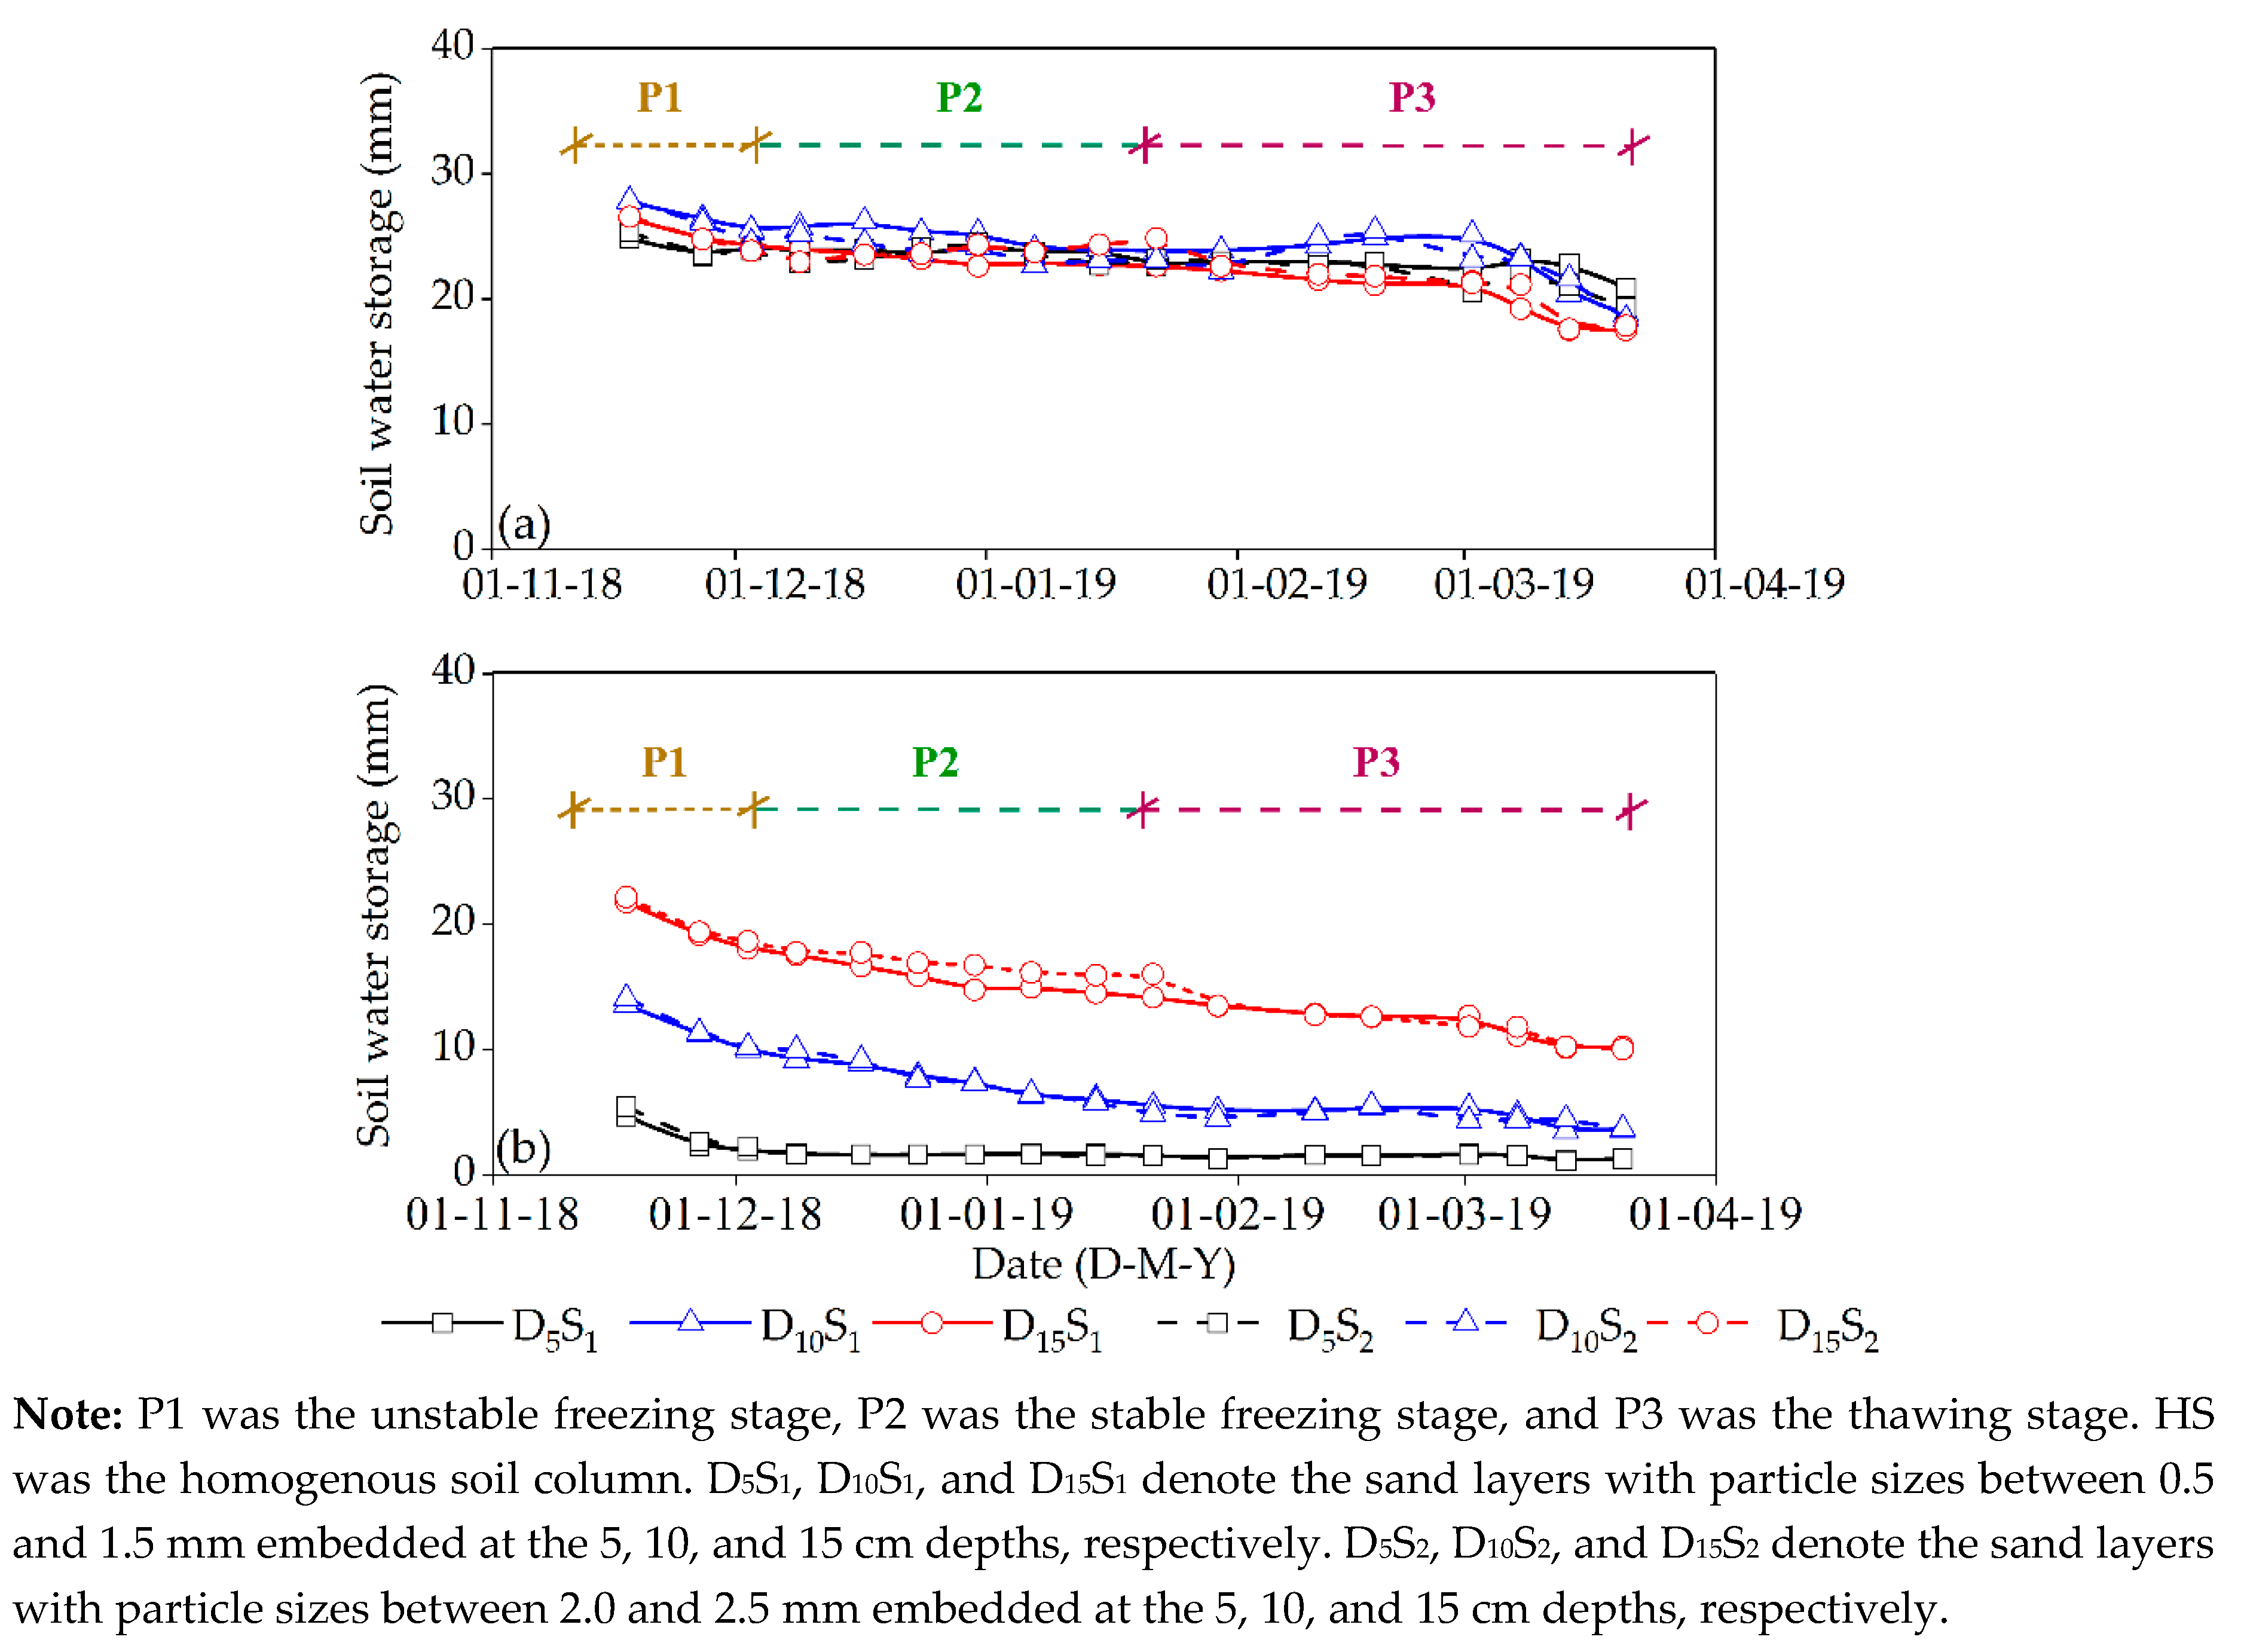
The depth of the sand layer had a great influence on soil water distribution, in contrast to particle size, which had a relatively slight influence on soil water distribution. In the overlying layer, the reduction of soil water storage increased with a deeper sand layer. In the underlying layer, soil water migration caused by soil freezing increased with the rising position of the sand layer, and gradually got close to HS.
(2)
The effect of the sand interlayer position on soil evaporation was greater than particle size. The former could reduce soil evaporation during the seasonal freeze–thaw period. The total evaporation values of sand-layered soil columns decreased by 40%, 40%, 19%, 21%, 18%, and 19% for D5S2, D5S1, D10S2, D10S1, D15S2, and D15S1, respectively, compared with HS.
(3)
Evaporation fronts had a substantial impact on soil evaporation in sand-layered soil columns. When evaporation fronts were located at the soil surface or the overlying layer, the sand layer could prevent liquid water exchange between the overlying and underlying layers. As a result, water loss by evaporation largely originated from the overlying layer (e.g., D10S2, D10S2, D15S2, and D15S1). Once the evaporation front moved to the lower boundary of the overlying layer, water loss was mainly experienced in the underlying layer in the form of vapor (e.g., D5S2 and D5S1)

Author Contributions

X.Z., J.C., and J.X. designed the field experiments. H.F. and Q.D. carried on the field evaporation test. H.F. and J.X. analyzed the data and wrote the paper. X.Z. and J.X. corrected the grammar errors and gave some suggestions for improvement. All authors have read and agreed to the published version of the manuscript.

Funding

This research was supported by the National Natural Youth Science Foundation of China (grant number 51909183), the National Natural Science Foundation of China (grant number 41572239), and the National Natural Youth Science Foundation of China (grant number 41502243).

Conflicts of Interest

The authors declare no conflict of interest.

References

  1. Zhang, B.; Wu, P.; Zhao, X.; Wang, Y.; Wang, J.; Shi, Y. Drought variation trends in different subregions of the Chinese Loess Plateau over the past four decades. Agric. Water Manag. 2012, 115, 167–177. [Google Scholar] [CrossRef]
  2. Sun, J.; Liu, Y.; Sun, B.; Wang, R. Tree-ring based PDSI reconstruction since 1853 AD in the source of the Fenhe River Basin, Shanxi Province, China. Sci. China 2012, 55, 1847–1854. [Google Scholar] [CrossRef]
  3. Ala, M.S.; Liu, Y.; Wang, A.Z.; Niu, C.Y. Characteristics of soil freeze–thaw cycles and their effects on water enrichment in the rhizosphere. Geoderma 2016, 264, 132–139. [Google Scholar] [CrossRef]
  4. Yang, K.; Wang, C. Water storage effect of soil freeze-thaw process and its impacts on soil hydro-thermal regime variations. Agr. Forest Meteorol. 2019, 265, 280–294. [Google Scholar] [CrossRef]
  5. Feng, H.; Chen, J.; Zheng, X.; Xue, J.; Miao, C.; Du, Q.; Xu, Y. Effect of sand mulches of different particle sizes on soil evaporation during the Freeze–Thaw period. Water 2018, 10, 536. [Google Scholar] [CrossRef] [Green Version]
  6. Fu, Q.; Yan, P.; Li, T.; Cui, S.; Peng, L. Effects of straw mulching on soil evaporation during the soil thawing period in a cold region in northeastern China. J. Earth System Sci. 2018, 127, 33. [Google Scholar] [CrossRef] [Green Version]
  7. Warrick, A.W.; Jim Yeh, T.C. One-dimensional, steady vertical flow in a layered soil profile. Adv. Water Resour. 1990, 13, 207–210. [Google Scholar] [CrossRef]
  8. Hillel, D.; Talpaz, H. Simulation of soil water dynamics in layered soil. Soil Sci. 1977, 123, 54–62. [Google Scholar] [CrossRef]
  9. Huang, M.; Bruch, P.G.; Barbour, S.L. Evaporation and water redistribution in layered unsaturated soil profiles. Vadose Zone J. 2013, 12. [Google Scholar] [CrossRef]
  10. Hill, D.E.; Parlange, J.Y. Wetting Front Instability in Layered Soils. Soil Sci. Soc. Am. J. 1972, 36, 697. [Google Scholar] [CrossRef]
  11. Sadeghi, M.; Tuller, M.; Gohardoust, M.R.; Jones, S.B. Column-scale unsaturated hydraulic conductivity estimates in coarse-textured homogeneous and layered soils derived under steady-state evaporation from a water table. J. Hydrol. 2014, 519, 1238–1248. [Google Scholar] [CrossRef] [Green Version]
  12. Shokri, N.; Lehmann, P.; Vontobel, P.; Or, D. Drying front and water content dynamics during evaporation from sand delineated by neutron radiography. Water Resour. Res. 2008, 44, W06418. [Google Scholar] [CrossRef] [Green Version]
  13. Willis, W.O. Evaporation from layered soils in the presence of a water table. Soil Sci. Soc. Am. J. 1960, 24, 239–242. [Google Scholar] [CrossRef]
  14. Bresler, E.; Kemper, W.D. Soil water evaporation as affected by wetting methods and crust formation. Soil Sci. Soc. Am. J. 1970, 34, 3–8. [Google Scholar] [CrossRef]
  15. Assouline, S.; Narkis, K.; Gherabli, R.; Lefort, P.; Prat, M. Analysis of the impact of surface layer properties on evaporation from porous systems using column experiments and modified definition of characteristic length. Water Resour. Res. 2014, 50, 1–22. [Google Scholar] [CrossRef] [Green Version]
  16. Lehmann, P.; Assouline, S.; Or, D. Characteristic lengths affecting evaporative drying of porous media. Phys. Rev. E 2008, 77, 056309. [Google Scholar] [CrossRef]
  17. Lehmann, P.; Or, D. Evaporation and capillary coupling across vertical textural contrasts in porous media. Phys. Rev. E 2009, 80, 046318. [Google Scholar] [CrossRef]
  18. Pillai, K.M.; Prat, M.; Marcoux, M. A study on slow evaporation of liquids in a dual-porosity porous medium using square network model. Int. J. Heat Mass Trans. 2009, 52, 1643–1656. [Google Scholar] [CrossRef]
  19. Miller, D.E.; Bunger, W.C. Moisture retention by soil with coarse layers in the profile. Soil Sci. Soc. Am. J. 1963, 27, 586–589. [Google Scholar] [CrossRef]
  20. Shi, W.; Shen, B.; Wang, Z.; Song, X. Laboratory Studies of Evaporation from the Layered Soil-sand Column[C]. Land and Water Management: Decision Tools and Practices. In Proceedings of the 7th Inter Regional Conference on Environment and Water, Beijing, China, 11–14 October 2004; pp. 888–892. [Google Scholar]
  21. Unger, P.W. Soil profile gravel layers: I. Effect on water storage, distribution and evaporation. Soil Sci. Soc. Am. J. 1971, 35, 631–634. [Google Scholar] [CrossRef]
  22. Shi, W.; Shen, B.; Wang, Z.; Wang, W. Effect of the sand layer position on the phreatic evaporation in the layered soil profile. Arid. Land Geogr. 2006, 29, 282–286. (In Chinese) [Google Scholar] [CrossRef]
  23. Chen, J.; Gao, X.; Zheng, X.; Miao, C.; Liu, P.; Du, Q.; Xu, Y. Transformation between Phreatic Water and Soil Water during Freeze–Thaw Periods. Water 2018, 10, 376. [Google Scholar] [CrossRef] [Green Version]
  24. Miao, C.; Chen, J.; Zheng, X.; Zhang, Y.; Xu, Y.; Du, Q. Soil water and phreatic evaporation in shallow groundwater during a freeze–thaw period. Water 2017, 9, 396. [Google Scholar] [CrossRef] [Green Version]
  25. Larson, L.L.; Kiemnec, G.L.; Johnson, D.E. Influence of freeze-thaw cycle on silt loam soil in sagebrush steppe of northeastern Oregon. Rangeland Ecol. Manag. 2019, 72, 69–72. [Google Scholar] [CrossRef]
  26. Weiss, T.; Slavík, M.; Bruthans, J. Use of sodium fluorescein dye to visualize the vaporization plane within porous media. J. Hydrol. 2018, 565, 331–340. [Google Scholar] [CrossRef]
  27. Konukcu, F.; Istanbulluoglu, A.; Kocaman, I. Determination of water content in drying soils: Incorporating transition from liquid phase to vapor phase. Aust. J. Soil Res. 2004, 42, 1–8. [Google Scholar] [CrossRef]
  28. Shi, W.; Shen, B.; Wang, Z.; Zhang, J. Water and salt transport in sand-layered soil under evaporation with the shallow underground water table. Trans. Chin. Soc. Agric. Eng. 2005, 21, 23–26. (In Chinese) [Google Scholar] [CrossRef]
  29. Yamanaka, T.; Yonetani, T. Dynamics of the evaporation zone in dry sandy soils. J. Hydrol. 1999, 217, 135–148. [Google Scholar] [CrossRef]
  30. Low, P.F.; Hoekstra, P.; Anderson, D.M. Some Thermodynamic Relationships for Soils at or Below the Freezing Point: 2. Effects of temperature and pressure on unfrozen soil water. Water Resour. Res. 1968, 4, 541–544. [Google Scholar] [CrossRef] [Green Version]
  31. Suzuki, S. Dependence of unfrozen water content in unsaturated frozen clay soil on initial soil moisture content. Soil Sci. Plant. Nutr. 2004, 50, 603–606. [Google Scholar] [CrossRef] [Green Version]
  32. Kozlowski, T. A simple method of obtaining the soil freezing point depression, the unfrozen water content and the pore size distribution curves from the DSC peak maximum temperature. Cold Reg. Sci. Technol. 2016, 122, 18–25. [Google Scholar] [CrossRef]
  33. Watanabe, K.; Osada, Y. Simultaneous measurement of unfrozen water content and hydraulic conductivity of partially frozen soil near 0°C. Cold Reg. Sci. Technol. 2017, 142, 79–84. [Google Scholar] [CrossRef]
  34. Campbell, G.S. Soil Physics with Basic; Elsevier: Amsterdam, The Netherlands, 1985; Volume 14, Transport Models for Soil-Plant Systems (Developments in Soil Science); 150p, Available online: https://www.elsevier.com/books/soil-physics-with-basic/campbell/978-0-444-42557-7 (accessed on 22 July 2020).
  35. Cass, A.; Campbell, G.S.; Jones, T.L. Enhancement of thermal water vapor diffusion in soil. Soil Sci. Soc. Am. J. 1984, 48, 25–32. [Google Scholar] [CrossRef]
  36. Jabro Jay, D. Water vapor diffusion through soil as affected by temperature and aggregate size. Transport. Porous Med. 2009, 77, 417. [Google Scholar] [CrossRef]
  37. Moldrup, P.; Olesen, T.; Gamst, J.; Schjønning, P.; Yamaguchi, T.; Rolston, D.E. Predicting the gas diffusion coefficient in repacked soil water-induced linear reduction model. Soil Sci. Soc. Am. J. 2000, 64, 1588–1594. [Google Scholar] [CrossRef]
  38. Du, C.; Yu, J.; Wang, P.; Zhang, Y. Analysing the mechanisms of soil water and vapour transport in the desert vadose zone of the extremely arid region of northern China. J. Hydrol. 2018, 558, 592–606. [Google Scholar] [CrossRef]
Figure 1. Location of the experimental site in Shanxi Province, China.
Water 12 02092 g001
Figure 2. The variations of average daily temperature and solar radiation: (a) precipitation and (b) frost depth during the seasonal freeze–thaw period.
Water 12 02092 g002
Figure 3. (a) Layout of experimental area; and (b) micro-lysimeters of the homogeneous soil column and sand-layered soil columns.
Water 12 02092 g003
Figure 4. The mean soil temperature of the soil profile in the homogeneous and sand-layered soil columns during (a) P1; (b) P2; and (c) P3.
Water 12 02092 g004
Figure 5. The soil water content at different depths in the (a) homogeneous soil column; (b) sand layer with a particle size between 0.5 and 1.5 mm and (c) between 2.0 and 2.5 mm embedded at the 5 cm depths; (d) sand layer with a particle size between 0.5 and 1.5 mm and (e) between 2.0 and 2.5 mm embedded at the 10 cm depths; (f) sand layer with a particle size between 0.5 and 1.5 mm and (g) between 2.0 and 2.5 mm embedded at the 15 cm depths during the seasonal freeze–thaw period.
Water 12 02092 g005aWater 12 02092 g005b
Figure 6. The positions of evaporation fronts in the (a) homogeneous soil column; (b) sand layer with particle size between 0.5–1.5 mm and 2.0–2.5 mm embedded at 5 cm depths; (c) sand layer with particle size between 0.5–1.5 mm and 2.0–2.5 mm embedded at 10 cm depths; (d) sand layer with particle size between 0.5–1.5 mm and 2.0–2.5 mm embedded at 15 cm depths in the seasonal freeze–thaw period.
Water 12 02092 g006
Figure 7. Cumulative soil evaporation of the homogeneous and sand-layered soil columns.
Water 12 02092 g007
Figure 8. Evaporation rates of homogeneous and sand-layered soil columns during the seasonal freeze–thaw period.
Water 12 02092 g008
Figure 9. Soil water storage of the (a) whole sand-layered soil columns; and (b) the overlying layer.
Water 12 02092 g009
Table 1. Soil properties in the top 0–100 cm layer.
Soil
Depth (cm)
Bulk
Density
(g·cm−3)
Particle DistributionField Capacity
(cm3·cm−3)
Permanent Wilting
Point
(cm3·cm−3)
Saturated Hydraulic
Conductivity
(cm·d−1)
Clay
(%)
Silt
(%)
Sand
(%)
0–201.411.2015.5783.240.200.10244.91
20–601.521.1820.3278.50.180.09121.98
60–801.520.8816.8482.290.190.09171.55
80–1001.520.418.1491.450.190.09519.40
Table 2. Soil evaporation in homogeneous and sand-layered soil columns in different freeze–thaw stages (unit: mm).
StagesHSD5S1D10S1D15S1D5S2D10S2D15S2
P14.3a3.0c3.3c3.4c3.3c3.6bc3.9ab
P24.1a2.1d3.5c3.9ab2.0d3.5c3.8b
P35.4a3.1e4.1b3.8c3.0e4.0b3.6d
Total period13.7a8.2d10.9c11.1bc8.3d11.0bc11.3b
Note: P1 was the unstable freezing stage, P2 was the stable freezing stage, and P3 was the thawing stage. HS was the homogenous soil column. D5S1, D10S1, and D15S1 denote the sand layers with particle sizes between 0.5 and 1.5 mm embedded at the 5, 10, and 15 cm depths, respectively. D5S2, D10S2, and D15S2 denote the sand layers with particle sizes between 2.0 and 2.5 mm embedded at the 5, 10, and 15 cm depths, respectively.
Table 3. Soil evaporation rates in homogeneous and sand-layered soil columns during different freeze–thaw stages (unit: mm·d−1).
StagesHSD5S1D10S1D15S1D5S2D10S2D15S2
P10.280.200.220.230.220.240.26
P20.080.040.070.080.040.070.08
P30.090.050.070.060.050.070.06
Total period0.110.070.090.090.070.090.09
Note: P1 was the unstable freezing stage, P2 was the stable freezing stage, and P3 was the thawing stage. HS was the homogenous soil column. D5S1, D10S1, D15S1 denotes the sand layer with a particle size between 0.5–1.5 mm embedded at the 5, 10, 15 cm depths, respectively. D5S2, D10S2, D15S2 denotes the sand layer with a particle size between 2.0 and 2.5 mm embedded at 5, 10, 15 cm depths, respectively.
Table 4. The reduction of soil water storage in the overlying layer and the whole sand-layered soil columns (unit: mm).
PartsD5S1D10S1D15S1D5S2D10S2D15S2
Overlying layer3.410.011.54.210.412.1
Whole soil columns3.99.08.96.09.58.7
Note: P1 was the unstable freezing stage, P2 was the stable freezing stage, and P3 was the thawing stage. HS was the homogenous soil column. D5S1, D10S1, and D15S1 denote the sand layers with particle sizes between 0.5 and 1.5 mm embedded at the 5, 10, and 15 cm depths, respectively. D5S2, D10S2, and D15S2 denote the sand layers with particle sizes between 2.0 and 2.5 mm embedded at the 5, 10, and 15 cm depths, respectively.

