Article

Land Use Pattern and Vegetation Cover Dynamics in the Three Gorges Reservoir (TGR) Intervening Basin

1
School of Hydropower and Information Engineering, Huazhong University of Science and Technology, Wuhan 430074, China
2
School of Hydraulic Engineering, Changsha University of Science & Technology, Changsha 410114, China
3
Key Laboratory of Water-Sediment Sciences and Water Disaster Prevention of Hunan Province, Changsha 410114, China
*
Author to whom correspondence should be addressed.
Water 2020, 12(7), 2036; https://doi.org/10.3390/w12072036
Submission received: 28 May 2020 / Revised: 10 July 2020 / Accepted: 13 July 2020 / Published: 17 July 2020
(This article belongs to the Section Biodiversity and Functionality of Aquatic Ecosystems)

Abstract

:
The Three Gorges Reservoir (TGR) intervening basin is one of the most important, ecologically fragile and sensitive areas in the upper reaches of the Yangtze River. Since the completion and operation of the TGR, the change of the ecological environment in this region—with vegetation as an indicator—has been a consistent focus of attention. Based on the six phases of land use data and normalized difference vegetation index (NDVI), temperature and precipitation data from 1998 to 2017, the change and trend of land use and vegetation cover in the TGR intervening basin were analyzed quantitatively by using a transition matrix, linear regression and partial correlation analysis. The area of unchanged land use type is 56,565 km2, accounting for 97.27% of the total area of the basin. The vegetation coverage with NDVI as the indicator showed a significant upward trend, with a growth rate of 7.5%/10a. The impact of temperature on vegetation was greater than that of precipitation on vegetation. The non-linear fitting curve of NDVI to temperature and precipitation rose with the time course of TGR impoundment, although the mechanism remains to be studied further. In general, climate change, ecological restoration measures, urbanization and reservoir impoundment did not significantly change the spatial distribution pattern of land use and the climate driving mechanism of vegetation growth in the TGR intervening basin.

1. Introduction

The Three Gorges Reservoir (TGR), on the upper reaches of the Yangtze River, is the largest water conservancy project in the world. Since the TGR’s completion and operation, it has attracted worldwide attention not only due to its comprehensive social and economic benefits but also for its potential ecological impact on the surrounding environment [1,2,3,4]. The TGR intervening basin is located in the transition area of a mountain ecosystem and water ecosystem. Its ecological environment is inherently fragile and unstable and thus easily causes ecosystem degradation under interference.
Previous studies have shown that the TGR intervening basin has been subjected to an array of natural environment changes such as regional extreme meteorological hydrological events [5,6], geological disasters and altered biodiversity [7,8]. The TGR intervening basin has also been seriously disturbed by human activities. About 1.3 million people have been resettled due to the impoundment of the reservoir. At the same time, with the rapid development of the region’s economy and urbanization, a large number of people have gradually migrated to cities [9]. In addition, China has implemented a number of ecological restoration measures in the upper reaches of the Yangtze River since 1998 [10,11], including the natural forest conservation program (NFCP), Grain for Green Project (GGP), etc. The implementation of these measures may have a profound impact on regional scale vegetation change and water resource security [12,13,14]. These natural and anthropogenic environmental changes may have direct or indirect effects on the terrestrial ecosystem of the TGR intervening basin, inducing substantial complexity and uncertainty regarding its security [15].
As one of the most important parts of the Earth’s land ecosystem, vegetation is conducive to the sustainability of the ecosystem. Vegetation can sequester carbon, regulate a microclimate, protect biodiversity, conserve water and soil and mitigate natural disasters, and it is often considered as an indicator of biological response to environmental factors, both climatic and anthropogenic [16,17,18]. Therefore, a comprehensive understanding of the changes in vegetation activities is an important task in the prediction of future vegetation growth trends, environmental changes and ecosystem evolution [19,20]. In general, remote sensing technology is used to study vegetation change at the macro scale (such as the regional scale). The normalized difference vegetation index (NDVI) is an important remote sensing and Earth surface coverage parameter that can accurately reflect vegetation growth status, vegetation coverage and photosynthesis intensity [21,22]. Its time series data have become the basic element for monitoring and studying the dynamic change of vegetation growth and land cover based on bioclimatic characteristics [16]. Land use will significantly affect the change of NDVI. When the land use type changes, the corresponding characteristic NDVI value will change significantly [19,23]. For example, the NDVI value of forest land will be significantly greater than that of grassland or water area. Meanwhile, the response relationship between the NDVI value of different land use types and meteorological factors such as temperature and precipitation is also significantly different. Therefore, it is necessary to investigate land use change when NDVI time series data are used for vegetation characterization.
The TGR has been in operation and impoundment for many years, and many research works on the TGR intervening basin have focused on Land Use/Cover Change(LUCC), migration, water system change and ecological impact on the downstream lakes [24,25,26]. Less attention has been paid to the impact of the impoundment of the TGR on vegetation [27], and land use and NDVI have not been combined to consider the dynamics of vegetation cover. This paper intends to analyze the change and transfer of land use over time in the TGR intervening basin, taking NDVI as the representation of vegetation cover and environmental factors, combined with partial correlation analysis, to deepen the understanding of the response mechanism of vegetation cover in the study area to the changing environment of temperature, precipitation and impoundment of the TGR. This study provides a scientific basis for the further exploration of the adaptive utilization of water resources and the mitigation of the negative effects of reservoirs under climate change.

2. Materials and Methods

2.1. Study Area

The TGR intervening basin is about 58,152 km2 in size and is located at the junction of Sichuan Basin and the plain of the middle and lower reaches of the Yangtze River (Figure 1). It crosses the gorge of Central Hubei district and the valley zone of East Sichuan ridge, with the Ta-pa Mountains in the north and the Sichuan-Hubei plateau in the South. The basin’s climate is a typical subtropical monsoon climate, with an annual precipitation of 900–1800 mm and relatively uniform distribution. The land types are various, the area of hills and mountains is large, the area of flat land is small, the land structure is complex and the vertical difference is obvious.

2.2. Data Materials

China’s land use/land cover data classification includes six first-class types of cultivated land, forest land, grassland, water area, residential land and bare land and 25 s-class types that are mainly reclassified according to the natural attributes of land resources. In this paper, the secondary types of paddy field and dry land were combined with the other five primary types to form seven land use types. The data set was provided by Data Center for Resources and Environmental Sciences, Chinese Academy of Sciences (RESDC) (http://www.resdc.cn), with a resolution of 1 km by 1 km.
NDVI can accurately reflect the surface vegetation coverage. The NDVI data used in this paper come from the Resource and Environment Data Cloud Platform [28]. The data set is based on the continuous time series of SPOT/VEGETATION NDVI satellite remote sensing data. The monthly vegetation index data set since 1998 is generated by the maximum value composites method.
Precipitation and temperature data are from China Meteorological Data Network (http://data.cma.cn). Vegetation and climate data have different sources, different spatial resolutions and different data formats. To establish a correlation between them, we need to preprocess the data. In this study, inverse distance weighted interpolation (IDW) is used to interpolate the air temperature and precipitation data into a 1 by 1 km spatial resolution, and Albert projection is used to obtain the meteorological grid data with the same pixel size, geographic coordinate system and projection as NDVI data. Then, the grid data of monthly mean temperature and precipitation in the Three Gorges region of the Yangtze River are obtained by data clipping.

2.3. Methods

2.3.1. Land Use Transition Matrix

The land use transition matrix comes from the quantitative description of system state and state transfer in system analysis. The general land use transition matrix is shown in Table 1. The rows represent the land use type at time T1 and the columns show the land use type at time T2. The pij represents the area of land type Ai converted to land type Aj during T1–T2, and pii represents the area of land use type Ai which remained unchanged during T1–T2. Additionally, pi+ represents the total area of land type Ai at T1 and p+j represents the total area of land use type Aj at T2. The decreased part of the Ai area of land type during T1–T2 is denoted by pi+–pii, and p+j–pjj is the increased area of the Aj land type during T1–T2.

2.3.2. Variations of NDVI and Linear Trend

The regression trend line is a regression analysis method for a group of variables which change with time; this method was used to calculate the change rate of vegetation greenness [29]. In order to understand the overall development status of vegetation in the study area from 1998 to 2017, it is proposed to analyze the NDVI change trend of each grid by using one-dimensional linear regression analysis and to carry out spatial quantitative analysis on the growth and change size of vegetation in different topography and vegetation coverage types in the study area. By calculating the annual series of NDVI values of each raster, the trend analysis method is used to simulate the time change trend of NDVI cells, and the calculation formula is as follows:
Q s l o p e = n i = 1 n ( i M NDV I i ) i = 1 n i i = 1 n M NDV I i n i = 1 n i 2 ( i = 1 n i ) 2 ,
where n is the length of time series, M NDV I i is the mean value of NDVI of the grid in the ith year and Q s l o p e is the slope of trend line. Q s l o p e > 0 indicates that NDVI increases in this period, Q s l o p e < 0 indicates that NDVI decreases and Q s l o p e = 0 indicates that NDVI does not change.

2.3.3. Partial Correlation Analysis

The simple correlation coefficient is only the local correlation property of two variables, not the whole property. In a complex system composed of many elements, the close degree of the relationship between the two elements is called partial correlation, which does not consider the influence of other elements. In multiple regression, we do not place a focus on the simple correlation coefficient, but pay close attention to partial correlation coefficient. The partial correlation coefficient is the correlation coefficient between two variables in multiple regression analysis under the condition of eliminating the influence of other variables.
Suppose we need to calculate the correlation between X and Y, and that Z represents all the other variables; the partial correlation coefficient of X and Y can be considered as the simple correlation coefficient between the residual RX obtained by X and Z linear regression and the residual RY obtained by Y and Z linear regression. According to the partial correlation coefficient, we can judge the influence degree of the independent variable on the dependent variable and ignore those independent variables that have little influence on the dependent variable.
The common steps of using a partial correlation coefficient to analyze the net correlation among variables are as follows:
Step 1: Calculate the simple correlation coefficients. The correlation coefficients of variables X and Y are
r X , Y = i = 1 n ( x i x ¯ ) ( y i y ¯ ) i = 1 n ( x i x ¯ ) 2 i = 1 n ( y i y ¯ ) 2 .
Step 2: Calculate the partial correlation coefficient. The partial correlation coefficient calculated from the sample data reflects the strength of the net correlation between the two variables. When analyzing the net correlation between variables X and Y, under the condition of controlling the linear action of variable Z, the first-order partial correlation coefficient between X and Y is defined as
r X , Y ( Z ) = r X , Y r X , Z r Y , Z 1 r X , Z 2 1 r Y , Z 2 .
Step 3: Infer whether there is a significant net correlation between the two populations from which the sample originates. The original hypothesis is that there is no significant difference between the partial correlation coefficient and zero. Select the test statistics; the test statistics of partial correlation analysis are t statistics. Their mathematical definition is
t = r X , Y ( Z ) 1 r X , Y ( Z ) 2 n q 2 ,
where n is the number of samples, q is the order (the number of independent variables) and the statistics obey the t distribution of n-q-2 degrees of freedom.
Step 4: Calculate the value of the test statistic and the corresponding probability p-value.
Step 5: Make a decision. If the probability p-value of the test statistic is less than the given significance level α, the original hypothesis should be rejected, indicating that there is a correlation between variables; otherwise, the original hypothesis cannot be rejected.

3. Results and Discussion

3.1. Dynamic Changes of Land Use

3.1.1. Land Use Type Statistics

Accurate knowledge of the distribution changes of land use type is the first step in evaluating vegetation cover dynamics. In this paper, the change and trend of land use in the TGR intervening basin are analyzed quantitatively by using six land use data sets. The statistical results are shown in Table 2. In the whole study area, the largest type is forest land (over 46%), followed by dry land (over 26%), while paddy field and grassland area are similar (about 11% and 12%) and the smallest type is resident land, water body and bare land (less than 5% in total). Various land use types are constantly changing. The areas of paddy field, dry land and grassland are slightly reduced, the forest land is slightly increased and the area of water body and resident land is significantly increased. The resident land has more than tripled in 20 years, but the proportion of the basin area is not large (Figure 2).
With the implementation of NFCP and GGP, forest and grass land in some areas have been improved, but there has been a large degree of degradation in some areas due to population growth, economic development, urban expansion and other factors [11,30]. In June 2003, the water level of the TGR raised from 66 to 135 m. After years of experimental impoundment, the water level of the reservoir reached a 175-m normal water level for the first time in October 2010. Before the first impoundment of the TGR in 2003, the floodplain was mainly covered by agricultural vegetation, shrubbery and forest, while after 2003, the water level of the reservoir has changed periodically. The river beach is dominated by annual herbs [31], and the area of water body has increased year by year. In general, land use patterns are closely related to elevation, and the spatial distribution of the main land use types changes little.

3.1.2. Land Use Transfer

After determining the quantitative statistics of land use quantity and change, in order to describe the dynamic transfer and spatial distribution of land use, the land use transition matrix (Table 3; Table 4) in 1995–2005 and 2005–2015 and spatial transfer map (Figure 3) were established, and the change pattern and spatial transfer of seven types of land use in different stages were compared and analyzed. The results show that all kinds of land use/cover changes are reversible in time and space, including the transfer out from this type to other cover types and the transfer in from other cover types to this type.
The area of paddy field and dry land transferred to other land use types is larger than that of other land use types transferred to paddy field and dry land, the amount of grass land transferred in and out are the same, more forest land is transferred in than out and the ecological restoration measures have played a large role. The area of water body and resident land transferred from other land use types increased significantly, which is closely related to the impoundment of the TGR and the acceleration of urbanization.
The spatial transfer map of the main land use types (Figure 3) showed that the area of the unchanged land use type was much greater than the changed land use land and that the land use change was relatively slow in the past 20 years. The increase of resident land and water bodies is relatively obvious. From 1995 to 2015, about 234 km2 of paddy field, 275 km2 of dry land, 69 km2 of forest land and 32 km2 of grassland were transferred to resident land; about 33 km2 of paddy field, 52 km2 of dry land, 80 km2 of forest land, 29 km2 of grassland, and 14 km2 of resident land was transferred to water bodies. By 2015, 614 km2 of land use types were transferred to resident land, and the resident land increased to 770 km2, accounting for about 1.32% of the total area of the basin; 210 km2 of land types were transferred into water bodies, and the water bodies increased to 839 km2, accounting for about 1.44% of the total area of the basin.
Compared with 1995 and 2015, the unchanged area of land use was 56,565 km2, accounting for 97.27% of the total area of the basin. In contrast to other land use transformation processes, such as industrial land transition [32], the land use transition in the basin interfered by the reservoir takes more consideration of ecological security, and the spatial–economic process on the regional level has little impact on this [33]. It can be concluded that the reservoir impoundment, resettlement and ecological restoration measures in the TGR intervening basin did not significantly change the spatial distribution pattern of land use.

3.2. Temporal Variation and Spatial Distribution of NDVI

3.2.1. Temporal Variation of NDVI

According to the monthly data of NDVI from 1999 to 2017, the multi-year monthly average value of NDVI was calculated. It is obvious that the NDVI value also changes with the change of months. Figure 4a shows the monthly change of NDVI in the TGR intervening basin over 19 years. The NDVI value was the highest in July, with a multi-year average of 0.7660. NDVI was the lowest in January, with a multi-year average of 0.3471. From February to June, the NDVI of the whole range showed an obvious upward trend, and cultivated crops, forest and grasslands were in the growth stage. Until July, the study area had abundant sunshine and abundant rain, and the vegetation was in the most vigorous growth stage of the year. Crops began to mature in August, part of the vegetation withered, and NDVI fell to the lowest level of the year in January.
Influenced by climate, hydrology, human activities and other factors, the growth of vegetation varies from year to year. The NDVI data of 12 months were averaged to obtain the annual NDVI value, which can better reflect the situation of the land surface vegetation cover in that year and eliminates the influence of seasonal changes in different regions on the land surface vegetation cover change [34]. As shown in Figure 4b, from 1999 to 2017, the overall vegetation coverage of the TGR intervening basin with NDVI as the indicator showed a significant upward trend, with a growth rate of 7.5%/10a. Vegetation activities in the whole basin were strengthened and productivity increased. During the period, there are two obvious fluctuations of decreasing value. In 2001, the NDVI value was 0.5173—the lowest point in 19 years—and the area of average precipitation of the basin in that year was the lowest for 19 years, at 878 mm (Figure 4d). In 2012, the NDVI value decreased to 0.5634, and the area average temperature of the basin in that year was 16.38 °C, the lowest value in 19 years (Figure 4c). By analyzing the change of NDVI, which represents the natural ecological environment of this region, it is found that NDVI is not only directly related to land use but also strongly correlated with temperature and precipitation [35].

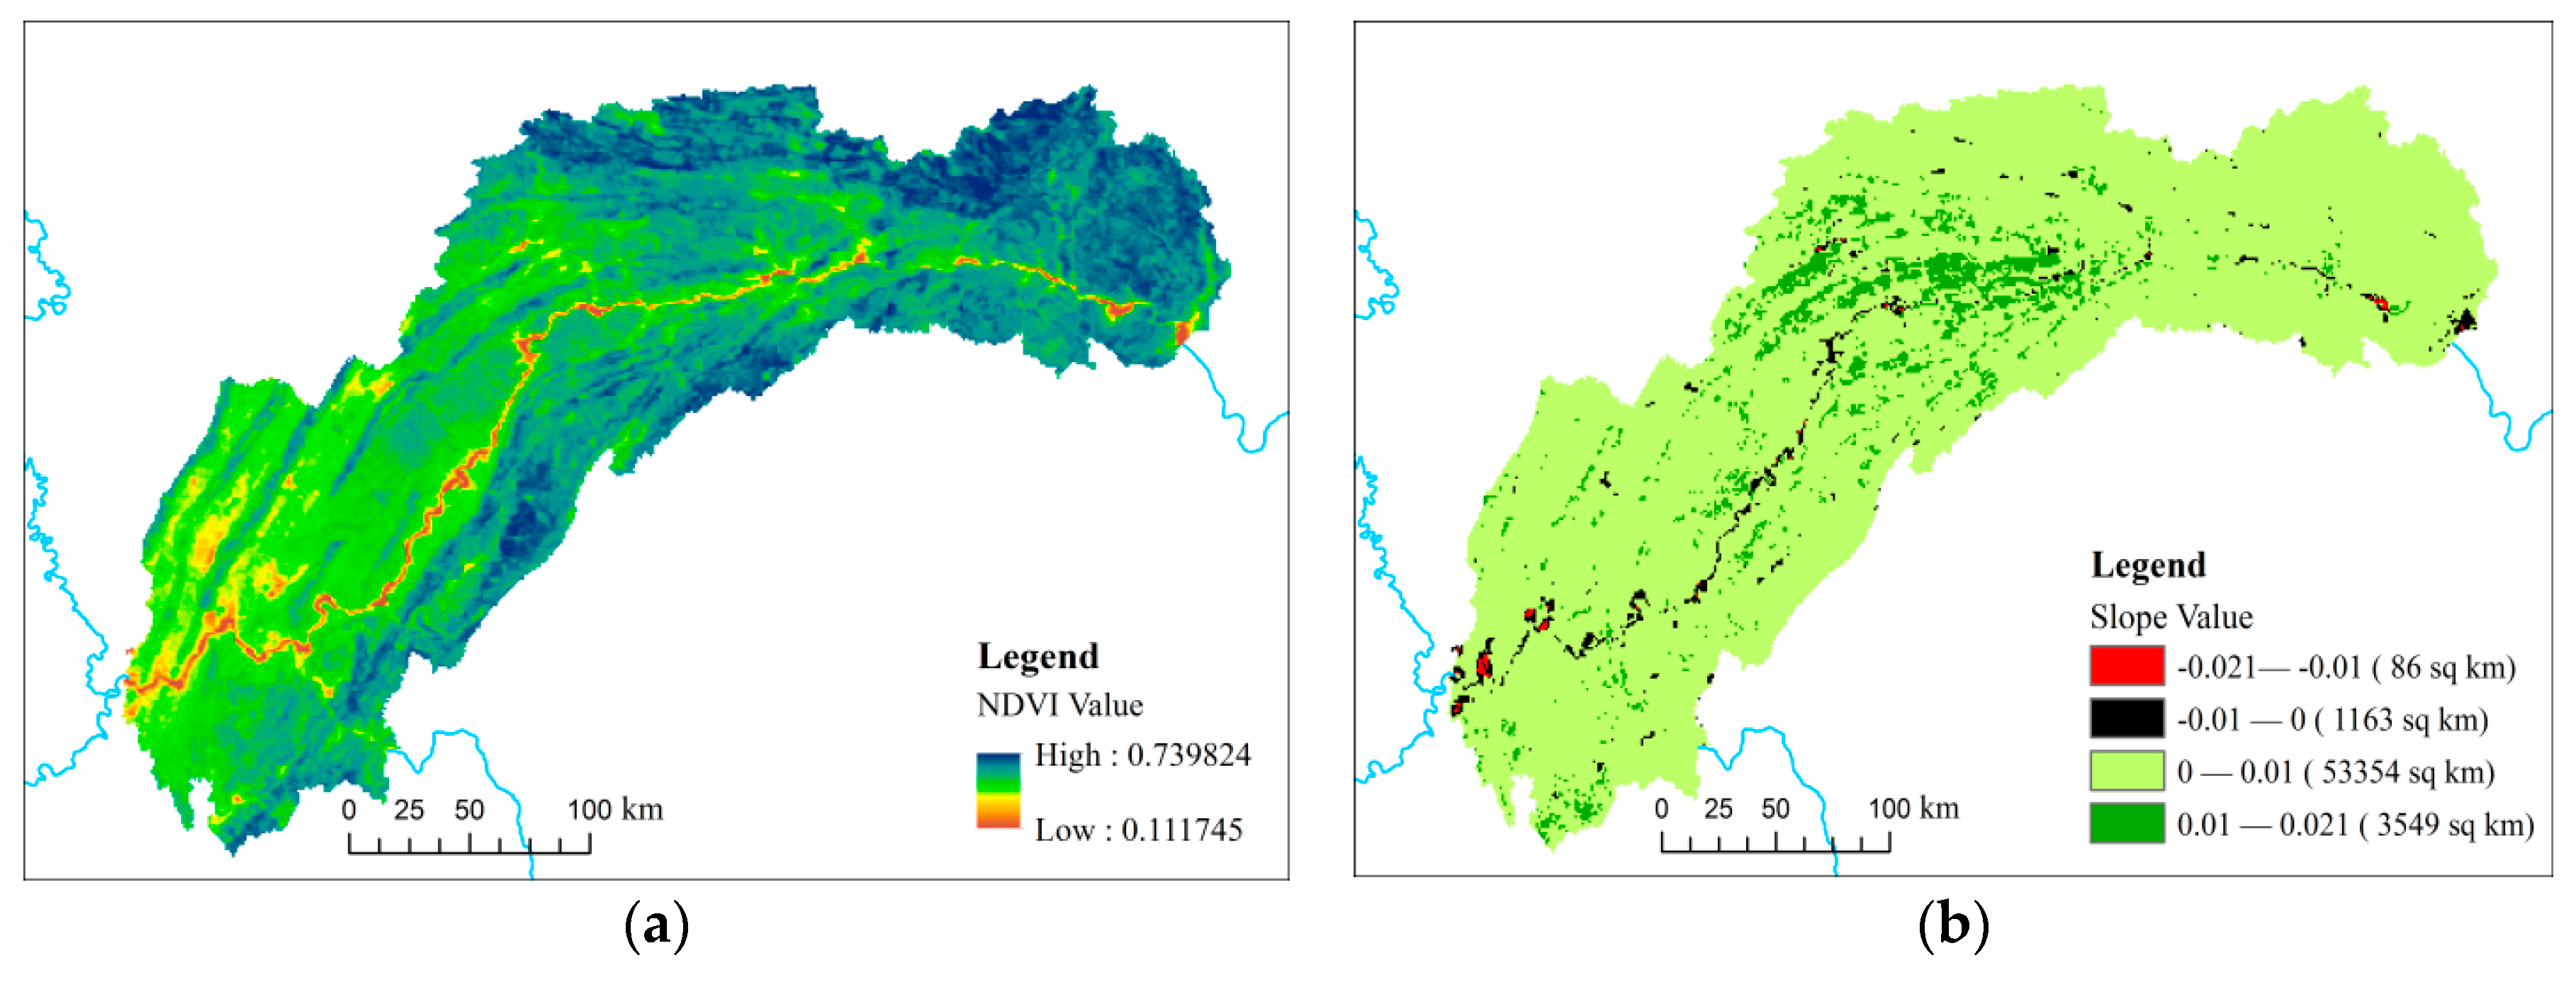
3.2.2. Spatial Variation of NDVI

Figure 5a shows the spatial distribution of multi-year (1999–2017) average NDVI in the TGR intervening basin. It can be seen from the figure that the study area has good vegetation coverage, and the distribution of NDVI follows similar laws to the distribution of elevation and the distribution of land use types. In the northeast of the Ta-pa Mountains and south of the Sichuan-Hubei plateau, the elevation is more than 1 km, and the land use type is mostly forest land, which has the highest NDVI value. In the middle and western basin and the valley zone of the east Sichuan ridge, the land use types in the elevation range of 500–1000 m are mostly grass land. In the vicinity of the Sichuan basin, the land use types within the elevation interval below 500 m are mostly cultivated land (dry land and paddy field). The NDVI value of cultivated land varies greatly over the four seasons, with a low mean value. The NDVI value of urban and rural residential land near rivers is the lowest.
According to the analysis of the change slope of every grid cell (Figure 5b), it is found that there are significant differences in vegetation cover changes in the TGR intervening basin from 1999 to 2017. The area with improved vegetation coverage was about 56,903 km2, accounting for 97.85% of the total area. The area where NDVI has increased significantly is mainly distributed in the mountainous areas with relatively slow economic development, a better background of forest resources and smaller population density, and the general increase area is widely distributed in the study area. With the implementation of the ecological restoration project, the ecological environment in the area with high vegetation coverage has been well protected, the growth and development of vegetation and its renewal are in good condition and the vegetation coverage can be kept stable or increased. In addition, in the area with low vegetation coverage, the continuous intervention of artificial greening means that the damaged and degraded vegetation has been restored to a certain extent. The results show that the vegetation condition in the TGR intervening basin tends to develop well, which is consistent with the conclusion of Yang et al. [36].
Referring to the results of land use pattern distribution in the previous section, the degradation areas of vegetation coverage are mainly distributed in the Yangtze River and residential areas near rivers, with a degraded area of 1249 km2, accounting for 2.15% of the total area. The results show that the increase of water area and hard surface area will directly lead to the increase of patch size and complexity of low vegetation coverage with the impoundment of TGR and the expansion of the urbanization process [25,37]. However, the influence scope of these negative interferences is limited, and so they do not significantly affect the landscape pattern of vegetation cover.

3.3. Response of NDVI to Changing Environment

Research on land use has shown that the land use in the TGR intervening basin is less affected by the Three Gorges Project and vegetation restoration project, and the land use pattern has remained basically unchanged for 20 years. Therefore, we can ignore the impact of land use change on NDVI in the study area and only consider the response of NDVI to climate change and other human activities.

3.3.1. Partial Correlation Analysis of NDVI with Temperature and Precipitation

Due to the impoundment of TGR, the underlying surface near the Yangtze River changes from land or vegetation to water surface, and the area of water surface increases. With the periodic change of the water level of the TGR, the vertical movement of water vapor in the 660-km-long waterway of the Yangtze River may change, which has different effects on evaporation, precipitation, temperature, etc. [38,39], thus affecting the vegetation activities in the basin.
Before the partial correlation analysis of NDVI, air temperature and precipitation, we must first determine whether the correlation coefficient values of NDVI, air temperature and precipitation are significant, along with the degree of correlation. The whole study area is calculated grid by grid (58,152 in total, 1 by 1 km). The calculation results of the correlation coefficient, partial correlation coefficient and p-value of significance test results are shown in Table 5. The average correlation coefficient between NDVI and air temperature is 0.8289, and the grid of 100% in the study area exceeds the significance level of 0.001, indicating that there is a significant positive correlation between NDVI and air temperature. Furthermore, the correlation coefficient between the analysis item and the control variable precipitation is determined. The correlation coefficient between precipitation and NDVI, precipitation and temperature are significant (p < 0.001, t-test), and the correlation coefficient is high, with mean values of 0.6854 and 0.7905, respectively. This shows that precipitation is closely related to NDVI and temperature at the same time in the correlation analysis, and the inclusion of precipitation as the control variable in the partial correlation analysis between NDVI and temperature is appropriate. It is also appropriate to include temperature as a control variable in the partial correlation analysis of NDVI and precipitation.
Taking precipitation as the control variable, the partial correlation coefficient between monthly NDVI and monthly average temperature is between 0.1722–0.8562, with an average of 0.6505. The partial correlation of the 100% grid exceeded the significance level of 0.01 and the 99.99% grid exceeded the significance level of 0.001, indicating that NDVI had a significant positive correlation with temperature.
Taking temperature as the control variable, the partial correlation coefficient between monthly NDVI and monthly average precipitation is between −0.1608–0.3161, with an average of 0.0922. Only 28.01% of the grids had a partial correlation over the 0.05 significance level, 12.04% of the grids had a partial correlation over the 0.01 significance level and 2.74% of the grids had a partial correlation over the 0.001 significance level. On the whole, the partial correlation between NDVI and precipitation is weak in the study area.
From April 1998 to December 2017, the spatial distribution of the partial correlation coefficient between monthly NDVI and the monthly temperature, monthly NDVI and monthly precipitation of each grid (58,152 in total, resolution 1 by 1 km) in the study area is shown in Figure 6. In different land use types, the correlation between NDVI and climate factors shows a certain spatial difference. The vegetation coverage shows different sensitivity and feedback characteristics due to different geographical location, geographical environment and time. Climate is the decisive factor for vegetation distribution. Among all climate factors, vegetation is most sensitive to the change of temperature and precipitation [40]. The sensitivity of NDVI to the change of temperature and precipitation has obvious differences in space. This spatial heterogeneity may be the result of the comprehensive effect of human activities, regional climate local characteristics and vegetation response to climate change [35].
Obviously, the Three Gorges project has not changed the driving effect of climate factors such as precipitation and temperature on vegetation growth in the study area, but the partial correlation coefficient between NDVI and temperature is higher than that between NDVI and precipitation, which indicates that the sensitivity of vegetation cover to temperature change is higher than that to precipitation change. The main reason for this is that the water resources in the TGR intervening basin are sufficient, basically meeting the needs of plant growth, but the heat resources are insufficient, which affects the vegetation growth in the study area; thus, the heat resources play a significant role in vegetation growth in the TGR intervening basin.

3.3.2. Response of NDVI to Temperature and Precipitation Considering Impoundment of the TGR

Under the dual influence of climate change and human activities, vegetation always adapts to the changes of the external environment to make its own activities more favorable. This process is dynamic and nonlinear. It is necessary to further study the non-linear response of vegetation to the changed environment in the TGR intervening basin. From April 1998 to December 2017, the NDVI, monthly temperature and monthly precipitation data in the study area were processed on a grid area average. Based on the 237 groups of data obtained, the NDVI–temperature and NDVI–precipitation scatter maps of the TGR intervening basin were drawn (Figure 7).
Further analysis of the overall distribution of scattered points shows that the NDVI value has a nonlinear relationship with the temperature and precipitation, approaching a second-order nonlinear structure. Therefore, second-order nonlinear mapping is used to describe the nonlinear response relationship between NDVI and temperature and NDVI and precipitation. The corresponding second-order nonlinear mapping curve is shown in Figure 7. Compared with NDVI and precipitation, the fitting effect of NDVI and temperature is better.
In June 2003, the water level of the TGR raised from 66 to 135 m. After years of experimental impoundment, the water level of the reservoir reached a 175-m normal water level for the first time in October 2010. Due to the influence of different impoundment stages of the TGR, the relationship between impoundment and the environment has been adjusted many times. Under the influence of impoundment of the TGR, the response of vegetation cover, with NDVI as an index, to temperature and precipitation may have changed.
Furthermore, 237 groups of monthly area average NDVI, monthly area average temperature and precipitation data were divided into three time periods: the pre-TGR period (April 1998–May 2003), test-TGR period (June 2003–December 2010) and post-TGR period (January 2011–December 2017). The NDVI–temperature and NDVI–precipitation scatter maps of the TGR intervening basin in three time periods are drawn below (Figure 8).
It can be seen from Figure 8 that NDVI increases with the increase of temperature within 30 °C. With the increase of precipitation, NDVI increases, but when the precipitation reaches a certain threshold (about 220 mm), excessive precipitation will inhibit plant growth and reduce the NDVI value. The scatter points (test-TGR period) in the experimental impoundment stage are mostly located above the scatter points (pre-TGR period) before the impoundment of the TGR, and the scatter points (post-TGR period) in the year after reaching a 175-m normal water level for the first time are mostly located above the scatter points (test-TGR period) in the experimental impoundment stage. Thus, under the same temperature and precipitation conditions, the NDVI value after reservoir impoundment is large. According to the quadratic curve fitted by scattered points in each stage, the upward movement of the response relationship is intuitively displayed.
Before and after the impoundment of the TGR and during the experimental impoundment stage, the upward movement of the NDVI response curve to temperature and precipitation may be associated with the impoundment of the TGR. The research shows that the construction and operation of the reservoir commonly interrupt the balance of the subsurface system, changing the groundwater level and local microclimate in the basin [41,42], which may bring about changes in biodiversity and vegetation growth characteristics. The groundwater level can also be used as another important factor to regulate the growth of vegetation. However, it is not easy to obtain the historical data of groundwater level. It is reasonable to believe that the groundwater level in the TGR intervening basin is closely related to the water level of the TGR. Therefore, further efforts are required to investigate the contribution of the water level of the TGR to the vegetation dynamics.

4. Conclusions

The main findings of this study can be summarized as follows:
With the implementation of NFCP and GGP, forest and grass land in some areas have been improved, but there will be a large degree of reduction in some areas due to population growth, economic development, urban expansion and other factors. The spatial transfer map of the main land use types showed that the unchanged land use type covered a much greater area than the changed land use land. Compared with 1995 and 2015, the unchanged area of land use was 56,565 km2, accounting for 97.27% of the total area of the basin. In general, land use patterns are closely related to elevation, and the spatial distribution of main land use type exhibits no significant change. It can be concluded that the reservoir impoundment, resettlement and ecological restoration measures in the TGR intervening basin did not significantly change the spatial distribution pattern of land use.
The study area has good vegetation coverage. From 1999 to 2017, the overall vegetation coverage of the TGR intervening basin with NDVI as an indicator showed a significant upward trend, with a growth rate of 7.5%/10a. From the perspective of spatial change, the study area has good vegetation coverage, and the distribution of NDVI follows similar laws to the distribution of elevation and the distribution of land use types. According to the analysis of the change slope of every grid cell, it is found that there are significant differences in vegetation cover changes in the TGR intervening basin from 1999 to 2017. The area with improved vegetation coverage was about 56,903 km2, accounting for 97.85% of the total area. With the implementation of the ecological restoration project, the ecological environment of the basin has been better protected, and the vegetation condition tends to develop well. The degradation areas of vegetation coverage are mainly distributed in the Yangtze River and residential areas near rivers. The degraded area is about 1249 km2, accounting for 2.15% of the total area. The impoundment of TGR and the expansion of the urbanization process have encroached on the forest and grass land resources, resulting in the decrease of vegetation coverage. However, the influence scope of these negative interferences is limited, so it does not significantly affect the landscape pattern of vegetation cover.
The water and heat conditions in the TGR intervening basin are deemed to be superior, and the temperature and precipitation are the main driving factors of vegetation growth. The analysis of every grid cell shows that the correlation between NDVI and climate elements shows certain spatial differences in different land use types, but the pairwise correlation coefficients between the three passed the significance test (p < 0.001, t-test). According to the partial correlation analysis of monthly NDVI with temperature and precipitation, the partial correlation between NDVI and temperature is much greater than that between NDVI and precipitation. Taking precipitation as the control variable, the partial correlation coefficient between monthly NDVI and monthly average temperature is between 0.1722–0.8562, with an average of 0.6505. The partial correlation of the 100% grid exceeded the significance level of 0.01 and the 99.99% grid exceeded the significance level of 0.001, indicating that NDVI had a significant positive correlation with temperature.
Furthermore, the non-linear response of vegetation to the changing environment in the TGR intervening basin is studied. Obviously, the Three Gorges Project has not changed the driving effect of climate factors such as precipitation and temperature on vegetation growth in the study area. The NDVI value has a nonlinear relationship with temperature and precipitation and approaches the second-order nonlinear structure. Compared with NDVI on precipitation, the fitting effect of NDVI on temperature is better. However, before and after the impoundment of the TGR and during the experimental impoundment stage, the fitting curve rises with the time process, which may be caused by the rise of groundwater level caused by the impoundment of the TGR and the change of local microclimate or by the measures of ecological restoration projects, such as soil and water conservation, closing the mountains for afforestation, etc.; their respective contributions need further study.

Author Contributions

Y.X. conducted this experiment and wrote the paper; J.Z. designed this experiment; L.C. and B.J. discussed result; N.S. and M.T. analyzed the data; G.H. provided useful advice. All authors have read and agreed to the published version of the manuscript.

Funding

This research was funded by the National Natural Science Foundation Key Project of China (No. U1865202) and the Key Program of the Major Research Plan of the National Natural Science Foundation of China (No. 91547208).

Acknowledgments

The authors also greatly appreciate the anonymous reviewers and academic editor for their careful comments and valuable suggestions to improve the manuscript.

Conflicts of Interest

The authors declare no conflict of interest.

References

  1. Shen, G. Three Gorges Project: Chance and Challenge. Science (80-) 2004, 304, 681b. [Google Scholar] [CrossRef] [PubMed] [Green Version]
  2. Edmonds, R.L. The Sanxia (Three Gorges) Project: The environmental argument surrounding China’s super dam. Glob. Ecol. Biogeogr. Lett. 1992. [Google Scholar] [CrossRef]
  3. Zhou, Y.; Ma, J.; Zhang, Y.; Li, J.; Feng, L.; Zhang, Y.; Shi, K.; Brookes, J.D.; Jeppesen, E. Influence of the three Gorges Reservoir on the shrinkage of China’s two largest freshwater lakes. Glob. Planet. Chang. 2019, 177, 45–55. [Google Scholar] [CrossRef]
  4. Du, J.; Yin, K.; Lacasse, S. Displacement prediction in colluvial landslides, Three Gorges Reservoir, China. Landslides 2013, 10, 203–218. [Google Scholar] [CrossRef]
  5. Su, B.D.; Jiang, T.; Jin, W.B. Recent trends in observed temperature and precipitation extremes in the Yangtze River basin, China. Theor. Appl. Climatol. 2006, 83, 139–151. [Google Scholar] [CrossRef]
  6. Zhang, Q.; Xu, C.Y.; Zhang, Z.; Chen, Y.D.; Liu, C.L.; Lin, H. Spatial and temporal variability of precipitation maxima during 1960-2005 in the Yangtze River basin and possible association with large-scale circulation. J. Hydrol. 2008, 353, 215–227. [Google Scholar] [CrossRef]
  7. Wu, J.; Huang, J.; Han, X.; Gao, X.; He, F.; Jiang, M.; Jiang, Z.; Primack, R.B.; Shen, Z. The Three Gorges Dam: An ecological perspective. Front. Ecol. Environ. 2004, 2, 241–248. [Google Scholar] [CrossRef]
  8. Subklew, G.; Ulrich, J.; Fürst, L.; Höltkemeier, A. Environmental impacts of the Yangtze Three Gorges project: An overview of the Chinese-German research cooperation. J. Earth Sci. 2010, 21, 817–823. [Google Scholar] [CrossRef]
  9. Qin, H. Rural-to-Urban Labor Migration, Household Livelihoods, and the Rural Environment in Chongqing Municipality, Southwest China. Hum. Ecol. 2010, 38, 675–690. [Google Scholar] [CrossRef] [Green Version]
  10. Zhang, P.; Shao, G.; Zhao, G.; Le Master, D.C.; Parker, G.R.; Dunning, J.B.; Li, Q. China’s forest policy for the 21st century. Science (80-) 2000, 288, 2135–2136. [Google Scholar] [CrossRef] [Green Version]
  11. Liu, J.; Kuang, W.; Zhang, Z.; Xu, X.; Qin, Y.; Ning, J.; Zhou, W.; Zhang, S.; Li, R.; Yan, C.; et al. Spatiotemporal characteristics, patterns and causes of land use changes in China since the late 1980s. Dili Xuebao/Acta Geogr. Sin. 2014. [Google Scholar] [CrossRef]
  12. Zhang, X.; Zhang, L.; Zhao, J.; Rustomji, P.; Hairsine, P. Responses of streamflow to changes in climate and land use/cover in the Loess Plateau, China. Water Resour. Res. 2009. [Google Scholar] [CrossRef]
  13. Zhang, K.; Kimball, J.S.; Nemani, R.R.; Running, S.W.; Hong, Y.; Gourley, J.J.; Yu, Z. Vegetation Greening and Climate Change Promote Multidecadal Rises of Global Land Evapotranspiration. Sci. Rep. 2015. [Google Scholar] [CrossRef] [PubMed]
  14. Sterling, S.M.; Ducharne, A.; Polcher, J. The impact of global land-cover change on the terrestrial water cycle. Nat. Clim. Chang. 2013. [Google Scholar] [CrossRef]
  15. Xu, X.; Tan, Y.; Yang, G. Environmental impact assessments of the Three Gorges Project in China: Issues and interventions. Earth-Sci. Rev. 2013, 124, 115–125. [Google Scholar] [CrossRef] [Green Version]
  16. Baldi, G.; Nosetto, M.D.; Aragón, R.; Aversa, F.; Paruelo, J.M.; Jobbágy, E.G. Long-term satellite NDVI data sets: Evaluating their ability to detect ecosystem functional changes in South America. Sensors 2008, 8, 5397–5425. [Google Scholar] [CrossRef] [PubMed] [Green Version]
  17. de Jong, R.; de Bruin, S.; de Wit, A.; Schaepman, M.E.; Dent, D.L. Analysis of monotonic greening and browning trends from global NDVI time-series. Remote Sens. Environ. 2011, 115, 692–702. [Google Scholar] [CrossRef] [Green Version]
  18. Chen, B.; Xu, G.; Coops, N.C.; Ciais, P.; Innes, J.L.; Wang, G.; Myneni, R.B.; Wang, T.; Krzyzanowski, J.; Li, Q.; et al. Changes in vegetation photosynthetic activity trends across the Asia-Pacific region over the last three decades. Remote Sens. Environ. 2014, 144, 28–41. [Google Scholar] [CrossRef]
  19. Neigh, C.S.R.; Tucker, C.J.; Townshend, J.R.G. North American vegetation dynamics observed with multi-resolution satellite data. Remote Sens. Environ. 2008, 112, 1749–1772. [Google Scholar] [CrossRef] [Green Version]
  20. Piao, S.; Nan, H.; Huntingford, C.; Ciais, P.; Friedlingstein, P.; Sitch, S.; Peng, S.; Ahlström, A.; Canadell, J.G.; Cong, N.; et al. Evidence for a weakening relationship between interannual temperature variability and northern vegetation activity. Nat. Commun. 2014, 5, 1–7. [Google Scholar] [CrossRef] [Green Version]
  21. Prince, S.D. A model of regional primary production for use with coarse resolution satellite data. Int. J. Remote Sens. 1991, 12, 1313–1330. [Google Scholar] [CrossRef]
  22. Carlson, T.N.; Ripley, D.A. On the relation between NDVI, fractional vegetation cover, and leaf area index. Remote Sens. Environ. 1997, 62, 241–252. [Google Scholar] [CrossRef]
  23. Mueller, T.; Dressler, G.; Tucker, C.J.; Pinzon, J.E.; Leimgruber, P.; Dubayah, R.O.; Hurtt, G.C.; Böhning-Gaese, K.; Fagan, W.F. Human land-use practices lead to global long-term increases in photosynthetic capacity. Remote Sens. 2014, 6, 5717–5731. [Google Scholar] [CrossRef] [Green Version]
  24. Tan, Y.; Yao, F. Three Gorges Project: Effects of resettlement on the Environment in the reservoir area and countermeasures. Popul. Environ. 2006, 27, 351–371. [Google Scholar] [CrossRef]
  25. Zhang, J.; Zhengjun, L.; Xiaoxia, S. Changing landscape in the Three Gorges Reservoir Area of Yangtze River from 1977 to 2005: Land use/land cover, vegetation cover changes estimated using multi-source satellite data. Int. J. Appl. Earth Obs. Geoinf. 2009, 11, 403–412. [Google Scholar] [CrossRef]
  26. Su, X.; Zeng, B.; Huang, W.; Xu, S.; Lei, S. Effects of the Three Gorges Dam on preupland and preriparian drawdown zones vegetation in the upper watershed of the Yangtze River, P.R. China. Ecol. Eng. 2012, 44, 123–127. [Google Scholar] [CrossRef]
  27. Han, G.; Yang, Y.; Yan, S. Vegetation activity trend and its relationship with climate change in the three gorges area, China. Adv. Meteorol. 2013, 2013. [Google Scholar] [CrossRef]
  28. Xu, X.L. China Monthly Vegetation Index (NDVI) spatial distribution data set. In Data Registration and Publishing System of the Resource and Environmental Data Cloud Platform Centre of the Chinese Academy of Sciences; Resource and Environmental Data Cloud Platform Centre of the Chinese Academy of Sciences: Beijing, China, 2020. (In Chinese) [Google Scholar]
  29. Stow, D.; Daeschner, S.; Hope, A.; Douglas, D.; Petersen, A.; Myneni, R.; Zhou, L.; Oechel, W. Variability of the seasonally integrated normalized difference vegetation index across the north slope of Alaska in the 1990s. Int. J. Remote Sens. 2003. [Google Scholar] [CrossRef]
  30. Jiang, X.B.; Ze-Zhong, M.A.; Zeng, W.R.; Zhou, W.C.; Zhou, A.X.; Ai-Nong, L.I.; Sun, Y.Q. Land-Use/Cover Change Process and Driving Force Analysis in Three Gorges Area. J. Soil Water Conserv. 2004, 18, 108–112. [Google Scholar]
  31. Wang, Q.; Yuan, X.; Willison, J.H.M.; Zhang, Y.; Liu, H. Diversity and Above-Ground Biomass Patterns of Vascular Flora Induced by Flooding in the Drawdown Area of China’s Three Gorges Reservoir. PLoS ONE 2014, 9, e100889. [Google Scholar] [CrossRef] [Green Version]
  32. Wang, T.; Kazak, J.; Han, Q.; de Vries, B. A framework for path-dependent industrial land transition analysis using vector data. Eur. Plan. Stud. 2019, 27, 1391–1412. [Google Scholar] [CrossRef]
  33. Liu, Y.S.; Fang, C.L. A study on regional forced land use convertion and optimal allocation—Taking the Three Gorges Reservoir Area as an example. J. Nat. Resour. 2001, 16, 334–340. [Google Scholar]
  34. Wang, G.; Zhang, X.; Liu, Y.; Xia, D. Annual and seasonal variation characteristics of NDVI and its relationship with meteorological factors in Jialing River Basin. J. Hohai Univ. 2013, 41, 21–25. [Google Scholar]
  35. Wen, Z.; Wu, S.; Chen, J.; Lü, M. NDVI indicated long-term interannual changes in vegetation activities and their responses to climatic and anthropogenic factors in the Three Gorges Reservoir Region, China. Sci. Total Environ. 2017, 574, 947–959. [Google Scholar] [CrossRef] [PubMed]
  36. Yang, G.S.; Zhu, C.Q.; Jiang, Z.G. Yangtze Conservation and Development Report 2009; Yangtze River Press: Wuhan, China, 2009; p. 168. [Google Scholar] [CrossRef] [Green Version]
  37. Ma, J.; Ma, P.; Li, C.; Zhang, W. Changes in Landscape Patterns of Vegetation Coverage in Chongqing Section of the Three Gorges Reservoir Region from 2000 to 2011. J. Southwest Univ. (Nat. Sci. Ed.) 2014, 36, 141–147. [Google Scholar] [CrossRef]
  38. Xiao, C.; Yu, R.; Fu, Y. Precipitation characteristics in the Three Gorges Dam vicinity. Int. J. Climatol. 2010, 30, 2021–2024. [Google Scholar] [CrossRef]
  39. Miller, N.L.; Jin, J.; Tsang, C.F. Local climate sensitivity of the Three Gorges Dam. Geophys. Res. Lett. 2005, 32, 1–4. [Google Scholar] [CrossRef] [Green Version]
  40. Nemani, R.R.; Keeling, C.D.; Hashimoto, H.; Jolly, W.M.; Piper, S.C.; Tucker, C.J.; Myneni, R.B.; Running, S.W. Climate-driven increases in global terrestrial net primary production from 1982 to 1999. Science 2003, 300, 1560–1563. [Google Scholar] [CrossRef] [Green Version]
  41. Zhang, M.; Dong, Y.; Sun, P. Impact of reservoir impoundment-caused groundwater level changes on regional slope stability: A case study in the Loess Plateau of Western China. Environ. Earth Sci. 2012, 66, 1715–1725. [Google Scholar] [CrossRef]
  42. Seeboonruang, U. Impacts of Reservoir on Groundwater Level and Quality in a Saline Area, Nakhon Panom Province, Thailand. APCBEE Procedia 2012, 4, 16–21. [Google Scholar] [CrossRef] [Green Version]
Figure 1. The Three Gorges Reservoir (TGR) intervening basin and its surrounding geographical environment.
Water 12 02036 g001
Figure 2. Land use classification map of the study area in 1995, 2005 and 2015.
Water 12 02036 g002
Figure 3. Spatial transfer map of main land use types in the study area from 1995 to 2015.
Water 12 02036 g003
Figure 4. Variations of temperature, precipitation and normalized difference vegetation index (NDVI) in the study area: (a) monthly variation of NDVI from 1999 to 2017; (b) area average annual NDVI and linear trend; (c) area average annual temperature; (d) annual precipitation.
Water 12 02036 g004
Figure 5. Spatial distribution and interannual change slope of NDVI in the TGR intervening basin: (a) distribution of annual average NDVI; (b) NDVI interannual change slope classification.
Water 12 02036 g005
Figure 6. Spatial distribution of partial correlation coefficient: (a) partial correlation between NDVI and temperature, with precipitation as a control variable; (b) partial correlation between NDVI and precipitation, with temperature as a control variable.
Water 12 02036 g006
Figure 7. The scatter plot of NDVI–temperature and NDVI–precipitation in the TGR intervening basin: (a) nonlinear relationship between NDVI and temperature; (b) nonlinear relationship between NDVI and precipitation.
Water 12 02036 g007
Figure 8. The scatter plot of NDVI–temperature and NDVI–precipitation in three periods: (a) nonlinear relationship between NDVI and temperature; (b) nonlinear relationship between NDVI and precipitation.
Water 12 02036 g008
Table 1. Land use transition matrix.
T2Pi+Reduction
A1A2An
T1A1p11p12p1np1+p1+–p11
A2p21p22p2np2+p2+–p22
Anpn1pn2pnnpn+pn+–pnn
P+jp+1p+2p+n
Increasep+1–p11p+2–p22 p+n–pnn
Table 2. Land use type statistics (unit: km2).
YearsPaddy FieldDry LandForestGrassWater BodyResident LandBare Land
1995698115,87927,08573966351706
2000695115,85126,96975026412326
2005690215,70827,17273807212654
2010683415,46027,20873818034624
2015668115,33627,15973638397704
2018683715,60427,76960819768841
Table 3. Land use transition matrix in the study area from 1995 to 2005 (unit: km2).
2005
Paddy FieldDry LandForestGrassWater BodyResident LandBare Land
1995Paddy Field68993272842-
Dry Land215,607178411338-
Forest Land-4826,8411325113-
Grass150125720587-
Water Body--1-6331-
Resident----6164-
Bare Land----2-4
Table 4. Land use transition matrix in the study area from 2005 to 2015 (unit: km2).
2015
Paddy FieldDry LandForestGrassWater BodyResident LandBare Land
2005Paddy Field6681-1125194-
Dry Land-15,331445538240-
Forest Land-227,066242852-
Grass-34872822126-
Water Body---17173-
Resident----10255-
Bare Land------4
Table 5. Correlation coefficients.
Correlation coefficientsMaxMinMeanp < 0.05p < 0.01p < 0.001
rNDVI,Temperature0.94440.36350.8289100%100%100%
rNDVI,Precipitation0.79470.27820.6854100%100%100%
rTemperature,Precipitation0.81780.58620.7905100%100%100%
rNDVI,Temperature(Precipitation)0.85620.17220.6505100%100%99.99%
rNDVI,Precipitation(Temperature)0.3161−0.16080.092228.01%12.04%2.74%

