Article

Reduction of Nutrient Leaching Potential in Coarse-Textured Soil by Using Biochar

1
Department of Civil Engineering, National Pingtung University of Science and Technology, Pingtung 91201, Taiwan
2
Center for Sustainability Science, Academia Sinica, Taibei 11529, Taiwan
3
Department of Soil and Water Conservation, National Pingtung University of Science and Technology, Pingtung 91201, Taiwan
*
Author to whom correspondence should be addressed.
Water 2020, 12(7), 2012; https://doi.org/10.3390/w12072012
Submission received: 4 June 2020 / Revised: 12 July 2020 / Accepted: 13 July 2020 / Published: 15 July 2020

Abstract

:
Background: Loss of nutrients and organic carbon (OC) through leaching or erosion may degrade soil and water quality, which in turn could lead to food insecurity. Adding biochar to soil can effectively improve soil stability, therefore, evaluating the effects of biochar on OC and nutrient retention and leaching is critical. Methods: We conducted a 42-day column leaching experiment by using sandy loam soil samples mixed with 2% of biochar pyrolyzed from Honduran mahogany (Swietenia macrophylla) wood sawdust at 300 °C (WB300) and 600 °C (WB600) and a control sample. Leaching was achieved by flushing the soil column on day 4 and every week during the 42-day experiment and adding a water volume for each flushing equivalent to the field water capacity. Results: Biochar application increased the final soil pH and OC, NH4+-N, NO3-N, available P concentrations but not exchangeable K concentrations. In particular, WB600 exhibited superior performance in alleviating soil acidification; WB300 engendered high NO3-N concentrations. Biochar application effectively retained water in soil and inhibited the leaching of the aforementioned nutrients and dissolved OC. WB300 reduced NH4+-N and K leaching by 30%, and WB600 reduced P leaching by 68%. Conclusions: Biochar application can improve nutrient retention and reduce the leaching potential of soils and connected water bodies.

1. Introduction

Nutrients (nitrogen, phosphorus, and potassium) and soil organic carbon (SOC) are critical components of a healthy soil, which is the foundation of a strong food system [1]. Tropical ecosystems are particularly susceptible to the loss of nutrients through soil erosion or leaching processes [2]. Intense rainfall in tropical or subtropical areas results in the leaching of fertilizer containing N, P, and K from soil bodies. Nutrient leaching could diminish soil fertility, accelerate soil acidification, increase fertilizer costs for farmers, and reduce crop yields [3]. The deposition of leached nutrients into water bodies adversely affects aquatic environments because of potential risks such as eutrophication. Leaching of N and P and agricultural runoffs are among the leading contributors to non-point source (NPS) pollution, which has a detrimental effect on drinking and ground water, aquatic habitats, and other water resources. Agricultural runoffs often contain several contaminants, including nutrients, pesticides, pathogens, sediment, salts, trace metals, and other substances, which contribute to biological oxygen demand [4]. Moreover, SOC, comprising nutrient and soil biota, leaches out over time [5], which could aggravate nutrient losses and water pollution. An enormous quantity of fertilizers must be applied to counter the dwindling fertility of agricultural soil.
Biochar is a solid bioresource obtained through the pyrolysis of organic waste. Residues from agricultural and forestry production processes are suitable raw materials for the production of high-quality biochar [6,7]. Biochar is a porous substance containing high levels of carbon and various functional groups. Accordingly, the addition of biochar to agricultural soil has emerged as a feasible strategy to enhance soil water retention capacity [8,9,10], soil quality [11,12,13,14], soil organic matter stability and nutrient retention [15,16], organic carbon (OC) sequestration [17], and greenhouse gases emission reduction [18,19,20,21]. Furthermore, biochar can affect soil microbial properties, including microbial activity [22] and microbial diversity [23]. However, the interactions between biochar and microbial properties in soil are not fully understood [24]. The application of biochar to soil could increase soil fertility and crop productivity by reducing leaching or even supplying nutrients [25,26,27]. However, the effects of biochar on nutrient leaching and OC retention has been reported to vary with the applied biochar pyrolysis temperature, raw material, and soil type [28,29]. Biochar produced from secondary forest residues could reduce fertilizer leaching and increase plant growth and nutrition [26]. Furthermore, the addition of biochar produced from hardwood to a typical Midwestern agricultural soil in the United States considerably reduced the leaching of total N and P by 11% and 69%, respectively [3]. Yao et al. [29] reported that the effect of biochar on nutrient retention and release varied with the nutrient and biochar type.
In this study, we conducted a 42-day column leaching experiment by using loamy sand soil samples that were obtained from a tropical/subtropical area and treated with two types of wood dust biochar pyrolyzed at 300 and 600 °C. The objective of this study was to determine the effects of biochar application on water, nutrient, and OC retention and leaching from the observed soil. The results are expected to be valuable for assessing the potential of biochar for the retention and immobilization of nutrients in soils and inhibition of water body contamination.

2. Materials and Methods

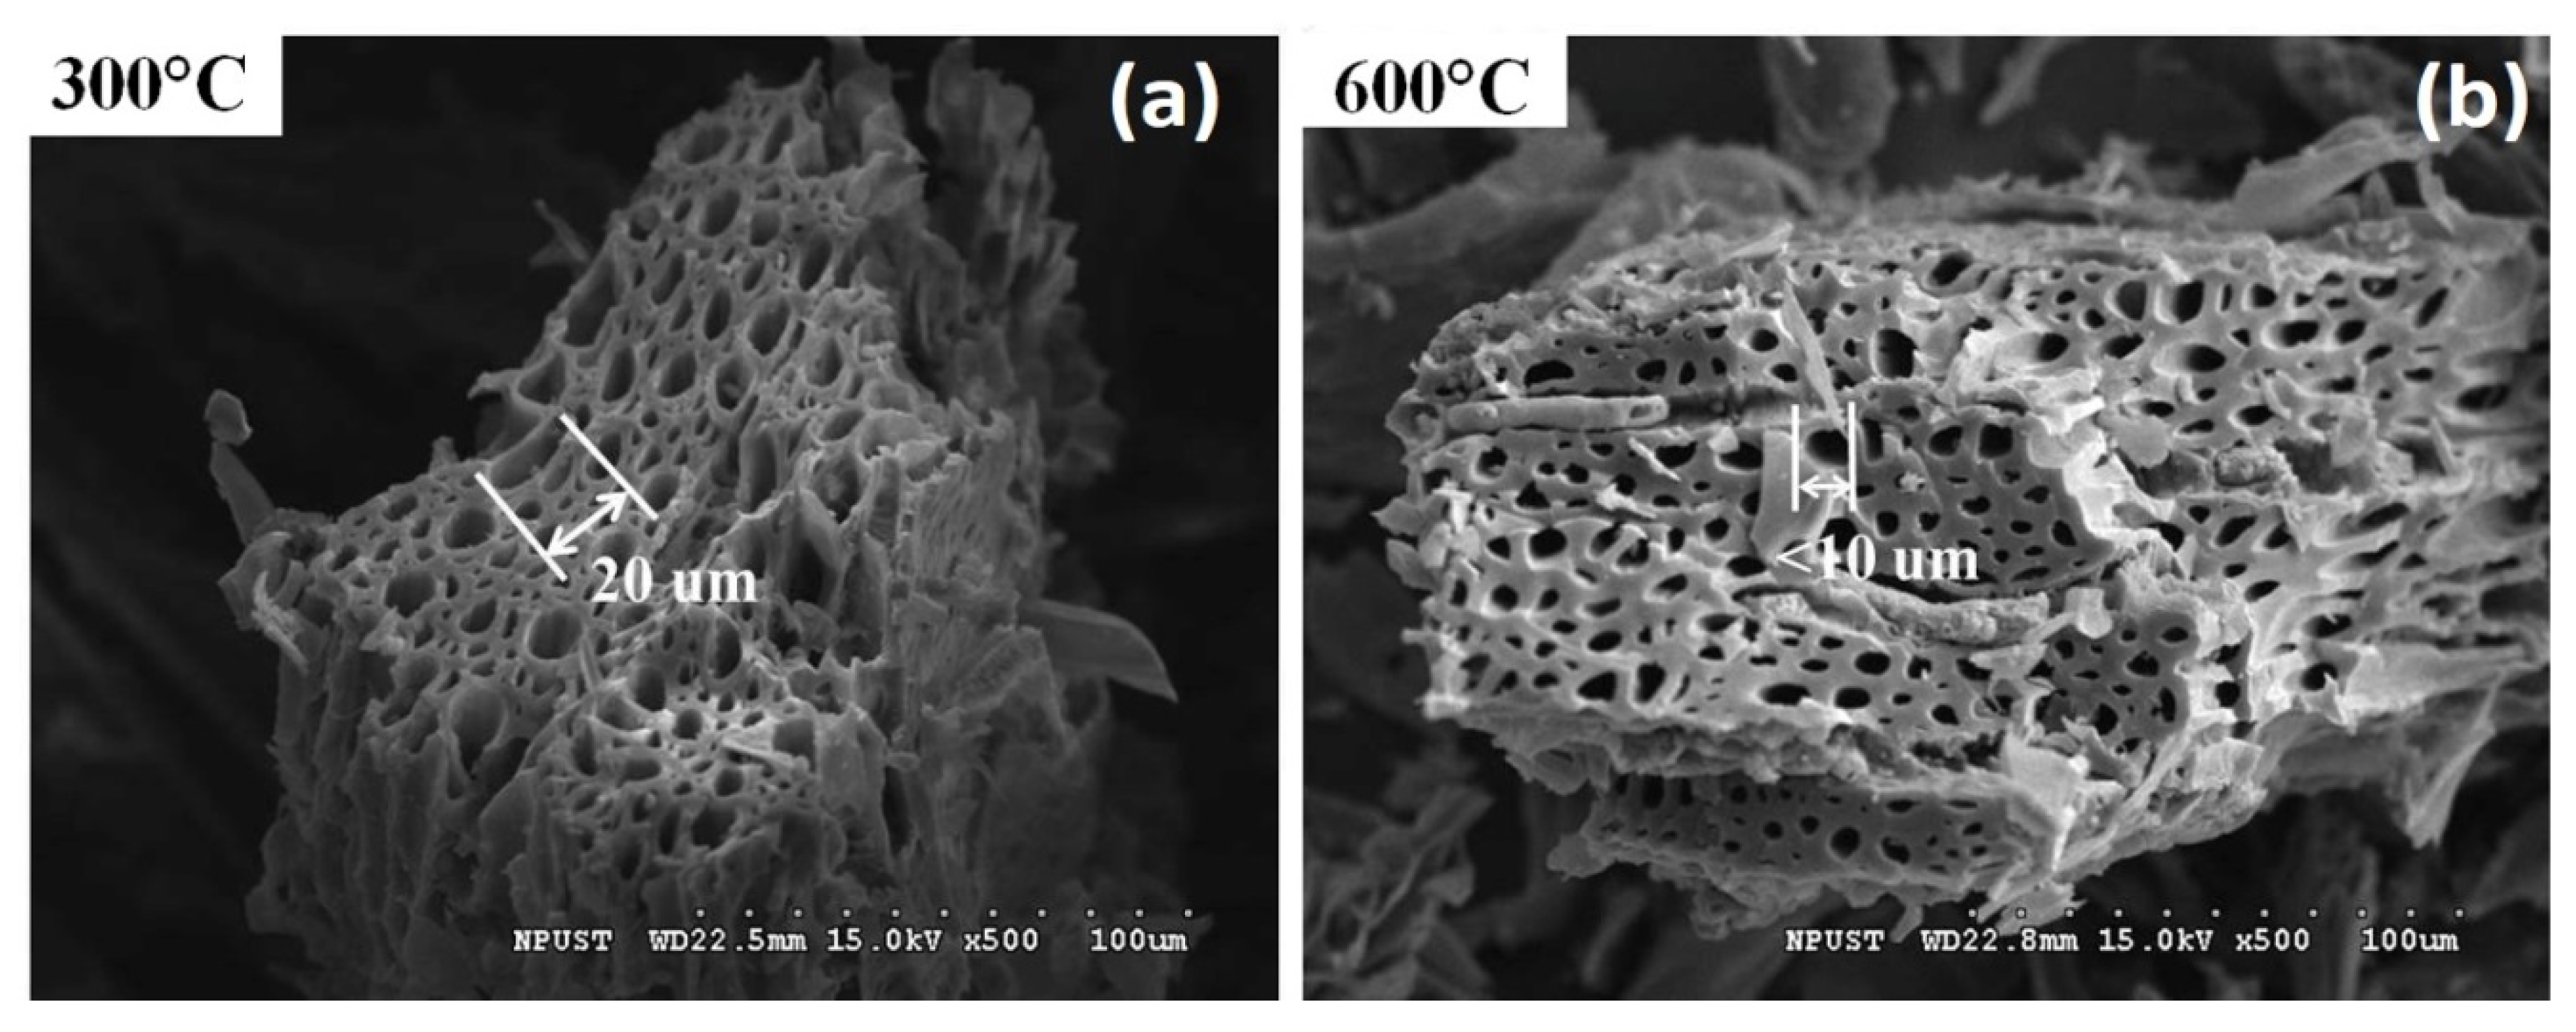
2.1. Collection of Soil Samples and Preparation of Biochars

Surface soil samples (0–15 cm) were collected from a field in Pingtung, Southern Taiwan (22°31′57.9″ N 120°33′38.1″ E). As of April 2016, pineapple (Ananas comosus (L.) Merr.) was the dominant crop on this land. The soil samples were air-dried, sieved through a 2-mm screen, and stored at room temperature. The biochar used in this study comprised Honduran mahogany (Swietenia macrophylla) wood sawdust obtained from the Department of Wood Design, National Pingtung University of Science and Technology. Two biochar materials were used in this study, namely WB300 and WB600, that were produced at pyrolysis temperatures of 300 and 600 °C, respectively. The biochar used in this study was supplied by the Industrial Technology Research Institute (ITRI) of Taiwan. Before being charred, the wood sawdust was dried at 60 °C for 24 h to < 10% moisture and cut to a particle size of 2 cm. For pyrolysis, the samples were placed in a tubular furnace (ITRI, Tainan, Taiwan) equipped with a corundum tube (diameter, 32 mm; length, 700 mm) and a N2 purging mechanism (flow rate, 1 L/min) to ensure an oxygen-free atmosphere. Heat treatments were performed at temperatures of 300 and 600 °C, with the heating rate being 5 °C min−1. The temperature was maintained for 2 h before cooling to an ambient temperature under an N2 flow. After the pyrolysis, the biochar materials were ground to pass through a 2-mm sieve, followed by homogenization through stirring.

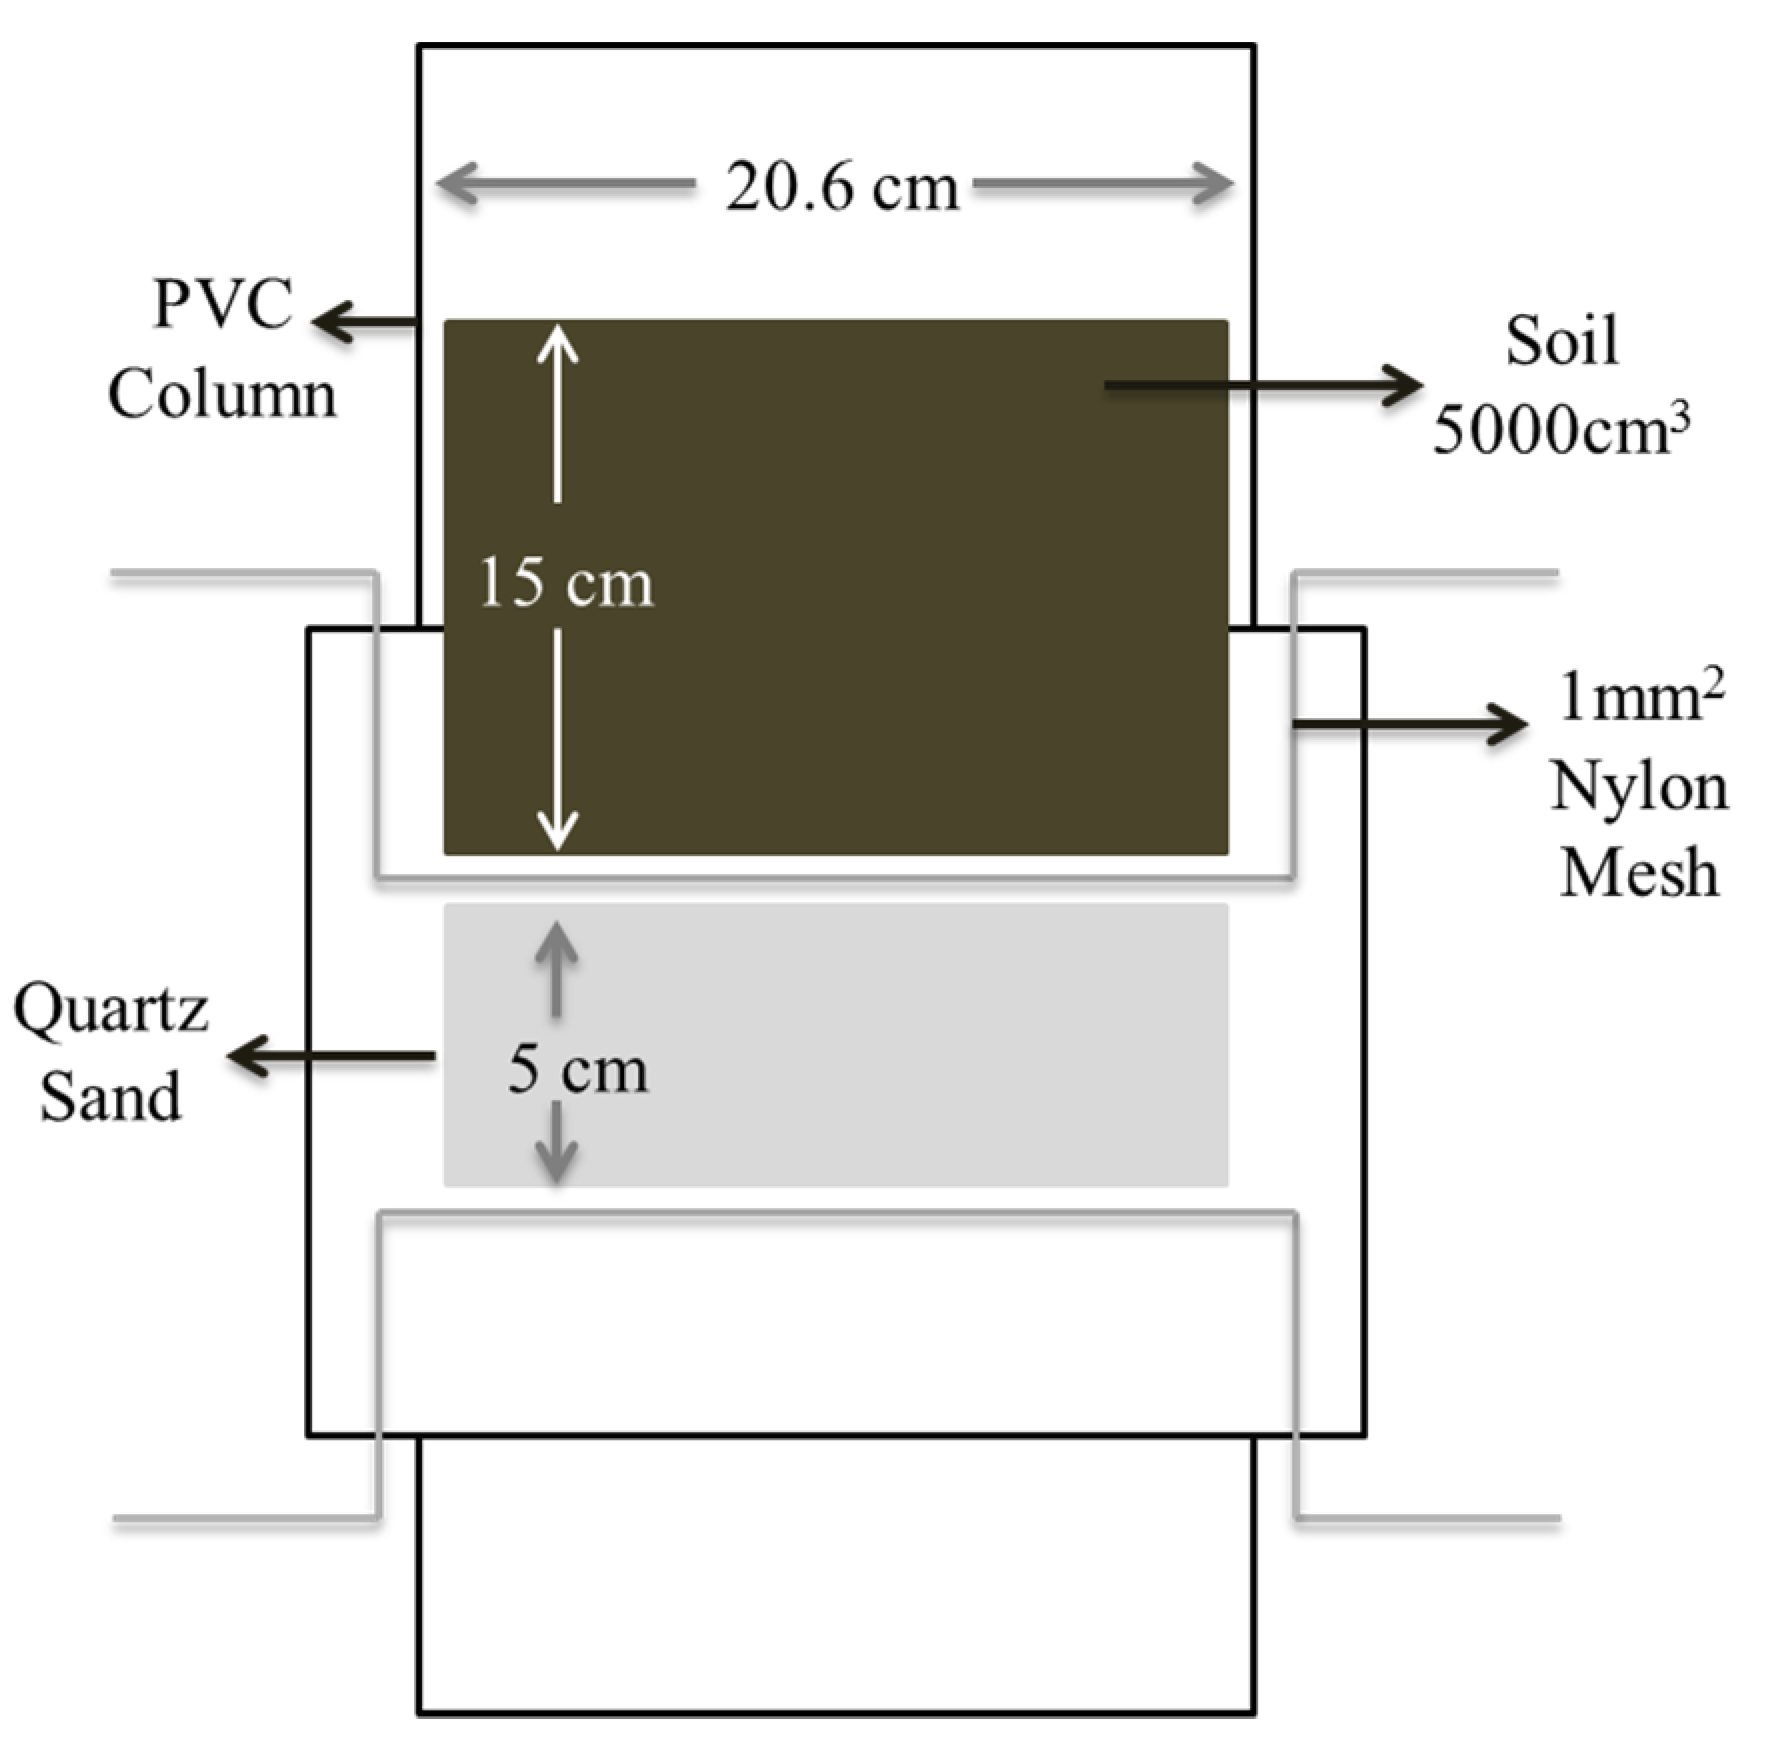
2.2. Preparations of Leaching Column

Similar to the procedures applied by Lo [30], the biochar materials were thoroughly mixed with the collected sandy loam soil at application rates of 0% (Control, 0 tons ha−1) and 2% (40 tons ha−1) w/w for Bok choy (Brassica rapa chinensis) cultivation in Taiwan. Briefly, nutrient solutions of ammonium sulfate ((NH4)2SO4), calcium dihydrogen phosphate (Ca(H2PO4)2), and potassium chloride (KCl) were added to the soil at application rates of 2076, 227, and 191 kg ha−1, respectively (approximately 220, 30, and 100 kg ha−1 for N, P, and K, respectively). The fertilizers were dissolved in deionized (DI) water and then mixed thoroughly with the soil samples. The volume of the nutrient solution applied was 60% of the water retention capacity of the treated soil samples. The treatment samples are outlined as follows: (1) control, comprising soil only (CK); (2) WB300, comprising soil to which 2% of the biochar pyrolyzed at 300 °C was added; and (3) WB600, comprising the soil to which 2% of the biochar pyrolyzed at 600 °C was added. A leaching experiment was conducted for each treatment in three replicates. As illustrated in Figure 1, a soil column with an internal diameter of 20.6 cm was constructed. The column was composed of two polyvinyl chloride (PVC) tubings of equal length, which were connected through a PVC fitting with a 5-cm interval. A nylon mesh (1 mm2) with filter paper (Whatman grade no. 42) above was placed between the joints to separate the soil in the upper part from the quartz sand (~2 mm in diameter) filled in the center PVC fitting. At a soil depth of 15 cm, the volume of the soil column was approximately 5000 cm3. All the columns were packed with the tested soil samples to obtain an initial bulk density of 1.2 g cm−3.

2.3. Soil Column Incubation and Leaching

The soil columns were subjected to a 42-day incubation process conducted at room temperature (25–28 °C) and humidity (60%–80%) with repeated leaching in order to investigate the effects of biochar application on (1) the physicochemical properties of, (2) the hydraulic properties of, and (3) nutrient retention and leaching from the soils. Short-term duration of incubation period was chosen based on Yoo et al. (2013) [31], where the leaching experiment was finished within 60 days. Likewise, based on our previous studies, the variation of chemical and physical properties [13] and dynamic changes of N and P [7] after biochar addition might occur and finish within 8 weeks, therefore, a short-term experiment period (42 days) was selected in this study. Table 1 lists the analysed items.
According to the soil porosity and volume determined for the studied soil column, we used a leaching volume of 700 mL for each flushing process. A fine sieve was placed above the columns to minimize water disturbance to the soil surfaces during flushing. Throughout the experimental period, all columns were leached seven times (on days 4, 7, 14, 21, 28, 35, and 42) using DI water. The leachates were collected using 1000-mL measuring cylinders, and the volumes of the leachates were recorded. Leachates were then subjected to chemical analyses. After the final leaching event, the soil of each column was collected, air-dried, and ground to pass through a 2-mm sieve before further chemical analysis.

2.4. Analytical Methods

The bulk density (DB) was determined using the core method [32]. The pH values of the soil samples and biochar materials mixed with DI water (1:2.5 and 1:20 w/v, respectively) were determined using a Horiba F-74 BW meter [33]. We performed electrical conductivity measurements on saturated paste extracts of the soil samples by using a Horiba F-74 BW meter [34]. The soil particle size distribution was determined using the pipette method [35]. Cation exchange capacity (CEC) was determined using the ammonium acetate method (pH 7.0) [36]. Exchangeable K was extracted using 1 mol L−1 NH4OAc (1:10 w/v for the soil samples; 1:20 w/v for the biochar materials), and the extract was analyzed through atomic absorption spectrometry (Z-2300, Hitachi, Tokyo, Japan). The OC concentration was determined through wet oxidation [37]. Available P was determined using the Bray P-1 extract test [38]. Inorganic N was extracted using 2 M KCl (1:10 w/v), and the concentrations of NH4+-N and NO3-N were determined though steam distillation conducted using MgO and Devarda’s alloy [39]. The microscale structure of the biochar materials was characterized through optical microscopy using reflected light, followed by scanning electron microscopy (SEM; Hitachi, S-3000N, Japan). A backscattered electron image representing the mean atomic abundance in a black-and-white image was observed on the surface of the samples coated with Au. The C components of biochar horizons were examined through solid-state CPMAS 13C nuclear magnetic resonance (DSX 400-MHz solid-state NMR, Bruker, Karlsruhe, Germany). Data acquisition was executed under the following conditions: spectrometer frequency, 100.46 MHz; spinning speed, 7000 Hz; contact time, 1 ms; and pulse delay time, 1 s. We determined the total signal intensity and the proportion contributed by each C functional group by integrating the spectra in the chemical-shift region: 0–50 ppm (aliphatic C), 50–110 ppm (O-alkyl-C), 110–165 ppm (aromatic C), and 165–190 ppm (carboxyl C). Methoxyl C contributed a wide shoulder between 50 and 60 ppm within the O-alkyl-C range (Alpha-T, Bruker).

2.5. Statistical Analysis

Data were analyzed using IBM SPSS Statistics 22 for Windows (IBM Corp., Armonk, NY, USA). Data sets were subjected to mean separation analysis using one-way analysis of variance, with significance being set to a p value of 0.05. The differences between mean values under different treatments were identified using Duncan’s test.

3. Results

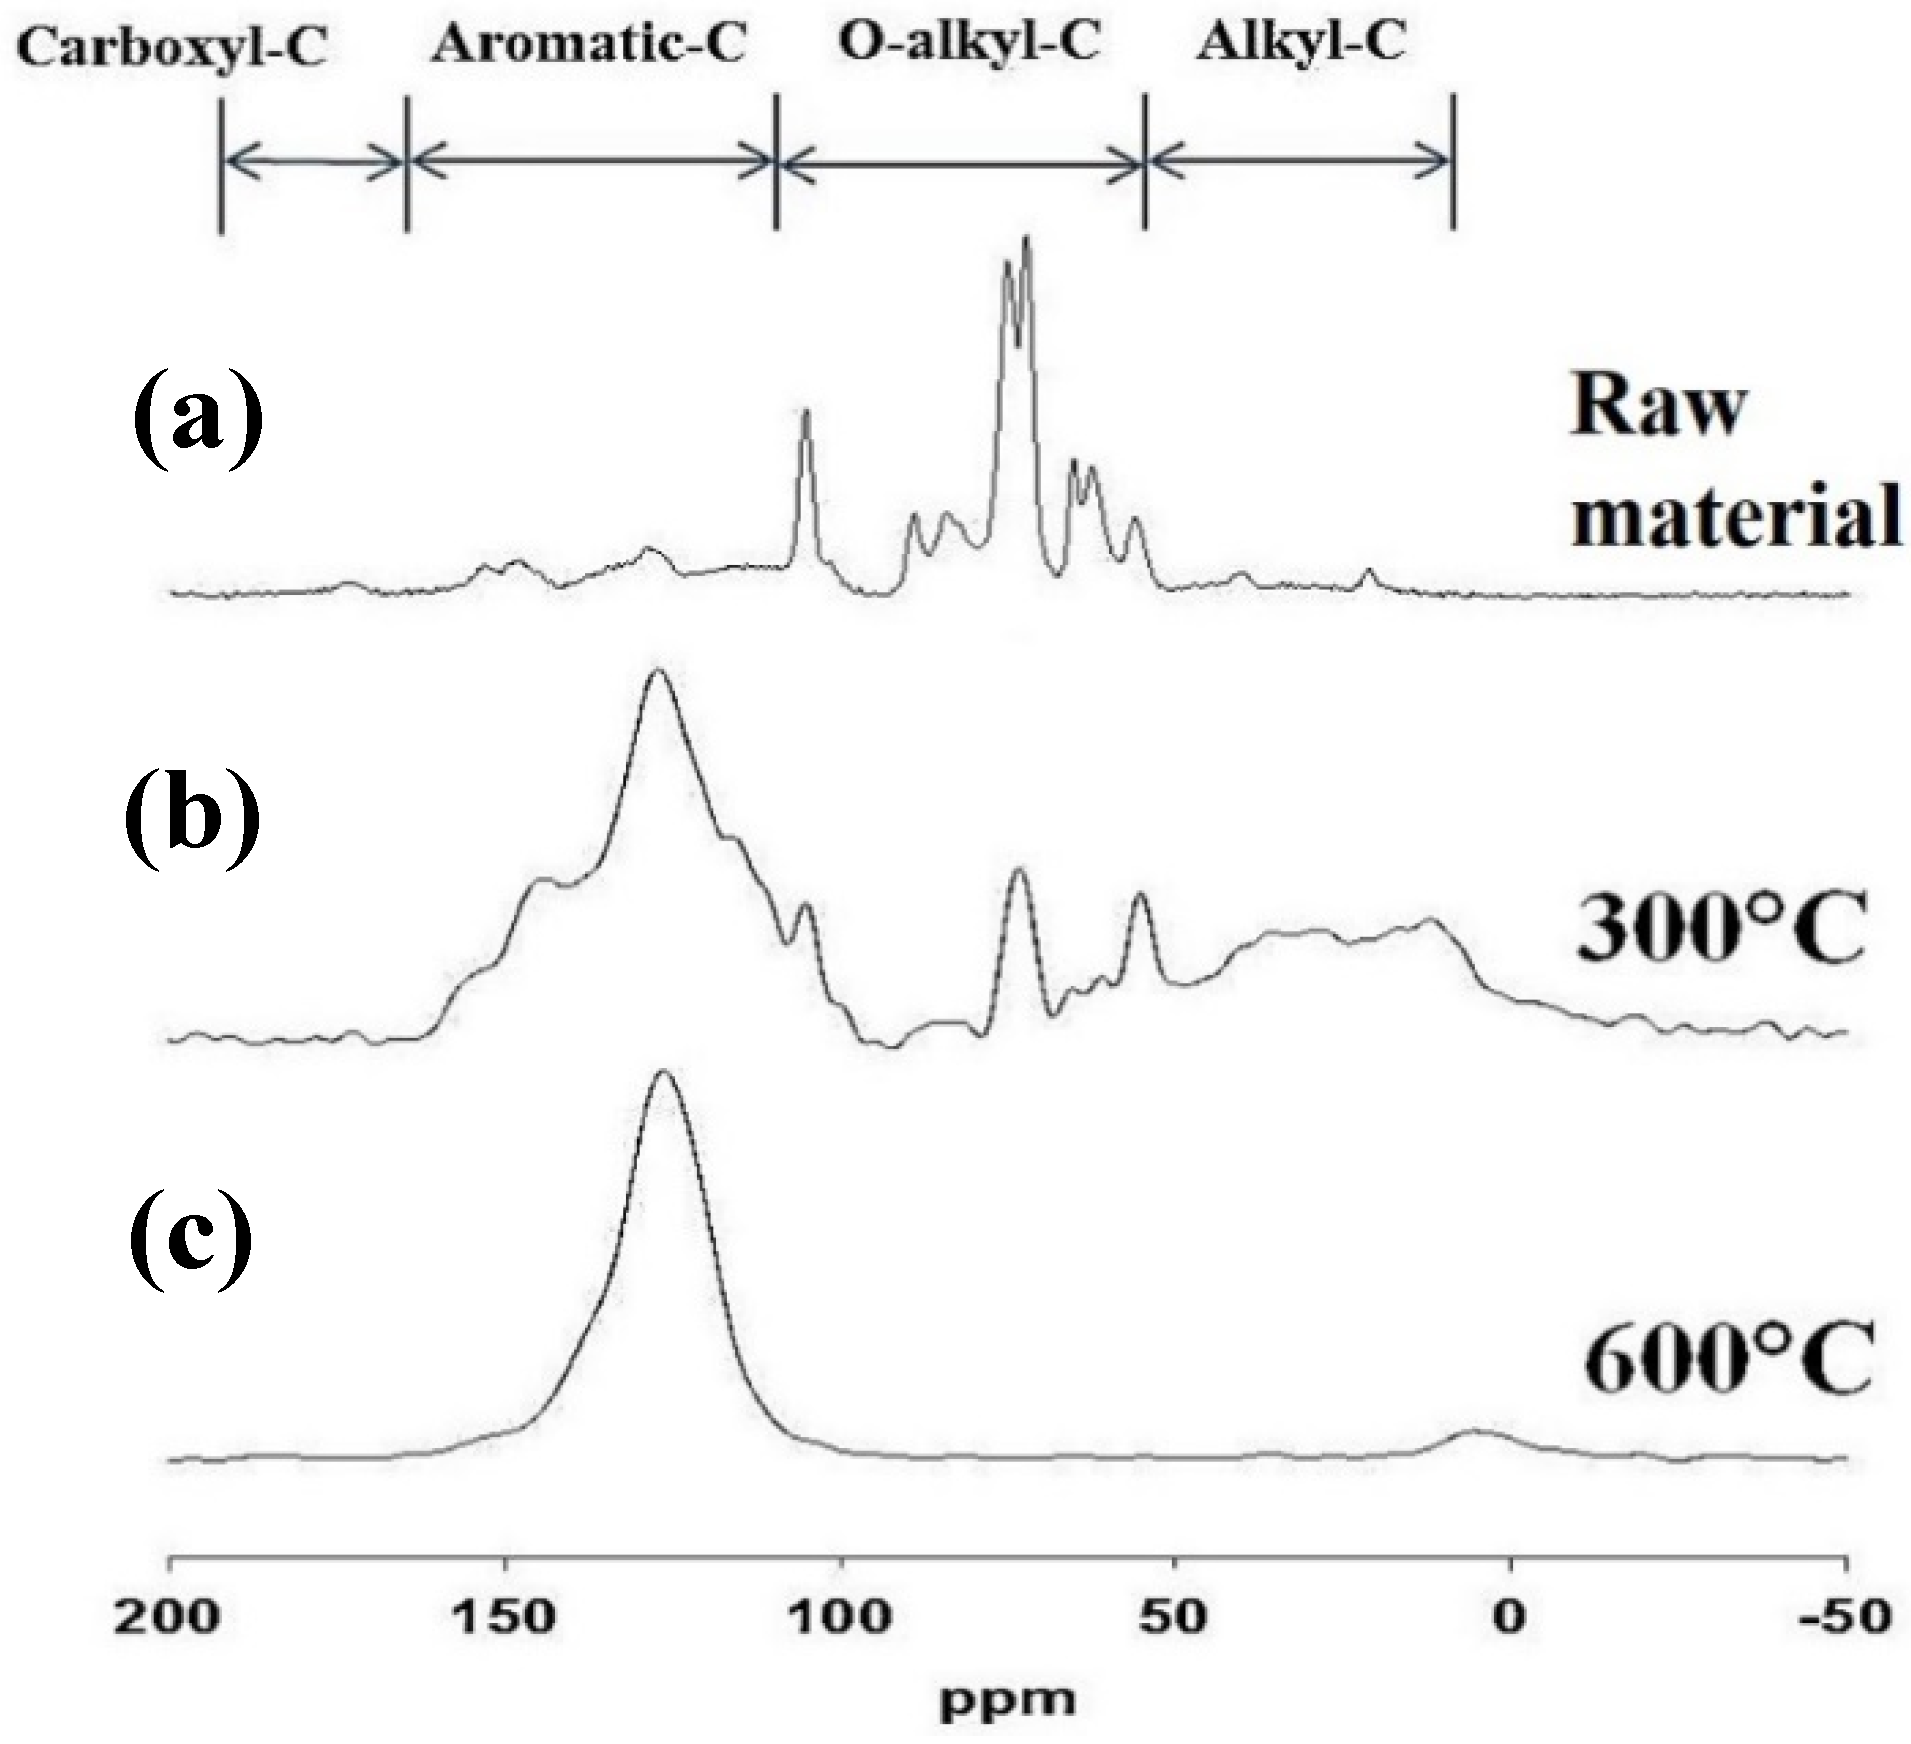
3.1. Properties of the Soil and Biochar Materials

Table 2 lists the properties of the soil samples and biochar materials. The texture of the studied soil was sandy loam; the soil was determined to have a neutral pH and low OC content. The porosity, bulk density, and particle density were in the normal ranges for the coarse-textured soil samples. The soil used in this study was sourced from an intensively cultivated field with high human input, which may result in high nutrient concentrations. The pH values of WB300 and WB600 (Honduran mahogany wood sawdust pyrolyzed at 300 and 600 °C) were 6.5 (neutral) and 10.4 (alkaline), respectively. The OC content in WB300 was 6.8%, which was higher than that in WB600 (2.0%). By contrast, the total carbon content was 69% in WB300, which was lower than that in WB600 (79.5%). These results indicate that WB600 contained a higher level of inorganic carbon than W300 did. The higher pyrolysis temperature reduced the concentrations of oxygen, nitrogen, ammonium–nitrogen, nitrate–nitrogen, available phosphorus, and exchangeable potassium in the biochar materials. Figure 2 depicts SEM images of both biochar materials. WB300 exhibited coarser pores than WB600 did but had a lower number of pores for the same volume. Because of its more porous structure—signifying a larger surface area—WB600 could have distinct effects on the physicochemical properties of soil and groundwater when compared with WB300.
Figure 3 illustrates the functional groups of C within the structures of the WB300 and WB600. O-alkyl-C is the major C group in the natural composition of Honduran mahogany. By pyrolyzing at 300 °C, the WB300 consisted of more aromatic-C, less O-alkyl-C, more alkyl-C, and more carboxylic-C than the raw wood dust. At 600 °C, the pyrolysis process resulted in the predominating aromatic-C in the WB600, and the other C groups became less observable. The results of the physical and chemical properties of the biochars as affected by pyrolysis temperature are consistent with previous studies [7,13,40,41].

3.2. Soil Physicochemical Properties

Table 3 shows the major soil properties under different treatments before and after the 42-days experiment. The pH value of the untreated soil (before mixing with fertilizer) was 6.8, as shown in Table 2. After fertilization, the pH value under control dropped to 6.1. The pH of soil treated with WB300 was ~6.2, whereas WB600 had the highest pH value of 6.5. At day 42, the soil pH values of both biochar treatments were significantly higher than that of the control (pH 4.6), as shown in Table 3. The WB600 treated soil still revealed the highest pH value (5.8) at day 42 among all treatments. Although the soil under WB300 treatment had the similar pH value (6.2) with the control on day 0, it revealed a higher pH than the control at day 42.
The DB values observed on day 42 for all the treated samples were lower than the initial DB of 1.20 g cm−3 (achieved when the soil columns were packed). The control exhibited the highest DB (1.11 g cm−3); the WB600-treated sample had the lowest value (1.05 g cm−3). However, the differences in DB between the treated samples were not significant (p = 0.05) (Table 3). Because biochar typically contains low levels of OC, the SOC levels observed for all treatments were low (0.21%–0.46%). The WB300-treated sample had the highest SOC content levels on both day 0 and day 42 (0.46% and 0.39%, respectively), indicating an SOC content loss of only 0.7% throughout the experiment (Table 3). The SOC levels observed for the WB600-treated sample did not differ significantly from that observed for the control (Table 3).
The NH4+-N concentration did not differ significantly between any of the treated samples on day 0 (Table 3). On day 42, the NH4+-N concentration in all treated samples decreased drastically from approximately 205 mg kg−1 to less than 6.5% of the initial concentrations. On day 42, the control had the lowest concentration (5.87 mg kg−1), and the WB300- and WB600-treated samples had significantly higher concentrations (12.7 mg kg−1). The NO3-N and inorganic N concentrations in the treated samples exhibited similar trends to the NH4+-N concentrations. On day 42, all treated samples exhibited considerably lower NO3-N concentrations when compared with the initial concentrations; the NO3-N concentrations were high in the samples treated with the two biochar materials, particularly the WB300-treated sample.
On day 0, the Ava. P concentrations did not differ significantly between the three treated soil samples (19.6–19.8 mg kg−1). On day 42, the Ava. P concentration decreased to 4.08, 5.1, and 5.36 mg kg−1 in the control, WB300-treated, and WB600-treated samples, respectively. On day 0, the Ex. K concentrations in the control, WB300-treated, and WB600-treated samples were 302, 315, and 351 mg kg−1, respectively. After the experiment, the Ex. K concentrations increased to 457–488 mg kg−1 in all treated samples and did not differ significantly between the samples.

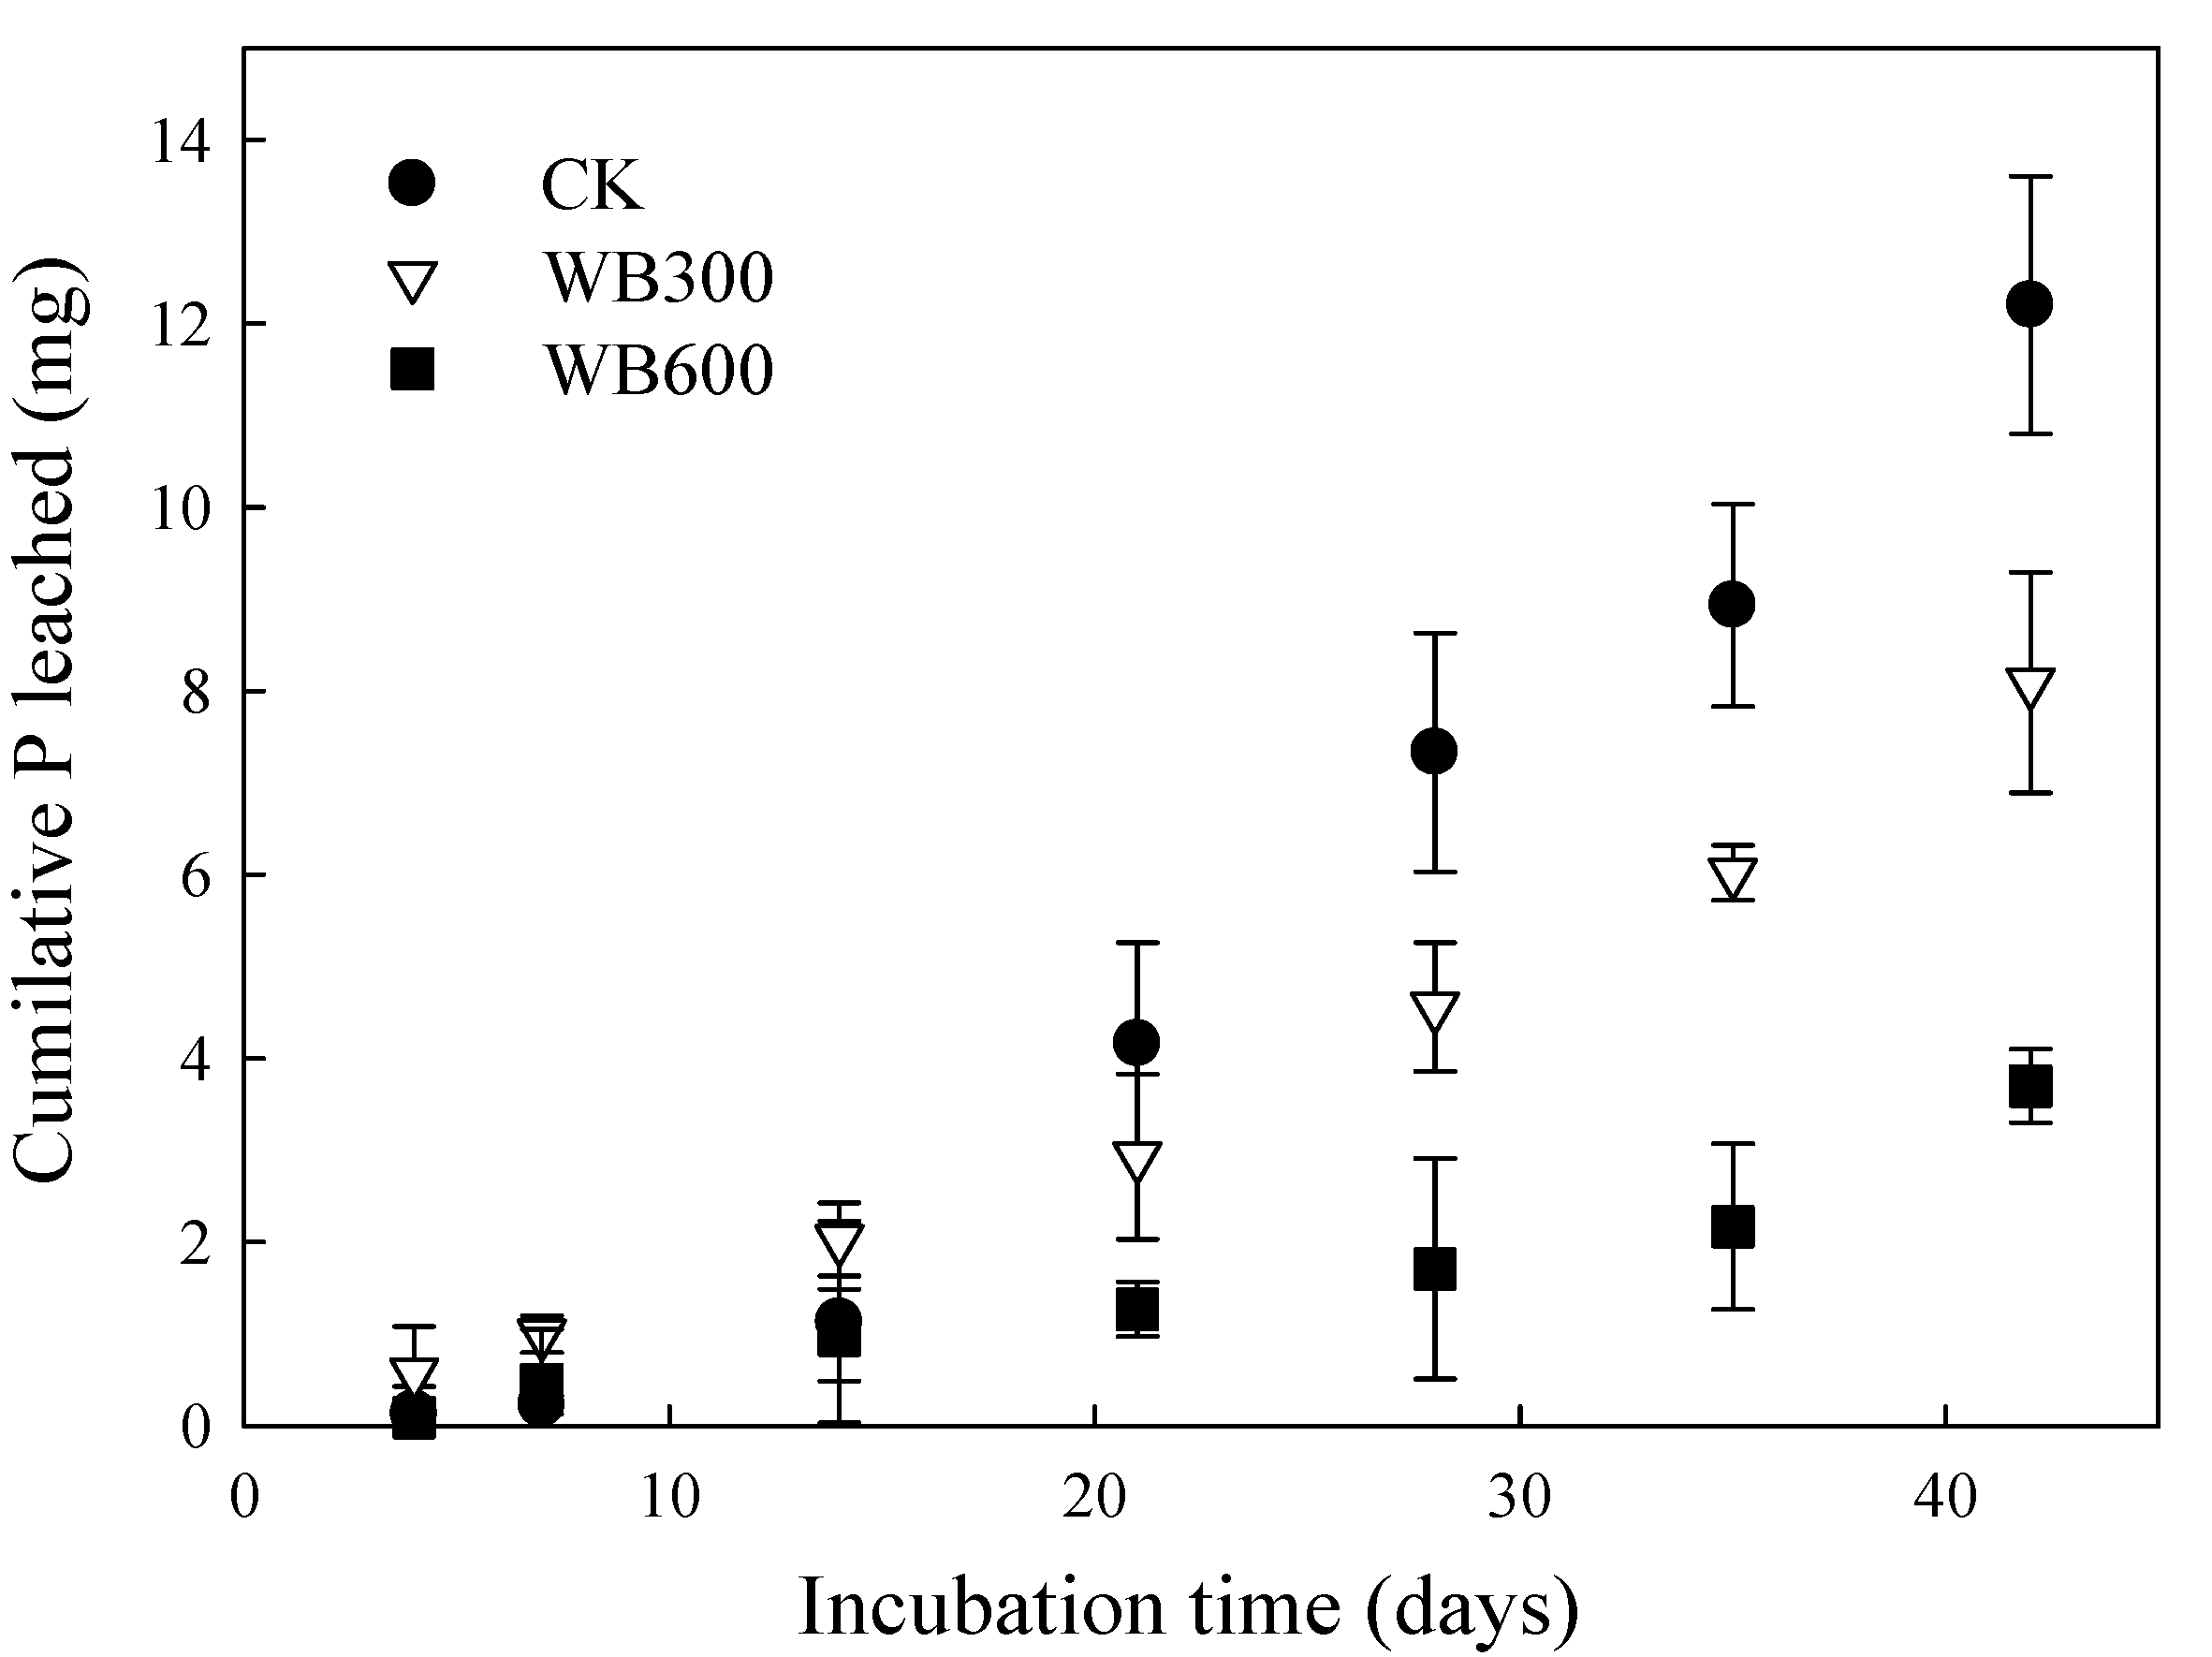
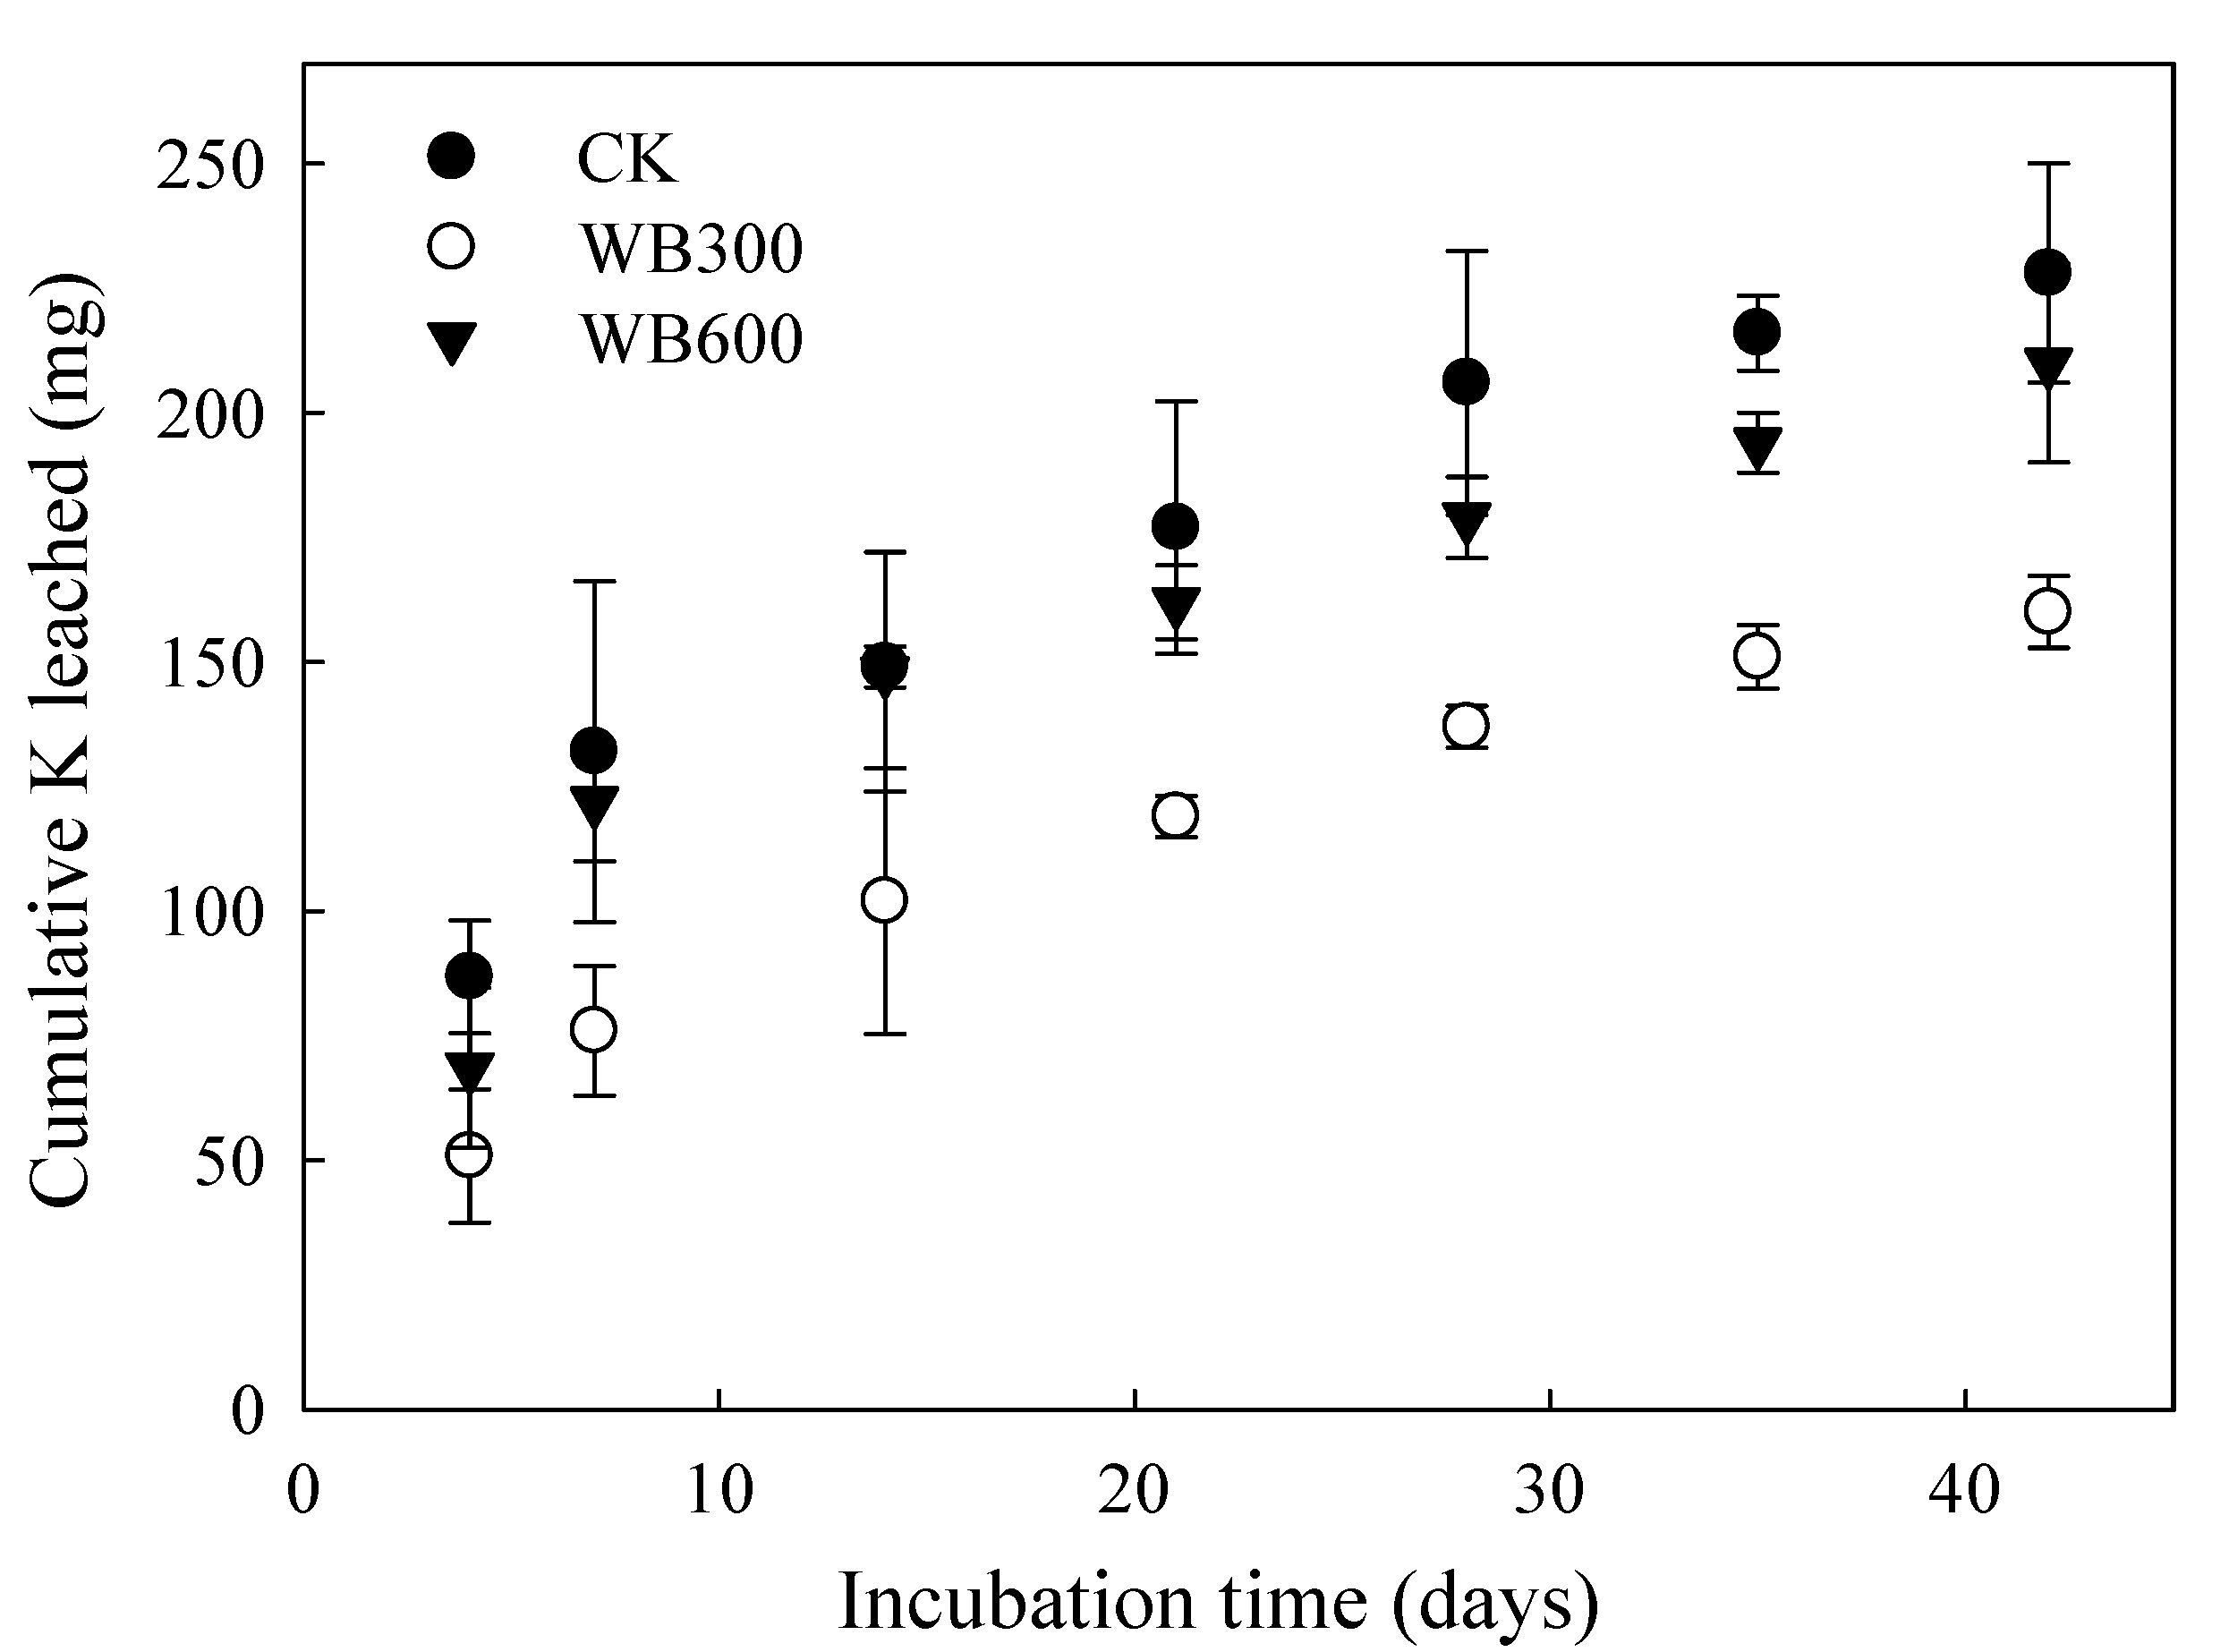
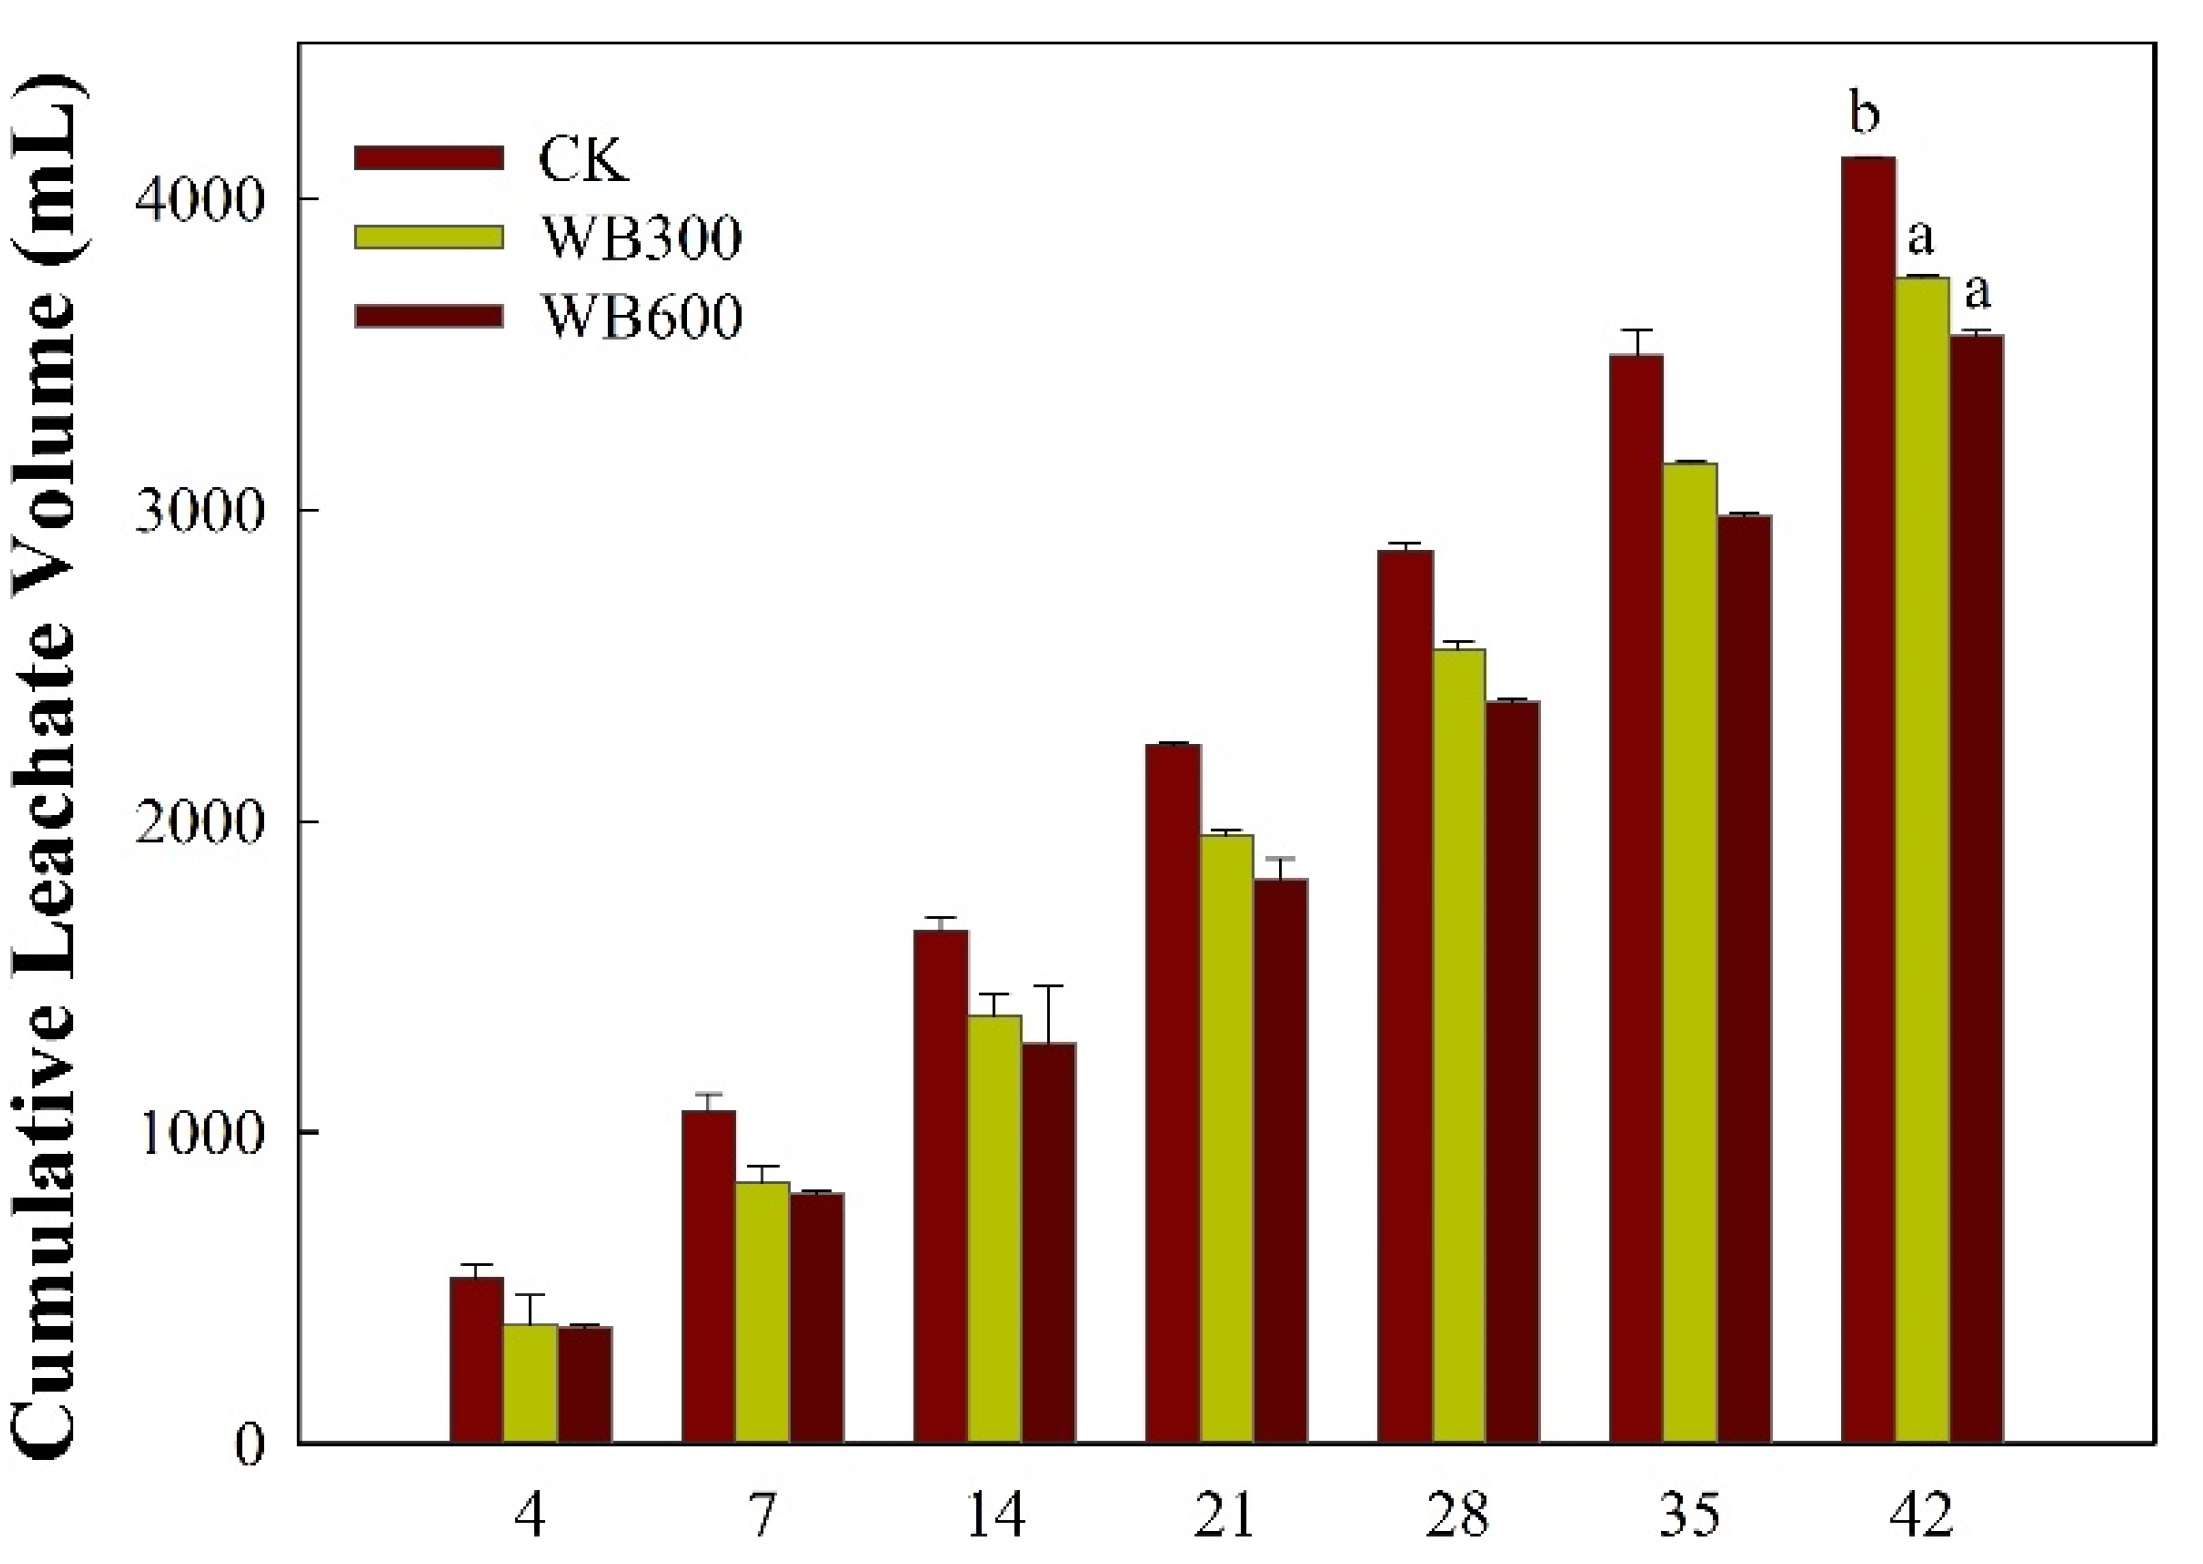
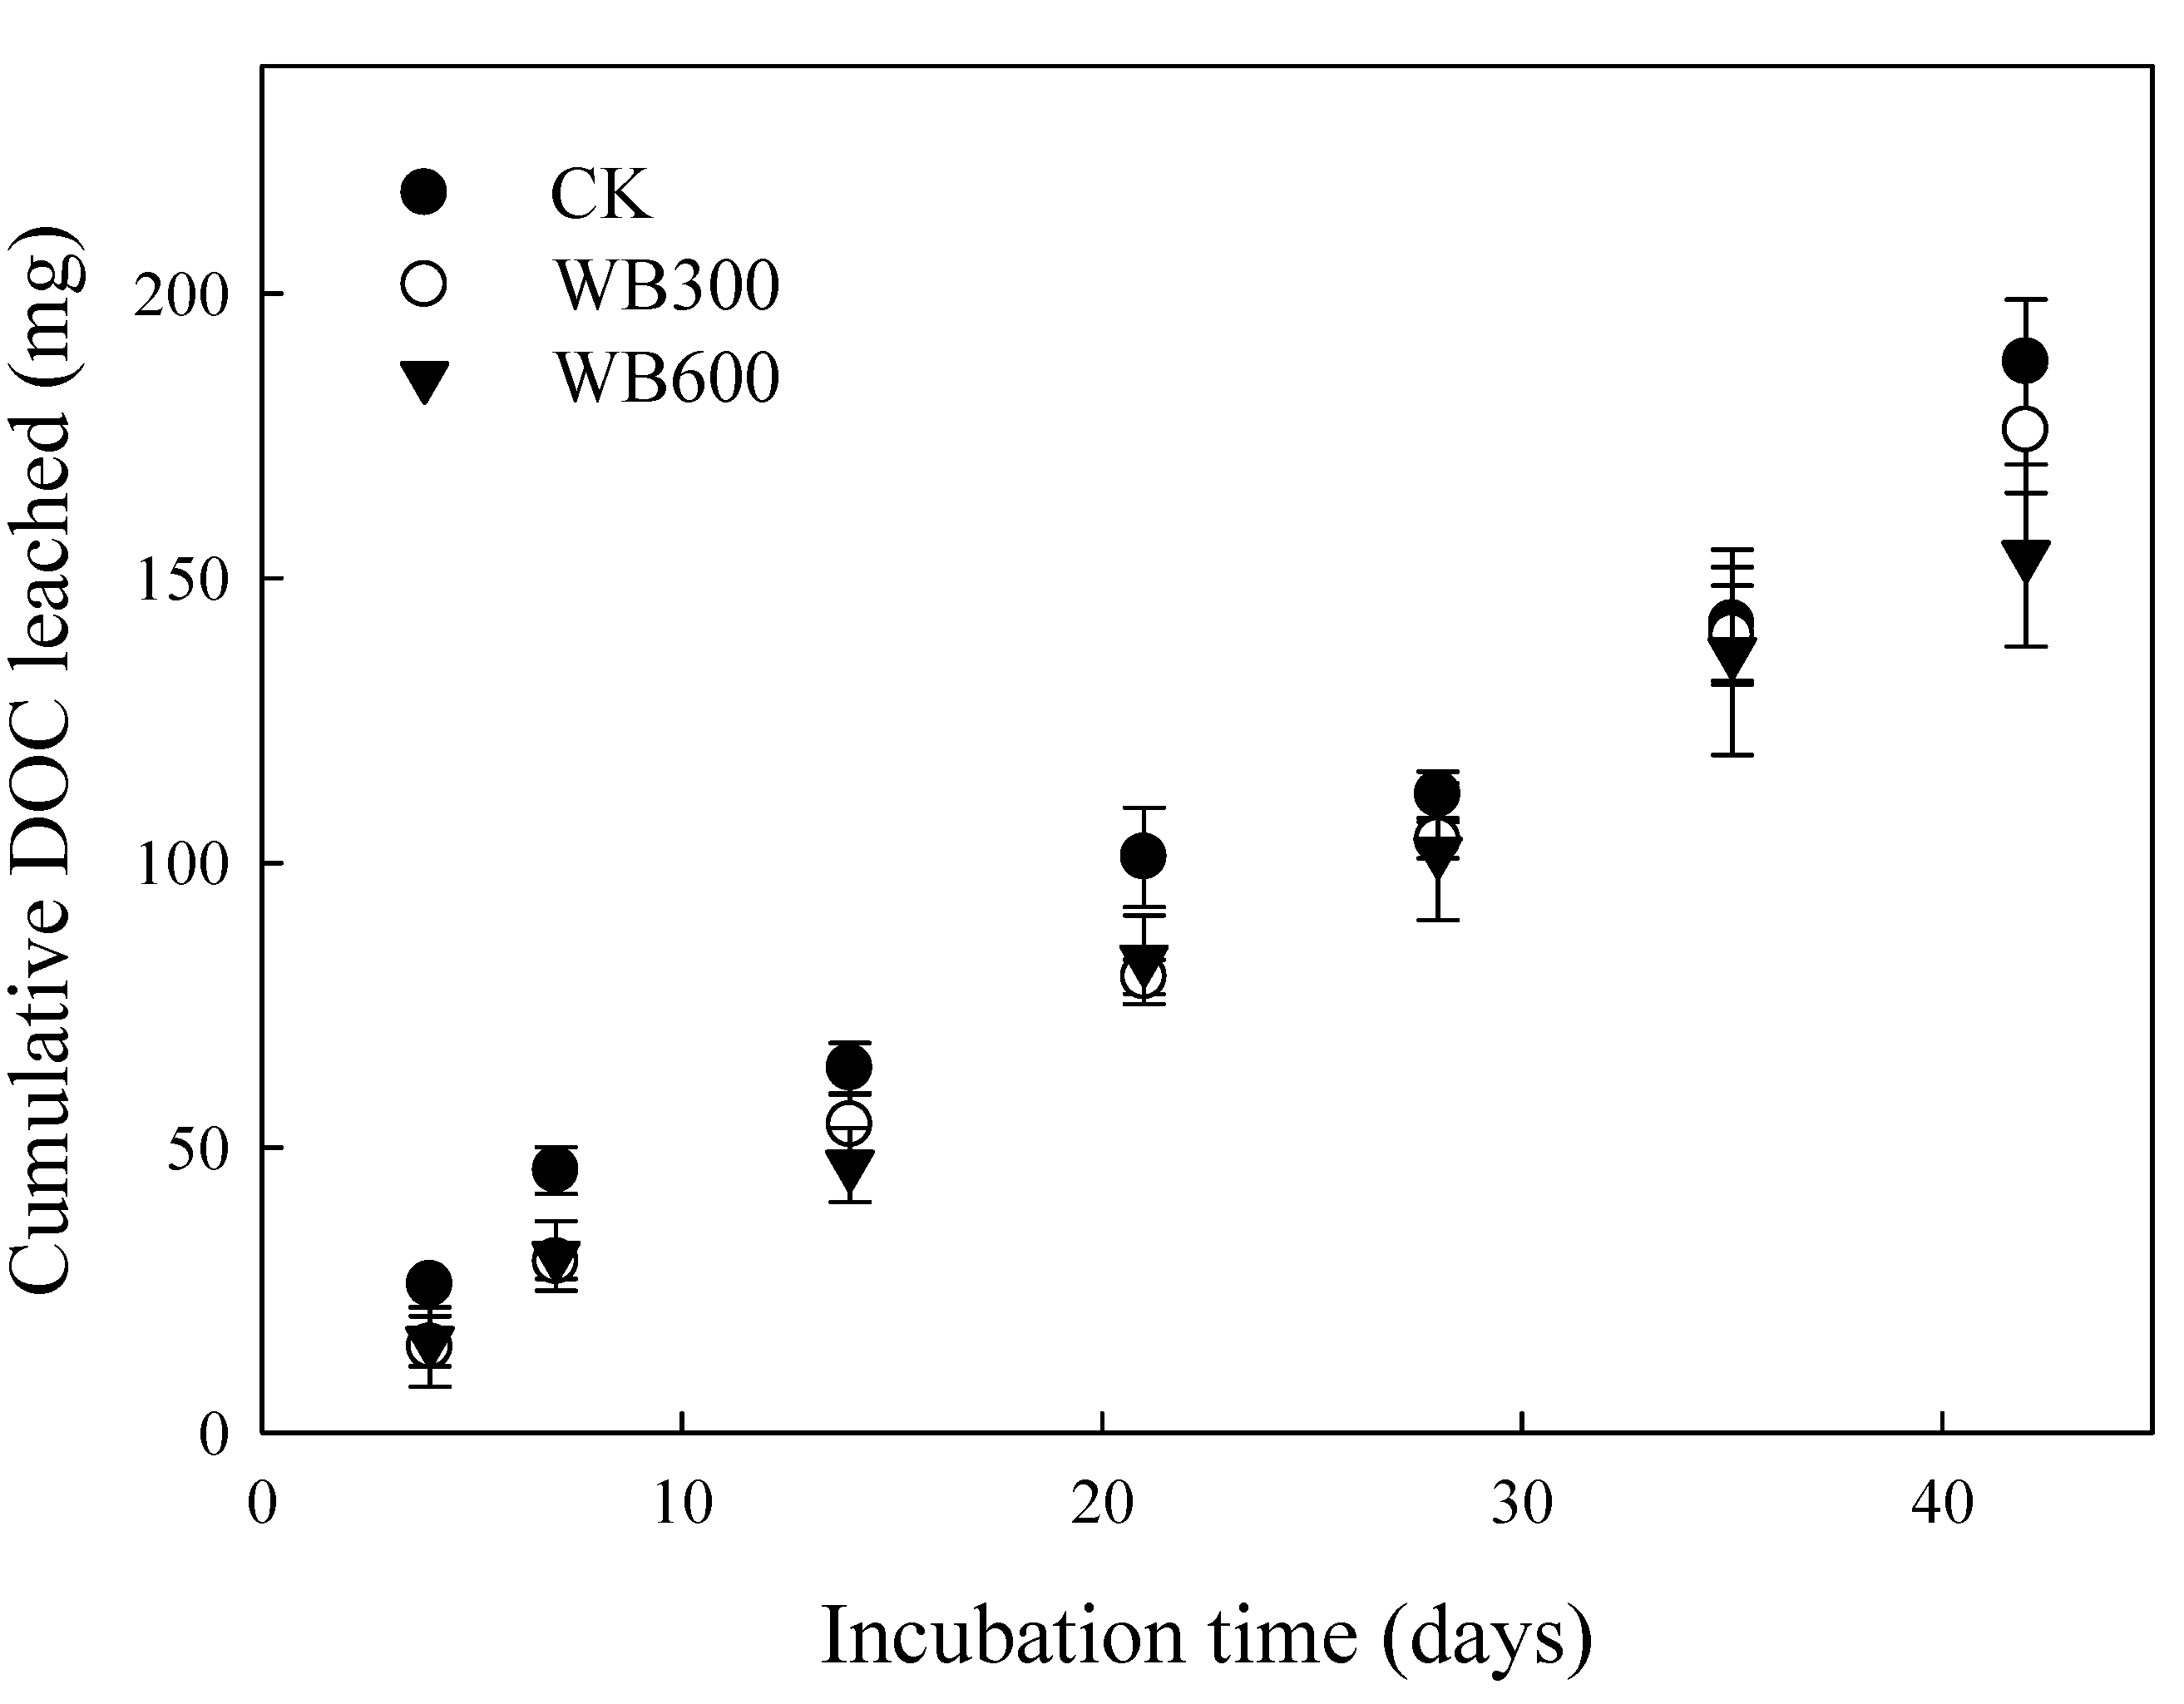
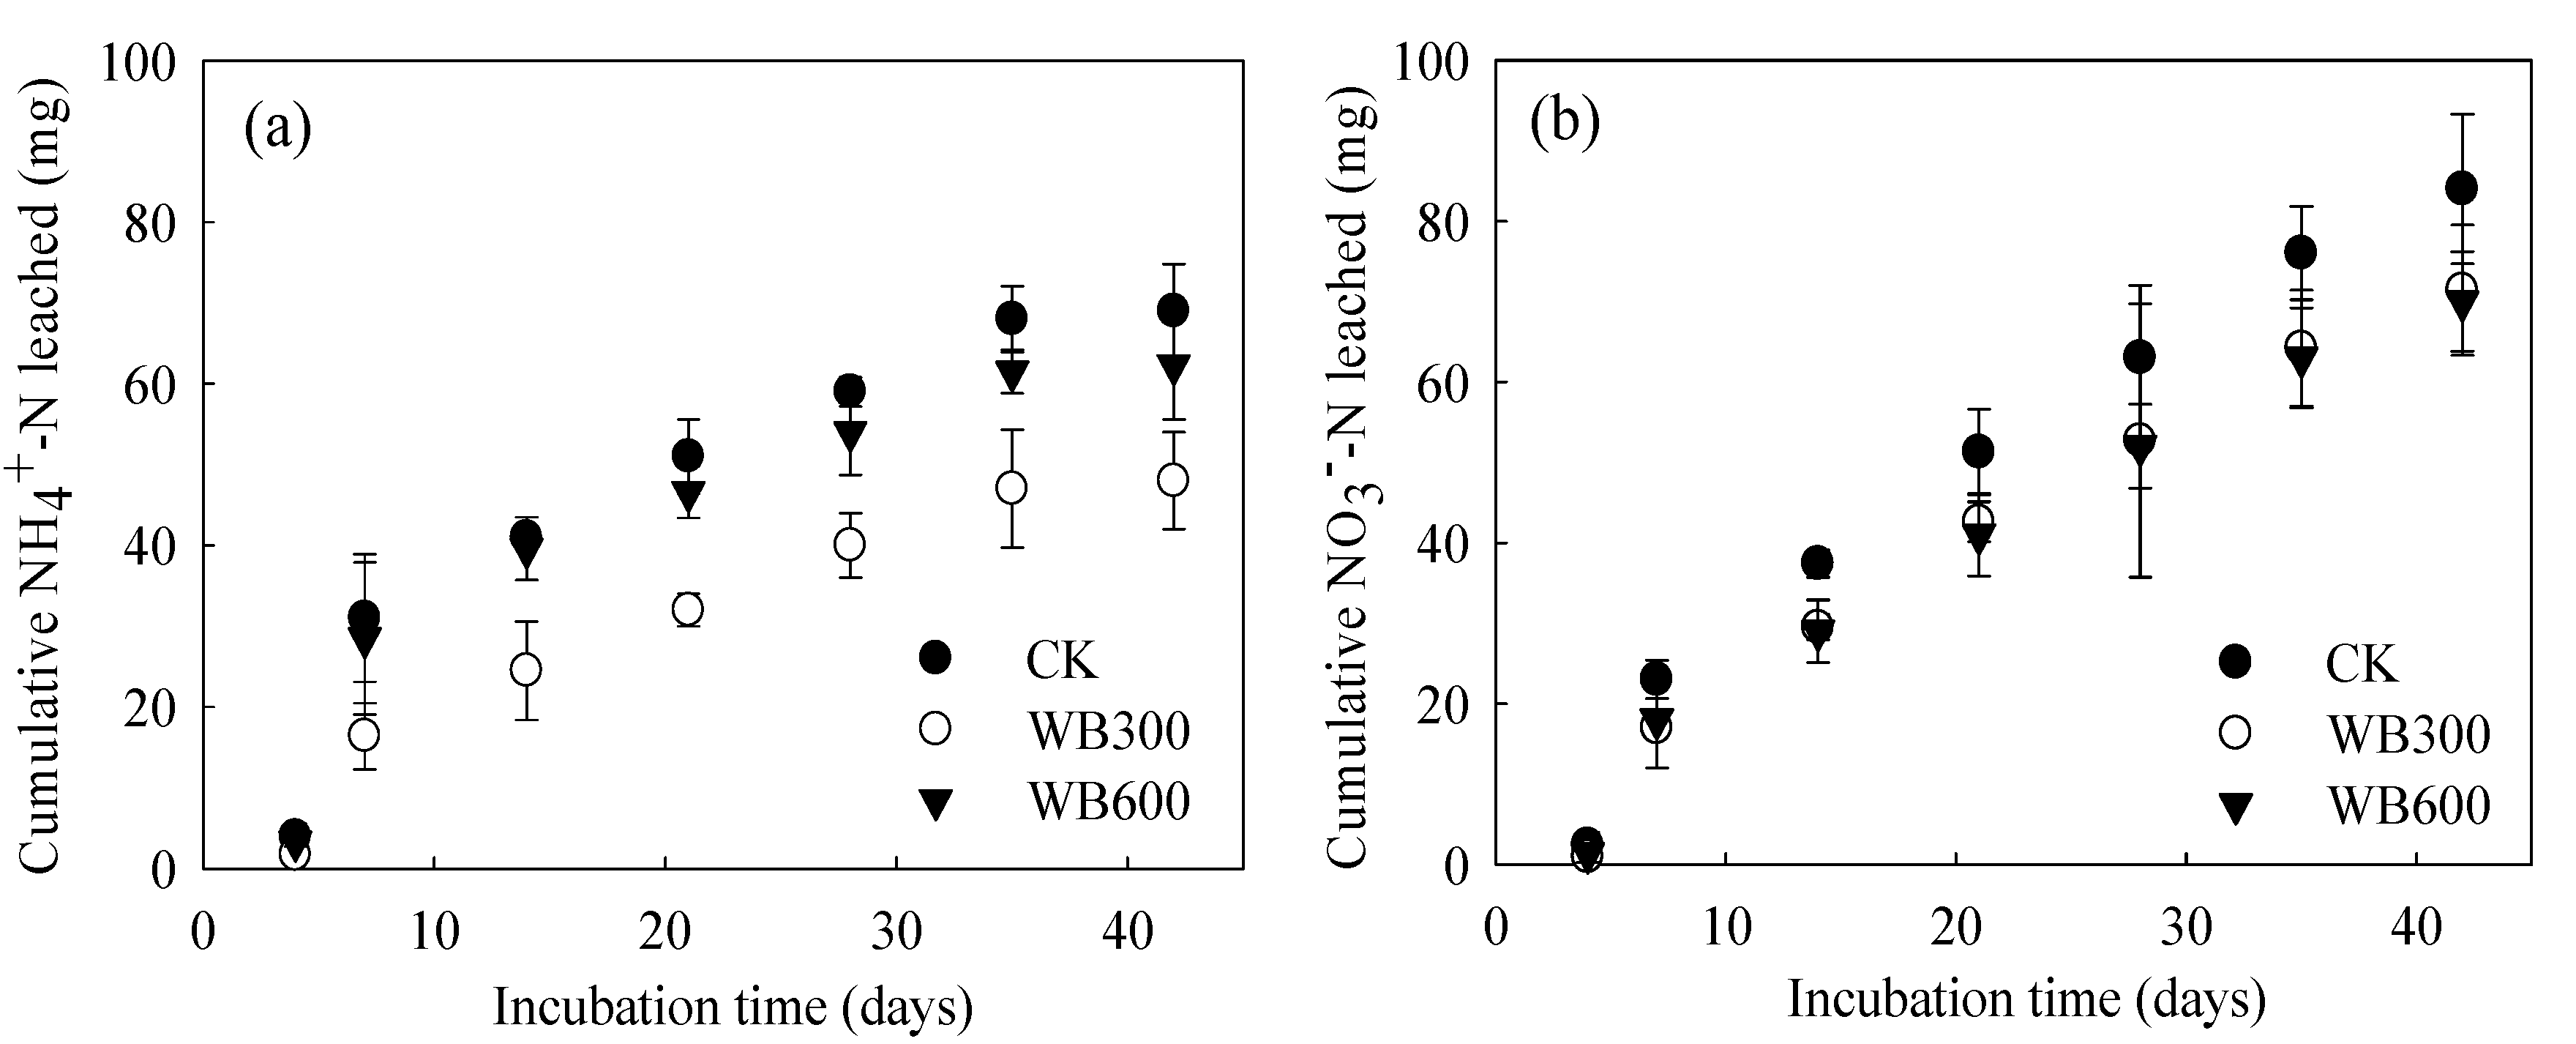
3.3. Properties of Leachate

Both biochar-treated samples exhibited significantly smaller leachate volumes than that of the control for each flushing event (Table 4; Figure 4). On day 4 (the day of the first flushing event), the soil column with the control sample had a leachate volume of 530 mL, and both WB300- and WB600-treated samples retained approximately 150 mL more water than the control did (i.e., the leachate volume decreased by 28%). At the end of the experiment, the cumulative leachate volumes observed for the WB300- and WB600-treated samples were lower than that observed for the control by 9.2% and 13.7%, respectively.
Figure 5 displays the cumulative level of dissolved OC (DOC) in the leachate. This was highest in the control and lowest in the WB600-treated sample after the experiment (188 and 154 mg, respectively). After 42 days of incubation, the level of DOC leached from the soil column decreased by 6.50% and 20.0% in the WB300- and WB600-treated samples, respectively, compared with the control. The biochar materials contained low levels of OC. Accordingly, biochar introduces a negligible level of DOC into soils.
The cumulative quantities of NH4+-N and NO3-N leached from the soil columns are illustrated in Figure 6. WB300 remarkably reduced NH4+-N leaching by 30.5% relative to the control (69.6 mg). Although the inhibitory effect of WB600 on NH4+-N leaching was relatively weak, it still reduced the total quantity of NH4+-N leached from the soil by 10.6%, which was approximately one-third of that observed for the WC300-treated sample. The WB300- and WB600-treatments reduced the quantities of NO3-N leached from the soil samples by 13.8% and 16.4%, respectively, compared with the control (83.9 mg).
The cumulative quantity of inorganic N (summation of the quantities of NH4+-N and NO3-N) leached from the soil samples subjected to the different treatments differed significantly (Figure 7). The control exhibited the highest quantity of inorganic N leached from the soil (154 mg), and the WB300-treated sample exhibited the lowest quantity (33.3% lower than the control). Furthermore, WB600 treatment decreased the quantity of inorganic N leached from the soil by 13.7% only.
Figure 8 displays the cumulative quantities of P leached from the soil columns. The total quantity of P leached from the WB600-treated sample decreased significantly (68.0%) compared with that from the control (12.2 mg). For the WB300-treated sample, the total quantity of P leached from the soil decreased by 45.2%. Compared with the control, the WB300 and WB600 treatments reduced the total quantities of P leached from the soil by 29.71% and 7.70% (156 and 210 mg leached), respectively (Figure 9).

4. Discussion

Compared with the original soil (control on day 0), the pH value of the fertilized soil decreased from 6.8 to 6.1, which could be attributed to the acidic properties of the two fertilizers, namely (NH4)2SO4 and Ca(H2PO4)2. The pH value of the control decreased to 4.6 on day 42, and those of the WB300- and WB600-treated samples were considerably higher (Table 3). The results indicate that both WB300 and WB600 could alleviate soil acidification. When biochar undergoes pyrolysis at a higher temperature, it generally has a higher pH [42]. Singh et al. [43] revealed that the CaCO3 equivalence of biochar increased with the pyrolysis temperature. Accordingly, the application of biochar could engender liming effects. For biochar, a higher application rate or higher pyrolysis temperature could increase the pH or alkalinity of the biochar-treated soil [11]. The alleviation effects of biochar on soil acidification could contribute to the retardation of the movement of several nutrients and pollutants from soils to groundwater and lower water bodies.
Applying biochar could decrease the DB of a soil sample [13]. However, this phenomenon was not observed in this study; a possible reason is that the reorganization of the soil structure for mixing the materials and packing the soil columns neutralized the soil properties. A similar condition can be achieved in the field through intensive tilling. For a less- disturbed sandy loam soil, the application of biochar could improve the soil structure, increase the infiltration rate, and reduce runoff water and soil erosion, thus improving soil and water conservation [7,13,41]. The volumes of leachates increased with repeated leaching for all treatments in this study. Although the differences in leachate volume between the control and biochar-treated samples decreased gradually in this study, the biochar-treated samples still retained a significantly higher amount of water in the soil columns on day 42 (Table 4). The WB300 and WB600 treatments reduced the level of water loss by 9.2% and 13.7%, respectively. Our results demonstrate that the biochar materials, particularly WB600, exhibited a strong ability to conserve water in the soil samples when applied at a rate of 2%.
The OC contents in both of the biochars were much lower than that of other organic materials commonly used in farmland. The biochar applications displayed significantly affect the SOC in the WB300 treatment only in this study (Table 3). Accordingly, the effects of biochar on DOC leaching are the results of the sorption of organic carbon onto the biochar, either within the pores of the biochar or onto the external biochar surface [7]. The biochar-applied soils retained more water than the control (Figure 4), as illustrated earlier, which could also contribute to DOC retention since DOC move down and leach out from the soil column along with the soil water. Our results illustrated that the highest amounts of DOC and leachate were found in CK indicating biochar addition could effectively retain DOC in the soils. However, the highest DOC concentration (47.0 mg/L, DOC amount/leachate volume) was found in the leachate of WB300 treatment indicated that biochar might release solube C components into soil solution, particularly in biochar pyrolized with low temperatures [7,44]. The results implicated that soluable C components onto the biochar itself might increase DOC concentration in output water (runoff or eluate from soil pedon) duing rainfall events in the biochar-amended soils. The WB300 treatment revealed the efficiency of 9.2% for water retention and the lower efficiency of 6.5% for DOC retention (Figure 4 and Figure 5). Under WB600 treatment, the retention efficiencies were 13.7% for water and a higher of 20.0% for DOC. This result indicates that WB600 had a stronger affinity to DOC than WB300. Kasozi et al. [45] reported that the organic matter sorption onto biochar surfaces is kinetically limited by slow diffusion into the subnanometer-sized pores dominating biochar surfaces. The various organo-mineral interactions lead to aggregations of soil and organic materials, which stabilizes both soil structure and the carbon compounds within the aggregates. Furthermore, the increase in the diversity and density of carbon groups within WB300 biochar may result in the slightly increased SOC but did not prevent the leaching of DOC as effective as the WB600 biochar.
Although the NH4+-N and NO3-N concentrations in the soil columns were low on day 42 (Table 3), the WB300- and WB600-treated samples, especially the WB300-treated sample, exhibited higher inorganic N concentrations than the control did. These results could be attributed to the high surface area and diverse functional groups, such as carboxyl C, O-alkyl-C, and alkyl C, of WB300 (Figure 3). Obvious higher CEC was also fould in WB300 than in WB600 in this study indicating that more NH4+-N and K could be retained in the soil treated with WB300, and which were demonstrated by our results in Figure 6 and Figure 9 [46,47]. Addtionally, improvement in soil physical properties such as promotion of soil aggregation and increasing of water holding capacity might also bring positive effects in nutrient leaching. Yoo et al. [31] suggested that increasing formation of aggregates by biochar addition could effectively promoted retention of NO3. Furthermore, they also indicated that increased water holding capacity after biochar addition was also a factor to reduce N leaching.
Overall, both biochars can effectively reduce N leaching and provide a potential N source of nutrient delivery to plants [48]. Agricultural non-point source (NPS) pollution is the leading source of water quality impacts to rivers and lakes. Nitrogen from fertilizers, manure, waste and ammonia turns into nitrite and nitrate. High levels of these toxins deplete waters of oxygen, killing all of the animals and fish. Nitrates also soak into the ground and end up in drinking water. Health problems can occur as a result of this and they contribute to methemeglopbinemia or blue baby syndrome which causes death in infants. Base on our results, application biochar might be a useful managememt practice to reduce NPS pollution in watersheds, particularly in tropical/subtropical climate regions. In this study, we measured the N losses through leaching. The N losses through denitrification and ammonia volatilization, which may form NH3, N2, or N2O, were not accessed. As the soil was pH 6.8 and the soil columns were nearly water-saturated during the experiment, we used acidic fertilizer, (NH4)2SO4 and Ca(H2PO4)2 intentionally to minimize ammonium volatilization.
Applying the biochar materials engendered only a slight increase in the available P in the soil samples after the leaching experiment (Table 3). Both biochar materials, particularly WB600, could retain soil P, according to the leaching results (Figure 8). This effect also resulted in the higher concentrations of Ava. P in the soil samples after the experiment, as mentioned. P tends to precipitate with Fe under acidic conditions. However, the application of the biochar materials increased the soil pH, which could enhance the release of P. Therefore, the biochar materials were likely to have contained numerous bonding sites or other co-precipitation elements, resulting in considerably higher P retention efficiency levels compared with their water retention efficiency levels. During soil pH 4 to 6, increasing of soil pH might unlock P “adsorbed on soluble and hydrous Fe/Al oxides” into an available form, however, the unlocked P might be adsorbed again onto biochar to form a potential available form. Our results was consistence with the resuld of Laird et al. [3] who indicated that biochar addition could effectively reduce leaching of dissolved P in the soil column due to adsorption of orthophosphate and adsorption of organic P compounds by biochar.
The Ex. K concentration was higher in the biochar-treated soil samples, particularly the WB600-treated sample, than in the control at the beginning of the experiment; this could be attributed to the high mobility of K in plant ash. A higher pyrolysis temperature may result in a higher concentration of soluble K in biochar. However, the Ex. K concentrations did not differ significantly between the samples on day 42. Both biochar materials considerably reduced the total quantity of K leached from the soil samples. The efficiency levels of WB300 and WB600 in inhibiting K leaching were 29.7% and 7.7%, respectively. WB600 inhibited K leaching mainly through holding the soil solutions, and WB300 possibly had additional K sorption mechanisms mainly related to C functional groups.
Our results indicated that both WB300 and WB600 could effectively reduce the leaching of soil water, DOC, NH4+-N, NO3-N, P, and K. After incubation, not only nutrient concentration but also leachate volume were found lower in biochar-treated soil compared with those in control (Table 4). Reharding the strong water retention capacity of the biochar-treated soils, two possible reasons were speculated, which were (1) high degree of evaporation (about 30 °C in average during summer in southern Taiwan) for the soil column after water adding; therefore, the biochar treatments might still effectively retain water after water addition; (2) the volume of adding water (700 mL) to the soil column at each date still did not match the pore volume (~2000 cm3) of soil column; therefore, the biochar treatments might still effectively retain water after water addition at day 7 and other dates. Nutrient leaching could be inhibited through increased water retention. Moreover, the inhibitory effect of the biochar materials on the mineralization of organic N, in terms of physical protection of organic matter [7,40], can reduce the quantity of nutrients released and thus reduce subsequent leaching. Our results reveal that WB300 exhibited a high NH4+-N and K (predominately cations) retention efficiency, and WB600 exhibited a high water, DOC, and P (predominately anions) retention efficiency. These results indicate that WB300 was negatively charged, which was most likely due to the distribution of various carbon functional groups. Overall, the biochar-induced retention of soil water, DOC, and nutrients could be considered to positively affect nutrient and water conservation and to improve soil quality. Reducing the leaching of water, DOC, and nutrients from soils could conserve groundwater and connected water bodies. Therefore, biochar application can benefit both soil and water conservation. Further research should be conducted to investigate whether these positive effects can be extended to the field and to downstream water bodies at the catchment level.

5. Conclusions

The results of this study demonstrate that the incorporation of Honduran mahogany (Swietenia macrophylla) wood sawdust biochar into sandy loam soil samples could improve soil health by increasing the capacity of the soil to retain nutrients and reduce nutrient leaching. The biochar materials applied in this study, particularly WB600, alleviated soil acidification. The incorporation of the biochar materials considerably increased SOC, inorganic N (NH4+-N and NO3-N), and ava. P concentrations in the soil samples. The biochar application did not significantly affect DB or Ex. K in the soil. Furthermore, the total volume of leachates and cumulative quantity of DOC, inorganic N, P, and K leached from the soil samples decreased significantly in the biochar-treated samples. WB300 engendered the least quantities of NH4+-N and K, both of which are cations. Thus, WB300 could be more negatively charged than WB600 because of its inhibitory effects on cation leaching. By contrast, WB600 was likely to have a higher density of P-bonding sites, which resulted in a stronger inhibitory effect on P leaching. Although the ability to retain various nutrients in soil differed with pyrolysis temperatures, both biochar materials effectively contributed to the conservation of groundwater and subsequent downstream water bodies. Increased retention of these nutrients in soils can increase the probability of absorption by plant roots, thereby decreasing the risk of leaching into rivers or groundwater reservoirs. In future studies, the on-site effects of biochar application on underground and water bodies should be determined in terms of eutrophication and potential pollution, especially for intensively fertilized cropped fields.

Author Contributions

Conceptualization and methodology, S.-H.J.; sample analysis, Y.-L.K.; writing—original draft preparation, S.-H.J. and Y.-L.K.; writing—review and editing, S.-H.J. and C.-H.L. All authors have read and agreed to the published version of the manuscript.

Funding

This research was funded by the Ministry of Science and Technology of the R.O.C. (Grant number MOST 105-2628-B-020-001-MY2).

Acknowledgments

We would like to thank the students of the Soil Survey and Conservation Laboratory, Department of Soil and Water Conservation, National Pingtung University of Science and Technology, for their assistance during the column leaching experiment and analysis.

Conflicts of Interest

The authors declare no conflicts of interest.

References

  1. Robertson, M. Sustainability Principles and Practice, 2nd ed.; Taylor & Francis: London, UK, 2017. [Google Scholar]
  2. Jordan, C.F.; Herrera, R. Tropical rain forests: Are nutrients really critical? Am. Nat. 1981, 117, 167–180. [Google Scholar] [CrossRef]
  3. Laird, D.; Fleming, P.; Wang, B.; Horton, R.; Karlen, D. Biochar impact on nutrient leaching from a Midwestern agricultural soil. Geoderma 2010, 158, 436–442. [Google Scholar] [CrossRef] [Green Version]
  4. O’Green, A.T.; Budd, R.; Gan, J.; Manynard, J.J.; Parikh, S.J.; Dahlgren, R.A. Mitigating nonpoint source pollution in agriculture with constructed and restored wetlands. Adv. Agron. 2010, 108, 1–76. [Google Scholar]
  5. Lal, R. Tillage and agricultural sustainability. Soil Tillage Res. 1991, 20, 133–146. [Google Scholar] [CrossRef]
  6. Lu, K.; Yang, X.; Shen, J.; Robinson, B.; Huang, H.; Liu, D.; Bolan, N.; Pei, J.; Wang, H. Effect of bamboo and rice straw biochars on the bioavailability of Cd, Cu, Pb and Zn to Sedum plumbizincicola. Agric. Ecosyst. Environ. 2014, 191, 124–132. [Google Scholar] [CrossRef]
  7. Jien, S.H.; Wang, C.C.; Lee, C.H.; Lee, T.Y. Stabilization of organic matter by biochar application in compost-amended soils with contrasting pH values and textures. Sustainability 2015, 7, 13317–13333. [Google Scholar] [CrossRef] [Green Version]
  8. Busscher, W.J.; Novak, J.M.; Evans, D.E.; Watts, D.W.; Niandou, M.; Ahmedna, M. Influence of pecan biochar on physical properties of a Norfolk loamy sand. Soil Sci. 2010, 175, 10–14. [Google Scholar] [CrossRef] [Green Version]
  9. Kammann, C.I.; Linsel, S.; Gößling, J.W.; Koyro, H.W. Influence of biochar on drought tolerance of Chenopodium quinoa Willd and on soil–plant relations. Plant Soil 2011, 345, 195–210. [Google Scholar] [CrossRef]
  10. Basso, A.S.; Miguez, F.E.; Laird, D.A.; Horton, R.; Westgate, M. Assessing potential of biochar for increasing water-holding capacity of sandy soils. Gcb Bioenergy 2013, 5, 132–143. [Google Scholar] [CrossRef] [Green Version]
  11. Yuan, J.H.; Xu, R.K.; Zhang, H. The forms of alkalis in the biochar produced from crop residues at different temperatures. Bioresour. Technol. 2011, 102, 3488–3497. [Google Scholar] [CrossRef]
  12. Vaccari, F.; Baronti, S.; Lugato, E.; Genesio, L.; Castaldi, S.; Fornasier, F.; Miglietta, F. Biochar as a strategy to sequester carbon and increase yield in durum wheat. Eur. J. Agron. 2011, 34, 231–238. [Google Scholar] [CrossRef]
  13. Jien, S.H.; Wang, C.S. Effects of biochar on soil properties and erosion potential in a highly weathered soil. Catena 2013, 110, 225–233. [Google Scholar] [CrossRef] [Green Version]
  14. Zhao, X.; Wang, J.; Xu, H.; Zhou, C.; Wang, S.; Xing, G. Effects of crop-straw biochar on crop growth and soil fertility over a wheat-millet rotation in soils of China. Soil Use Manag. 2014, 30, 311–319. [Google Scholar] [CrossRef]
  15. Clough, T.J.; Condron, L.M.; Kammann, C.; Müller, C. A review of biochar and soil nitrogen dynamics. Agronomy 2013, 3, 275–293. [Google Scholar] [CrossRef] [Green Version]
  16. Ventura, M.; Sorrenti, G.; Panzacchi, P.; George, E.; Tonon, G. Biochar reduces short-term nitrate leaching from a horizon in an apple orchard. J. Environ. Qual. 2013, 42, 76–82. [Google Scholar] [CrossRef]
  17. Laird, D.A. The charcoal vision: A win–win–win scenario for simultaneously producing bioenergy, permanently sequestering carbon, while improving soil and water quality. Agron. J. 2008, 100, 178–181. [Google Scholar]
  18. Gaunt, J.L.; Lehmann, L. Energy balance and emissions associated with biochar sequestration and pyrolysis bioenergy production. Environ. Sci. Technol. 2008, 42, 4152–4158. [Google Scholar] [CrossRef]
  19. Woolf, D.; Amonette, J.E.; Street-Perrott, F.A.; Lehmann, J.; Joseph, S. Sustainable biochar to mitigate global climate change. Nat. Commun. 2010, 1, 1–9. [Google Scholar] [CrossRef] [Green Version]
  20. Zheng, J.; Stewart, C.E.; Cotrufo, M.F. Biochar and nitrogen fertilizer alters soil nitrogen dynamics and greenhouse gas fluxes from two temperate soils. J. Environ. Qual. 2012, 41, 1361–1370. [Google Scholar] [CrossRef] [Green Version]
  21. Stewart, C.E.; Zheng, J.; Botte, J.; Cotrufo, M.F. Co-generated fast pyrolysis biochar mitigates green-house gas emissions and increases carbon sequestration in temperate soils. GCB Bioenergy 2013, 5, 153–164. [Google Scholar] [CrossRef]
  22. Warnock, D.D.; Lehmann, J.; Kuyper, T.W.; Rillig, M.C. Mycorrhizal responses to biochar in soil–concepts and mechanisms. Plant Soil 2007, 300, 9–20. [Google Scholar] [CrossRef]
  23. Jin, H. Characterization of Microbial Life Colonizing Biochar and Biochar-Amended Soils; Cornell University: New York, NY, USA, 2010. [Google Scholar]
  24. Lehmann, J.; Rillig, M.C.; Thies, J.; Masiello, C.A.; Hockaday, W.C.; Crowley, D. Biochar effects on soil biota—A review. Soil Biol. Biochem. 2011, 43, 1812–1836. [Google Scholar] [CrossRef]
  25. Glaser, B.; Lehmann, J.; Zech, W. Ameliorating physical and chemical properties of highly weathered soils in the tropics with charcoal—A review. Biol. Fertil. Soils 2002, 35, 219–230. [Google Scholar] [CrossRef]
  26. Lehmann, J.; da Silva, J.P., Jr.; Steiner, C.; Nehls, T.; Zech, W.; Glaser, B. Nutrient availability and leaching in an archaeological Anthrosol and a Ferralsol of the Central Amazon basin: Fertilizer, manure and charcoal amendments. Plant Soil 2003, 249, 343–357. [Google Scholar] [CrossRef]
  27. Major, J.; Rondon, M.; Molina, D.; Riha, S.J.; Lehmann, J. Maize yield and nutrition during 4 years after biochar application to a Colombian savanna oxisol. Plant Soil 2010, 333, 117–128. [Google Scholar] [CrossRef]
  28. Mukherjee, A.; Zimmerman, A.R. Organic carbon and nutrient release from a range of laboratory-produced biochars and biochar–soil mixtures. Geoderma 2013, 193, 122–130. [Google Scholar] [CrossRef]
  29. Yao, Y.; Gao, B.; Zhang, M.; Inyang, M.; Zimmerman, A.R. Effect of biochar amendment on sorption and leaching of nitrate, ammonium, and phosphate in a sandy soil. Chemosphere 2012, 89, 1467–1471. [Google Scholar] [CrossRef]
  30. Lo, C.H. Manual of Fertilizer Application, 6th ed.; Agriculture and Food Agency, Council of Agriculture, Executive Yuan: Taipei, Taiwan, 2005. [Google Scholar]
  31. Yoo, G.Y.; Kim, H.J.; Chen, J.J.; Kim, Y.S. Effects of biochar addition on nitrogen leaching and soil structure following fertilizer application to rice paddy soil. Soil Sci. Soc. Am. J. 2013, 78, 852–860. [Google Scholar] [CrossRef]
  32. Blake, G.R.; Hartge, K.H. Bulk density. In Methods of Soil Analysis, Part 1. Physical and Mineralogical Methods; Klut, A., Ed.; ASA and SSSA: Madison, WI, USA, 1986; Agronomy monograph No. 9; pp. 363–375. [Google Scholar]
  33. McLean, E. Soil pH and lime requirement. In Methods of Soil Analysis. Part 2. Chemical and Microbiological Properties; Page, A.L., Miller, R.H., Keeney, D.R., Eds.; ASA and SSSA: Madison, WI, USA, 1982; pp. 199–224. [Google Scholar]
  34. Rhoades, J. 1982. Cation exchange capacity. In Methods of Soil Analysis. Part 2. Chemical and Microbiological Properties; Page, A.L., Miller, R.H., Keeney, D.R., Eds.; ASA and SSSA: Madison, WI, USA, 1982; pp. 149–157. [Google Scholar]
  35. Gee, G.W.; Bauder, J.W.; Klute, A. Particle-size analysis. In Methods of Soil Analysis. Part 1. Physical and Mineralogical Methods; Klut, A., Ed.; ASA and SSSA: Madison, WI, USA, 1986; Agronomy monograph No. 9; pp. 383–411. [Google Scholar]
  36. Sumner, M.E.; Miller, W.P. Cation exchange capacity and exchange coefficients. In Methods of Soil Analysis: Soil Science Society of America Book Series 5 Part 3—Chemical Methods; Sparks, D.L., Page, A.L., Helmke, P.A., Loeppert, R.H., Eds.; ASA and SSSA: Madison, WI, USA, 1996; pp. 1201–1229. [Google Scholar]
  37. Nelson, D.W.; Sommers, L.E.; Sparks, D.; Page, A.; Helmke, P.; Loeppert, R.; Soltanpour, P.; Tabatabai, M.; Johnston, C.; Sumner, M. Total carbon, organic carbon, and organic matter. In Methods of Soil Analysis: Soil Science Society of America Book Series 5 Part 3—Chemical Methods; Sparks, D.L., Page, A.L., Helmke, P.A., Loeppert, R.H., Eds.; ASA and SSSA: Madison, WI, USA, 1996; pp. 961–1010. [Google Scholar]
  38. Bray, R.H.; Kurtz, L. Determination of total, organic, and available forms of phosphorus in soils. Soil Sci. 1945, 59, 39–46. [Google Scholar] [CrossRef]
  39. Mulvaney, R.L. Nitrogen-Inorganic forms. In Methods of Soil Analysis: Soil Science Society of America Book Series 5 Part 3—Chemical Methods; Sparks, D.L., Page, A.L., Helmke, P.A., Loeppert, R.H., Eds.; ASA and SSSA: Madison, WI, USA, 1996; pp. 1123–1184. [Google Scholar]
  40. Jien, S.H.; Chen, W.C.; Ok, Y.S.; Awad, Y.M.; Liao, C.S. Short-term biochar application induced variation of C and N mineralization in a compost-added rural soil. Environ. Sci. Pollut. Res. 2018. [Google Scholar] [CrossRef]
  41. Lee, C.H.; Wang, C.C.; Lin, H.H.; Lee, S.S.; Tsang, D.C.W.; Jien, S.H.; Ok, Y.S. In situ biochar application conserves water and nutrients while simultaneously mitigating the erosion of an Fe-oxide-enriched tropical soil. Sci. Total Environ. 2018, 619, 665–671. [Google Scholar] [CrossRef] [PubMed]
  42. Cantrell, K.B.; Hunt, P.G.; Uchimiya, M.; Novak, J.M.; Ro, K.S. Impact of pyrolysis temperature and manure source on physicochemical characteristics of biochar. Bioresour. Technol. 2012, 107, 419–428. [Google Scholar] [CrossRef] [PubMed]
  43. Singh, B.; Singh, B.P.; Cowie, A.L. Characterisation and evaluation of biochars for their application as a soil amendment. Soil Res. 2010, 48, 516–525. [Google Scholar] [CrossRef]
  44. Mukherjee, A.; Zimmerman, A.R.; Harris, W. Surface chemistry variations among a series of laboratory-produced biochars. Geoderma 2011, 163, 247–255. [Google Scholar] [CrossRef]
  45. Kasozi, G.N.; Zimmerman, A.R.; Kizza, P.N.; Gao, B. Catechol and Humic Acid Sorption onto a Range of LaboratoryProduced Black Carbons (Biochars). Environ. Sci. Technol. 2010, 44, 6189–6195. [Google Scholar] [CrossRef] [PubMed]
  46. Steiner, C.; Glaser, B.; Teixeira, W.G.; Lehmann, J.; Blum, W.E.H.; Zech, W. Nitrogen retention and plant uptake on a highly weathered central Amazonian Ferralsol amended with compost and charcoal. J. Plant Nutr. Soil Sci. 2008, 171, 893–899. [Google Scholar] [CrossRef]
  47. Lentz, R.D.; Ippolito, J.A. Biochar and manure affect calcareous soil and corn silage nutrient concentrations and uptake. J. Environ. Qual. 2011, 41, 1033–1043. [Google Scholar] [CrossRef]
  48. Hagemann, N.; Kammann, C.; Schmidt, H.P.; Kappler, A. Nitrate capture and slow release in biochar amended compost and soil. PLoS ONE 2017, 12, e171214. [Google Scholar] [CrossRef]
Figure 1. Schematic of the soil column constructed for the leaching experiment.
Water 12 02012 g001
Figure 2. Scanning electron microscope (SEM) images of Honduran mahogany (Swietenia macrophylla) wood sawdust biochar pyrolyzed at (a) 300 °C and (b) 600 °C.
Water 12 02012 g002
Figure 3. Solid-state 13C cross-polarization magic-angle spinning nuclear magnetic resonance spectra for Honduran mahogany (Swietenia macrophylla) wood sawdust (a) and its biochar materials pyrolyzed at 300 °C (b) and 600 °C (c).
Water 12 02012 g003
Figure 4. Cumulative leachate volume (VL) of treated samples (n = 3). Different letters above the bars for day 42 indicate significant differences between the relevant treated samples (p < 0.05).
Water 12 02012 g004
Figure 5. Cumulative concentration of dissolved organic carbon (DOC) for different treated samples (n = 3).
Water 12 02012 g005
Figure 6. Cumulative quantities of (a) NH4+-N and (b) NO3-N leached from the soil columns (n = 3).
Water 12 02012 g006
Figure 7. Cumulative quantity of inorganic N leached from the soil columns (n = 3).
Water 12 02012 g007
Figure 8. Cumulative quantity of phosphorus leached from the soil columns (n = 3).
Water 12 02012 g008
Figure 9. Cumulative quantity of potassium leached from the soil columns (n = 3).
Water 12 02012 g009
Table 1. Analysis items and relevant abbreviations for the leachates and soils.
PropertiesLeachateSoil
Leachate VolumeVL
pHpH
Bulk DensityDB
Organic CarbonOC
Ammonium NitrogenNH4+-N
Nitrate-NitrogenNO3-N
Available PhosphorusAva. P
Exchangeable PotassiumEx. K
Table 2. Properties of the studied soil and Honduran mahogany (Swietenia macrophylla) wood sawdust biochar samples pyrolyzed at 300 °C (WB300) and 600 °C (WB600).
PropertiesSoilWood Biochar (WB)
300 °C (WB300)600 °C (WB600)
pH6.26.510.4
EC (dS m−1)0.35--
Sand (%)72.5--
Silt (%)18.1--
Clay (%)9.4--
TextureSL--
DB (g cm−3)1.44--
DP (g cm−3)2.69--
Porosity (%)42.8 --
CEC (cmol(+)/kg)10.255.120.4
OC (%)0.336.82.0
TC (%)-69.079.5
H (%)-4.52.9
O (%)-24.714.6
N (%)-0.920.82
H/C-0.060.04
O/C-0.360.18
NH4+-N (mg/kg)82.456.741.7
NO3-N (mg/kg)131548341
Ava. P (mg/kg)6.635.293.30
Ex. K (mg/kg)259449323
EC: electrical conductivity; SL: sandy loam; DB: bulk density; DP: particle density; OC: organic carbon; TC: total carbon; H: hydrogen; O: oxygen; N: nitrogen; NH4+-N: ammonium-nitrogen; NO3-N: nitrate-nitrogen; Ava. P: available phosphorous; Ex. K: exchangeable potassium; -: Not determined.
Table 3. The Soil physicochemical properties on day 0 and day 42 (n = 3).
PropertiesDayTreatments
CKWB300WB600
pH06.1 ± 0.1 a6.2 ± 0.1 a6.5 ± 0.1 b
424.6 ± 0.1 a5.2 ± 0.2 b5.8 ± 0.1 c
DB (g cm−3)421.11 ± 0.24 a1.09 ± 0.11 a1.05 ± 0.10 a
SOC (%)00.33 ± 0.05 a0.46 ± 0.03 b0.36 ± 0.05 a
420.21 ± 0.05 a0.39 ± 0.05 b0.31 ± 0.07 a,b
NH4+-N (mg kg−1)0206 ± 6.28 a205 ± 6.16 a205 ± 6.35 a
425.87 ± 1.19 a12.7 ± 1.15 b12.7 ± 1.21 b
NO3-N (mg kg−1)0131 ± 8.35 a138 ± 8.98 a135 ± 8.14 a
427.52 ± 1.14 a33.0 ± 1.31 c28.0 ± 3.63 b
Inorganic N (mg kg−1)0336 ± 8.61 a343 ± 9.60 a339 ± 8.38 a
4213.4 ± 0.82 a45.7 ± 0.11 c40.7 ± 3.42 b
Ava. P (mg kg−1)019.6 ± 0.27 a19.6 ± 0.26 a19.8 ± 0.28 a
424.08 ± 0.45 a5.10 ± 0.28 b5.36 ± 0.75 b
Ex. K (mg kg−1)0488 ± 46.2 a457 ± 30.6 a497 ± 45.2 a
42302 ± 3.02 a315 ± 0.24 b351 ± 0.13 c
DB: bulk density; SOC: soil organic carbon; NH4+-N: ammonium–nitrogen; NO3-N: nitrate–nitrogen; N: nitrogen; Ava. P: available phosphorous; Ex. K: exchangeable potassium. The values followed by the same superscript letters within a row are not significantly different (p > 0.05) between relevant treatments.
Table 4. Volume of the leachate from the soil columns after each flushing with DI water (n = 3).
TreatmentsVolume of the Leachate (mL)
Incubation Time (Days)
471421283542
CK530 ± 45 b539 ± 55579 ± 39598 ± 287625 ± 21624 ± 82633 ± 08 b
WB300378 ± 63 a459 ± 53539 ± 23577 ± 18600 ± 22598 ± 08597 ± 11 a
WB600377 ± 05 a426 ± 55488 ± 110525 ± 64570 ± 05598 ± 10578 ± 24 a
The values followed by the same superscript letters within a column are not significantly different (p > 0.05) between the relevant treatments.

