Article

A Dual Source of Phosphorus to Lake Sediments Indicated by Distribution, Content, and Speciation: Inle Lake (Southern Shan State, Myanmar)

1
Department of Physics, University of Mandalay, 73 Street, 05032 Mandalay, Myanmar
2
Department of Earth and Environmental Sciences, University of Pavia, Via Ferrata 9, I-27100 Pavia, Italy
3
Earth Sciences Department, University of Pisa, Via Santa Maria 53, 56126 Pisa, Italy
*
Author to whom correspondence should be addressed.
Water 2020, 12(7), 1993; https://doi.org/10.3390/w12071993
Submission received: 12 June 2020 / Revised: 7 July 2020 / Accepted: 9 July 2020 / Published: 14 July 2020
(This article belongs to the Special Issue Geochemistry of Water and Sediment)

Abstract

:
In this study, grab and core sediments from Inle lake were collected and analysed for their water and organic matter (O.M.) contents. Total phosphorus (TPSMT) and P fractions, namely inorganic-P (IP), organic-P (OP), P bound to Al, Fe and Mn oxy-hydroxides (Fe-P), and calcium-bound P (Ca-P) were determined by a sequential extraction procedure. TPSMT varied considerably (152–1980 mg/kg), with minimum concentrations detected at sites away from the main inflow rivers and maximum concentrations in the floating gardens area. In core sediments, TPSMT concentrations tended to decrease with depth, reaching values of <100 mg/kg. Concerning P forms, the overall abundance sequence in grab sediments was IP >> OP and Ca-P ≥ OP > Fe-P, whereas in core sediments it showed marked differences with depth and between sites. The relative abundance of the inorganic species (Ca-P, Fe-P) was controlled by the mineralogy of the sediments. While the TPSMT distribution pointed to an increased anthropogenic input, the relative abundance of P species provided information on the P origin, incorporation processes, and evolution over time. This information, combined with chemical and mineralogical data, permitted to identify two different P sources: the agricultural input in the floating gardens area and the detrital input related to soil erosion.

1. Introduction

Lake eutrophication is accelerated by nutrient pollution, one of the most widespread water quality problems worldwide [1]; it is estimated that it affects water quality in 28% of the lakes in Africa, 41% in South America, 48% in North America, 53% in Europe, and 54% in Asia [2]. The process of eutrophication can occur naturally over thousands of years [3]. Nevertheless, human activities have dramatically increased the level of eutrophication by discharging nutrients, such as phosphates and nitrates, into aquatic systems [4]. Phosphorus (P) is recognised not only as a primary nutrient for aquatic ecology but also as the most critical limiting nutrient for lake productivity [5]. Since its oversupply can lead to eutrophication of lakes [6,7], a reduction of the phosphorus content is usually essential to improve lake water quality and ecological state [3,8,9]. The main sources of phosphorus in lakes are external point and non-point sources, such as terrestrial runoff, rainfall, soil leaching, and industrial and municipal effluents. These are also indicated as the external load, to distinguish them from the internal load, corresponding to the release from sediments [3].
Sediments play an important role in the retention or release of P and have a major impact on the functioning of shallow lakes [10,11]. A number of different mechanisms might induce internal P release in shallow lakes, depending on a variety of physical, chemical, and biological factors [12,13]. In particular, sediments have been considered to play a significant role in the period following a reduction in external nutrient loading. They may serve as an important internal nutrient source until the pool of accumulated and releasable P has been buried deep and permanently in the sediment. Where the annual P retention is negative or considerably lower than predicted from empirical models [14], this internal load typically persists for about 10–15 years [15], although the duration is highly variable depending on the loading history and the capacity of the sediment to retain P [16].
Ecosystem studies on shallow lakes have identified two main alternative stable states: one is dominated by submerged macrophytes (clear-water state), and the other has a high algal biomass (turbid state) [17]. Authors have remarked that increased nutrient concentrations do not seem to have much effect on water transparency until they exceed a critical threshold, at which point the lake shifts abruptly from clear to turbid [18,19]. This critical nutrient level, which requires aquatic ecosystem modelling for its definition [20], depends on many factors such as lake size, depth, and climate and on whether any alternative stable states are present, characterised by different groups of primary producers [21]. Nevertheless, the identified shift between a clear and a turbid state is one of the most dramatic changes observed in shallow lakes subject to human-induced eutrophication. In this case, a positive feedback mechanism between phytoplankton production and P release acts to accelerate the transition into the alternative state [18,22,23].
To evaluate the extent to which P levels in lake sediments affect lake eutrophication, it is more efficient to consider the contents of different P fractions rather than total P content. Information about the different chemical P fractions in lake sediments is useful in understanding whether the sediment acts as an adsorber or a source of phosphorus. The association of phosphate with iron, aluminium, and calcium and the adsorptive properties of carbonates and clays are of special interest [24,25].
Wetlands are recognised as providers of ecological goods (e.g., water for irrigation and domestic use, fisheries, recreation) and services (e.g., carbon sequestration, flood control, groundwater recharge, nutrient and contaminant removal, biodiversity maintenance) but are threatened worldwide by rapid urbanisation, industrialisation, and agricultural intensification, resulting in a reduction of their areal extent and a decline in the functions they perform [26]. Inle lake (Southern Shan State, Myanmar) is a perfect example of an ecosystem that is suffering from environmental degradation due to the combined interaction of multiple stressors, such as changes in land use pattern, nutrient discharge from urban areas and agriculture fields, excess siltation from watershed erosion, and changes in microclimatic condition (e.g., temperature and rainfall patterns) [27,28]. In 2018, Inle lake was included in the list of wetlands of international importance as the fifth site of Myanmar (Ramsar convention; [29]), though it witnessed degradation in its water quality and lake status due to an increase in anthropogenic pressure and agricultural and industrial activities.
Concerning phosphorus as the main driver of eutrophication, previous studies mostly focused on the characterisation of Inle lake waters, providing relatively little information on the trophic status and on the environmental impact of the different anthropogenic activities. An assessment of surface lake water quality, conducted in 2004 [30], indicated that the concentration of PO4-P was relatively high (7.8 to 28.1 μg/L) and that phosphorus may derive from domestic and agricultural sources. This study concluded that the lake was eutrophic and suggested that more extensive studies be carried out due to the rapidly evolving socio-environmental conditions. Similar figures and conclusions were obtained by Lwin et al. [31], who found PO4-P concentrations of up to 69.3 μg/L and identified some “hot spots” of contamination near the villages and in the floating gardens area. Mjelde et al. [32] conducted three extensive monitoring campaigns for water quality (at 14 lake stations, at the main tributaries and at the outflow) in different years and seasons, including phytoplankton and macrophyte assessments. The nutrient concentrations measured in the centre of the lake were generally low but increased close to the shores and in the inflow waters. Nevertheless, they indicated that most of the nutrients were not available for phytoplankton growth, highlighting the role played by the large stands of aquatic macrophytes covering the lake bottom and suggesting that high amounts of phosphorus were likely to be stored in the sediments. Based on the nutrient concentrations, they concluded that Inle lake showed mesotrophic to semi-eutrophic conditions. Finally, in the frame of an integrated assessment of water resource quality on a catchment scale, Re et al. [33] analysed the P content of both surface and groundwater. Results indicated a low P content (median 15.6, average 17.1 μg/L) and a high N:P ratio, suggesting that P may be the limiting nutrient for this freshwater ecosystem. They attributed this low P concentration to endogenic Calcite precipitation, an effective process sequestering P in a mineral form and making it unavailable for the development of organic matter [34]. This internal mechanism of P removal, combined with the low water residence time, would prevent the accumulation of this nutrient in lake waters but would inevitably transfer it to sediments.
While there are only a few studies available that have addressed the P content in lake waters, there are even fewer that have fully characterised Inle lake sediments, with the exception of a small amount of mineralogical and isotopic data [35] and some pollen, charcoal, diatom, and 14C data from a very recent palynological study [36]. The aim of this study is therefore to fill this knowledge gap by analysing grab and core sediments to investigate the phosphorus content, speciation, distribution, and origin. The overall goal is to define the lake status, evaluate the role of sediments as a P source or sink, and highlight the danger represented by the changing environmental conditions and increasing anthropogenic impact, as a premise for the correct management of this valuable water body. Another paper [37] reports the mineralogical, morphological, and geochemical characterisation of the Inle lake sediments, allowing us to identify allogenic minerals and their associated chemical constituents, to describe the natural sedimentation patterns and to highlight the recent anthropogenic disturbances that may pose threats to the ecosystem and to the population.

2. Study Area

Inle Lake is located in Southern Shan State, Taungyi District, Nyaung Shwe Township (UTM 47Q 282178 N latitude, 282178 E longitude) at an elevation of about 884 m a.s.l. (Figure 1).
The basin has a humid subtropical climate with three seasons: March to June (summer), July to October (rainy), and November to February (winter). Average daily humidity ranges from 48% in March to 79% in the rainy season, and mean air temperature near the lake ranges from 22 °C to 31 °C [38]. Mean annual precipitation recorded from 2000 to 2013 is of 984 mm [39]. Rainy days are generally 80 per year, 70% of which occur during the southwest Asian monsoon season [36].
Inle lake is the second largest lake in Myanmar. Presently, the lake has an approximate length of 17.5 km and width of 5 km [28]. It is situated in a large, flat tectonic depression surrounded by mountain chains reaching 1200 m a.s.l. at their highest. The lake is fed by 30 streams, of which 17 come from the east and 12 from the west. The major inflow, from the north, is the Nanlit stream, which flows by the main town of Naung Shwe, located about 2 km N of the lake; the only outflow, to the south, is the Thanlwin River [40]. Other perennial inflows are the Kalaw and Indein steams, which are characterised by two remarkable birdfoot-like deltas ([41]; Figure 1), whereas the eastern lake side is steeper due to the proximity of the mountain range.
Inle lake has been classified as a shallow freshwater lake. Butkus et al. [27] report a depth that ranges from approximately 4 m in the hot dry season to 7 m in the rainy season. Nevertheless, in recent years, especially in 2010, the lake has experienced dramatic drops in the water level in summer [42]. A recent bathymetric survey indicated an average dry season open water depth of ~1 m in April 2015 and 2016 and an average rainy season depth of 2.2 and 2.5 m in October 2015 and 2016 and showed that the maximum lake depth (3.18 m) had halved since 1918 [28]. Su et al. [40] estimated a watershed area of 5612 km2, a lake volume of 3.5 × 10⁷ m3, an annual inflow water volume of 1.13 × 10⁸ m3 year−1, and a water residence of 0.32 years. More recently, Michalon et al. [28] quantified the entire lake flood zone (open water, floating gardens plus fringe wetland) as ~126 km2 in the 2015 rainy season and ~94.4 km2 in the 2016 dry season, and, combining this information with bathymetric results, they estimated a lake volume of 122.6 × 10⁶ m3 in October 2015 (highstand) and 50 × 106 m3 in May 2016 (lowstand).
The land use pattern in the Inle Lake for 2003 reported about 38% (627 km2) of the total area of 1647 km2 under open water and only 24% (393 km2) used for agriculture (floating gardens), the remaining 38% (627 km2) being covered by floating vegetation, settlements and other forms of gardening and farming [43]. Concerning the catchment, a survey dated 2010 indicated that agricultural land occupies 42% of the area, forest with sparse canopies 16%, while other forms of land use and water surface areas account for 35%. Forest with dense canopies only remains on 7% of the catchment [43]. An analysis of land use and cover changes in the last 40 years indicates that the dominant landscape transformation processes were urbanisation (+203%), crop expansion (+34%) with a particular increase of floating gardens (+390%), land abandonment (+167%), deforestation (−49%), and wetland losses in marshlands (−83%) and water bodies (−16%) [44].
The basin is located in the Shan Plateau, which belongs to the Sibumasu block [45] and is mainly constituted by Permo-Triassic carbonates [46]. The catchment is located about 100 km E of the tectonically active Sagaing fault, an important continental transform fault between the India and Sunda plates [47]. In Myanmar, recent tectonic activity, and in particular the movement of the eastern Himalayan syntaxis, condition the development of the hydrographic network [48]. Neotectonic studies [49,50] indicate that the lake catchment develops along a right-lateral strike-slip fault, parallel to the Sangaing fault. The Taunggyi normal fault borders the lake on the east side, causing the asymmetrical shape of the basin (Figure 1), and influencing the sediment transport and the development of the river deltas [49]. Moreover, due to the catchment topography, some areas are flooded during the monsoon period in response to the increase in the lake water level [28]. In the past, these floodable areas, mostly located to the N and W of the present-day open water surface (dark-green areas in Figure 1), were likely a swamp, and the straight course of the Nanlit stream, S of Naung Shwe, indicates that the northern sector is reclaimed land.
Anthropic activities on the lake sides and in its watershed are known to seriously threaten the Inle lake environment [27,30,33,40,41,44,51].
One of the main problems is the decrease in the open water surface, estimated to as much as 32.4% over a 65-year period (1935–2000) [41] and to about 23% in the period 1967–2014 [28]. This is partly due to an increase in sedimentation caused by deforestation in the watershed [40]. The resulting accelerated soil erosion mostly affects the western uplands characterised by unsustainable land use practices combined with a steep topography. The average soil loss rates are approximately quantified as 19.9, 10.1, and 26.2 t ha−1 in the years 1989, 2000, and 2009, respectively [51]. Another reason for this shrinkage is the expansion of floating gardens, which are a typical agricultural system that makes the boundary between land and water remarkably unclear [28]. The system, locally known as ye-chan, involves the cultivation of hundreds of hectares of floating “islands” that produce enough tomatoes and other vegetables to drive the region’s economy [52]. Floating tomato gardens (a sort of hydroponic cultivation technique) used by the local residents are concentrated mostly in the western part of the lake. These gardens are created by using the dead parts of aquatic and marsh plants as a growing medium for planting fruits, flowers, and other vegetables. Once the fertility of these dead aquatic and marsh plants has been exhausted, they are transported to the perimeter of the lake, thus contributing to the apparent disappearance of the lake surface.
Another serious problem is the quality of the lake water. As in many other low-income countries, the population increase, with an exponential growth rate of approximately 2.3% per year [40], is not matched with adequate sanitation infrastructure. This anthropogenic pressure is expected to grow in the future because of the development of tourism in the area [53]. In addition, agrochemicals are widely used in floating gardens, especially for tomato cultivation [30], and the unregulated use of pesticides affects the transparency of the lake water, threatening the biological diversity of local flora and fauna [27,40]. More recently, Pradhan et al. [54] analysed the anthropogenic drivers of environmental change and comprehensively evaluated the state of the ecosystem. They confirmed a progressive decline in dissolved oxygen over the decade 2001–2011, related to high waste organic loading and anaerobic silt on the lake bottom, and reported that Inle lake was becoming shallower year by year because of sedimentation and deposition of dead biomass.

3. Materials and Methods

The field sampling was carried out in March 2014 (hot dry season). The sampling stations were selected on the basis of their position and environmental setting, to ensure full coverage of the lakebed area and proximity to potential sources of pollution (Figure 1, Table 1). Sixteen grab sediment samples were collected with a stainless-steel, Ponar type sampler, immediately placed in plastic containers, and tightly sealed to prevent oxidation. In addition, at selected locations, sediment cores, from 40 to 85 cm in length, were collected with a sampler prototype (handmade), which allows for careful recovery of the sediment–water interface [55] (Table 1). On the same day as collection, cores were cut into 5 cm long slices, wrapped with polythene foil to prevent oxidation, and put into a polyethylene container. All sampling tools were washed with lake water before the next sample was collected. The sediment samples were then transported to the laboratory at the Department of Earth and Environment Sciences, University of Pavia, Italy. Due to their high organic matter content, grab samples were preserved frozen, while core sediment samples were stored in the dark in a refrigerator prior to analysis.
In the laboratory, the sediment samples were dried at room temperature for 2–3 days. Large shells were eliminated by manual picking, and air-dried sediment was ground to a fine powder in an agate mortar. The full morphological, mineralogical, and geochemical characterisation of the sediment samples is reported elsewhere [37,56].
The water content was determined on 200 mg of air-dried sediment, heated at 105 °C for 2 h, cooled in a desiccator, and weighed again on an analytical balance. The organic matter (O.M.) content was subsequently determined by heating the oven-dried sediments at 450 °C for 3 h. This relatively low temperature of ignition can cause an underestimation of the total O.M., as the decomposition of the more thermally stable humified organic substances is only completed at 530–540 °C [57]. However, a lower temperature represents a compromise between a substantial, if not complete, destruction of O.M. and a limited mineral dewatering, which can be critical especially for clay-rich materials.
Total phosphorus content and P fractions were investigated by a sequential extraction procedure following the standards, measurements, and testing (SMT) protocol proposed by [58,59]. This procedure was selected for its simplicity and because results can be compared among sites, although some authors report that it may underestimate the NaOH-extractable P fraction due to partial resorption on carbonates [60]. The extracted solutions were analysed for their P content using the molybdenum blue method [61]. All reagents were analytical grade, and distilled water was used throughout to control the quality of analysis. All glassware was washed with hot diluted HCl and rinsed with distilled water before use. For the measurements, the spectrophotometer HACH DR 2800 was set at 880 nm, and cells with a light path of 20 mm were used [62].
In the SMT protocol, concentrated HCl-extractable, also indicated as total phosphorus (hereafter referred to as TPSMT), was extracted from the sediment samples using 3.5 M HCl. The other P fractions considered in this study were the following:
  • Inorganic-P (hereafter referred to as IP), extracted using 1 M HCl;
  • Organic-P (hereafter referred to as OP), extracted on the same aliquot of IP, after calcination at 450 °C, using 1 M HCl;
  • NaOH-extractable P (also indicated as P bound to Al, Fe and Mn oxy-hydroxides, hereafter referred to as Fe-P), extracted using 1 M NaOH;
  • HCl-extractable P (also indicated as calcium-bound P, hereafter referred to as Ca-P), extracted on the same sample aliquot of the previous fraction, using 1 M HCl.
The concentration C, in mg/kg of P (dry weight) is derived from the equation:
C = (SV/(1000 × m)) × 103
where S = P concentration in the extract in mg/L of P; V = volume of reagent used for extraction (20 mL), and m = mass of the test sample (200 mg dry weight).
Since it is assumed that
TPSMT = IP + OP = (Fe-P + Ca-P) +OP
an internal control of the results was performed by comparing the sum of IP and OP with TPSMT (mean error 15%), and the sum of Fe-P and Ca-P with IP (mean error 16%). Duplicates were analysed when the internal control indicated elevated errors (>30%) or when the results were close to the detection limit.
To further strengthen the interpretation of the P results obtained with the SMT protocol, they were compared with the results obtained by total digestion (TPTD) and analysis with ICP-MS at ACTLABS Ltd. (Ancaster, ON, Canada) and with the results of the mineralogical composition of the sediments, determined by XRPD [63]. These data, available on a larger number of sites and sediment samples, are presented and discussed elsewhere [37,56]. To combine the P distribution patterns with the geochemical and mineralogical composition of the sediments, a Principal Components Analysis (PCA; e.g., [64]) was conducted using the SPSS software (version 16.0 for Windows®, SPSS Inc., Chicago, Ill., USA, [65]). The PCA was performed on 82 observations (i.e., all the grab and core sediment samples included in [63]) considering all the elements determined by TD and the mineral abundances (50 variables). Elemental concentrations below detection limits were substituted by a positive value of half the detection limit [66]. Factor loadings obtained from the PCA allowed us to identify the variables grouped in each factor. Furthermore, the factor scores of each sample were saved and further elaborated to classify the different sampling sites based on their affinity to the grouped variables.

4. Results

The water content of the collected lake sediments is generally low, ranging from 0% to 9%. However, there is a marked difference in O.M. contents at different sites, ranging from 5% to 60% (Table S1 in Supplementary Materials). The O.M. contents in sediment at sites 4/2 and 4/3 are higher than those at the other sites, which is likely to be due to the agricultural waste from the floating gardens (Figure 1).
In grab samples, TPSMT varied considerably (Figure 2a), ranging from 152 to 1980 mg/kg, with the minimum concentrations detected at sites 3/2 and 11, located far from the main inflow rivers, and the maximum concentrations detected at sites 4/1, 4/3, and 4/2 in the floating gardens area. In core sediments, TPSMT concentrations generally tend to decrease with depth (Figure 3), reaching values of <100 mg/kg at the bottom of the core at site 3/1. This trend is further confirmed by TP determined by total digestion data (TPTD) available on a larger number of core samples [63]. The TP distribution in the lake area and with depth in the sediment cores strongly suggests an increased input due to anthropogenic activities.
Concerning the P speciation, in grab sediments, OP and IP range from 47 to 570 mg/kg and from 53 to 1452 mg/kg, with an average concentration of 196 mg/kg and 363 mg/kg, respectively (Table S1). Within the Inorganic-P forms, Ca-P (range 38–1072 mg/kg) is dominant over Fe-P (range 19–189 mg/kg) (Figure 2b). The overall abundance sequence in grab sediments is generally IP>>OP and Ca-P≥OP>Fe-P. Therefore, assuming the sum of OP, Ca-P and Fe-P is equal to 100% P content of the sediment, these forms account for an average of 43%, 44%, and 13%, respectively (Figure 2c). In core sediments, all the P species tend to decrease with depth, as is observed for TPSMT (Figure 3). Nevertheless, their relative abundance shows marked differences between sites. For example, the OP fraction accounts for more than 40% of TPSMT at site 2, at the river inflow, and decreases to about 15% at the bottom of the core at site 4/2; Ca-P accounts for about 30% of TPSMT at site 2 and reaches more than 80% at site 4/2; and Fe-P accounts for about 30% at site 2 and shows a mean value of about 10% at the other sites (Figure 4). These differences in absolute and relative concentrations for the P species with the sample location and depth point to different P sources, incorporation, and evolution in time as preserved in the sediment record.
Concerning the PCA, the value of 1227 × 104 for the Bartlett chi-square statistic (1225 degrees of freedom and a minimum significance level of 0.000) applied for Bartlett’s sphericity test indicates the existence of a good correlation between the variables. Moreover, the measure of sampling adequacy (MSA) obtained by the Kayser–Meyer–Olkin (KMO) measure returns a rather high value (0.875), validating the PCA application. To reduce the overlap of the original variables over each factor, a Varimax rotation was performed [67]. The PCA results are presented in Table S2 in Supplementary Materials, including the loadings, the eigenvalues, the amount of variance explained by each factor, and the cumulative variance.

5. Discussion

5.1. Identification of P Bearing Phases

The P forms determined using sequential extraction procedures are operationally defined and are related to specific reagents and procedures [60]. Nevertheless, the comparison with other parameters of the sediment (i.e., O.M. content, mineralogical composition, other chemical constituents) may allow for the derivation of the P related to a specific phase of sediment. This is of utmost importance since not all the P forms are likely to be released from the sediment and become bioavailable and are therefore likely to increase eutrophication.
Comparing TP determined with two different techniques (TPTD and TPSMT), a significant correlation between the two parameters is observed (n = 50; r = 0.90; p << 0.01). Nevertheless, TPTD is always higher than TPSMT, by about 30%, with a higher discrepancy for 6 grab sediments with high TP. If these data are eliminated, the correlation strongly improves (n = 44; r = 0.99; p << 0.01) and the discrepancy is reduced to about 7%. This correlation confirms that TPTD and TPSMT are both reliable and provide the same information and therefore can be used indifferently in the discussion.
A correlation matrix was calculated by taking into account the sediment data (water content, O.M. content, TP, P forms, Table S1) and the mineralogical composition (extracted from [63]). The results are presented in Table S3 in Supplementary Materials. It is interesting to note that the sediment data are all well correlated to each other. The most significant correlations (p << 0.01) are those between O.M. and water content, between TPSMT and all the P forms, between OP and the water and O.M. contents, between IP and Ca-P, and between Fe-P and OP (Table S3). Furthermore, the mineralogical abundances are well correlated to each other, although this is partially expected since their content is expressed in % (these mineralogical correlations are discussed in detail in [37]). Little correlation is found between TPSMT (and all P forms) and the mineralogical composition, with the exception of Hematite. This observation seems to confirm a possible organic origin for Hematite, rather than detrital, as discussed in [37].
More informative correlations are those observed between the relative abundance of the inorganic P forms (Fe-P or Ca-P) and the mineralogical data. Fe-P (%) is positively correlated (p << 0.01) with Kaolinite, Mica/Illite, and Quartz (n = 54, r = 0.571, r = 0.556, and r = 0.427, respectively) and negatively correlated (p << 0.01) with Calcite (r = −0.516) and Aragonite (r = −0.387). Accordingly, Ca-P (%) is positively correlated (p << 0.01) with Calcite (r = 0.453) and negatively correlated (p << 0.01) with Mica/Illite and Kaolinite (r = −0.512 and r = −0.488, respectively).
Kaolinite, Mica/Illite, and Quartz have been identified as allogenic phases, based on their morphology and occurrence in lake sediments. They are often present in coarse grains and aggregates, testifying to their origin from soil [37,56]. On the other hand, Calcite may have different origins, although morphological and hydrochemical data indicate that it is mostly related to endogenic precipitation [35,37].
The correlations observed between the sediment data and the absolute P content and forms (especially that between the O.M. and water content with OP) seem to confirm that the O.M. input may represent an important source of this nutrient to the system, coming both from soil erosion or due to agricultural activities. This finding is in agreement with [54], who suggested that the observed decline in dissolved oxygen in lake waters in recent years was related to the high waste organic loading and deposition of dead biomass, also contributing to the decrease in depth of the lake. In addition, our data suggest that, while the TPSMT and the absolute P forms contents are determined by the location of the site in the lake area (i.e., to the proximity to the P source(s) to the lake), the relative abundance of the inorganic species is strongly controlled by the mineralogical composition of the particles, which in turn is a function of the sediment depositional processes (i.e., whether detrital minerals or endogenic minerals dominate). As a consequence, we turned to the examination of the P distribution in the lake sediments.

5.2. Phosphorus Distribution in Lake Sediments

The spatial distribution map of TPSMT was obtained by interpolating the results from grab sediments. Indeed, a comparison of these data with those of the top layers of the sediment cores (Table S1) shows a good agreement with the first 5–10 cm layers, and this is further confirmed by the comparison of the chemical and the mineralogical composition [37,63]. Such spatial interpolation, using the inverse squared distance method, provides the map shown in Figure 5.
The highest contents of TPSMT are found at sites 4/1, 4/3, and 4/2. These locations are within the floating gardens area: 4/1 and 4/3 are in the agricultural zone and 4/2 is located in the middle of the Kaylar village. At the first two locations, evidence suggests that the high P content is related to the use of synthetic fertilisers for cultivation. Indeed, the dominant P form here is IP and more specifically Ca-P, accounting for more than 50% (and up to 65%) of TPSMT. In addition, Thin et al. [56] was able to detect Apatite grains in the sediments of these sites. Furthermore, site 4/4, located in proximity of 4/3 but towards the centre of the lake, where the floating gardens are absent, shows a much lower TPSMT concentration. A similar agricultural origin for TPSMT can be envisaged for site 9, also located in proximity to cultivated areas, but with much lower concentrations. On the other hand, site 4/2 may also receive a contribution from civil sources (such as domestic and sewage effluents).
High TPSMT concentrations are also detected at sites 1 and 2. These represent the sediment transported by the Nanlit stream and the lake sediment at the stream inflow into the lake, respectively. This allows the attribution of this TPSMT to the detrital input contributed by the watershed, through soil erosion and transport by surface waters. It should be noted that at site 2, the second highest concentrations of OP and Fe-P were detected, following the highest concentrations at site 4. During soil erosion, orthophosphates can be leached out of the agricultural soils and adsorbed directly on the stream sediments or on suspended particles that later sediment in the stream. This adsorption is partly dependent on the availability of oxy-hydroxides of Al and Fe in the suspended particles [68] (Singh et al., 2005). Macroscopic and microscopic observations of the sediment particles reported by [56] and [37] highlight the presence of coarse grains and aggregates (often reddy brown), which are typical of tropical red soils, and a larger proportion of detrital minerals in these samples [63]. The influence of the detrital P input is likely to extend towards the centre of the lake, reaching site 3/1, which displays a distinctively higher TPSMT than sites 3/2 and 3/3. Indeed, the Nanlit stream course, while crossing the northern part of the Inle lake basin, appears to have been rectified (Figure 1) and is periodically dredged to facilitate motorboat circulation [28]. The large input of sediments carried by the stream can also be observed in satellite images, where an important fan extends from the Nanlit entrance to the lake to more than 2 km south [35]. It is interesting to note that the TPSMT distribution map for the lakebed area (Figure 5) compares nicely with the map of total P in surface waters reported by [33]. A significant (p << 0.01) correlation exists between the two parameters (n = 13, r = 0.76), despite the fact that sediments were sampled in summer 2014 and waters in winter 2015, and the same contamination hotspots are identified, corresponding to the Nanlit stream (site 1), its entrance to the lake (site 2), and the floating gardens area (sites 4/1, 4/2, and 4/3). Therefore, the sediments closely reflect the P content of surface waters and can be used to identify the areas of higher anthropogenic impact. Additionally, the correlation suggests that the sediments are presently acting as a sink for the P input to the lake.
Additional support to the identification of the sources is provided by the P distribution with depth in the sediment cores (Figure 3), which, as already described, is characterised by high concentrations in the top layers and low concentrations in the bottom layers. This is particularly observed in the cores collected at sites 4/3 and 3/1, where the lower bottom values could be representative of the natural P background before the anthropogenic disturbances. This observation is further confirmed by the analyses of TPTD [63], also decreasing with depth and reaching the low values that characterise some uncontaminated sites located away from P sources (e.g., sites 3/2, 10, and 6). At site 2, the TPSMT distribution does not significantly change with depth, which is likely to be because the sediment affected by the allogenic inputs by the inflow stream is very thick, and background values are not reached at depth (see also the discussion in [37]). This distribution of TP and P forms with depth confirms the anthropogenic disturbance of the P cycle at Inle lake.

5.3. Characterisation of the Anthropogenic Phosphorus Inputs

The discussion above suggests that the lowest TPSMT values recorded in the bottom layers of core 3/1 and core 4/2 may represent the natural background concentrations and relative proportion of P before the advent of anthropogenic disturbances. If this is correct, an indication of anthropogenic P content and forms delivered to the lake can be obtained by subtracting these background values from the other sediment layers.
Due to the differences in the environmental setting of the lake area, we considered the bottom layers of core 3/1 as representative of the background value of TPSMT and of the P forms for core 3/1 and core 2. Therefore, we subtracted these values from those of each layer to obtain the results shown in Figure 6. In core 2, the anthropogenic input is dominantly in the form of OP, accounting for more than 50% of the P forms, followed by Fe-P (between 25% and 10% from top to bottom) and Ca-P (between 15% and 45% from top to bottom). On the other hand, in the top layer of core 3/1, the dominant form is still that of OP (around 45%), but the relative proportion of Fe-P is much lower (generally less than 10%) in favour of Ca-P, which accounts for about 50% of the anthropogenic P forms. The same calculation can be performed for cores 4/2 and 4/3, using the value displayed by the bottom layer of core 4/3 as a background value. In this case, the Ca-P form is the dominant one of the anthropogenic P forms (generally more than 50% but reaching up to 90%), followed by OP (around 35%) and Fe-P (10–15%).
This information is crucial to understand the ability of the sediments to store or release P. Indeed, it is generally acknowledged that Ca-P, related to the presence of Apatite and Apatite-like minerals (including carbonates), is a relatively stable and non-bioavailable phosphorus form. Calcite is naturally present in the sediments of Inle lake, as it derives from the calcareous rock that is present in the watershed [46] and is precipitated from lake waters both as endogenic and as authigenic Calcite [33,35,37]. As a consequence, the high Ca-P contents detected in the floating gardens area should have little repercussions on the trophic state of the waters. Furthermore, due to the alkaline character of the Inle lake waters, it is likely that part of the P carried by the rivers or released by the sediments during O.M. degradation may be immobilised in endogenic or authigenic Calcite. This could be the case of the top layers of the core collected at site 3/1, where Ca-P is the most abundant P form.
On the other hand, OP can easily be released by the sediments during O.M. degradation. In this regard, the high percentage of the anthropogenic OP form, detected both at the Nanlit river inflow and in the floating gardens area, should be considered alarming. In the former case, the sources of OP are likely to be related to soil erosion and civil input from the city of Nyang Shwe; in the latter case, OP is derived from the dead parts of the cultivations. This conclusion is in agreement with the findings of [54], indicating a strong input of O.M. in the lake area and suggesting that its degradation may be at the origin of the decrease in DO registered in lake waters. The potential establishment of anoxic conditions is extremely worrying, as these could affect the Fe-P contents. Indeed, the reduction of Fe oxy-hydroxides in the sediment is generally acknowledged as the main mechanism by which P can be released from the sediments and can constitute the internal P load in eutrophic lakes [24,69]. In the case of Inle lake, it seems that oxygenated conditions at present are maintained in the water column throughout the year, as a combined effect of the low depth and fast circulation [33]. Nevertheless, the input of O.M. to the lake should be carefully monitored, and action should be taken to prevent shifting to anoxic conditions that could trigger a positive feedback mechanism of P release from the sediments [23].

5.4. Characterisation of the Dual Phosphorus Sources

As previously discussed, the spatial variation in P content with different sites can be ascribed to a set of differences in the natural setting and in anthropogenic impacts, such as agricultural practices (application of chemical fertilisers and pesticides) and soil erosion in the lake catchment areas. If so, not only P but also other elements should reflect these differences. The elaboration of the chemical and mineralogical data with the PCA may provide addition support to the interpretation.
The PCA analysis provided six principal factors with eigenvalues greater than 1, which explain a high percentage (around 90%) of the total variance in all samples (Table S2) and allow for the grouping of the variables in a geochemically reasonable and interpretable manner.
  • Factor 1 (F1), accounting for 60% of the total variance, is composed of the high positive loading for silicates (Kaolinite, Mica/Illite, and Quartz) and numerous elements (Ba, Be, Li, Na, K, Rb, Cs, Al, Fe, Mn, Co, Cr, Cu, Ni, Pb, V, Zn, Tl, Bi, Sn, As, Ag, Sc, Ti, Y, Zr, La, Ce, Hf, and Th). This factor reflects the binding of these elements to allogenic minerals. It is also characterised by the high negative correlation with Calcite content. The strongly bipolar character of the sediment mineralogy reflects the antithesis between detrital input and endogenic Calcite precipitation (see also the discussion in [37]). High factor scores for F1 are observed at or near inflow water (sites 1 and 2), indicating a detrital origin of these elements and minerals contributed to the lake by the erosion of the rocks and soil in the watershed.
  • Factor 2 (F2) resulting from the analysis explains 10% of the total variance and is mostly composed of the positive relation of P, U, Cd, Mo, and Sb. This factor can be considered as the “P pollution factor” due to the association of this element to other trace elements that are commonly found in phosphate fertilisers [70,71,72]. High scores of F2 are recorded at sites 4/1, 4/2, and 4/3, in the floating gardens area, further supporting this interpretation.
  • Factor 3 (F3), accounting for 8% of the total variance, is associated with the positive loadings for W, Nb, and Ta and the negative loading for Dolomite. These elements are classified as High Field Strength Elements (HFSE) and have similar geochemical behaviour. This factor is not clearly attributable to a natural or an anthropogenic process. Dolomite displays a low communality value (0.300), indicating that the factors do not adequately explain its variance. The attribution to this factor is uncertain, partly due to the relatively low number of samples showing the presence of this mineral [63].
  • Factor 4 (F4), accounting for 6% of the total variance, is characterised by the negative loading for Ca, Mg, and Sr. This factor can be assumed as the carbonate pole as indicated by the excellent correlation of F4 with Mg and Sr, while the lower correlation with Ca could be due to the fact that concentrations of these elements above 50% could not be adequately assessed with the analytical method used.
  • Factor 5 (F5), accounting for 4% of the total variance, is associated with the negative loading for Aragonite and Hematite and may be related to authigenic minerals of a biogenic origin [37].
  • Factor 6 (F6), accounting for 2% of the total variance, is composed of Au and S. This factor cannot provide significant information as the two elements are only present in very small amounts which are close to the detecting limit.
Overall, F1 + F2 explain more than 70% of the cumulative variance of the dataset. Concerning the dual origin of P, a clear distinction can be observed between sites by plotting TPTD with respect to F1 scores (Figure 7). Two different trends of increasing P concentrations are observed. The first one (displayed by samples from sites 1 and 2), which also corresponds to an increase in F1 values, highlights the presence of a detrital input enriched in both major and trace elements in areas close to the inflow of major rivers and can be attributed to soil erosion. The second trend (displayed by samples from sites 4/1, 4/2, and 4/3), which is not associated to an increase in F1 values, is related to the impact of human induced pollution, mainly associated with agricultural activities in the floating gardens area and with civil sources of P. In this interpretation, site 4/1, displaying high P content but also a relatively high F1 score, is impacted by both the detrital inputs from the stream situated on the western side of the lake and by agricultural activities. It is worth noting that this conclusion, fully in line with that obtained with TPSMT and the P forms contents, is derived from the elaboration of an independent dataset [63], further supporting the interpretation.

6. Conclusions

In this study, Inle lake sediments (both grab and core samples) were analysed for their water and O.M. contents, for their total phosphorus concentration, and P fractions, the latter determined by a sequential extraction procedure (SMT protocol).
The TPSMT distribution in the lakebed area and with depth in the sediment cores (i.e., over time) pointed to an increased input due to anthropogenic activities. The main P contamination hotspots corresponded to the floating gardens area, the Nanlit stream, and its entrance to the lake. Concerning P forms, the overall abundance sequence in grab sediments was generally IP>>OP and Ca-P≥OP>Fe-P. In core sediments, the relative abundance of P species showed marked differences with depth and between sites, suggesting that information on different P sources, incorporation processes, and evolution over time was preserved in the sediment record. In addition, the relative abundance of the inorganic species (Ca-P, Fe-P) was strongly controlled by the mineralogical composition of the particles, which in turn was a function of the relative abundance of detrital and endogenic minerals.
Results allowed us to identify two distinct P sources. The first in terms of concentration is the anthropogenic pollution, mainly associated with agricultural activities in the floating gardens area. Nevertheless, the dominant anthropogenic P form identified here was Ca-P, a relatively stable and non-bioavailable form. In addition, the correlation between TPSMT and the P content in surface waters suggests that the sediments are presently acting as a sink for the P input to the lake. Indeed, due to the alkaline character of Inle lake waters, part of the P carried by the rivers or released by the sediments during the O.M. degradation is trapped in endogenic or authigenic Calcite. The second source is the detrital input, enriched in both major (Al, Fe, Mn) and trace elements, mostly affecting the areas close to the inflow of major rivers and related to soil erosion. In this case, the dominant anthropogenic P form was OP, which is more labile and can easily be released during O.M. degradation. Moreover, this process could lead to the establishment of anoxic conditions in the future, which may promote the reduction of Fe oxy-hydroxides and trigger a positive feedback mechanism, further increasing the internal P load. At present, oxygenated conditions are maintained in the water column throughout the year, as a combined effect of the low depth and fast circulation [33]. Nevertheless, the changing climatic conditions and the anthropogenic disturbances are affecting sedimentation and are progressively reducing the open water surface and the depth of this shallow lake [37]. Therefore, action is needed to limit the O.M. input to the lake, to prevent it from shifting to anoxic conditions that would accelerate the transition towards a eutrophic state.
In conclusion, the characterisation of P content and forms in the sediments favoured a better understanding of the sources, the dynamics, and the potential threats posed by this key nutrient. This study represents a replicable approach for assessing the potential role of sediments as a P source for tropical alkaline lakes subject to increasing anthropogenic pressure and climate change. Moreover, the results of our study are fundamental in implementing an effective management strategy for a sustainable economic development of the area that preserves the ecological functions of Inle Lake, in line with the objective set by the Ramsar Convention for wetlands of international relevance.

Supplementary Materials

The following are available online at https://www.mdpi.com/2073-4441/12/7/1993/s1. Table S1: Water, Organic Matter, TP, and relative forms extracted from grab and core sediments from Inle lake. Table S2: Results of the Factor Analysis performed on the chemical and mineralogical data from grab and core sediments from Inle lake. Table S3: Correlation matrix of the sediment data (water content, O.M. content, TP, P forms, Table S1) and the mineralogical data extracted from Thin et al. [63]. Cc = Calcite; Qz = Quartz; M/I = Mica/Illite; Kaol = Kaolinite; Ar = Aragonite; Hem = Hematite; Dol = Dolomite. In red, correlations with p < 0.01; in blue, correlations with p < 0.01 and r ≥ 0.8.

Author Contributions

Conceptualization, E.S. and M.S.; methodology, E.S.; validation, M.M.T. and E.S.; formal analysis, M.M.T. and E.S.; investigation, M.M.T., E.S. and M.S.; resources, E.S.; data curation, M.M.T.; writing—original draft preparation, M.M.T., E.S. and V.R.; writing—review and editing, M.S.; visualization, M.M.T., E.S. and V.R.; funding acquisition, E.S. and V.R. All authors have read and agreed to the published version of the manuscript.

Funding

This study is part of the Ph.D. in Physics of M.M.T., conducted in the frame of the EU Erasmus Mundus project PANACEA (Action 2, Strand 1, Lot-10, grant agreement number 201-2647/001-001-EMA2). Additional data were produced thanks to the CICOPS—Centre for International Cooperation and Development of the University of Pavia, which granted M.M.T. a visiting scientist scholarship. The displacement to Myanmar of E.S., M.S., and V.R. was supported by the Erasmus+ programme, KA107 International Credit Mobility, Outgoing Teaching Mobility Grants 2015–2017 managed by the University of Pavia. The University of Pavia also supported the work of V.R. through the Fondo Ricerca & Giovani funding scheme.

Acknowledgments

The Ph.D in Physics of M.M.T. was conducted under the supervision of Htun Hlaing (Supervisor), University of Lashio, and Kalyar Thwe (Co-supervisor), University of Mandalay (Myanmar). Authors wish to sincerely thank Mya Mya, Yezin Agricultural University, Myanmar for her help through the sampling campaign; Enrico Allais of ISO4 for the construction of the core sediment sampler; and Gianni Tartari, former Director of the CNR Water Research Institute (Brugherio), for lending the grab sampler.

Conflicts of Interest

The authors declare no conflicts of interest. The funders had no role in the design of the study; in the collection, analyses, or interpretation of data; in the writing of the manuscript; or in the decision to publish the results.

References

  1. Granlund, K.; Räike, A.; Ekholm, P.; Rankinen, K.; Rekolainen, S. Assessment of water protection targets for agricultural nutrient loading in Finland. J. Hydrol. 2005, 304, 251–260. [Google Scholar] [CrossRef]
  2. Dokulil, M.T.; Teubner, K. Eutrophication and Climate Change: Present Situation and Future Scenarios. In Eutrophication: Causes, Consequences and Control; Springer: Dordrecht, The Netherlands, 2010; pp. 1–16. [Google Scholar]
  3. Prepas, E.E.; Charette, T.; Prepas, E.E.; Charette, T. Worldwide Eutrophication of Water Bodies: Causes, Concerns, Controls. TrGeo 2003, 9, 612. [Google Scholar] [CrossRef]
  4. Carpenter, S.R.; Caraco, N.F.; Correll, D.L.; Howarth, R.W.; Sharpley, A.N.; Smith, V.H. Nonpoint pollution of surface waters with phosphorus and nitrogen. Ecol. Appl. 1998, 8, 559–568. [Google Scholar] [CrossRef]
  5. Moss, B.; Jeppesen, E.; Søndergaard, M.; Lauridsen, T.L.; Liu, Z. Nitrogen, macrophytes, shallow lakes and nutrient limitation: Resolution of a current controversy? Hydrobiologia 2013, 710, 3–21. [Google Scholar] [CrossRef]
  6. Boström, B.; Pettersson, K. Different patterns of phosphorus release from lake sediments in laboratory experiments. Hydrobiologia 1982, 91–92, 415–429. [Google Scholar] [CrossRef]
  7. Kim, L.H.; Choi, E.; Gil, K.I.; Stenstrom, M.K. Phosphorus release rates from sediments and pollutant characteristics in Han River, Seoul, Korea. Sci. Total Environ. 2004, 321, 115–125. [Google Scholar] [CrossRef] [PubMed]
  8. Macintosh, K.A.; Mayer, B.K.; McDowell, R.W.; Powers, S.M.; Baker, L.A.; Boyer, T.H.; Rittmann, B.E. Managing Diffuse Phosphorus at the Source versus at the Sink. Environ. Sci. Technol. 2018, 52, 11995–12009. [Google Scholar] [CrossRef] [PubMed] [Green Version]
  9. Peng, J.T.; Zhu, X.D.; Sun, X.; Song, X.W. Identifying external nutrient reduction requirements and potential in the hypereutrophic Lake Taihu Basin, China. Environ. Sci. Pollut. Res. 2018, 25, 10014–10028. [Google Scholar] [CrossRef]
  10. Moore, P.A.; Reddy, K.R.; Fisher, M.M. Phosphorus Flux between Sediment and Overlying Water in Lake Okeechobee, Florida: Spatial and Temporal Variations. J. Environ. Qual. 1998, 27, 1428–1439. [Google Scholar] [CrossRef]
  11. Egemose, S.; de Vicente, I.; Reitzel, K.; Flindt, M.R.; Andersen, F.; Lauridsen, T.L.; Søndergaard, M.; Jeppesen, E.; Jensen, H.S. Changed cycling of P, N, Si, and DOC in danish lake nordborg after aluminum treatment. Can. J. Fish. Aquat. Sci. 2011, 68, 842–856. [Google Scholar] [CrossRef]
  12. Palmer-Felgate, E.J.; Mortimer, R.J.G.; Krom, M.D.; Jarvie, H.P.; Williams, R.J.; Spraggs, R.E.; Stratford, C.J. Internal loading of phosphorus in a sedimentation pond of a treatment wetland: Effect of a phytoplankton crash. Sci. Total Environ. 2011, 409, 2222–2232. [Google Scholar] [CrossRef]
  13. Orihel, D.M.; Baulch, H.M.; Casson, N.J.; North, R.L.; Parsons, C.T.; Seckar, D.C.M.; Venkiteswaran, J.J. Internal phosphorus loading in Canadian fresh waters: A critical review and data analysis. Can. J. Fish. Aquat. Sci. 2017, 74, 2005–2029. [Google Scholar] [CrossRef] [Green Version]
  14. Vollenweider, R.A. Advances in defining critical loading levels of phosphorous in lake eutrofication Mem. Ist. Ital. Idrobiol. 1976, 33, 53–83. [Google Scholar]
  15. Jeppesen, E.; Søndergaard, M.; Jensen, J.P.; Havens, K.E.; Anneville, O.; Carvalho, L.; Coveney, M.F.; Deneke, R.; Dokulil, M.T.; Foy, B.; et al. Lake responses to reduced nutrient loading - An analysis of contemporary long-term data from 35 case studies. Freshw. Biol. 2005, 50, 1747–1771. [Google Scholar] [CrossRef]
  16. Søndergaard, M.; Jensen, J.P.; Jeppesen, E. Internal phosphorus loading in shallow Danish lakes. Hydrobiologia 1999, 408/409, 145–152. [Google Scholar] [CrossRef]
  17. Scheffer, M. Multiplicity of stable states in freshwater systems. Hydrobiologia 1990, 200–201, 475–486. [Google Scholar] [CrossRef]
  18. Scheffer, M.; Hosper, S.H.; Meijer, M.L.; Moss, B.; Jeppesen, E. Alternative equilibria in shallow lakes. Trends Ecol. Evol. 1993, 8, 275–279. [Google Scholar] [CrossRef]
  19. Scheffer, M.; Carpenter, S.; Foley, J.A.; Folke, C.; Walker, B. Catastrophic shifts in ecosystems. Nature 2001, 413, 591–596. [Google Scholar] [CrossRef]
  20. Andersen, T.K.; Nielsen, A.; Jeppesen, E.; Hu, F.; Bolding, K.; Liu, Z.; Søndergaard, M.; Johansson, L.S.; Trolle, D. Predicting ecosystem state changes in shallow lakes using an aquatic ecosystem model: Lake Hinge, Denmark, an example. Ecol. Appl. 2020, eap.2160. [Google Scholar] [CrossRef]
  21. Scheffer, M.; Van Nes, E.H. Shallow lakes theory revisited: Various alternative regimes driven by climate, nutrients, depth and lake size. In Proceedings of the Hydrobiologia; Springer: Berlin/Heidelberg, Germany, 2007; Volume 584, pp. 455–466. [Google Scholar]
  22. Viaroli, P.; Bartoli, M.; Giordani, G.; Naldi, M.; Orfanidis, S.; Zaldivar, J.M. Community shifts, alternative stable states, biogeochemical controls and feedbacks in eutrophic coastal lagoons: A brief overview. In Proceedings of the Aquatic Conservation: Marine and Freshwater Ecosystems; John Wiley & Sons, Ltd.: Hoboken, NJ, USA, 2008; Volume 18, pp. S105–S117. [Google Scholar]
  23. Sirota, J.; Baiser, B.; Gotelli, N.J.; Ellison, A.M. Organic-matter loading determines regime shifts and alternative states in an aquatic ecosystem. Proc. Natl. Acad. Sci. USA 2013, 110, 7742–7747. [Google Scholar] [CrossRef] [Green Version]
  24. Perrone, U.; Facchinelli, A.; Sacchi, E. Phosphorus dynamics in a small eutrophic Italian lake. Water Air. Soil Pollut. 2008, 189, 335–351. [Google Scholar] [CrossRef]
  25. Şahin, Y.; Demirak, A.; Keskin, F. Phosphorus fractions and its potential release in the sediments of Koycegiz Lake, Turkey. Ponds 2012, 6, 139–153. [Google Scholar]
  26. Bassi, N.; Kumar, M.D.; Sharma, A.; Pardha-Saradhi, P. Status of wetlands in India: A review of extent, ecosystem benefits, threats and management strategies. J. Hydrol. Reg. Stud. 2014, 2, 1–19. [Google Scholar] [CrossRef] [Green Version]
  27. Butkus, S.; Myint, S. Pesticide Use Limits for Protection of Human Health in Inle Lake (Myanmar) Watershed; Living Earth Institute: Olympia, WA, USA, 2001. [Google Scholar]
  28. Michalon, M.; Gunnell, Y.; Lejot, J.; Mialhe, F.; Aung, T. Accelerated degradation of Lake Inle (Myanmar): A baseline study for environmentalists and developers. L. Degrad. Dev. 2019, 30, 928–941. [Google Scholar] [CrossRef]
  29. Inlay Lake Ramsar Site|Ramsar Sites Information Service. Available online: https://rsis.ramsar.org/ris/2356 (accessed on 10 June 2020).
  30. Akaishi, F.; Satake, M.; Otaki, M.; Tominaga, N. Surface water quality and information about the environment surrounding Inle Lake in Myanmar. Limnology 2006, 7, 57–62. [Google Scholar] [CrossRef]
  31. Lwin, Z.; Sharma, M.P. Environmental Management of the Inle Lake in Myanmar. Hydro Nepal J. Water Energy Environ. 2012, 11, 57–60. [Google Scholar] [CrossRef]
  32. Mjelde, M.; Ballot, A.; Swe, T.; Eriksen, T.E.; Nesheim, I.; Aung, T.T. Integrated Water Resources Management in Myanmar. Assessing ecological status in Inlay Lake. Preliminary report Report n. 7163-2017, Norwegian Institute for Water Research 2017; p. 76. Available online: https://niva.brage.unit.no/niva-xmlui/handle/11250/2449892 (accessed on 13 July 2020).
  33. Re, V.; Thin, M.M.; Setti, M.; Comizzoli, S.; Sacchi, E. Present status and future criticalities evidenced by an integrated assessment of water resources quality at catchment scale: The case of Inle Lake (Southern Shan state, Myanmar). Appl. Geochem. 2018, 92, 82–93. [Google Scholar] [CrossRef]
  34. Koschel, R.; Bemmdorf, J.; Proft, G.; Recknagel, F. Calcite precipitation as a natural control mechanism of eutrophication. Arch. für Hydrobiol. 1983, 98, 380–408. [Google Scholar]
  35. Thin, M.M.; Sacchi, E.; Setti, M. Hydrological processes at Inle Lake (Southern Shan State, Myanmar) inferred from hydrochemical, mineralogical and isotopic data. Isotopes Environ. Health Stud. 2016, 52, 455–467. [Google Scholar] [CrossRef] [PubMed]
  36. Hope, G.; van der Kaars, S.; Finn, J.; Moe, K.Z. Holocene environmental change at Inle Lake, Shan State, Myanmar, and its implications for the regional development of agriculture. Palaeogeogr. Palaeoclimatol. Palaeoecol. 2019, 523, 18–29. [Google Scholar] [CrossRef]
  37. Thin, M.M.; Setti, M.; Sacchi, E.; Re, V.; Riccardi, M.P.; Allais, E. Mineralogical and geochemical characterisation of alkaline lake sediments to trace origin, depositional processes, and anthropogenic impacts: Inle Lake (Southern Shan State, Myanmar). Environ. Earth Sci. 2020, 79, 1–18. [Google Scholar] [CrossRef]
  38. Rainfall Radar and Weather Nyaungshwe. 14 day forecast Nyaungshwe. Available online: http://www.meteovista.co.uk/Asia/Myanmar/Nyaungshwe/3408406 (accessed on 10 June 2020).
  39. Tun, Z.W. Seasonal Variations of Air Temperature and Rainfall of Naung Shwe Township; Myanmar Agricultural Service: Naung Shwe, Myanmar, 2014. [Google Scholar]
  40. Su, M.; Jassby, A.D. Inle: A large Myanmar lake in transition. Lakes Reserv. Res. Manag. 2000, 5, 49–54. [Google Scholar] [CrossRef]
  41. Sidle, R.C.; Ziegler, A.D.; Vogler, J.B. Contemporary changes in open water surface area of Lake Inle, Myanmar. Sustain. Sci. 2007, 2, 55–65. [Google Scholar] [CrossRef]
  42. Okamoto, I. Coping and adaptation against decreasing fish resources: Case study of fishermen in Lake Inle, Myanmar. IDE Discuss. Pap. 2012, 329, 1–28. [Google Scholar]
  43. Government of Myanmar. Long Term Restoration and Conservation Plan for Inle Lake; Government of Myanmar: Naypyidaw, Myanmar, 2014. [Google Scholar]
  44. Htwe, T.N.; Kywe, M.; Buerkert, A.; Brinkmann, K. Transformation processes in farming systems and surrounding areas of Inle Lake, Myanmar, during the last 40 years. J. Land Use Sci. 2015, 10, 205–223. [Google Scholar] [CrossRef]
  45. Metcalfe, I. Kyi Pyar Aung Late Tournaisian conodonts from the Taungnyo Group near Loi Kaw, Myanmar (Burma): Implications for Shan Plateau stratigraphy and evolution of the Gondwana-derived Sibumasu Terrane. Gondwana Res. 2014, 26, 1159–1172. [Google Scholar] [CrossRef]
  46. Oo, T.; Hlaing, T.; Htay, N. Permian of Myanmar. J. Asian Earth Sci. 2002, 20, 683–689. [Google Scholar] [CrossRef]
  47. Bertrand, G.; Rangin, C. Tectonics of the western margin of the Shan plateau (central Myanmar): Implication for the India-Indochin oblique convergence since the Oligocene. J. Asian Earth Sci. 2003, 21, 1139–1157. [Google Scholar] [CrossRef]
  48. Robinson, R.A.J.; Brezina, C.A.; Parrish, R.R.; Horstwood, M.S.A.; Nay, W.O.; Bird, M.I.; Myint, T.; Walters, A.S.; Oliver, G.J.H.; Zaw, K. Large rivers and orogens: The evolution of the Yarlung Tsangpo-Irrawaddy system and the eastern Himalayan syntaxis. Gondwana Res. 2014, 26, 112–121. [Google Scholar] [CrossRef] [Green Version]
  49. Wang, Y.; Sieh, K.; Tun, S.T.; Lai, K.Y.; Myint, T. Active tectonics and earthquake potential of the Myanmar region. J. Geophys. Res. Solid Earth 2014, 119, 3767–3822. [Google Scholar] [CrossRef]
  50. Crosetto, S.; Watkinson, I.M.; Min, S.; Gori, S.; Falcucci, E. Nwai Le Ngal Evidence of Quaternary and recent activity along the Kyaukkyan Fault, Myanmar. J. Asian Earth Sci. 2018, 156, 207–225. [Google Scholar] [CrossRef]
  51. Htwe, T.N.; Brinkmann, K.; Buerkert, A. Spatio-temporal assessment of soil erosion risk in different agricultural zones of the Inle Lake region, southern Shan State, Myanmar. Environ. Monit. Assess. 2015, 187, 1–14. [Google Scholar] [CrossRef] [PubMed]
  52. Ma, T. Floating Island Agriculture (Ye-Chan) of Inle Lake. Ph.D. Thesis, University of Yangon, Yangon, Myanmar, 1996. [Google Scholar]
  53. Buijtendijk, H.; Tschunkert, K. Hotel industry expansion and sustainable development: A case study of Inle Lake, Myanmar. Res. Hosp. Manag. 2016, 6, 9–23. [Google Scholar] [CrossRef]
  54. Pradhan, N.; Habib, H.; Venkatappa, M.; Ebbers, T.; Duboz, R.; Shipin, O. Framework tool for a rapid cumulative effects assessment: Case of a prominent wetland in Myanmar. Environ. Monit. Assess. 2015, 187, 1–18. [Google Scholar] [CrossRef] [PubMed]
  55. Allais, E. Studio Geochimico Delle Acque e dei Sedimenti di Alcuni Laghi Piemontesi al Fine di una Ricostruzione Paleoclimatica e Paleoambientale Regionale; University of Torino: Torino, Italy, 2001. [Google Scholar]
  56. Thin, M.M. Environmental Applications of Physical Nuclear and Geochemical Techniques: Origin, Dynamics and Impact of Phosphates and Heavy Metals in Cultivated Areas and at Inle Lake, Myanmar; University of Mandalay: Mandalay, Myanmar, 2015. [Google Scholar]
  57. Boyle, J. A comparison of two methods for estimating the organic matter content of sediments. J. Paleolimnol. 2004, 31, 125–127. [Google Scholar]
  58. Ruban, V.; López-Sánchez, J.F.; Pardo, P.; Rauret, G.; Muntau, H.; Quevauviller, P. Selection and evaluation of sequential extraction procedures for the determination of phosphorus forms in lake sediment. J. Environ. Monit. 1999, 1, 51–56. [Google Scholar] [CrossRef]
  59. Ruban, V.; López-Sánchez, J.F.; Pardo, P.; Rauret, G.; Muntau, H.; Quevauviller, P. Harmonized protocol and certified reference material for the determination of extractable contents of phosphorus in freshwater sediments - A synthesis of recent works. Anal. Bioanal. Chem. 2001, 370, 224–228. [Google Scholar] [CrossRef]
  60. Wang, C.; Zhang, Y.; Li, H.; Morrison, R.J. Sequential extraction procedures for the determination of phosphorus forms in sediment. Limnology 2013, 14, 147–157. [Google Scholar] [CrossRef] [Green Version]
  61. Murphy, J.; Riley, J.P. A modified single solution method for the determination of phosphate in natural waters. Anal. Chim. Acta 1962, 27, 31–36. [Google Scholar] [CrossRef]
  62. American Society for Testing and Materials. Test Methods for Phosphorous in Water D 515-88, 474–483. 1988. Available online: http://www.astm.org/cgi-bin/resolver.cgi?D515 (accessed on 13 July 2020).
  63. Thin, M.M.; Sacchi, E.; Setti, M. Geochemical and Mineralogical Composition of Grab and Core Sediments from Inle Lake (Southern Shan State, Myanmar). Available online: https://doi.pangaea.de/10.1594/PANGAEA.908284 (accessed on 11 June 2020).
  64. Chatfield, C.; Collins, A.J. Introduction to Multivariate Analysis; Chapman and Hall: London, UK, 1980; ISBN 9780412160301. [Google Scholar]
  65. SPSS Inc. Released 2007. SPSS for Windows, Version 16.0; SPSS Inc.: Chicago, IL, USA, 2007. [Google Scholar]
  66. Tarvainen, T.; Reeder, S.; Albanese, S. Database Management and Map Production. In Geochemical Atlas of Europe. Part 1—Background Information, Methodology and Maps; Salminen, R., Ed.; Geological Survey of Finland: Espoo, Finland, 2005; ISBN 951-690-921-3. [Google Scholar]
  67. Kaiser, H.F. The varimax criterion for analytic rotation in factor analysis. Psychometrika 1958, 23, 187–200. [Google Scholar] [CrossRef]
  68. Singh, B.R.; Krogstad, T.; Shivay, Y.S.; Shivakumar, B.G.; Bakkegard, M. Phosphorus fractionation and sorption in P-enriched soils of Norway. Nutr. Cycl. Agroecosyst. 2005, 73, 245–256. [Google Scholar] [CrossRef]
  69. Golterman, H.L. The role of the ironhydroxide-phosphate-sulphide system in the phosphate exchange between sediments and overlying water. Hydrobiologia 1995, 297, 43–54. [Google Scholar] [CrossRef]
  70. Lottermoser, B.G. Trace metal enrichment in sugarcane soils due to the long-term application of fertilisers, North Queensland, Australia: Geochemical and Pb, Sr, and U isotopic compositions. Soil Res. 2009, 47, 311–320. [Google Scholar] [CrossRef]
  71. Niu, L.; Yang, F.; Xu, C.; Yang, H.; Liu, W. Status of metal accumulation in farmland soils across China: From distribution to risk assessment. Environ. Pollut. 2013, 176, 55–62. [Google Scholar] [CrossRef]
  72. Azzi, V.; Kazpard, V.; Lartiges, B.; Kobeissi, A.; Kanso, A.; El Samrani, A.G. Trace Metals in Phosphate Fertilizers Used in Eastern Mediterranean Countries. CLEAN—Soil Air Water 2017, 45. [Google Scholar] [CrossRef]
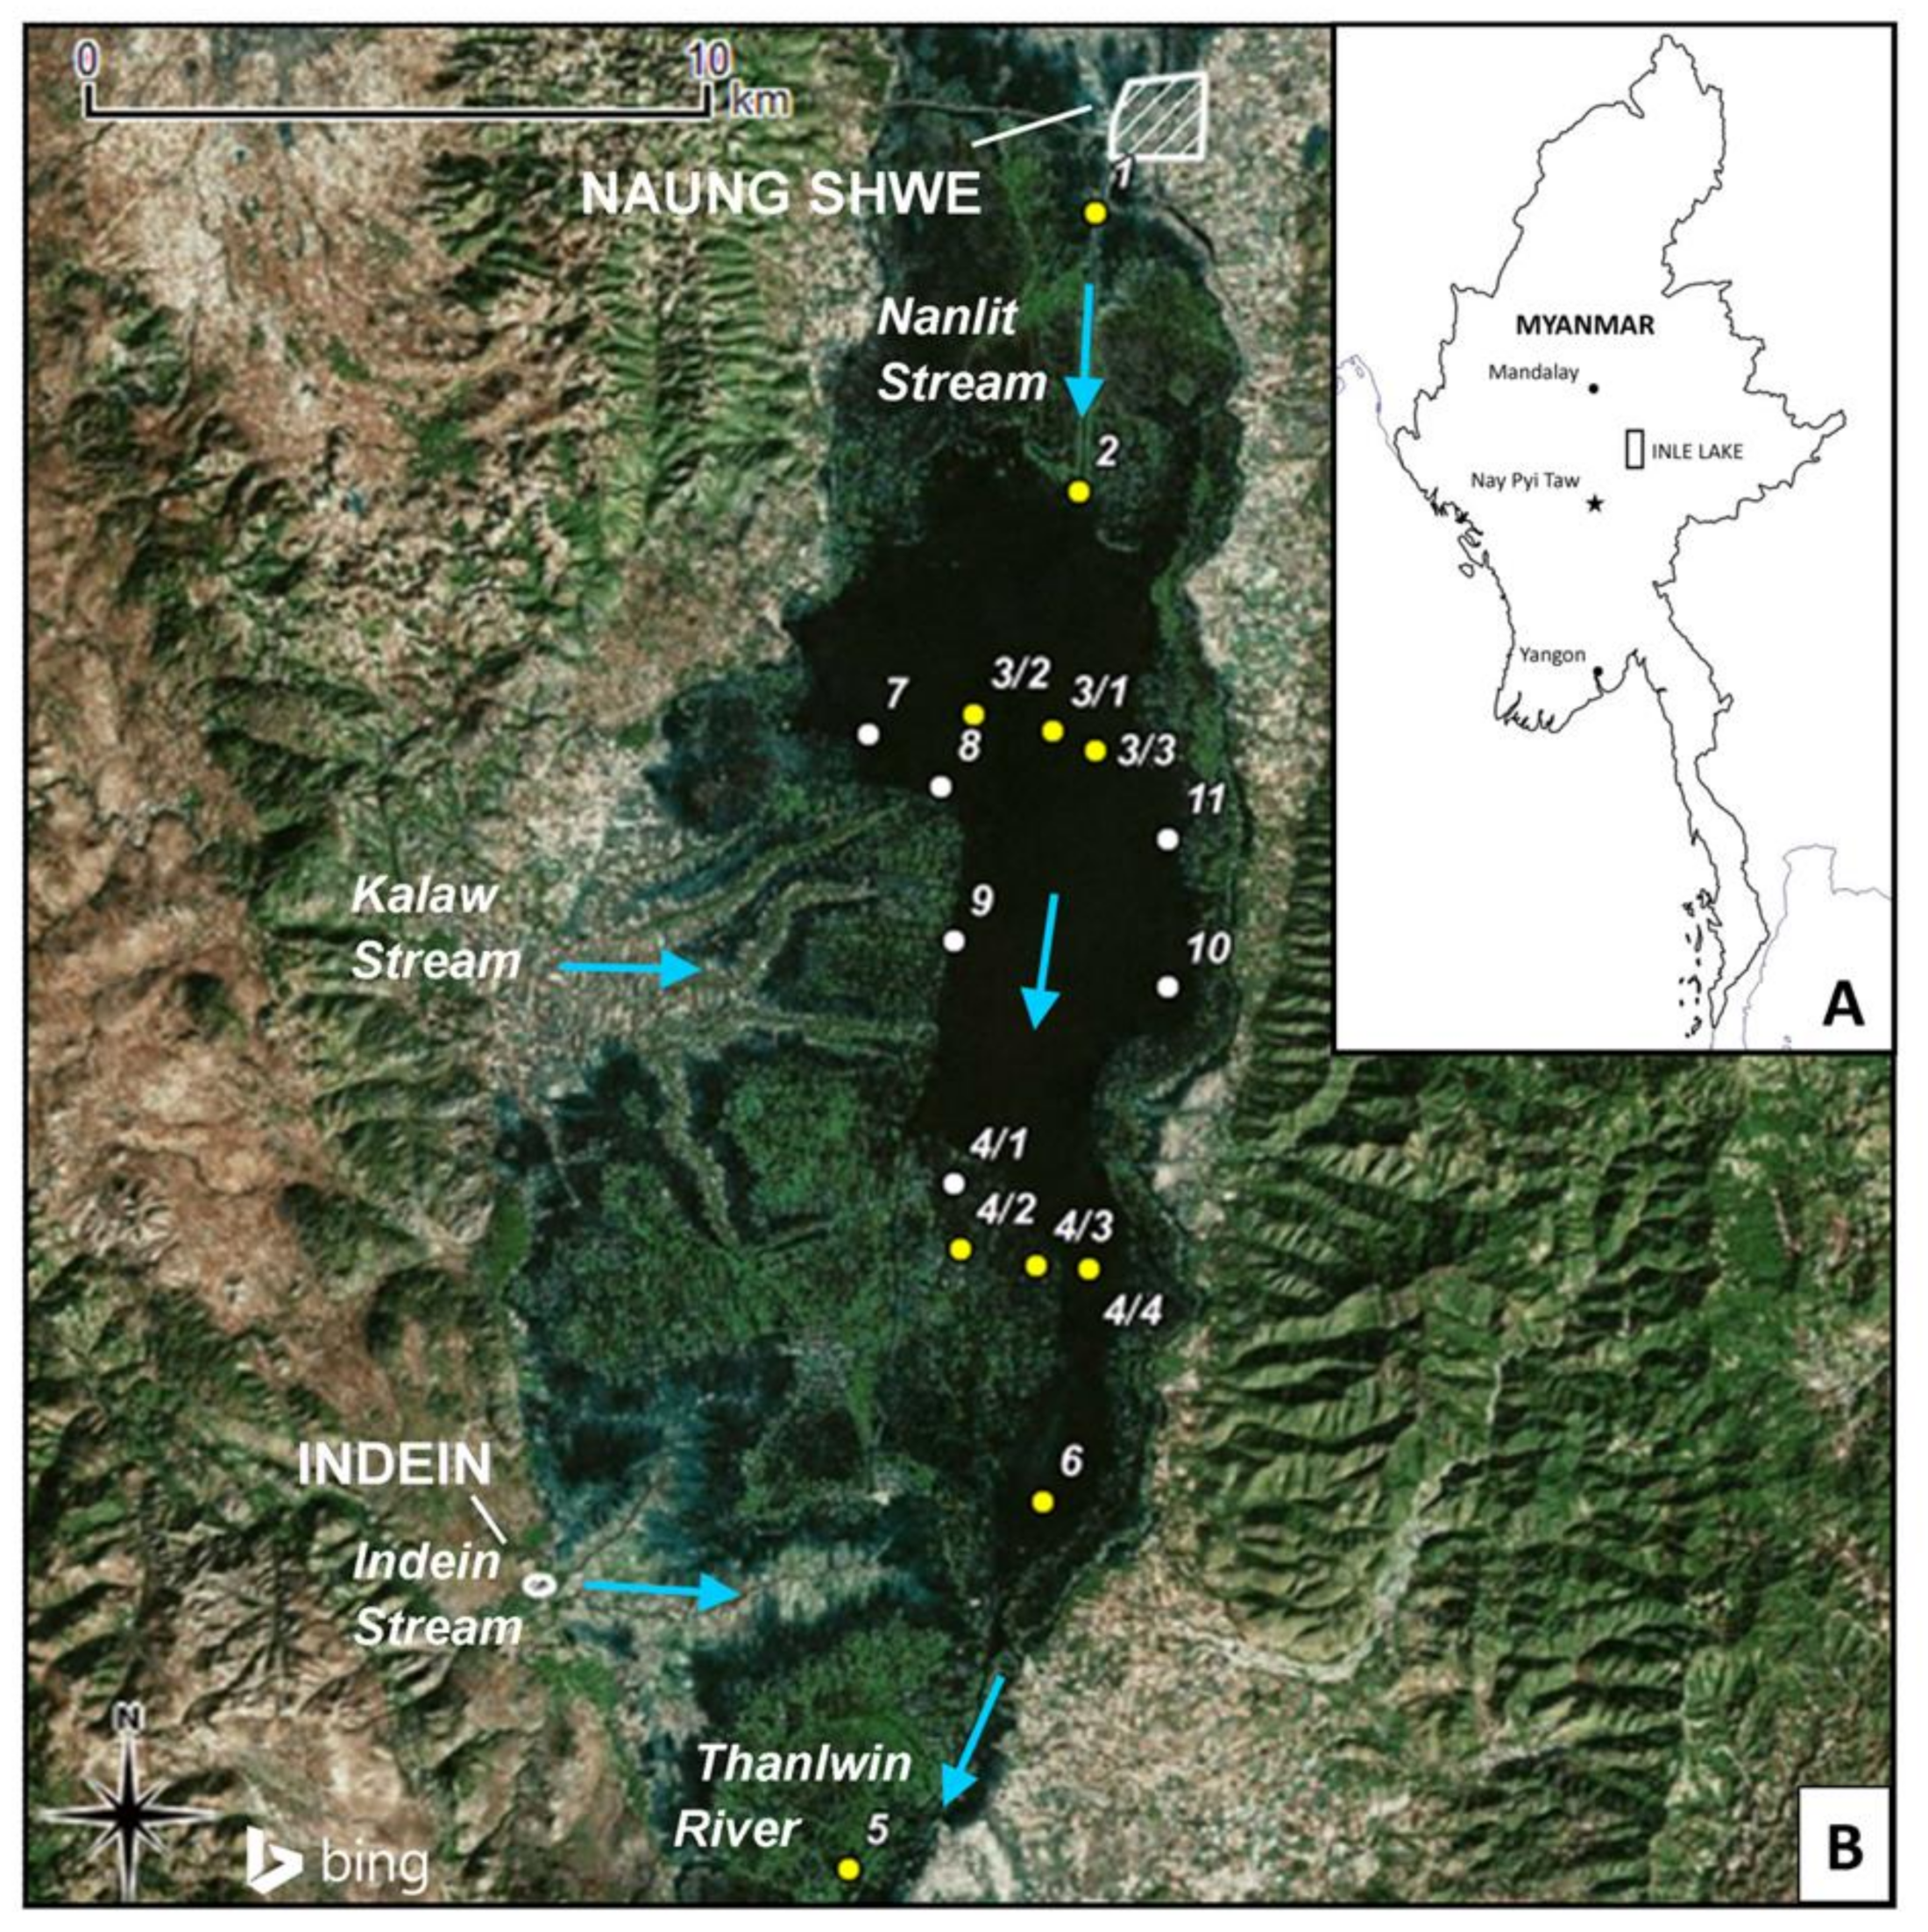
 [Green Version]
Figure 1. (A) Location of the study area in Myanmar; (B): location of the sediment samples (white dots = grab samples; yellow dots = grab and core samples). Blue arrows: surface water flow directions.
Water 12 01993 g001
Figure 2. Total phosphorus (TPSMT) and P forms determined from grab samples: (a) Inorganic-P (IP) and organic-P (OP), compared to TPSMT; (b) calcium-bound P (Ca-P) and P bound to Al, Fe and Mn oxy-hydroxides (Fe-P) compared to IP; (c) percent contribution of OP, Fe-P and CaP.
Water 12 01993 g002
Figure 3. TPSMT and P forms determined from core sediment samples and their variation with depth.
Water 12 01993 g003
Figure 4. Concentration and contribution percentage of OP, Fe-P, and Ca-P in core sediment samples.
Water 12 01993 g004
Figure 5. Spatial interpolation (inverse squared distance method) of TPSMT data from grab sediments.
Water 12 01993 g005
Figure 6. TPSMT and P forms of the anthropogenic input in core samples, calculated by assuming that the bottom layer of core 3/1 represents the natural background concentration for cores 2 and 3/1, and core 4/3 bottom layer represents the natural background concentration for cores 4/2 and 4/3.
Water 12 01993 g006
Figure 7. TPTD versus F1 scores for all the sediment samples of this study, distinguished by site.
Water 12 01993 g007
Table 1. Location, environmental setting, and potential pollution sources in proximity to the grab (G) and core (C) sediment samples reported in this study.
SiteLongitude (UTM)Latitude (UTM)Environmental SettingPotential Nearby Pollution SourcesSamples Collected
147Q 02834272284690Nanlit stream—inflowNaung Shwe Township and motorboat circulationG
247Q 02831222280515Nanlit stream—lake entranceMotorboat circulationG, C
3/147Q 02827072276910Inle lake—wide area—CentreDetrital input form the Nanlit streamG, C
3/247Q 02815082277202Inle lake—wide area—WestNoneG
3/347Q 02833052276640Inle lake—wide area—EastNoneG
4/147Q 02811042270131Floating gardens area—Northern entranceFloating gardensG
4/2 47Q 02811902269152Floating gardens area—CentreFloating gardens and Kaylar villageG, C
4/347Q 02823562268878Floating gardens area—Eastern entranceFloating gardensG, C
4/447Q 02831032268840Inle lake—narrow areaFloating gardensG
547Q 02793972259847Lower Belu stream—outflowHelon villageG
647Q 02823962265350Inle lake—narrow areaNoneG
747Q 02799082276921Inle lake—Western bankFloating gardensG
847Q 02809952276119Inle lake—Western bankFloating gardensG
947Q 02811552273786Inle lake—Western bankFloating gardensG
1047Q 02843732273034Inle lake—Eastern bankNoneG
1147Q 02844092275275Inle lake—Eastern bankTourist resortsG

