Article

Analyzing Particle-Associated Pollutant Transport to Identify In-Stream Sediment Processes during a High Flow Event

1
Center for Applied Geoscience, Eberhard Karls University of Tübingen, 72074 Tübingen, Germany
2
Oberlin College Geology Department, Oberlin College, Oberlin, OH 44074, USA
*
Author to whom correspondence should be addressed.
Water 2020, 12(6), 1794; https://doi.org/10.3390/w12061794
Submission received: 29 May 2020 / Revised: 17 June 2020 / Accepted: 18 June 2020 / Published: 23 June 2020
(This article belongs to the Special Issue Geochemistry of Water and Sediment)

Abstract

:
Urban areas are a leading source of polycyclic aromatic hydrocarbons (PAHs) that result from combustion processes and are emitted into rivers, especially during rain events and with particle wash-off from urban surfaces. In-stream transport of suspended particles and attached PAHs is linked strongly to sediment turnover processes. This study aimed to identify particle exchange processes that contribute to the transport of suspended particles during flood events. An urban high-flow signal was tracked in high temporal resolution at two sampling sites in the Ammer River (South-western Germany). Samples were analyzed for turbidity, total suspended solids concentrations (TSS), particle-size distribution, organic carbon, and PAH. Maximum discharge and the highest TSS occurred nearly simultaneously at the upstream sampling site, whereas a temporally shifted course was observed for downstream. The total load of particles was similar, yet a decrease of PAH mass (~28%) and an increase of the particulate organic carbon (POC) content (~3.5%-points) occurred. Coarser particles (≥26 µm) dominated at the beginning of the event at both sampling sites. The signal of remobilized riverbed sediment increases downstream and leads to well-established, robust linear correlations between TSS and PAHs. This study highlights that riverbed sediment acts as intermediate storage for contaminated particles from upstream sources that shape, together with the fresh urban input, the “particle signature” of suspensions moving through catchments during high discharge conditions.

1. Introduction

Urban areas constitute a significant source of contaminants, such as polycyclic aromatic hydrocarbons (PAHs). Given their strongly hydrophobic and low soluble character, PAHs are associated with particles rather than transported freely dissolved [1,2]. By surface runoff, highly PAH contaminated urban particles are introduced into rivers via, e.g., combined sewer overflows and significantly impact riverine ecosystems [3,4]. In the fluvial system, erosion and deposition are the two main processes regulating particle transport [5]. Thus, a strong interaction between suspended particles and riverbed sediment exists, and suspension load consequently represents a mixture of particles from different locations, sources, and mobilization history within catchments [6]. The intermittent and periodic interplay between suspended particles and the riverbed sediment hampers the understanding of processes controlling the storage and export of sediment and associated pollutants. A deeper knowledge of this interplay is highly relevant, especially regarding the residence time and fate of hydrophobic contaminants in stream networks.
Total PAH (concentrations) in bulk water samples and total suspended solids concentrations (TSS) typically correlate linearly [7,8,9,10]. These correlations are catchment-specific and robust over many years. They likely reflect the urban imprint in conjunction with the sediment yield of the respective catchment [7]. A large mass of contaminated particles is transported downstream, especially during heavy rain events [11,12], when high TSS and discharges occur [13,14]. Rain events have the potential to play an important role in the annual flux of strongly sorbing pollutants (solid-water distribution coefficient; logKd ≥ 4), despite the short duration of single rain events and their low frequency in comparison to base flow conditions.
There is still a knowledge gap regarding the underlying short-term mechanisms that contribute to the robustness of the correlation between PAH and TSS, despite the temporally and spatially non-uniform inputs. Transport of suspended particles and also the attached pollutants’ concentration are linked strongly to dynamic sediment turnover processes such as deposition or (re-) mobilization [15,16]. Deposition of suspended particles may lead to an accumulation of contaminants on flood plains in, e.g., lowlands [17] or river sections with a mild channel slope [18]. Riverbed mobilization, on the contrary, initiates the transport of contaminated suspended sediments when the frictional force of the water acting on the riverbed (shear stress) is strong enough to entrain surface river bed particles [19].
This study aimed to identify instream particle exchange processes that contribute to the transport of suspended particles and associated pollutants within the river. The purpose was to disentangle these local processes and their contribution to the overall correlation between PAHs and TSS during flood events. To this end, a tailored sampling approach was conducted during a pronounced flood event in a small river (Ammer River) in southwestern Germany that is heavily impacted by urban inputs.

2. Materials and Methods

2.1. General Approach
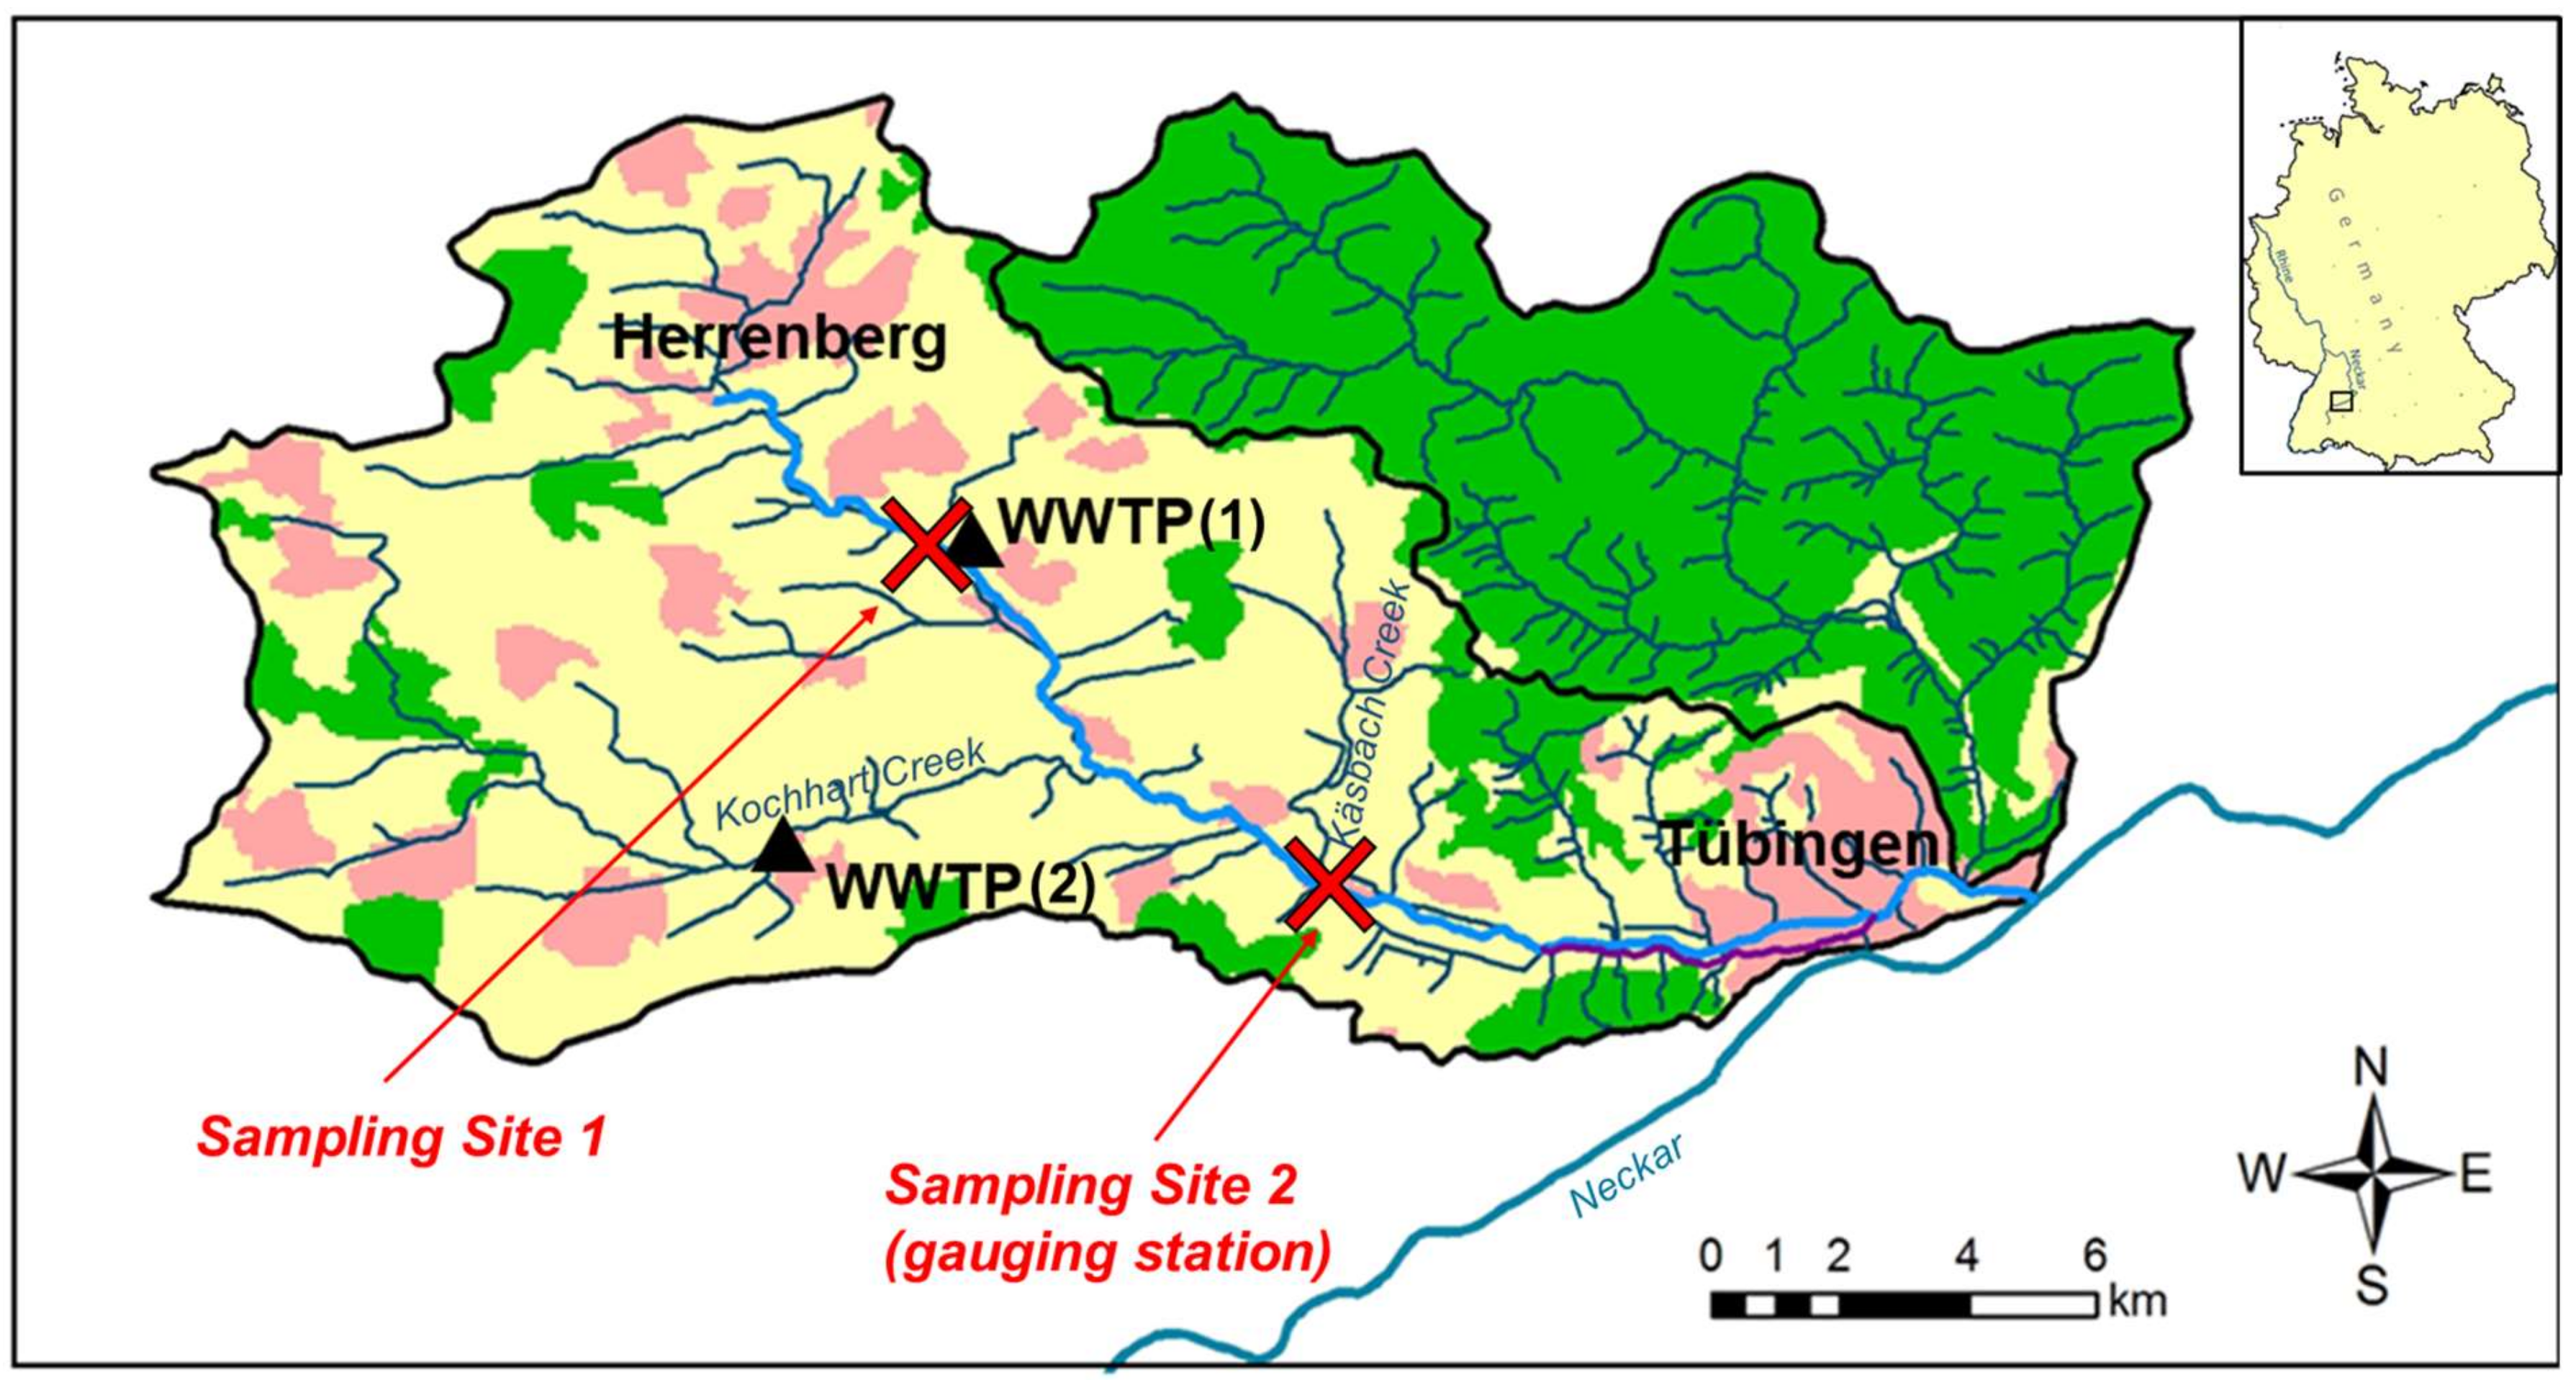
Direct measurement of relevant local processes that potentially lead to the described correlations between total PAHs in bulk water samples and TSS is complicated since the mass flux, quality, and characteristics of suspended particles integrate processes occurring in the entire upstream river network. Thus, a differential approach was proposed that identified changes to a pulse of urban sediment as it moved along a defined river segment. Given its extraordinarily high, yet stable loading of suspended particles with PAHs, the Ammer River (Baden-Württemberg, southwestern Germany) was selected for the investigations. A sharp, high flood event originating from urban areas located in the upper catchment was sampled in high temporal resolution close to its origin in the vicinity of the city of Herrenberg and further downstream at a location integrative for the gauged catchment. The differential analysis of the temporally resolved data on the quantity and quality of the suspended sediment flux at the beginning and end of the 7.7 km long river segment was performed with a special focus on factors shaping and changing the urban signal, e.g., the exchange between suspended and riverbed sediment particles.

2.2. Sampling Site

The Ammer River (5th order stream, 22 km length) is a tributary of the Neckar River (Southwestern Germany) with an average discharge (Q) of 0.87 m³ s−1 (https://www.hvz.baden-wuerttemberg.de/) measured at the gauge Pfäffingen (134 km³ catchment size), located about 10 km upstream of the Ammer mouth. Annual areal precipitation is 750 mm, with maximum precipitation peaks in summer. Karstic aquifers of the Upper Triassic Limestone and Middle Keuper gypsum formations contribute groundwater to the Ammer River [20]. Land use in the gauged catchment is dominated by agriculture (71%) and urban areas (17%) [21]. Two wastewater treatment plants (WWTP) are located in the catchment and release water to the Ammer River (WWTP (1), 80,000 person equivalents (PE), mean flow of 0.10–0.12 m3 s−1) as well as the Kochhart Creek (WWTP (2), 9000 PE, mean flow of 0.012–0.015 m³ s−1; Figure 1).
Larger cobbles dominate the riverbed with gravel and sandy material in the interspaces that are underlain by loamy Holocene deposits. Two sampling locations were selected for the investigation in the Ammer River main stem. The upper location is about 200 m upstream of the WWTP effluent directly under a motorway bridge (Figure 1, sampling site 1) and drains a topographic catchment of approximately 45 km². This sampling site is usually dominated by baseflow arising from several karst springs in the upper catchment, and during rain events, it is characterized by a significant water inflow from the urban areas leading to remarkable discharge peaks. The downstream sampling site (Figure 1, sampling site 2) is located at the gauging station and integrates hydrological processes of a 134 km² catchment. During baseflow conditions, this location is also fed by water as mentioned above from the karstic springs, (diffuse) groundwater inflows [21], and additionally water from many small tributaries and artificial inflows (WWTPs, drinking water treatment plant), leading to a general increase of discharge between the sampling locations. The lower site was already shown to be a suitable location to study particle-transport processes since it integrates significant contributions from riverbed erosion occurring in the upstream river sections during summer months (e.g., Reference [18]). This denotes that high discharge and turbidity peaks occurring right after a sudden precipitation event in this region were already observed for this sampling site leading, e.g., to well established, robust linear correlations between total PAHs in bulk water samples and the total suspended particles (TSS) over several years [8,15]. The sampling locations were selected based on these conditions and especially differences in underlying hydrological conditions between both sampling sites. The precipitation forecast was observed during the summer months to catch the discharge increase of the Ammer River directly after a rain event that took place in the city of Herrenberg. Sampling was performed on July 27 and 28, 2019, at the selected sampling sites (Figure 1).

2.3. Field Instrumentation

Data on precipitation was obtained from the German Meteorological Service (DWD; ftp://ftp-cdc.dwd.de/pub/). At both sampling sites, continuous data from online-probes (UIT GmbH, Dresden, Germany; 15 min interval) measuring the EC, turbidity, water temperature, and water level were derived. The probes were installed at concrete linings of the bank, approximately 20 cm above the riverbed level, i.e., that corresponds to mean discharge conditions. During flood peaks, the water level may rise by >1 m above the sensors. The application of pre-established rating curves on the water level measurements allowed the determination of discharge (Q). Turbidity was measured on-line by optical backscatter sensors at a wavelength of 880 nm. Since the time series of the turbidity probe at the gauging station (Pfäffingen) lacked a reliable calibration for turbidity larger than 10 NTU, the data above this threshold was multiplied by a correction factor (f = 4.932) derived from the correlation of field turbidity with turbidity obtained from laboratory measurements (R² = 0.92). In the lab, turbidity was quantified by a nephelometer (Hach 2100N Turbidimeter, Loveland, CO, USA). Samples used for laboratory turbidity measurements were sampled automatically using autosamplers (ISCO 3700, Teledyne Isco, Inc., Lincoln, NE, USA). The autosamplers had already been installed in early summer at each sampling site to obtain samples covering a discharge peak at short notice in case of an event. Tubing inlets for sampling were placed next to the online-probes to ensure comparability between the samples and the parameters. The autosamplers were started on July 27, 2019, quickly after the initiation of an intense precipitation event in the upper Ammer catchment. The autosampler at the upstream sampling site was started at 07:09 PM, the downstream autosampler at 08:03 PM, due to the river water travel time, and thus, we expected a later maximum discharge peak. The samplers were equipped with Teflon tubes and clean 1 L glass bottles and programmed to sample 1 L composite samples of 30 min (~330 mL every 10 min; 11 samples in total per sampling site). On the next day, July 28, samples were transferred to 1 L amber glass bottles after rinsing these bottles with river water. Additionally, two grab samples were taken with 1 L amber glass bottles on the day of transferring the samples from the autosamplers to the amber glass bottles (09:00 AM at sampling site 1, 10:00 AM at sampling site 2) to cover the tailing of the recession curve. In the laboratory, homogenized samples were split up immediately after sampling according to the required volume of the respective analysis (0.5 L for PAHs, 50 mL for dissolved organic carbon, 50 mL for total organic carbon, 250 mL for total suspended solids, 2 mL for turbidity, 50 mL for analysis of the particle size distribution) and stored in a dark 4 °C cooling room until analysis.

2.4. Laboratory Treatment

2.4.1. PAH15 Concentrations in Bulk Water Samples

A mixture of isotope-labeled standards was added to the bulk water samples according to a standardized procedure from the “Deutsche Institut für Normung e.V.” entitled DIN 38407–39 (10 µL, 5 perdeuterated PAH in toluene; each perdeuterated PAH 20 ng µL−1) before liquid/liquid extraction with cyclohexane to detect PAH and musk fragrance concentrations. Extracts were dried with anhydrous sodium sulfate, concentrated to 100 µL, and analyzed by gas chromatography with a mass spectrometer (GC/MS; (HP GC 6890 directly coupled with a mass selective detector Hewlett Packard MSD 5973), Santa Clara, CA, USA). Isotope dilution was used for quantification [22]. The detection limit of each compound equaled 1 ng L−1. The sum of PAH15, including the 16 US EPA (United States Environmental Protection Agency) without naphthalene, were reported throughout this article.

2.4.2. Dissolved Organic Carbon (DOC) and Total Organic Carbon (TOC)

Samples were filtered through 0.45 µm cellulose acetate filters before measurement. The aliquot for DOC (dissolved organic carbon) determination was acidified to pH 2 and purged with nitrogen gas using a TOC analyzer (Elementar HighTOC, Langenselbold, Germany), where thermal oxidation at 680 °C allows CO2 quantification using an IR detector. TOC concentrations were determined in the same way (Elementar vario TOC cube) without preceding filtration of the sample, but with a homogenization of the suspension (Ultra Turrax T18, IKA, Staufen, Germany) for at least 2 min (~6000 rpm).

2.4.3. TSS, Turbidity and Particle Size Distribution

TSS were quantified according to DIN 38409-2 by weighing the dried residues after membrane filtration (1.5 μm cellulose membrane). Turbidity was measured by a nephelometer (Hach 2100N Turbidmeter, Loveland, Colorado, USA) reported in NTU. The particle size distribution of the suspensions was determined using a laser-based device (Mastersizer 2000 linked with a Hydro 200 S pump, Malvern Panalytical, Kassel, Germany) trying to achieve optimal obscurity of 10–20% depending on the turbidity of the respective sample.

2.5. Data Evaluation

2.5.1. Particle-Associated Pollutant Transport

Application of liquid/liquid extraction for sample preparation of measuring PAH concentrations allows the determination of the total PAH concentration of the bulk (=turbid) water sample, which comprises the dissolved and the particle-associated fraction of the selected compound. Thus, the total concentration Cw,tot (M L−3) can be described as follows:
C w , tot = C w + C sus × TSS
where Cw (M L−3)denotes the dissolved concentrations of the contaminant, Csus (M M−1)the contaminant concentration on suspended particles, and TSS the total suspended solid concentration in the river water (M L−3) [7,8,9]. Assuming Cw and Csus are time-invariant during the period of sampling and keeping TSS as a sole variable, plotting the total concentration of selected compounds (Cw,tot) against TSS allows a direct determination of the particle loading (Csus) and the dissolved concentration (Cw) as the slope and the intercept, respectively, of a linear regression line. The ratio of Csus/Cw may be interpreted as the distribution coefficient between solids and dissolved phase (Kd) (L³ M−1):
K d = C sus C w
Combining Equations (1) and (2) allows the determination of the fraction of pollutants (fp) associated to particles:
f P = TSS TSS + 1 K d
From this relation, it may be derived that, if the distribution coefficient Kd equals the reciprocal of TSS (i.e., the water-to-solid concentration ratio), the fraction of particle-facilitated pollutant transport is 50%. However, during pronounced discharge events, uncertainties regarding the representative determination of Cw arise if the intercept is set to zero for these cases. Thus, the determination of a representative Kd value is not possible anymore, and a literature Kd value in the range of 105 L kg−1, as reported by [8] for the Ammer catchment, was assumed.

2.5.2. Particle and Particle-Associated Pollutant Flux

The particle load transported in suspension during the event (mparticles (M)) was derived from the integrated particle mass flux from the start of the event (meaning ‘mass flux baseflow conditions’, t = 0) until the end of the event (return to mass flux baseflow conditions, t = 1), consisting of the discharge (Qi (L³ T−1)) at each time step i multiplied by the respective TSS concentration (M L−3):
m particles = t = 0 t = 1 Q i × TSS i   dt
A sampling-site specific linear regression between high-resolution turbidity measurements and TSS measurements exists. Thus, missing TSS values can be easily obtained from the turbidity data series to complete the overall time span of the event with:
TSS i = turbidity i   × slope turbidity TSS
This allows a comparison of the mass of transported particles between both sampling sites.
The PAH load attached to particles (mPAH) per sampling site was derived from the integration of the PAH flux from the start of the event (meaning ‘mass flux baseflow conditions’, t = 0) until the end of the event (return to mass flux baseflow conditions, t=1). This consisted of the discharge (Q (L³ T−1)) at each time step i multiplied by the respective particle-associated PAH concentration (bulk PAH concentration C(PAH)w,tot,i (M L−3) corrected for the particle-associated PAH fraction (fp,i) (–) (Equation (3)):
m PAH = t = 0 t = 1 Q i ×   C PAH w , tot , i × f p , i   dt
For missing C(PAH)w,tot,i values, TSS values obtained from Equation (5) were converted into concentrations using the sampling site-specific regression line slope (Csus, Equation (1)).

3. Results

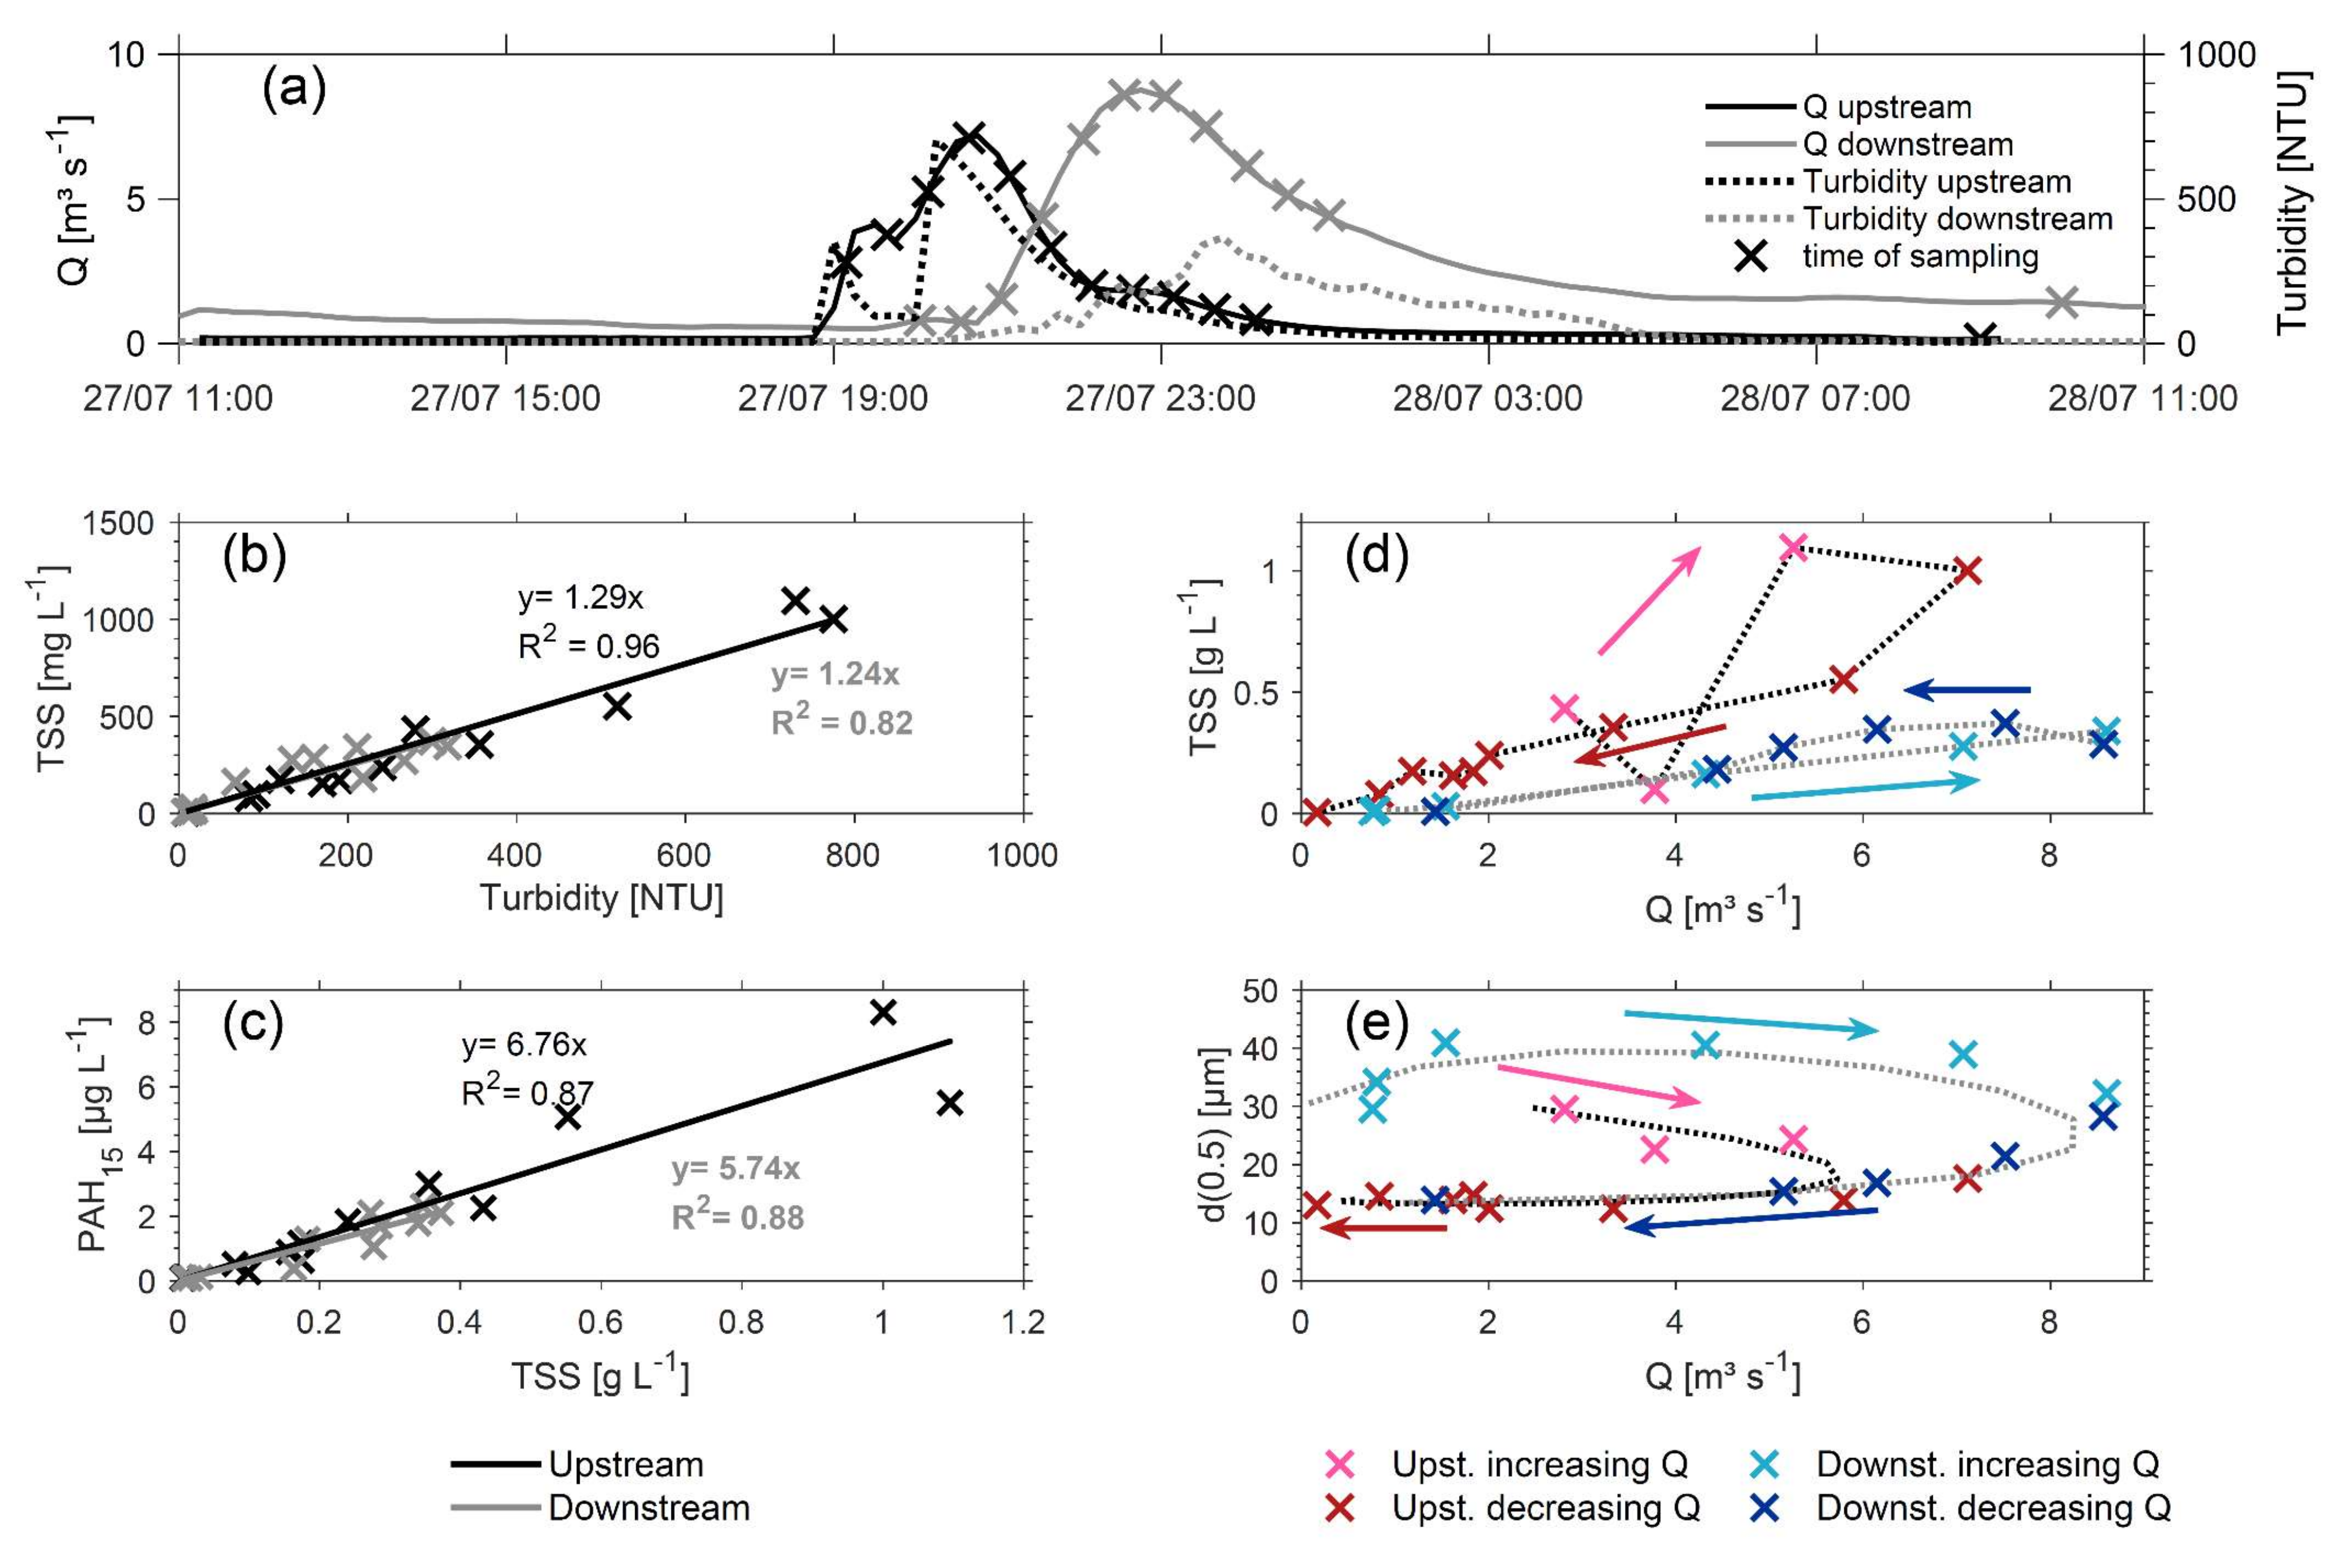
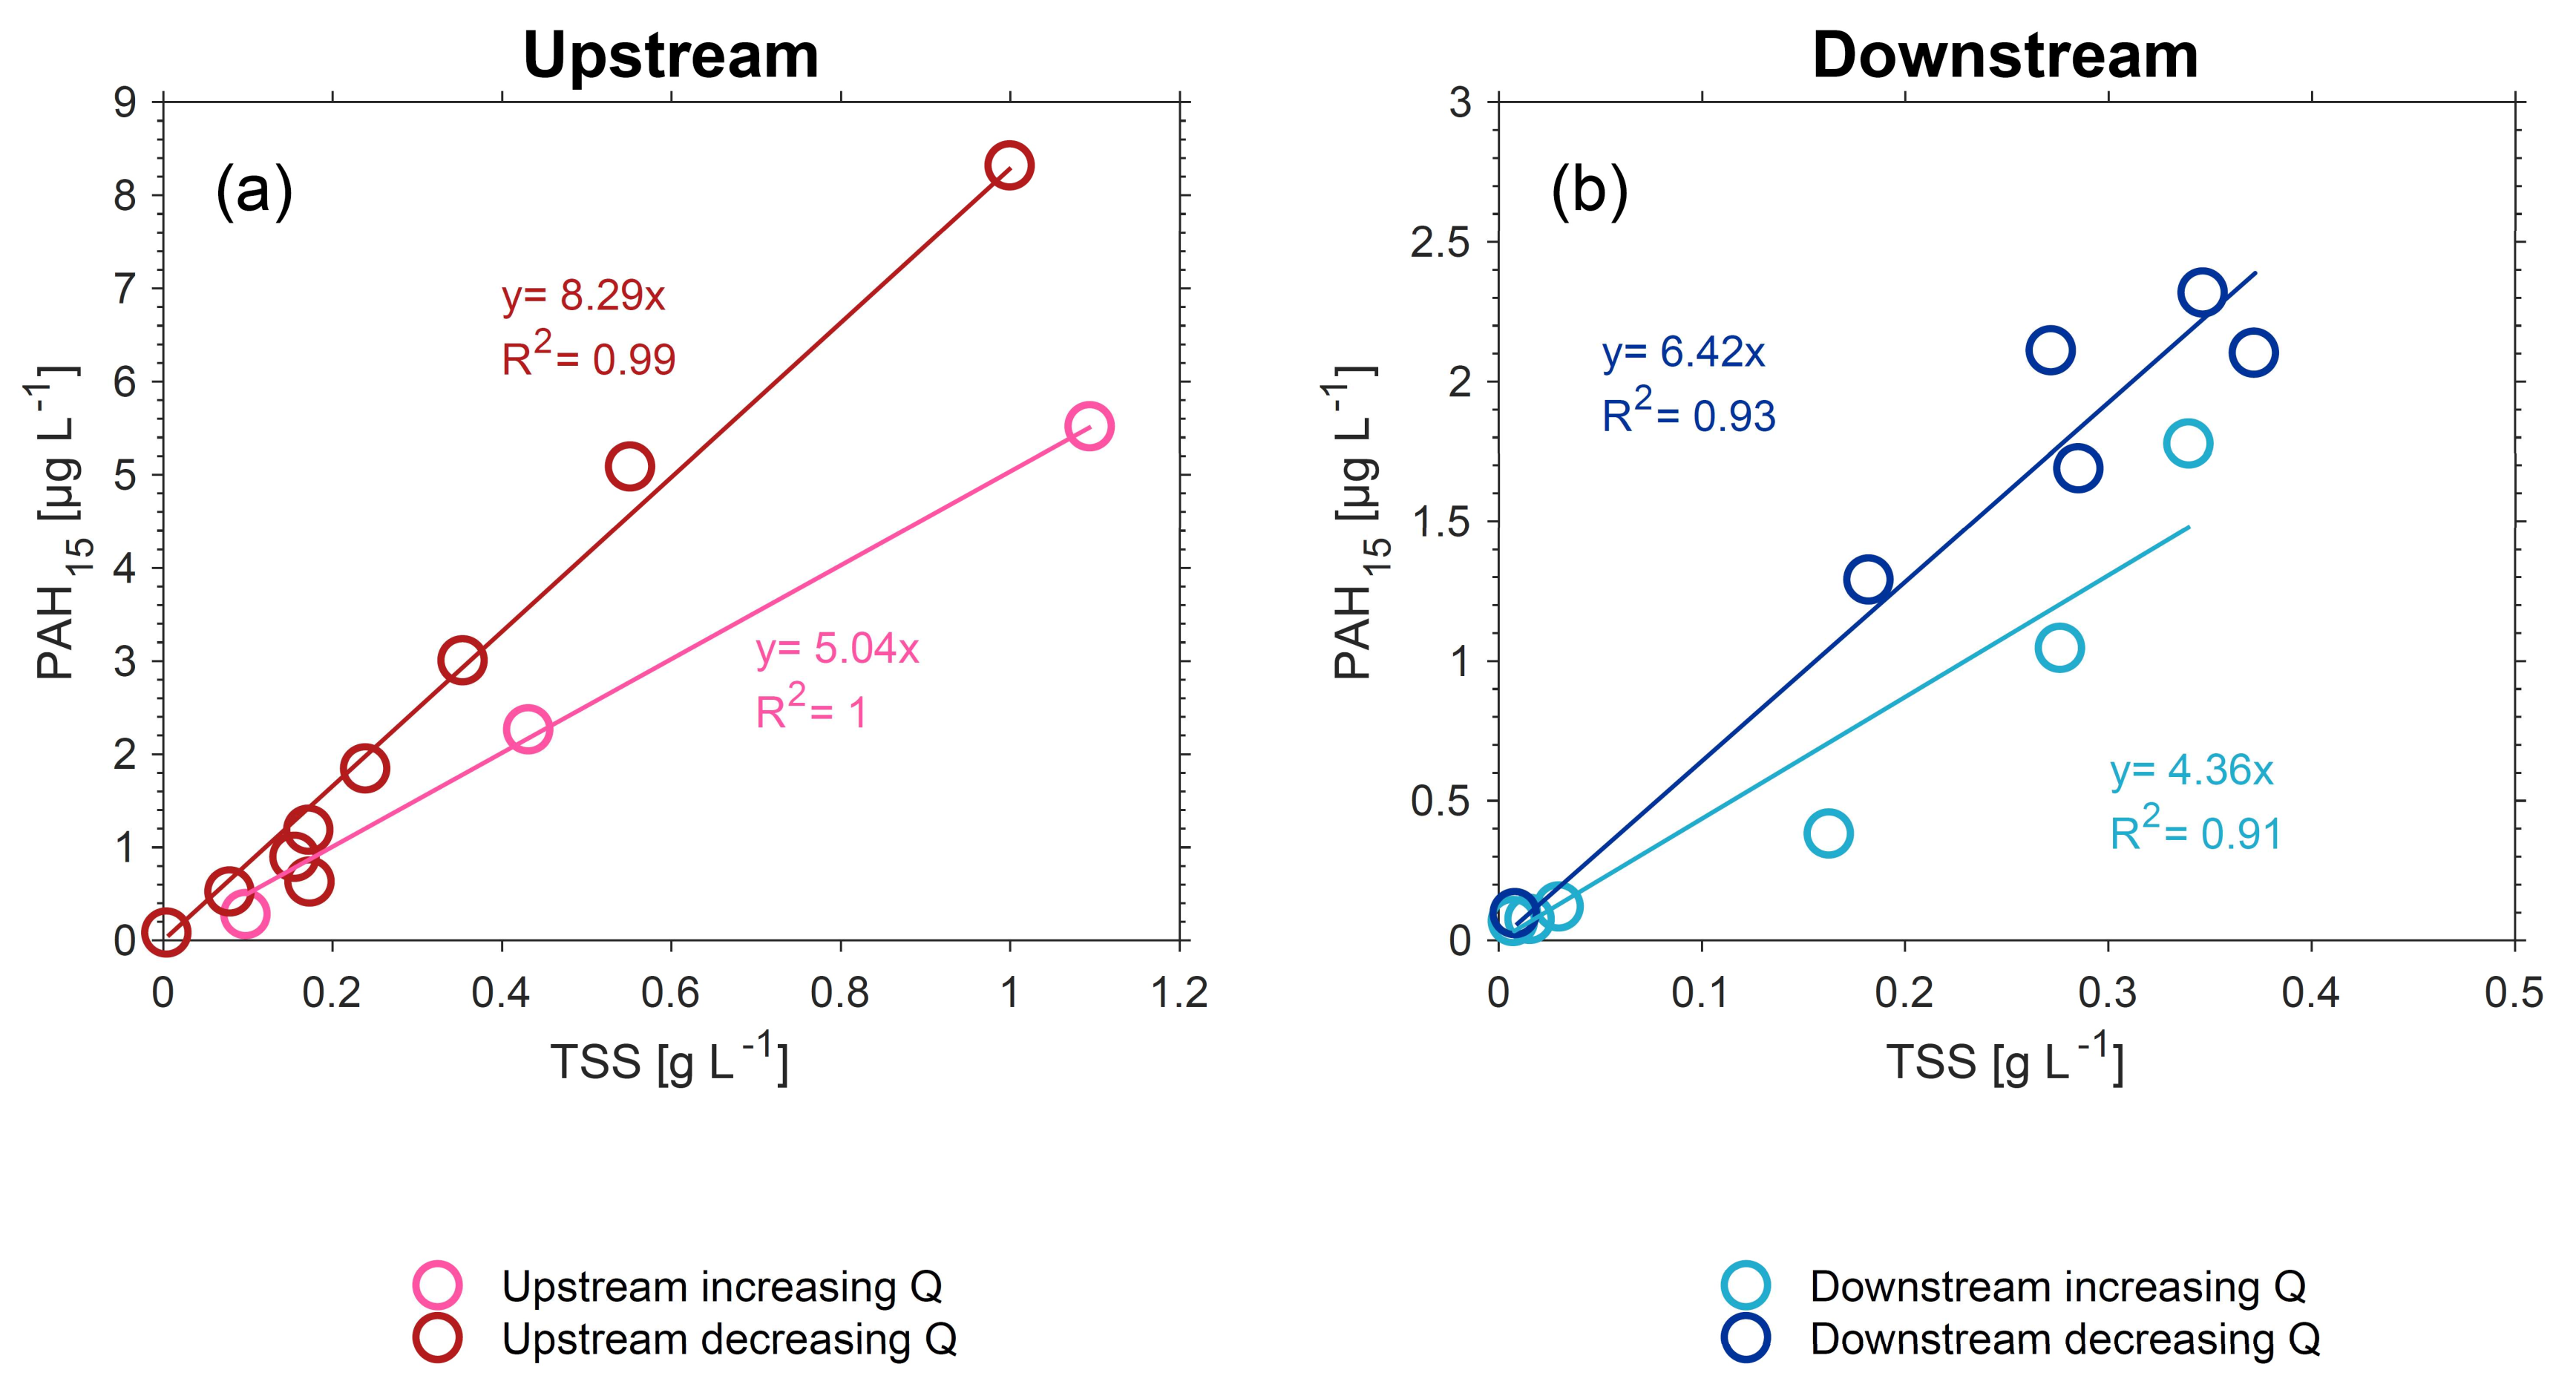
3.1. Total Mass Fluxes

Throughout the event, the discharge increase at the upstream sampling site was very steep, with a pronounced maximum of 7.2 m³ s−1. The discharge wave propagated to the downstream location with a maximum discharge of 8.8 m³ s−1 (Figure 2a). The total amount of particles transported during the event was 37.6 t at the upstream sampling site with an associated PAH mass of 211 g. At the downstream sampling site, 32.8 t particles were transported for the duration of the event, and the total PAH mass transported at this sampling site was 152 g. Comparing the transported amounts of particles between both sampling sites led to a particle mass loss of ~13%, which was negligible due to possible measurement errors arising, among others, from converting turbidity into TSS measurements for missing data points (Equation (5)). PAH mass decreased by ~28% along with the longitudinal profile. Downstream, POC content on average increased by 3.5%-points (downstream average of 9.6 ± 3.5%).
Turbidity, as a proxy for particle concentration (R² ≥ 0.82, Figure 2b), peaked slightly before the discharge peak (Figure 2a) that led to a clockwise, but generally steep hysteresis relation (Figure 2d) for the upstream sampling site. A linear PAH–TSS relation (R² = 0.87, Figure 2c) led to a mean PAH suspended particle loading of ~6.8 µg g−1. A temporal delay of the turbidity peak in relation to the discharge maximum was observed for the downstream sampling site, which led to a counter-clockwise hysteresis with a milder relation between TSS and Q (Figure 2d). The linear PAH–TSS relation (R² = 0.88, Figure 2c) at the downstream sampling site indicated a mean PAH suspended particle loading of ~5.7 µg g−1.

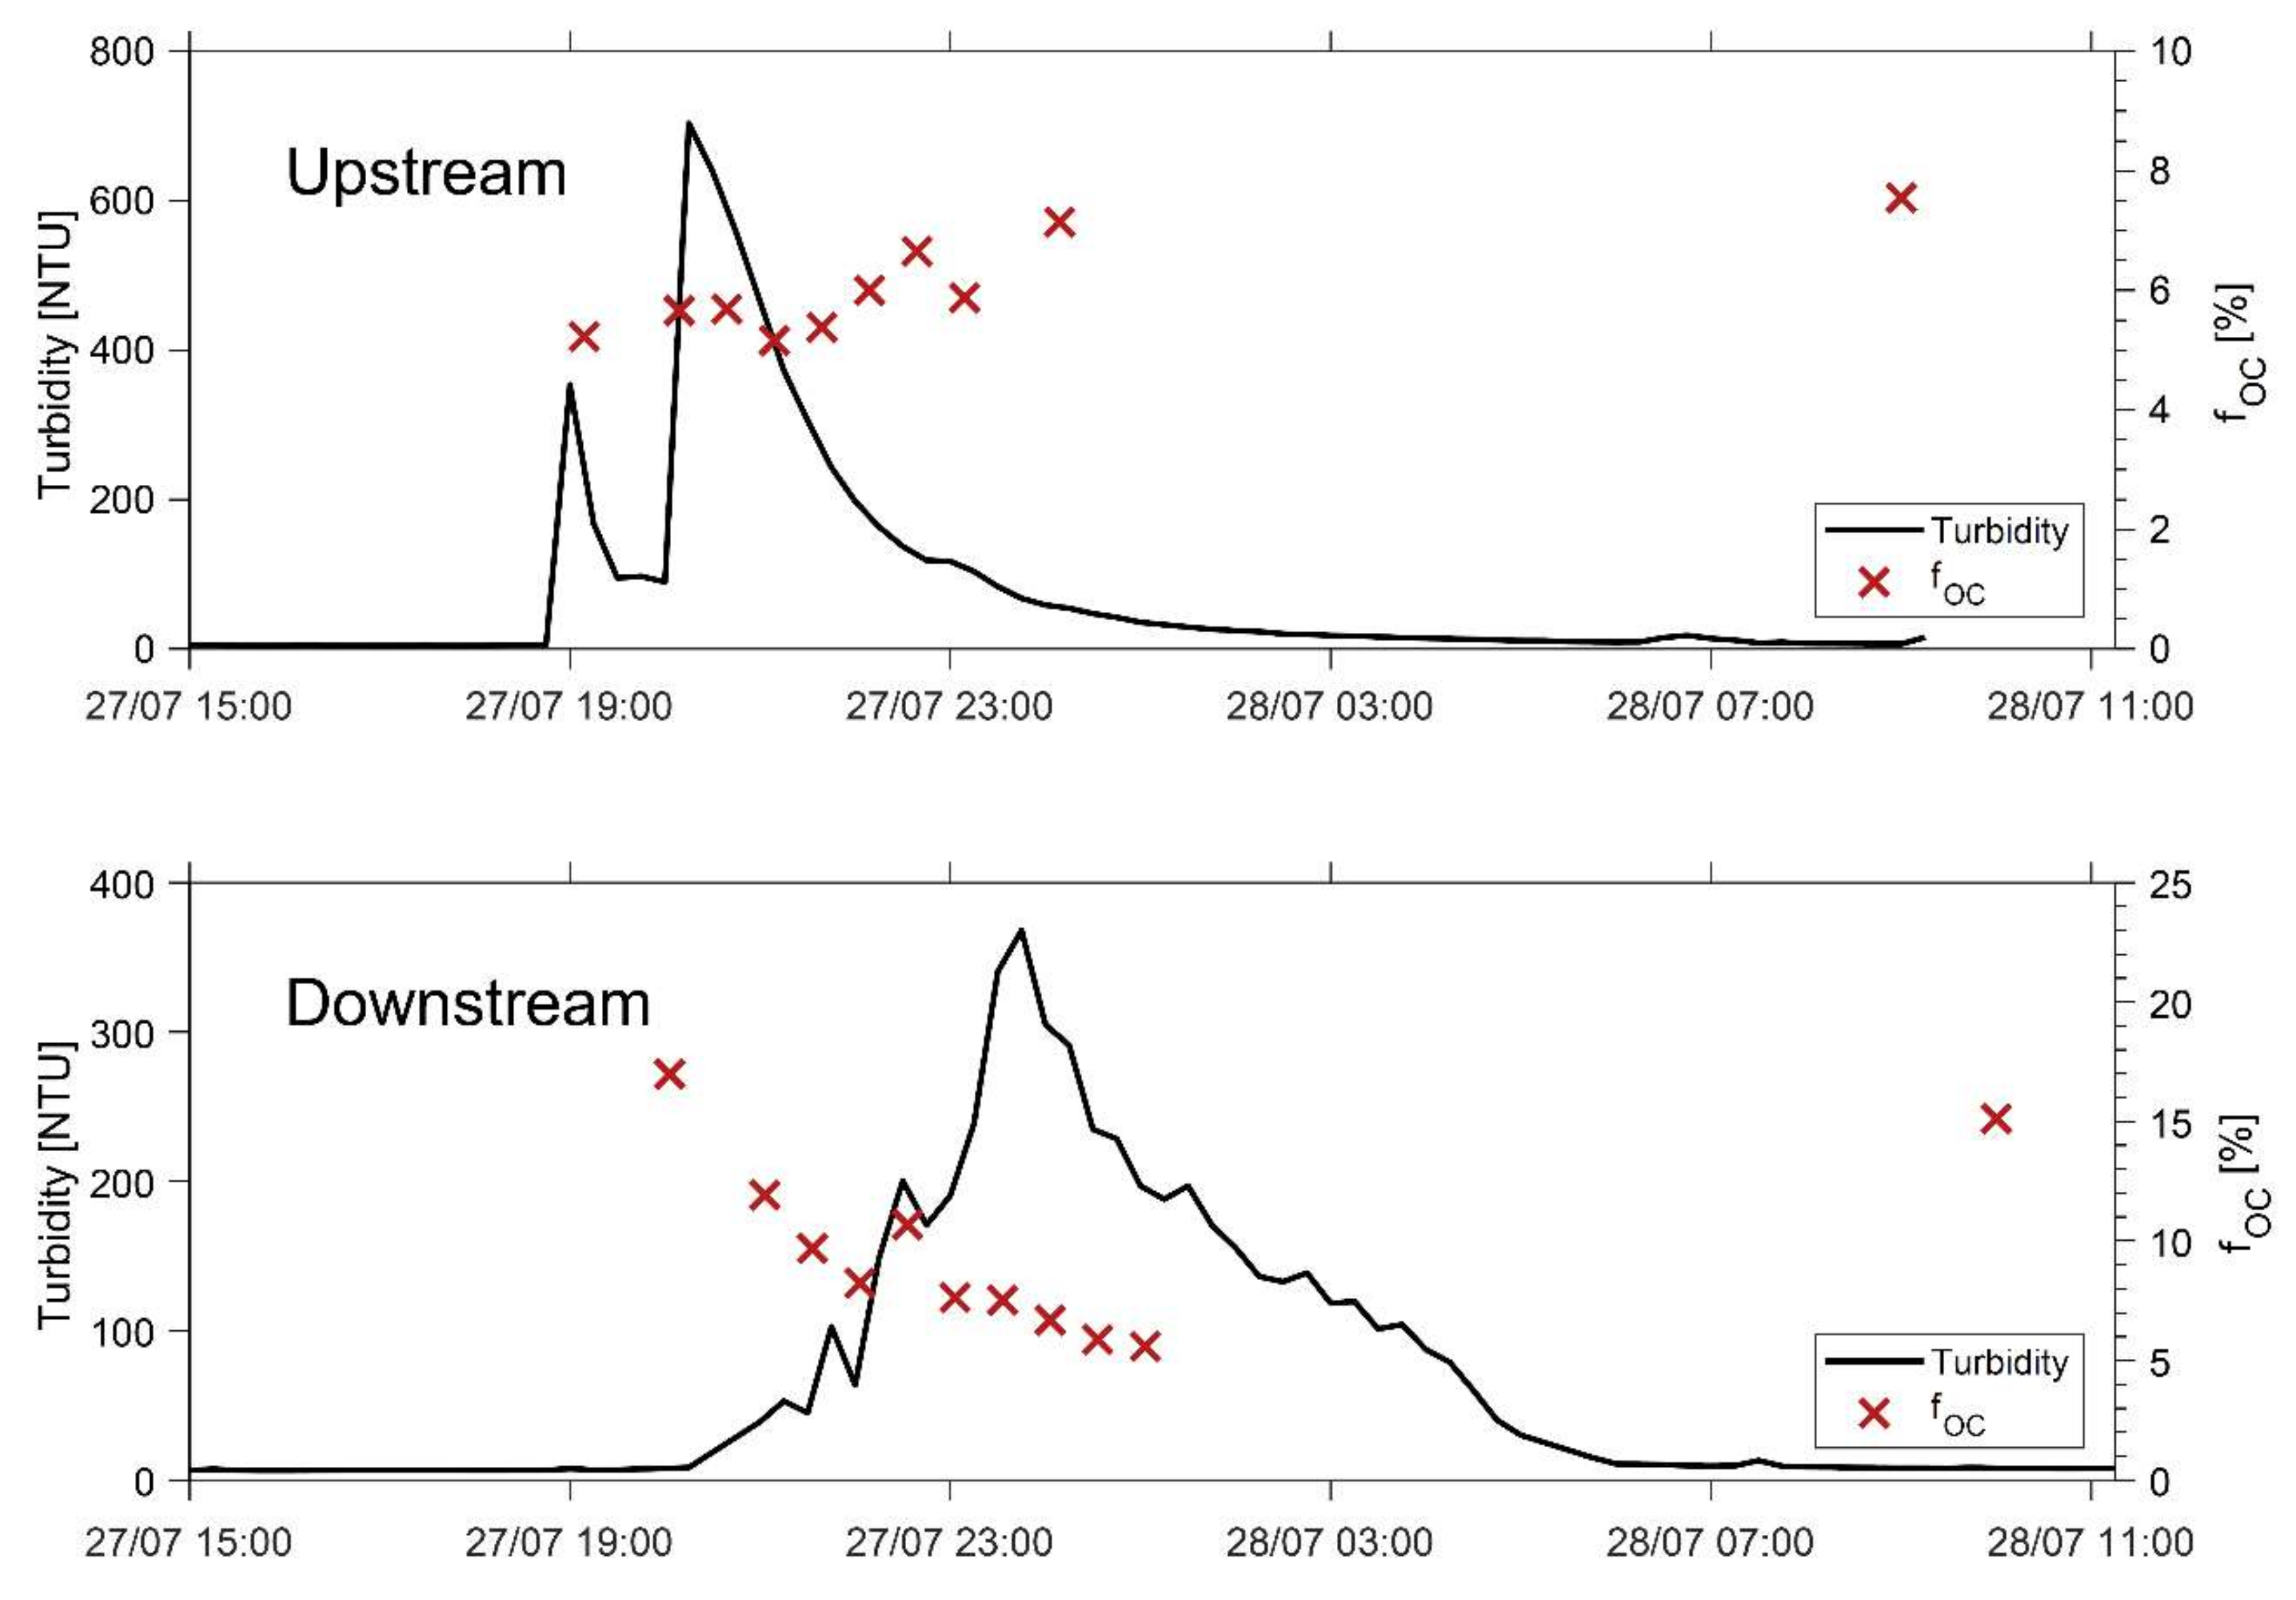
3.2. Particle Dynamics

Upstream, larger median particle sizes of 25.5 ± 3.6) µm dominated at the beginning of the event followed by consistently smaller particles (14.0 ± 1.7 µm; Figure 2e). In comparison, for the downstream sampling site, a clearly larger median particle diameter dominated at the beginning (36.0 ± 4.8 µm) and was followed by smaller, relatively constant median particle sizes (19.2 ± 5.9 µm), which were similar to the smaller particles at a later time of the upstream sampling site. For all described relations and both sampling sites, the shift in the respective characteristics co-occurred with the shift from increasing to decreasing discharge conditions.
Assessment of the PAH – TSS relation with respect to a differentiation between increasing and decreasing discharge conditions showed that two groups of correlations existed (Figure 3a,b). A reduced PAH loading could be observed for samples obtained during the increasing discharge limb for both the upstream (~5.0 µg g−1) and the downstream (~4.4 µg g−1) location compared to decreasing discharge conditions (upstream: ~8.3 µg g-1; downstream: ~6.4 µg g−1).
POC content of particles (POC per TSS; fOC) remained constant over the course of the event with 6.1 (± 0.9)% at the upstream sampling site. Downstream, the POC content was significantly higher at the beginning of the event (up to ~17%) and decreased to 8.5 (± 2.7)% at a later time of the event (Figure 4).

4. Discussion

4.1. Urban Imprint

The pulse-like discharge pattern observed at the upstream sampling site (Figure 2a) is similar to flushing flows formerly known from controlled flood flows of dams [23]. As already identified in previous investigations [21], the combined sewer system in the upstream catchment introduces stormwater into the Ammer River in case of heavy precipitation at the city of Herrenberg that often leads to prominent discharge peaks. Surface runoff from agricultural areas, on the contrary, does not contribute significantly to the discharge in the Ammer catchment due to a flat topography [18] and the lacking connection between soils and streams [21]. Overbank flows and inundation of the floodplain usually do not occur due to the modified, deeply incised river channel. The loading of particles (Figure 2c) with the hydrophobic PAHs being an indicator of urban activities (traffic, combustion/heating) [8] was very high. Untreated surface runoff and stormwater release were described as the main source of PAHs in rivers [4,24]. PAH loading of suspended Ammer particles (Figure 3) up to 8.3 mg kg−1 are similar to literature values of urban sediment PAH loadings ranging between 7.6 mg kg-1 for Bergen, Norway [25], up to 10 mg kg−1 in Luleå, Sweden [26], which shows that the urban areas constitute a major inflow pathway for contaminated particles into the Ammer River during high discharge conditions.
The general discharge pattern downstream is similar to the one at the upstream sampling site, except for a more dampened peak and recession and a larger total Q due to the additional inputs in between both sampling sites. The temporal offset between turbidity and discharge was explained by a distant source of particles in previous investigations [23]. Suspended particles travel at velocities close to the mean flow velocity [27], while the wave velocity is 5/3 times the mean water flow velocity according to the kinematic wave approach under idealized conditions [28]. The particle size at a later time of the event is similar to particles upstream already described to originate from the urban inflow in the upper catchment (Figure 2e).

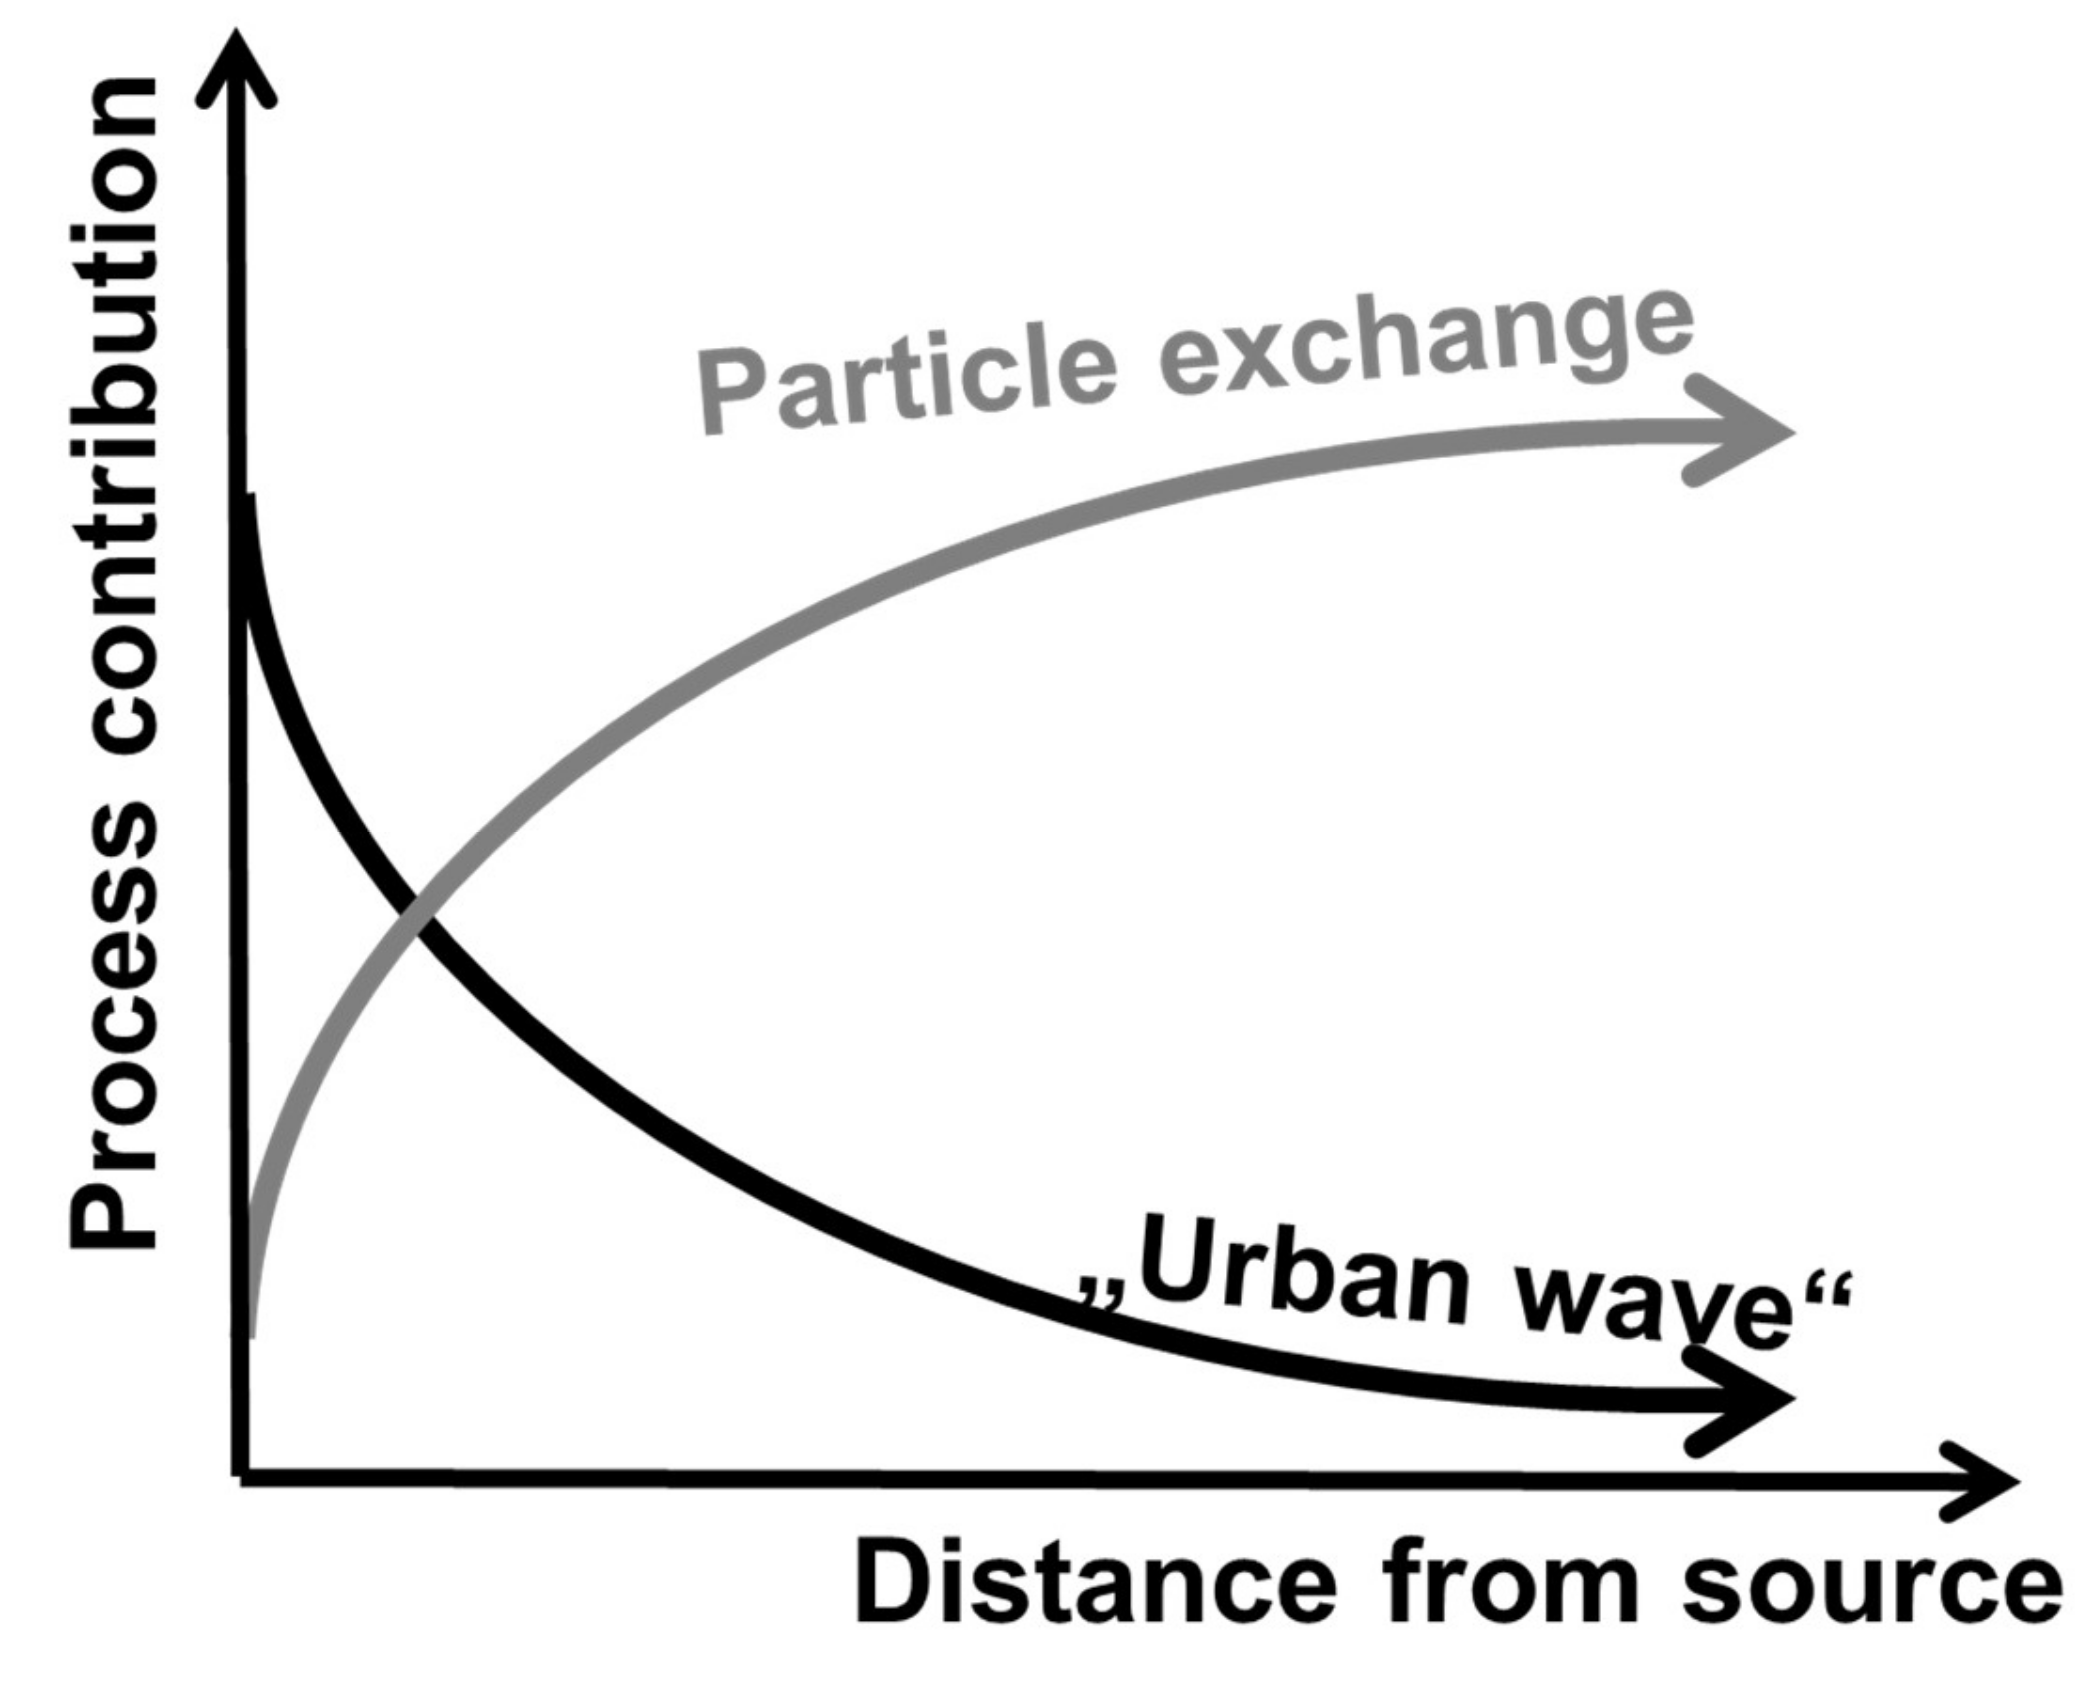
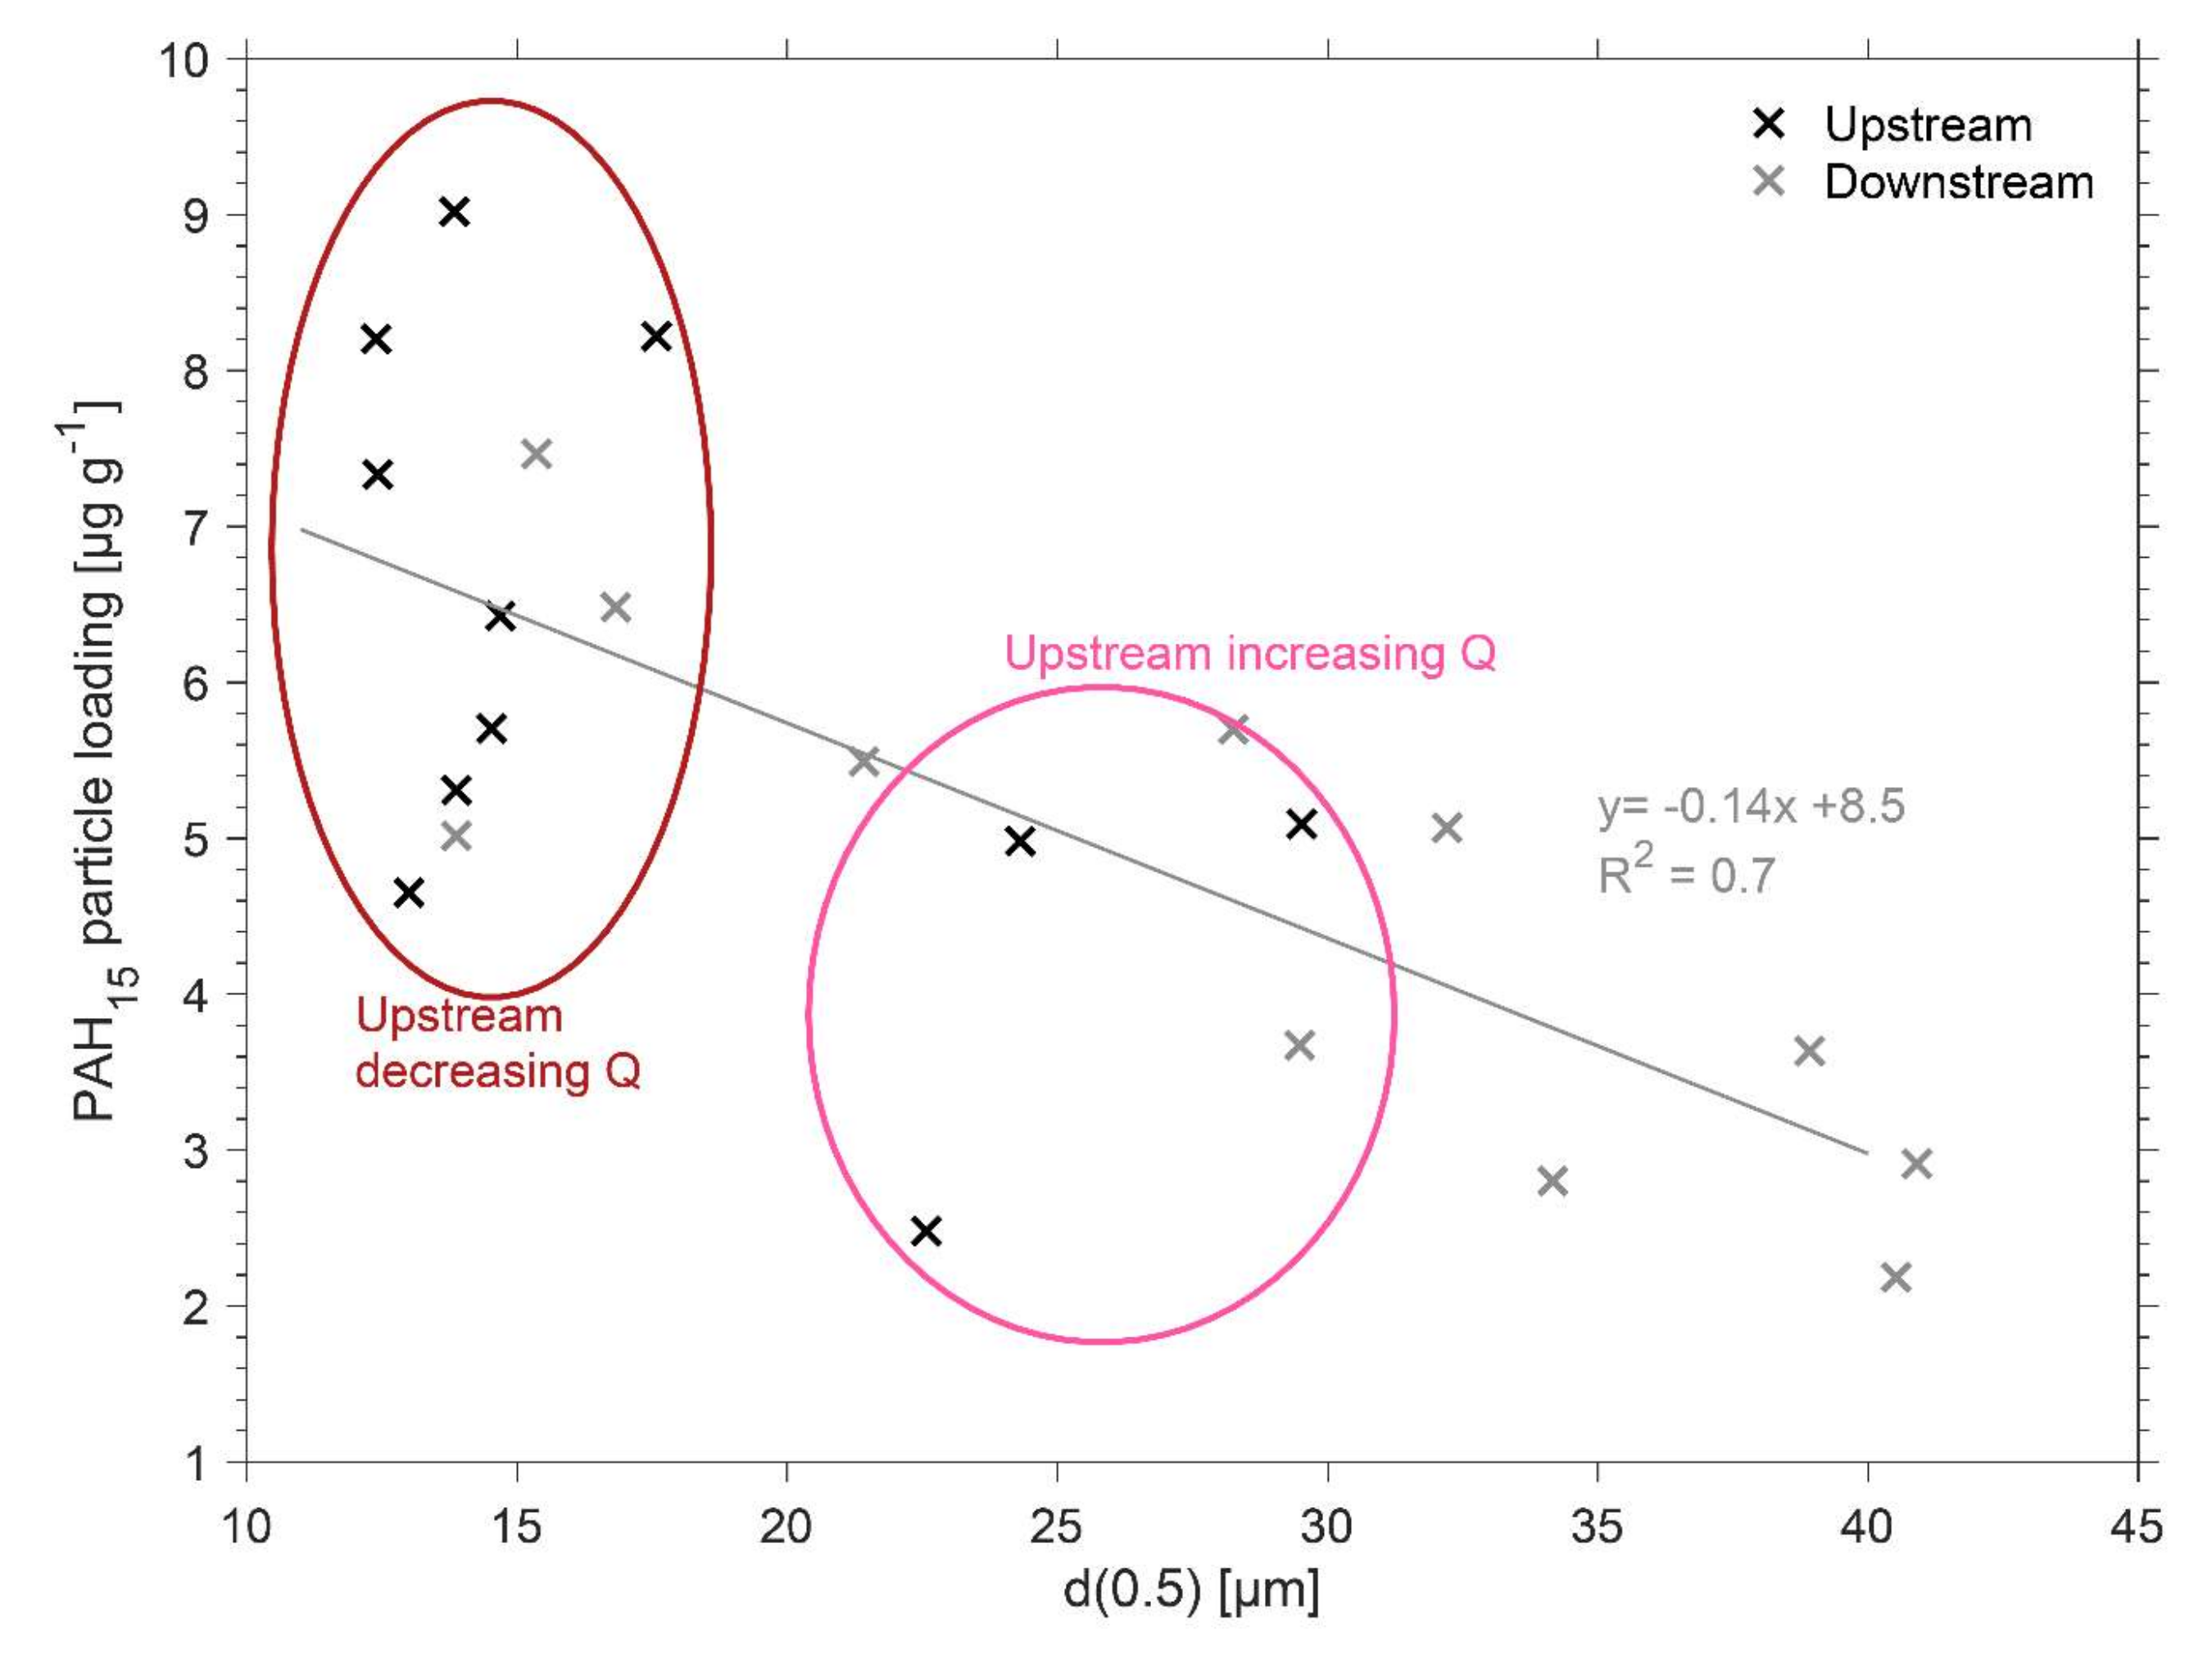
4.2. Particle Exchange Along the Longitudinal Profile

The nearly constant load of particles at both sampling sites demonstrates that no significant net gain or loss of particles occurs along the stretch. In contrast, the PAH mass decreases along the longitudinal profile. Only a minor PAH release is expected from the main tributaries due to the mainly agriculturally dominated land use in these sub-catchments. Since the overall particle mass remains constant, less contaminated particles contribute more to the particle load further downstream, which could be indicative of particle exchange that occurred along the stretch. Underlying processes responsible for the exchange can be deduced from temporally changing particle characteristics. At the upstream location, the absence of a significant temporal offset, and thus, similar relative travel time between Q and the turbidity or TSS, respectively, points to a close particle source [27] and a clockwise hysteresis for the TSS–Q relation may, besides a generally close particle source, denote a rapid initial delivery of sediment from the channel [29]. The riverbed mobilization during that time might occur due to a higher discharge energy gradient with the rising limb for a given flow depth compared to decreasing discharge conditions that lead to higher shear stress and enhance the erosion competence of the flow [30] or due to a source depletion of to be mobilized sediment particles in the course of the event. The former argument would explain why the turning point of the particle size–Q relation is identical to the change in discharge. The significantly larger median particle size supports the interpretation of initial sediment delivery from river bed mobilization during the rising discharge limb (Figure 2e) since coarser particles are expected to dominate in the bed sediment compared to the particle composition in suspension [31]. Thus, we suggest that the source of particles at the upstream location that dominates at the beginning of the event until the maximum Q has been reached is mobilized riverbed sediment, followed by the dominant urban inflow contributing with freshly introduced urban particles.
The POC content of suspended particles is higher at the downstream location, which supports the hypothesis that particle exchange bringing more organic particles in suspension occurred along the longitudinal profile. The generally increased POC content is likely due to the influence of the WWTP that introduces nutrients into the river, thus, enhancing inter alia primary production [32]. At the beginning of the event, the POC content is increased (Figure 4), which could indicate that an organic-rich layer that covers the riverbed sediment is mobilized first. Previous investigations claim that the breaking-up of biofilms leads to a delaying release of sediment into urban rivers [33], and thus, causes an anti-clockwise hysteresis between TSS and Q. This may also explain the anti-clockwise hysteresis between both parameters for the downstream sampling site (Figure 2d) that apparently contradicts the interpretation of an initial bed sediment delivery for this location. Breaking up of biofilm was discussed to be followed by an increased material release in the latter part of the event [33]. This seems plausible for the Ammer River since coarser median particle sizes dominate at the beginning compared to upstream mobilized particles (Figure 2e). Thus, it supports the interpretation of river bed mobilization as an important first process relevant at this sampling site, as well. Consequently, the source of mobilized particles may be close to the respective sampling site despite the delayed arrival. Since the POC proportion does not reach a constant ‘background proportion’ of the upstream sampling site at any time, river bed mobilization of POC-rich particles is likely to contribute significantly to an exchange of particles downstream even at a later time of the event despite the dominant urban imprint during that time.

4.3. PAHs: Memory Effect from Previous Baseflow Conditions?

The total particle-attached PAH mass transported during the event is higher at the upstream location and can be attributed to the urban inputs located in the upper catchment, as discussed in the previous sections. The proportion of particles exchanged through cycling between suspension and bed sediment increases along the longitudinal profile with increasing distance to the main particle source. Particle exchange leads to a mixed-signal of freshly introduced urban particles and particles arising from the intermediate storage compartment integrating the net sedimentation from previous events (Figure 5). Exchanged particles from the sediment storage smoothen the PAH burden of episodic, short-term urban inflows. Exchange with the sediment storage contributes to the robustness of correlations between PAHs and TSS, which was observed over many years, also for other rivers [7,8,15].
Interestingly, the PAH loading of firstly mobilized particles from river bed sediment is lower compared to particles arriving at a later time from the urban inflow for both sampling sites (Figure 3). This could point to a different origin of particles with different sizes, though the high PAH loading demonstrates that also the firstly mobilized particle originally arose from the urban areas. The reduced PAH particle loading could be a particle size-specific mass transfer effect due to the smaller surface area of firstly mobilized large particles [34]. A correlation between particle size and PAH particle loading exists for the downstream sampling site (R² = 0.7), whereas only a trend between particle size and PAH loading can be obtained from the data upstream either due to an insufficient amount of samples or the dominance of the urban inflow (Figure 6). An alternative explanation is the leaching of PAH during prolonged base flow periods without fresh inputs, continuously decreasing the loading of bed sediment particles. [10] interpret diffusion of PAH from the bed to the river water during low-flow conditions (especially for mild river reaches) as a driving factor for a shorter turnover time (=the renewal of sediments and/or attached PAHs) of the attached PAH in comparison to the bed sediment. Moreover, laboratory column experiments identified that leaching is an important process for PAHs attached to soils [35]. Under field-conditions, particles may be stored for long times in the riverbed sediment, which is in permanent contact with the river water. During dry weather conditions, contaminated sediments may become the only source of PAH to river water. The result of the leaching process might, therefore, be visible during high discharges in addition to the consequences of the transient interplay between the riverbed and suspended particles. Both processes may form the chemical signature of suspended particles during high discharge conditions. This would imply that leaching is an additional, important exchange process between riverbed sediment and flowing river water occurring during preceding baseflow conditions. According to the assumptions above, the strictly episodic inputs of urban particles via storm sewers and combined sewer overflows are smoothed in a downstream direction by a dual-effect. First, intermediate storage in the bed sediment, the re-mobilization during flood events, and the associated mixing with the freshly introduced suspended particles increasingly homogenize particle-loadings in a downstream direction (Figure 5). Second, the leaching of sediments during low flows results in a redistribution of PAHs from the particle-bound phase towards the dissolved phase, equally increasing downstream. The bulk transfer of PAHs is thereby rendered from purely episodic towards more continuous with increasing distance from the urban inputs. This may be interpreted as a positive self-purification effect, mitigating peak concentrations. However, it may also complicate river basin management since the relationships between the occurrence of contaminants and the input pathways and events are being masked. In essence, urban water management should focus more on retaining urban particles, e.g., by providing larger volumes for stormwater retention. A reduced frequency of overflow events will result in reduced peak concentrations during flood events, as well as in lower dissolved concentrations during baseflow conditions. How quickly mitigation measures become visible in improved sediment and water quality depends, among others, on the sediment residence times of individual river systems.

5. Conclusions

The findings of this study demonstrate that a transient interaction of suspended particles with the riverbed sediment can be deduced from the measurements on PAHs deriving from urban inputs. Spatially and temporally variable particle mobilization mechanisms contribute to the overall particle load, particle composition, and size distribution, as well as particle-associated contaminant load and shape the “particle signature” of suspensions as it moves through the catchment. Therefore, riverbed sediments work as intermediate storage for contaminated particles from upstream sources as the particles are transported downstream during high discharge events. Gradual releases from this intermediate storage, in turn, lead to the well-established robust linear correlations between PAHs and total suspended particles, despite the different particle sources and turnover processes occurring along the river profile. The Ammer River constitutes a vivid example since the input of “clean” background particles from the catchment is limited, and the urban imprint is, therefore, clearly visible. It also emphasizes that the vulnerability of rivers to urban inputs has to be assessed individually and that in such cases, measures to reduce urban sediment inputs further should be considered.
Although, in general, loadings on suspended particles are dominated mainly by the proportion of introduced urban to background particles, particle-attached contaminant turnover processes are relevant on a short timescale (sediment mobilization) and, in addition, face processes relevant on a long timescale (chemical leaching). Hence, processes such as leaching during the preceding baseflow period have to be considered for the interpretation of data obtained during rain events. As a consequence, the comparability of data attained during different flood events will, on the one hand, strongly depend on the hydro-meteorological characteristics of the respective rain event, and, on the other hand, on the duration and general conditions of the previous baseflow situation. Open research questions remain with respect to the identification of the sediment as a source of (dissolved) pollutants. However, reliable field-based measurements are complicated by the expected small mass fluxes between sediment and water column, the potentially long time scale of this process, and the need to overcome heterogeneities in contaminated sediments. Additional tracers to track the “sedimentation age” of particles and compounds could be helpful for this purpose.

Author Contributions

Conceptualization, C.G., C.Z., H.R., and M.S.; fieldwork, C.G. and M.S.; laboratory analysis, A.L.; statistical analysis, C.G.; writing—original draft preparation, C.G., C.Z., M.S.; writing—review and editing, C.G., C.Z., H.R., and M.S.; All authors have read and agreed to the published version of the manuscript.

Funding

This work was supported by the Collaborative Research Center 1253 CAMPOS (Project P1: Rivers) funded by the German Research Foundation (DFG, Grant Agreement SFB 1253/1 2017) and financially supported by the Excellence Initiative at the University of Tübingen, funded by the German Federal Ministry of Education and Research and the German Research Foundation (DFG).

Acknowledgments

The authors thank Niklas Best, Franz Weyerer, Katharina Fischer, Judith Tettenborn, Laura Czekay, Tobias Junginger, Martin Ebner, Renate Seelig, Sara Cafisso, and Bernice Nisch for support in sampling and assisting in the laboratory.

Conflicts of Interest

The authors declare no conflict of interest.

References

  1. Patrolecco, L.; Ademollo, N.; Capri, S.; Pagnotta, R.; Polesello, S. Occurrence of priority hazardous PAHs in water, suspended particulate matter, sediment and common eels (Anguilla anguilla) in the urban stretch of the River Tiber (Italy). Chemosphere 2010, 81, 1386–1392. [Google Scholar] [CrossRef] [PubMed]
  2. DiBlasi, C.J.; Li, H.; Davis, A.P.; Ghosh, U. Removal and fate of polycyclic aromatic hydrocarbon pollutants in an urban stormwater bioretention facility. Environ. Sci. Technol. 2009, 43, 494–502. [Google Scholar] [CrossRef] [PubMed]
  3. Wang, W.; Huang, M.-J.; Kang, Y.; Wang, H.-S.; Leung, A.O.W.; Cheung, K.C.; Wong, M.H. Polycyclic aromatic hydrocarbons (PAHs) in urban surface dust of Guangzhou, China: Status, sources and human health risk assessment. Sci. Total Environ. 2011, 409, 4519–4527. [Google Scholar] [CrossRef] [PubMed]
  4. Zgheib, S.; Moilleron, R.; Chebbo, G. Priority pollutants in urban stormwater: Part 1—Case of separate storm sewers. Water Res. 2012, 46, 6683–6692. [Google Scholar] [CrossRef]
  5. Marttila, H.; Saarinen, T.; Celebi, A.; Kløve, B. Transport of particle-associated elements in two agriculture-dominated boreal river systems. Sci. Total Environ. 2013, 461–462, 693–705. [Google Scholar] [CrossRef]
  6. Walling, D.E. Tracing suspended sediment sources in catchments and river systems. Sci. Total Environ. 2005, 344, 159–184. [Google Scholar] [CrossRef]
  7. Rügner, H.; Schwientek, M.; Milačič, R.; Zuliani, T.; Vidmar, J.; Paunović, M.; Laschou, S.; Kalogianni, E.; Skoulikidis, N.T.; Diamantini, E.; et al. Particle bound pollutants in rivers: Results from suspended sediment sampling in Globaqua River Basins. Sci. Total Environ. 2019, 647, 645–652. [Google Scholar] [CrossRef]
  8. Schwientek, M.; Rügner, H.; Beckingham, B.; Kuch, B.; Grathwohl, P. Integrated monitoring of particle associated transport of PAHs in contrasting catchments. Environ. Pollut. 2013, 172, 155–162. [Google Scholar] [CrossRef]
  9. Nasrabadi, T.; Ruegner, H.; Schwientek, M.; Bennett, J.; Fazel Valipour, S.; Grathwohl, P. Bulk metal concentrations versus total suspended solids in rivers: Time-invariant & catchment-specific relationships. PLoS ONE 2018, 13, e0191314. [Google Scholar] [CrossRef] [Green Version]
  10. Liu, Y.; Zarfl, C.; Basu, N.B.; Cirpka, O.A. Turnover and legacy of sediment-associated PAH in a baseflow-dominated river. Sci. Total Environ. 2019, 671, 754–764. [Google Scholar] [CrossRef]
  11. Owens, P.; Walling, D.; Carton, J.; Meharg, A.; Wright, J.; Leeks, G. Downstream changes in the transport and storage of sediment-associated contaminants (P, Cr and PCBs) in agricultural and industrialized drainage basins. Sci. Total Environ. 2001, 266, 177–186. [Google Scholar] [CrossRef]
  12. Sicre, M.-A.; Fernandes, M.B.; Pont, D. Poly-aromatic hydrocarbon (PAH) inputs from the Rhône River to the Mediterranean Sea in relation with the hydrological cycle: Impact of floods. Mar. Pollut. Bull. 2008, 56, 1935–1942. [Google Scholar] [CrossRef]
  13. Rügner, H.; Schwientek, M.; Beckingham, B.; Kuch, B.; Grathwohl, P. Turbidity as a proxy for total suspended solids (TSS) and particle facilitated pollutant transport in catchments. Environ. Earth Sci. 2013, 69, 373–380. [Google Scholar] [CrossRef]
  14. Rügner, H.; Schwientek, M.; Egner, M.; Grathwohl, P. Monitoring of event-based mobilization of hydrophobic pollutants in rivers: Calibration of turbidity as a proxy for particle facilitated transport in field and laboratory. Sci. Total Environ. 2014, 490, 191–198. [Google Scholar] [CrossRef] [PubMed] [Green Version]
  15. Schwientek, M.; Rügner, H.; Scherer, U.; Rode, M.; Grathwohl, P. A parsimonious approach to estimate PAH concentrations in river sediments of anthropogenically impacted watersheds. Sci. Total Environ. 2017, 601–602, 636–645. [Google Scholar] [CrossRef] [PubMed]
  16. Ciszewski, D.; Grygar, T.M. A Review of Flood-Related Storage and Remobilization of Heavy Metal Pollutants in River Systems. Water Air Soil Pollut. 2016, 227, 239. [Google Scholar] [CrossRef] [Green Version]
  17. Herrero, A.; Bateman, A.; Medina, V. Sediment resuspension due to density currents caused by a temperature difference: Application to the Flix reservoir (Spain). J. Hydraul. Res. 2013, 51, 76–91. [Google Scholar] [CrossRef]
  18. Liu, Y.; Zarfl, C.; Basu, N.B.; Schwientek, M.; Cirpka, O.A. Contributions of catchment and in-stream processes to suspended sediment transport in a dominantly groundwater-fed catchment. Hydrol. Earth Syst. Sci. 2018, 22, 3903–3921. [Google Scholar] [CrossRef] [Green Version]
  19. Tengberg, A.; Almroth, E.; Hall, P. Resuspension and its effects on organic carbon recycling and nutrient exchange in coastal sediments: In situ measurements using new experimental technology. J. Exp. Mar. Biol. Ecol. 2003, 285–286, 119–142. [Google Scholar] [CrossRef]
  20. Villinger, E. Grundwasserbilanzen im Karstaquifer des Oberen Muschelkalks im Oberen Gäu (Baden-Württemberg). Geologisches Jahrbuch 1982, Reihe C 32, 43–61. [Google Scholar]
  21. Schwientek, M.; Osenbrück, K.; Fleischer, M. Investigating hydrological drivers of nitrate export dynamics in two agricultural catchments in Germany using high-frequency data series. Environ. Earth Sci. 2013, 69, 381–393. [Google Scholar] [CrossRef]
  22. Boden, A.R.; Reiner, E.J. Development of an isotope-dilution gas chromatographic-mass spectrometric method for the analysis of polycyclic aromatic compounds in environmental matrices. Polycycl. Aromat. Compd. 2004, 24, 309–323. [Google Scholar] [CrossRef]
  23. Batalla, R.J.; Vericat, D. Hydrological and sediment transport dynamics of flushing flows: Implications for management in large Mediterranean Rivers. River Res. Appl. 2009, 25, 297–314. [Google Scholar] [CrossRef]
  24. Blanchard, M. Origin and distribution of polyaromatic hydrocarbons and polychlorobiphenyls in urban effluents to wastewater treatment plants of the Paris area (FRANCE). Water Res. 2001, 35, 3679–3687. [Google Scholar] [CrossRef]
  25. Jartun, M.; Ottesen, R.T.; Steinnes, E.; Volden, T. Runoff of particle bound pollutants from urban impervious surfaces studied by analysis of sediments from stormwater traps. Sci. Total Environ. 2008, 396, 147–163. [Google Scholar] [CrossRef]
  26. Karlsson, K.; Viklander, M. Polycyclic Aromatic Hydrocarbons (PAH) in Water and Sediment from Gully Pots. Water Air Soil Pollut. 2008, 188, 271–282. [Google Scholar] [CrossRef]
  27. Williams, G.P. Sediment concentration versus water discharge during single hydrologic events in rivers. J. Hydrol. 1989, 111, 89–106. [Google Scholar] [CrossRef]
  28. Dingman, S.L. Fluvial Hydrology; W.H. Freeman and Co.: New York, NY, USA, 1984. [Google Scholar]
  29. Smith, H.G.; Dragovich, D. Interpreting sediment delivery processes using suspended sediment-discharge hysteresis patterns from nested upland catchments, south-eastern Australia. Hydrol. Process. 2009, 23, 2415–2426. [Google Scholar] [CrossRef]
  30. Julien, P.Y. River Mechanics; Cambridge University Press: Cambridge, UK, 2002. [Google Scholar]
  31. Wu, W.; Wang, S.S.Y. Formulas for Sediment Porosity and Settling Velocity. J. Hydraul. Eng. 2006, 132, 858–862. [Google Scholar] [CrossRef]
  32. Gücker, B.; Brauns, M.; Pusch, M.T. Effects of wastewater treatment plant discharge on ecosystem structure and function of lowland streams. J. North Am. Benthol. Soc. 2006, 25, 313–329. [Google Scholar] [CrossRef]
  33. Lawler, D.M.; Petts, G.E.; Foster, I.D.L.; Harper, S. Turbidity dynamics during spring storm events in an urban headwater river system: The Upper Tame, West Midlands, UK. Sci. Total Environ. 2006, 360, 109–126. [Google Scholar] [CrossRef] [PubMed]
  34. Wang, J.; Wang, C.; Huang, Q.; Ding, F.; He, X. Adsorption of PAHs on the Sediments from the Yellow River Delta as a Function of Particle Size and Salinity. Soil Sediment Contam. 2015, 24, 103–115. [Google Scholar] [CrossRef]
  35. Zand, A.D.; Grathwohl, P.; Nabibidhendi, G.; Mehrdadi, N. Determination of leaching behaviour of polycyclic aromatic hydrocarbons from contaminated soil by column leaching test. Waste Manag. Res. 2010, 28, 913–920. [Google Scholar] [CrossRef] [PubMed]
Figure 1. The Ammer catchment, its land use (pink—urban, yellow—agriculture, green—forest), and sampling locations (red crosses) in the Ammer main stem. The upstream sampling site 1 is located about 200 m upstream of the WWTP, whereas the downstream sampling site 2 is located at the gauging station (Pfäffingen).
Water 12 01794 g001
Figure 2. (a) Discharge (Q) (m³ s−1) and turbidity [NTU] during the time of the event with samples obtained during the rain event (crosses), (b) total suspended solids (TSS) (g L−1) – turbidity [NTU] for upstream (black) and downstream (grey) sampling sites, (c) polycyclic aromatic hydrocarbon (PAH15) concentration (µg L−1) – TSS (g L−1) relation for the upstream (black) and downstream (grey) sampling sites, (d) total suspended solids (TSS) (g L−1) – discharge (Q) (m³ s-1) relation, and (e) median particle size (d(0.5)) – discharge (Q) (m³ s−1) relation. Arrows in (d) and (e) indicate the direction of the hysteresis.
Water 12 01794 g002
Figure 3. PAH15–TSS relations for the upstream (a) and downstream (b) location split up into samples under increasing and decreasing discharge conditions.
Water 12 01794 g003
Figure 4. Time course of turbidity [NTU] and foc (%) for the upstream and downstream sampling sites.
Water 12 01794 g004
Figure 5. Development of suspended particle signature along the longitudinal profile. Exchanged particles are expected to increase with increasing distance from the sewer system, whereas the impact from the urban areas (“urban wave”) is expected to decrease along the longitudinal profile.
Water 12 01794 g005
Figure 6. Relationship between PAH15 particle loading (µg g−1) and median particle size (µm).
Water 12 01794 g006

