Article

Identifying Optimal Sites for a Rainwater-Harvesting Agricultural Scheme in Iran Using the Best-Worst Method and Fuzzy Logic in a GIS-Based Decision Support System

1
College of Water Conservancy & Hydropower Engineering, Hohai University, Nanjing 210098, China
2
Center for General Education, Tzu-Chi University, No. 701, Zhongyang Rd., Sec. 3, Hualien 97004, Taiwan
*
Author to whom correspondence should be addressed.
Water 2020, 12(7), 1913; https://doi.org/10.3390/w12071913
Submission received: 18 June 2020 / Revised: 30 June 2020 / Accepted: 1 July 2020 / Published: 4 July 2020
(This article belongs to the Special Issue Agriculture Water Management and Water Saving Strategies)

Abstract

:
Rainwater-harvesting (RWH) agriculture has been accepted as an effective approach to easing the overexploitation of groundwater and the associated socioeconomic impacts in arid and semiarid areas. However, the stability and reliability of the traditional methods for selecting optimal sites for RWH agriculture need to be further enhanced. Based on a case study in Tehran Province, Iran, this study proposed a new decision support system (DSS) that incorporates the Best-Worst Method (BWM) and Fuzzy logic into a geographic information system (GIS) environment. The probabilistic analysis of the rainfall pattern using Monte Carlo simulation was conducted and adopted in the DSS. The results have been demonstrated using suitability maps based on three types of RWH systems, i.e., pans and ponds, percolation tanks, and check dams. Compared with traditional methods, the sensitivity analysis has verified that the proposed DSS is more stable and reliable than the traditional methods. Based on the results, a phase-wise strategy that shifts the current unsustainable agriculture to a new paradigm based on RWH agriculture has been discussed. Therefore, this DSS has enhanced the information value and thus can be accepted as a useful tool to ease the dilemma resulting from unsustainable agriculture in arid and semiarid areas.

1. Introduction

The worsening overexploitation of groundwater in the agricultural sector of arid and semiarid areas worldwide has resulted in severe negative impacts, e.g., declining aquifer heads, groundwater quality deterioration, lower crop yields, land subsidence, seawater intrusion, increased energy consumption, and even degenerated ecosystems [1,2,3]. Moreover, the social and economic consequences associated with such unsustainable agricultural practices may further challenge human development in these areas [4,5].
In Iran, the overexploitation of groundwater is largely due to the misplacement of agricultural areas and the lack of an alternative water supply [6,7]. The agricultural sector with traditional irrigation methods that largely depend on deep wells, consumes 92% of the country’s water [8]. The conventional strategy, e.g., constructing more large dams and exploiting more groundwater, to increase the water supply against increased demand over the last three decades was not a solution but a problem in Iran [9]. Land suitability analysis indicates that most of Iran’s current farmland is located in unsuitable and very poorly suitable lands, which leads to overexploitation of groundwater and impaired agriculture with low productivity [6]. This situation is particularly noticeable in Tehran Province (capital of Iran). The collapse of agriculture has caused migration from rural to urban areas in some parts of the country [10]. These problems are urgent and important. Therefore, a comprehensive strategy for reallocating agricultural development with the support of alternative water sources is critically important to ease the overexploitation of groundwater and associated socioeconomic dilemmas in this country [11].
Rainwater-harvesting (RWH) systems have been identified as an effective alternative water source and a useful approach for the agricultural sector to overcome water scarcity, thereby reducing the dependency on groundwater irrigation in arid and semiarid regions around the world [12,13]. Research on RWH agricultural irrigation has been conducted in many parts of the world, such as India, China, the United States (USA), South Africa, and the Netherlands, over the last two decades [14]. Successful examples of the various agricultural RWH techniques being practiced in sub-Saharan Africa (SSA) [15], Iran [16,17], and China [18] show that RWH systems are effective in improving soil moisture, erosion and flood control, and groundwater recharge, increasing agricultural production, and in turn reducing the risks of spatial and temporal water scarcity [19,20,21,22,23,24,25,26,27].
Some field studies in Iran (Fars Province) show that microcatchment water-harvesting systems in grape cultivation using 9 m2 microcatchments for each individual plant can achieve a 40% increase in yield [17]. Another case experiment in the arid and semiarid region of Iran (Khorasan Province) indicated that RWH can be used as a supplementary water resource, and the grain yield is almost double that of conventional rainfed cultivation [16]. Despite these single-site reports of effective RWH settings, Iran is in desperate need of a comprehensive strategy for transforming the existing unsustainable agriculture into RWH agriculture on a large scale. For this purpose, identifying the optimal sites for rainwater-harvesting agriculture using various types of RWH systems as alternative water sources should be the first and crucial approach.
Acknowledging the importance of spatial information in large-scale applications, researchers often incorporate hydraulic models into geographic information system (GIS) to obtain the optimal sites for RWH agriculture [28,29]. However, in such a large-scale implementation, the socioeconomic complexity involved in the study areas should not be neglected. To overcome such limitations, multiple criteria decision making (MCDM) has been adopted by researchers, and traditionally the analytic hierarchy process (AHP) has been most commonly adopted and incorporated within GIS to address multi-criteria scenarios, especially in arid and semiarid regions [30,31,32,33,34,35,36]. AHP was developed by Thomas Saaty in the 1980s and then widely applied for organizing complex decisions based on professional knowledge [37]. The AHP method is implemented based on the subjective evaluation of the decision makers or experts by the pairwise comparison matrices. However, these comparisons with the number of n(n − 1)/2 are not consistent, which can lead to uncertain results [38]. To address such shortcomings, a newer method, namely, the Best-Worst Method (BWM), proposed by J. Rezaei (2015), has been proven to give more accurate and reliable results than that of AHP [39]. The BWM is a vector-based comparison method with fewer pairwise comparisons 2n − 3 which, therefore, reduces the calculations and enhances the consistency and reliability of the results. In addition, the BWM has the capability for combination with other MCDM methods and easier access, as it uses only integers on a scale between 1 and 9 [39,40,41,42].
Despite the value of the BWM, the subjectivity level in the assessment of the BWM, which is also a subjective expert evaluation, needs to be reduced when incorporated in an MCDM process. Moreover, the important drawback in such comparison-based assessments for both the AHP and the BWM is the associated ambiguity and intangibility, while decision makers use the qualitative assessment of a scale-based comparison in a real-life problem [43]. In the case of site selection for RWH systems, such drawbacks occurred as researchers often used an MCDM method solely to obtain the weights of the criteria. To overcome such shortcomings, Fuzzy logic has been proposed, as it has a precise compatibility with the subjective evaluation of decision makers and has been identified as more reliable [38]. Therefore, incorporating the BWM with Fuzzy logic in GIS environment can support sounder decision making by providing more realistic and reliable prioritization.
In addition, rainfall data, as the significant impact on the efficiency of RWH systems, should be carefully investigated. However, most of the previous studies tend to use a fixed amount, e.g., average annual rainfall, to indicate the rainfall supply while neglecting the importance of rainfall patterns and the associated probabilistic distributions [30]. Therefore, rainfall patterns should be examined, and the socioeconomic complex should be taken into account in the MCDM using a more advanced approach. Only when policy and decision makers have received comprehensive and integrated information to identify the areas for RWH agriculture will they be able to make sound decisions when promoting RWH agriculture to ease the overexploitation of groundwater and the associated socioeconomic dilemmas.
This study proposes a new GIS-based Decision Support System (DSS) that incorporates BWM and Fuzzy logic to identify the optimal sites for RWH agriculture. This DSS case study is based on the arid and semiarid areas of Tehran Province, Iran. The rainfall pattern will be analyzed using Monte Carlo simulation and three types of RWH, i.e., pans and ponds, percolation tanks, and check dams will be tested to obtain suitability maps. Accordingly, the strategy for promoting RWH agriculture will thereby be discussed. Therefore, the purpose of this study is threefold: first, to develop the proposed GIS-based DSS that achieves suitable maps for three types of RWH agriculture; second, to perform a sensitivity analysis that validates the performance of the proposed method by comparing it with traditional methods; and third, to discuss the phase-wise strategy of transiting the current unsustainable agriculture to a new paradigm of RWH agriculture based on the results of DSS.

2. Methodology and Materials

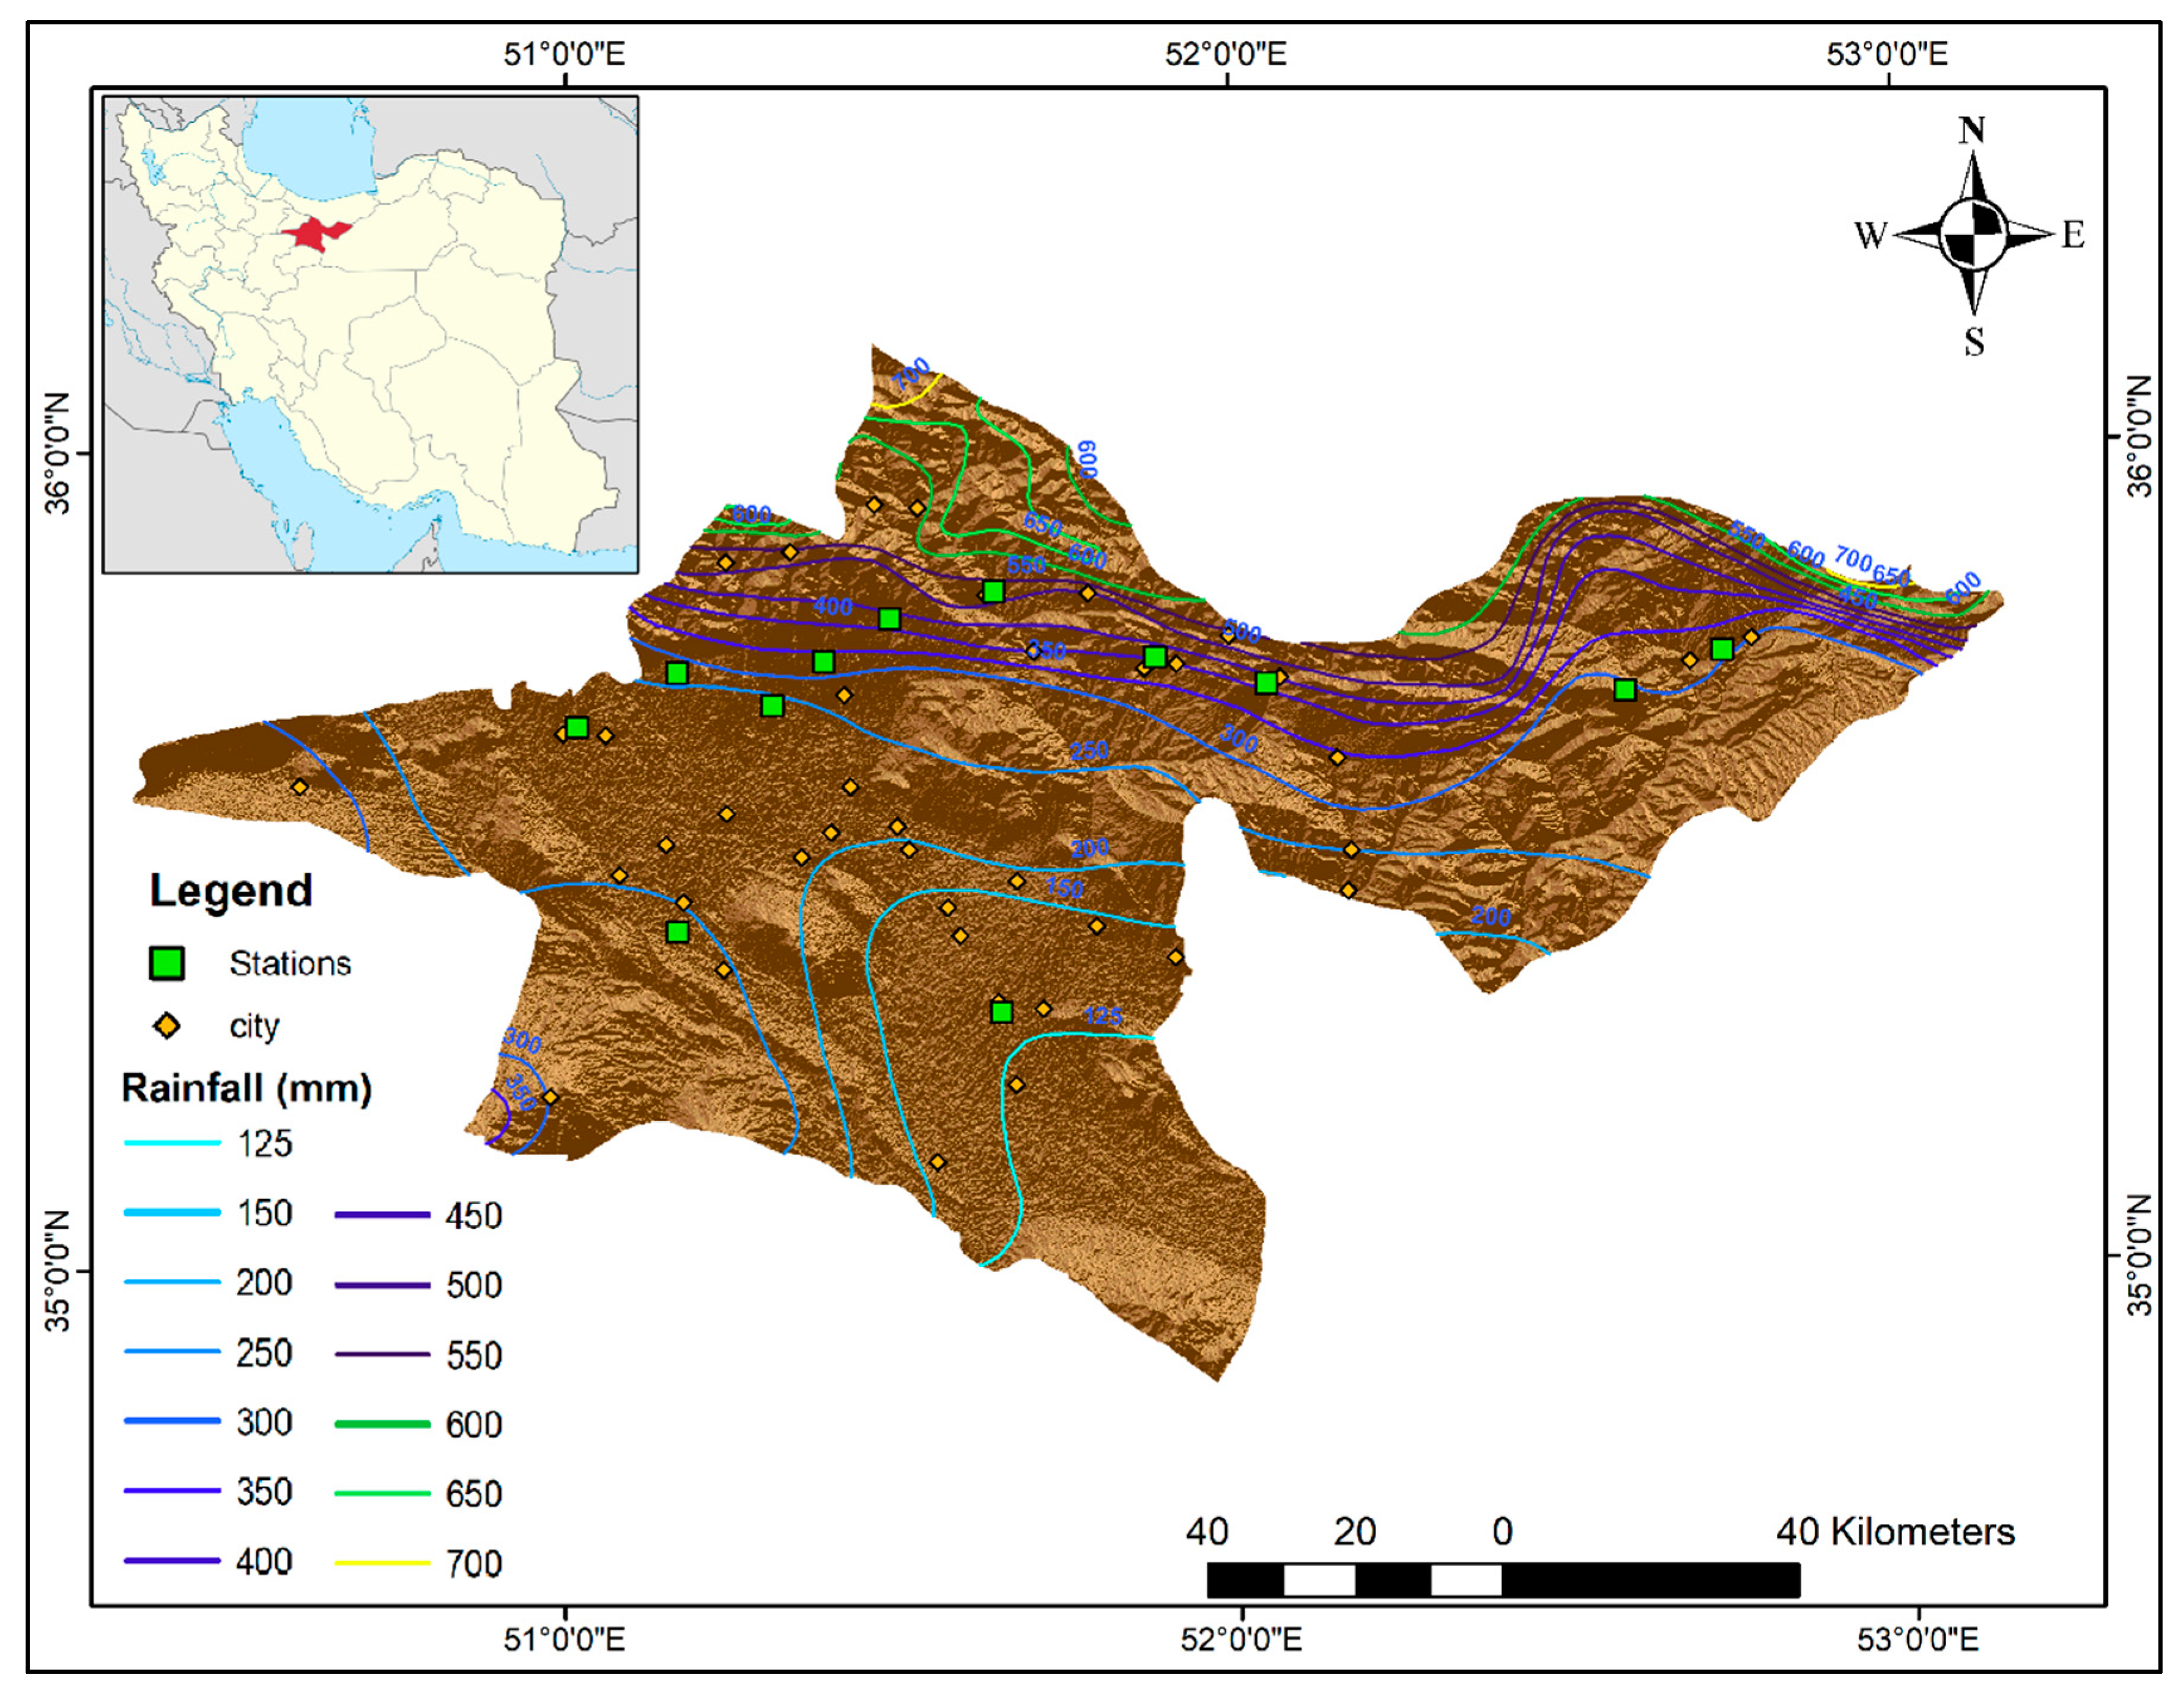
2.1. Overview of the Study Area

Figure 1 shows the location and spatial distribution of the average annual rainfall in Tehran Province, which is located between 34°51′ N and 36°08′ N latitude and 50°21′ E and 53°09′ E longitude with an area of 12,981 km2. Being the political and economic center of the country, Tehran Province is composed of 16 counties, 34 districts, 46 cities, 71 rural districts and 1043 villages [44,45]. Most parts of the province are arid and semiarid. The topography of the provincial lands is categorized into three main areas: the Alborz Mountain range in the north; the central and southern foothills of the Alborz Mountains; and plains [46,47]. The major limitations and issues for the development and sustainability of Tehran Province include critical water conditions, uneconomical agricultural activities, insufficient watershed management, salinity and soil degradation, and excessive exploitation of groundwater resources. According to the latest statistics, the total annual discharge from the groundwater resources of the province through 15,982 deep wells, 27,375 semi-deep wells, 536 qanat systems and 2503 fountains is approximately 2722 million cubic meters [45]. Due to recent droughts, the exploitation of groundwater for water supply has increased by 55% in the last five years. Such a trend of increasingly exploiting groundwater resources has resulted in a deficit in the volume of water reserves of almost all aquifers and caused irreparable damage to aquifers, severe desertification, and land subsidence in Tehran Province [48,49]. Therefore, as the existing uneconomic agricultural practice has consumed the maximum part of groundwater, a paradigm shift that transforms conventional agricultural practice into more RWH agriculture is crucial for future development in Tehran Province.

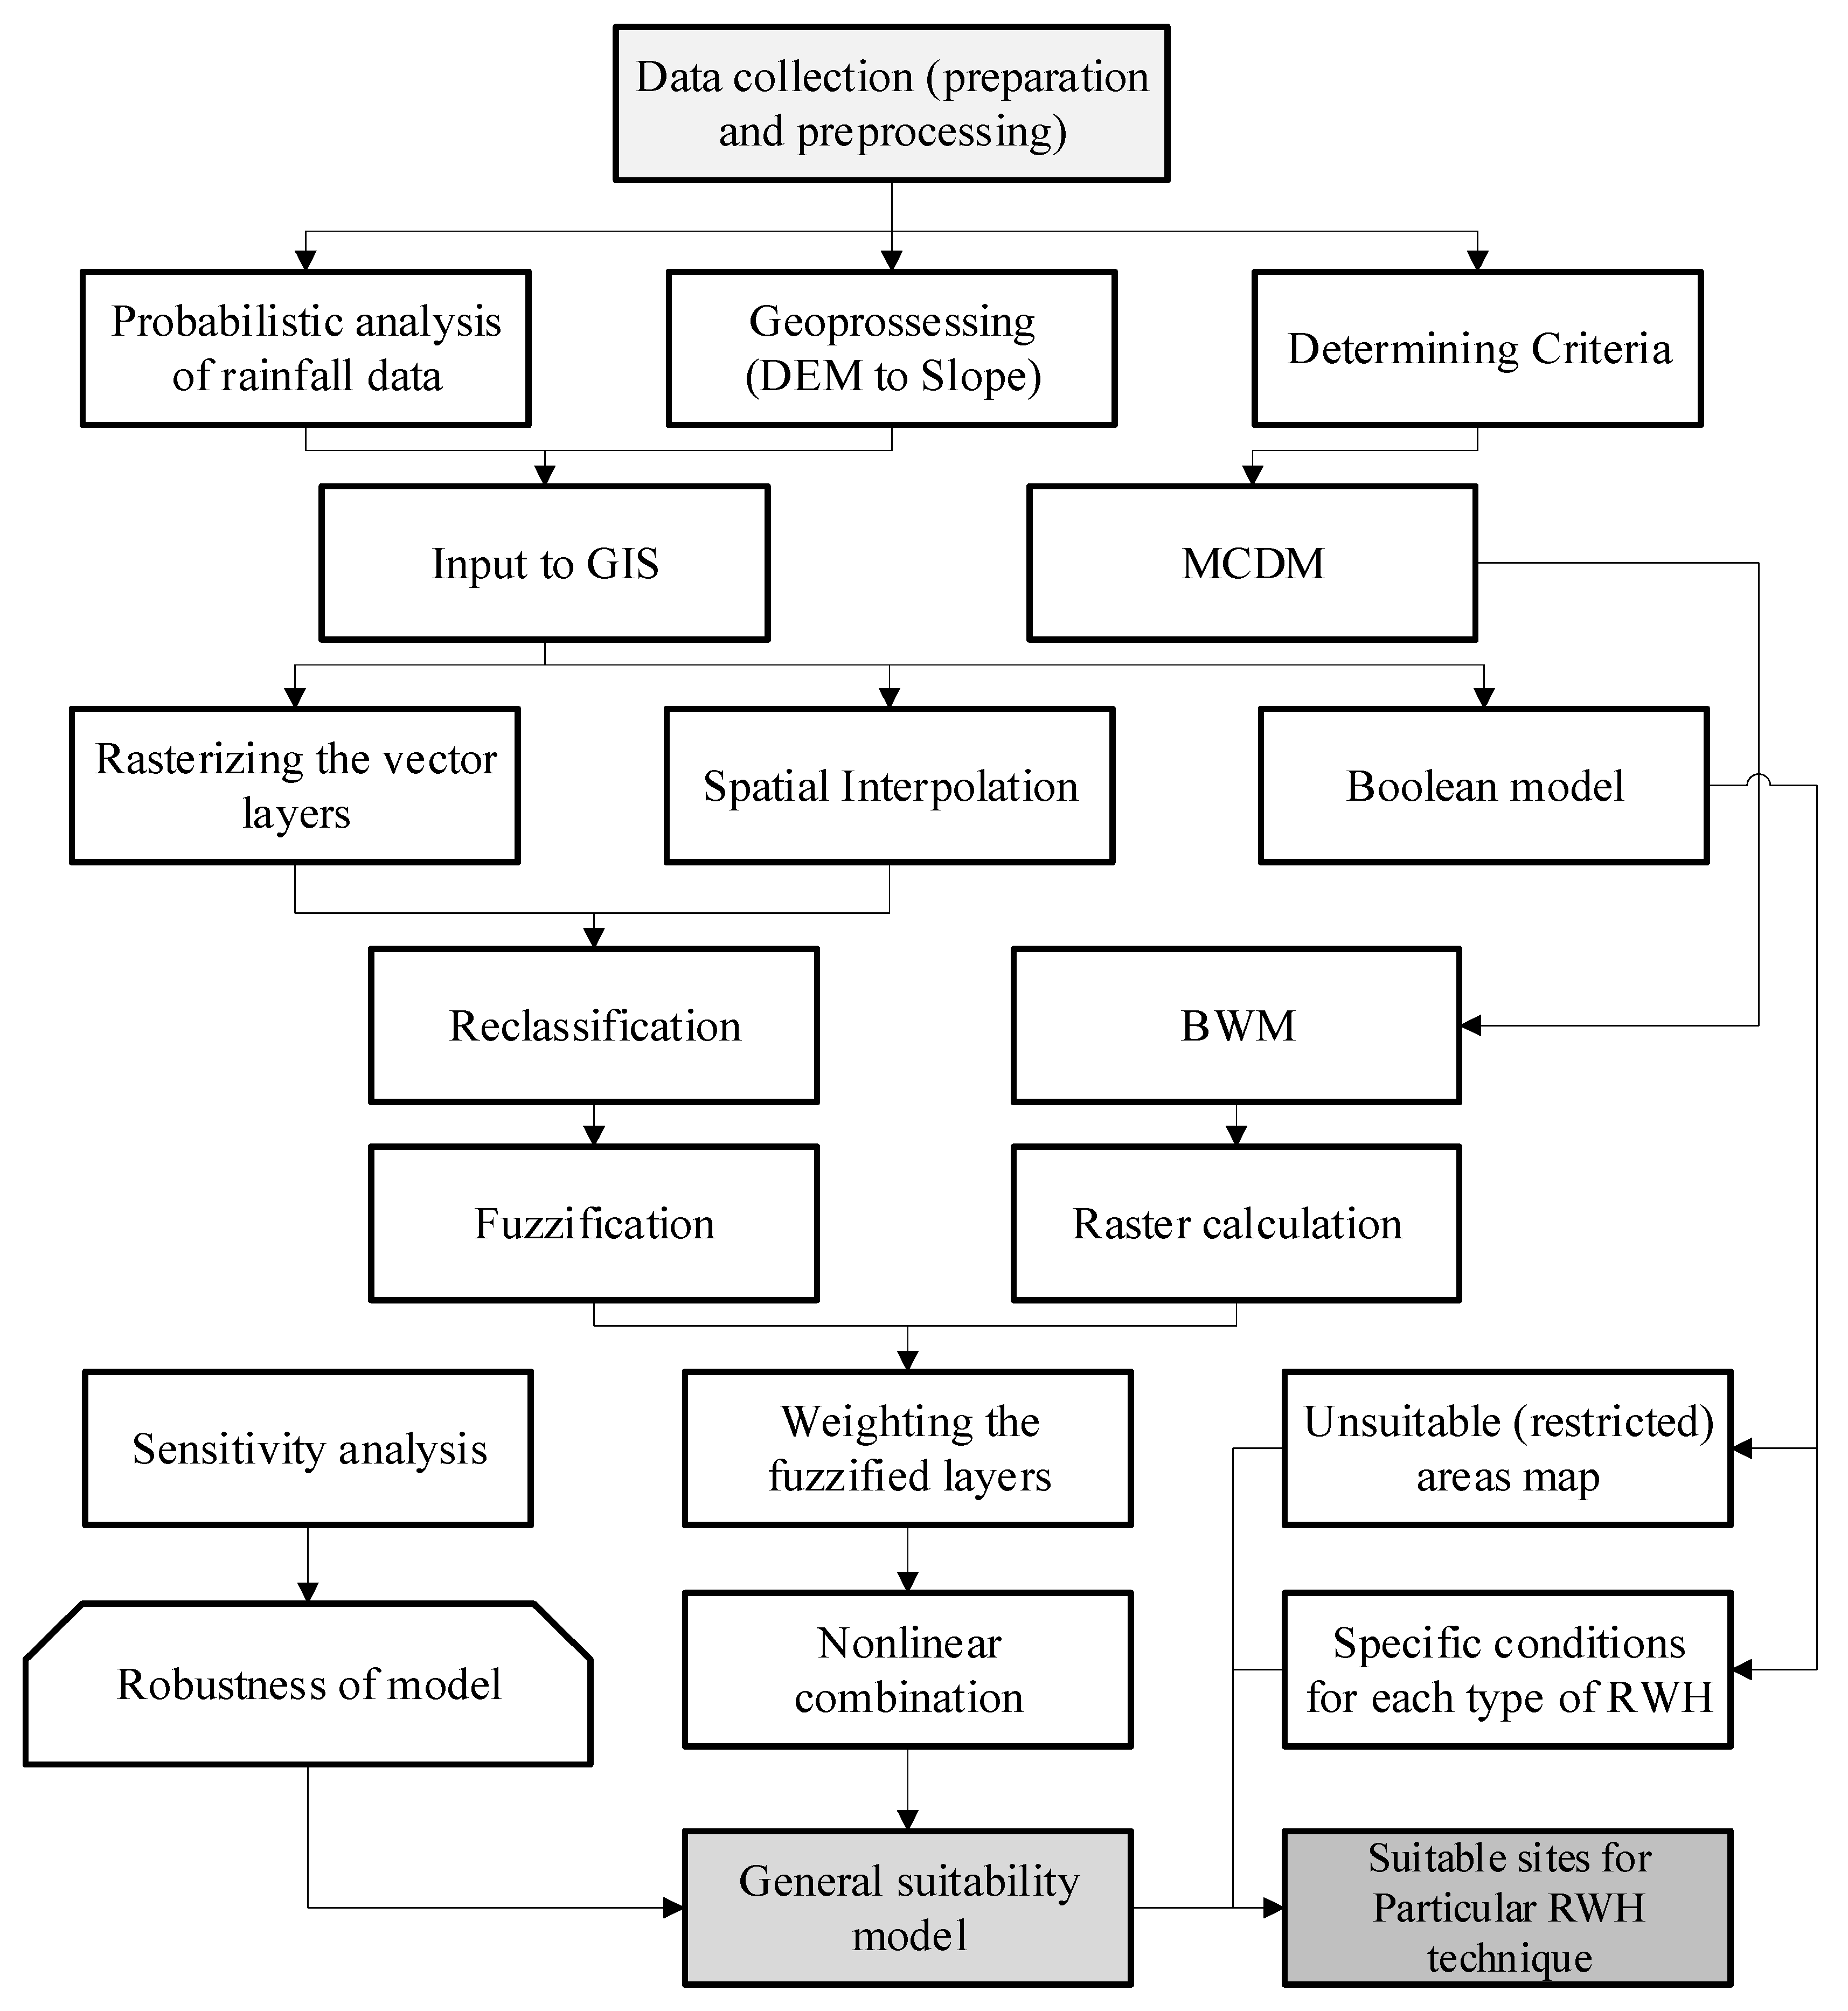
2.2. System Description

Figure 2 demonstrates the conceptual framework of the proposed DSS, which is composed of five major parts: dataset, data process, GIS platform, MCDM models, and user interface. To explore the optimal sites for RWH agriculture using the selected types of RWH systems, the rainfall data in the dataset were first analyzed using a Monte Carlo simulation to obtain the exceedance probability distribution and then geostatistically interpolated. Two sets of criteria for MCDM were selected based on the suggestion of the Food and Agriculture Organization (FAO) (2003) containing both biophysical and socioeconomic factors [31]. The weights of the criteria were first calculated using the linear-BWM separate from GIS. The spatial data were fuzzified in GIS and finally combined with the results of the BWM to achieve the weighted and fuzzified layers. The weighted and reclassified criteria can be combined using raster calculator and overlay tools in ArcGIS. The Boolean technique will also be used in this DSS to eliminate the constraint areas in the suitability maps [37,50,51]. A comparative analysis will be conducted by comparing the results of the DSS and those of the traditional AHP using sensitivity analysis. The suitability map will then be compared with the existing farming map to achieve the developing strategy for RWH agriculture to ease the overexploitation of groundwater.

2.3. Process of the Best-Worst Method (BWM) and Fuzzy Logic in Geographic Information System (GIS)

Figure 3 shows the detailed procedure of the proposed model. The criteria were selected based on a literature review. Among them, rainfall and slope required preprocessing. ArcGIS 10.5 (Esri, Redlands, CA, USA) provided a spatial and geographical analysis platform, which was used for rasterization, spatial interpolation, reclassification of rasterized layers, and all multi-criteria evaluation processes, e.g., overlay process; Fuzzy membership, Fuzzy overlay and weighted overlay, for suitability modeling. In addition, a raster calculator was used to integrate, separate and combine layers based on the Boolean technique, where the suitable areas were denoted by a value of 1 and technically impractical areas by zero. This study explores the new integration of the BWM and Fuzzy logic, and compares it with the results of widely used traditional methods, i.e., the AHP and WOP (weighted overlay process) using sensitivity analysis.
According to the BWM, the best (e.g., most desirable, most important) and the worst (e.g., least desirable, least important) criteria are identified first by the decision makers. Pairwise comparison vectors are then conducted between each of these two criteria (best and worst) and the other criteria. An optimization problem is then formulated and solved to determine the weights of the different criteria. Two models of the BWM were often adopted, namely, non-linear BWM and linear BWM [39,52]. This research adopts the linear BWM to derive the weights of the criteria.
The steps for the linear BWM are listed as follows:
Step 1. Determine a set of criteria as {C1, C2, , Cn}; for RWH site selection, we selected {rainfall, slope, soil type, land use/cover, drainage density, socioeconomics}.
Step 2. Specify the best and the worst criteria identified by the decision maker. The best criteria mean most desirable or most important; the worst means least desirable or least important.
Step 3. Determine the preference of the best criterion over all the other criteria, using a number between 1 and 9. The resulting best-to-others (BO) vector would be:
A B = ( a B 1 ,   a B 2 , , a B n ) ,
where a   B j indicates the preference of the best criterion B over criterion j. It is clear that a B B = 1 .
Step 4. Determine the preference of all the criteria over the worst criterion, using a number between 1 and 9. The resulting others-to-worst (OW) vector would be:
A W = ( a 1 W , a 2 W , , a n W ) T ,
where a j W = 1 indicates the preference of the criterion j over the worst criterion W . It is clear that a W W = 1 .
Step 5. Find the optimal weights ( w 1 * ,   w 2 * , , w n * ) .
We minimize the maximum among the set of { | w B a B j w j | , | w j a j W w W | } . Then, the problem is formulated as follows:
min max j { | w B a B j w j | ,   | w j a j W w W | }
such that:
j w j = 1   ;   w j       0 ,   for   all   j
Equation (4) is equivalent to the following linear programming model:
min ξ L such that:
| w B a B j w j |     ξ L ,   for   all   j | w j   a j W w W |     ξ L ,   for   all   j j w j = 1 ;   w j     0 ,   for   all   j
By solving the linear Equation (5), the optimal weights ( w 1 * , w 2 * , , w n * ) and consistency ratio ( ξ L * ) are obtained. The linear equation has a unique solution.
To establish the preference of all the criteria over the worst criterion, using a number between 1 and 9, we use the fundamental comparison scale that is commonly used in AHP. It stems from the qualitative judgments by experts corresponding to numerical judgments from 1 to 9. Table 1 shows this fundamental scale of comparison [53].
In GIS, the Fuzzy overlay and Fuzzy membership tools employ Fuzzy logic as a mechanism to address inherent inaccuracies in attributes and in the geometry of spatial datasets. Fuzzy membership transforms the input raster into a 0 to 1 scale, indicating the strength of a membership in a set based on a specified fuzzification algorithm. Furthermore, the Fuzzy overlay combines Fuzzy membership raster data together based on the selected overlay type.

2.4. Dataset and Data Processing

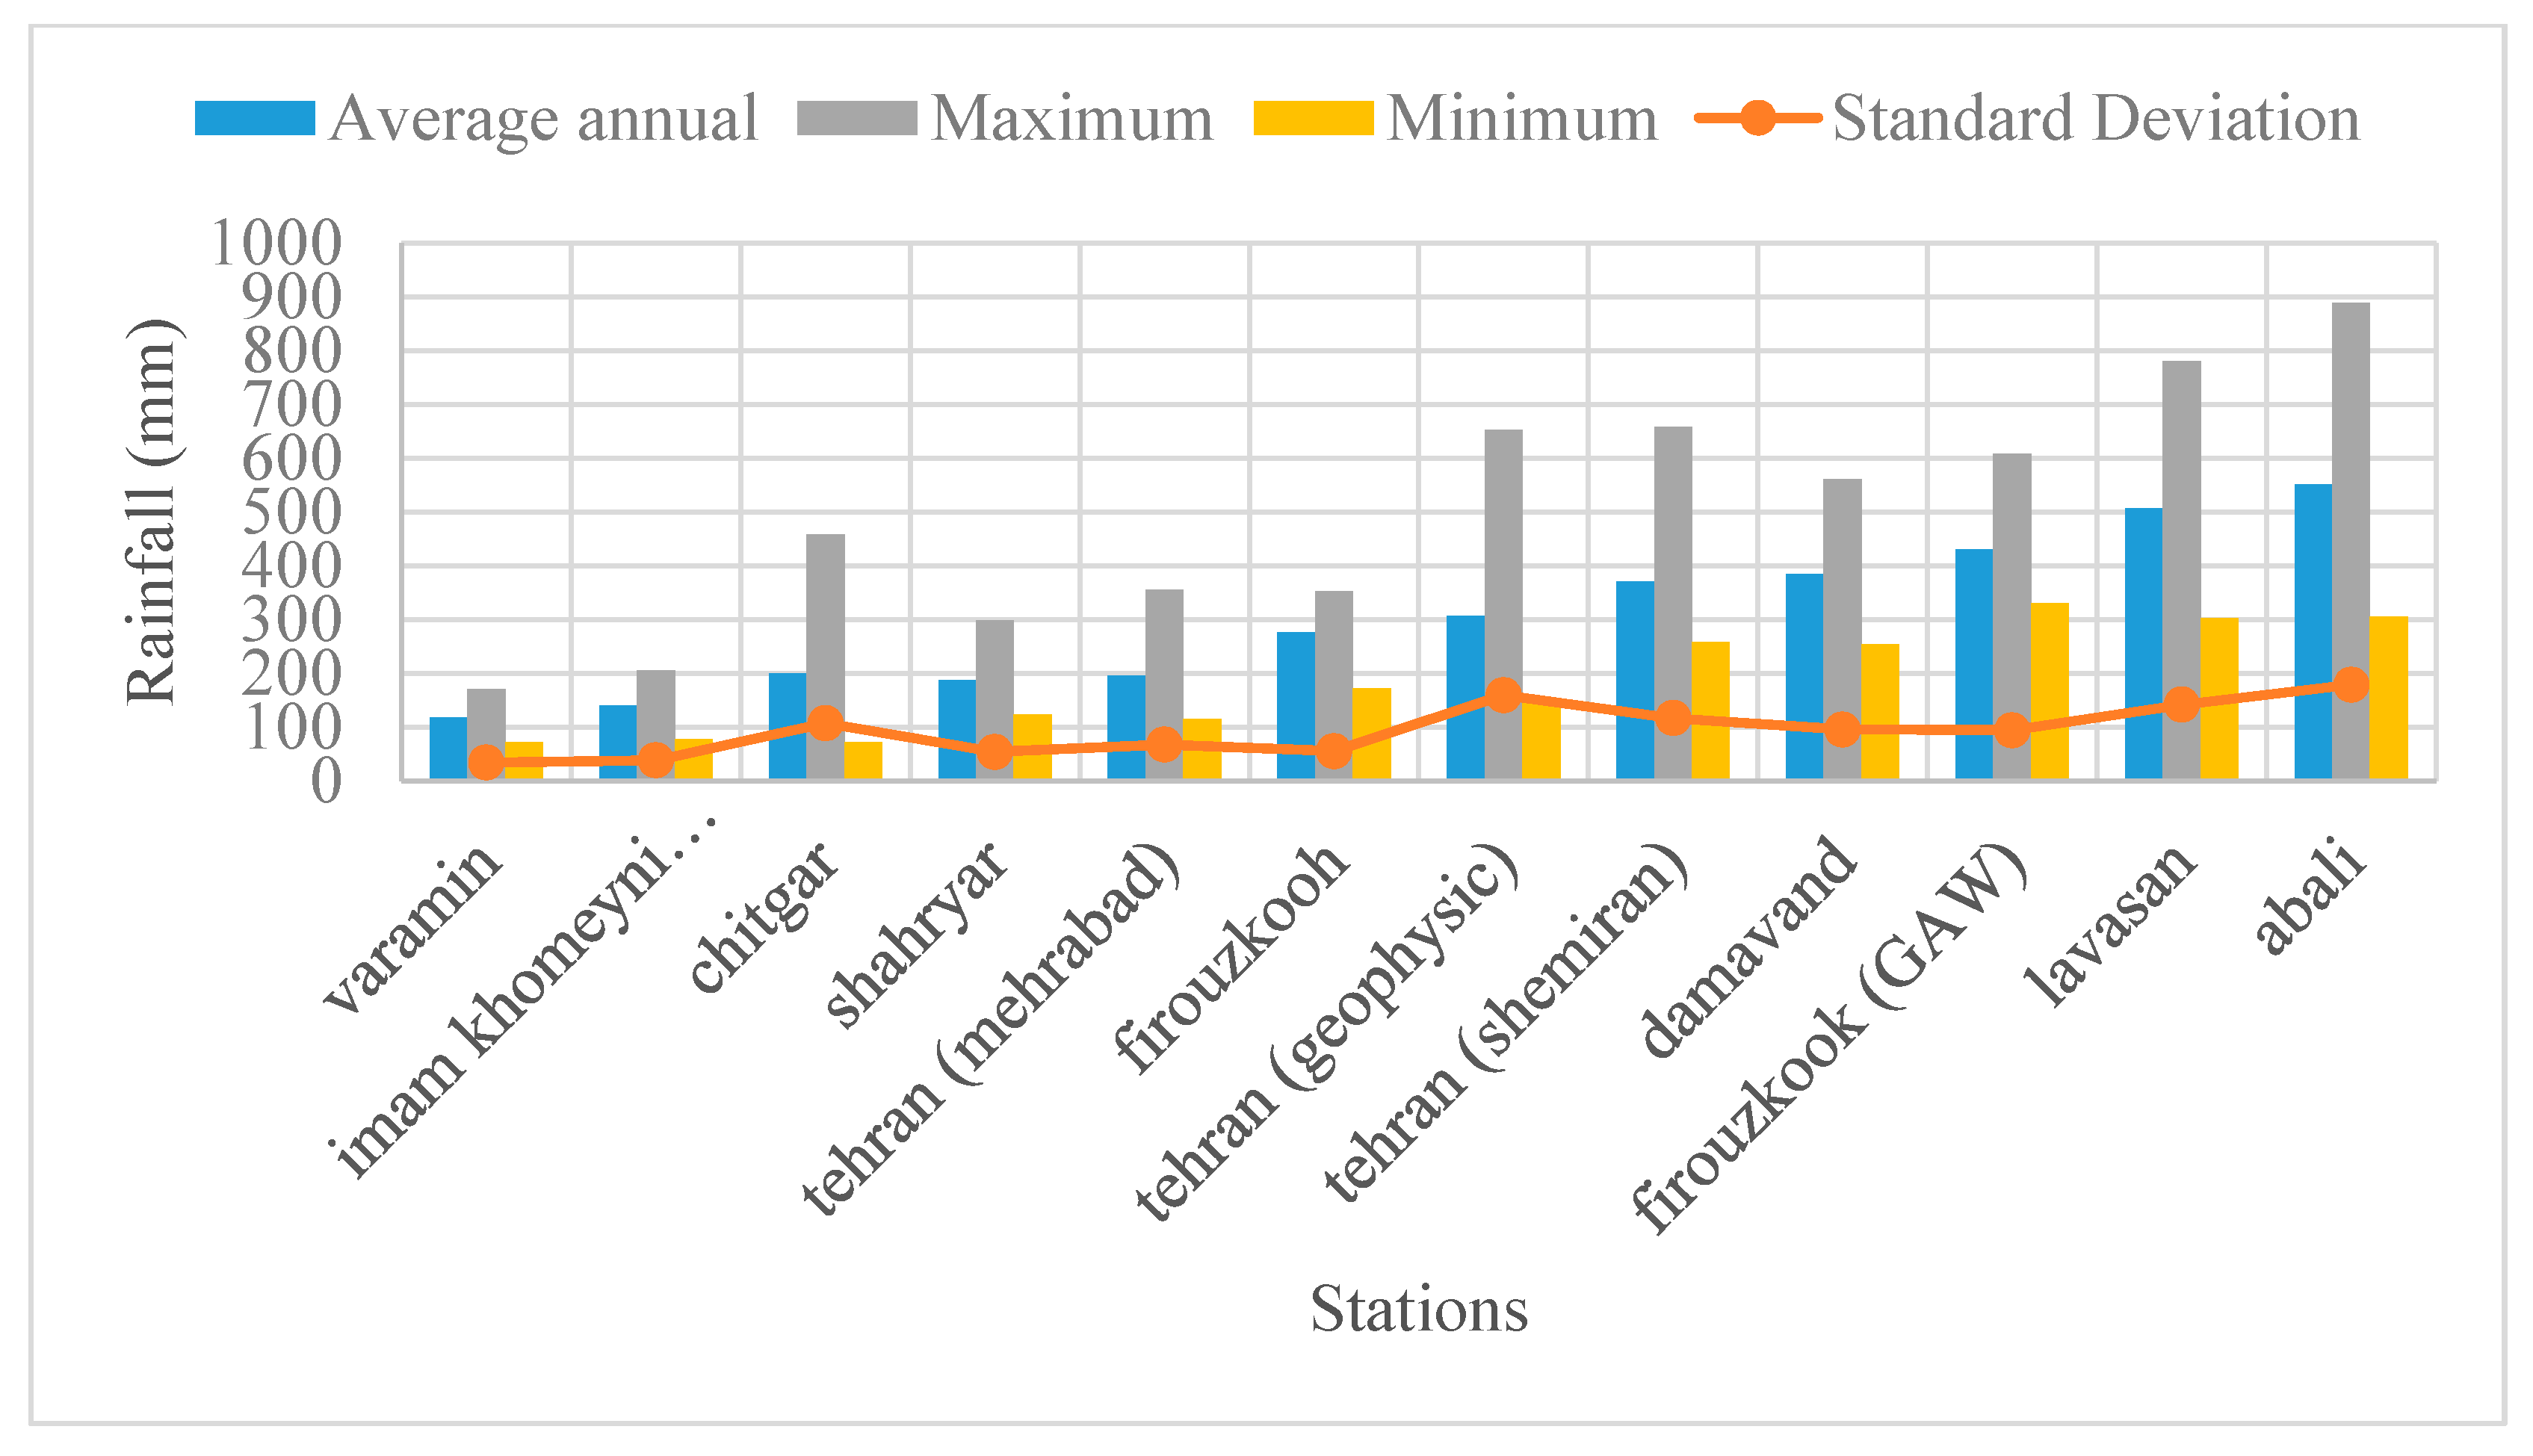
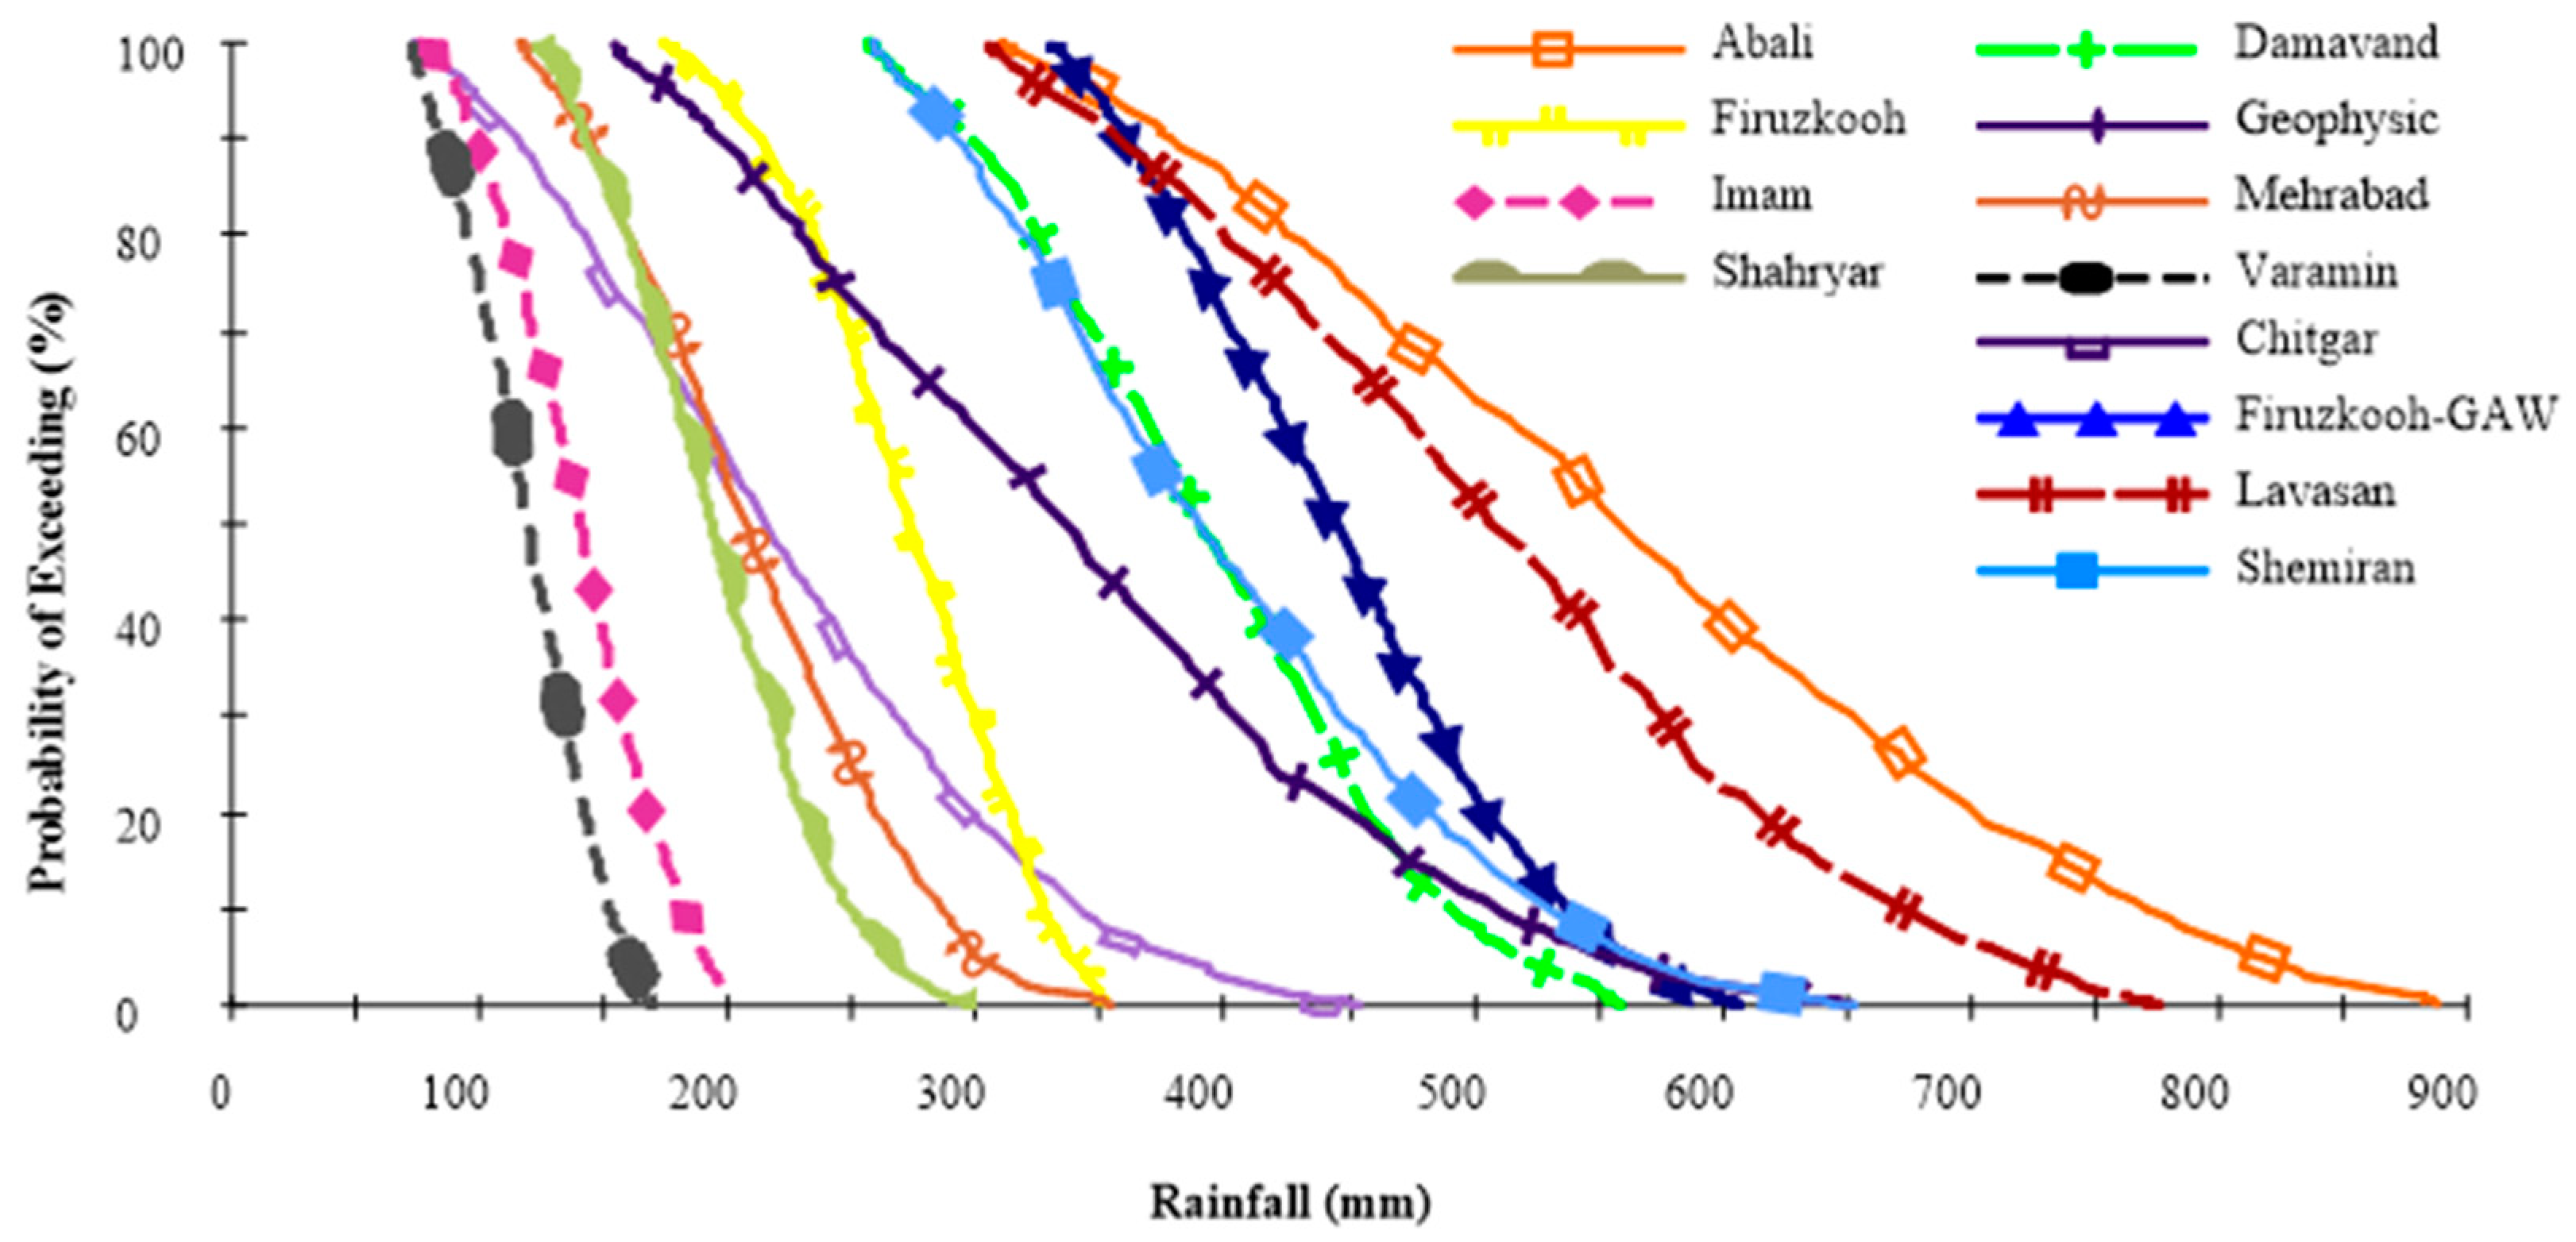
2.4.1. Rainfall Data

Typically, researchers often use daily rainfall data in the rooftop RWH behavior models to predict the relationship between the tank volume and the performance of a RWH system [54]. However, in the case of the optimal site selection, Adham et al. [30] have suggested using monthly rainfall data to evaluate the performance of existing RWH techniques and site selection in (semi-) arid regions. Moreover, some researchers reported that 10 years rainfall time series can be used to obtain results, which is equivalent to those obtained with long-term rainfall time series [55]. Therefore, this study adopted monthly rainfall data from 12 rain gauge stations (from 2005 to 2014) collected from the Iran Meteorological Organization (IRIMO) [56]. Figure 1 also shows the location of rainfall stations distributed in the study area. Figure 4 shows the annual maximum, minimum, average and standard deviation of precipitation for each station. The average annual rainfall of these rain stations amounts to 305.7 (mm/year), while the highest is 551 (mm/year) and the lowest is 118 (mm/year). Aridity varies from humid and subhumid in the north to arid and semiarid and hyperarid in the south.
Previous studies often adopt rainfall surplus maps from satellite imagery, using only average annual rainfall to indicate the rainwater supply in the site selection of RWH systems [29,32,35,51]. However, the drawback of such practice is that the effect of rainfall patterns has been neglected, and decision makers cannot adjust the level of water demand according to the crop types. In other words, the parameter of water demand for different crops needs to be adjustable, and the associated probability should be informed. Therefore, this study modeled the exceedance probability of 10 years of rainfall data using Monte Carlo simulation. The system is simulated one thousand times and allows users to choose the exceedance probability according to the level of the water demand of crops. This study uses 70% exceedance probability as a test in the DSS. The chosen and processed rainfall data will be further spatially interpolated for MCDM.

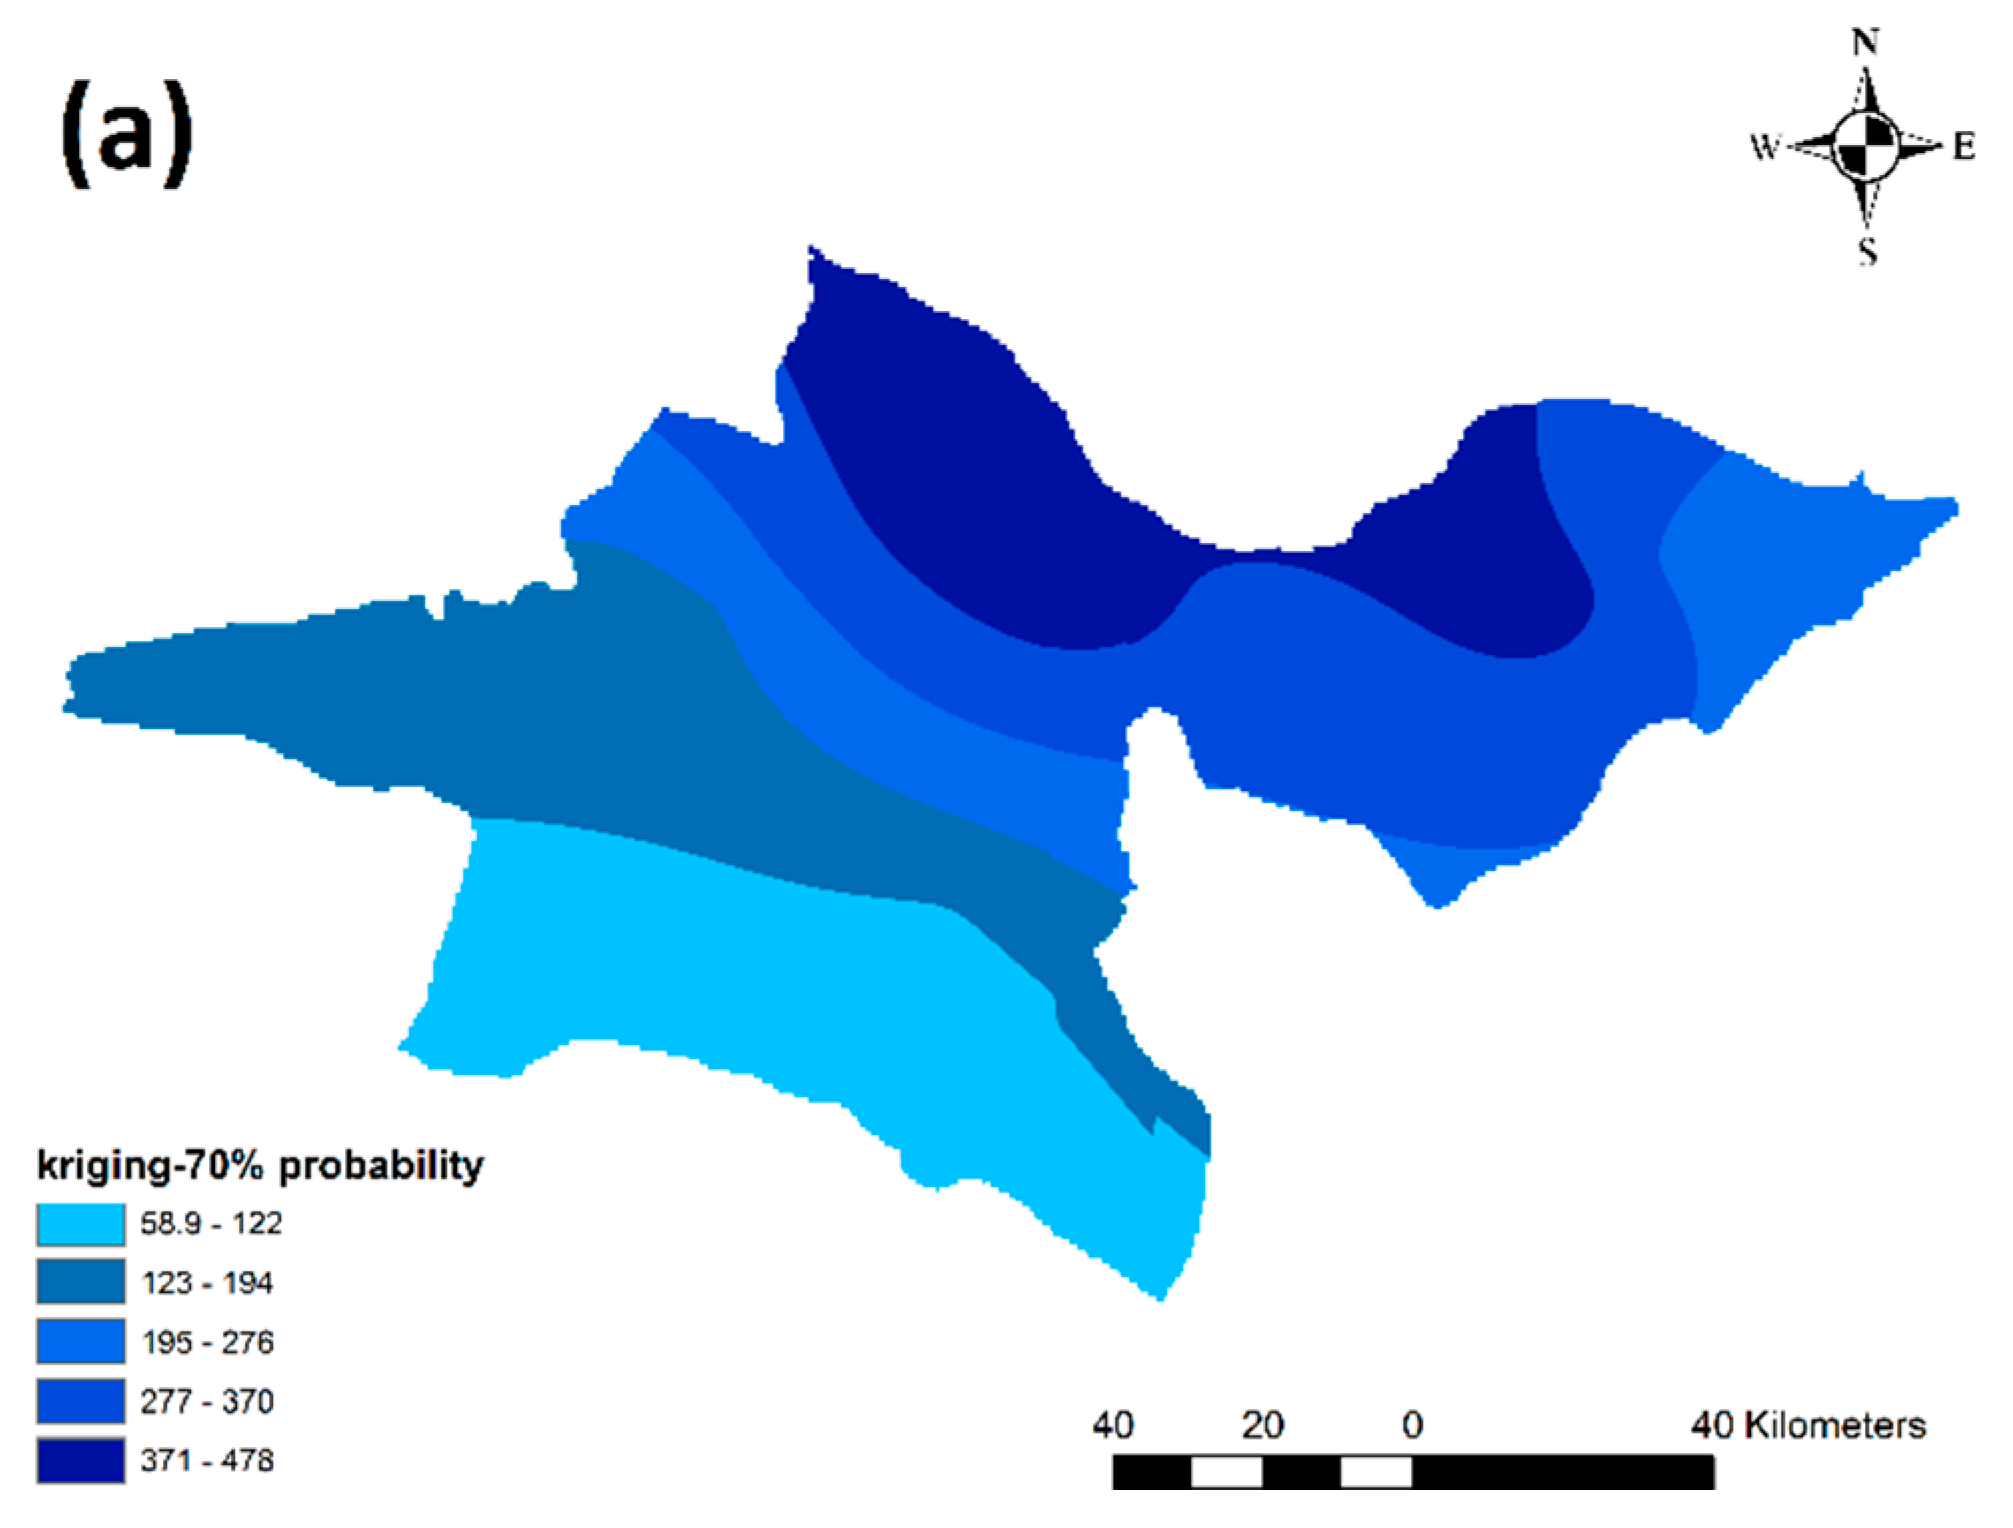
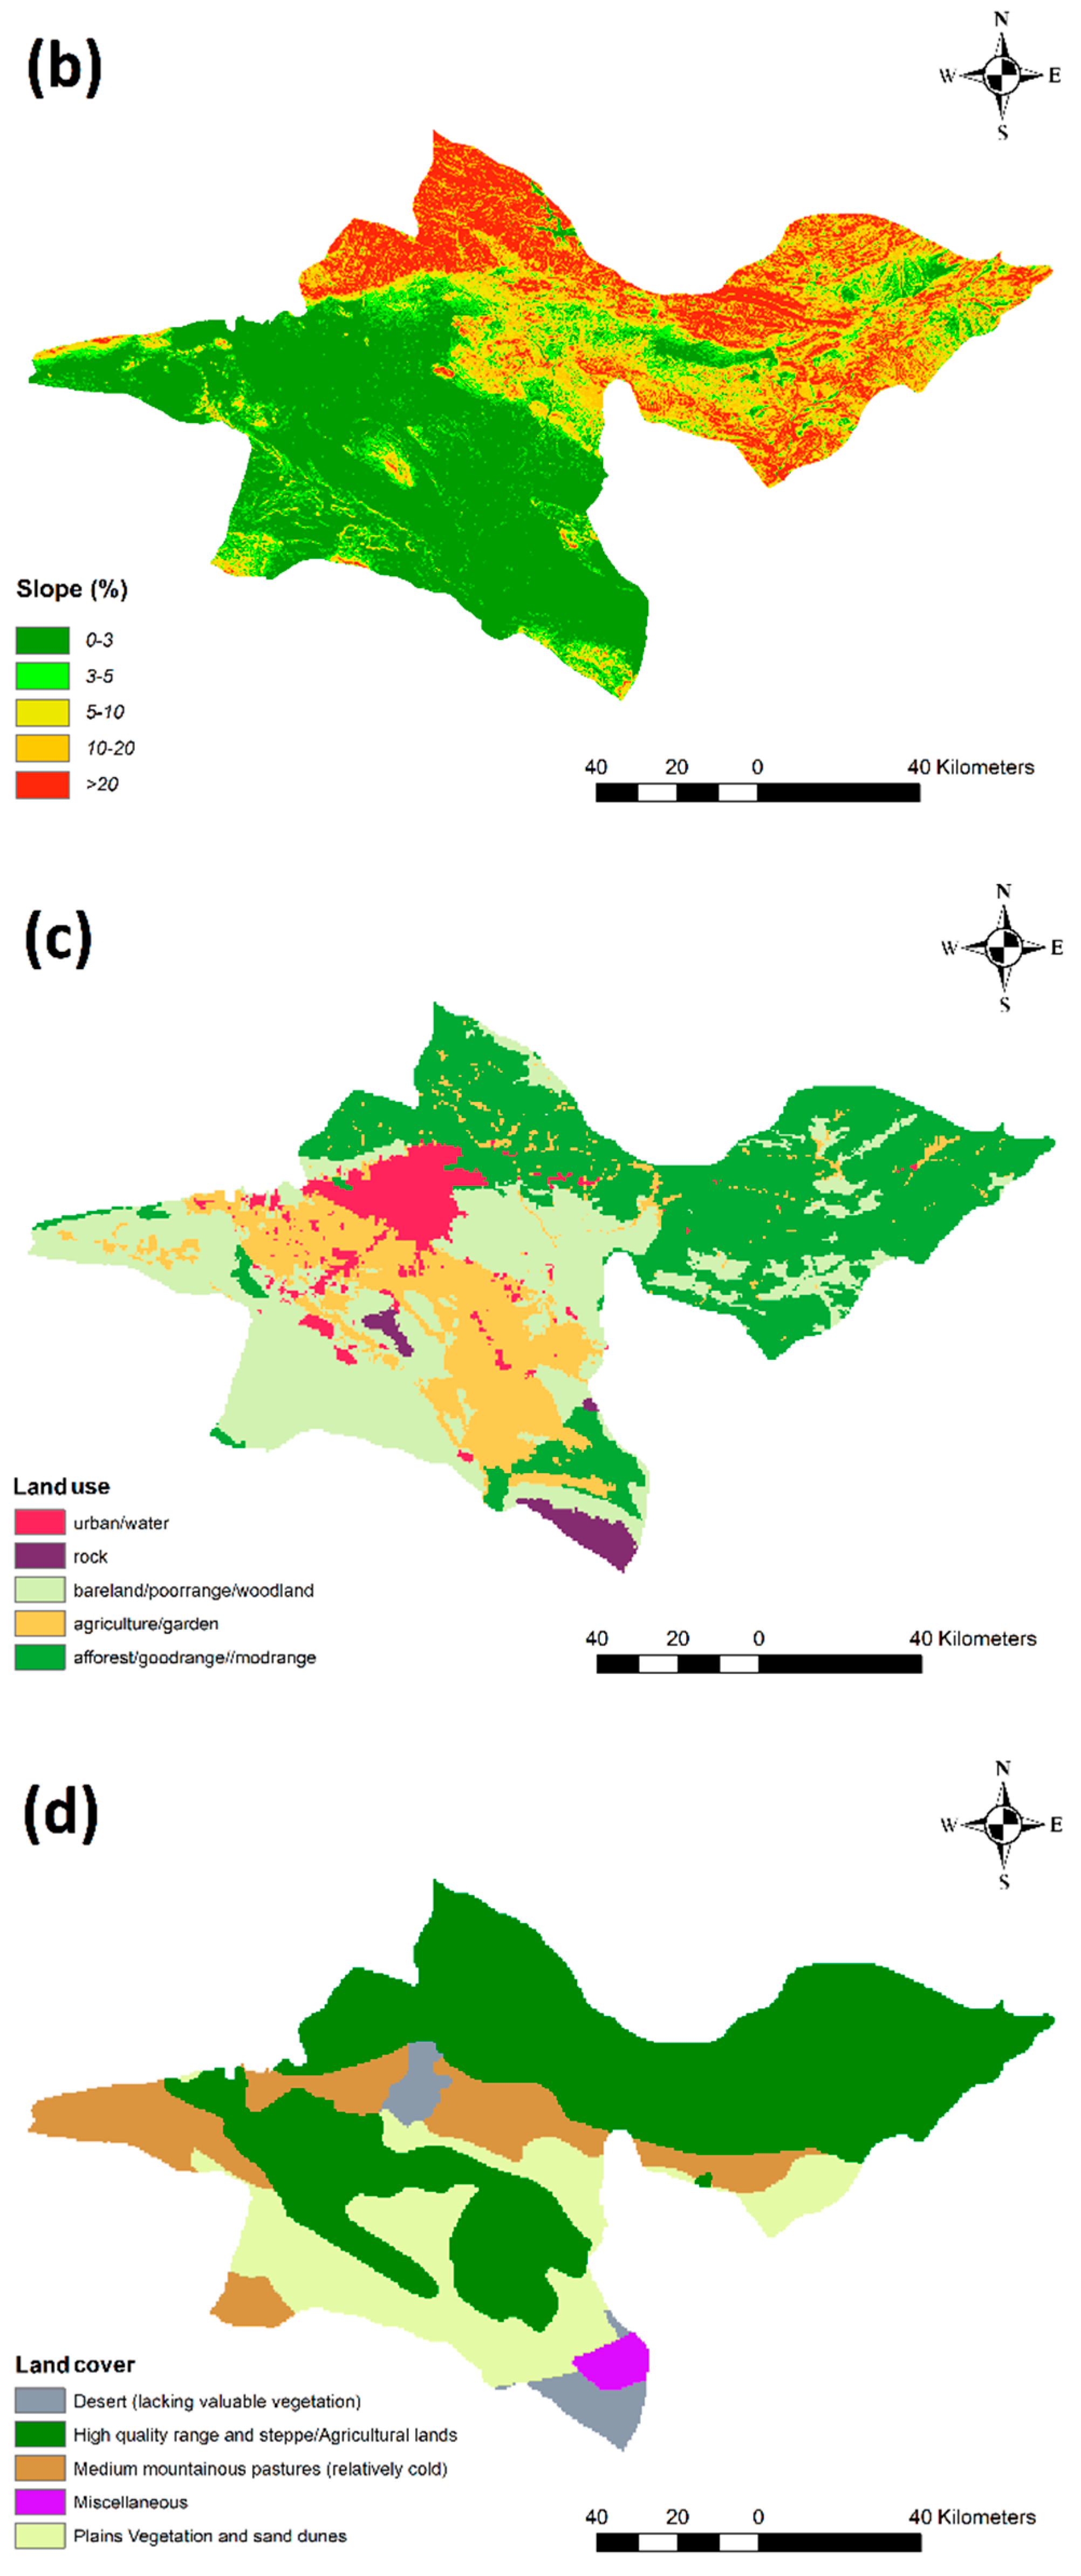
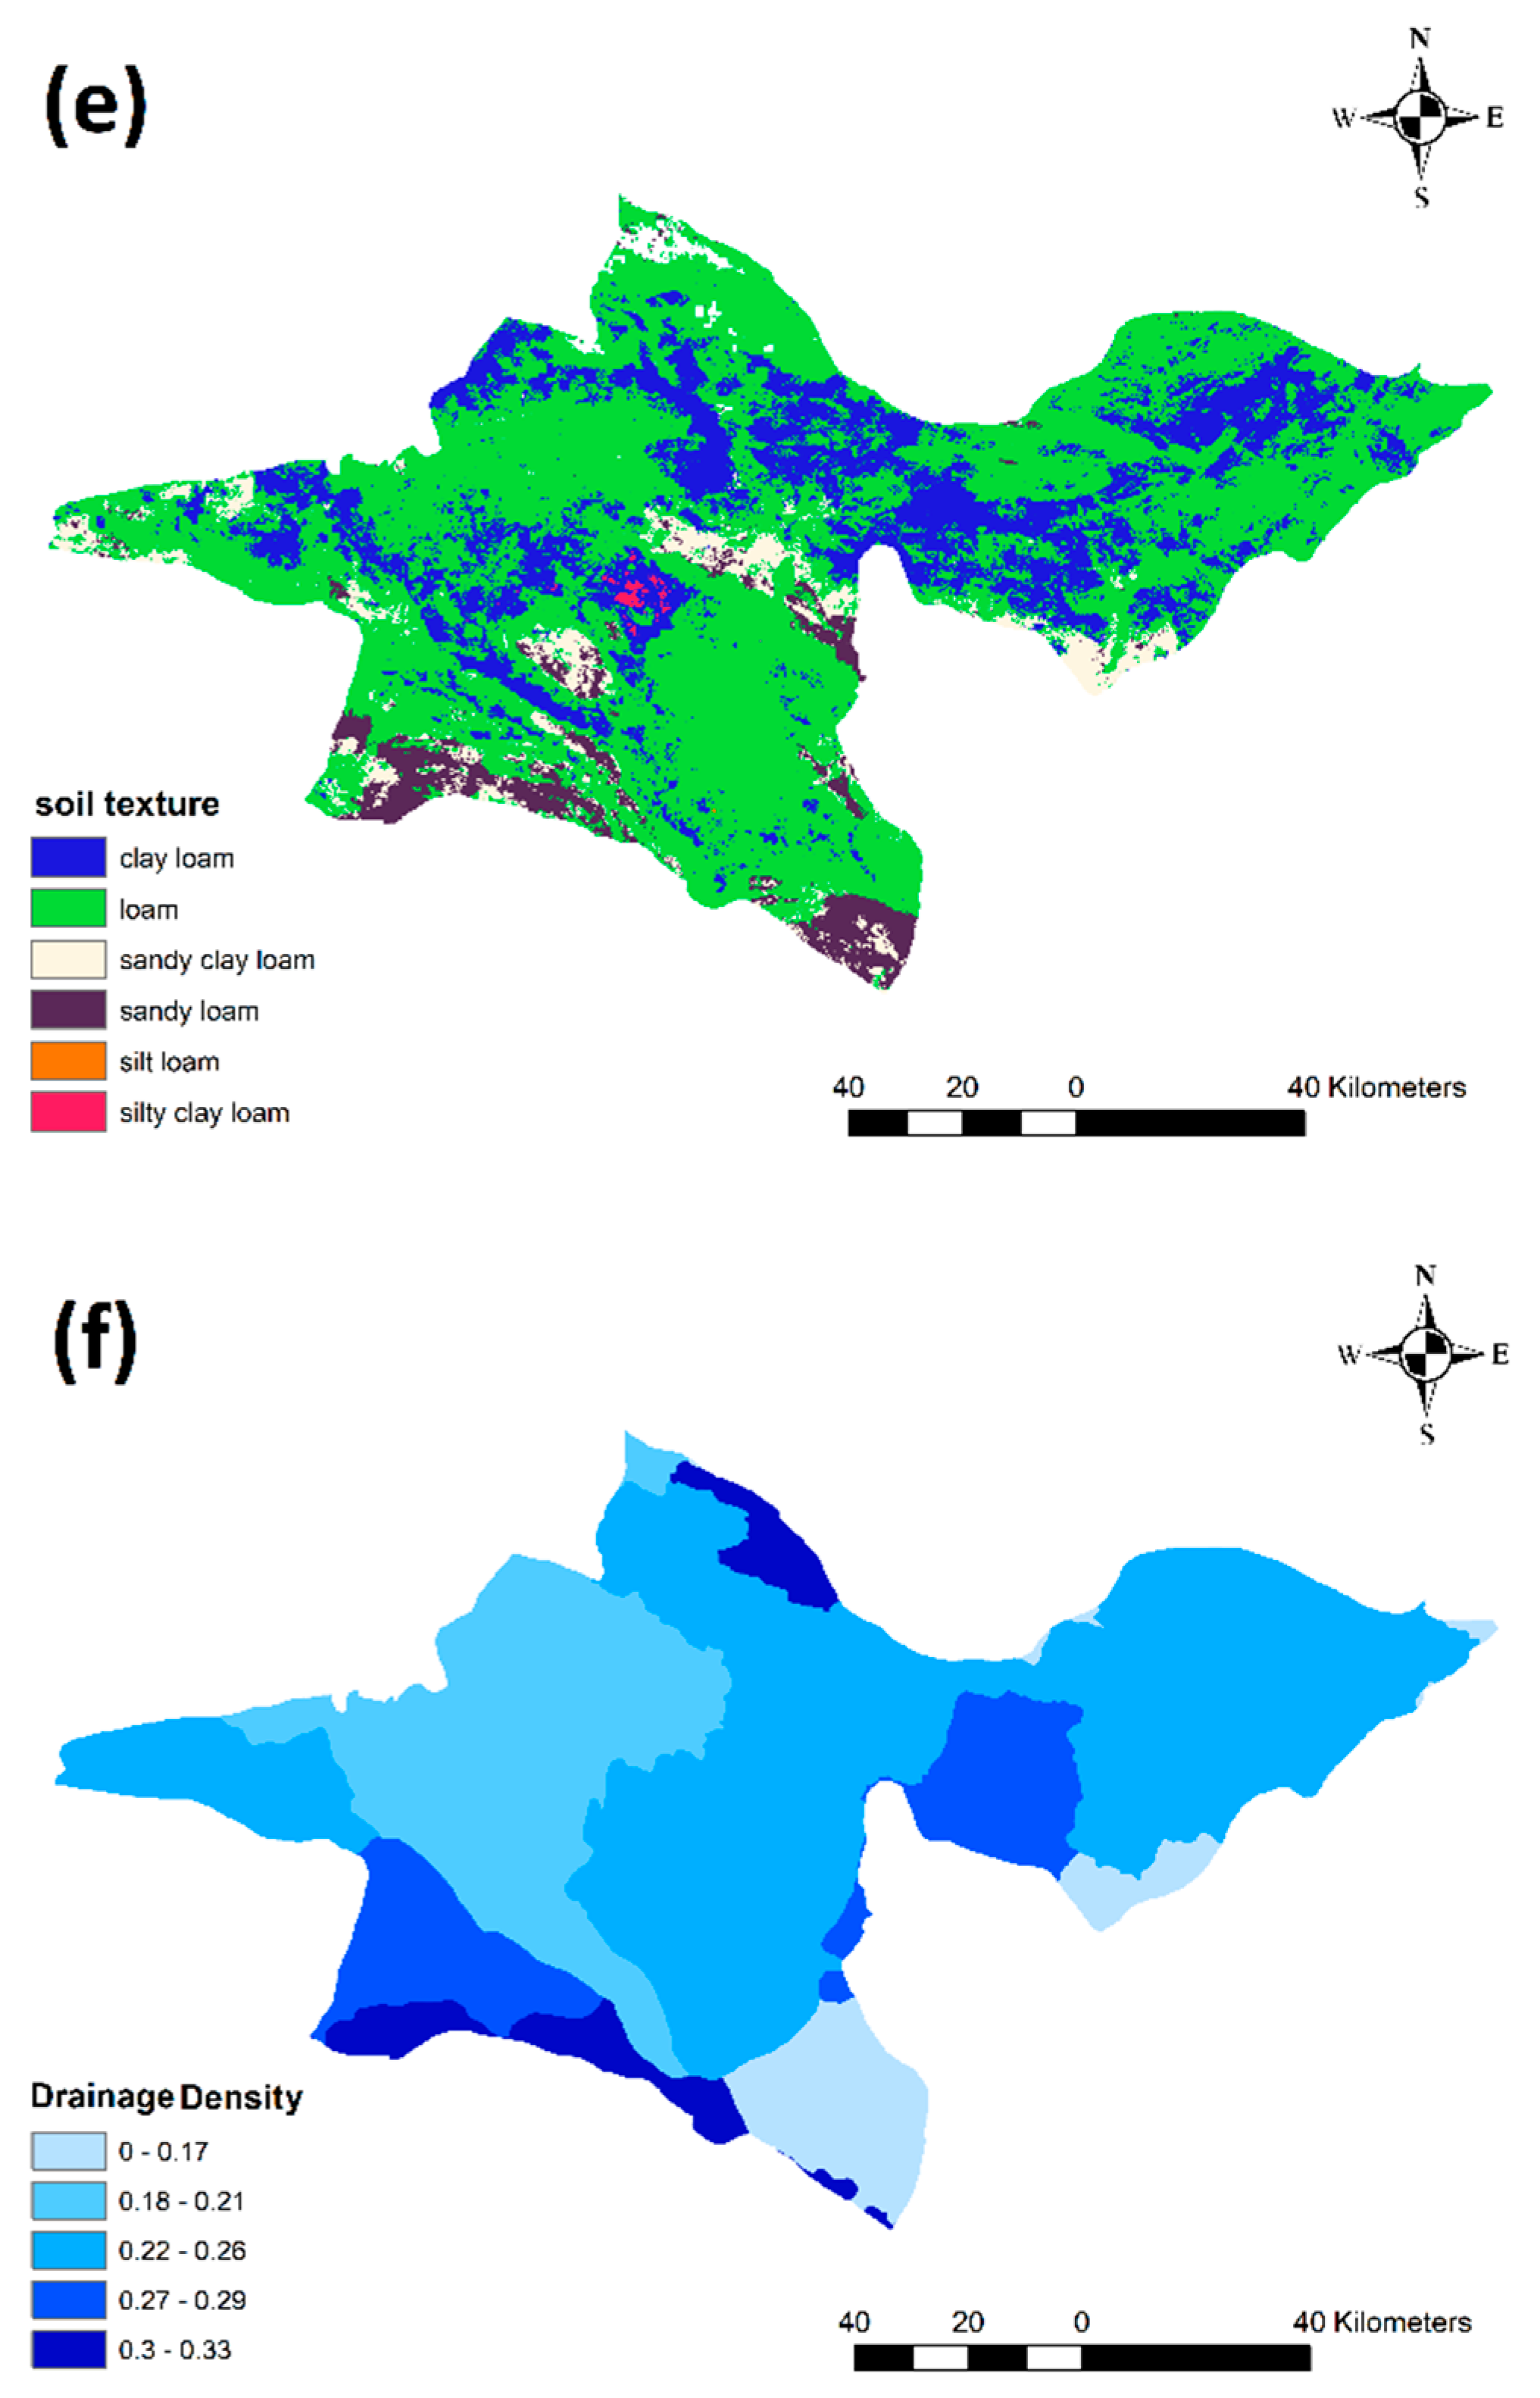
2.4.2. Spatial Geographic Information

The Advanced Spaceborne Thermal Emission and Reflection Radiometer (ASTER) digital elevation model (DEM) was supplied by The United States Geological Survey (USGS) earth explorer. The shapefiles and other thematic layers, including land use/cover, soil type and other geodatabases, were georeferenced to the XY coordinate system GCS_WGS_1984. Most of the data have been provided by remote sensing. The field surveys and data collection were performed under the supervision of the “Organization of Agriculture-Jahad-Tehran”, “National Cartographic Center of Iran”, Geological Survey and Mineral Exploration of Iran”, and “Housing Foundation of Islamic Revolution”. Other statistical data are collected from the “Statistical Center of Iran”. Table 2 lists the databases used in this study. These databases together with spatially interpolated rainfall data will be further processed as the criteria in the MCDM process.

2.5. Setting Criteria for Multiple Criteria Decision Making (MCDM)

The identification of suitable areas for RWH techniques depends on two groups of criteria: biophysical and socioeconomic factors. According to the FAO (2003), the factors used for identifying suitable sites for RWH systems in GIS environment include climate (rainfall), hydrology (runoff), topography (slope), agronomy (land use/cover), soils (texture and depth) and socioeconomics (cost, distance to cities, roads, streams, etc.) [29,31,32,33,51,57,58]. In this study, rainfall, slope, soil type, land use/cover, and drainage density were used as biophysical criteria, while distance to roads, rivers, cities and faults were used as socioeconomic factors. The vector layers were further converted to raster format.
Rainfall impacts are a major component in all RWH systems. The annual distribution and intensity of rain, soil type and slope are the basic criteria that determine the technical suitability of a location [31,50,51]. To design an RWH system, daily or monthly corrected data must be used [59]. It is noteworthy that, for lands with slopes greater than 5%, RWH is not recommended due to the cost of preparation for construction [50]. The soil type represents the percentage of sand, silt and clay content. The layer was reclassified into five suitability rankings considering soil properties in moisture retention and potential for water holding [60]. In this study, the drainage density was considered a hydrological factor [37]. The selected criteria will be used in the DSS to first generate a general suitability map and then generate specific suitability maps for the three types of RWH technique.

2.6. Types of Rainwater-Harvesting (RWH) Techniques

The types of RWH techniques and the associated biophysical and socioeconomic factor techniques were selected based on previous studies of RWH system site selection, especially in arid and semiarid areas [29,30,34,35,36,37,50,51]. Among the RWH techniques that have been well developed and accepted in arid areas [31], three techniques, i.e., ponds and pans, check dams and percolation tanks, were selected to be tested in the DSS and are discussed below.

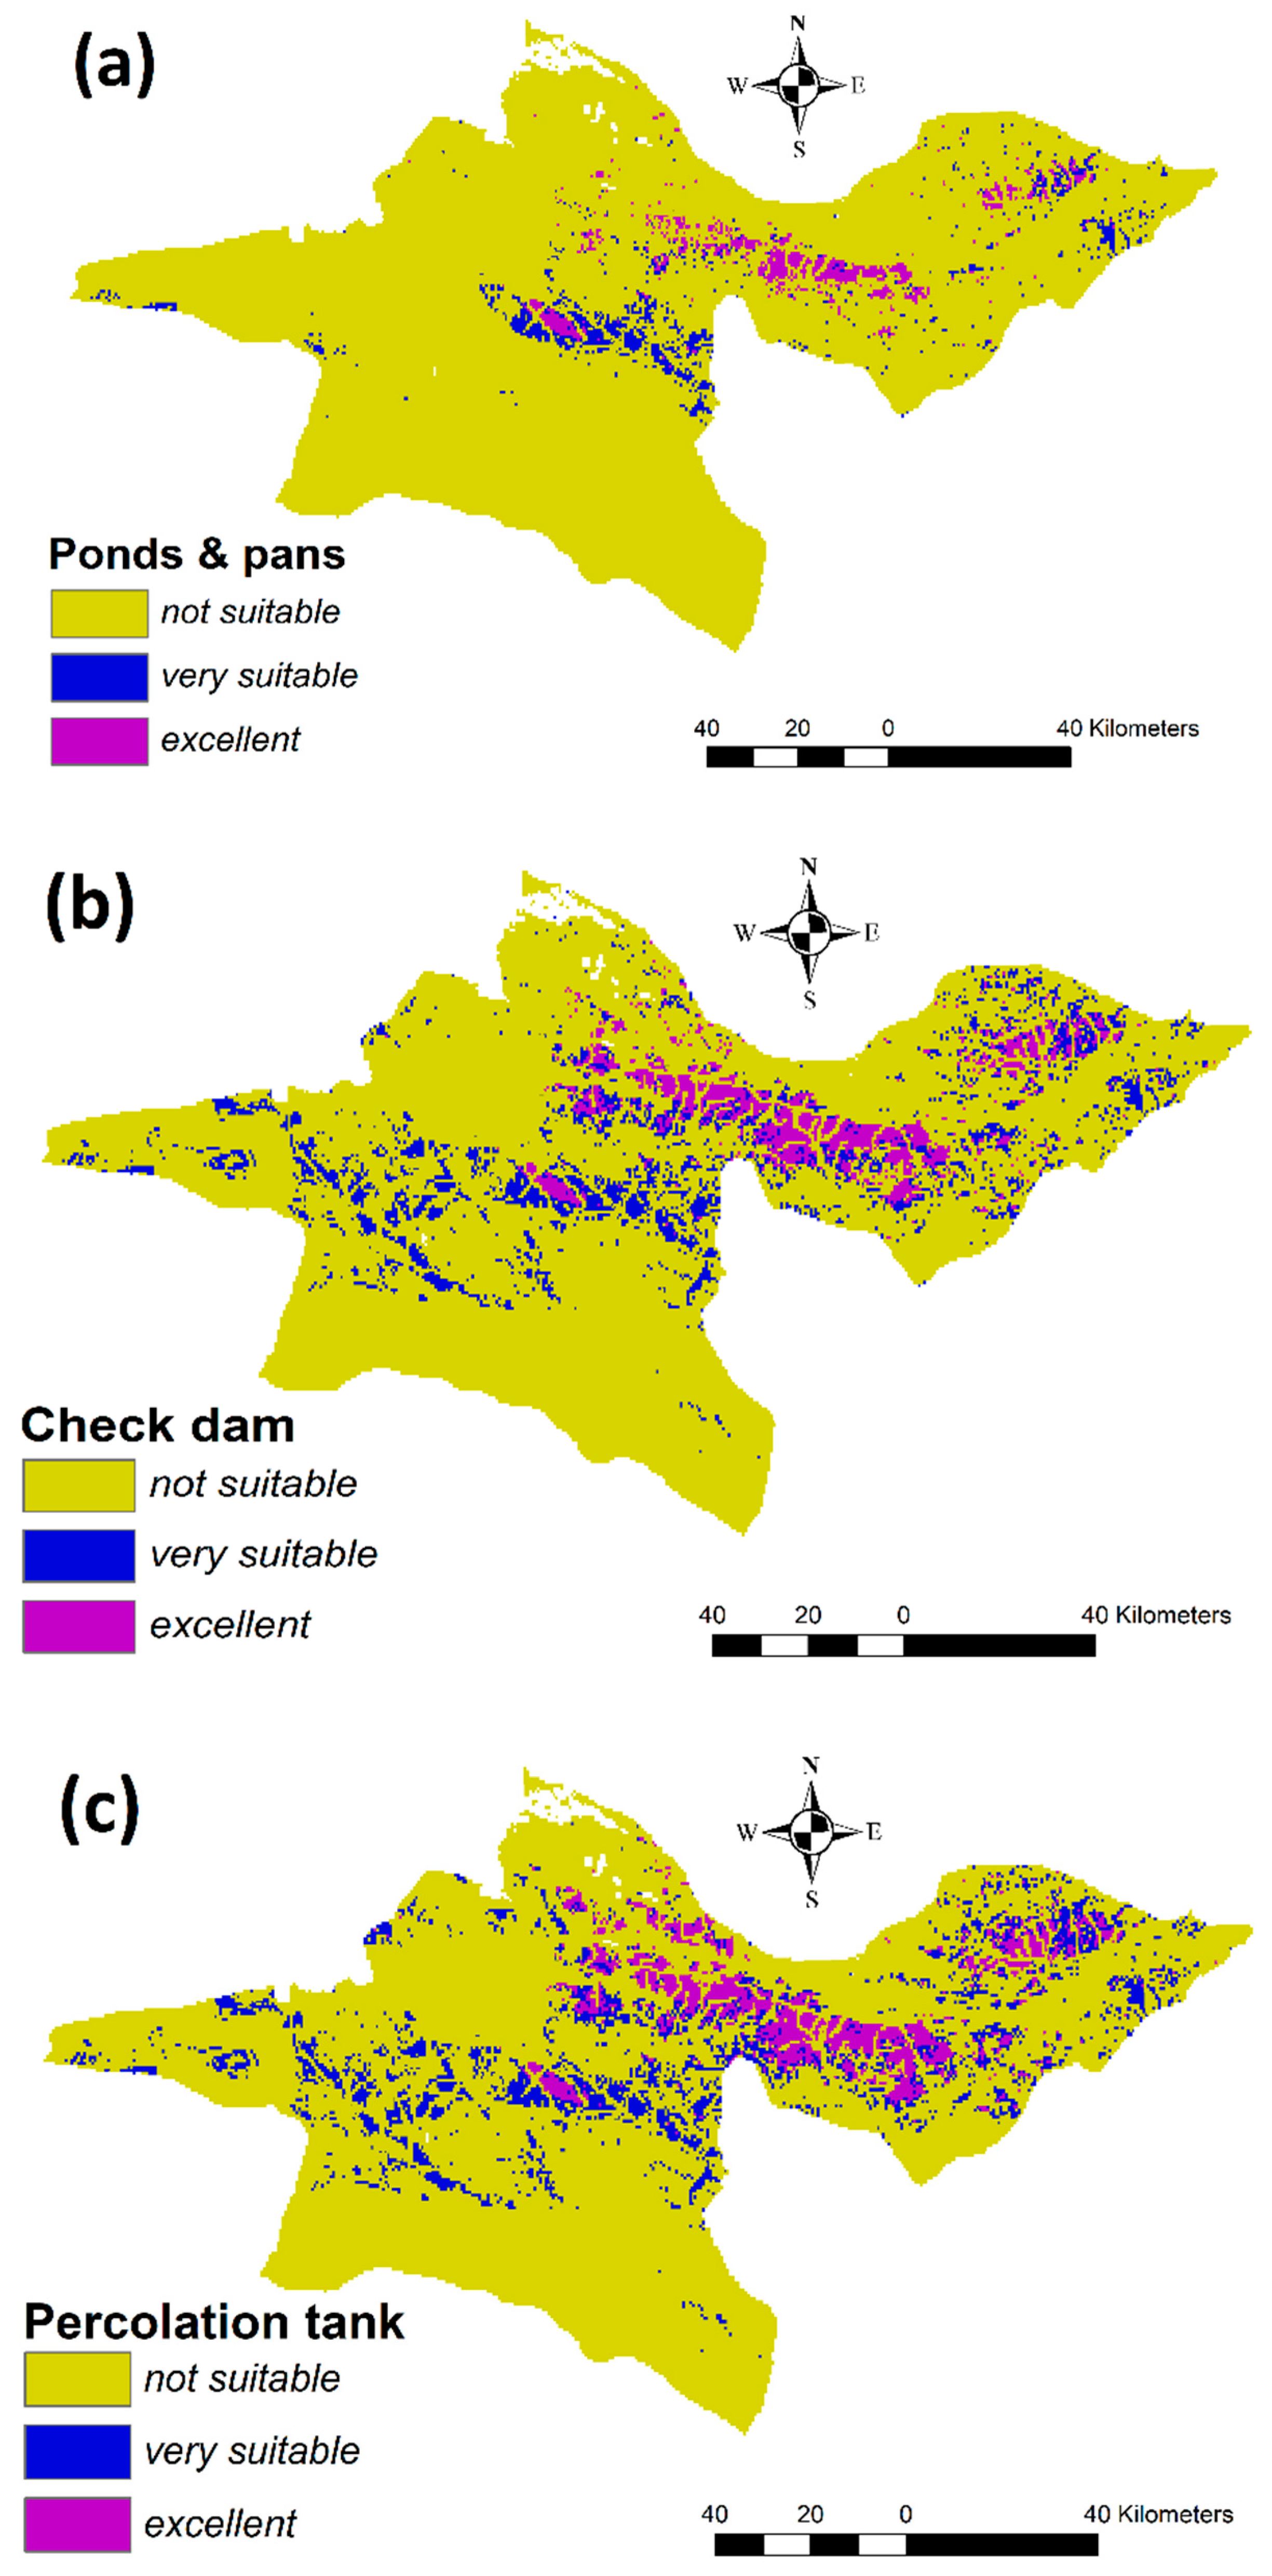
2.6.1. Ponds and Pans

Ponds and pans are water storage facilities, either naturally occurring or manually excavated, that collect runoff from macrocatchments. The difference between them is that pans receive water wholly from surface runoff, while ponds are constructed where there is some groundwater contribution or contribution from high water table. The collected water can be used for livestock watering or supplementing irrigation for crops. This type of RWH structure is cost effective and can be conducted by indigenous people. Previous literature has indicated that farm ponds are the most suitable water-harvesting structures for arid and semiarid areas [37,61].

2.6.2. Check Dams

A check dam is a small dam constructed across a channel to reduce the flow velocity. Many studies have investigated these multifunctional structures in different countries, including China, Italy, Japan, France, Spain, the United States, Iran, India, Austria, Switzerland, Thailand and Ethiopia [62]. Reduced runoff velocity may reduce erosion and gullying in the channel and allow sediment to settle out. Check dams have been reported to be useful for soil and water conservation, flood mitigation, groundwater recharge and land development [63]. These structures significantly affect hydro environmental processes in watersheds and provide sustainable ecological functions. A check dam may be built from stone, sandbags filled with pea gravel, or logs. The site selected should have sufficient thickness of a permeable bed or weathered formation to facilitate the recharge of stored water within a short span of time.

2.6.3. Percolation Tanks

Percolation tanks are artificial reservoirs that are commonly constructed on second- to third-order streams to collect surface water and percolate trapped runoff within permeable land. Percolation tanks are located on highly fractured and weathered bedrock, which has lateral continuity downstream. Therefore, the size of the percolation tank depends on the percolation capacity of the strata in the bedrock. The groundwater recharge is supported by a number of wells and cultivable land. The percolation tank utilizes a large reservoir and is commonly used in India [37,64].
The optimal sites for these three types of RWH methods will be indicted in the suitability maps using the proposed DSS. The promoting strategy for the RWH agricultural scheme will be further discussed based on these optimal site selections.

3. Results and Discussion

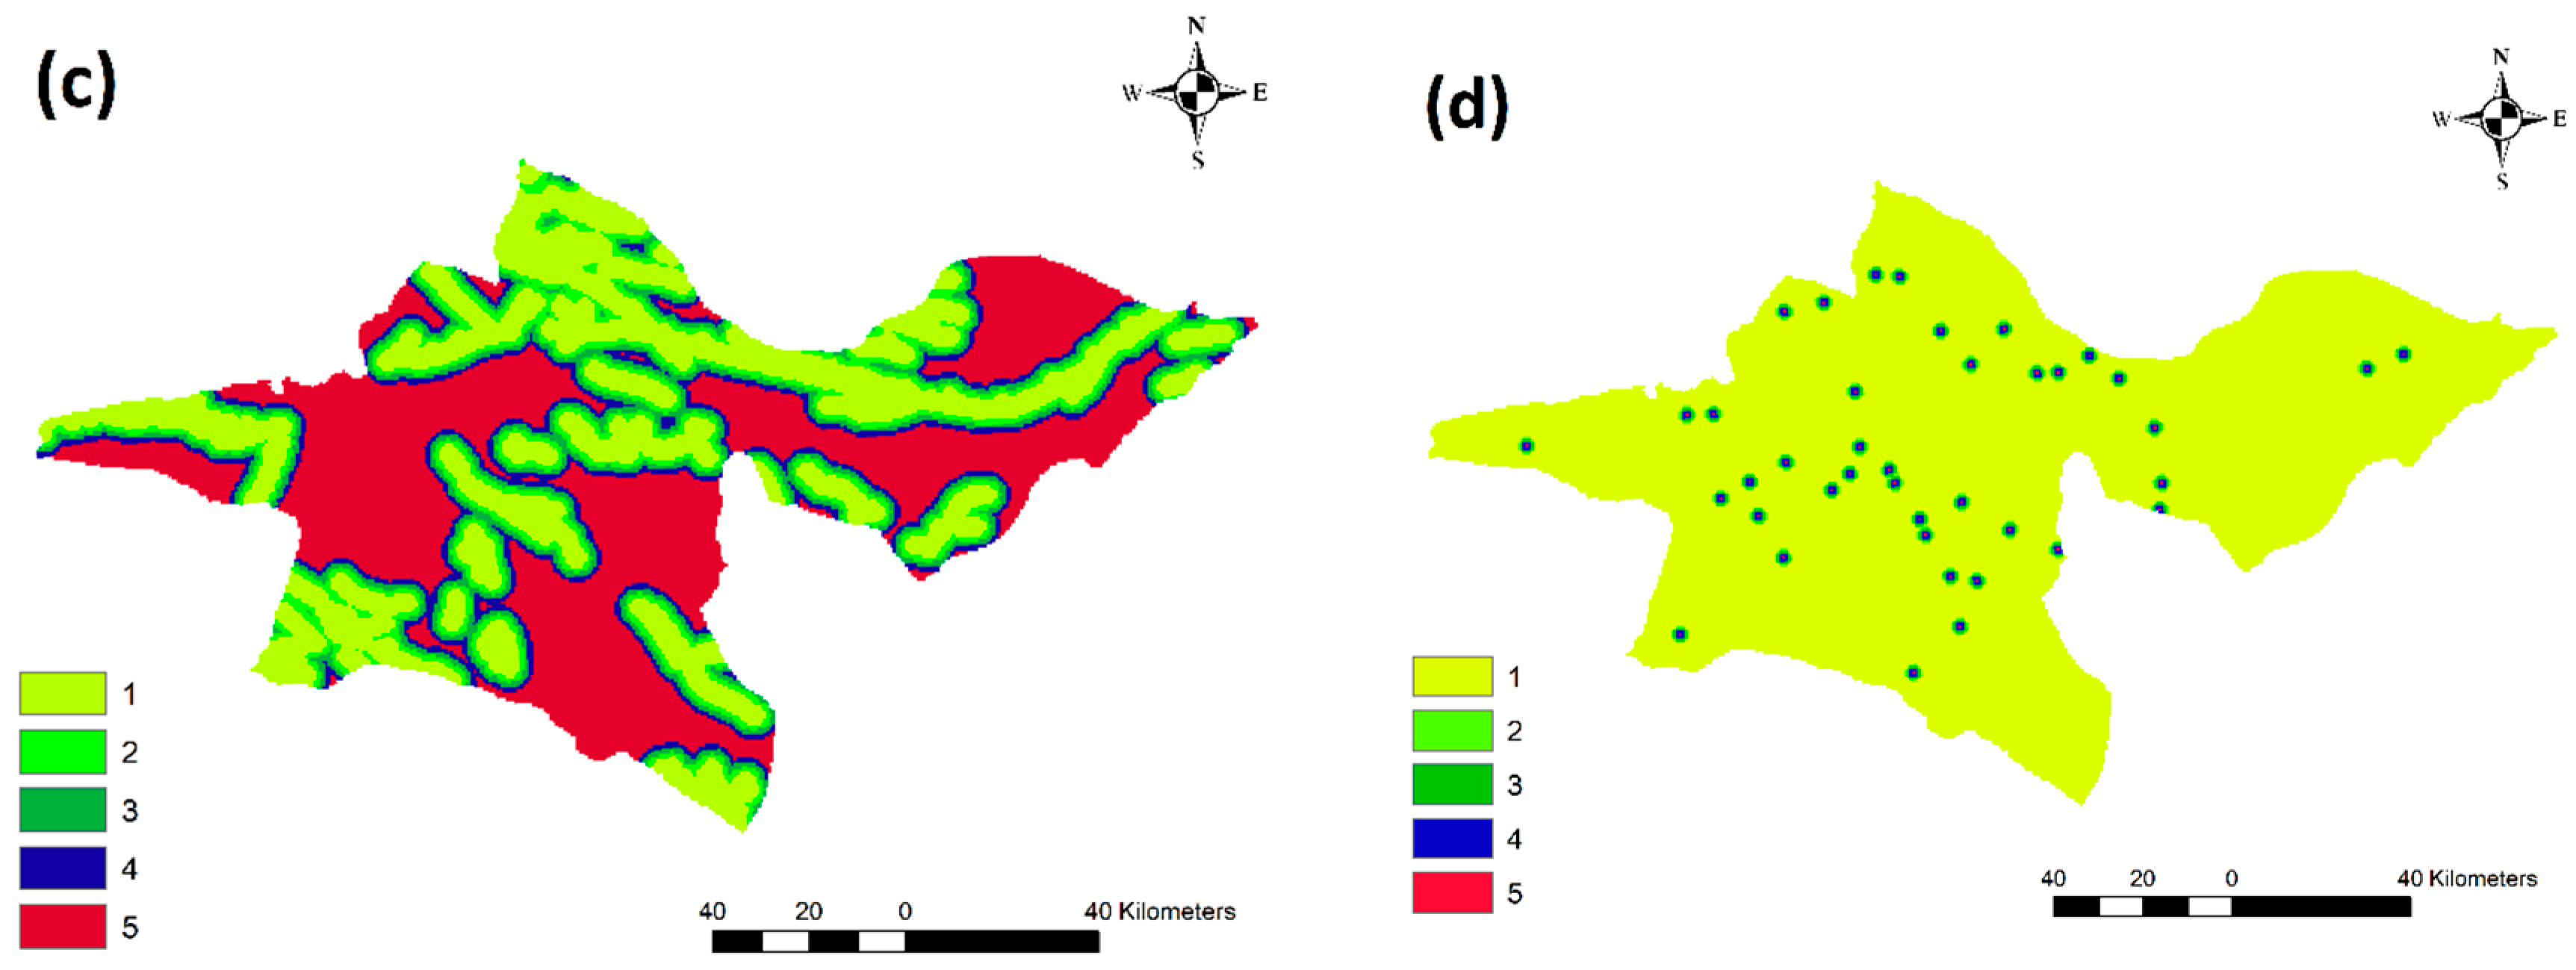
3.1. Results of Rainfall Analysis

The occurrence of rainfall is associated with uncertainty, wherein probability distributions describe the pattern of uncertainty explicitly and quantitatively. Figure 5 shows the results of the Monte Carlo simulation using the complementary cumulative distribution function (CCDF) to denote the probability of exceedance for selected stations. Herein, several points of intersection among these CCDFs can be observed in Figure 5, revealing that the spatial distribution of rainfall may shift when users choose different levels of probability of exceedance. As the uncertainty in output depends heavily on the uncertainty in input, such information with probability can be valuable for the DSS with more reliability and less uncertainty than that of the traditional methods using only one fixed amount or the average annual rainfall for site selection of RWH agriculture.
As mentioned above, this study selects rainfall data with a 70% probability of exceedance to fit the crops with a higher level of water demand in the MCDM, which was further spatially interpolated in the suitability ranking.

3.2. Suitability Ranking for the Criteria

These spatial data used for MCDM will be further reclassified for suitability ranking based on the setting supported by a literature review [31,32,35,50,51]. For integrating and processing the various criteria, the suitability ranking was applied to set all criteria into a common measurement scale, namely, 5 (excellent), 4 (very suitable), 3 (moderate), 2 (poor), and 1 (not suitable). Table 3 lists the 5 class ranks adopted in this study.
As for the interpolation methods, Pellicone et al. [65] compared different interpolation methods using cross-validation and visual analysis on the precipitation maps, and reported that the geostatistical interpolation techniques, e.g., Ordinary Kriging (OK), Kriging with External Drift (KED), Ordinary Cokriging (COK), Exponential Ordinary Kriging (EOK) and Empirical Bayesian Kriging (EBK), outperform the deterministic methods such as the Inverse Distance Weighting (IDW). Gupta et al. [66] has evaluated the efficiency of various types of geostatistical interpolation techniques in arid and semi-arid regions of north-west India, indicating that both EOK and EBK revealed better performance over other kriging techniques. However, less root-mean-square error values occurred in EBK, suggesting it as the best-fit technique. Consequently, this study adopted EBK for developing spatially distributed rainfall raster.
Figure 6 demonstrates the spatial data for biophysical criteria, where Figure 6a is the spatial distribution of annual rainfall with a 70% probability of being exceeded; Figure 6b is the slope map; Figure 6c shows land use; Figure 6d shows land cover; Figure 6e is soil texture; and Figure 6f shows drainage density. These figures are based on the suitability ranking in Table 3.
Figure 7 shows the socioeconomic criteria and associated suitability ranking. The Euclidean distance tool was used to generate the following figures: Figure 7a, distance to road; Figure 7b, distance to rivers; Figure 7c, distance to faults; and Figure 7d, distance to urban centers. These spatial data will be used in the BWM and Fuzzy logic to obtain the general suitability map for RWH agriculture.

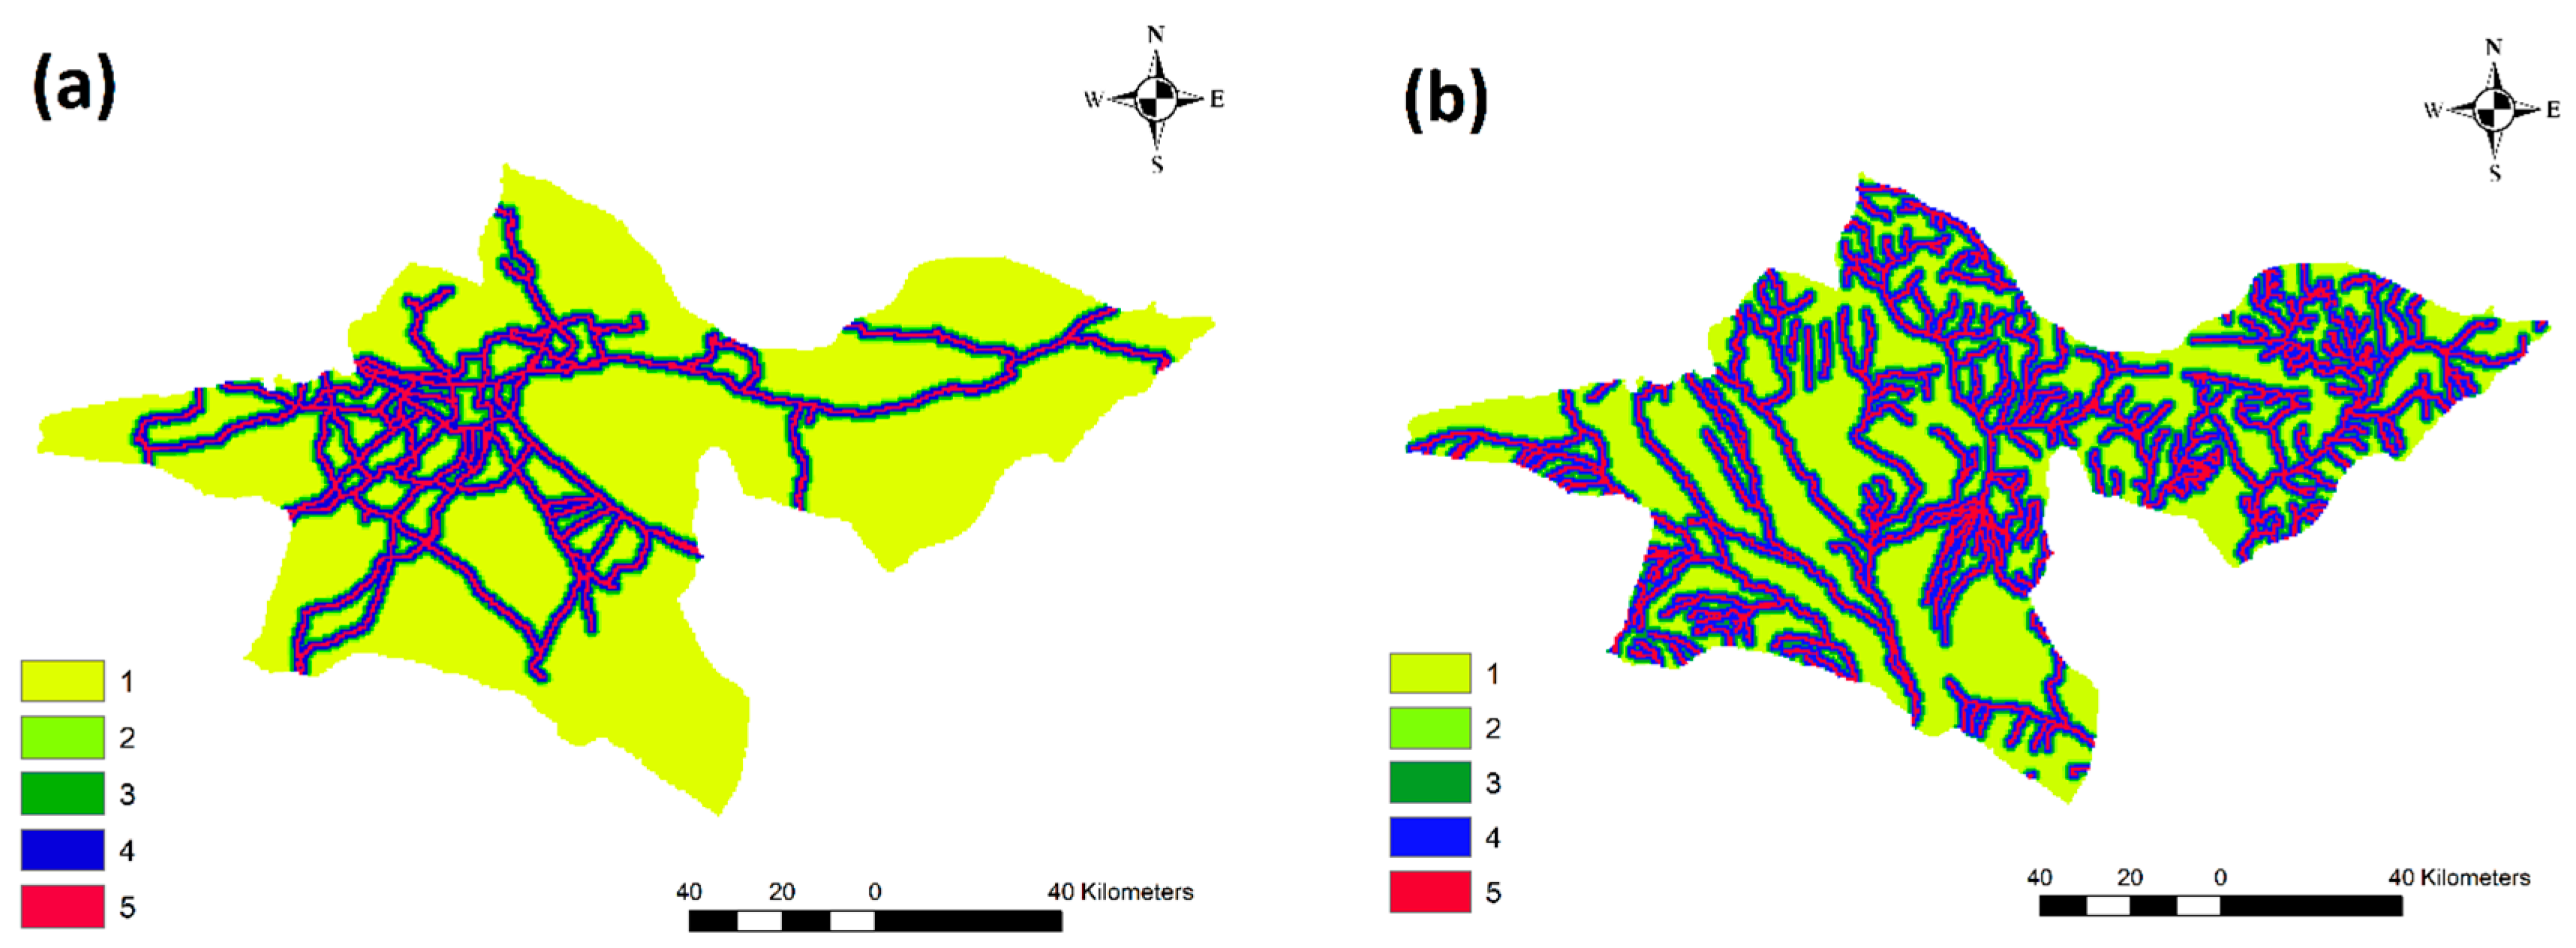
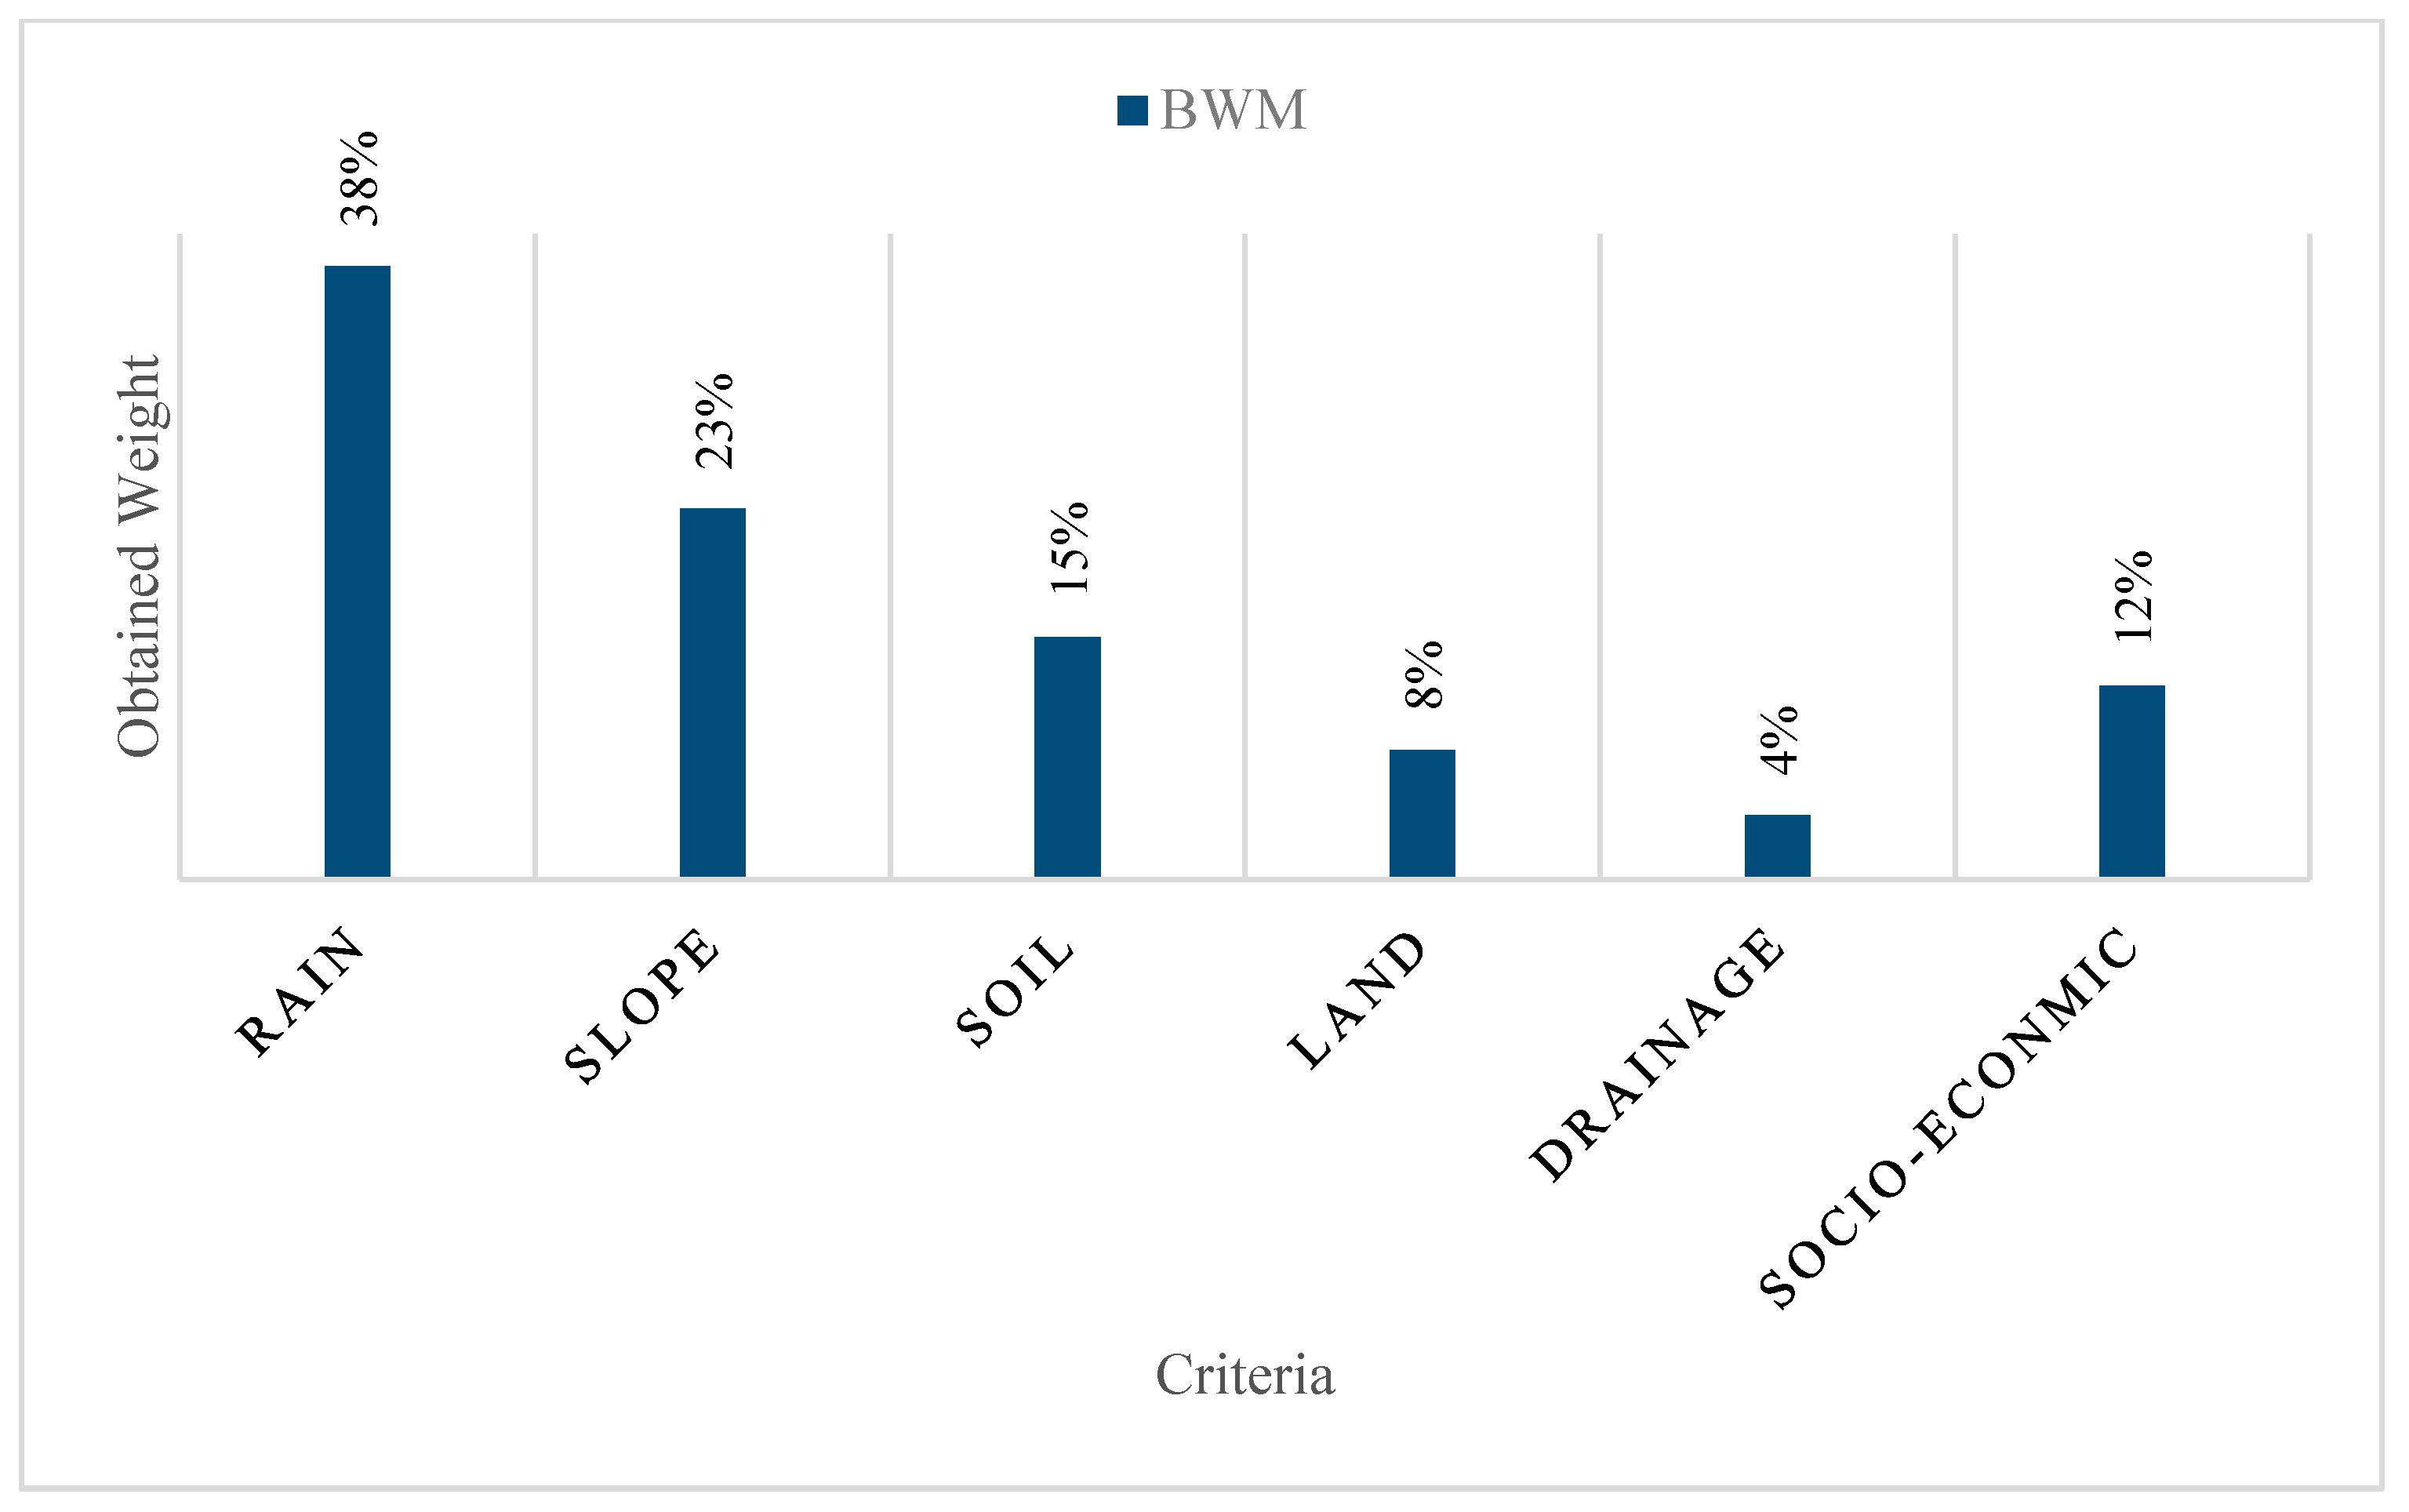
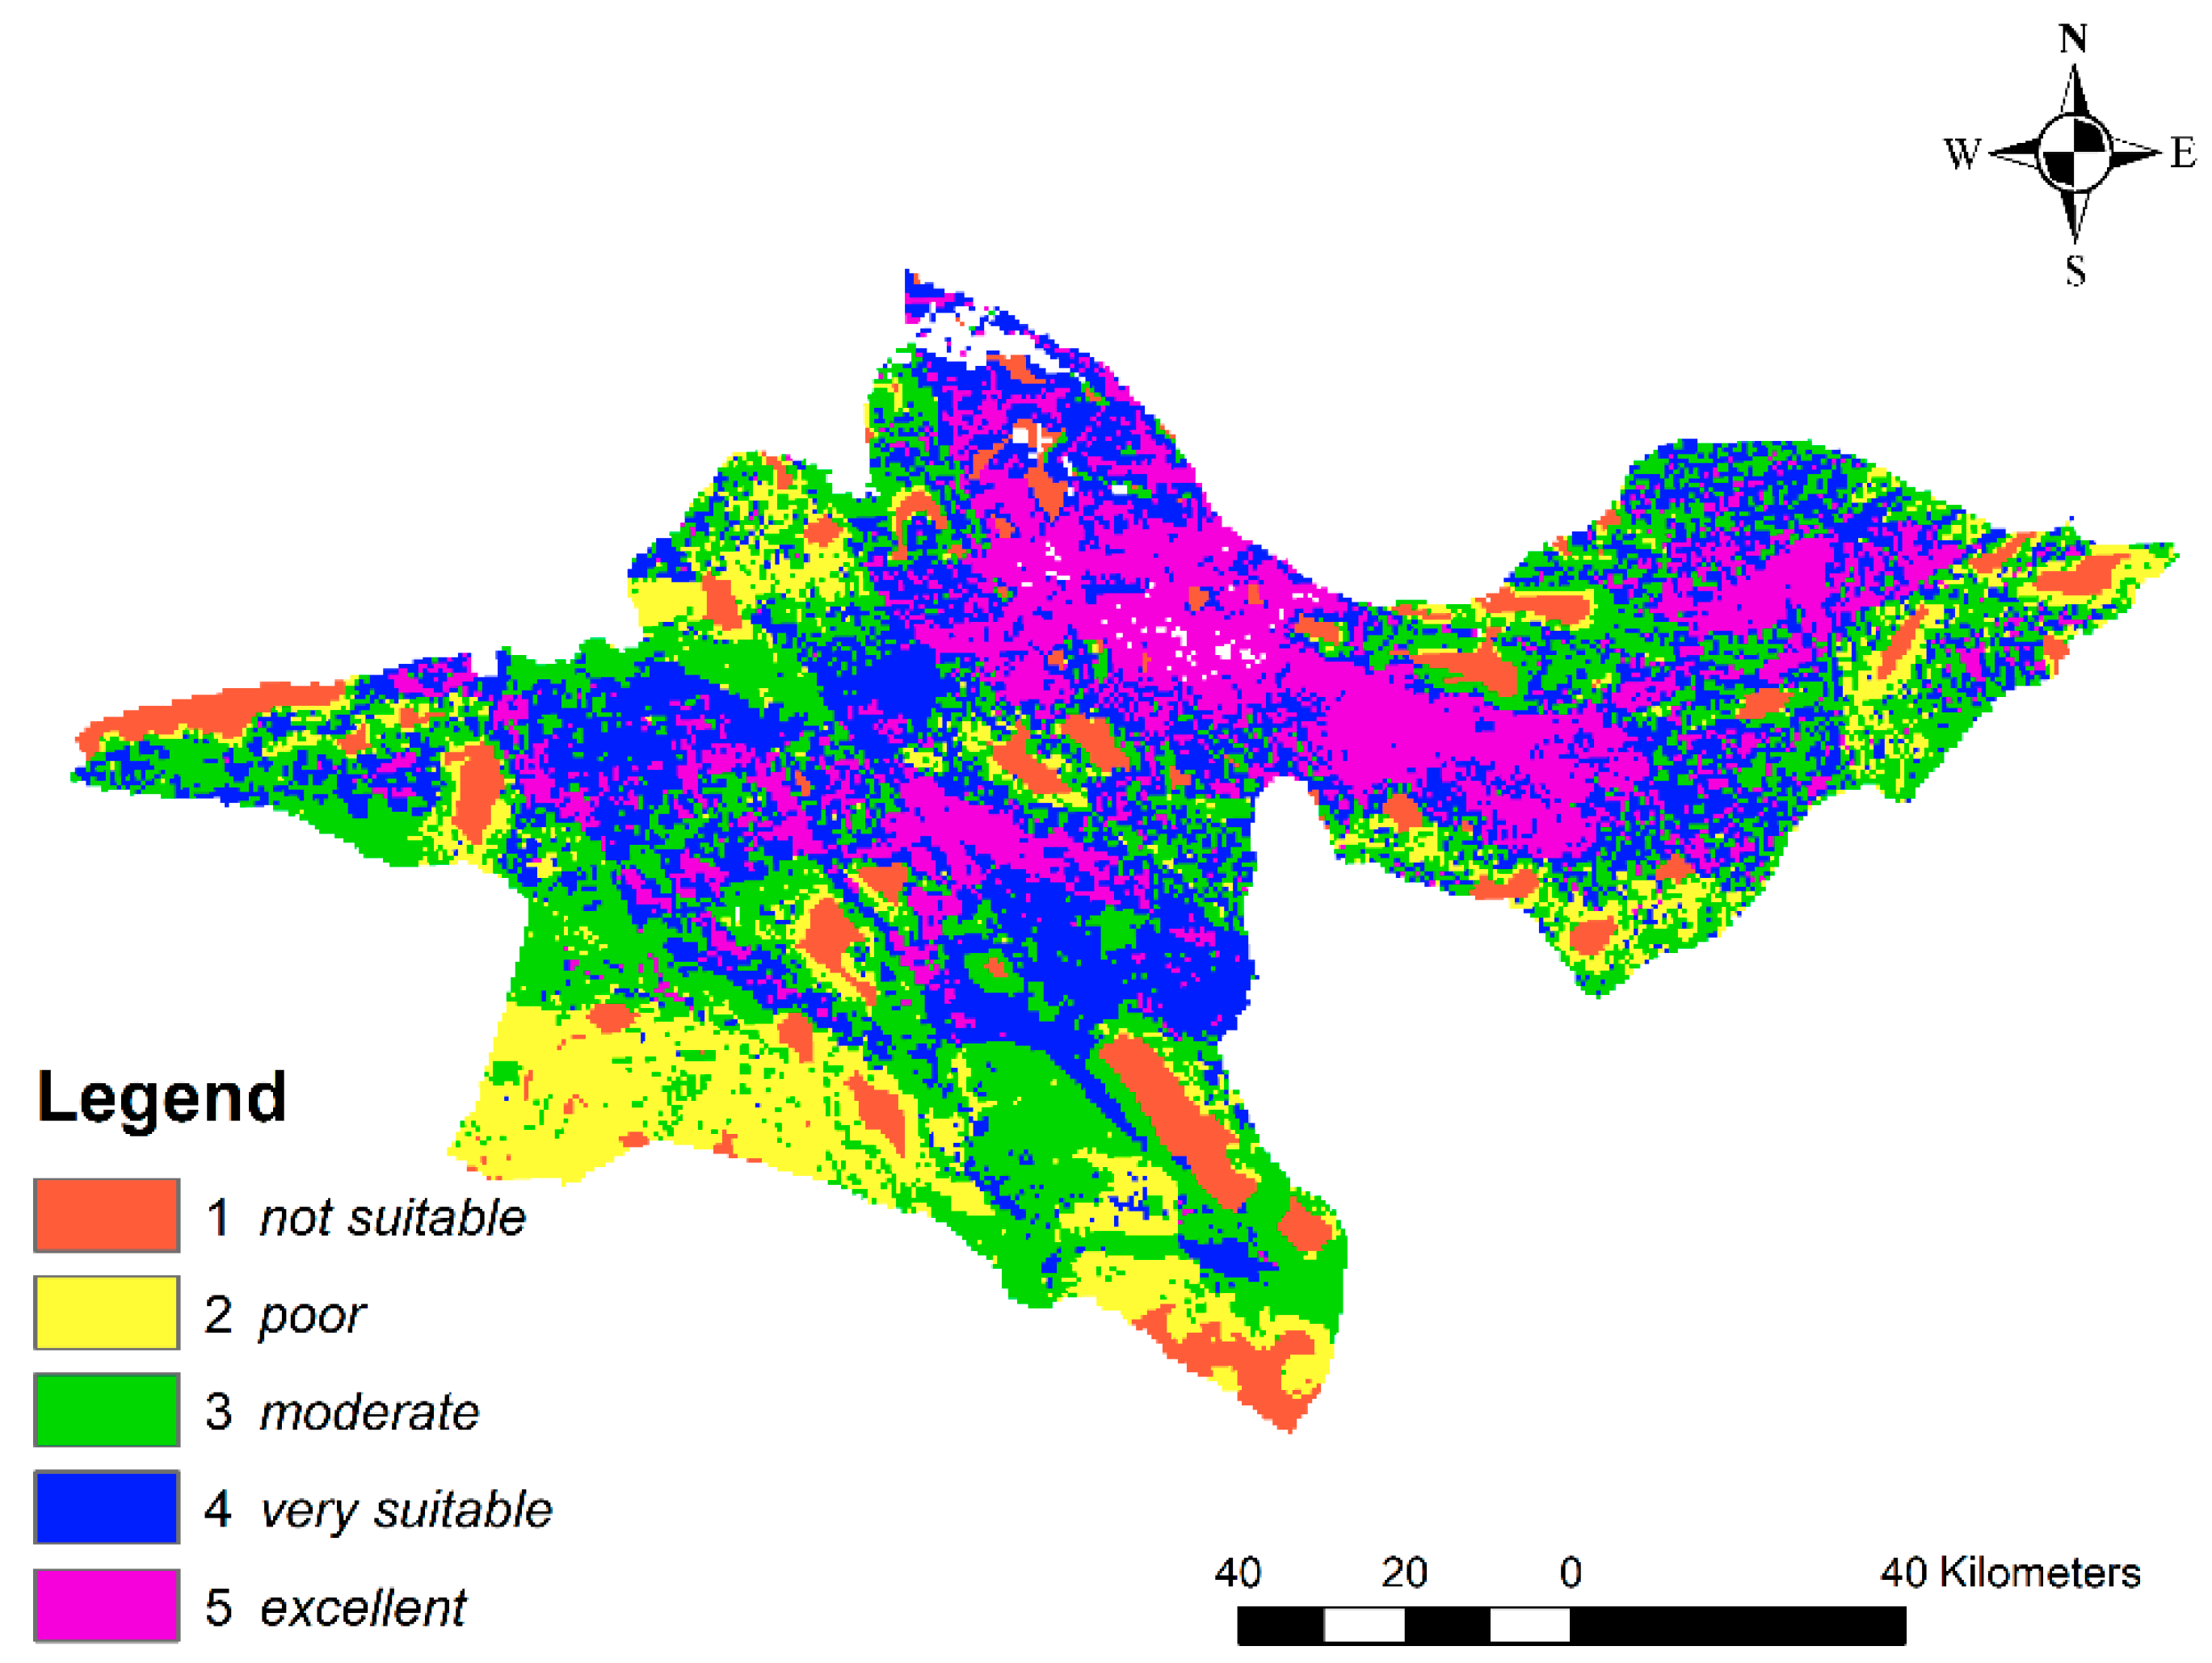
3.3. BWM Results and General Suitability Maps
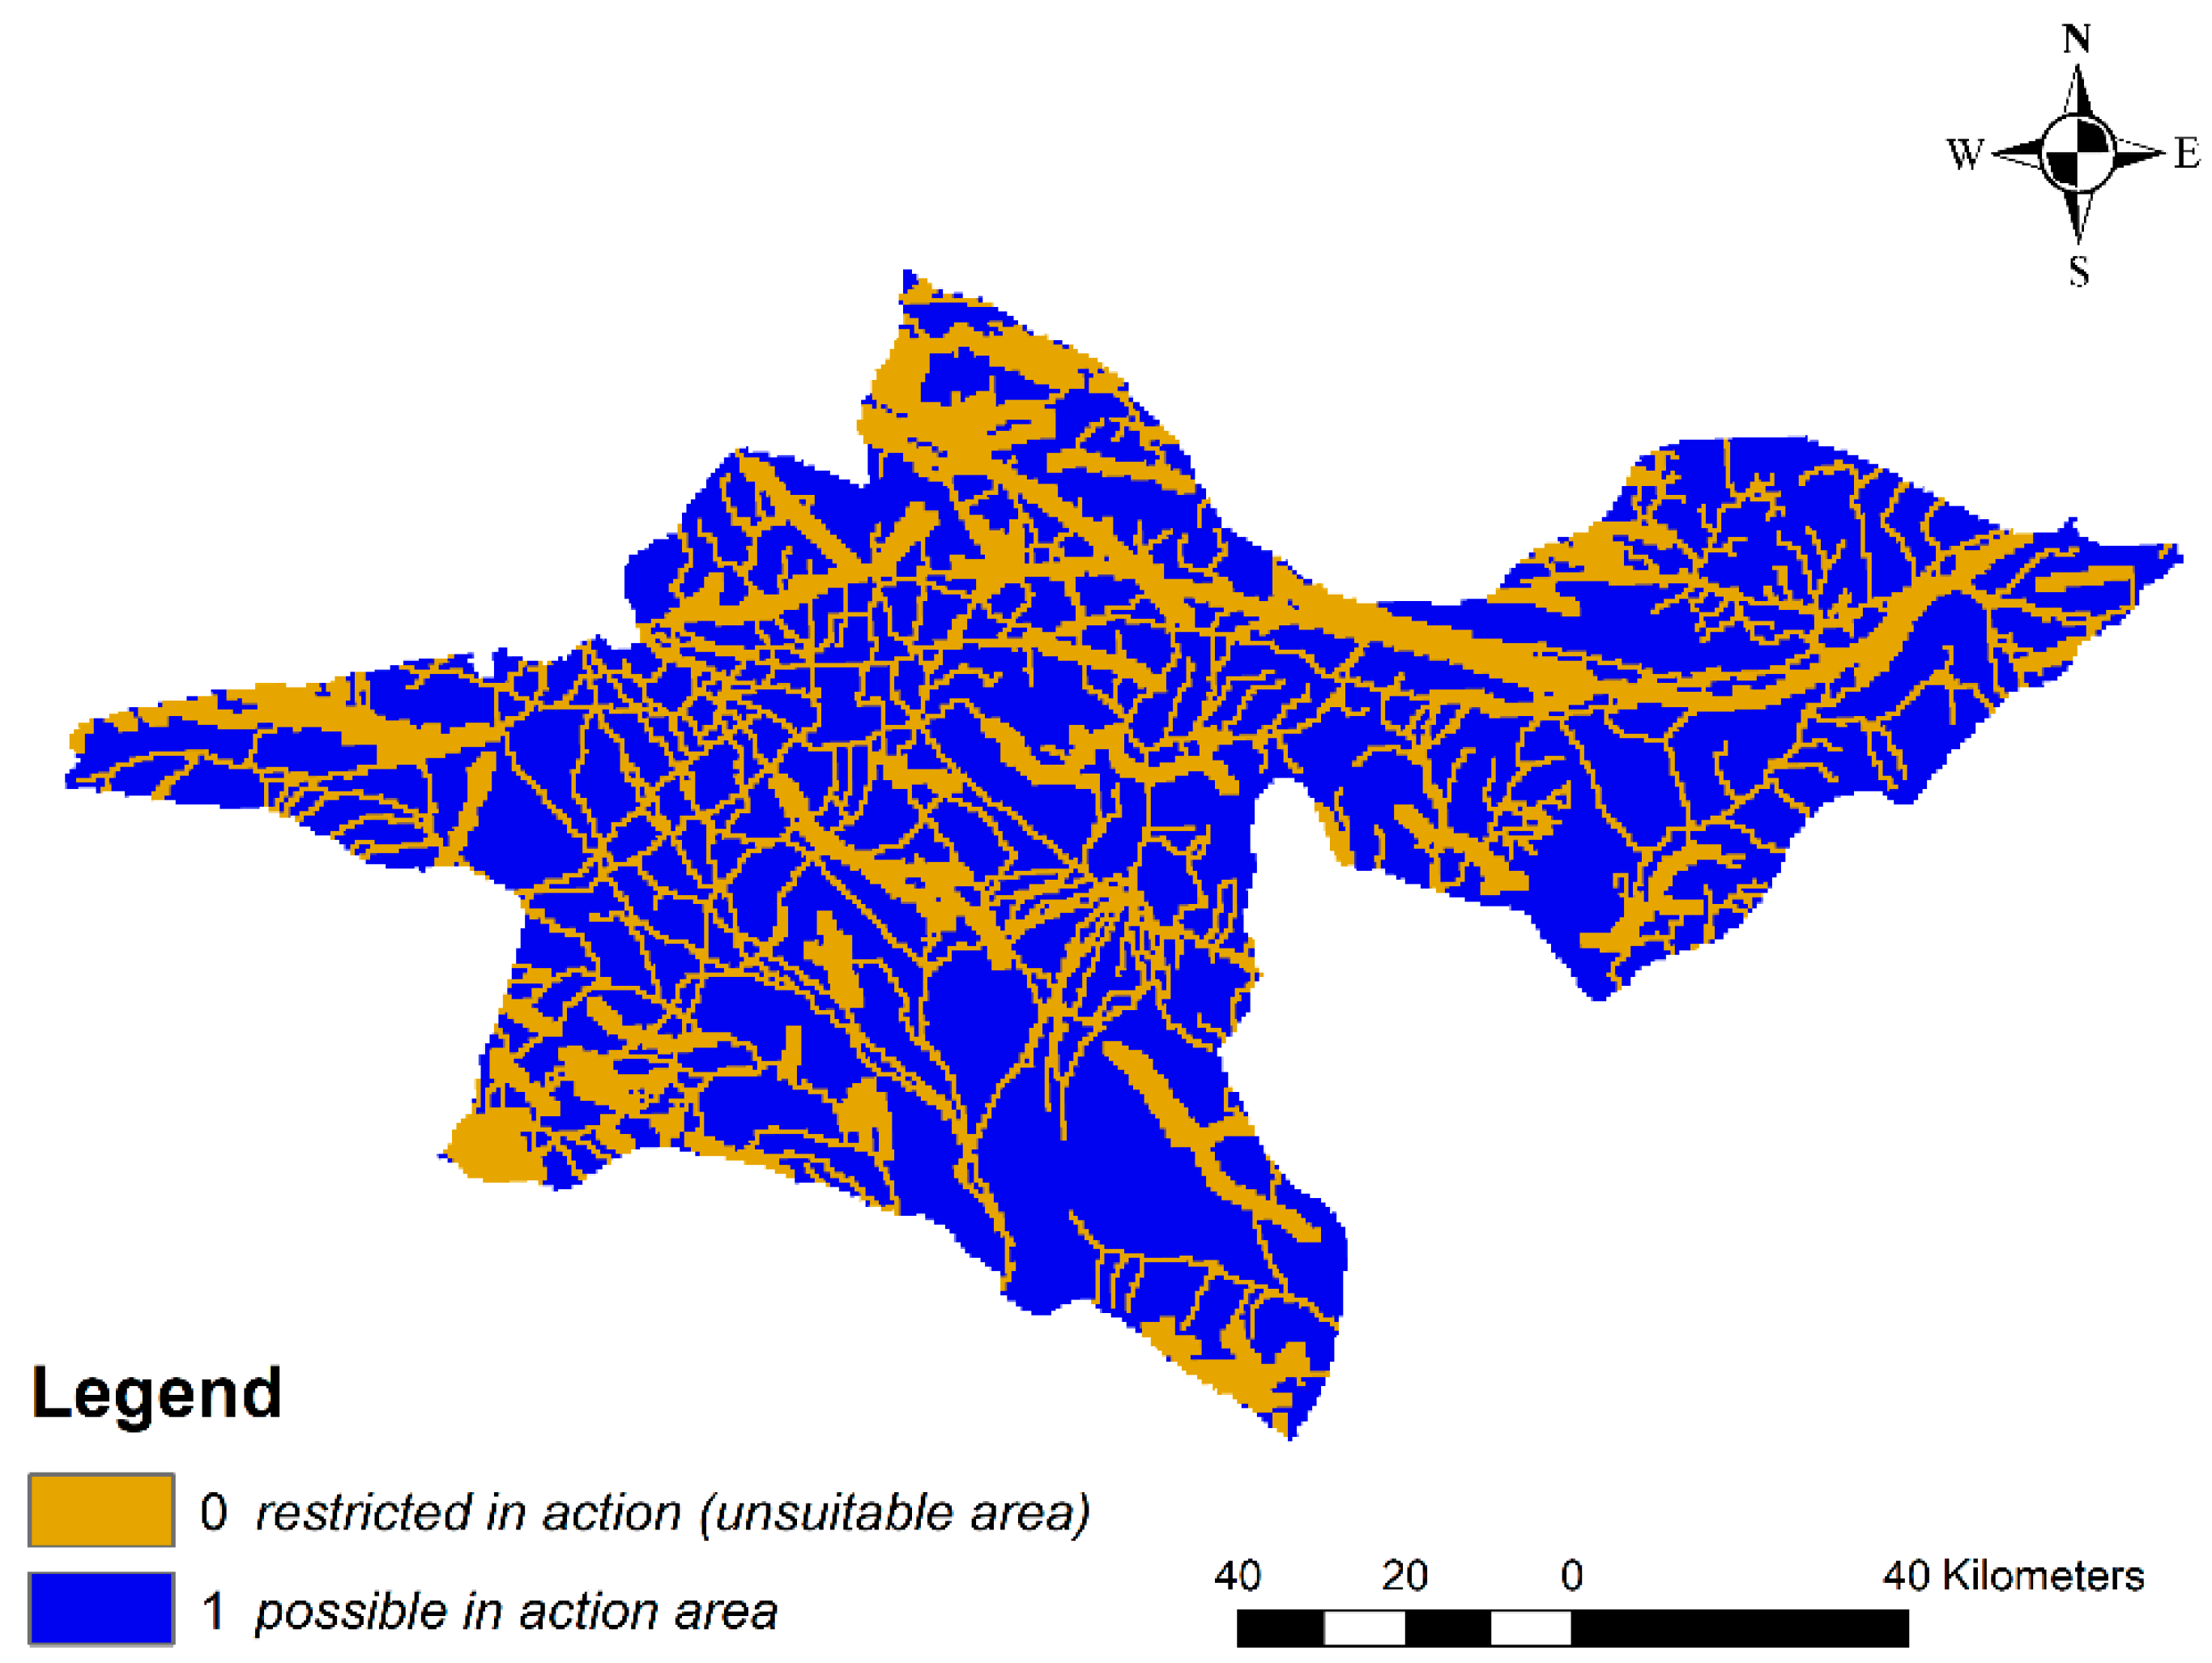
The BWM was conducted to achieve the weightings of six criteria and then applied in GIS using Fuzzy logic to obtain the suitability maps for various types of RWH systems. In this process, a constraint map will also be generated and further applied to exclude the unsuitable areas to enhance the value of the output of the DSS.
Using the five steps of the BWM, Figure 8 shows the results of weighting the criteria with a consistency ratio equal to 0.07, which means the reliability of the results. Among them, the weighting of rainfall is highest (38%), while the density of drainage is lowest (4%). These weightings will be further transformed to a Fuzzy scale using Fuzzy logic in the GIS environment. The Fuzzy membership tool in ArcGIS Spatial Analyst extension was adopted to reclassify the values to the 0 to 1 possibility scale.
Figure 9 shows the general suitability maps resulting from the process of the BWM and Fuzzy logic. However, such a general map needs to be further processed by excluding the unsuitable areas, e.g., the buffers of roads, rivers, city centers and faults, that cannot be selected to implement RWH structures due to technical, financial and environmental limitations [50].

3.4. Constraint Map

This study adopted the Boolean technique to specify the areas that are restricted in action and impossible to implement RWH. Four layers were selected as constraints and reclassified into binary maps. A value of 0 was assigned to restricted areas, and a value of 1 was assigned to suitable areas [51]. The advantage of the Boolean method is the ease and simplicity of the calculations and its quick implementation. Table 4 lists the criteria for the Boolean technique suggested by Al-Adamat et al. [50]. Figure 10 shows the results of the constraint map.
After the unsuitable areas in Figure 10 are excluded, the new suitability map can be further narrowed down and specified for different types of RWH agriculture.

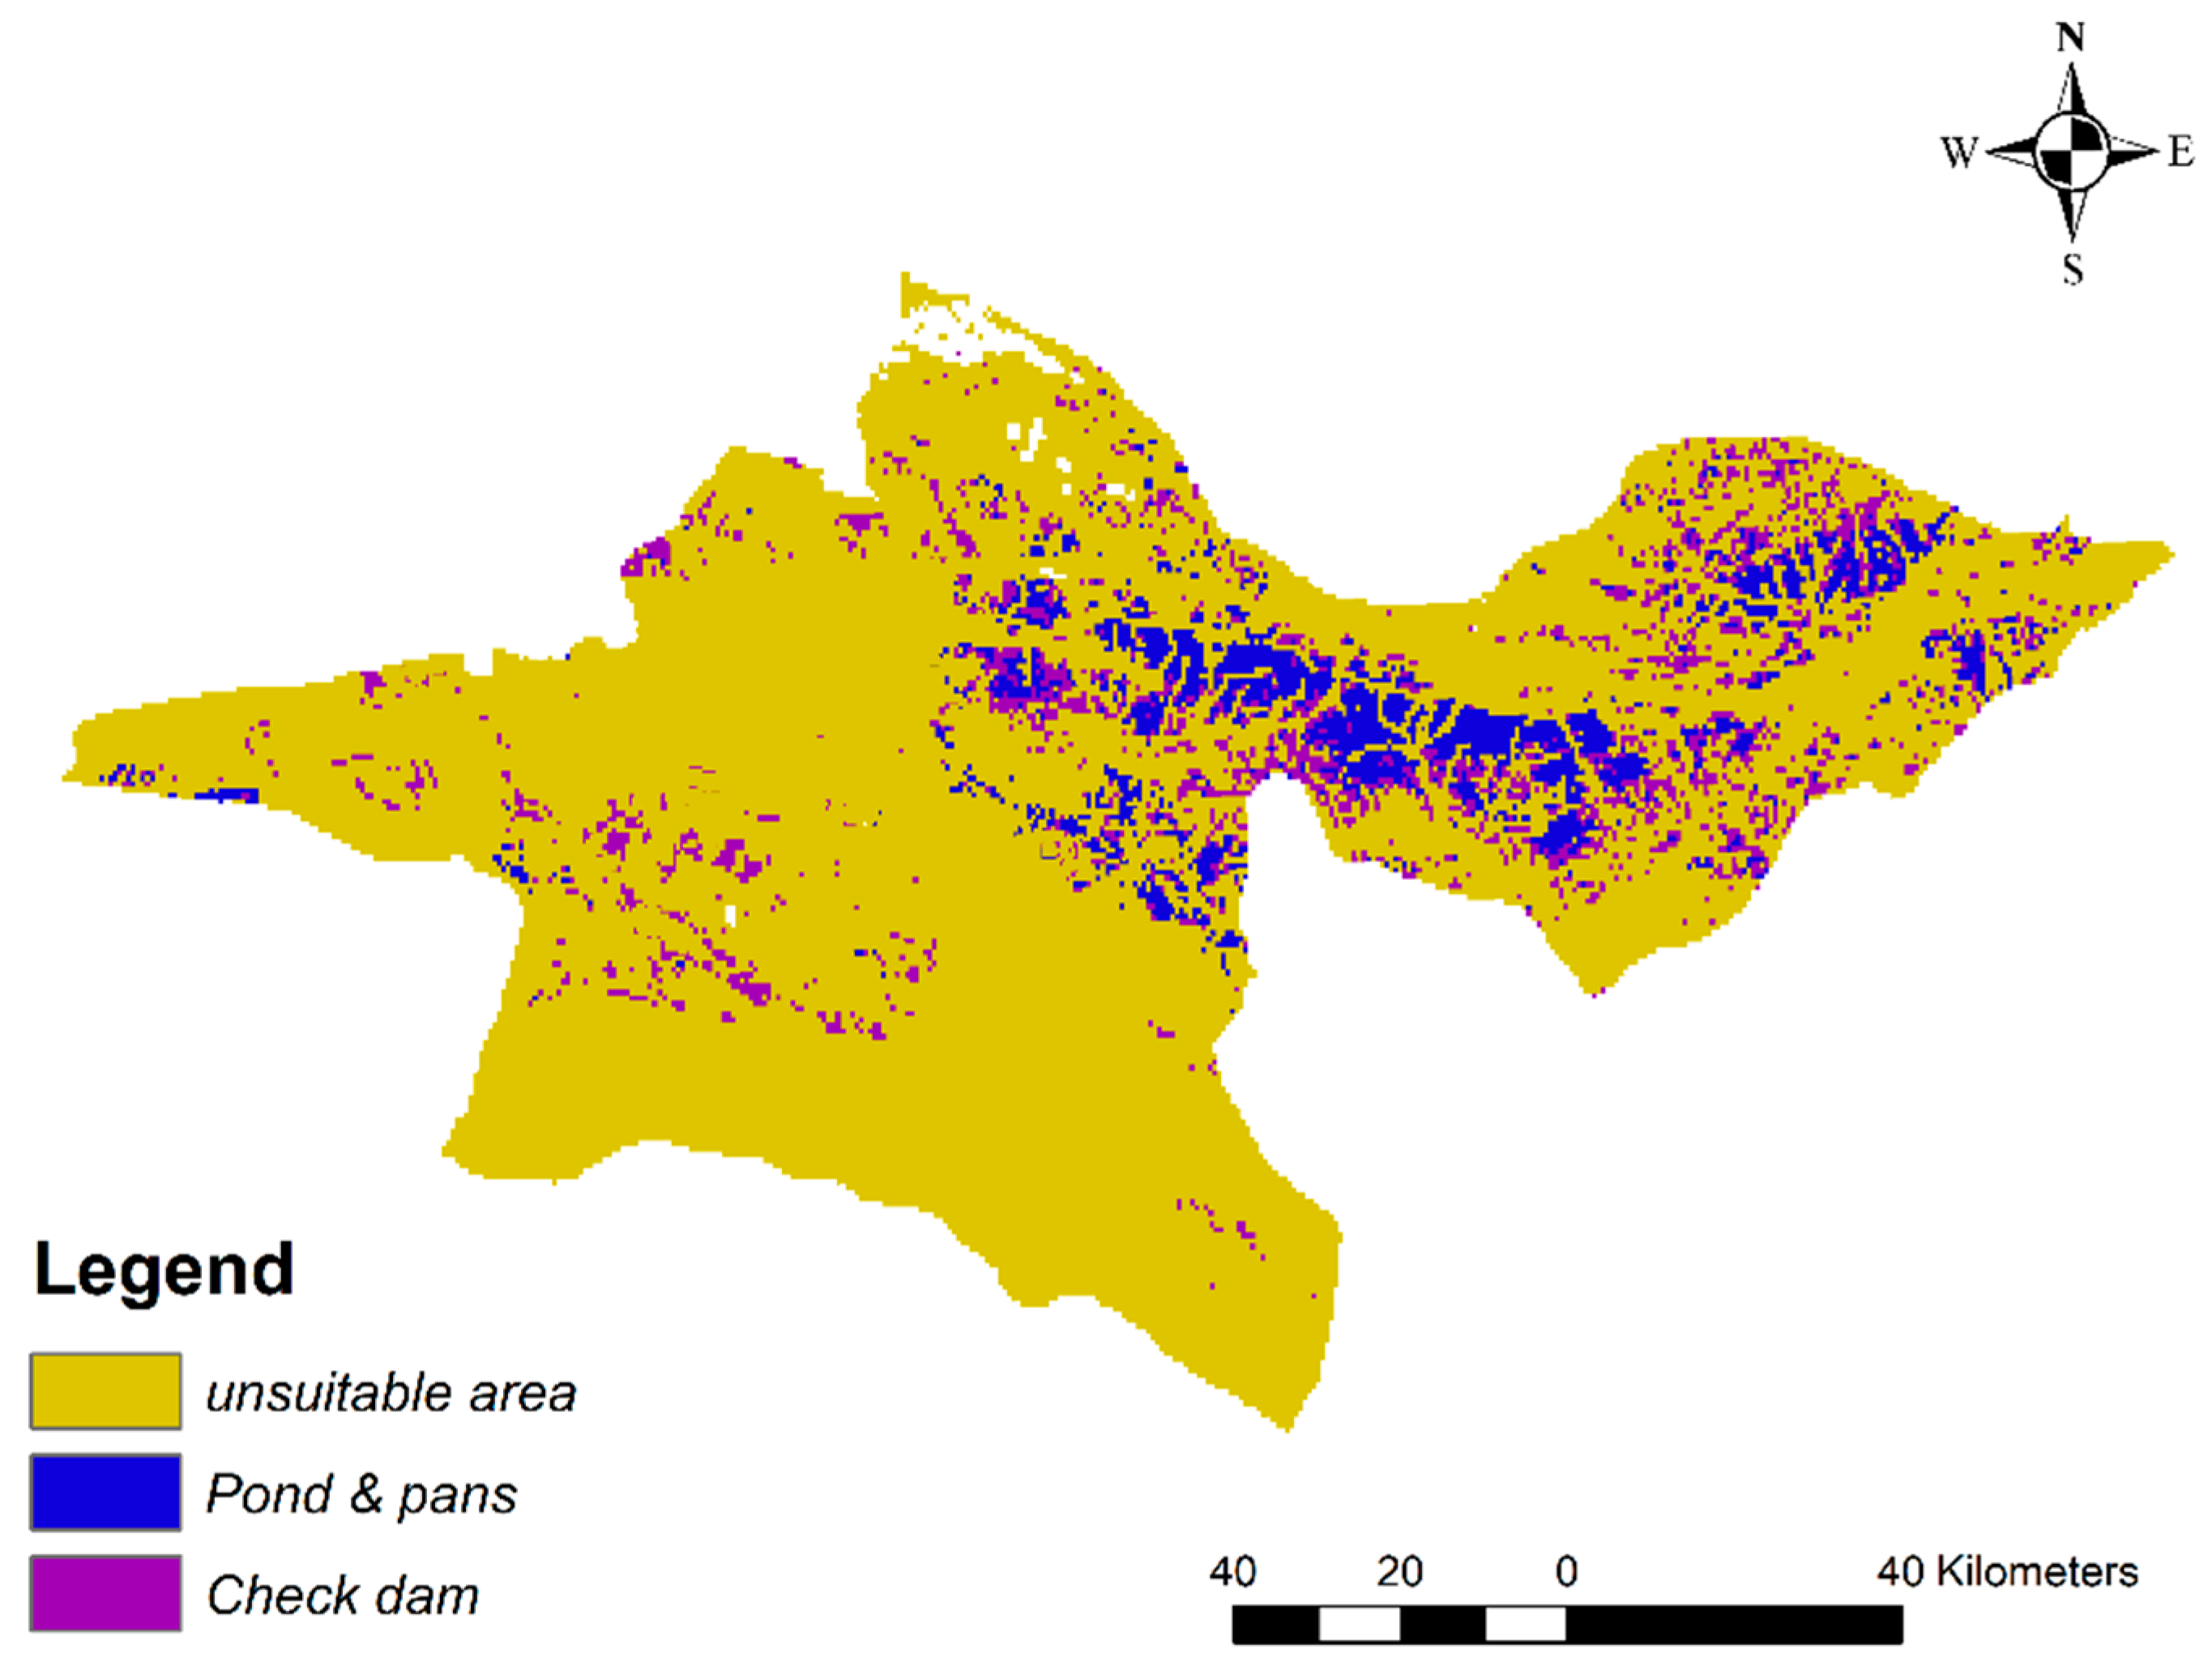
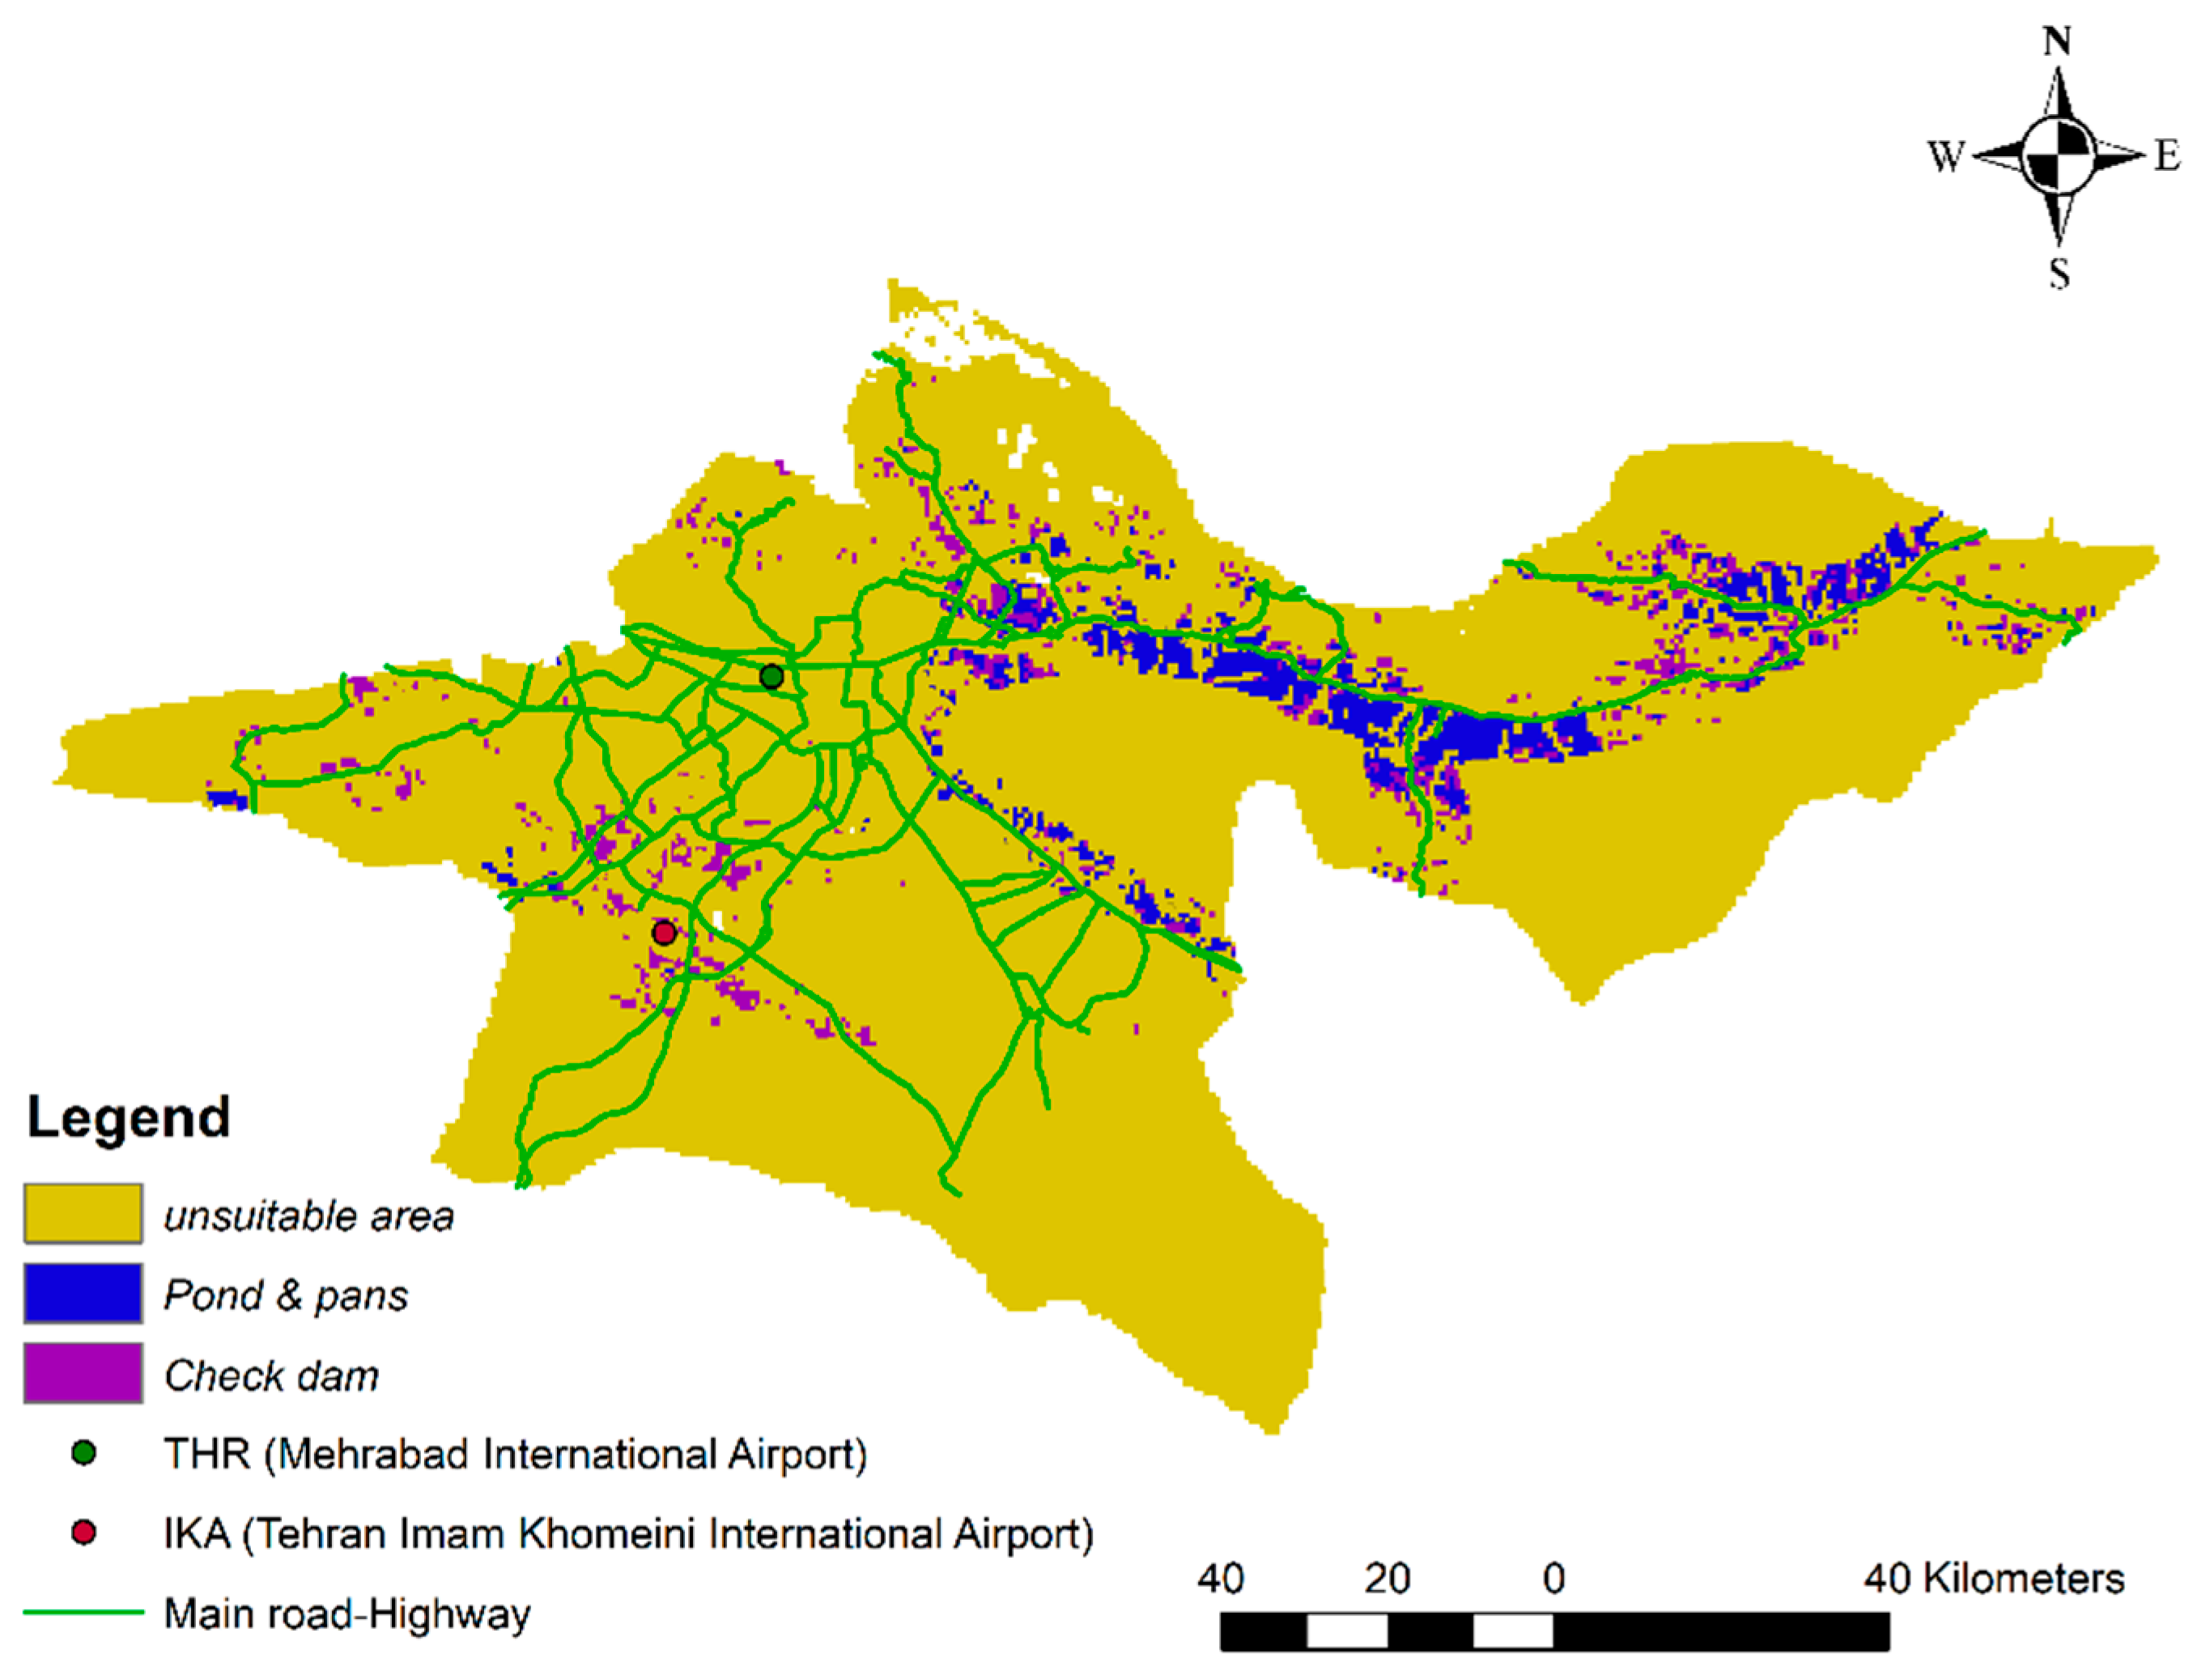
3.5. Identifying Suitable Areas for Different RWH Systems and Scenarios

Table 5 lists the criteria for three types of conventional techniques widely used in arid and semiarid areas, which have been adopted from previous studies [31,37].
Figure 11 shows the areas with suitability of 5 (excellent) and 4 (very suitable) areas for the three types of RWH technique. These maps allow decision makers to choose the appropriate RWH technique for the chosen areas and therefore is useful for promoting the RWH agriculture scheme.
The total area of the excellent and very suitable areas of all three types of RWH structures will be further used as the output of the DSS in the sensitivity analysis.

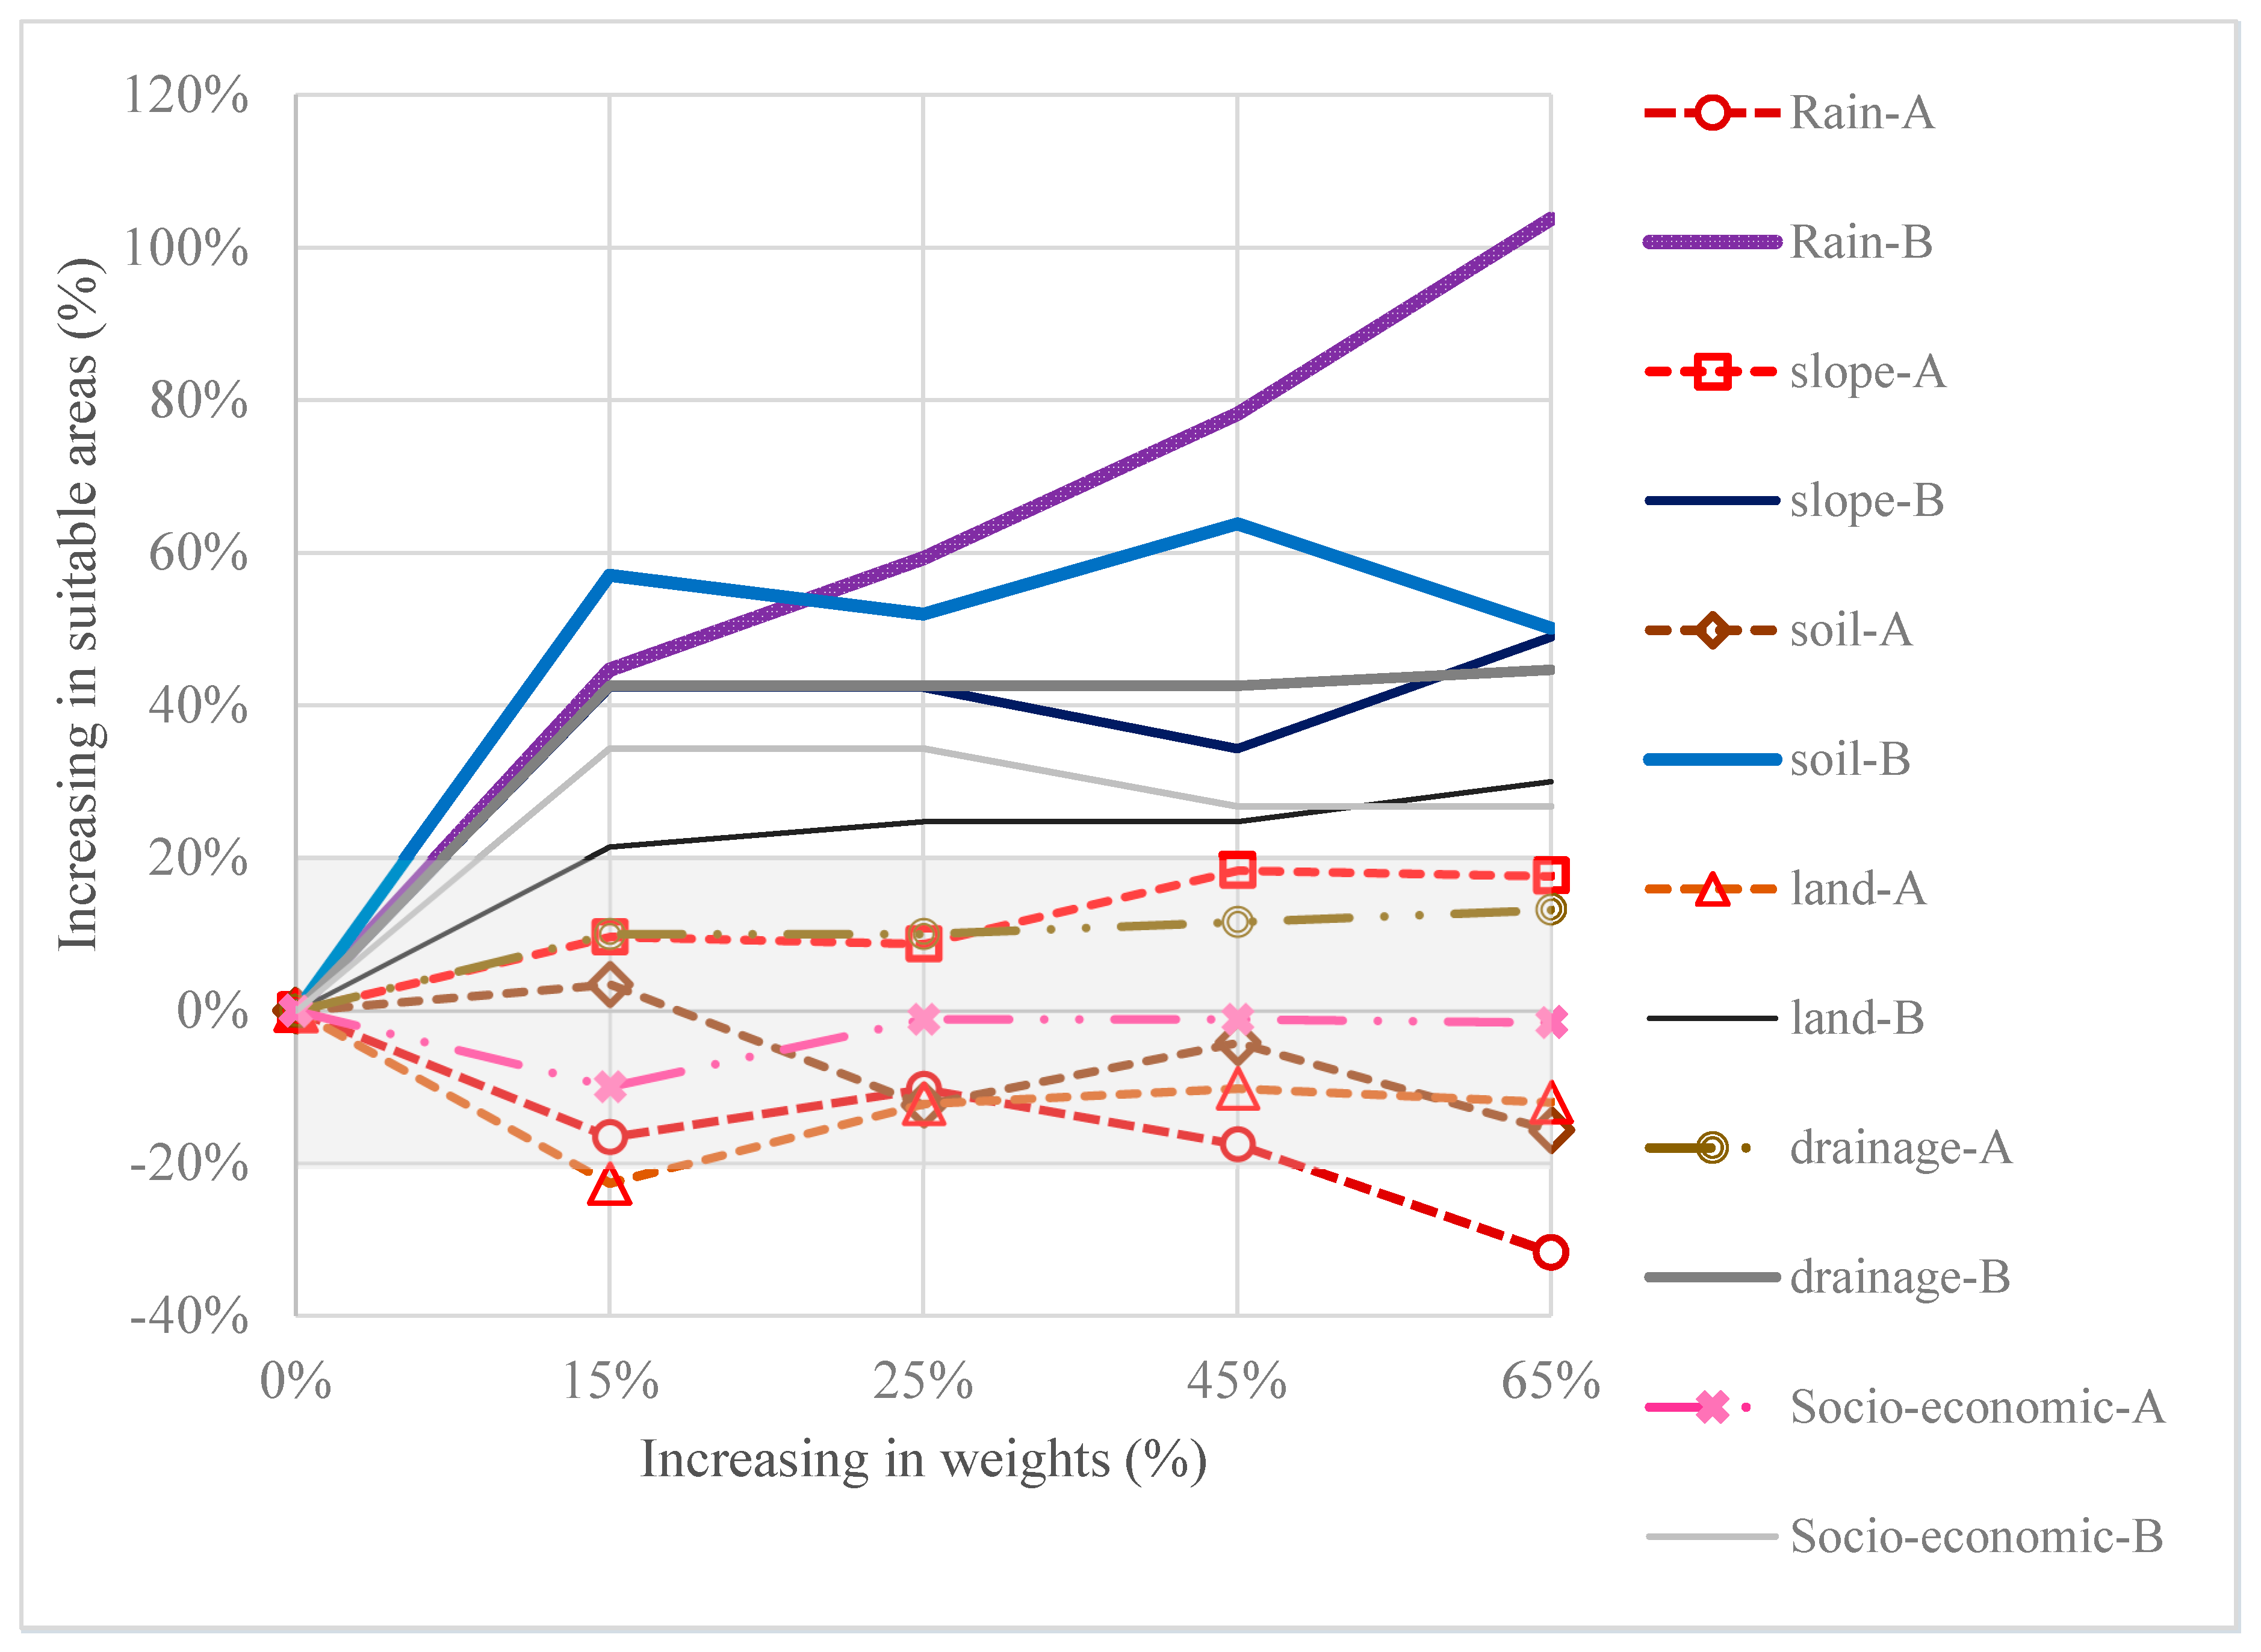
3.6. Sensitivity Analysis Using the OAT Method

To explore the stability and reliability of the proposed method, i.e., BWM + Fuzzy, the sensitivity analysis named OAT (one at a time) was conducted by comparing the proposed method with the most commonly used traditional method, AHP + WOP. The OAT explores the changes in output induced by changes in the modeling input parameters, enabling researchers to understand the behavior of the modeled system [67]. In this study, OAT revealed the model stability and criteria sensitivity [68,69]. In this context, for example, when considering the input parameter w 1 = 1.15   W 1 where w i = 1 ( W 1 is the weight of the first criterion obtained by the BWM), the other input parameter will be w 2 = w 3 = w 4 = w 5 = w 6 = ( 1 w 1 ) / 5 . The change in the weights input to GIS will result in a change in output, i.e., the total suitability, of the sensitivity analysis. This procedure was performed for each criterion and for 15%, 25%, 45% and 65% of each criterion for both BWM + Fuzzy and AHP + WOP.
Figure 12 shows the results of the sensitivity analysis. The variation in output area in BWM + Fuzzy is mostly limited within 20%, while that of AHP + WOP is mostly above 20% and even to 100%, showing that BWM + Fuzzy is more stable and thus reliable. Previous studies on MCDM have indicated that the BWM can provide more accurate and stable results with less uncertainty than that of AHP. In the case of site-selecting methods in the GIS environment, the results of the sensitivity analysis of BWM + Fuzzy are also better. This is partially because Fuzzy logic may greatly reduce the effects of subjective evaluation. Therefore, the sensitivity analysis has not only reinforced the previous study that the newer BWM is better than AHP but also showed that Fuzzy logic can work well with the BWM in the GIS environment. Consequently, the proposed method has been verified to enhance the information value and can, thereby, be accepted to discuss the strategy for transiting to the new RWH agricultural paradigm and thus reducing the overexploitation of groundwater in arid and semiarid areas.

3.7. Strategy for the Development of RWH Agriculture

Based on the results of this DSS, a phase-wise strategic plan for the RWH agricultural scheme in the study area can be further established. The factors that determine this strategic plan include the capital required for investment, the benefit to local farmers, the local food demand, and the commercial crops for exporting. Figure 13 shows areas of the existing farmland. By comparing with the existing farmland, the phase-wise strategic plan for RWH agriculture was discussed as follows.

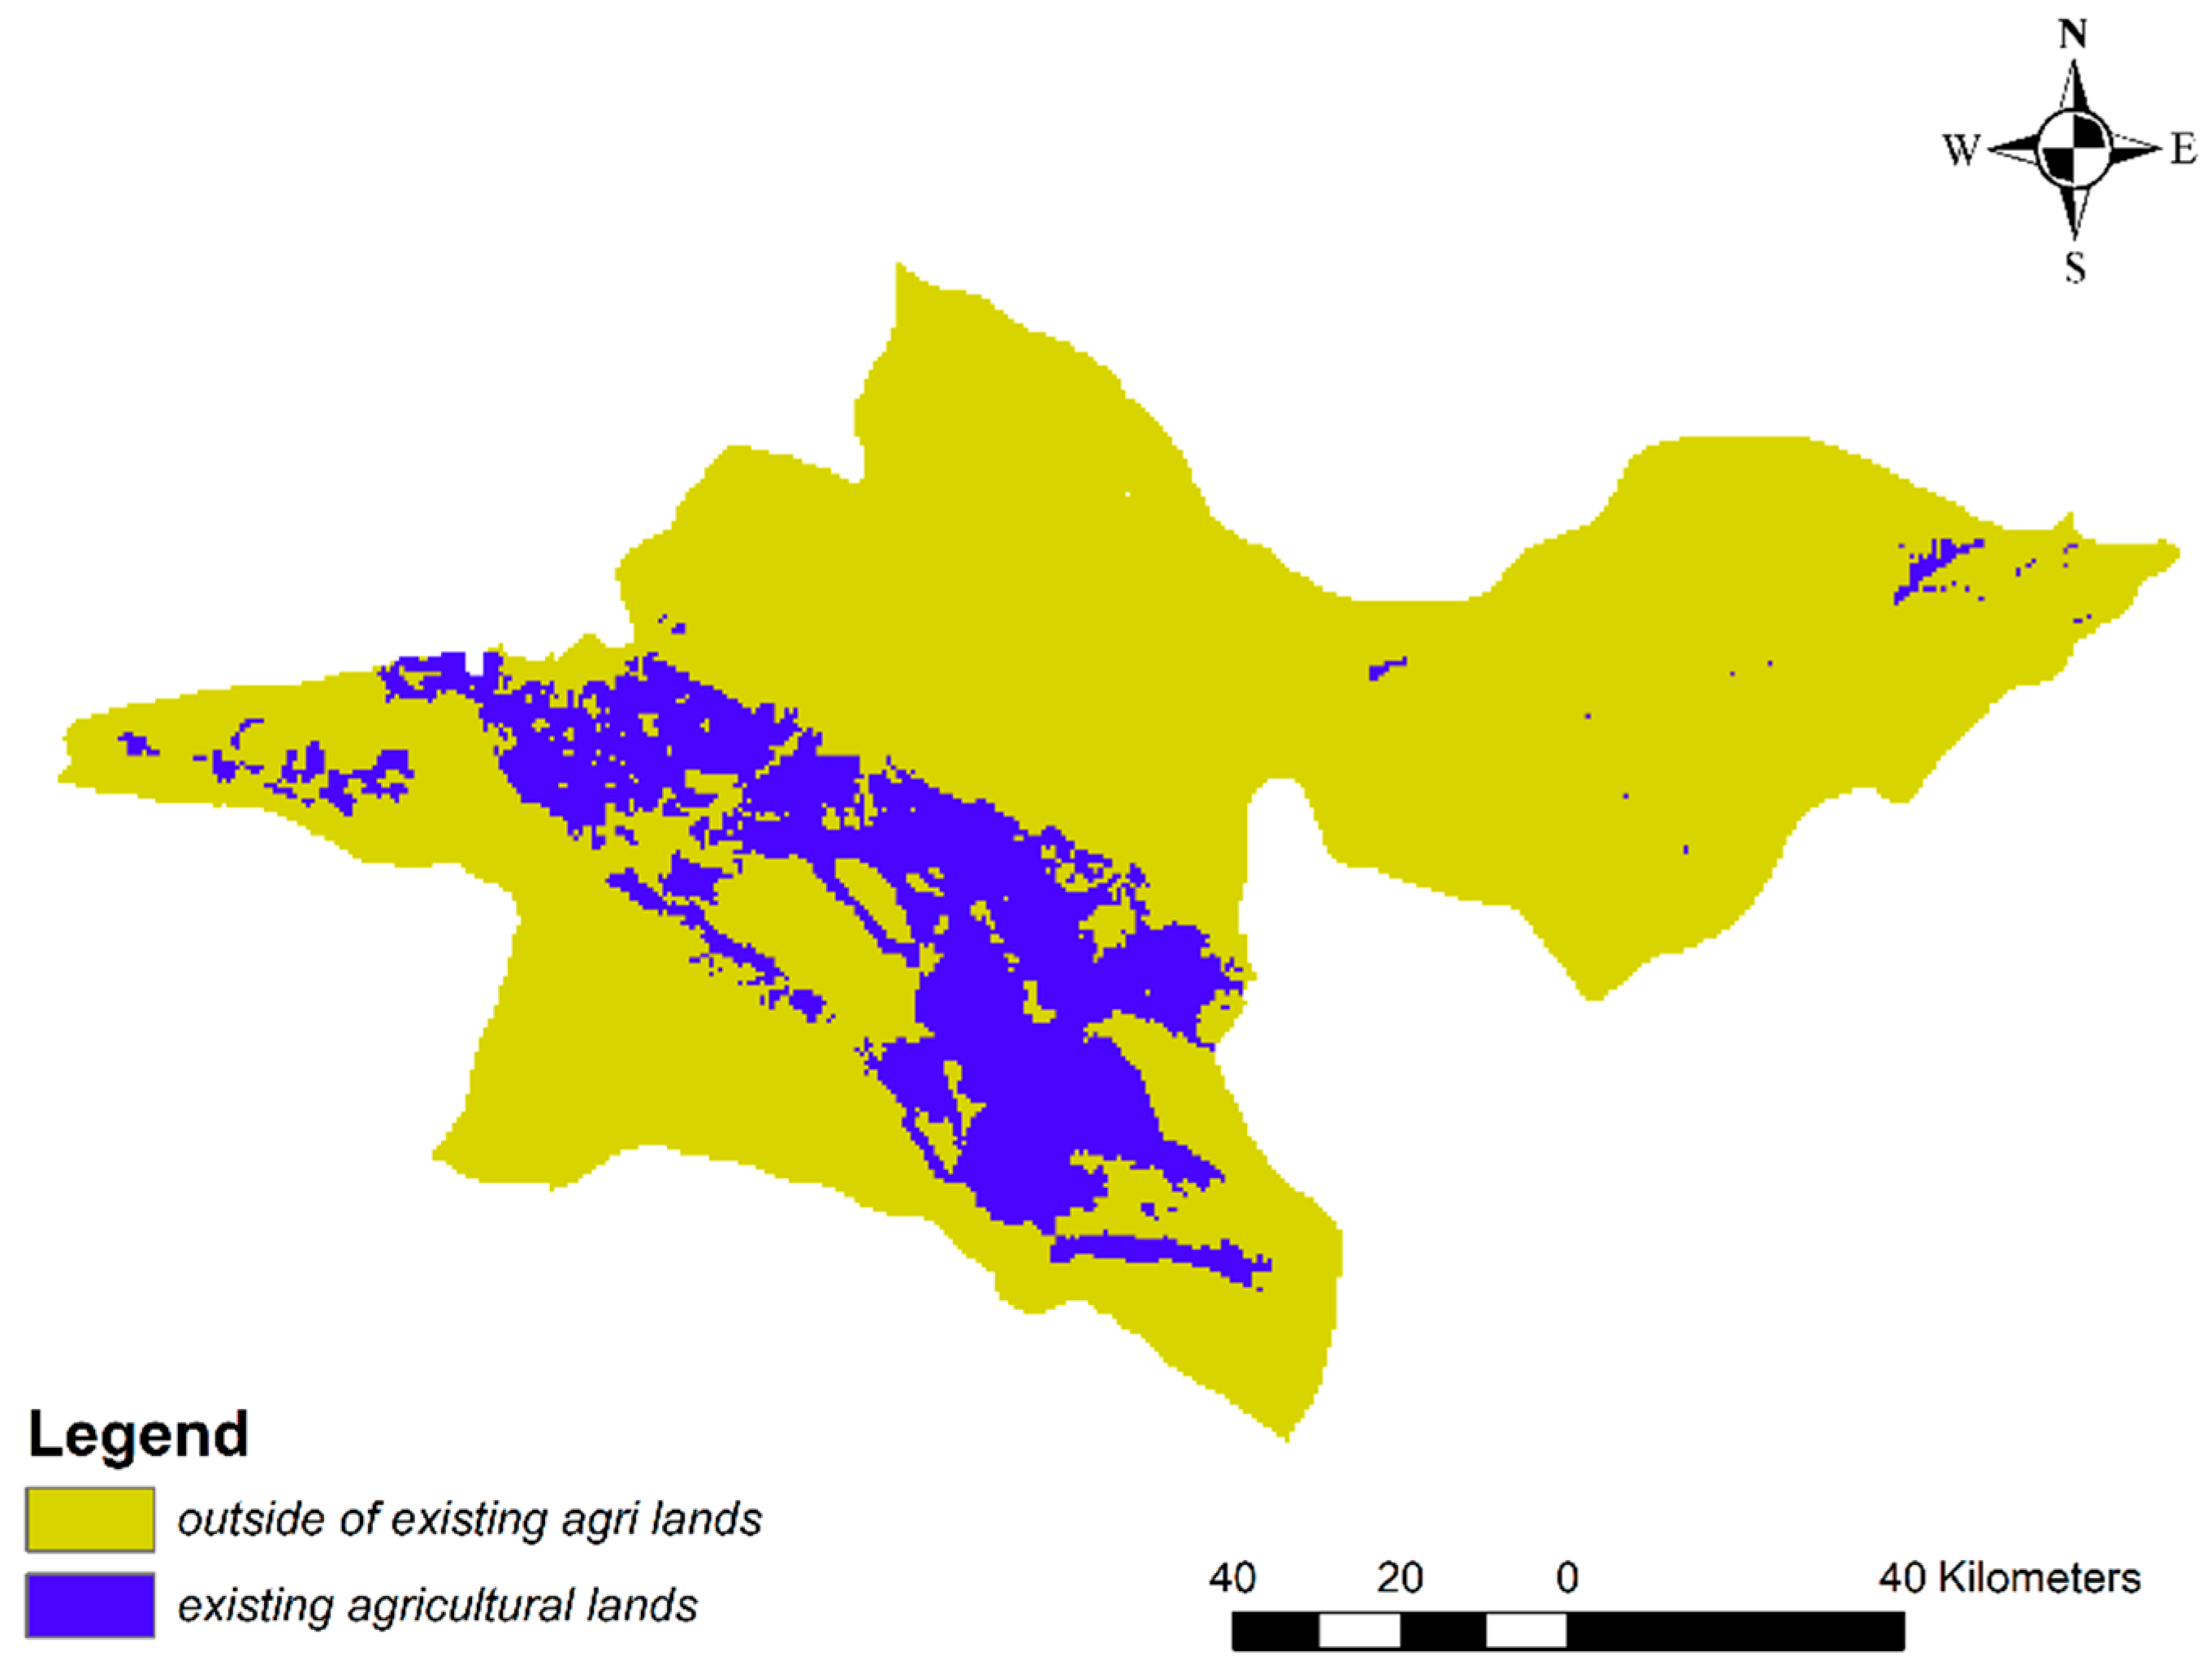
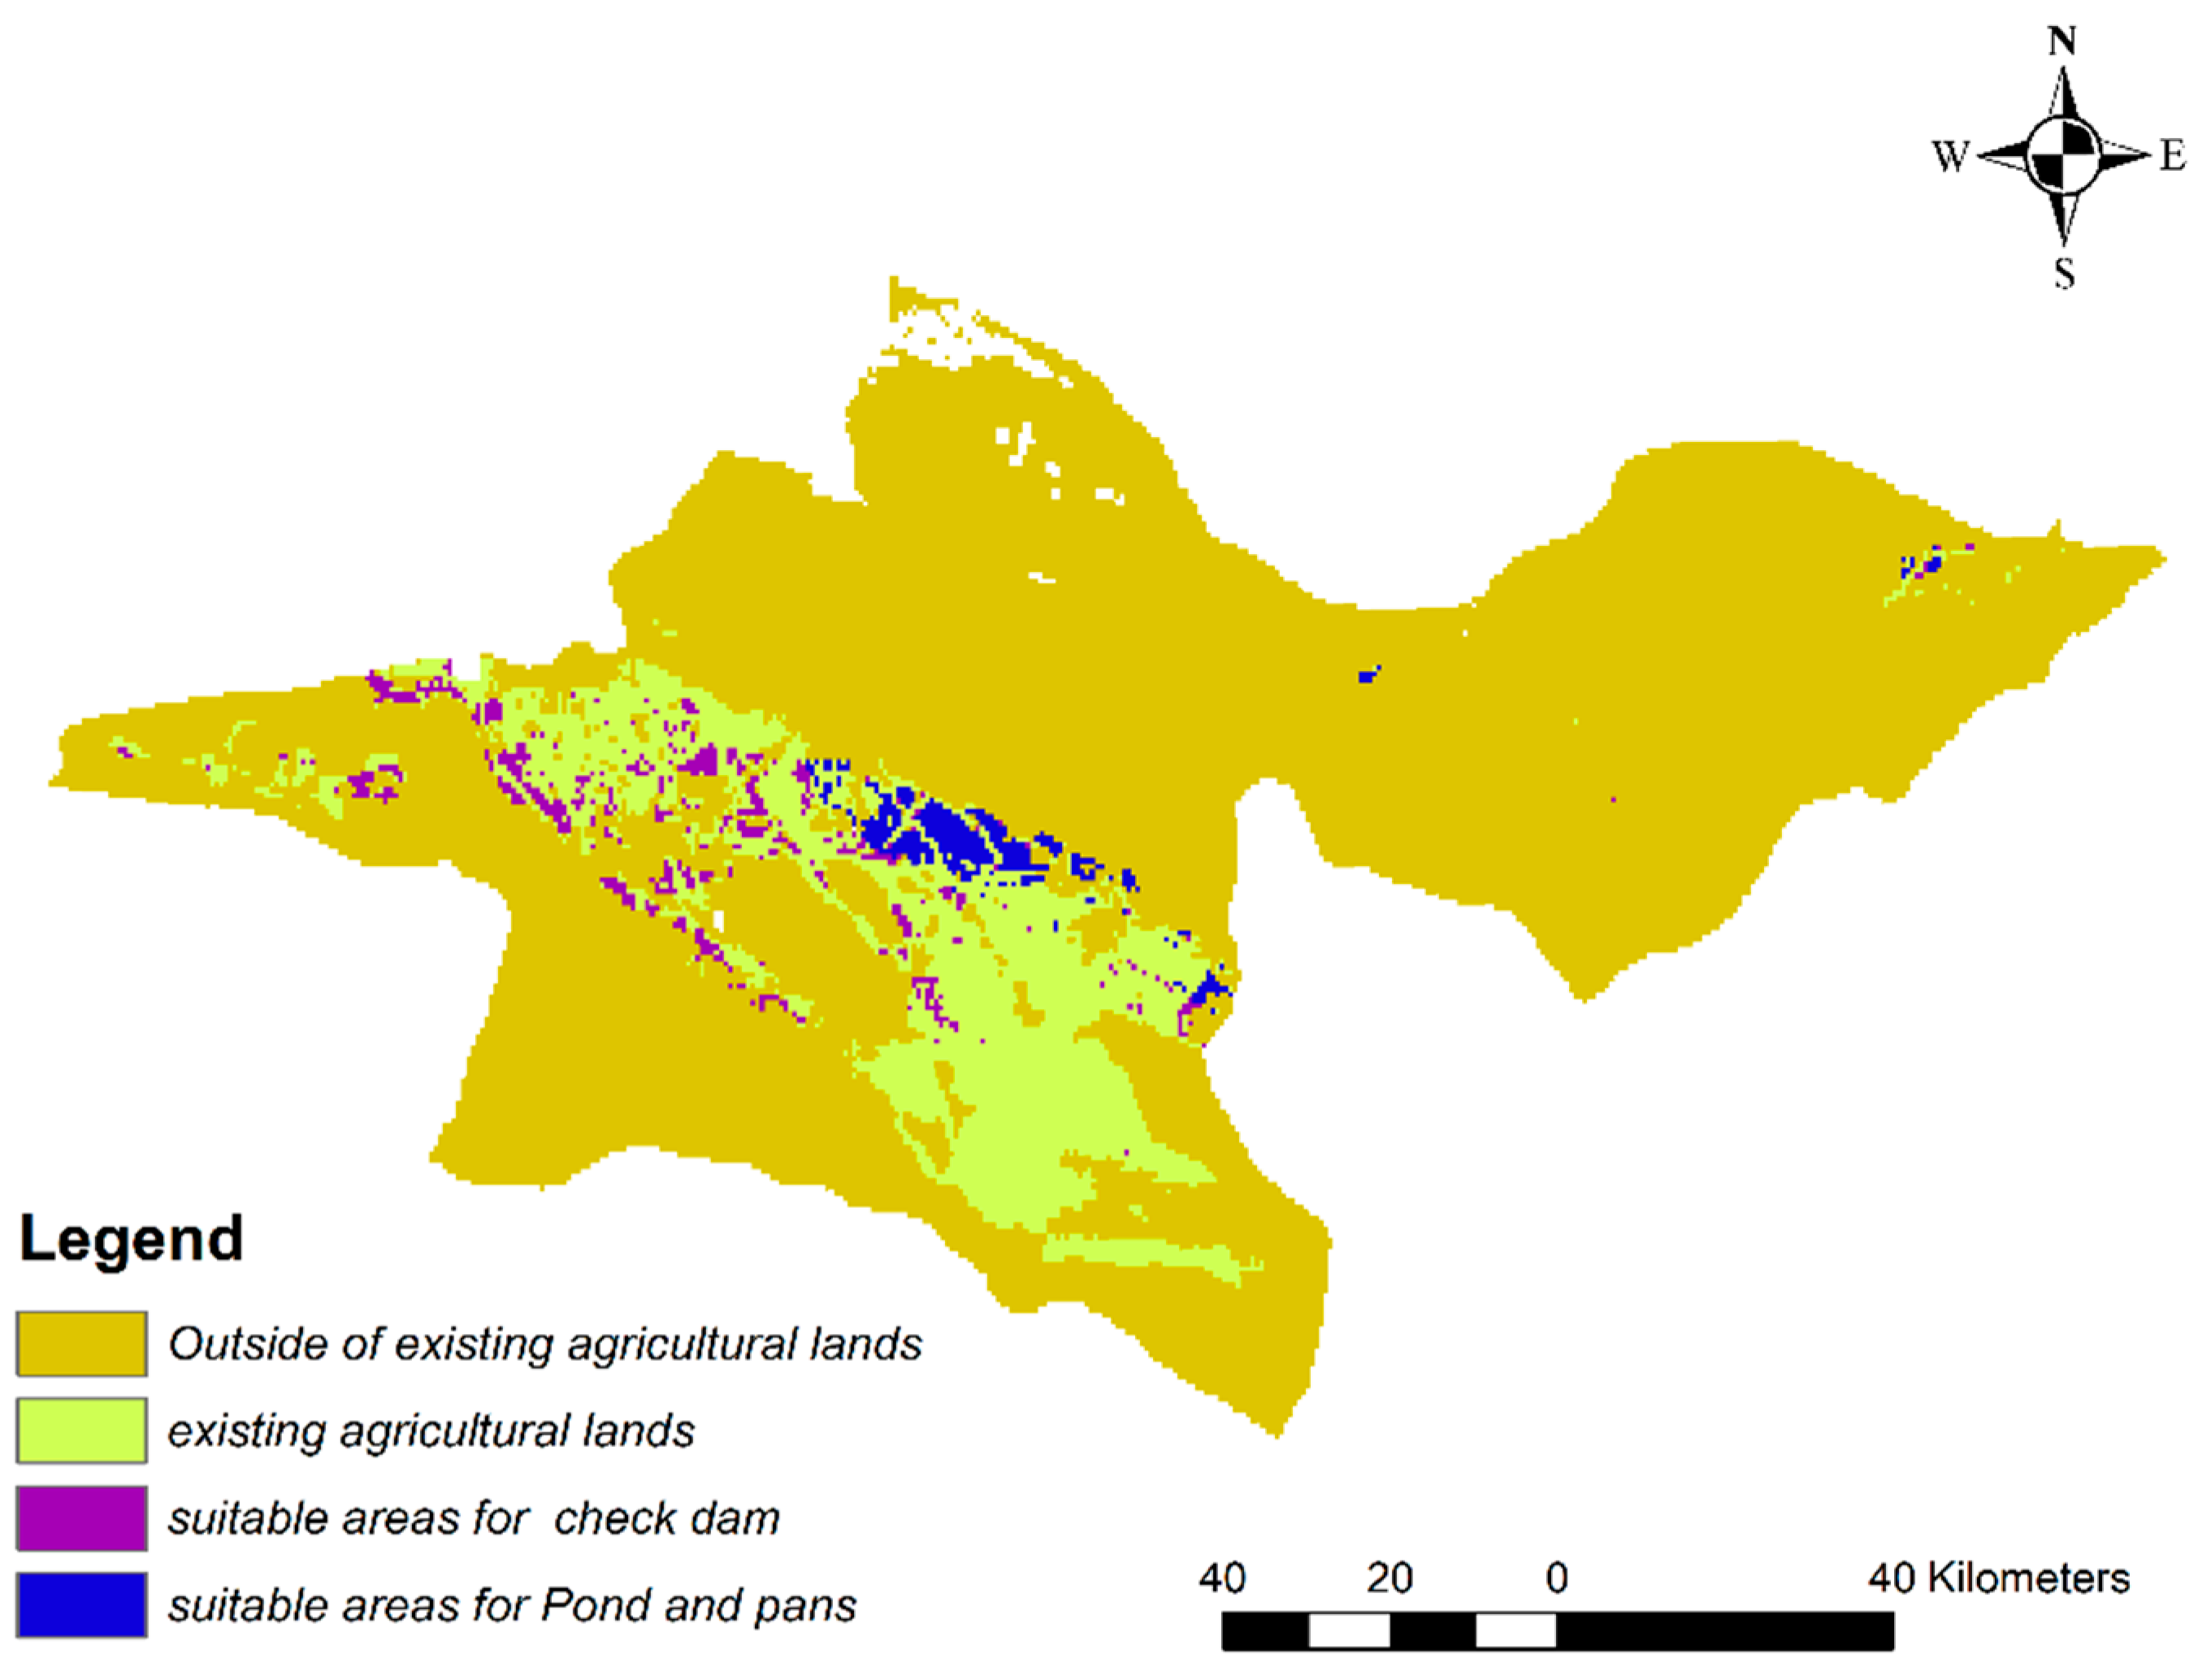
3.7.1. Phase One: Install RWH Systems in the Existing Farming Areas

The existing agricultural lands that are included in suitable areas for RWH should be encouraged to adopt RWH systems in the first phase, where local farmers will immediately benefit from minimum investment or subsidies from the government. As soil erosion may be reduced by implementing RWH systems, productivity can be potentially increased, thereby allowing farmers to pay back the installation investment. In case of overlap taking place among three types of RWH systems, the priority of implementation will be: first, pan and pond, second check dam, and last percolation tank. Figure 14 shows the suitability map for the three types of RWH agriculture in the first phase.

3.7.2. Phase Two: Increase the Local Supply by Creating New Farmland

As the population rapidly grows in developing countries, especially in Iran, domestic food demand thereby increases and requires a new agriculture plan to meet the local demand. In the case study, the suitable areas for RWH that are not within the existing farming areas but close to existing villages should be developed into farmland as the second phase plan. Based on the local knowledge gained from the first phase implementation, more experienced and trained engineers or farmers will be available to support the development of the second phase plan. Figure 15 demonstrates the location of areas for the Phase Two Plan.

3.7.3. Phase Three: Develop Farmland for Commercial Exporting

Agricultural exports are very important for Iran, as they lead the country’s economy to reduce its dependence on oil and move toward more sustainable development. Among these economic crops, pistachios are one of the most important non-oil export goods in Iran. The production and associated profit can be enhanced by increasing the cultivation areas, improving the water supply and introducing more mechanized methods [70]. Due to excessive climate changes, drought and the need to diversify agricultural production, the government has initiated several large schemes to promote the production of crops with less water demand. Herein, using sustainable and decentralized alternatives such as RWH systems to increase the production of crop exports is crucial because it creates less stress on the existing water systems. The suitable areas for RWH that are outside existing farmlands but near main highways or ports can be assigned to be the areas for commercial crops for international trade. The development of the third phase requires more capital for investment but has more potential to improve the local economy. Figure 16 shows the areas for commercial export crops. The benefit of such a strategy is that the development of crops exports will not hamper the domestic food supply nor increase water stress in the country.
Consequently, areas for the phase-wise strategic plan in the RWH agricultural scheme to reduce the overexploitation of groundwater have been identified based on the proposed DSS. However, more on-site investigations and agricultural economic tools should be involved in further implementation. For further refinement of the DSS, quantitative assessment of the effect of the reduction in groundwater exploitation by adopting RWH systems requires further investigation. The associated economic evaluation of RWH agriculture for each type of crop should also be explored. The advantage of this proposed DSS is that it provides a more accurate, reliable and visualized understanding for decision makers than that of previous studies, and allows future expansion by adding hydraulic and economic modules.

4. Conclusions

The increasing overexploitation of groundwater resulting from unsustainable agricultural practices is leading to severe negative impacts on environmental, social and economic aspects and challenging human development in arid and semiarid areas, especially in Iran. The transition of the current unsustainable agricultural practice to a new paradigm based on RWH agriculture is urgent. In this context, identifying the optimal sites for RWH agriculture on a large scale is the primary task for such a new paradigm shift. For this, a new DSS that incorporates the BWM and Fuzzy logic into GIS has been proposed in this study. Moreover, a probabilistic analysis of the rainfall pattern using Monte Carlo simulation was also conducted, which not only enhances the understanding of rainfall scenarios but also allows users to adjust the input according to the level of water demand. This study has demonstrated the utility of the proposed DSS in the RWH agricultural scheme in Tehran Province, Iran. Herein, three types of RWH systems, i.e., pans and ponds, percolation tanks, and check dams were tested to obtain suitability maps. By comparing with the existing agricultural areas, the phase-wise strategy for transitioning to RWH-based agriculture has been explored. Compared to the traditional methods that mostly adopt AHP and WOP in GIS for site selection, the sensitivity analysis has identified that the proposed new DSS is more stable and reliable. Such a DSS also provides a straightforward and simple approach to understanding the RWH agricultural scheme and, therefore, offers the potential for public participation. For further research, the hydraulic model for these types of RWH systems and the associated economic analysis can be further investigated and incorporated. The web-based interface of this DSS can be further refined to be more user friendly before opening it to the public. Hence, this DSS has been verified to enhance the information value and help for a large-scale RWH agricultural scheme to ease the worsening overexploitation of groundwater and associated socioeconomic dilemmas in arid and semiarid areas.

Author Contributions

K.A.: Conceptualization, Project administration, Formal analysis, Investigation, Methodology, Software, Writing original draft; Y.-R.C.: Conceptualization, Project supervision, Methodology, Visualization, Validation, Writing, Review. All authors have read and agreed to the published version of the manuscript.

Funding

This research is partially founded by Tzu-Chi University’s Research Supporting Project.

Conflicts of Interest

The authors declare no conflict of interest.

References

  1. Salameh, E. Over-exploitation of groundwater resources and their environmental and socio-economic implications: The case of Jordan. Water Int. 2008, 33, 55–68. [Google Scholar] [CrossRef]
  2. Chen, J.; Wu, H.; Qian, H.; Li, X. Challenges and prospects of sustainable groundwater management in an agricultural plain along the Silk Road Economic Belt, north-west China. Int. J. Water Resour. Dev. 2018, 34, 354–368. [Google Scholar] [CrossRef]
  3. Alfarrah, N.; Walraevens, K. Groundwater overexploitation and seawater intrusion in coastal areas of arid and semi-arid regions. Water 2018, 10, 143. [Google Scholar] [CrossRef] [Green Version]
  4. Binyam, A.Y.; Desale, K.A. Rainwater harvesting: An option for dry land agriculture in arid and semi-arid Ethiopia. Int. J. Water Resour. Environ. Eng. 2015, 7, 17–28. [Google Scholar] [CrossRef] [Green Version]
  5. Kadam, A.K.; Kale, S.S.; Pande, N.N.; Pawar, N.J.; Sankhua, R.N. Identifying Potential Rainwater Harvesting Sites of a Semi-arid, Basaltic Region of Western India, Using SCS-CN Method. Water Resour. Manag. 2012, 26, 2537–2554. [Google Scholar] [CrossRef]
  6. Mesgaran, M.B.; Madani, K.; Hashemi, H.; Azadi, P. Iran’s Land Suitability for Agriculture. Sci. Rep. 2017, 7, 7670. [Google Scholar] [CrossRef] [PubMed]
  7. Mesgaran, M.B.; Azadi, P. A National Adaptation Plan for Water Scarcity in Iran; Stanford University: Stanford, CA, USA, 2018. [Google Scholar]
  8. Gohari, A.; Eslamian, S.; Mirchi, A.; Abedi-Koupaei, J.; Massah Bavani, A.; Madani, K. Water transfer as a solution to water shortage: A fix that can Backfire. J. Hydrol. 2013, 491, 23–39. [Google Scholar] [CrossRef]
  9. Nazari, B.; Liaghat, A.; Akbari, M.R.; Keshavarz, M. Irrigation water management in Iran: Implications for water use efficiency improvement. Agric. Water Manag. 2018, 208, 7–18. [Google Scholar] [CrossRef]
  10. Madani, K.; AghaKouchak, A.; Mirchi, A. Iran’s Socio-economic Drought: Challenges of a Water-Bankrupt Nation. Iran. Stud. 2016, 49, 997–1016. [Google Scholar] [CrossRef]
  11. Madani, K. The value of extreme events: What doesn’t exterminate your water system makes it more resilient. J. Hydrol. 2019, 575, 269–272. [Google Scholar] [CrossRef]
  12. Assefa, S.; Biazin, B.; Muluneh, A.; Yimer, F.; Haileslassie, A. Rainwater harvesting for supplemental irrigation of onions in the southern dry lands of Ethiopia. Agric. Water Manag. 2016, 178, 325–334. [Google Scholar] [CrossRef]
  13. Guarnieri, L.; Salman, M. Emerging practices from agricultural water management in Africa and the Near East. In Proceedings of the Thematic Workshop—CIHEAM Bari, Bari, Italy, 28–31 August 2017. [Google Scholar]
  14. Velasco-Muñoz, J.F.; Aznar-Sánchez, J.A.; Batlles-delaFuente, A.; Fidelibus, M.D. Rainwater Harvesting for Agricultural Irrigation: An Analysis of Global Research. Water 2019, 11, 1320. [Google Scholar] [CrossRef] [Green Version]
  15. Biazin, B.; Sterk, G.; Temesgen, M.; Abdulkedir, A.; Stroosnijder, L. Rainwater harvesting and management in rainfed agricultural systems in sub-Saharan Africa—A review. Phys. Chem. Earth Parts A/B/C 2012, 47–48, 139–151. [Google Scholar] [CrossRef]
  16. Tabatabaee, J.; Han, M.Y. Rainwater harvesting potentials for drought mitigation in Iran. Water Sci. Technol. 2010, 62, 816–821. [Google Scholar] [CrossRef] [PubMed]
  17. Fooladmand, H.R.; Sepaskhah, A.R. Economic analysis for the production of four grape cultivars using microcatchment water harvesting systems in Iran. J. Arid Environ. 2004, 58, 525–533. [Google Scholar] [CrossRef]
  18. Deng, X.P.; Shan, L.; Zhang, H.; Turner, N.C. Improving agricultural water use efficiency in arid and semiarid areas of China. Agric. Water Manag. 2006, 80, 23–40. [Google Scholar] [CrossRef]
  19. Mwenge Kahinda, J.; Rockström, J.; Taigbenu, A.; Dimes, J. Rainwater harvesting to enhance water productivity of rainfed agriculture in the semi-arid Zimbabwe. Phys. Chem. Earth Parts A/B/C 2007, 32, 1068–1073. [Google Scholar] [CrossRef]
  20. Li, X.-Y.; Gong, J.-D.; Wei, X. In-situ rainwater harvesting and gravel mulch combination for corn production in the dry semi-arid region of China. J. Arid Environ. 2000, 46, 371–382. [Google Scholar] [CrossRef]
  21. Schiettecatte, W.; Ouessar, M.; Gabriels, D.; Tanghe, S.; Heirman, S.; Abdelli, F. Impact of water harvesting techniques on soil and water conservation: A case study on a micro catchment in southeastern Tunisia. J. Arid Environ. 2005, 61, 297–313. [Google Scholar] [CrossRef]
  22. Christian Amos, C.; Rahman, A.; Mwangi Gathenya, J. Economic Analysis and Feasibility of Rainwater Harvesting Systems in Urban and Peri-Urban Environments: A Review of the Global Situation with a Special Focus on Australia and Kenya. Water 2016, 8, 149. [Google Scholar] [CrossRef]
  23. Nachshon, U.; Netzer, L.; Livshitz, Y. Land cover properties and rain water harvesting in urban environments. Sustain. Cities Soc. 2016, 27, 398–406. [Google Scholar] [CrossRef]
  24. Campisano, A.; Butler, D.; Ward, S.; Burns, M.J.; Friedler, E.; DeBusk, K.; Fisher-Jeffes, L.N.; Ghisi, E.; Rahman, A.; Furumai, H.; et al. Urban rainwater harvesting systems: Research, implementation and future perspectives. Water Res. 2017, 115, 195–209. [Google Scholar] [CrossRef]
  25. Gwenzi, W.; Dunjana, N.; Pisa, C.; Tauro, T.; Nyamadzawo, G. Water quality and public health risks associated with roof rainwater harvesting systems for potable supply: Review and perspectives. Sustain. Water Qual. Ecol. 2015, 6, 107–118. [Google Scholar] [CrossRef]
  26. Amos, C.C.; Rahman, A.; Karim, F.; Gathenya, J.M. A scoping review of roof harvested rainwater usage in urban agriculture: Australia and Kenya in focus. J. Clean. Prod. 2018, 202, 174–190. [Google Scholar] [CrossRef]
  27. Helmreich, B.; Horn, H. Opportunities in rainwater harvesting. Desalination 2009, 248, 118–124. [Google Scholar] [CrossRef]
  28. Adham, A.; Wesseling, J.G.; Riksen, M.; Ouessar, M.; Ritsema, C.J. A water harvesting model for optimizing rainwater harvesting in the wadi Oum Zessar watershed, Tunisia. Agric. Water Manag. 2016, 176, 191–202. [Google Scholar] [CrossRef]
  29. Mahmoud, S.H.; Alazba, A.A. The potential of in situ rainwater harvesting in arid regions: Developing a methodology to identify suitable areas using GIS-based decision support system. Arab. J. Geosci. 2015, 8, 5167–5179. [Google Scholar] [CrossRef]
  30. Adham, A.; Riksen, M.; Ouessar, M.; Ritsema, C. A Methodology to Assess and Evaluate Rainwater Harvesting Techniques in (Semi-) Arid Regions. Water 2016, 8, 198. [Google Scholar] [CrossRef]
  31. Ammar, A.; Riksen, M.; Ouessar, M.; Ritsema, C. Identification of suitable sites for rainwater harvesting structures in arid and semi-arid regions: A review. Int. Soil Water Conserv. Res. 2016, 4, 108–120. [Google Scholar] [CrossRef] [Green Version]
  32. Mahmoud, S.H.; Tang, X. Monitoring prospective sites for rainwater harvesting and stormwater management in the United Kingdom using a GIS-based decision support system. Environ. Earth Sci. 2015, 73, 8621–8638. [Google Scholar] [CrossRef]
  33. Krois, J.; Schulte, A. GIS-based multi-criteria evaluation to identify potential sites for soil and water conservation techniques in the Ronquillo watershed, northern Peru. Appl. Geogr. 2014, 51, 131–142. [Google Scholar] [CrossRef]
  34. Dewana, A.A. Suitable Site Selection for Rainwater Harvesting and Storage Case Study Using Dohuk Governorate. Water 2019, 11, 864. [Google Scholar]
  35. Mahmoud, S.H.; Alazba, A.A.; Adamowski, J.; El-Gindy, A.M. Rainwater harvesting for the management of agricultural droughts in arid and semi-arid regions. Paddy Water Environ. 2015, 14, 231–246. [Google Scholar] [CrossRef]
  36. Wu, R.-S.; Molina, G.L.L.; Hussain, F. Optimal Sites Identification for Rainwater Harvesting in Northeastern Guatemala by Analytical Hierarchy Process. Water Resour. Manag. 2018, 32, 4139–4153. [Google Scholar] [CrossRef] [Green Version]
  37. Shadmehri Toosi, A.; Ghasemi Tousi, E.; Ghassemi, S.A.; Cheshomi, A.; Alaghmand, S. A multi-criteria decision analysis approach towards efficient rainwater harvesting. J. Hydrol. 2020, 582, 124501. [Google Scholar] [CrossRef]
  38. Moslem, S.; Gul, M.; Farooq, D.; Celik, E.; Ghorbanzadeh, O.; Blaschke, T. An Integrated Approach of Best-Worst Method (BWM) and Triangular Fuzzy Sets for Evaluating Driver Behavior Factors Related to Road Safety. Mathematics 2020, 8, 414. [Google Scholar] [CrossRef] [Green Version]
  39. Rezaei, J. Best-worst multi-criteria decision-making method. Omega 2015, 53, 49–57. [Google Scholar] [CrossRef]
  40. Ren, J.; Liang, H.; Chan, F.T.S. Urban sewage sludge, sustainability, and transition for Eco-City: Multi-criteria sustainability assessment of technologies based on best-worst method. Technol. Forecast. Soc. Change 2017, 116, 29–39. [Google Scholar] [CrossRef]
  41. Rezaei, J.; Wang, J.; Tavasszy, L. Linking supplier development to supplier segmentation using Best Worst Method. Expert Syst. Appl. 2015, 42, 9152–9164. [Google Scholar] [CrossRef]
  42. Salimi, N.; Rezaei, J. Measuring efficiency of university-industry Ph.D. projects using best worst method. Scientometrics 2016, 109, 1911–1938. [Google Scholar] [CrossRef] [Green Version]
  43. Guo, S.; Zhao, H. Fuzzy best-worst multi-criteria decision-making method and its applications. Knowl. Based Syst. 2017, 121, 23–31. [Google Scholar] [CrossRef]
  44. NCCI, National Cartographic Center of Iran. 2018. Available online: https://www.ncc.org.ir (accessed on 4 February 2020). (In Persian).
  45. SCI, Statistical Center of Iran. 2018. Available online: https://www.amar.org.ir/ (accessed on 20 November 2019). (In Persian).
  46. FRWMO, Forest, Ranges and Watershed Management Organization. 2020. Available online: https://www.tehran.frw.ir (accessed on 4 February 2020). (In Persian).
  47. DOE, Department of Environment. 2020. Available online: https://www.tehran.doe.ir (accessed on 8 March 2020). (In Persian).
  48. TMPO, Tehran Management and Planning Organization. 2018. Available online: https://www.thmorg.ir (accessed on 6 March 2020). (In Persian).
  49. RWCT, Regional Water Company of Tehran. 2015. Available online: https://www.thrw.ir (accessed on 6 March 2020). (In Persian).
  50. Al-Adamat, R.; Diabat, A.; Shatnawi, G. Combining GIS with multicriteria decision making for siting water harvesting ponds in Northern Jordan. J. Arid Environ. 2010, 74, 1471–1477. [Google Scholar] [CrossRef]
  51. Kahinda, J.M.; Lillie, E.S.B.; Taigbenu, A.E.; Taute, M.; Boroto, R.J. Developing suitability maps for rainwater harvesting in South Africa. Phys. Chem. Earth Parts A/B/C 2008, 33, 788–799. [Google Scholar] [CrossRef]
  52. Rezaei, J. Best-worst multi-criteria decision-making method: Some properties and a linear model. Omega 2016, 64, 126–130. [Google Scholar] [CrossRef]
  53. Saaty, T.L. How to make a decision: The analytic hierarchy process. Eur. J. Oper. Res. 1990, 48, 9–26. [Google Scholar] [CrossRef]
  54. Chiu, Y.-R.; Aghaloo, K.; Mohammadi, B. Incorporating Rainwater Harvesting Systems in Iran’s Potable Water-Saving Scheme by Using a GIS-Simulation Based Decision Support System. Water 2020, 12, 752. [Google Scholar] [CrossRef] [Green Version]
  55. Zhang, S.; Jing, X.; Yue, T.; Wang, J. Performance assessment of rainwater harvesting systems: Influence of operating algorithm, length and temporal scale of rainfall time series. J. Clean. Prod. 2020, 253, 120044. [Google Scholar] [CrossRef]
  56. IRIMO, Iran Meteorological Organization. 2016. Available online: https://www.irimo.ir (accessed on 5 December 2019). (In Persian).
  57. Mosate, T. Application of GIS To Determine Suitable Sites for Surface Rainwater Harvesting in a Semi-Arid Catchment a Case Study of Notwane Catchment; University of Dar Es Salaam: Dar es Salaam, Tanzania, 2016; p. 99. [Google Scholar]
  58. Adham, A.; Sayl, K.N.; Abed, R.; Abdeladhim, M.A.; Wesseling, J.G.; Riksen, M.; Fleskens, L.; Karim, U.; Ritsema, C.J. A GIS-based approach for identifying potential sites for harvesting rainwater in the Western Desert of Iraq. Int. Soil Water Conserv. Res. 2018, 6, 297–304. [Google Scholar] [CrossRef]
  59. Nguyen, D.C.; Han, M.Y. Proposal of simple and reasonable method for design of rainwater harvesting system from limited rainfall data. Resour. Conserv. Recycl. 2017, 126, 219–227. [Google Scholar] [CrossRef]
  60. Soil Survey Staff. Soil Taxonomy: A Basic System of Soil Classification for Making and Interpreting Soil Surveys, 2nd ed.; Natural Resources Conservation Service: Washington, DC, USA, 1999; p. 436.
  61. Ammar, A.A. Evaluating Rainwater Harvesting Systems in Arid and Semi-ARID Regions; Wageningen University & Research: Wageningen, The Netherlands, 2017.
  62. Rahmati, O.; Kalantari, Z.; Samadi, M.; Uuemaa, E. GIS-Based Site Selection for Check Dams in Watersheds: Considering Geomorphometric and Topo-Hydrological Factors. Sustainability 2019, 11, 5639. [Google Scholar] [CrossRef] [Green Version]
  63. Ahmed, N.; Xu, X.; Lucas-Borja, M.E.; Dang, W.; Liu, B. Science of the Total Environment The use of check dams in watershed management projects: Examples from around the world. Sci. Total Environ. 2019, 676, 683–691. [Google Scholar]
  64. Jha, M.K.; Chowdary, V.M.; Kulkarni, Y.; Mal, B.C. Resources, Conservation and Recycling Rainwater harvesting planning using geospatial techniques and multicriteria decision analysis. Resour. Conserv. Recycl. 2014, 83, 96–111. [Google Scholar] [CrossRef]
  65. Pellicone, G.; Caloiero, T.; Modica, G.; Guagliardi, I. Application of several spatial interpolation techniques to monthly rainfall data in the Calabria region (southern Italy). Int. J. Climatol. 2018, 38, 3651–3666. [Google Scholar] [CrossRef]
  66. Gupta, A.; Kamble, T.; Machiwal, D. Comparison of ordinary and Bayesian kriging techniques in depicting rainfall variability in arid and semi-arid regions of north-west India. Environ. Earth Sci. 2017, 76, 512. [Google Scholar] [CrossRef]
  67. Mair, M.; Sitzenfrei, R.; Kleidorfer, M.; Möderl, M.; Rauch, W. GIS-based applications of sensitivity analysis for sewer models. Water Sci. Technol. 2012, 65, 1215–1222. [Google Scholar] [CrossRef] [PubMed] [Green Version]
  68. Jamal, T.; Urmee, T.; Shafiullah, G.M. Planning of off-grid power supply systems in remote areas using multi-criteria decision analysis. Energy 2020, 201, 117580. [Google Scholar] [CrossRef]
  69. Al-Mashreki, M.H.; Mat Akhir, J.B.; Abd Rahim, S.; Desa, K.M.; Lihan, T.; Haider, A.R. GIS-Based Sensitivity Analysis of Multi-Criteria Weights for Land Suitability Evaluation of Sorghum Crop in the Ibb Governorate, Republic of Yemen. J. Basic. Appl. Sci. Res. 2011, 1, 1102–1111. [Google Scholar]
  70. Barghandan, A.; Barghandan, K.; Golestaneh, S.; Mirlashari, H. Investigating the Effect of Real Effective Exchange Rate on the Iranian Pistachio Export. J. Nuts 2011, 2, 25–32. [Google Scholar]
Figure 1. The location and the average rainfall distribution of Tehran Province.
Water 12 01913 g001
Figure 2. The conceptual framework.
Water 12 01913 g002
Figure 3. Flowchart of geographic information system (GIS) integrated with multiple criteria decision making (MCDM).
Water 12 01913 g003
Figure 4. A historical rainfall pattern in the study area.
Water 12 01913 g004
Figure 5. The amount of rainfall and exceedance probability.
Water 12 01913 g005
Figure 6. Classified input layers and feature classes: (a) analyzed rainfall pattern, (b) slope map, (c) land use, (d) land cover, (e) soil texture, and (f) drainage density.
Water 12 01913 g006aWater 12 01913 g006bWater 12 01913 g006c
Figure 7. Socioeconomic factors: (a) distance to road, (b) distance to rivers, (c) distance to faults, and (d) distance to urban centers.
Water 12 01913 g007aWater 12 01913 g007b
Figure 8. The criteria weighted by the best-worst method.
Water 12 01913 g008
Figure 9. RWH system suitability map generated based on BWM and Fuzzy overlay.
Water 12 01913 g009
Figure 10. The constraint map shows the unsuitable areas for RWH implementation.
Water 12 01913 g010
Figure 11. Suitability map of three types of RWH structure: (a) ponds and pans, (b) check dams, (c) percolation tank.
Water 12 01913 g011
Figure 12. Analysis on the proposed modeling and common modeling; (A: BWM then Fuzzy, and B: AHP then WOP).
Water 12 01913 g012
Figure 13. Existing agricultural lands.
Water 12 01913 g013
Figure 14. Suitable areas for RWH in the existing agricultural lands.
Water 12 01913 g014
Figure 15. Suitable areas for RWH that are not within the existing agricultural lands.
Water 12 01913 g015
Figure 16. Suitable areas for RWH for commercial crops.
Water 12 01913 g016
Table 1. Fundamental comparison scale.
Intensity of Importance Definition
1Equal importance
3Moderate importance of one over another
5Essential or strong importance
7Very strong importance
9Extreme importance
2, 4, 6, 8Intermediate values between the two adjacent judgments
Table 2. Database used in this study.
No.LayerType Source
1Digital elevation model DEM (30 m)Raster (the max elevation of the study area 4325.8 m and min elevation 758.28 m)The United States Geological Survey (USGS) earth explorer 1
2StationsVector, the shapefile created in ArcGIS based on the Excel File)IRIMO
3Annual rainfall map with 70% Probability of ExceedanceRainfall data (Excel File) analyzed probabilistic and then assigned to station points coordinate and finally spatially interpolated to raster formatAs a result of Monte Carlo simulation derived by authors
4SlopeRasterWas generated based on ASTER DEM
5Land use/coverVector Geographic data center 2
6Soil textureRaster, Soil tissue map at a depth of 60 cm in Tehran province, which has been prepared using soil profile data of FAO databases. It consists of three layers (percentage of silt, clay and sand) obtained using the soil texture triangle based on the USDA classification.Engineering and computer research data center 3
7Drainage networkVector Geographic data center 2
8Basin/sub basinVector Geographic data center2
9RiverVector Geographic data center 2
10Road and railwayVectorGeographic data center 2
11FaultVectorGeographic data center 2
12City VectorGeographic data center 2
Table 3. Scaling the criteria in scores 1 to 5. Feature classes were classified based on the suitability for rainwater-harvesting (RWH) systems.
Parameter 12345
Rainfall0–100100–200200–300300–400400–600
Slope (%)>2010–205–103–50–3
Land use/coverWater body—urban—desertRock, Miscellaneous-mediumPoor range-bare land-wood land, Midrange—mix, agricultureAfforest-garden-agriculture—High quality range
Soil typeSandy loamloamSilt loamSandy clay loamClay loam, silty clay loam
Drainage density (km/km2)0–0.170.18–0.210.22–0.260.27–0.290.3–0.33
Distance to roads, rivers and cities (m)≥2000≥1500, <2000≥1000, <1500≥500, <1000≤500
Distance to faults (m)>1000, <2000≥2000, <3000≥3000, <4000≥4000, <5000>5000
Table 4. Constraint factors and the associated justification.
FactorLimitationValue
Distance to road>2501
≤2500
Distance to river>1001
≤1000
Distance to city>2501
≤2500
Distance to fault>10001
≤10000
Table 5. The common RWH techniques and criteria used to generate suitability maps.
RWH TechniqueRainfall Slope (%)Soil TypeLand Use/Cover
Pond and pans>200<5Sandy clay loam, silty loamRanges, farmlands, pastures, bare lands, woodlands, plain vegetation
Check dams<1000<15Sandy clay loamRivers, ranges, farmlands, pastures, bare lands, rock protrusions
Percolation tank<1000<10Silt loam, clay loamRanges, farmlands, pastures, bare lands, rock protrusions

