Article

Rapid Urbanization Impact on the Hydrological Processes in Zhengzhou, China

1
School of Water Conservancy Science and Engineering, Zhengzhou University, Zhengzhou 450001, China
2
Zhengzhou Hydrology and Water Resources Survey Bureau, Zhengzhou 450001, China
*
Author to whom correspondence should be addressed.
Water 2020, 12(7), 1870; https://doi.org/10.3390/w12071870
Submission received: 17 May 2020 / Revised: 20 June 2020 / Accepted: 25 June 2020 / Published: 30 June 2020
(This article belongs to the Special Issue Urban Catchment: Rainfall–Runoff Issues and Responses)

Abstract

:
Changes in the hydrological process caused by urbanization lead to frequent flooding in cities. For fast-growing urban areas, the impact of urbanization on the hydrological process needs to be systematically analyzed. This study takes Zhengzhou as an example to analyze the impact of urbanization on the hydrological process based on 1971–2012 hourly rainfall-runoff data, combining Geographic Information Systems with traditional hydrological methods. Our study indicates that the rain island effect in different districts of city became stronger with the increase of its built-up. The uneven land use resulted in the difference of runoff process. The flood peak lag was 25–30% earlier with the change of land use. The change of flood peak increased by 10–30% with the change of built-up. The runoff coefficient increases by 20–35% with the increase of built-up, and its change increased with the change of land use. Affected by the rain island effect, precipitation tends to occur in areas where built-up is dominant, which overall magnifies the impact of urbanization on the hydrological process. This provides new ideas for urban flood control. Refine flood control standards according to regional land use changes to cope with the hydrological process after urbanization.

1. Introduction

Significant changes have taken place in the urban hydrological process [1,2], such as the increase of peak and the reduction of water degeneration [3], and the increase of surface runoff [4]. The causes of urban hydrological process change mainly focus on two aspects. One is the impact of climate change. The mechanism of the impact of climate change on hydrological processes is relatively clear [5,6,7]. Many studies have shown that climate change altered regional hydrological conditions [8,9], and cities amplified the hydrological changes of natural watersheds [10,11]. Another is the impact of urbanization. Land use changes related to urbanization change rainfall-runoff generation processes in complex ways [12,13,14]. In the process of urban development, urban resources (population, impermeable surface, building density, green space, etc.) are disproportionately distributed within urban areas. Hence, the rainfall-runoff relationship become more complex and highly non-linear depending on changing rainfall time-space distribution and land-use [15,16,17,18,19]. Saifullah et al. [20] found that the impact of land use change on runoff process is increasing with urbanization, so it is of great significance to analyze the impact of land use change on runoff process in combination with the characteristics of the urbanization process, which is helpful to cope with the changes of the hydrological process after urbanization and improve the city’s flood control ability and protect urban security.
Urban expansion changes the natural underlying surface condition [21,22], which affects the catchment characteristics [23,24,25]. The expansion of built-up areas disturbs the original vegetation cover, reducing the amount of penetrations and increasing the amount of runoff [26,27,28]. Based on this, many studies took impervious surface as the main index to analyze the impact of land use change on hydrological process, and found that combinations of impervious surface and spatial rainfall patterns enhance hydrological responses [29,30,31]. However, the relationship between rainfall-runoff is highly non-linear and complex [32,33,34,35], the use of impervious surface to analyze the impact of land use change on runoff process has limitations. Further research is needed on the impact of land use changes on runoff processes caused by urbanization. Li et al. [36] assessed the relative influence and marginal effects factors affecting direct runoff using boosted regression trees, and the results showed that the runoff had the strongest correlation with rainfall, followed by impervious surface, normalized difference vegetation index, antecedent 5-day rainfall. Sertel et al. [10] applied the Soil and Water Assessment Tool (SWAT) distributed hydrological model to the Buyukcekmece Basin of Istanbul metropolis to analyze the sensitivity of hydrological elements to land use. Infiltration, evaporation, and basal flow are the most sensitive to land use, while soil water is the least. The above studies show that urbanization affects the distribution of temporal characteristics of rainfall and hydrological processes. However, there is limited understanding of rainfall and runoff sensitivity to the rapidly development of urban.
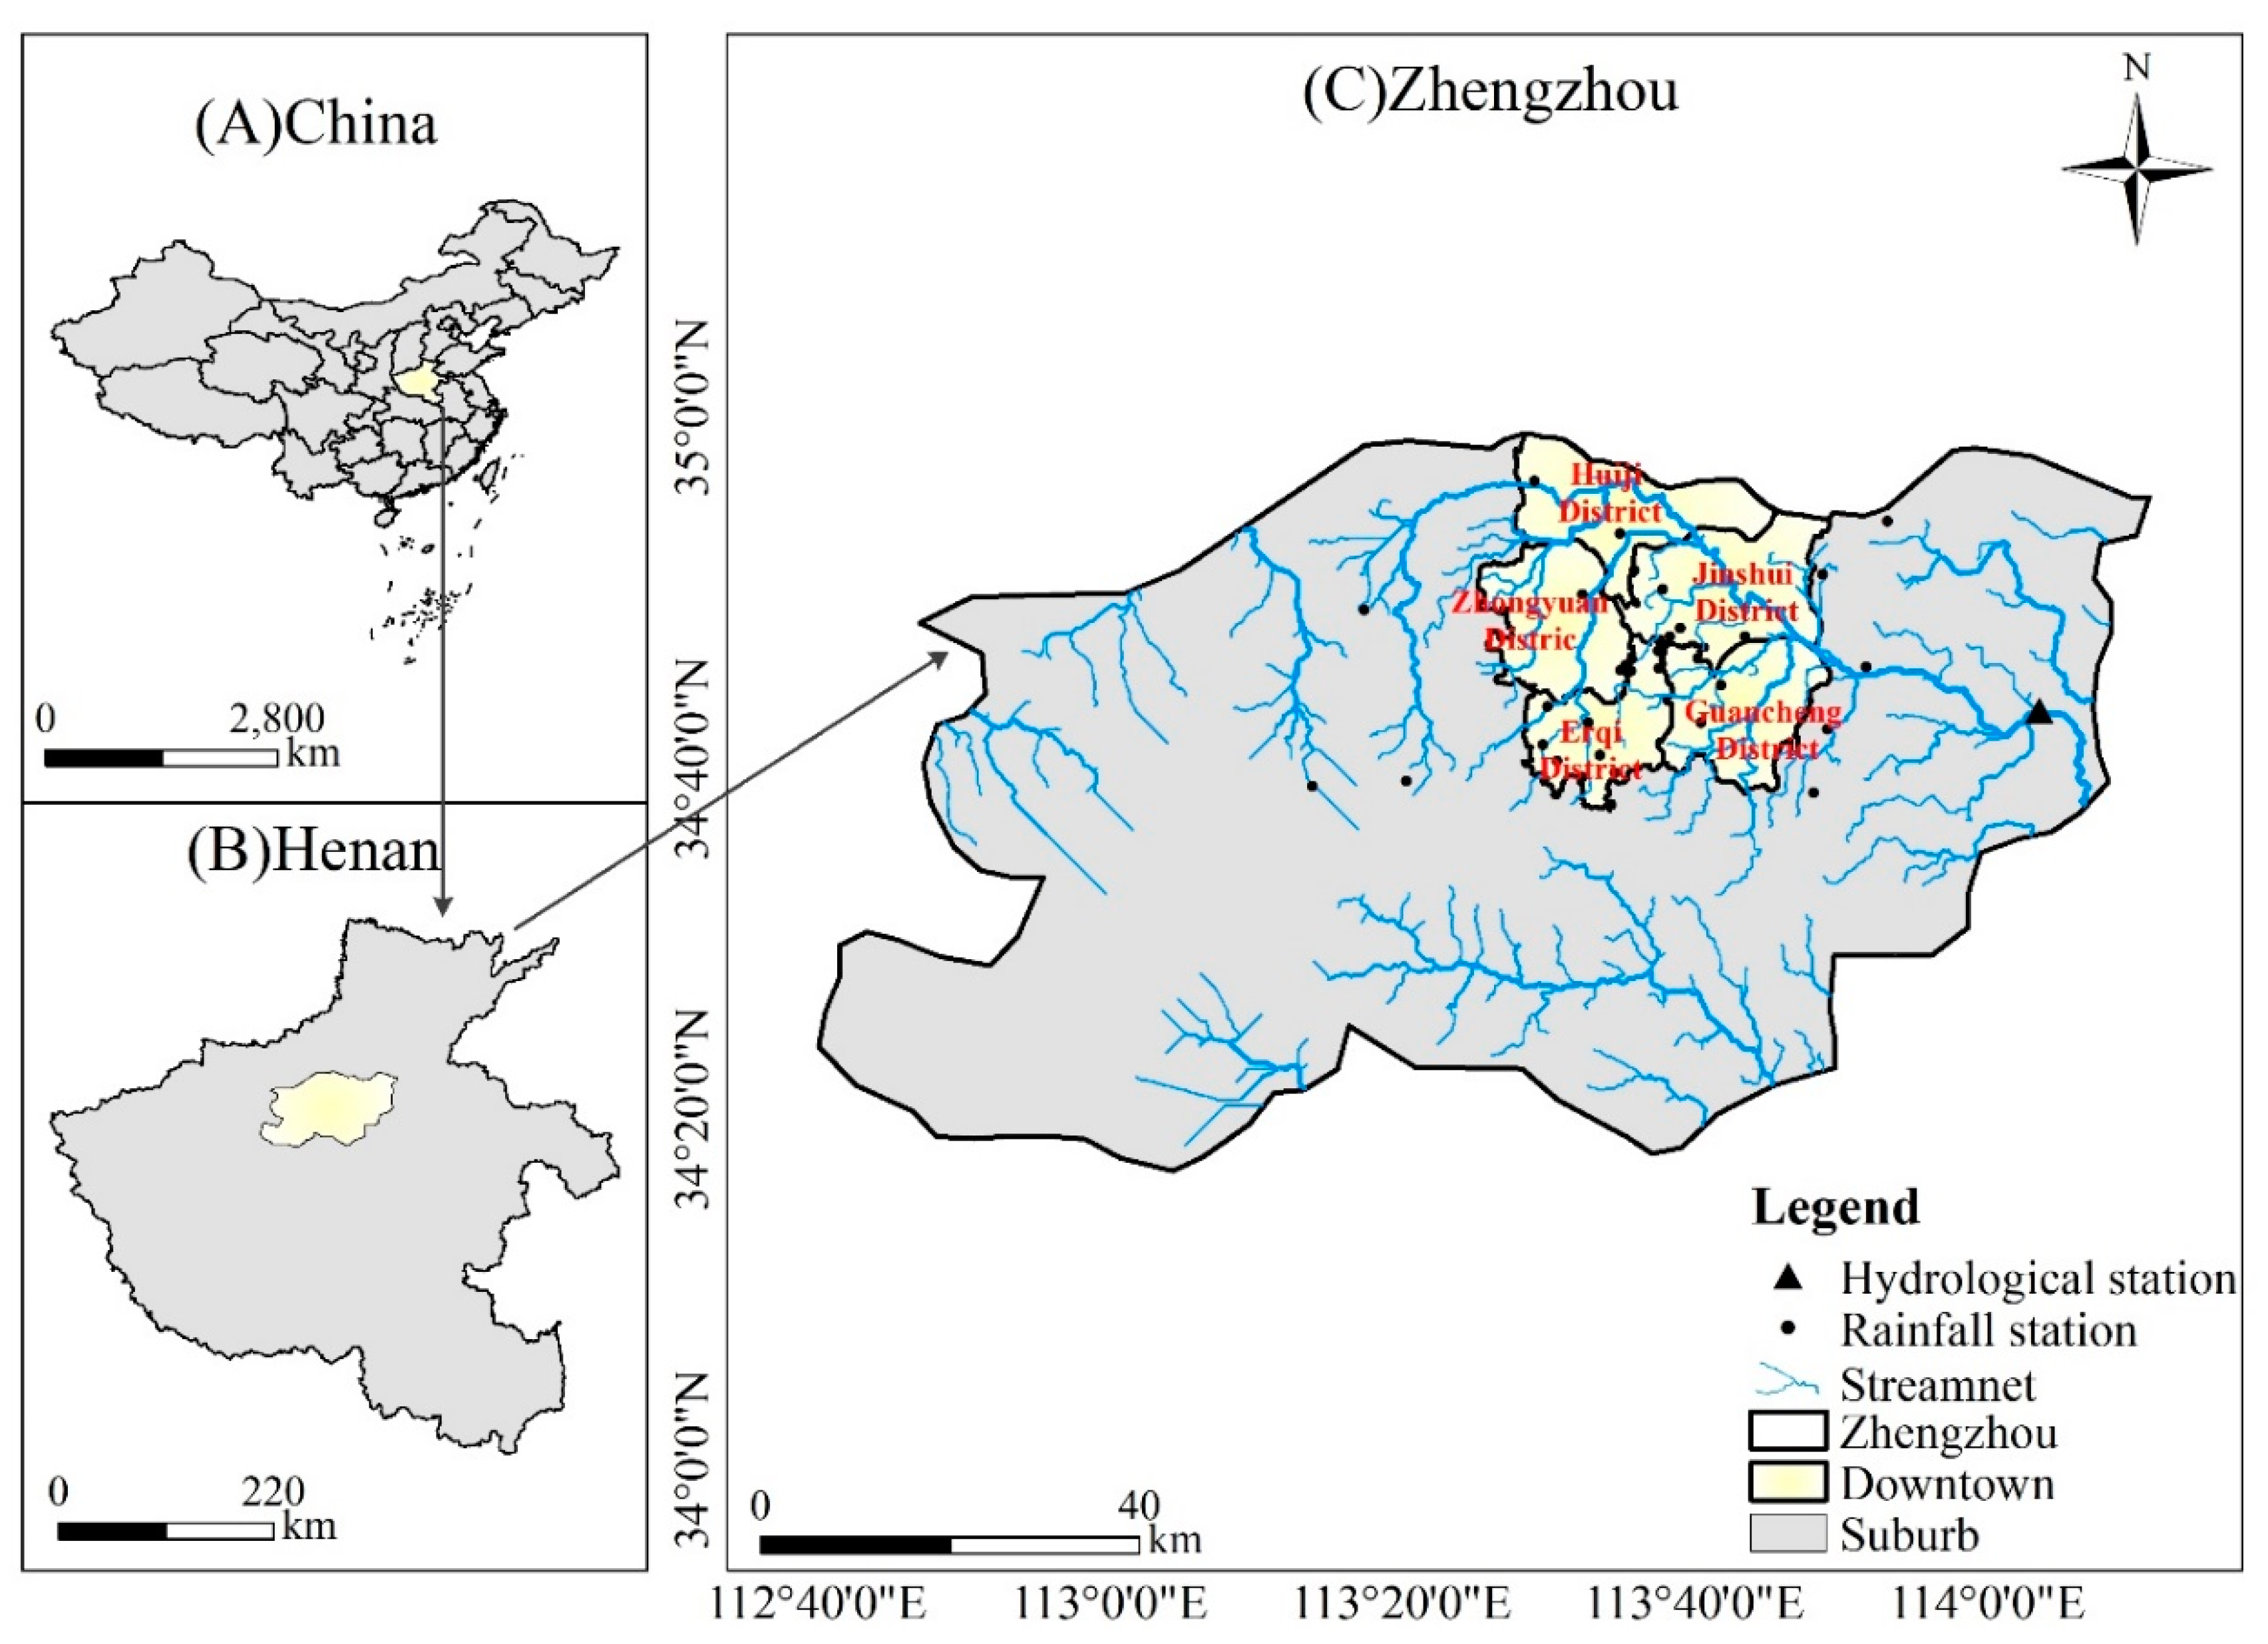
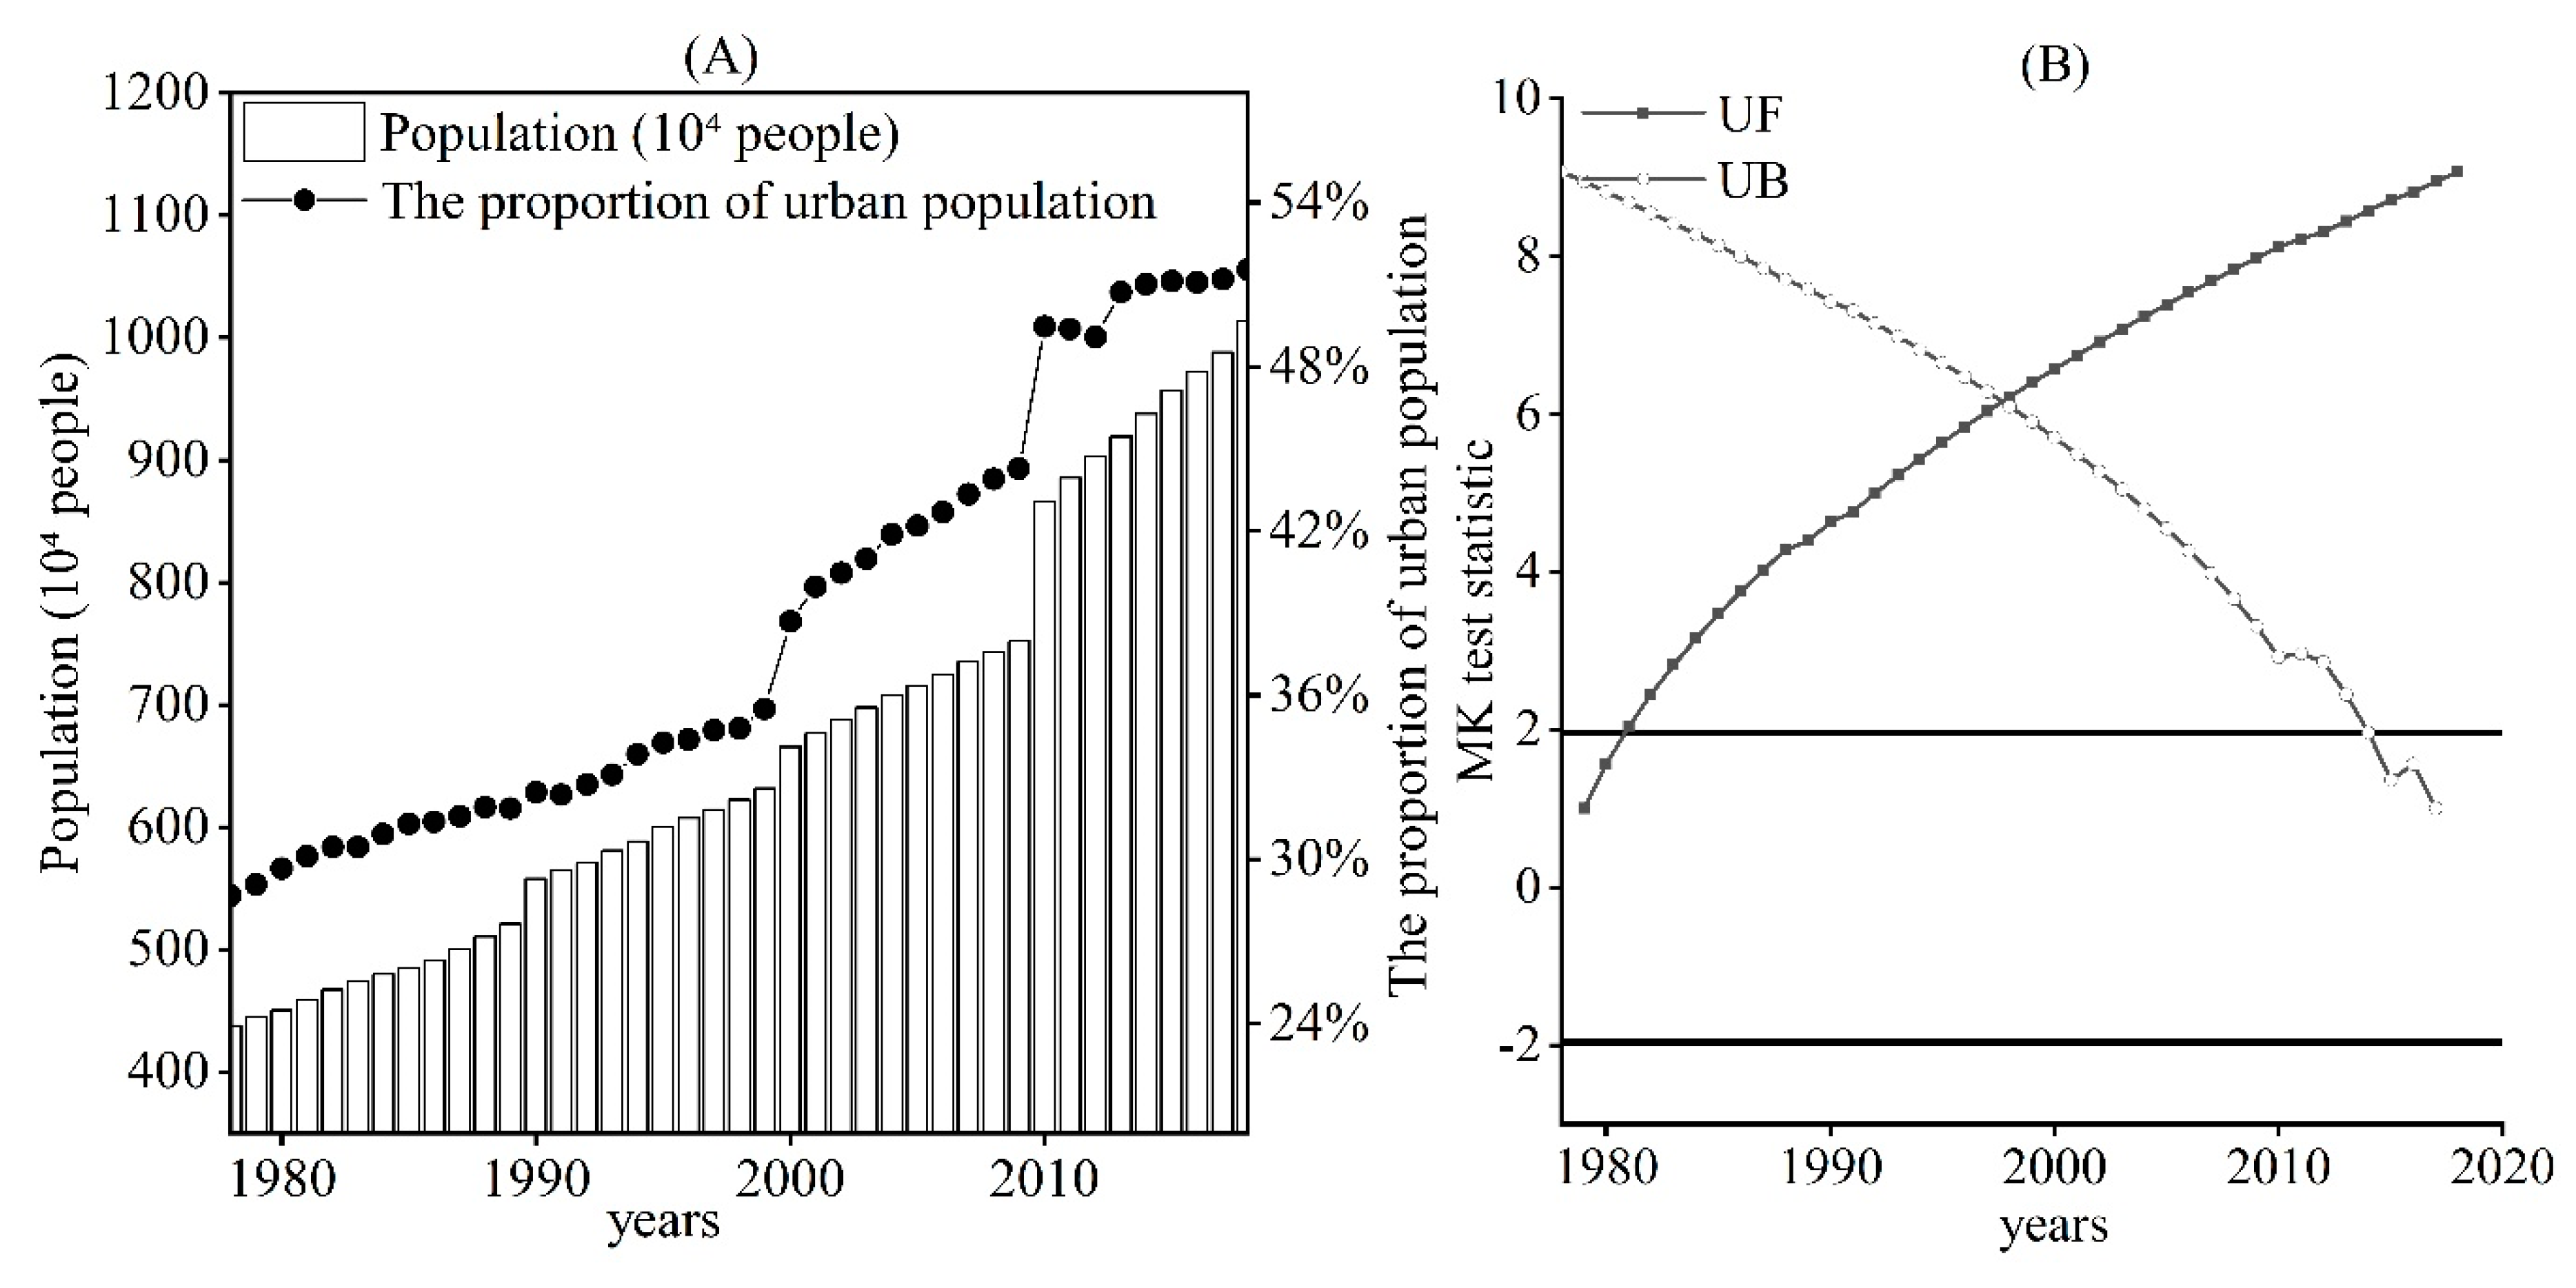
Zhengzhou is an ideal research area to study the effects of urbanization on hydrological processes. On the one hand, compared with other rapidly developing cities, Zhengzhou has a network of rain stations and hydrological stations established earlier, which is convenient to obtain rainfall data and hydrological data. On the other hand, the urbanization of Zhengzhou is typical. In recent years, driven by a series of development policies, such as reform and opening-up and the construction of the Central Plains urban agglomeration, Zhengzhou is in the process of rapid urbanization, with a rapidly expanding urban area and obvious imbalance of development among regions [37]. As a result, the impact of urbanization on the hydrological process is increasingly obvious, and many researches are concentrated here. Based on the Landsat remote sensing images to extract the land use and water system structure of Zhengzhou in 1988, 2002, and 2016 with RS and GIS, Wu [38] found that the reduction of river network in Zhengzhou urbanization area led to the decline of the capacity of the water system through analyzing the changes of Zhengzhou water system structure and the capacity of the water system structure with river length, water area, river network density, water surface ratio, water system connectivity, storage capacity, adjustable storage capacity, unit storage capacity per unit area, and adjustable storage capacity per unit area. It is necessary to adopt low-impact development (LID) to meet Zhengzhou’s requirements for urban rainfall and waterlogging. The runoff data selected for the studies of the impact of Zhengzhou urbanization on the hydrological process are mostly runoff data from the Zhengzhou section of the Jialu River Basin. Wang et al. [39] found that 2009 was the mutation point of runoff coefficient through the Mann–Kendall test of runoff coefficient during 1995–2015. The multi-year average of runoff coefficient from 1995 to 2009 was 0.21, and the average value increased from 2009 to 0.28, with an increase of 33.33%. It was found that the land use change in Zhengzhou caused the runoff coefficient to develop to a high value through simulating the annual rainfall and runoff data of Zhengzhou section of the Jialu River Basin from 1995 to 2015 with the SCS model and analyzing the land use, which was one of the main reasons leading to the increase in total runoff. Liu [40] found that land use change had the greatest impact on runoff in dry years by analyzing the annual runoff process in wet years (10%), normal years (50%), and dry years (90%) with the hydrologic statistics method and verified model by simulating the daily runoff data of the Zhengzhou section of the Jialu River Basin from 1995 to 2008 with the SWAT model. Wei et al. [41] found that urbanization has a certain effect on the peak flow and peak duration of runoff through simulating the 2004 daily runoff process in the middle section of the Jialu River with the coupling of MIKE 11 and MIKE Urban model. Land use change has the greatest impact on the wet years and the least on the dry years by analyzing the annual runoff process in wet years (20%), normal years (50%), and dry years (90%) with using the hydrologic statistics method and verified model, which is quite different from Liu [40]. All these studies show that simulating annual or daily runoff processes cannot accurately reflect the impact of Zhengzhou urbanization on runoff processes. Thus, it is necessary to quantitatively analyze the impact of Zhengzhou land use change on the hydrological process based on the hourly data and the characteristics of the urbanization development process. This can understand the impact of urbanization on the hydrological process from a more detailed perspective, which is of great significance to urban flood control planning.
Zhengzhou was selected as a case to explore the impact of urbanization on the hydrological process combined the characteristics of the urbanization development process. There were three goals: (1) to analyze the impact of different development periods of urbanization on the hydrological process; (2) to qualitatively analyze the regional land change imbalance and its impact on the hydrological process; (3) to quantitatively analyze the impact of land use change on the hydrological process based on hourly runoff data.

2. Materials and Methods

2.1. Study Area

Zhengzhou is located in north-central China (112.70° E–114.23° E, 34.26° N–34.96° N), covers approximately 7446.2 km2, and is the capital of Henan province. It is also the most populous province with the fifth-highest gross domestic product (GDP) of China. The urban area consists of 5 municipal districts (i.e., Huiji, Jinshui, Zhongyuan, Erqi, and Guancheng), as shown in Figure 1. The Yellow River plays a significant role in the development of the regional economy as the major source of freshwater for a large number of people living there. It has a warm temperate continental monsoon climate with an annual average temperature from 12.7 °C to 15.6 °C and an average annual rainfall approximately 635.6 mm. The change in population of Zhengzhou was relatively fast during 1978–2018, ranging from 4.379 to 10.136 million.

2.2. Workflow

The methodology applied in this study is illustrated in Figure 2. The outcomes are the changes in the different urbanization development period. Furthermore, the impact of urbanization on the hydrological response. To reach these targets, several steps were taken. Firstly, the characteristics of Zhengzhou’s urbanization were analyzed with the Mann–Kendall test, and the urbanization was divided into two periods. Secondly, Classification and Regression Trees (CART) algorithm was used to process remote sensing images. Land use transfer matrix and comprehensive dynamic attitude of land use were used to analyze the distribution and transformation characteristics of land use in different urbanization periods. Thirdly, the Thiessen Polygon approach was used to process the rainfall data to obtain the precipitation and its distribution changes in Zhengzhou. The rainfall was divided into groups according to the Precipitation Grade Standard, and the changes of precipitation in different urbanization periods and their influencing factors were analyzed. In the fourth step, the runoff data was processed with the method of flat cutting and diarrhea relationship. Runoff was divided into different groups according to precipitation characteristics. The characteristics and influencing factors of runoff change in different periods were analyzed. Finally, the SCS model was applied to analyze the impact of urbanization on hydrological processes.

2.3. Data Collection

There are 31 rainfall stations and 1 hydrological station in Zhengzhou, with a rainfall station density of 232.69 km2/a, which can accurately reflect the spatial distribution of rainfall, as shown in Table 1. In this study, annual runoff, daily runoff, flood extract data and evaporation data of Zhongmu hydrological Station in the lower reaches of Zhengzhou from 1971–2012 were collected, as well as rainfall data of daily and period rainfall data from 23 rainfall stations in the city from 1971–2012 and 8 rainfall stations in the suburbs from 1971–2015. Zhengzhou economic and social data from 1978–2018 were taken from Zhengzhou Statistical Yearbook.
The remote sensing data were downloaded from the Geospatial Data Cloud website with acquisition dates from April to October. Landsat 4–5 TM series was selected for remote sensing data from 1983 to 1995. The Landsat 7 ETM series of 1999–2012 and the Landsat 8 OLI series during 2013–2017 were downloaded for studying the dynamic change of land use in urbanization. The classification data of Zhengzhou soil data were from the Nanjing Institute of Soils, Chinese Academy of Sciences.
The Mann-Kendall test is a non-parametric statistical test method, which has the advantage that the sample does not need to follow a certain distribution and is not affected by a small number of outliers. Zheng [42] applied the Mann-Kendall test to the division of urban development periods and analyzed the impact of different urbanization periods on the spatial distribution of rainfall in Beijing. It illustrates the applicability of Mann-Kendall test to divide the development stages of urbanization when analyzing the impact of urbanization on the hydrological process.
The total population and non-agricultural population were selected to reflect the urban development. Since 1978, the total population of Zhengzhou has increased by an average of 143,900 people annually, reaching 10.136 million people by the end of 2018. The proportion of urban population also increased from 28.68% in 1978 to 51.55% in 2018, an average annual increase of 0.57% (Figure 3A). The Mann–Kendall test on the proportion of urban population found that the mutation point appeared near 1998 under the condition of 99% confidence (Figure 3B). The annual growth rate of the built-up area and the proportion of the urban population were selected to analyze the development of the urban area in Zhengzhou’s urbanization. It is found that population growth and urban expansion were inextricably linked and present different characteristics in different urbanization periods. Before 1998, the total annual population of Zhengzhou increased by 1.78%, the urban population increased by 0.97%, and the built-up area increased by 3.96%. After 1998, Zhengzhou’s total population increased by 2.51% annually, urban population increased by 2.03%, and built-up area increased by 8.03%. This showed that with the obvious acceleration of Zhengzhou’s urbanization process, the urban area began to accelerate its expansion around 1998. Based on this, the urbanization process of Zhengzhou was divided into the slow urbanization period before 1998 and the accelerated urbanization period after 1998 to analyze the impact of different periods of urbanization development on the hydrological process.

2.4. Land Use

The rapid development of Zhengzhou’s urbanization has led to the rapid expansion of the urban area, which has a huge impact on land use in Zhengzhou. At present, the main urban land uses are built-up, agricultural land, grass, forest, bare land, and water bodies. Zhengzhou is located on the plain, which has a high degree of land use. Its land use types were divided into built-up, agricultural land, grass, forest, and water bodies. The Classification and Regression Trees (CART) algorithm can clearly indicate the importance of variables for classification and select classification-related variables, which can improve the accuracy of land-use extraction [43].
The land use transfer matrix and comprehensive land use dynamic attitude are selected to quantify the change of land use.
The land use transfer matrix can comprehensively and specifically reflect the structure of land use change and the direction of change of each land use type. Therefore, it is widely used in land use change and simulation research.
Comprehensive land use dynamics (LU) represents regional land change rate of a certain land use type within a certain time range of a research area [44], which is widely used in land use change analysis [45]:
LU = a = 1 n Δ L M a - b / 2 T a = 1 n L M a × 100 %
where, Δ L M ( a b ) represents the absolute area of the type a land use type converted into a non-a type land use type during the study period, L M a represents the area of the type a land use type at the study start time, and n represents the land use type data, T is the length of the study period.
The distribution of land uses in Zhengzhou in 1993, 1998, 2003, 2008, and 2013 is shown in Figure 4. The area of land uses is shown in Table 2. The land use transfer matrix is shown in Table 3. In the past 20 years, the changes in the land use patterns of Zhengzhou showed a decrease in grass and an increase in built-up. The grass area decreased from 331.02 km2 in 1993 to 153.83 km2 in 2013, a decrease of 53.33%. The area of built up increased from 134.41 km2 in 1993 to 406.04 km2 in 2015, a two-fold increase. From 1993 to 1998, the average annual decrease in grass was 3.21 km2, and the average annual increase in built-up was 4.20 km2. From 1998 to 2013, the average annual decrease in grass was 10.65 km2, and the average annual increase in built-up was 18.71 km2. In addition, forest and agricultural land have also been continuously transformed into built-up. After 1998, as the rapid growth of urban population led to the expansion of urban area, the conversion of other land use to built-up accelerated.

2.5. Rainfall and Hydrological Processes

In order to analyze the impact of urbanization on the spatial rainfall distribution and obtain more accurate rainfall in Zhengzhou, the Thiessen polygon approach [46] was used to analyze the rainfall and rainfall distribution.
The obtained flood data is time-continuous data, and the flat cut method and storage relation method are used to process the flood data. First, the flat cut method is used to divide the flood formed by this rainfall from the flood generated by this rainfall, and then the runoff depth R formed by this rainfall is calculated using the storage and drainage relationship method [47]:
R = 3.6 Δ t ( i = 2 n 1 Q i + Q 1 + Q n 2 ) / A
where, n is the number of study periods; Δt is the period length (h); Qi is the flow at the i-th time (m3/s); A is the area of the study area.

2.6. SCS Model

The SCS model is suitable for runoff simulation in urban areas with insufficient measured data [48,49], and has strong practicability and wide applicability in China [50]. Therefore, the SCS model was selected to analyze the impact of urbanization on the hydrological process. In order to analyze the impact of land use change on surface runoff, the SCS model was selected to simulate the surface runoff under different land use changes.
Q = ( P 0.2 S ) 2 P + 0.8 S
S = 254 ( 100 C N 1 )
where, Q is direct runoff (mm), S is in mm and CN is the curve number, which depends on the soil type, land cover and land use, hydrological conditions, and antecedent moisture condition, the value varies from 0–100; P is rainfall for event (mm).
In the SCS model, soil moisture in the early stage can be divided into three levels: dry (AMCI), normal (AMCII), and moist (AMCIII). The CN value is a dimensionless parameter with a theoretical range of 0–100. According to the characteristics of hydrologic and soil groups and land use types in Zhengzhou, based on the CN table put forward by The Bureau of Soil and Water Conservation of the Ministry of Agriculture, the CN values corresponding to various land use types and hydrologic and soil types in the study area under normal conditions (AMCII) were obtained by looking up the table. For the CN values of soil moisture at different stages, the following formula can be obtained:
C N I = 4.2 C N I I 10 0.058 C N I I
C N I I I = 23 C N I I 10 + 0.13 C N I I
Set the adjustment coefficient K to adjust the parameters:
C N = k × C N
where, C N is the updated value, C N is the initial value.

3. Results and Discussion

3.1. Precipitation

Compared with 1971–1998, the average annual precipitation in Zhengzhou was 572 mm, and 1999–2018 was 617 mm. It can be seen that the average annual precipitation of Zhengzhou did not change much during different urbanization periods. Therefore, according to the “Precipitation Grade Standard” [51], 75 precipitations in Zhengzhou from 1971 to 2012 were grouped to analyze the changes in precipitation caused by urbanization. The grouping criteria and statistical results are shown in Table 4. Precipitation of all intensities increased from 1999 to 2012 compared with 1971 to 1998, indicating that the rapid development of urbanization has brought about obvious changes in the process of extreme rainfall. The frequency of light rain, rainstorm, and heavy rainstorm has increased significantly. Based on the monthly precipitation data from 1959 to 2010 in Beijing, Zhou et al. [52] found that the variation coefficient of rainfall stations in urban areas was greater than that in suburbs during urbanization. It shows that urbanization increased the occurrence probability of rainstorm and light rain, which provided support for our research results.
Most of current researches have analyzed the impact of urbanization on precipitation at the city scale, which found that urbanization-related land-use changes lead to the rain island effect and have an enhanced effect on the precipitation [53,54,
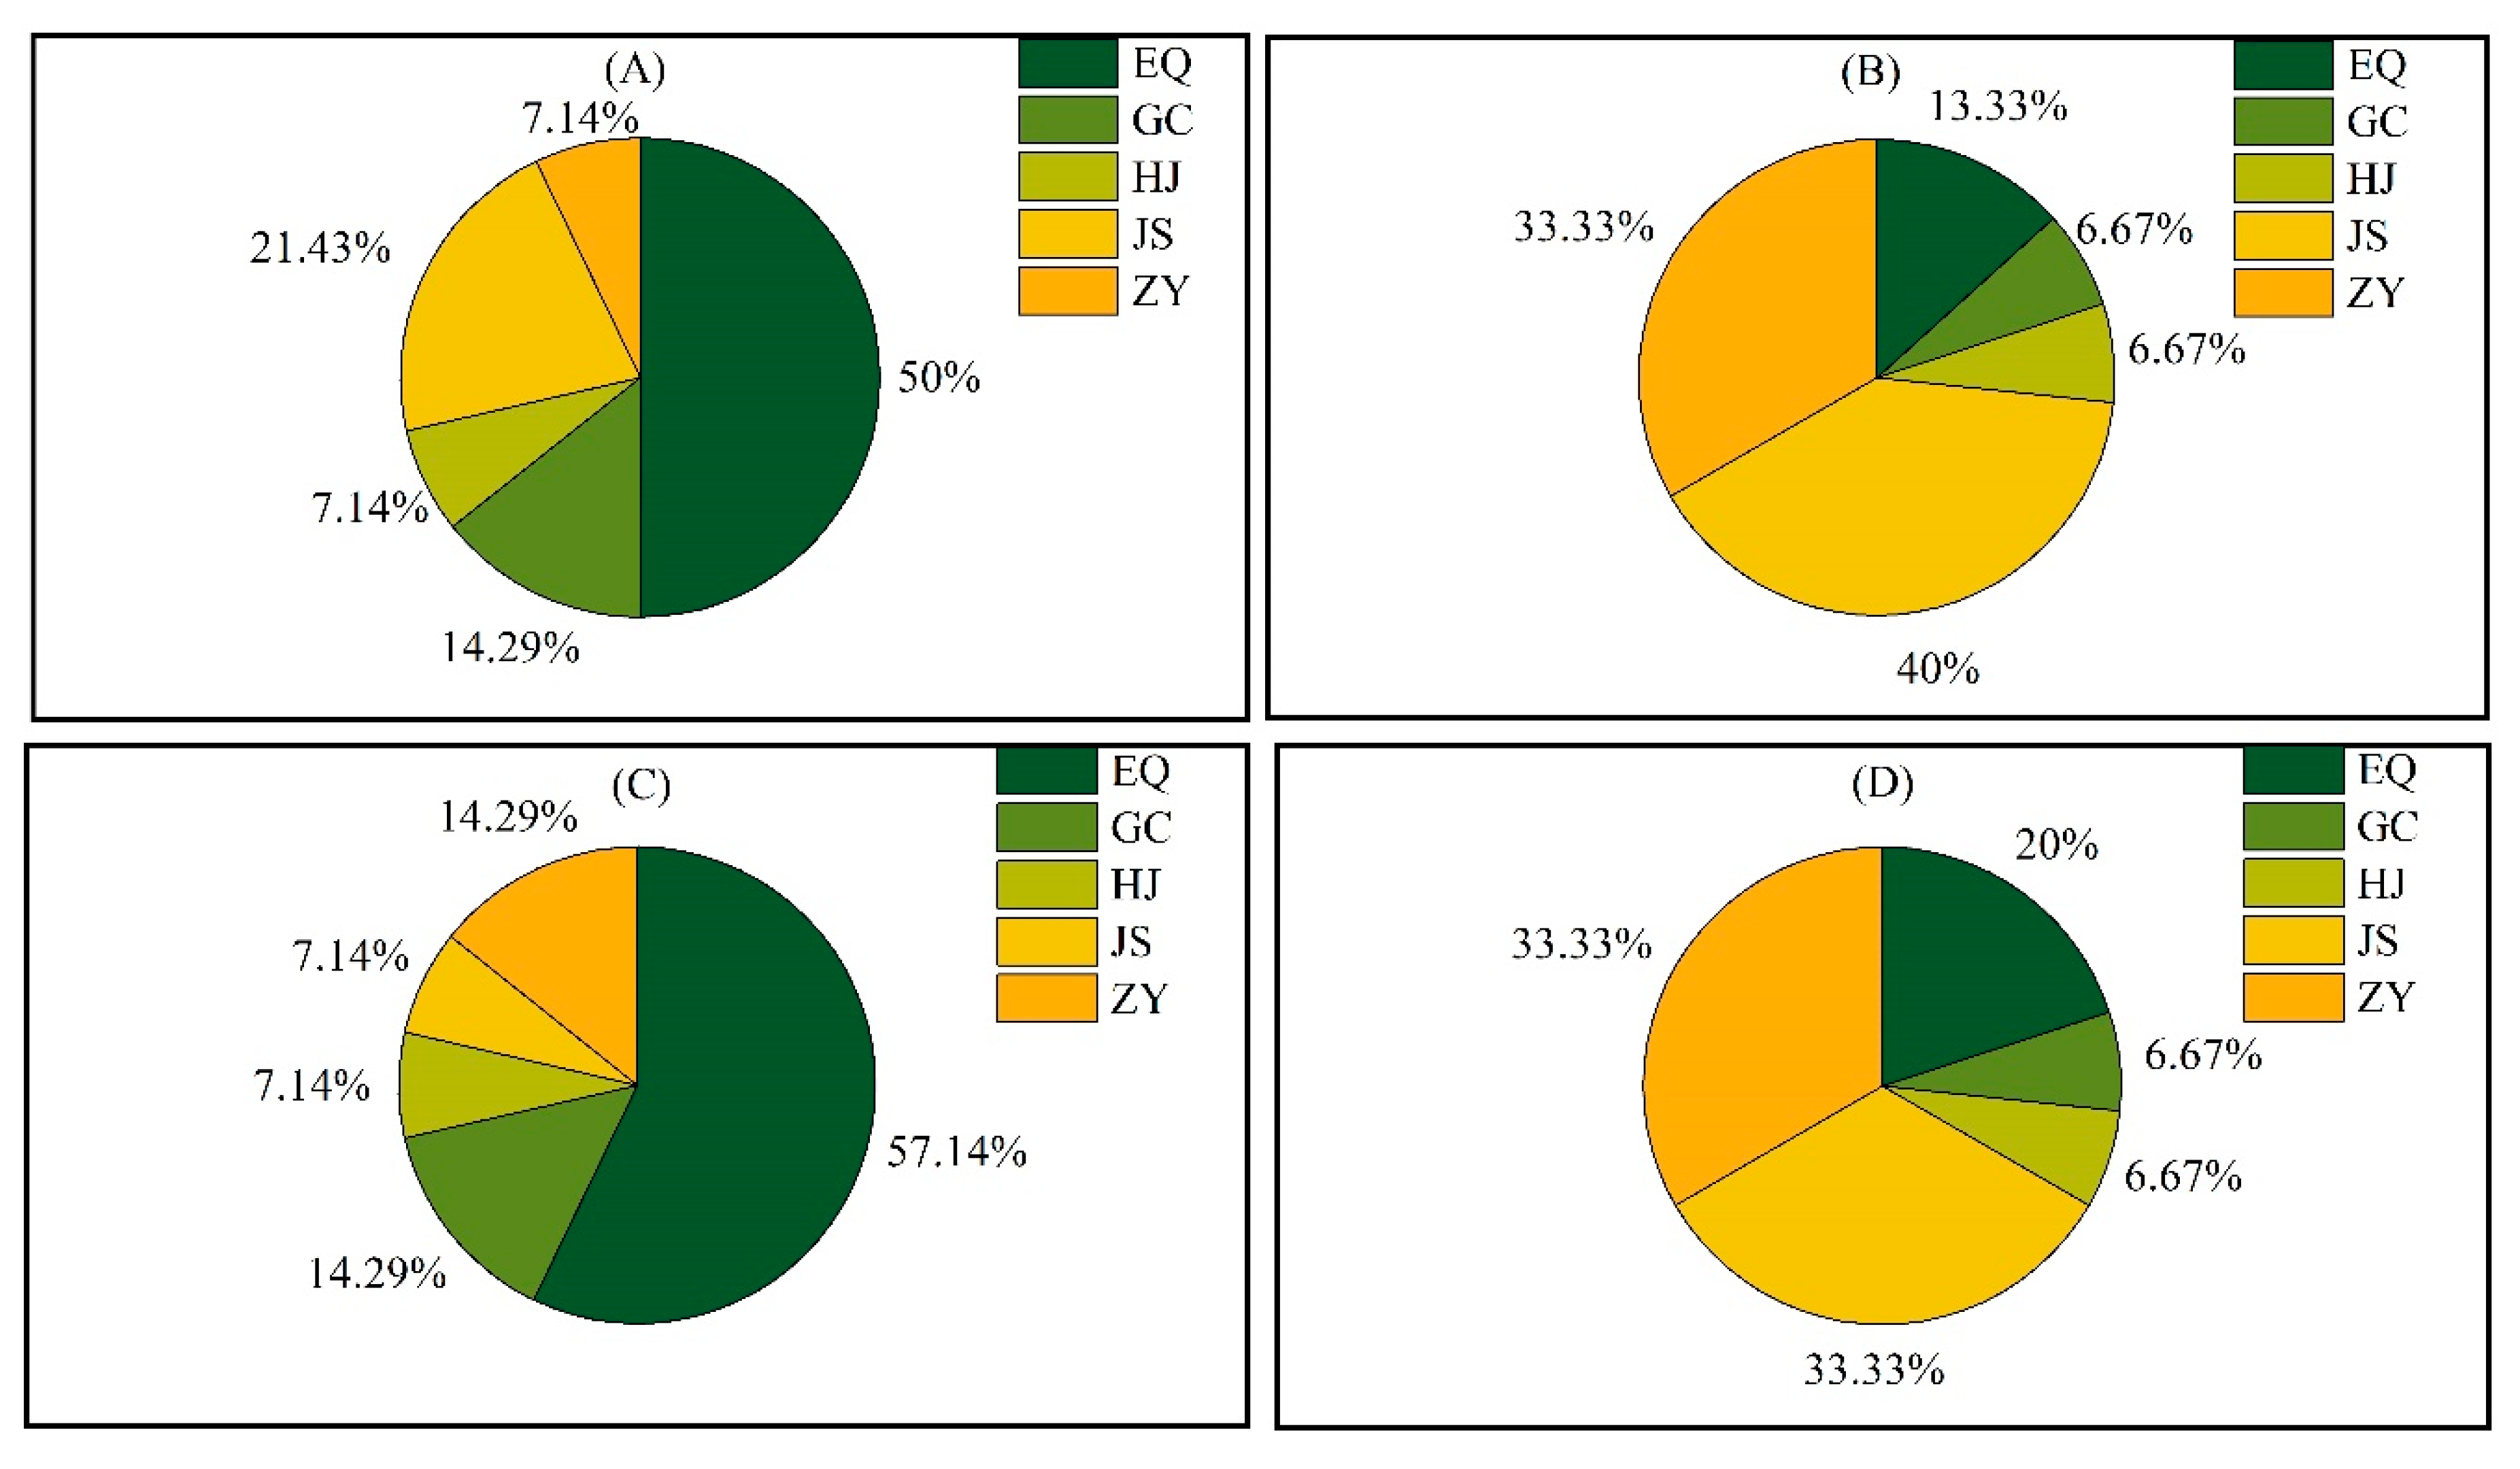
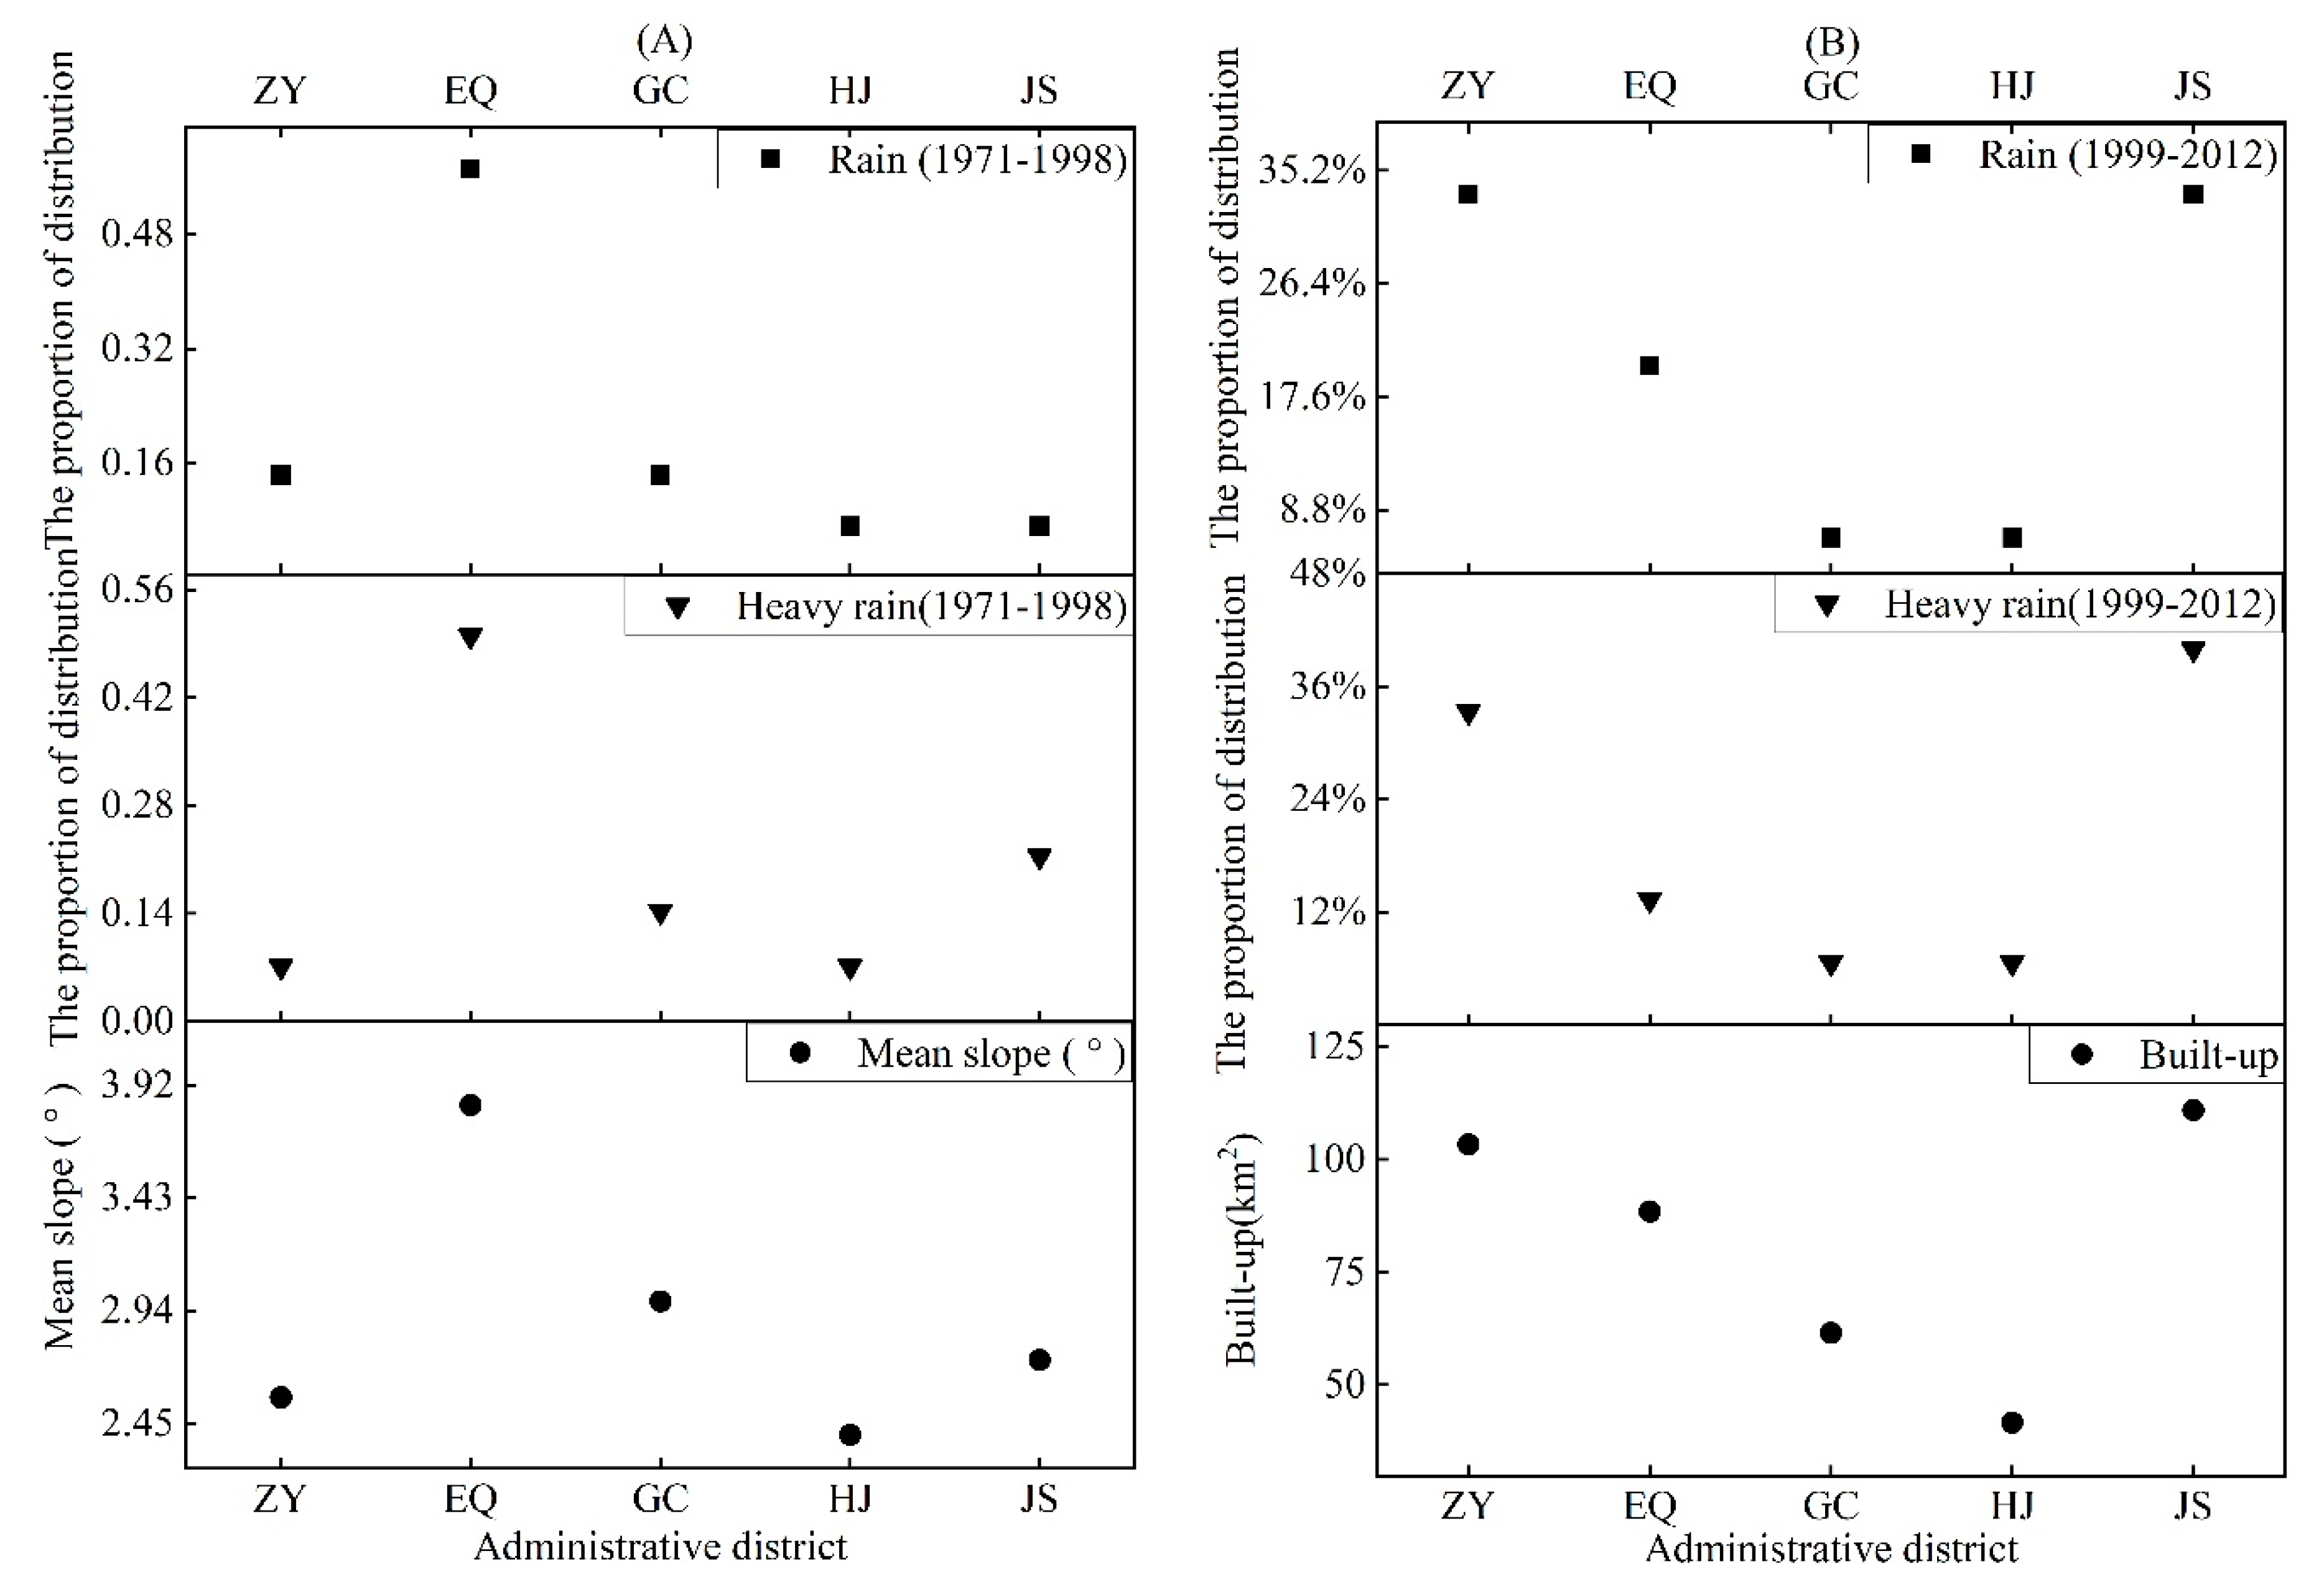
55]. However, there are few studies focusing on the impact of land use change on rainstorm at the regional scale. In order to study the precipitation and its influencing factors on the regional scale, administrative division of China was used to divide the urban area. Zhengzhou is divided into Erqi District (EQ), Guancheng District (GC), Huiji District (HJ), Jinshui District (JS), and Zhongyuan District (ZY). Two sets of sufficient data for rain and heavy rain in different urbanization periods were selected to analyze the impact of regional land use on precipitation (Figure 5).
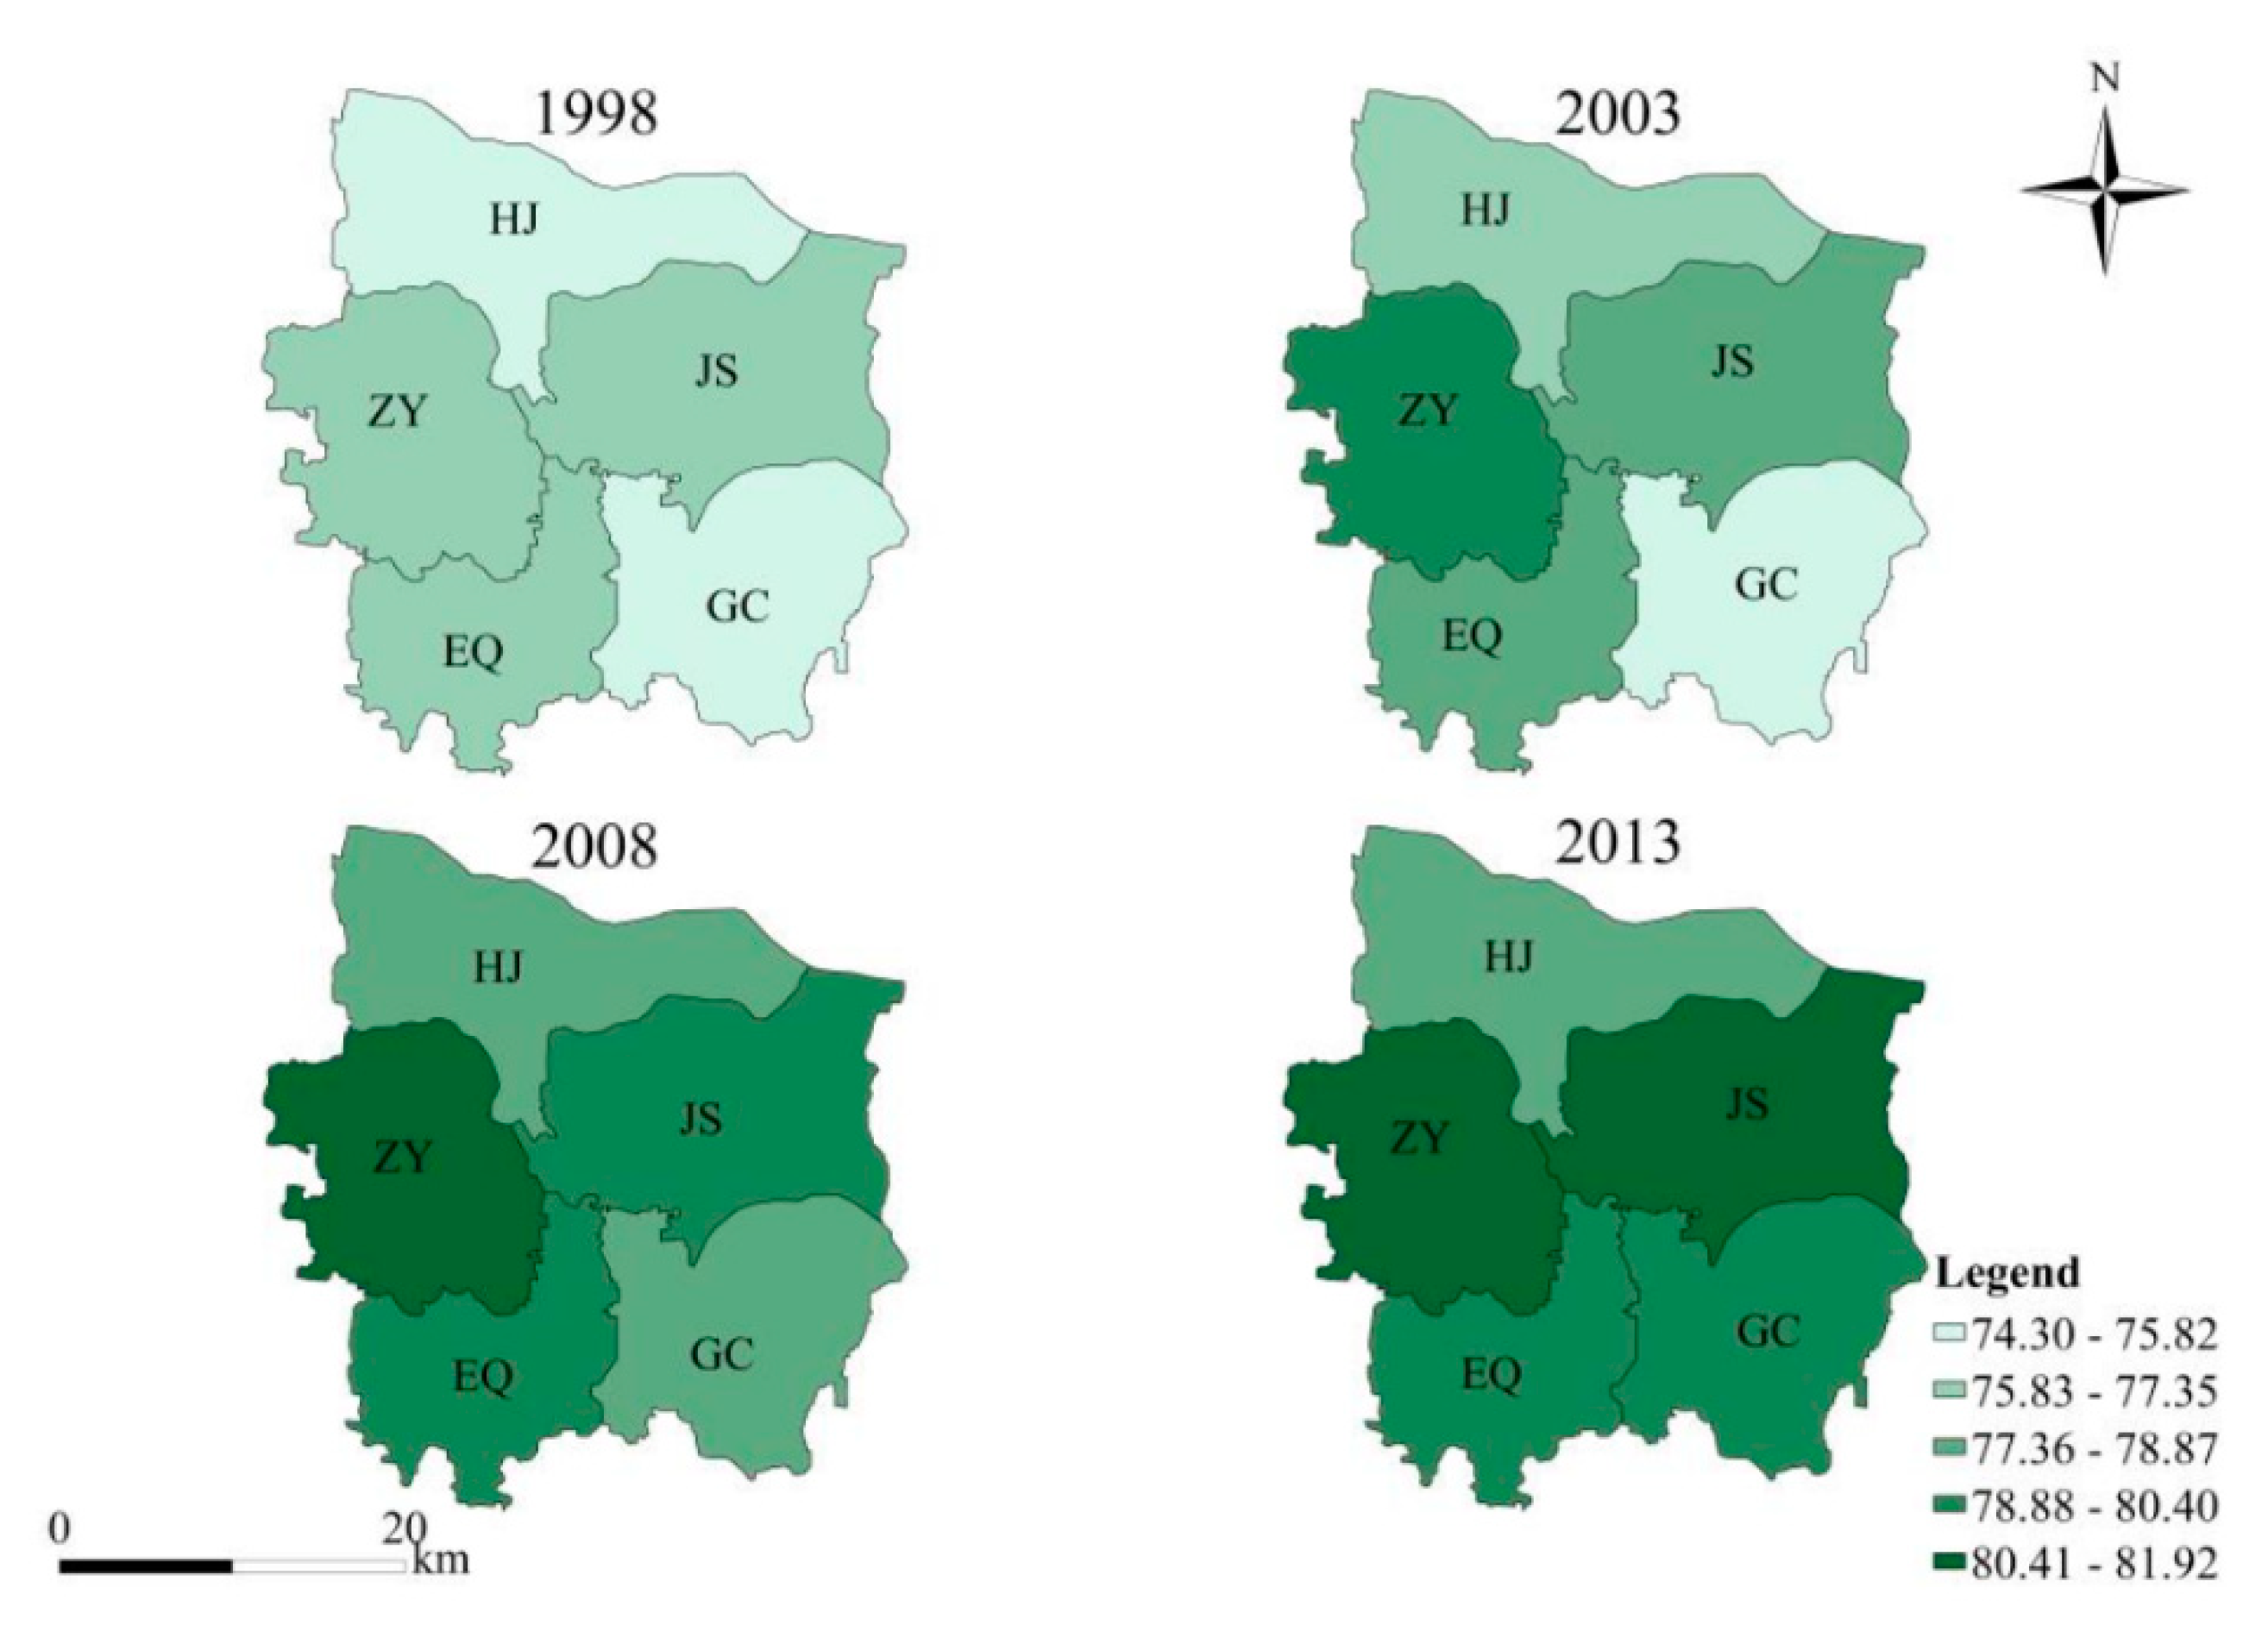
From 1971 to 1998, most of the precipitation was concentrated in EQ, where about 50% of rain and heavy rain occurred. The main factor affecting the spatial distribution of precipitation during this period was the natural geographical conditions due to the low level of urban development. The average slope of EQ is 3.89°, which is the largest topographic fluctuation area in Zhengzhou, providing conditions for the formation of precipitation (Figure 6A).
From 1999 to 2012, the precipitation centers in Zhengzhou were mostly concentrated in urban areas, presenting obvious rain island effect that with different strengths in different regions. The frequency of precipitation centers in JS and ZY increased significantly, while in EQ it showed a downward trend. According to the analysis of land use change, the built-up land area of ZY and JS expanded rapidly (Figure 6B). At the end of 2013, the built-up land area of JS reached 110.91 km2, and that of ZY reached 103.39 km2. The total built-up land area of the two districts accounted for 52.78% of Zhengzhou, making the possibility of precipitation centers appearing in these areas increased. This indicates that regional land use change in urbanization, especially the distribution of built-up, has an impact on the distribution of the rain island effect. In the process of urbanization, the economic development difference between different regions increases, and the built-up is redistributed. The retardation of concentrated buildings on cloud activities leads to the extension of precipitation time and the increase of precipitation intensity, so more pronounced in areas where built-up land is relatively concentrated.
Previous studies have found similar conclusions on the city scale: in the period of accelerated urbanization, land use becomes the main influencing factor of precipitation [42], and the retardation of city on clouds enhances precipitation [56]. This study further explains the impact of land use associated with urbanization on precipitation. Combined with regional land use changes, it is found that the distribution of built-up land is the main factor of the rain island effect, and precipitation is more likely to be concentrated in areas with built-up land as the main type of land use.

3.2. Hydrological Processes

With the complex changes on land use and rainfall in urbanization, the hydrological process has also changed significantly. For example, the surface runoff increased significantly, the underground runoff decreased, and the peak lag was advanced. Many studies have confirmed these changes [57,58,59], but most of the current studies have not involve the impact of land use distribution related to urbanization on the hydrological process under the rain island effect. In order to further explore the impact of urbanization on hydrological processes, 75 hydrological processes from 1971 to 2012 were grouped according to precipitation distribution and regional land use. Hydrological processes are grouped according to the maximum 1-h precipitation, and the classification criteria are shown in 
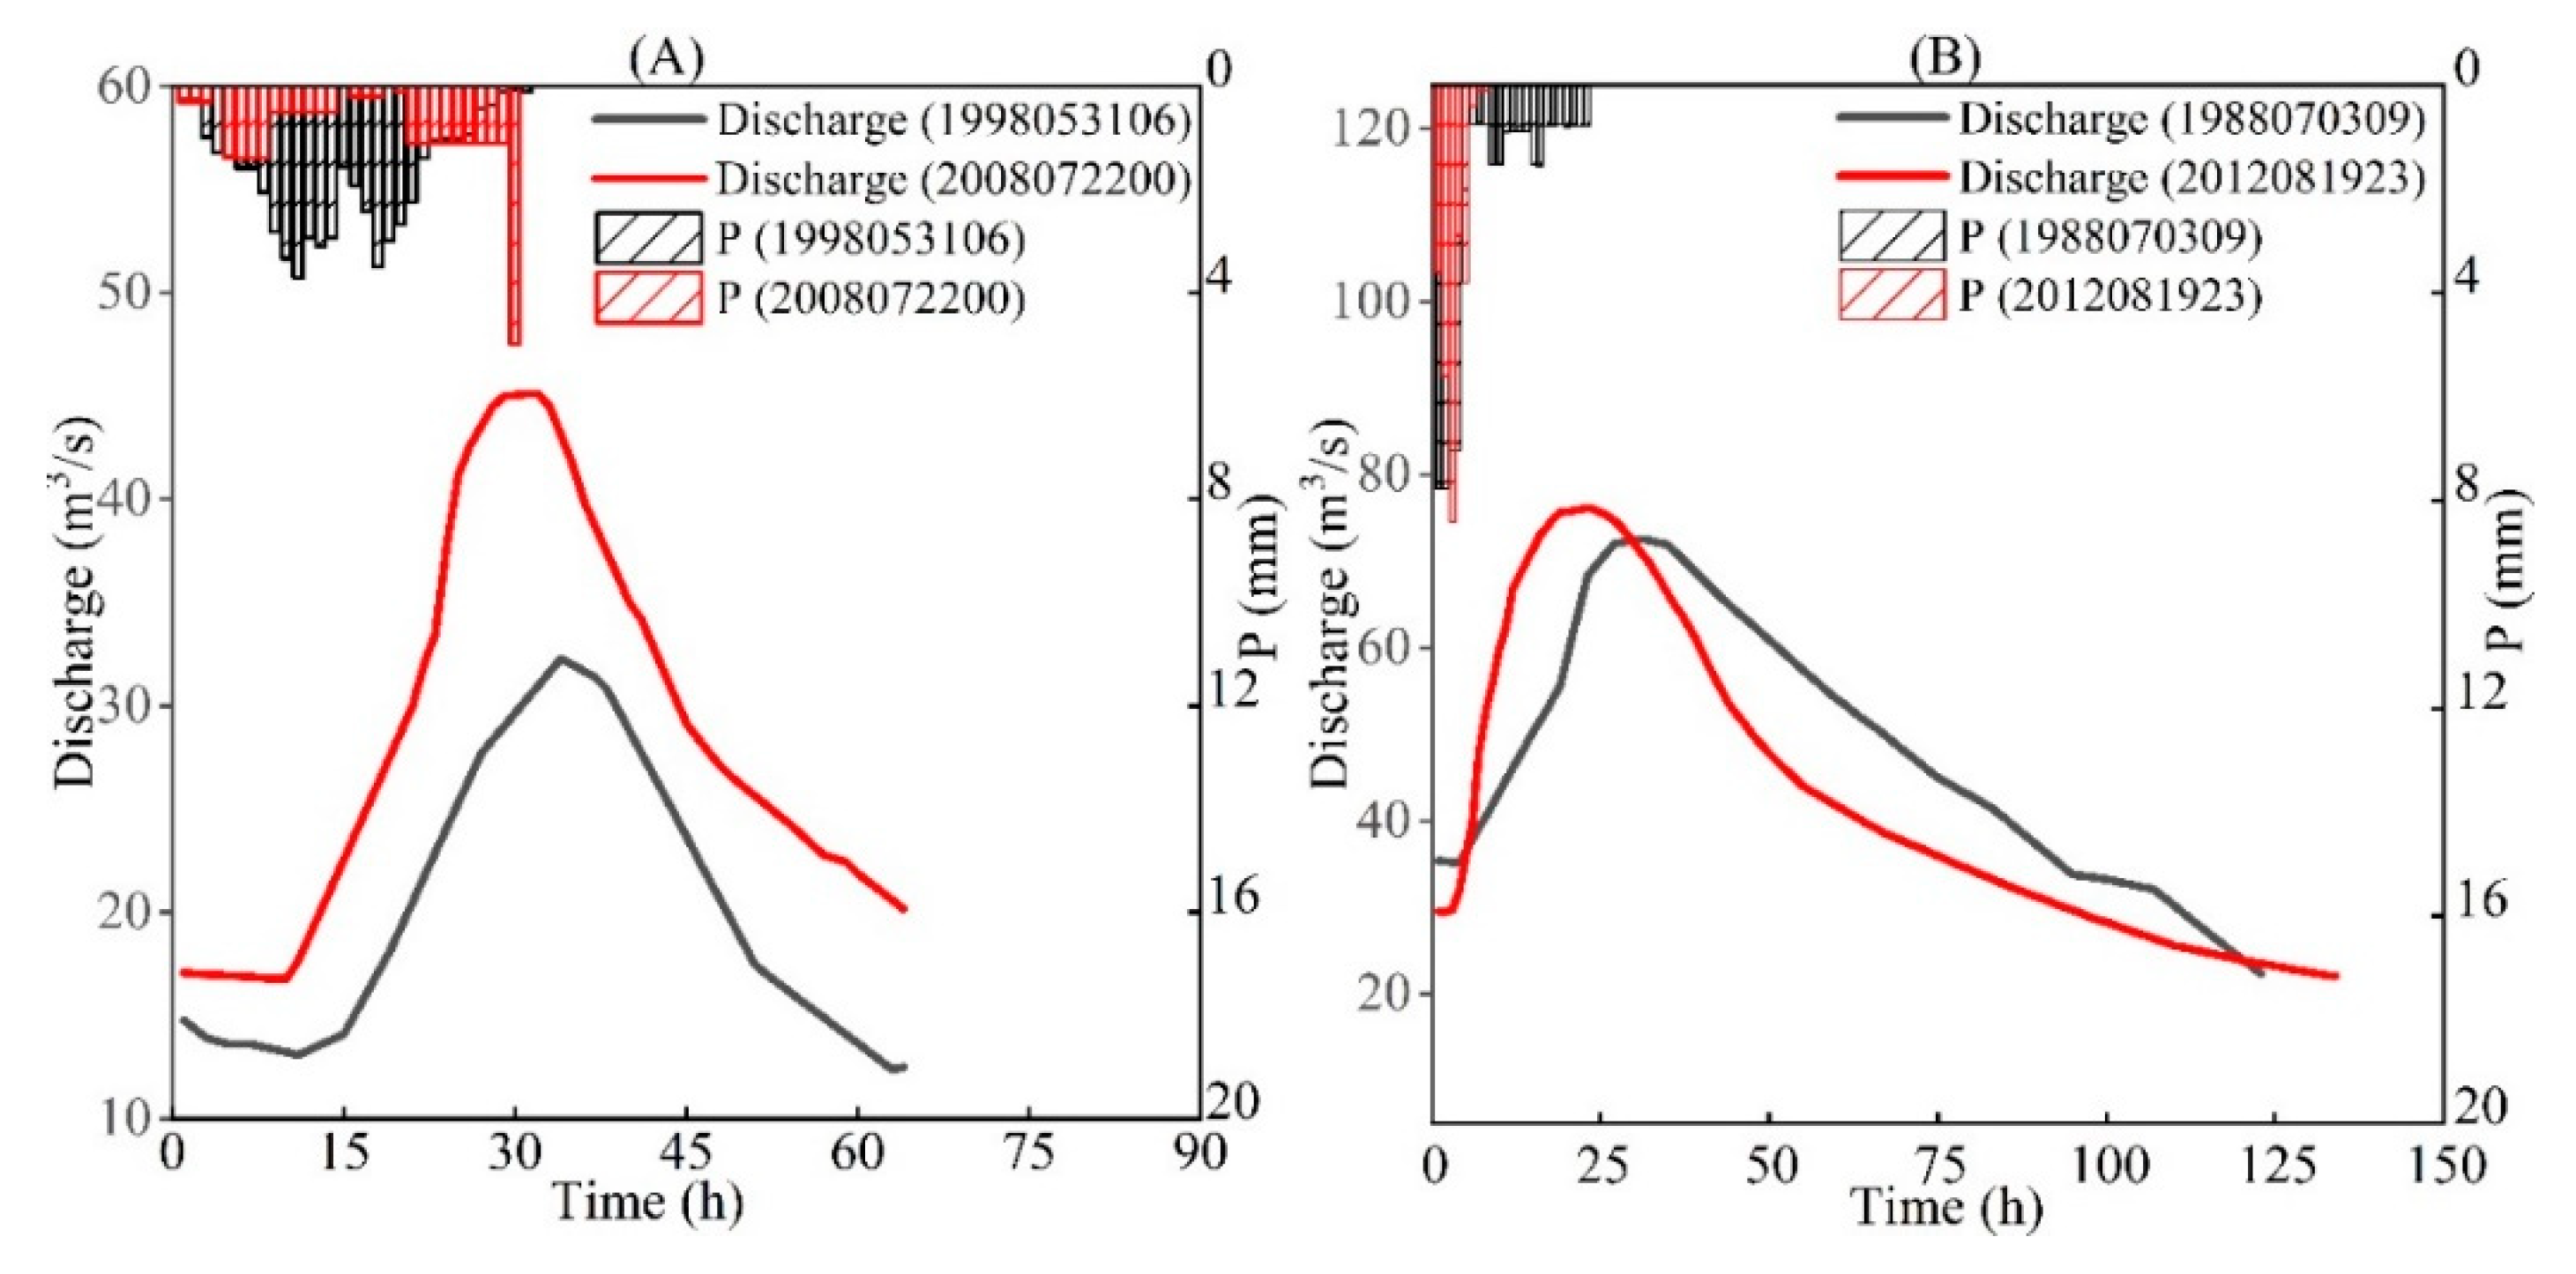
Table 4. Taking EQ as an example, typical hydrological processes in different periods are shown in Figure 7. Two groups of sufficient runoff data of rain and heavy rain which precipitation center in ZY, GC, EQ in different periods of urbanization were selected to analyze the impact of urbanization on hydrological process by statistical three indexes, namely peak lag, flood peak and runoff coefficient. The results are shown in Table 5, Table 6 and Table 7.
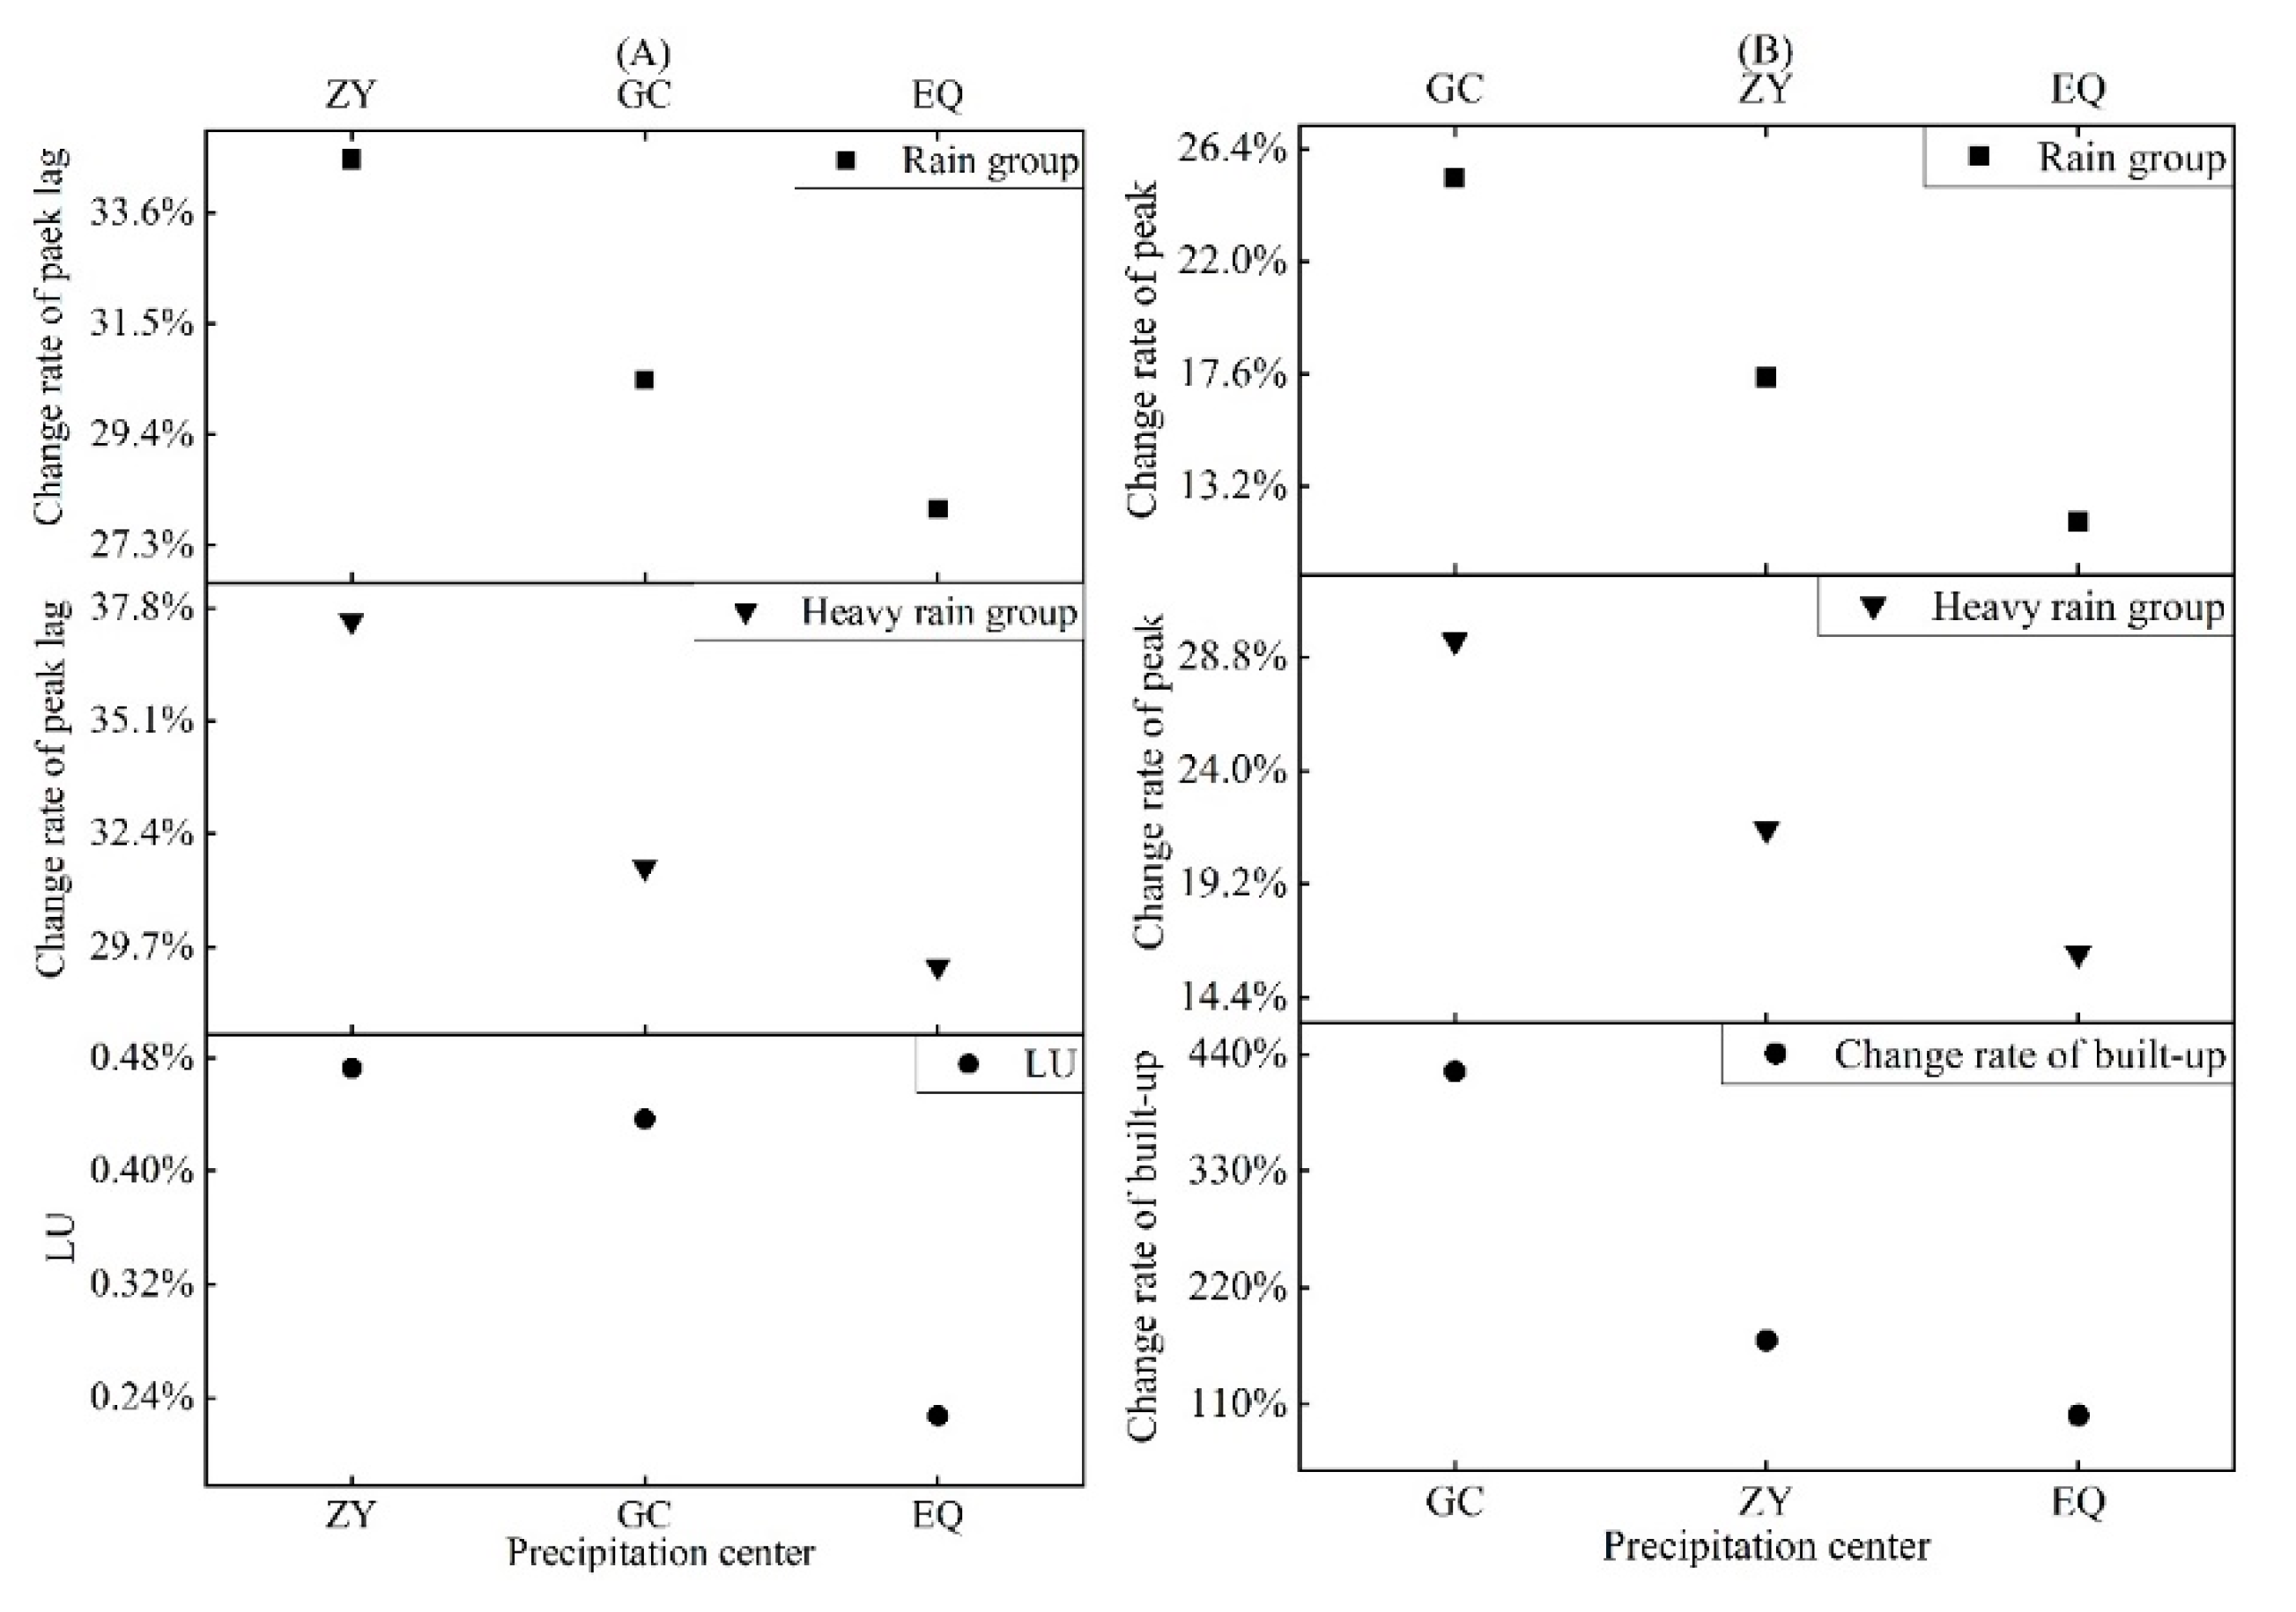
The flood peak lag in 1999–2012 was about 25–30% earlier than that in 1971–1998 under similar precipitation conditions. In the same group of hydrological processes, the variation trend of the hydrological peak lag formed by the precipitation center in different regions was ZY > GC > EQ (Table 5). The comprehensive dynamic degree of land use (LU) between 1998 and 2013 in Zhengzhou was ZY > GC > EQ. Under the conditions of similar precipitation, when the precipitation center was in the area with a large LU, the change in the peak lag was relatively large (Figure 8A). The consistency of the peak lag change and LU indicated that the peak lag was affected by the spatial distribution of land use. With the accelerated expansion of Zhengzhou built-up area from 1999 to 2012, significant changes took place in land use patterns. Precipitation converged more quickly because of the reduction of vegetation, the rapid expansion of the urban area and the construction of the urban drainage pipe network. The difference in the spatial distribution of land use has led to the difference in the peak lag. When rainfall is concentrated in areas with large changes in the spatial distribution of land use, the peak lag variation is large.
Under the condition of similar precipitation distribution, the influence of land use change on the peak lag of runoff process in heavy rain group is greater than that in rain group. The average peak lag of runoff in rain group was advanced by 30.56%. The average peak lag of runoff in heavy rain group was 31.77% earlier. The rain island effect increased the frequency of heavy rain, amplified the impact of land use change on the peak lag of flood season, and put pressure on the operation of urban flood control system.
The flood peak in 1999–2012 was about 10–30% greater than that in 1971–1998 under similar precipitation conditions. In the same group of hydrological processes, the variation trend of the flood peaks formed by the precipitation center in different areas was GC > ZY > EQ (Table 6). The changes of Zhengzhou’s built-up area between 1998 and 2013 was GC > ZY > EQ. Under the conditions of similar precipitation, when the precipitation center was in a region with large changes in built-up type, the change in flood peak was greater (Figure 8B). The change of flood peak is closely related to the change of built-up land. As the expansion of built-up land significantly accelerated from 1999 to 2012, the amount of filling and infiltration decreased, which increased the flood peak. Due to the different expansion of built-up area in different regions, the differences in the amount of filling and infiltration also increased. While the precipitation is concentrated in areas with large changes in built-up land, the flood peaks also change more.
Under the condition of similar precipitation distribution, the influence of the change of built-up land on the runoff process of heavy rain group was greater than that of rain group. The average peak of runoff in rain group increased by 18.19%. The average peak of runoff flow in heavy rain group increased by 22.41%. Heavy rain is more frequently affected by the island effect and is more likely to occur in areas with concentrated built-up land. This aggravated the influence of the change of built-up land on the flood peak and increased the flood control pressure of the city and its downstream.
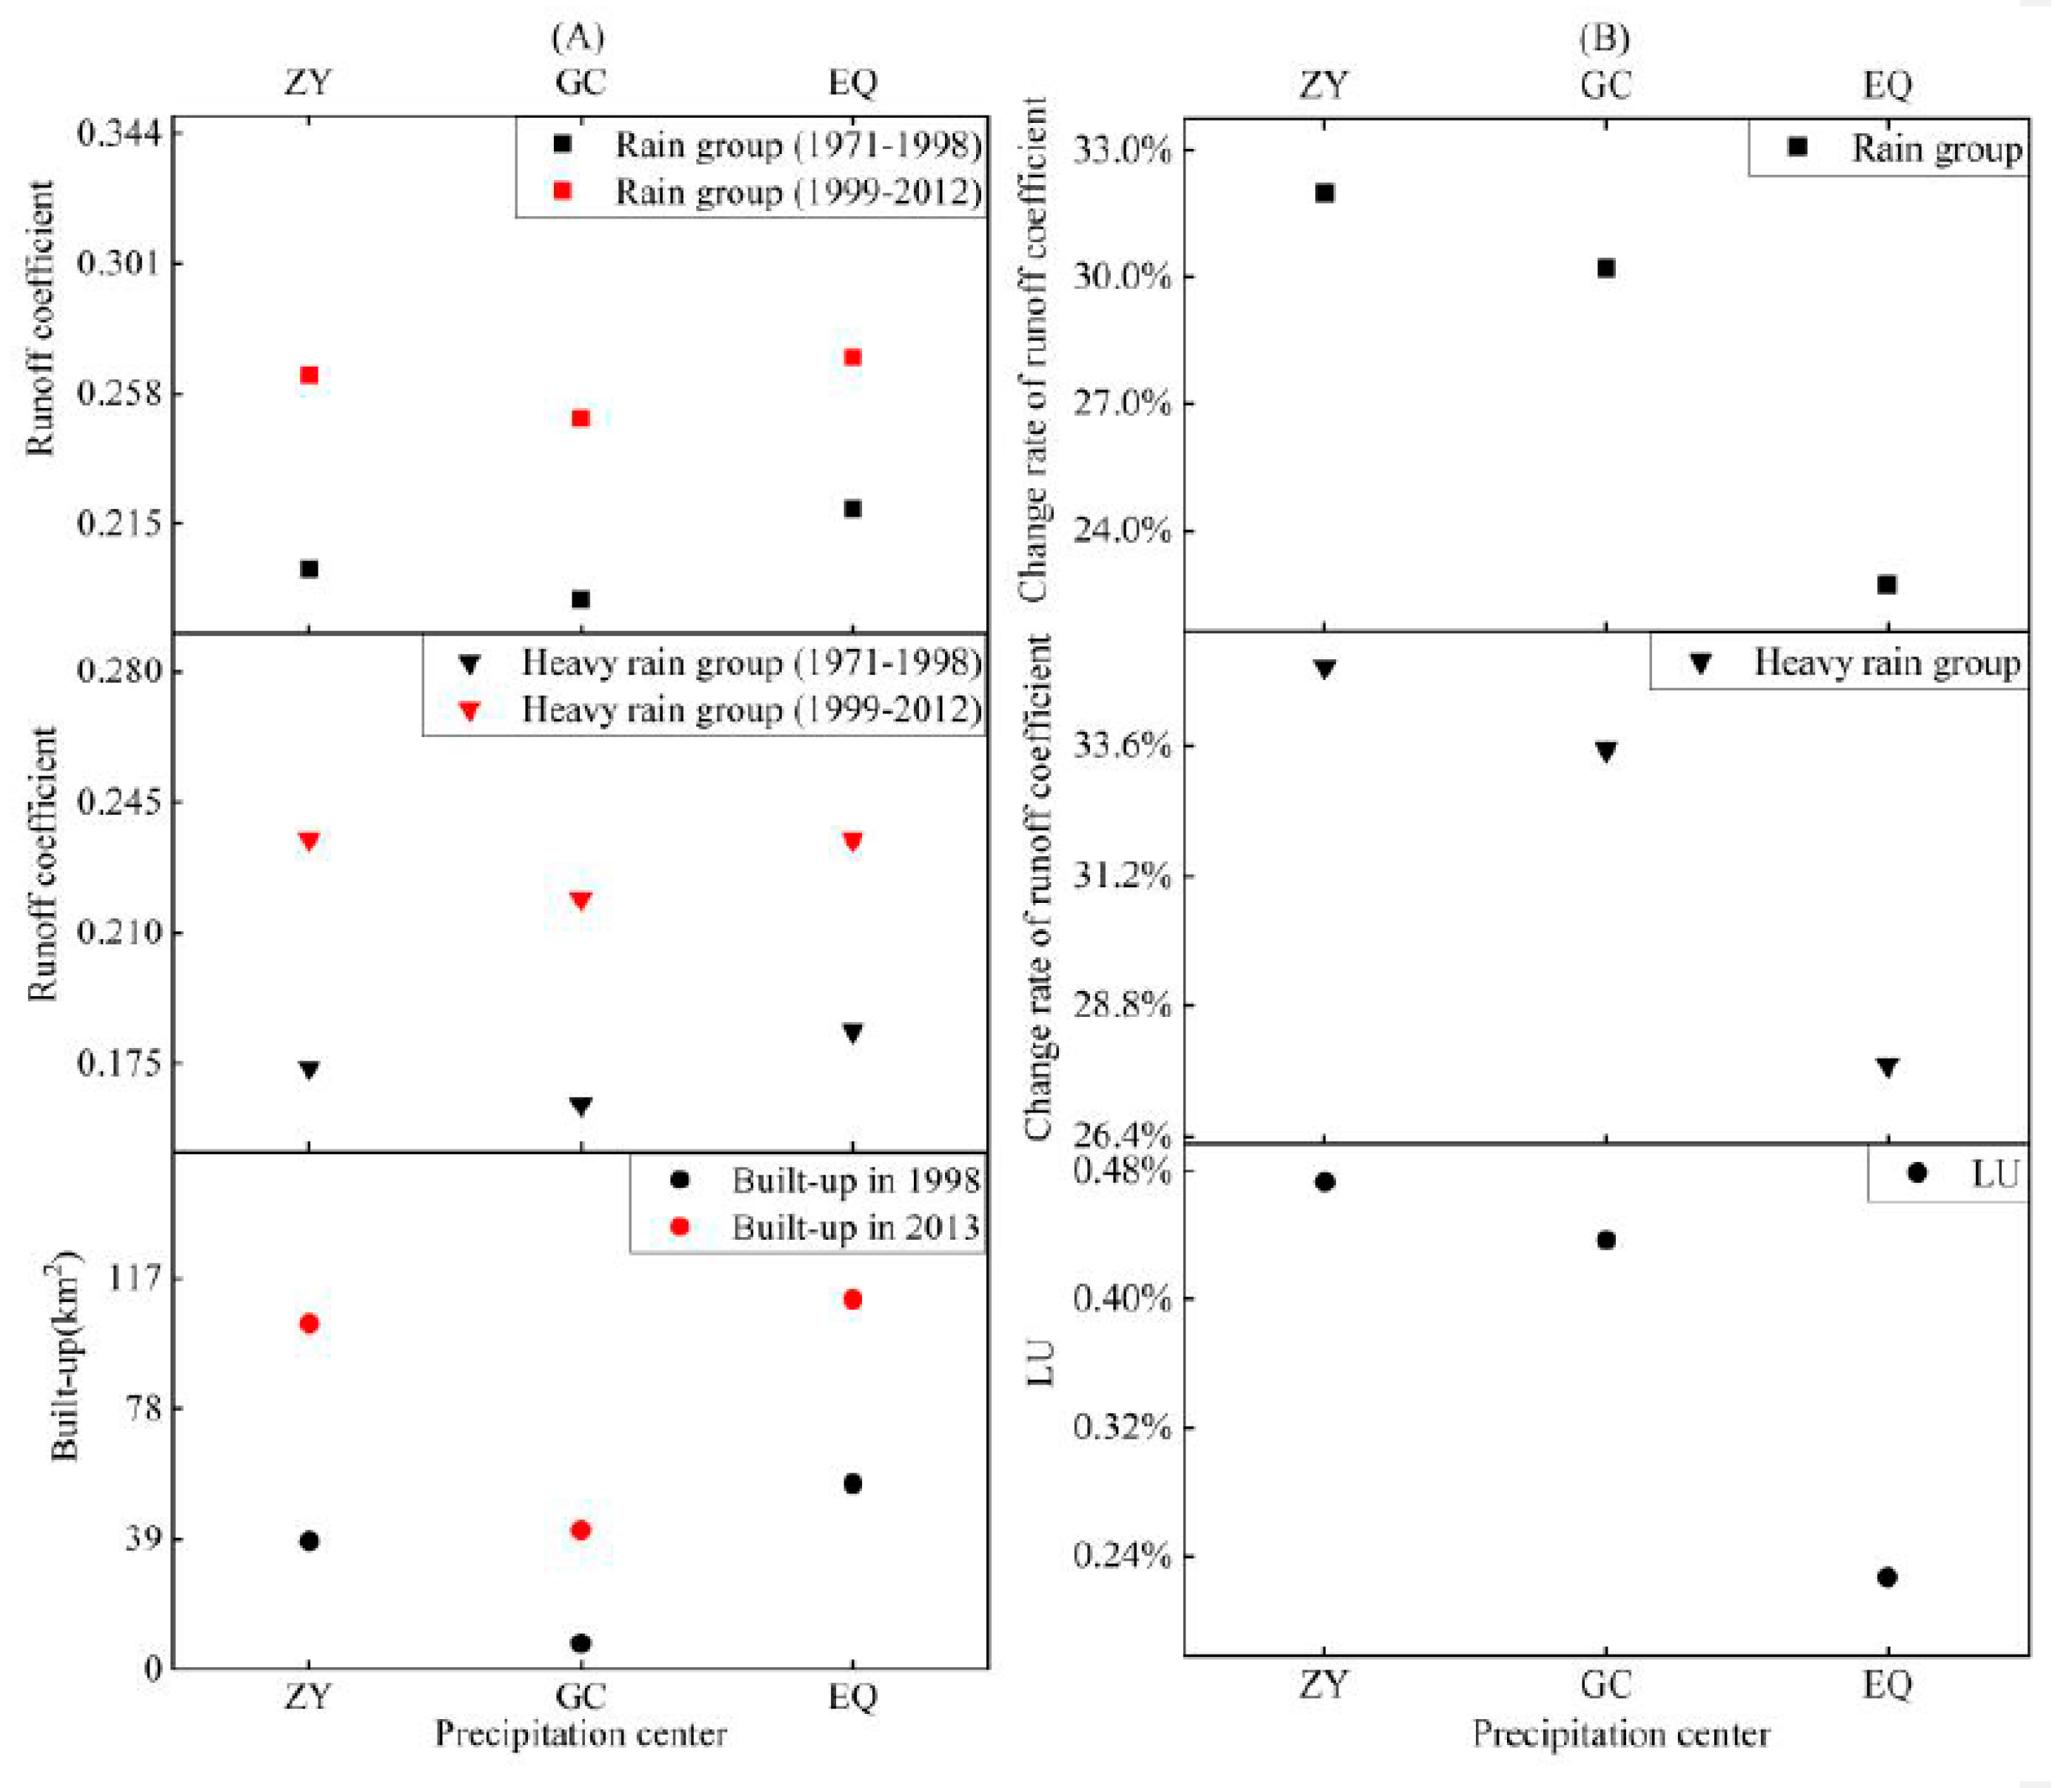
The runoff coefficient in 1999–2012 increased by approximately 20–35% compared with that in 1971–1998 under similar precipitation conditions. In the same group of hydrological processes, the variation trend of the runoff coefficient formed by the precipitation center in different areas was ZY > EQ > GC (Table 7). The proportion of built-up land in 2013 was ZY > EQ > GC. The runoff coefficient of hydrological process was larger when the precipitation center occurred in the area where the built-up land is concentrated (Figure 9A). The change of the runoff coefficient formed by the precipitation center in different regions was ZY > GC > EQ. Zhengzhou’s LU was ZY > GC > EQ during 1998–2013. When precipitation was concentrated in areas with large changes in land use, the runoff coefficient changed more (Figure 9B). It is manifested as that the runoff coefficient is related to the distribution of built-up land and its change is related to the distribution of land use. When the precipitation is concentrated in the built-up area, the runoff coefficient increases as the amount of filling and infiltration decreases. When precipitation is concentrated in areas with large changes in land use, the amount of infill and infiltration also varies greatly, leading to an increase in runoff coefficient.
Under the condition of similar precipitation distribution, the influence of land use change on the runoff peak of heavy rain group is greater than that of rain group. The average runoff coefficient of rain group increased by 28.31%. The average runoff coefficient of heavy rain group increased by 32.10%. Under the influence of rain island effect, the frequency of rainstorm increases and it is easier to concentrate in built-up land. This magnified the impact of land use change on runoff in flood season and brought difficulties to the operation of urban drainage system.
Liu [40] used the SWAT model to simulate the daily runoff data of the Zhongmu section of the Jialu River from 1995 to 2008, and found that the land use had an increasing impact on the hydrological process with the urbanization of Zhengzhou. For the same location, Wei [41] used the MIKE model to simulate the daily runoff process in 2004 and 2007, and found that Zhengzhou urbanization had a significant impact on the flood peak. However, the simulation of daily runoff data masks the impact of urbanization on the hydrological process within a few hours, which cannot accurately reflect the impact of urbanization on the hydrological process. Based on systematic analysis of the hourly measured rainfall-runoff data and the impact of regional land use change on urbanization, it is found that when the precipitation is concentrated in the area with fast land use conversion, the peak lag and runoff coefficient change greatly. Flood peaks change greatly when precipitation is concentrated in areas with large changes in built-up land, and runoff coefficient increases with precipitation concentrating in areas where build up is the main land use type. The impact of land use change on the hydrological process is more pronounced in extreme precipitation. The probability of occurrence of extreme precipitation increases under the influence of the rain island effect that can amplify the impact of land use change on the hydrological process during the flood season and cause urban floods.

3.3. Impact of Urbanization on Hydrological Processes

The flood was simulated for the data of nine precipitation processes in 1998 and 2003. The values of CN are shown in Table 8 and the simulation results are shown in Table 9. It can be seen from Table 9 that the errors of the simulated runoff and the calculated runoff are both less than 20%, indicating that the SCS model can better simulate the precipitation hydrological process in Zhengzhou.
In order to study the impact of land use on the hydrological process, it is necessary to control the conditions such as rainfall and soil moisture in the early stage. Therefore, the precipitation data of 2003082520 was selected to calculate the runoff under normal (AMC II) conditions in 1998, 2003, 2008, and 2013, respectively. The distribution of regional CN values is shown in Figure 10, the simulation results are shown in Table 10. The runoff distribution of different land uses is shown in Table 11 and the runoff distribution of different districts is shown Table 12 and Figure 11.
On the city scale, the total runoff of Zhengzhou showed an increasing trend from 1998 to 2013, with grassland, agricultural land and built-up land as the main ones. The continuous increase of built-up land runoff makes it the largest land use type of runoff, indicating that the land use change caused by urbanization leads to the significant increase in regional runoff. Among them, the runoff of water bodies increased by 75.19%, the runoff of built-up increased significantly, with a proportion 161.30%, and the runoff of forest, agricultural land and grass decreased, which was mainly related to the increase and decrease of land use area. The five years in 2003–2008 manifested the largest change in total runoff, with an increase of 4.05%. During this period, the runoff of water areas and built-up land increased by 37.14% and 57.40% respectively, and the runoff of forest, grass, and agricultural land decreased to varying degrees. It shows that the tendency of runoff change in urbanization is mainly affected by the change of built-up land. The increase of built-up land can reduce the amount of infill and infiltration and increase the surface runoff.
On the regional scale, the runoff in each region from 1998 to 2013 was: JS > HJ > ZY > GC > EQ. The area of each administrative district is: JS > HJ > GC > ZY > EQ. Regional runoff is mainly affected by the area, that is, the larger the area, the greater the runoff. However, in ZY and GC with similar areas, land use distribution has become the major factor affecting runoff. From 1998 to 2013, the runoff in ZY with a relatively large distribution of built-up land was greater than the runoff in GC, a relatively small distribution of built-up land. This shows that the runoff of the areas with concentrated built-up land is greater under similar rainfall. From 2003 to 2008, the runoff in ZY was greater than that in GC and the LU changed the most, which shows that as spatial distribution of land use change increased, runoff change also increased under similar rainfall.
In summary, the runoff change trend on the city scale is mainly affected by changes of built-up land, which is the surface runoff increases with the expansion of built-up land. On the regional scale, regional runoff is mainly affected by the area. The larger the area, the greater the runoff. With similar areas, land use distribution becomes the major factor affecting runoff. The amount of runoff is related to the distribution of built-up land, and the change of runoff is related to the spatial distribution of land use. Under similar rainfall and area, the larger the runoff generated in the concentrated area of built-up land, the more the runoff variation with the land use change.
Wang et al. [39] used the SCS model to simulate the long-term rainfall and runoff data of Zhengzhou from 1995 to 2015 and found that land use change and sewage discharge were the main reasons for the increase in total runoff. We further analyzed the impact of land use change on the hydrological process on the basis of it, which found that the trend of runoff change in Zhengzhou on the city scale is mainly affected by changes in built-up land. On the regional scale, the regional runoff is mainly affected by the area. In the case of similar areas, runoff increases with the increase in built-up land. The greater the change in built-up land, the greater the change in runoff.

4. Conclusions

The impact of urbanization on the hydrological process with Zhengzhou as an example was discussed in the study. In the process of rapid urbanization, changes in regional land use, especially the distribution of built-up land, have a huge impact on the distribution of the rain island effect. The rain island effect is more apparently in areas where built-up land is relatively concentrated. When the precipitation is concentrated in the area where the distribution of land use changes greatly. The transformation speed of other land to built-up is accelerated, the faster the corresponding drainage pipe network is constructed in the built-up area, the earlier the flood peak appears. When the precipitation is concentrated in the area where the built-up expands faster, the speed of impermeable surface replacing permeable surface increases faster, the infiltration rate decreases and the speed changes, and the increase of flood peak is more obvious. Runoff coefficient is related to the distribution of built-up, and its change is related to the spatial distribution of land use. When the precipitation is concentrated in the area with more built-up, the infiltration amount decreases and the runoff coefficient is large. When the precipitation is concentrated in the area with great land use change, the faster the conversion of other land to built-up, the greater the change of runoff coefficient. By analyzing the hydrological process with similar spatial distribution of rainfall, land use change is more significant under heavy rain. Affected by the rain island effect, the frequency of heavy rain increases in the areas where built-up is concentrated, which increases the flood control pressure in the areas where built-up is the main use type and land use changes greatly.
The SCS model was used to simulate runoff of different land use types in different periods, and it was found that land use distribution was the main factor affecting runoff in the case of similar area and precipitation conditions. The runoff increased with the increase of built-up. The change of runoff increases with the change of spatial distribution of land use. Compared with 1998, the built-up area in 2012 increased by 161.30%, and the runoff increased by 8.49%. The main increment of runoff is located in the area with large land use change and built-up concentrated. Under the influence of rain island effect, the heavy rain is mostly concentrated in the area where built-up is the main land use type. Therefore, these areas are more at risk of flood than other areas, so we should pay attention to the construction of flood control facilities in these areas. Appropriate low-impact development measures should be developed in areas with strong rain-island effects to cope with post-urbanization hydrological processes.

Author Contributions

Conceptualization, C.H.; methodology, C.H., J.W. and B.M.; software, J.W.; validation, C.H., B.M. and J.W.; formal analysis, C.H., J.W.; investigation, C.H., J.W.; resources, C.H.; data curation, C.H., X.M. and J.W.; writing—original draft preparation, C.H., J.W.; writing—review and editing, C.H.; supervision, C.H., B.M.; project administration, C.H.; funding acquisition, C.H. All authors contributed to the final version of the manuscript. All authors have read and agreed to the published version of the manuscript.

Funding

This research was funded by Key projects of National Natural Science Foundation of China, grant number 51739009, National Key Research Priorities Program of China, grant number 2016YFC040240203, National Natural Science Foundation of China, grant number 51979250.

Acknowledgments

We would like to thank the reviewers very much for their valuable comments and suggestions. We also thank our other colleagues for their valuable comments and suggestions that have helped improve the manuscript.

Conflicts of Interest

The authors declare no conflict of interest.

References

  1. Huff, F.A.; Changnon, S.A. Precipitation Modification by Major Urban Areas. J. Bull. Am. Meteorol. Soc. 1973, 54, 1220–1232. [Google Scholar] [CrossRef]
  2. Chen, Y.; Pan, L.; Zhang, T. Impact of Urbanization on Hydrological Processes: A Case Study of Xinji River in Southern China. In Proceedings of the World Environmental and Water Resources Congress, Minneapolis, MN, USA, 3–7 June 2018; pp. 321–329. [Google Scholar]
  3. Burns, D.; Vitvar, T.; McDonnell, J.; Hassett, J.; Duncan, J.; Kendall, C. Effects of suburban development on runoff generation in the Croton River basin, New York, USA. J. Hydrol. 2005, 311, 266–281. [Google Scholar] [CrossRef]
  4. Li, C.; Liu, M.; Hu, Y.; Shi, T.; Zong, M.; Walter, M. Assessing the Impact of Urbanization on Direct Runoff Using Improved Composite CN Method in a Large Urban Area. Int. J. Environ. Res. Public Health 2018, 15, 775. [Google Scholar] [CrossRef] [Green Version]
  5. Boru, G.F.; Gonfa, Z.B.; Diga, G.M. Impacts of climate change on stream flow and water availability in Anger sub-basin, Nile Basin of Ethiopia. J. Sustain. Water Res. Manag. 2019, 5, 1755–1764. [Google Scholar] [CrossRef]
  6. Shrestha, B.; Cochrane, T.A.; Caruso, B.S.; Arias, M.E.; Piman, T. Uncertainty in flow and sediment projections due to future climate scenarios for the 3S Rivers in the Mekong Basin. J. Hydrol. 2016, 540, 1088–1104. [Google Scholar] [CrossRef]
  7. Huyen, N.T.; Tram, V.N.Q.; Minh, D.N.; Liem, N.D.; Loi, N.K. Assessing the impacts of climate change on water resources in the Srepok watershed, Central Highland of Vietnam. J. Water Clim. Chang. 2017, 8, 524–534. [Google Scholar] [CrossRef] [Green Version]
  8. F1eming, J.R. Joseph Fourier, the ‘greenhouse effect’, and the quest for a universal theory of terrestrial temperatures. Endeavour 1999, 23, 72–75. [Google Scholar] [CrossRef]
  9. Broecker, W. Climatic change: Are we on the brink of a pronounced global warming. Science 1975, 189, 460–463. [Google Scholar] [CrossRef] [Green Version]
  10. Zhang, J.; Wang, Y.; He, R.; Hu, Q.; Song, X. Analysis of Urban Flood and Its Causes in China. Adv. Water Sci. 2016, 7, 485–491. [Google Scholar]
  11. Oni, S.K.; Futter, M.N.; Buttle, J.; Dillon, P. Hydrological footprints of urban developments in the Lake Simcoe watershed, Canada: A combined paired-catchment and change detection modelling approach. Hydrol. Process. 2015, 29, 1829–1843. [Google Scholar] [CrossRef]
  12. Huang, J.; Cheng, S.; Wen, J.; Lee, J. Effect of growing watershed imperviousness on hydrograph parameters and peak discharge. Hydrol. Process. 2008, 22, 2075–2085. [Google Scholar] [CrossRef]
  13. Sertel, E.; Imamoglu, M.Z.; Cuceloglu, G.; Erturk, A. Impacts of Land Cover/Use Changes on Hydrological Processes in a Rapidly Urbanizing Mid-latitude Water Supply Catchment. Water 2019, 11, 1075. [Google Scholar] [CrossRef] [Green Version]
  14. Mustafa, A.; Szydłowski, M. The Impact of Spatiotemporal Changes in Land Development (1984–2019) on the Increase in the Runoff Coefficient in Erbil, Kurdistan Region of Iraq. Remote Sens. 2020, 12, 1302. [Google Scholar] [CrossRef] [Green Version]
  15. Souma, K.; Tanaka, K.; Suetsugi, T.; Sunada, K.; Tsuboki, K.; Shinoda, T.; Wang, Y.; Sakakibara, A.; Hasegawa, K.; Moteki, Q.; et al. A comparison between the effects of artificial land cover and anthropogenic heat on a localized heavy rain event in 2008 in Zoshigaya, Tokyo, Japan. J. Geophys. Res. Atmos. 2013, 118, 600–610. [Google Scholar] [CrossRef]
  16. Shem, W.; Shepherd, M. On the impact of urbanization on summertime thunderstorms in Atlanta: Two numerical model case studies. Atmos. Res. 2009, 92, 172–189. [Google Scholar] [CrossRef]
  17. Miao, S.; Chen, F.; Li, Q.; Fan, S. Impacts of Urban Processes and Urbanization on Summer Precipitation: A Case Study of Heavy Rainfall in Beijing on 1 August 2006. J. Appl. Meteorol. Climatol. 2011, 50, 806–825. [Google Scholar] [CrossRef]
  18. Mote, T.L.; Lacke, M.C.; Shepherd, J.M. Radar signatures of the urban effect on precipitation distribution: A case study for Atlanta, Georgia. J. Geophys. Res. Lett. 2007, 34, 1–4. [Google Scholar] [CrossRef]
  19. Rounsevell, M.D.A.; Reginster, I.; Araújo, M.B.; Carter, T.R.; Dendoncker, N.; Ewert, F.; Housem, J.I.; Kankaanpääm, S.; Leemans, R.; Metzger, M.J.; et al. A coherent set of future land use change scenarios for Europe. Agricul. Ecosyst. Environ. 2005, 114, 57–68. [Google Scholar] [CrossRef]
  20. Saifullah, M.; Li, Z.; Li, Q.; Zaman, M.; Hashim, S. Quantitative Estimation of the Impact of Precipitation and Land Surface Change on Hydrological Processes through Statistical Modeling. Adv. Meteorol. 2016, 2016, 1–15. [Google Scholar] [CrossRef] [Green Version]
  21. Bhaduri, B.; Harbor, J.; Engel, B.; Grove, M. Assessing Watershed-Scale, Long-Term Hydrologic Impacts of Land-Use Change Using a GIS-NPS Model. Environ. Manag. 2000, 26, 643–658. [Google Scholar] [CrossRef]
  22. Remondi, F.; Burlando, P.; Vollmer, D. Exploring the hydrological impact of increasing urbanisation on a tropical river catchment of the metropolitan Jakarta, Indonesia. Sustain. Cities Soc. 2016, 20, 210–221. [Google Scholar] [CrossRef]
  23. Zampella, R.A.; Procopio, N.A.; Lathrop, R.G.; Dow, C.L. Relationship of land-use/land-cover patterns and surface-water quality in the Mullica River basin. J. Am. Water Res. Assoc. 2007, 43, 594–604. [Google Scholar] [CrossRef]
  24. Hibbs, B.J.; Sharp, J.M. Hydrogeological impacts of urbanization. Environ. Eng. Geosci. 2012, 18, 3–24. [Google Scholar] [CrossRef]
  25. Zhou, F.; Xu, Y.P.; Chen, Y.; Xu, C.Y.; Gao, Y.Q.; Du, J.K. Hydrological response to urbanization at different spatio-temporal scales simulated by coupling of CLUE-S and the SWAT model in the Yangtze River Delta region. J. Hydrol. 2013, 485, 113–125. [Google Scholar] [CrossRef]
  26. Angrill, S.; Petit-Boix, A.; Morales-Pinzón, T.; Josa, A.; Rieradevall, J.; Gabarrell, X. Urban rainwater runoff quantity and quality–a potential endogenous resource in cities. J. Environ. Manag. 2017, 189, 14–21. [Google Scholar] [CrossRef] [Green Version]
  27. Fletcher, T.D.; Andrieu, H.; Hamel, P. Understanding, management and modelling of urban hydrology and its consequences for receiving waters: A state of the art. Adv. Water Res. 2013, 51, 261–279. [Google Scholar] [CrossRef]
  28. Olang, L.O.; Furst, J. Effects of land cover change on flood peak discharges and runoff volumes: Model estimates for the Nyando River basin, Kenya. Hydrol. Process. 2011, 25, 80–89. [Google Scholar] [CrossRef]
  29. Lerner, D.N. Identifying and quantifying urban recharge: A review. Hydrogeol. J. 2002, 10, 143–152. [Google Scholar] [CrossRef]
  30. Mejía, A.I.; Moglen, G.E. Impact of the spatial distribution of imperviousness on the hydrologic response of an urbanizing basin. Hydrolog. Process. 2010, 24, 3359–3373. [Google Scholar] [CrossRef]
  31. Oudin, L.; Salavati, B.; Furusho-Percot, C.; Ribstein, P.; Saadi, M. Hydrological impacts of urbanization at the catchment scale. J. Hydrol. 2018, 559, 774–786. [Google Scholar] [CrossRef] [Green Version]
  32. Guan, M.; Sillanpää, N.; Koivusalo, H. Storm runoff response to rainfall pattern, magnitude and urbanization in a developing urban catchment. Hydrol. Process. 2016, 30, 543–557. [Google Scholar] [CrossRef]
  33. Isik, S.; Kalin, L.; Schoonover, J.E.; Srivastava, P.; Lockaby, B.G. Modeling effects of changing land use/cover on daily streamflow: An artificial neural network and curve number based hybrid approach. J. Hydrol. 2013, 485, 103–112. [Google Scholar] [CrossRef]
  34. Sajjad, R.U.; Kim, K.J.; Memon, S.; Sukhbaatar, C.; Paule, M.C.; Lee, B.Y.; Lee, C.H. Characterization of stormwater runoff from a light rail transit area. Water Environ. Res. 2015, 87, 813–822. [Google Scholar] [CrossRef] [PubMed]
  35. Zhang, B.A.; Xie, G.D.; Zhang, C.Q.; Zhang, J. The economic benefits of rainwater-runoff reduction by urban green spaces: A case study in Beijing, China. J. Environ. Manag. 2012, 100, 65–71. [Google Scholar] [CrossRef]
  36. Li, C.; Liu, M.; Hu, Y.; Shi, T.; Qu, X.; Walter, M.T. Effects of urbanization on direct runoff characteristics in urban functional zones. Sci. Total Environ. 2018, 643, 301–311. [Google Scholar] [CrossRef]
  37. Wang, X.; Dong, G.; Mao, H. The Urban Development Process and Its Feature of Zhengzhou. Areal Res. Dev. 2005, 6, 47–51. [Google Scholar]
  38. Wu, L. Research on the Sponge City Construction of Zhengzhou Based on the Change of Land Use Type. Master’s Thesis, Henan University of Economics and Law, Zhengzhou, China, 2017. [Google Scholar]
  39. Wang, H.; Wu, Z.; Sun, R. The influence of urbanization in Zhengzhou on the hydrological process of the Jialu river basin. Sci. Technol. Eng. 2017, 17, 316–321. [Google Scholar]
  40. Liu, Y. Study on the Hydrological Response of Zhengzhou Urbanization in the Jialu River Basin. Master’s Thesis, Tsinghua University, Beijing, China, 2010. [Google Scholar]
  41. Wei, H. Study on Runoff Evolution and its Influencing Mechanism in Urban Rivers. Ph.D. Thesis, Xi’an University of Technology, Xi’an, China, 2018. [Google Scholar]
  42. Zheng, Z.; Gao, H.; Wang, Z.; Li, Q. Analysis of precipitation spatial distribution and urban effect in Beijing. Plateau Meteorol. 2014, 33, 522–529. [Google Scholar]
  43. Chen, Y.; Dai, J.; Li, J. Classification of CART decision tree based on image features and its application. Geogr. Geo-Inf. Sci. 2008, 24, 33–36. [Google Scholar] [CrossRef]
  44. Su, Y. Study on the Influence of Urbanization on Rainfall and Runoff-A case Study of Xi’an. Master’s Thesis, Chang’an University, Xi’an, China, 2014. [Google Scholar]
  45. Wang, H. Study on Land Use Change and its Driving Force in Urbanization of Zhengzhou. Master’s Thesis, Henan University, Kaifeng, China, 2017. [Google Scholar]
  46. Thiessen, A.H. Precipitation averages for large areas. Mon. Weather Rev. 1911, 39, 1082–1089. [Google Scholar] [CrossRef]
  47. Bao, W. Hydrological Forecast, 4th ed.; China Water and Power Press: Beijing, China, 2006; pp. 27–29. [Google Scholar]
  48. Soulis, K.X.; Valiantzas, J.D. ldentification of the SCS-CN Parameter Spatial Distribution Using Rainfall- Runoff Data in Heterogeneous Watersheds. Water Res. Manag. 2013, 27, 1737–1749. [Google Scholar]
  49. Soulis, K.X.; Valiantzas, J.D. SCS-CN parameter determination using rainfall-runoff data in heterogeneous watersheds-The two-CN system approach. Hydrol. Earth Syst. Sci. 2012, 16, 1001–1015. [Google Scholar] [CrossRef] [Green Version]
  50. Li, C.; Qing, J.; Li, J. Application of Computational Curve Number to Precipitation-runoff Simulation in a Typical Watershed in Chinese Loess Plateau. J. Arid Land Res. Environ. 2008, 22, 67–70. [Google Scholar]
  51. China Meteorological Administration. GB/T28592-2012 Precipitation Grade Standard; China Standard Press: Beijing, China, 2012. [Google Scholar]
  52. Zhou, C.; Ren, S.; Yang, P.; Bao, Z. Study on the influence of urbanization on rainfall characteristics. Water Res. Hydropower Eng. 2007, 38, 62–65. [Google Scholar]
  53. Cao, K.; Ge, Z.; Xue, M.; Song, Y. Analysis of rain island effect and its changing trend in Shanghai urban area. Water Res. Power 2009, 27, 31–33. [Google Scholar]
  54. Yin, J.; Liang, S. The influence of urbanization on regional precipitation in Shanghai. J. China Hydrol. 2010, 30, 66–72. [Google Scholar]
  55. Jiao, J.; Wu, Y.; Li, Z. The influence of urbanization on the rain island effect in Laoshan district, Qingdao. Water Res. Power 2013, 31, 26–28. [Google Scholar]
  56. Hu, Q.; Zhang, J.; Wang, Y.; Huang, Y.; Liu, Y.; Li, L. A review of urbanization impact on precipitation. J. Adv. Water Sci. 2018, 29, 138–150. [Google Scholar]
  57. Zhou, C. Study on the Influence of Urbanization on Hydrologic Factors in Beijing. Master’s Thesis, China Agricultural University, Beijing, China, 2007. [Google Scholar]
  58. Zhao, G.; Shi, R.; Pang, B.; Xu, Z.; Du, L.; Chang, X. Study on the influence of rapid urbanization on confluence: A case study of Liangshui river basin. J. Hydroelectr. Eng. 2016, 35, 55–64. [Google Scholar]
  59. Zhao, Y.; Xu, Z.; Zhao, G.; Cheng, T.; Chang, X.; Tan, Q. Study on the impact of urbanization on the confluence of the Xiaoqing river basin in Jinan. J. Hydroelectr. Eng. 2019, 38, 35–46. [Google Scholar]
Figure 1. Location map and rainfall-runoff gauge stations of Zhengzhou. (A) Inset map showing the location of Henan province in China; (B) Location of Zhengzhou in Henan province; (C) Location of Zhengzhou and distribution of rainfall-runoff gauge stations.
Water 12 01870 g001
Figure 2. Flow chart of data and the applied methodology.
Water 12 01870 g002
Figure 3. The proportion of population (A) and urban population and the Mann–Kendall test statistics of population urbanization rate (B) in Zhengzhou from 1978 to 2018.
Water 12 01870 g003
Figure 4. Land use classification of Zhengzhou.
Water 12 01870 g004
Figure 5. (A) Precipitation center of rain in 1971–1998, (B) Precipitation center of rain in 1999–2012, (C) Precipitation center of heavy rain in 1971–1998, (D) Precipitation center of heavy rain in 1999–2012.
Water 12 01870 g005
Figure 6. (A) Relationship between slope and precipitation center distribution during the slow urbanization period, (B) relationship between built-up and precipitation center distribution during the accelerated urbanization period.
Water 12 01870 g006
Figure 7. Hydrographs and hyotograms (mm/h) on (A) group of rain: 31 May–2 June 1998, precipitation center in EQ, and 22–24 July 2006, precipitation center in EQ, (B) group of heavy rain: 3–7 July 1988, precipitation center in EQ, and 19–25 August 2012, precipitation center in EQ.
Water 12 01870 g007
Figure 8. (A) Relationship between LU and change of peak lag, (B) relationship between built-up and change of peak.
Water 12 01870 g008
Figure 9. (A) Relationship between built-up and runoff coefficient, (B) relationship between LU and change of runoff coefficient.
Water 12 01870 g009
Figure 10. CN distribution in different regions in different periods.
Water 12 01870 g010
Figure 11. Runoff from SCS model in different regions in different periods (106 m3).
Water 12 01870 g011
Table 1. Station Information Distribution Statistics.
Administrative DistrictArea (km2)Rainfall Station (Amount)Hydrological Station (Amount)PeriodTotal (Amount)Station Density (km2/amount)
JS235.0501971–2012547.00
EQ157.21001971–20121015.72
HJ220.2201971–20122110.12
GC198.2301971–2012366.06
ZY197.4301971–2012365.79
Suburbs6438.0811971–20159715.33
Zhengzhou7446.031132232.69
Note: JS denotes Jinshui District, EQ denotes Erqi District, GC denotes Guancheng District, ZY denotes Zhongyuan District, HJ denotes Huiji District.
Table 2. Areas of different land use patterns in Zhengzhou from 1993 to 2013 (km2).
Land UseYear
19931998200320082013
Water Bodies4.953.874.075.566.78
Forest8.738.577.945.192.52
Grass329.61313.57273.53195.12153.83
Agricultural Land532.60528.90515.14474.48441.13
Built-up134.41155.39209.61329.95406.04
Table 3. Land Use Transfer Matrix of Zhengzhou from 1993 to 2013 (km2).
2013SumTransfer Out
Land UseWater BodiesForestGrassAgricultural LandBuilt-Up
1993Water Bodies4.92 0.030.01 4.950.04
Forest 1.880.070.106.688.736.85
Grass1.070.02137.7213.93178.27331.02193.30
Agricultural Land0.690.029.05431.5290.91532.19100.67
Built-up 0.230.02134.15134.410.26
Sum 6.681.92147.11445.58410.021011.30
Transfer into 1.760.049.3814.06275.87
Table 4. Precipitation intensity in different periods.
Maximum Precipitation in 1 hRainfall Intensity1971–1998 (a)1998–2012 (a)
0.1 mm < P < 1.5 mmlight rain14
1.6 mm < P < 6.9 mmrain1415
7.0 mm < P < 14.9 mmheavy rain1415
15.0 mm < P < 39.9 mmrainstorm28
40.0 mm < P < 49.9 mmheavy rainstorm02
Sum3144
Note: P is precipitation; a is the amount of precipitation.
Table 5. Peak lag statistics.
1971–19981999–2012
GroupPrecipitation CenterLU (1998–2013)Mean Peak Lag (h)Mean Peak Lag (h)Change Rate
RainZY0.47%2617−34.62%
GC0.44%2316−30.67%
EQ0.23%2518−26.40%
Mean0.38%2517−30.56%
Heavy rainZY0.47%2415−37.50%
GC0.44%2115−31.60%
EQ0.23%2417−29.24%
Mean0.38%2316−31.77%
Zhengzhou0.38%2416−31.08%
Table 6. Flood peak statistics.
1971–19981999–2012
GroupPrecipitation CenterChanges of Built-UpMean Peak (m3/s)Mean Peak (m3/s)Change Rate
RainGC424.13%58.673.425.26%
ZY170.20%54.363.817.50%
EQ99.54%46.552.011.83%
Mean231.29%46.555.418.19%
Heavy rainGC424.13%65.184.329.49%
ZY170.20%58.671.221.50%
EQ99.54%54.863.716.24%
Mean231.29%53.866.722.41%
Zhengzhou231.29%54.966.320.00%
Table 7. Statistics of runoff coefficient.
1971–19981999–2012
GroupPrecipitation CenterLUBuilt-Up (km2)Mean Runoff CoefficientBuilt-Up (km2)Mean Runoff CoefficientChange Rate
RainZY0.47%38.260.20103.390.2632.00%
GC0.44%7.970.1941.800.2530.21%
EQ0.23%55.580.22110.910.2722.73%
Mean0.38%33.940.2085.370.2628.31%
Heavy rainZY0.47%38.260.17103.390.2435.06%
GC0.44%7.970.1641.800.2233.54%
EQ0.23%55.580.18110.910.2427.72%
Mean0.38%33.940.1785.370.2332.10%
Zhengzhou0.38%33.940.1985.370.2529.94%
Table 8. CN.
Table 8. CN.
Hydrological Soil GroupForestGrassAgricultural LandWater BodiesBuilt-Up
AAMC I1622549853
AMC II2641599874
AMC III5262789888
BAMC I3542589872
AMC II5763789887
AMC III7781909896
CAMC I5156729878
AMC II7477879892
AMC III8790969897
DAMC I6065779884
AMC II8083909895
AMC III9394989898
Note: A is thick sand, thick loess, aggregated silt soil group; B is thin layer loess and sandy loam group; C is sandy clay loam group; D is clay loam, silt clay loam, sand clay, silt clay, clay group; AMC I represents soil drought, but did not reach plant wilting point; AMC II represents the average condition of the river basin when flooding occurs; AMC III represents heavy rain, light rain or low temperature in the first 5 days, and the soil moisture is almost saturated.
Table 9. Rainfall-runoff simulation.
FloodP (mm)RC (mm)RS (mm)QC (106 m3)QS (106 m3)Relative Error (%)
199805310651.891.931.821.951.84−5.56%
199807070245.7116.4418.5516.6118.7412.86%
199807120031.424.985.075.035.121.73%
199807151639.758.259.238.349.3311.85%
199808140437.819.138.189.228.27−10.34%
199808210922.8312.0111.8112.1311.93−1.63%
200306291481.6946.0652.6846.5453.2214.36%
2003082520178.67125.88111.13127.17112.28−11.71%
200309281748.7119.3922.9819.5923.2118.51%
Note: RC represents the runoff depth calculated from measured data; RS is the runoff depth simulated by the SCS model; QC represents the runoff calculated from measured data; QS is the runoff simulated by the SCS model.
Table 10. Rainfall-runoff simulation.
FloodP (mm)RC (mm)RS (mm)QC (106 m3)QS (106 m3)Relative Error (%)
199805310651.891.931.821.951.84−5.56%
199807070245.7116.4418.5516.6118.7412.86%
199807120031.424.985.075.035.121.73%
199807151639.758.259.238.349.3311.85%
199808140437.819.138.189.228.27−10.34%
199808210922.8312.0111.8112.1311.93−1.63%
200306291481.6946.0652.6846.5453.2214.36%
2003082520178.67125.88111.13127.17112.28−11.71%
200309281748.7119.3922.9819.5923.2118.51%
Note: RC represents the runoff depth calculated from measured data; RS is the runoff depth simulated by the SCS model; QC represents the runoff calculated from measured data; QS is the runoff simulated by the SCS model.
Table 11. Runoff from SCS model of different land uses in different periods (106 m3).
YearWater BodiesForestGrassAgricultural LandBuilt-UpSum
19980.670.6628.8565.2121.98117.38
20030.700.6125.1763.5129.65119.65
20080.960.4017.9558.5046.67124.49
20131.170.1914.1654.3957.44127.35
Table 12. Runoff from SCS model in different districts in different periods (106 m3).
DistrictArea (km2)1998200320082013
JS235.027.6328.1929.2529.78
HJ220.225.4025.8026.4326.80
GC198.222.2922.5823.7724.97
ZY197.423.1724.7125.2525.71
EQ157.218.4118.8319.4519.72

