Abstract
Soil moisture is closely related to the hydrosphere, atmosphere, and biosphere, which makes it one of the most significant climate variables. Using data from the National Environmental Forecasting Center (NCEP), this paper analyzes the temporal and spatial characteristics of soil moisture at a depth of 0–10 cm in China for the period of 1948 to 2014. In addition, the soil moisture’s possible interaction with air temperature is explored. Mainly using statistical analysis, the results showed that annual soil moisture decreased significantly (p < 0.01) in most areas. The tendency of decreasing soil moisture was relatively higher in spring and autumn than that in summer and winter. As to the national annual average soil moisture, there was a sudden change in the 1970s. The soil moisture had a relatively high value with a larger deviation before the abrupt change, but after that, the soil moisture was at a relatively low level with a smaller deviation. It was also found that the soil moisture at 0–10 cm showed a negative correlation with the 2-m air temperature above ground in the northern part of China, where the speed of the temperature rise was higher. The results are expected to help improve the understanding of the link between regional soil moisture variation and climate change.
1. Introduction
Soil moisture is a key variable of the climate system [1], as well as an important variable in biogeochemical cycles, connecting the atmosphere, hydrosphere, and biosphere [2,3,4,5]. Soil moisture can alter the transmission and distribution of water and energy on land surfaces by changing surface evapotranspiration, albedo, and soil thermal capacity. Consequently, this causes a change in atmospheric circulation, eventually resulting in a climate anomaly [6]. Soil water content is a significant part of the water cycle, and a small change in soil water content can greatly impact the hydrosphere, especially in arid and semiarid areas [6,7,8]. Furthermore, the combined effects from soil interflow, surface runoff, and soil infiltration reflect the changes in soil moisture, which is involved in the evaporation and precipitation process of surface hydrological cycling [9]. Soil moisture, being the main variable in the earth and biosphere interface and its biochemical cycle, is essential in the study of many other relevant issues, such as food security, human health, and ecosystem function [10,11].
On a global scale, soil moisture is in second place among the essential climate variables, with sea surface temperature (SST) coming in the first place. However, on land, the influence of soil moisture is even greater than SST [9]. Chahine pointed out that 65% of precipitation on land comes from surface evapotranspiration, with only 35% transported from the sea surface [9]. Soil moisture variation can cause changes in precipitation, namely, when soil moisture increases, precipitation increases; otherwise, it decreases [1,12]. However, soil moisture is also affected by atmospheric precipitation to a certain extent, and the interaction between these two variables is compact and complex. Changes in soil moisture are usually accompanied by changes in air temperature, and soil moisture and air temperature usually show a negative correlation [13,14]. Soil moisture is also closely related to events such as monsoon circulation [15] and extreme heatwaves [6] and significantly impacts agricultural production. Being the most effective and direct source of water for crops, soil moisture is an important parameter of drought evaluation, which is another crucial factor affecting crop growth and ultimate yields. Its spatial distribution is especially meaningful to drought forecasting, vegetation regionalizing, agricultural production, and agricultural decision-making.
Soil moisture alters the energy transfer between the atmosphere and land surface, particularly the sensible heat and latent heat transfers. By changing land surface properties, it alters the exchange of vapor and momentum [16]. Soil moisture not only directly affects land surface temperature and near-surface air temperature, but it also affects local and regional climate. Therefore, it is of great theoretical and practical value to study soil moisture variation and to understand the interaction of meteorological factors of climate systems, plant growth, crop yield formations, and disaster prevention and mitigation.
Previous research has normally focused on regional soil moisture variation in a short time. Cho and Choi studied the temporal stability of soil moisture in the Korean peninsula in the growing season [12]. Zuo and Zhang found that there was significant sensitivity of the summer rainfall to soil moisture change from the Yangtze River valley to North China via model simulation of recent decades [13]. Su et al. studied the soil moisture variations from 1988 to 2013 in the Tarim River basin in China [17]. Moreover, there is a lack of long-term systematic studies of soil moisture variation in China. Meanwhile, the increased warming of China over recent decades has been observed; moreover, northern China is warming faster than southern China [18]. It is meaningful to establish a connection between soil moisture and air temperature and explain the possible reasons.
The global average soil moisture has decreased remarkably, and the soil drying trend is attributed to rising temperatures [2]. It is true that precipitation has a dominant effect on the variability of soil moisture at interannual to decadal time scales [19]; however, compared to temperature, the long-term variability of precipitation is not significant [3]. Many studies have focused on analyzing the effect of climate warming on soil moisture [3,8] and paid little attention to the feedback effect of soil moisture change on climate warming. Since human activities have a significant impact on soil moisture, the affected soil moisture will, in turn, have an impact on climate [20]. Therefore, it is significant to further explain the impact of soil moisture change on air temperature variation.
Accordingly, the aim of this paper is to explore soil moisture’s interaction with air temperature by investigating the temporal and spatial characteristics of soil moisture change and their correlations and to further analyze the possible reasons for the change. It is hoped that the results of this study will give some insight into the causes of climate change in China.
2. Materials and Methods
2.1. Study Area
For the purpose of this study, China was divided into eight regions, with administrative regions and climate zones were taken into consideration. Figure 1 shows the study area and the partition. The eight regions are northeastern China (NEC), northern China (NC), northwestern China (NWC), southwestern China (SWC), southern China (SC), eastern China (EC), central China (CC), and the Tibetan Plateau area (TP). NEC, NC, and NWC normally have four distinct seasons, and the sunshine duration is long. The winter is relatively cold, dry, and long, and the summer has a relatively high temperature. NEC, CC, and EC are affected by the East Asian monsoon, which brings abundant precipitation in summer. SC and SWC are affected by both East Asian monsoon and the southwest monsoon; they have abundant precipitation most times of the year, and the temperature fluctuation in any one year is normally small. The Tibetan Plateau area has a special terrain, with an average altitude of more than 4000 m. The climate is complex and changeable, and meteorological factors are greatly affected by altitude and terrain. Therefore, TP was excluded when analyzing and discussing the results. Additionally, for Taiwan Island and South Sea area of China, they are geographically small land areas, so they are not discussed in this study. The other seven regions will be mainly focused on in this study.
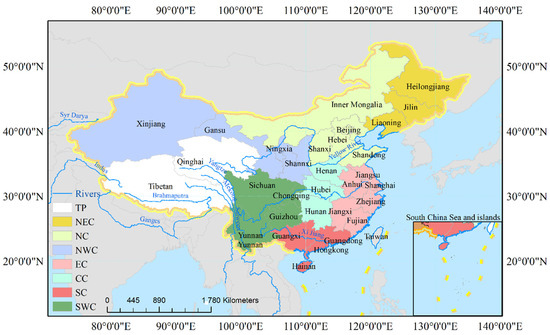
Figure 1.
Location of the study area and its eight partitions.
2.2. Data Resources
NCEP/CAR reanalysis data were used in this paper, which was released in 1996 by the National Environmental Prediction Center (NCEP) and the National Center for Atmospheric Research (NCAR). The NCEP and the NCAR use observational data, forecasting models, and assimilation systems to analyze meteorological data to form grid data of the world, covering the period from 1948 to the present. NCEP1 was the first version to jointly analyze global atmospheric data [21]. It is one of the most popular datasets for analyzing climate change, and it came out at an earlier time than other datasets. Our analysis was based on soil moisture and air temperature datasets from NCEP/NCAR from 1948 to 2014. The resolution was 1.875° × 1.875°, and the time-step was one month. Soil moisture was at a depth of 0–10 cm below the surface, and the air temperature was at 2 m above the ground.
2.3. Data Analysis Methodology
This study firstly extracted the data of specific regions from reanalysis datasets by making a mask of maps for particular areas so the soil moisture and air temperature data in certain regions could be obtained. Then, linear regression and the Mann–Kendall nonparametric test were used to analyze the characteristics of soil moisture variation in the different regions and different seasons. Lastly, the correlation coefficient between soil moisture and air temperature was calculated. To visualize the spatial distribution of soil moisture and the correlation coefficient, ArcGIS10.2 software was used.
2.3.1. Regression Analysis
Use x to represent the soil moisture or air temperature during the period of t, and the amount of data is n, and a linear regression equation between x and time series is established. The regression coefficients (a and b) can be obtained by the least-squares method.
When b is multiplied by 10, the climate tendency rate will be obtained. It measures the tendency of a certain variable in a decade. Additionally, if b is above zero, it means that the trend is increasing. Otherwise, there is a decreasing trend. Soil moisture’s and air temperature’s tendencies were calculated.
2.3.2. Mann–Kendall Nonparametric Test
The Mann–Kendall method is a nonparametric statistical test used to predict the long-term trends of time series data of various meteorological elements such as temperature. The variables do not necessarily have normal distribution characteristics and a few outliers do not affect them so they can be applied to non-normal distribution trend analysis, such as hydrological variables and meteorological elements.
When the time series is described as X1, X2, …, Xn (n for the length of time series), the Mann–Kendall test statistic S is computed as
and the sign function is
and the variance is calculated as
Then, the standard normal test statistic ZS can be computed by
Positive values of ZS indicate increasing trends, while negative ZS values represent decreasing trends. Specific α significance level should be set while testing the trends. When |ZS| > Z1 − α/2, a significant trend exists in the time series, and the null hypothesis is rejected. Z1 − α/2 is calculated from the standard normal distribution table. Usually, significance levels α = 0.01 and α = 0.05 are used. At the 5% significance level, the null hypothesis of no trend is rejected if |ZS| > 1.96 and rejected. At the 1% significance level, |ZS| > 2.576 is rejected [22,23]. The Mann–Kendall statistical test has been frequently used to quantify the significance of trends in hydro-meteorological time series [24].
Here, we used annual soil moisture as the time series, and the length was 67 years. Additionally, we set the significance level at 5%; then, ZS values were calculated to obtain a sequential curve. Then, we reversed the time series to obtain a similar reverse curve. The intersection of the two curves within the significance level is the time of abruption.
2.3.3. Pearson’s Correlation Coefficient Calculation
Pearson’s correlation coefficient calculation is defined as the ratio of the covariance of two variables representing a set of numerical data, normalized to the square root of their variances. Here, we calculated Pearson’s correlation coefficient between soil moisture and air temperature. Soil moisture and air temperature are represented as x and y, and xi and yi are data values at time i, respectively.
indicate the long term mean values of the variables. represents the covariance of x and y. and represent the standard deviations.
2.3.4. Spatial Visualization Tools
ArcGIS10.2 software was used to visualize the spatial distribution of soil moisture and the correlation coefficient. Here, we used Kriging’s interpolation. It is an optimal, linear, and unbiased spatial interpolation method. It was first proposed by South African mining engineer D.G. Krige in 1951 as an interpolation method in geostatistics. After fully considering the relationship between observation data, each observation data is given a certain weight coefficient, and the weighted average is estimated. We used Kriging’s interpolation tool in ArcGIS10.2 software to do the spatial analysis of soil moisture in order to get clear distribution with details.
3. Results
3.1. Spatial Characteristic of Soil Moisture Variation
The distribution of soil moisture in China is displayed in Figure 2. The color bar from dark red to dark blue represents soil moisture value from low to high (0.1–0.4 m3/m3). The annual average soil moisture of China in the 0–10 cm layer between 1948 and 2014 displays a sandwich distribution. The relatively low-value areas are concentrated in the north and northwest China, ranging from the Shandong peninsula to midstream of the Yellow River and extended along the Hexi Corridor to western Xinjiang province. The low-value centers are located in the junction of the Xinjiang and Gansu provinces, while the relatively high-value areas are in the south and northeast China as well as central China. Specifically, in the four seasons, the distributions differ from the annual distribution. In spring, the soil moisture distribution is similar to the annual sandwich distribution, with the low-value center moving towards the east. In summer, the distribution becomes higher in the south and lower in the north. The low-value center is located in the western part of Inner Mongolia, and the high-value center is in south China. There is a notable difference from south to north. In autumn, the pattern is similar to that in summer, but the low-value center moves westward to Xinjiang and Inner Mongolia. Opposite from the pattern in summer and autumn, the soil moisture distribution pattern changes to being lower in the south and higher in the north in winter. Because of climatic features, ice and snow usually cover most areas of northern China in winter, which helps contain the soil water below the frozen surface. However, in the southern part of China, the air temperature is commonly above zero, and it is also the dry season during winter. As a consequence, in winter, the low-value center moves to the lower reaches of the Yellow River region.
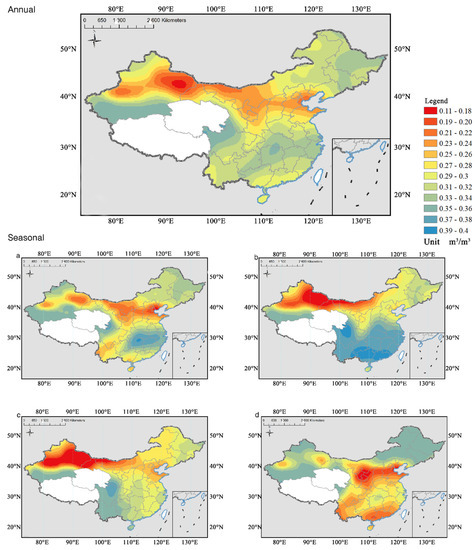
Figure 2.
The distribution of annual soil moisture and seasonal soil moisture in China. (a) Spring; (b) summer; (c) autumn; (d) winter.
3.2. Temporal Characteristic of Soil Moisture Variation
Generally, the annual and seasonal average soil moisture in China between 1948 and 2014 showed a declining trend with fluctuations. Figure 3 shows the interannual variations of soil moisture from 1948 to 2014. The soil moisture decreased significantly (p < 0.01) in all seasons, and the seasonal difference was quite obvious. The decreasing tendency was the greatest in spring (−0.0030 (m3/m3)/10 yr), followed by autumn (−0.0027 m3/m3)/10 yr). The relative higher seasonal average soil moisture appeared in summer (0.3097 m3/m3) and spring (0.3056 m3/m3), and then in winter (0.2939 m3/m3). The soil moisture in autumn was 0.2758 m3/m3, which was 12.3% lower than that in summer.
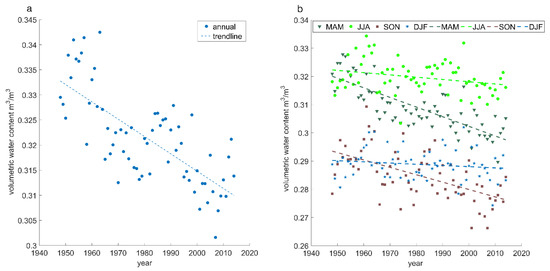
Figure 3.
National interannual variations of soil moisture from 1948 to 2014 in the four seasons. (a) Annual; (b) seasonal. MAM means March, April, and May; JJA means June, July, and August; SON means September, October, and November; DJF means December, January, and February.
The variation of soil moisture showed differences in the seven regions. Figure 4 shows the interannual variation of soil moisture in the seven regions of China.There were large fluctuation amplitudes in CC, NC, and EC. NWC had the lowest average annual soil moisture among the eight regions, which was merely 0.2648 m3/m3, followed by NC, CC, and EC. By contrast, SC had the highest average annual soil moisture, followed by NEC and SWC. Soil moisture was prone to decrease in all the regions except SC. Specifically, soil moisture in SC showed a slight trend to increase that failed to pass the significance test. However, the decrease trends were significant in NC, CC, NEC, and NWC (p < 0.01), and an insignificant drop appeared in EC and SWC. The results indicate that soil moisture in China generally decreased in the last 60 years, but the variation characteristics differed from region to region and from season to season.
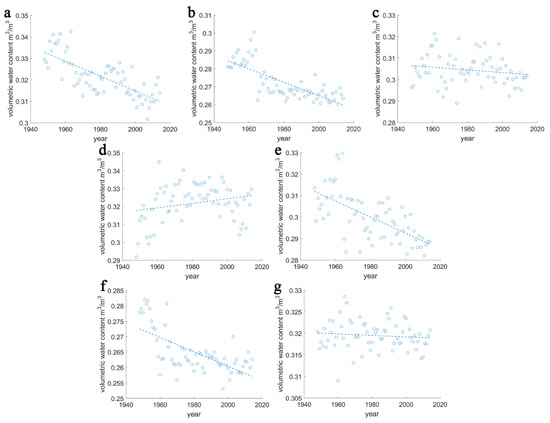
Figure 4.
Interannual variation of soil moisture for 1948 to 2014 in the seven regions of China. (a) Northeastern China (NEC); (b) northern China (NC); (c) eastern China (EC); (d) southern China (SC); (e) central China (CC); (f) northwestern China (NWC); (g) southwestern China (SWC).
In three out of the seven regions, soil moisture shows a trend of a significant decrease in all four seasons. These regions are NEC, NC, and NWC. It is clear that north China has been facing a more severe decline in soil moisture. The tendency rates of soil moisture in the four seasons from 1948 to 2014 in the seven regions of China are listed in Table 1. The soil water deficit also appears in different regions in different seasons. The regions facing the most severe soil moisture decline from 1948–2014 were NWC, NC, and NEC in spring, summer, and autumn, with a decreasing rate of −0.0034, −0.0052, and −0.0050 m3/m3/10 yr, respectively.

Table 1.
Soil moisture variation in different regions of China.
The soil moisture in CC displayed a significant decreasing trend (p < 0.01) in spring and autumn, with the greatest decrease in spring among the eight regions, up to −0.0082 m3/m3/10 yr. There was no significant decreasing trend in summer and winter.
In EC, there was a significant trend in spring and summer. However, soil moisture had a downward trend in spring, with a tendency of 0.0044 m3/m3/10 yr, while it had an upward trend in summer, with a tendency of 0.0023 m3/m3/10 yr. Meanwhile, there was a slight decline in autumn and a slight upward trend in winter.
In SWC, soil moisture showed a significant downward trend only in spring, which was not significant in other seasons. In summer, it showed a weak upward trend, but a slight decline in autumn and winter. SC was the only area where soil moisture showed an increasing trend in all seasons and showed a significant upward trend in summer, with a rate of 0.0034 m3/m3/10 yr; the trend was not significant in the other seasons.
3.3. Mutation Period of Soil Moisture Change
To analyze the mutation time of soil moisture, the Mann–Kendall nonparametric test was used. The intersection of two testing lines represents the mutation time, and the results are displayed in Table 2 and Figure 5. Table 2 shows the trend, average values, and standard deviation values of the soil moisture before and after the mutation. They indicate that the mutation time in most regions took place around the 1970s to 1980s, but in EC, SC, and SWC, the mutation time appeared after the year 2000. As for the national annual soil moisture, the mutation appeared in the late 1980s, and the decreasing trend followed slowly after that. Before the mutation, soil moisture tended to have a relatively high value with a larger deviation, but after the 1980s, the mean value remained at a relatively low level with a smaller deviation. However, in the past two decades, the decreasing trend has been prone to accelerate again. Similarly, in NEC, NC, and NWC, the rate of soil moisture variation changed from a relatively high value to a relatively low value, and their mutation time happened within the 1960–1970 time period. In EC and SWC, soil moisture had a sudden change in the 2000s, when the trend of variation changed from increase to decrease, and the rate of change accelerated. In CC, soil moisture continues to decrease every year but picked up a little speed in and around 1987. SC is the only region where soil moisture has been increasing, with its soil moisture remaining at a high level.
Table 2.
Soil moisture variation trends and mutation time.
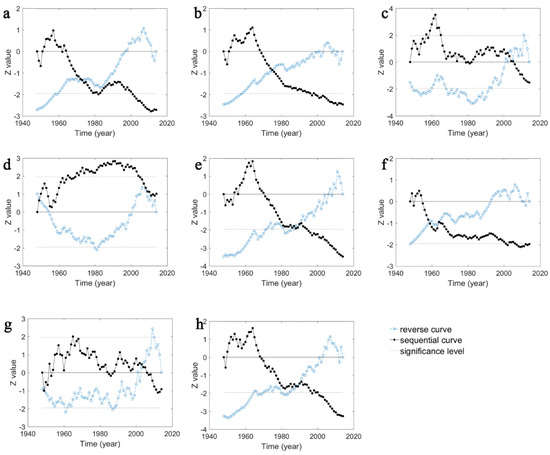
Figure 5.
Mann-Kendall test results of soil moisture variation from 1948 to 2014; (a) NEC; (b) NC; (c) EC; (d) SC; (e) CC; (f) NWC; (g) SWC; (h) the whole country.
3.4. The Relationship between Soil Moisture and Air Temperature
To figure out the possible connection between soil moisture variation and climate change, the correlation coefficient between soil moisture and air temperature was calculated. China’s third national climate change assessment report (2015) pointed out that the speed of rising temperatures in the northern part of China is higher than the national average speed in the past 50 years. This is consistent with the results calculated using the NCAR/NCEP dataset. The interannual variation of air temperature from 1948 to 2014 in seven regions is shown in Figure 6.
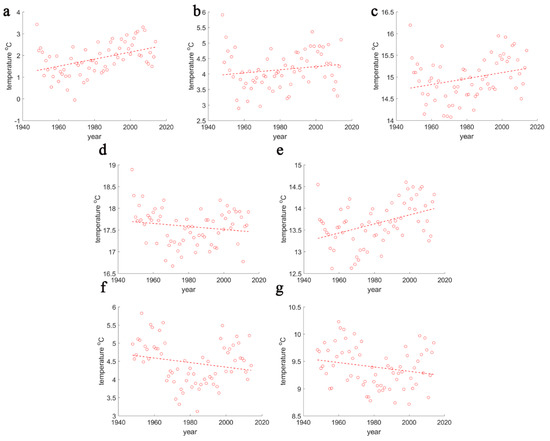
Figure 6.
Inter-annual variation of air temperature for 1948 to 2014 in 7 regions of China. (a) NEC; (b) NC; (c) EC;(d) SC; (e) CC; (f) NWC; (g) SWC.
In NEC, NC, EC, and CC, the air temperature tended to increase; however, in NWC, SC, and SWC, there was an opposite variation tendency. However, if we take only the last 30 years into consideration, the temperature rise is more obvious, and all the regions have an increasing tendency. Moreover, the increasing speed has become faster in recent decades than in the whole study period. Meanwhile, soil moisture declination has been more severe in the northern part of China than in the south. The climate tendencies of soil moisture and air temperature are displayed in Figure 7. The phenomenon of rising temperatures accompanied by decreasing soil moisture is most obvious in NEC, CC, and NEC.
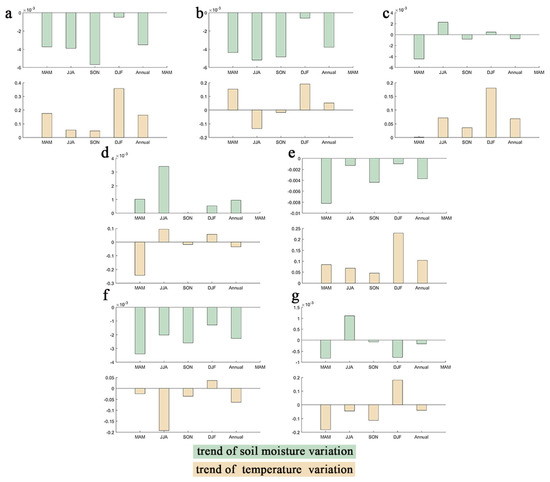
Figure 7.
Seasonal and annual tendencies of soil moisture and air temperature in 7 regions of China. (a) NEC; (b) NC; (c) EC; (d) SC; (e) CC; (f) NWC; (g) SWC.
For most regions, air temperature tended to increase, whereas soil moisture decreased, but it depends on the seasons and regions since China has a vast territory, and different regions have distinct climate patterns. As for EC, CC, and NEC, they are normally affected by the East Asian monsoon, which causes precipitation concentrated in summer and autumn and is accompanied by relatively high temperatures. SC and SWC are affected by both the East Asian monsoon and the South Asian monsoon, so the rainfall’s spatial and temporal distributions are more complicated. NWC and NC have a continental climate, and the precipitation there is mainly influenced by weather processes. Increased precipitation leads to a certain increase in soil moisture. Therefore, the variation of soil moisture is affected by climate patterns, which results in different tendencies in different regions and seasons.
The distribution of the correlation coefficient between annual soil moisture at a depth of 0–10 cm and temperature at 2 m is displayed in Figure 8. The correlation coefficient is closer to 1 when the color was darker, which means a stronger correlation. Red represents a negative correlation, and blue represents a positive correlation. Generally, soil moisture has a negative correlation with air temperature [1]. The distribution shows that there is a strong, negative correlation to NEC, CC, and some parts of NWC and NC. Furthermore, there is a positive correlation in the Hexi Corridor area, where soil moisture is extremely low. The areas where the correlation coefficient passes the significance test of p < 0.05 are marked with cross symbols. The correlation between annual soil moisture and temperature is more significant in the northern part of China. Summer and spring have a stronger correlation, and autumn and winter have a weaker correlation. The annual distribution pattern is more closely to the summer and spring patterns.
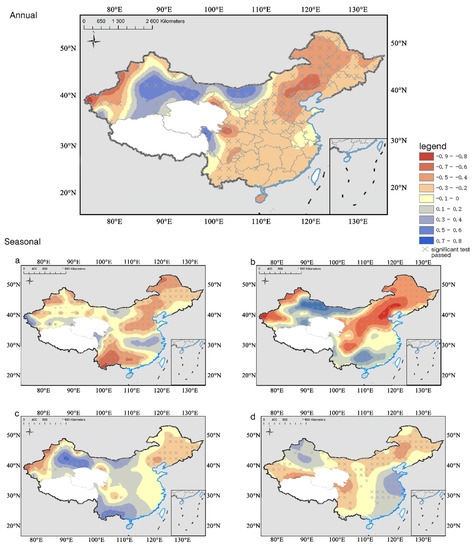
Figure 8.
Distribution of correlation coefficient between annual and seasonal soil moisture and temperature. (a) Spring; (b) summer; (c) autumn; (d) winter.
4. Discussion
4.1. The Accuracy of the Dataset
Large-scale and long-term soil moisture datasets are not easy to obtain. Satellite and remote sensing data have better resolution but shorter time series. Moreover, in situ soil moisture measurements are geographically limited and lack consistency. The reanalysis dataset might display deviations with observation data, but it captures the data on a global scale and has good continuity. The NCAR-reanalysis dataset performs well on monthly time scales [25], although the resolution of the grid data used in this study is not extremely high. The time scale of the data is long and the spatial distribution is wide, and it reflects the general variation of soil moisture, which is consistent with the general trend of the observation data based on ground stations and other datasets [26]. The general distribution of soil moisture using the dataset from NCAR/NCEP is consistent with previous studies [26]. The regional discrepancy is quite obvious, and the variation characteristics differ from region to region and from season to season. This study indicates that soil moisture in China has generally decreased in the last 60 years and that the northern part of China is facing severe soil moisture decline, again consistent with previous studies [27,28].
4.2. The Correlation between Soil Moisture and Air Temperature
Many studies have indicated that there is a good negative correlation between temperature and soil moisture [1,12,13,14], and the basic mechanism is that higher temperatures will promote soil evaporation and plant transpiration, resulting in a decrease in soil moisture [1]. Usually, soil moisture is studied as a dependent variable, and soil moisture variation is seen as the result of climate change. Generally, people believe that the increase in greenhouse gas emissions is the main reason for global warming. Meanwhile, land use and land cover (LULC) also alters the air temperature trend [29,30].
However, here, Figure 8 shows that it is hard to tell whether soil moisture is the result of climate change or whether it causes regional climate change due to the complex relations between soil moisture and temperature. It can be found that the absolute value of the correlation coefficient between soil moisture and temperature is higher in northern China. The annual negative correlation coefficient was up to −0.85 in NEC and NC but merely around −0.3 in southern China. Moreover, the negative correlation was stronger in summer; the correlation coefficient could reach −0.7 in over 70% of areas in NEC and NC. Additionally, the positive correlation was obvious in NWC, with a maximum value of 0.71, and the location of a high positive correlation coefficient center was close to the low-value center of soil moisture. In summer, autumn, and winter, positive correlations also appeared in the southern part of China. Affected by the Asian monsoons, coastal regions experience abundant rainfall during monsoon periods, especially in summer and autumn. A large amount of precipitation leads to high soil moisture, which helps maintain a smaller fluctuation of soil moisture variation; some regions have the tendency of increasing precipitation. This means that precipitation is the leading factor influencing soil moisture in SC and SWC. Meanwhile, the speed of rising air temperature has been slow; these factors have resulted in a positive correlation between soil moisture and air temperature. In dry lands with less precipitation, soil moisture has continued to decrease, with air temperature dramatically rising, resulting in a strong negative correlation. The results are in accordance with the fact that arid and semiarid regions will face more stress under climate change [31,32,33]. Therefore, the correlation might be more accurate if the study area is refined in the future.
4.3. The Reasons for Soil Moisture Decline
Whether warming is the main cause of soil moisture declination, especially in northern China, is doubtful. Although soil drought may be caused by climate change, we cannot ignore the fact that the intensity of human activities, especially agricultural activities, has strengthened in recent decades. Regional climate is sensitive to soil moisture change [34]; for instance, extreme heat events are associated with surface soil moisture feedback [35,36]. The intensive agricultural production arrangements, including the expansion of arable land and the increasing use of fertilizers, undermine the soil–water balance and exacerbate soil moisture consumption, leading to soil drought [37]. In Europe, soil moisture droughts are exacerbated by anthropogenic warming [38], and worldwide, human activities were probably affecting the risk of droughts [39]. A previous study found that agriculture intensified soil moisture decline in Northern China [20]; this is consistent with our results. In summer, north China has the largest trend of decline, and that is the season to harvest winter wheat and plant maize. In autumn, northeast China has the most severe soil moisture decline, and that is the season to harvest rice, maize, and soybean. The soil moisture variation is associated with agricultural activities in different seasons and regions. This also explains the different soil moisture variations of the region. In China, there was an industrialization campaign before the 1960s when agricultural production was delayed for several years, and soil moisture increased during that period. However, this was followed by a decline in soil moisture when agricultural activities resumed and the intensity of water consumption increased. In recent decades, agricultural production has continuously increased and soil moisture decline has intensified. It is important for policy-makers to realize that the high intensity of agriculture brings economic benefit but also has negative effects on ecology [39], such as soil moisture decline. In addition, appropriate agricultural practices and policies benefit both human beings and the ecological system. The coherence of soil moisture variation and agricultural activities has been observed, and agriculture could be one possible reason for the soil moisture decline. However, other possible reasons require investigation.
5. Conclusions
In this study, variations of soil moisture in China in the 0–10 cm layer, from 1948 to 2014, based on the dataset from NCAR/NCEP, were analyzed. The results indicate that (1) the annual average soil moisture of China displays a sandwich distribution. The relative low-value areas are concentrated in NWC, while the relative high-value areas are in CC and NEC. (2) Soil moisture is prone to decrease in all four seasons significantly (p < 0.01); the rate of decrease is relatively larger in spring and autumn, and the amplitude is smaller in summer and winter. All the regions show a decreasing trend except for SC, with the most significant decreases occurring in CC in spring, NC in summer, and NEC in autumn. (3) As for national annual average soil moisture, there was a mutation in the 1970s, before which the soil moisture was relatively high with a larger deviation, but after which it returned to a relatively low level with a smaller deviation. Most regions show a slowed-down decrease, but in certain places, the soil water deficit situation has intensified. (4) Soil moisture at 0–10 cm shows a negative correlation with the 2-m air temperature above ground in the northern part of China. There is a negative correlation in most regions but a positive correlation in the NEC, where the soil moisture is extremely low. (5) Soil moisture variation accompanies agricultural activities. The mechanism of soil moisture change and regional air temperature change, as well as the effect of human activities on this process, still calls for further study.
Author Contributions
Conceptualization, G.H. and Z.P.; Data curation, N.H. and G.S.; Formal analysis, J.W.; Funding acquisition, Z.P.; Investigation, Z.W. and C.L.; Methodology, Z.Z.; Resources, R.P. and S.M.; Software, G.H.; Supervision, Z.P.; Validation, Y.P.; Writing—original draft, G.H.; Writing—review & editing, G.H. and Y.S. All authors have read and agreed to the published version of the manuscript.
Funding
This study is supported by the National Key R&D Program of China (No. 2018YFA0606303, No.2017YFD0300906, No.2018YFD0300502) and the National Natural Science Foundation of China (No. 41871086).
Conflicts of Interest
The authors declare no conflict of interest.
References
- Seneviratne, S.I.; Corti, T.; Davin, E.L.; Hirschi, M.; Jaeger, E.B.; Lehner, I.; Orlowsky, B.; Teuling, A.J. Investigating soil moisture–climate interactions in a changing climate: A review. Earth-Sci. Rev. 2010, 99, 125–161. [Google Scholar] [CrossRef]
- Deng, Y.; Wang, S.; Bai, X.; Luo, G.; Wu, L.; Cao, Y.; Li, H.; Li, C.; Yang, Y.; Hu, Z.; et al. Variation trend of global soil moisture and its cause analysis. Ecol. Indic. 2020, 110, 105939. [Google Scholar] [CrossRef]
- Cheng, S.; Guan, X.; Huang, J.; Ji, F.; Guo, R. Long-term trend and variability of soil moisture over East Asia. J. Geophys. Res. Atmos. 2015, 120, 8658–8670. [Google Scholar] [CrossRef]
- Robinson, D.A.; Campbell, C.S.; Hopmans, J.W.; Hornbuckle, B.K.; Jones, S.B.; Knight, R.; Ogden, F.L.; Selker, J.S.; Wendroth, O. Soil Moisture Measurement for Ecological and Hydrological Watershed-Scale Observatories: A Review. Vadose Zone J. 2008, 7, 358–389. [Google Scholar] [CrossRef]
- Fierer, N.; Schimel, J.P. Effects of drying–rewetting frequency on soil carbon and nitrogen transformations. Soil Biol. Biochem. 2002, 34, 777–787. [Google Scholar] [CrossRef]
- Lai, X.; Wen, J.; Cen, S.; Huang, X.; Tian, H.; Shi, X. Spatial and Temporal Soil Moisture Variations over China from Simulations and Observations. Adv. Meteorol. 2016, 2016, 4587687. [Google Scholar] [CrossRef]
- Wang, S.; Mo, X.; Liu, S.; Lin, Z.; Hu, S. Validation and trend analysis of ECV soil moisture data on cropland in North China Plain during 1981–2010. Int. J. Appl. Earth Obs. Geoinf. 2016, 48, 110–121. [Google Scholar] [CrossRef]
- Chen, Y.; Li, Z.; Fan, Y.; Wang, H.; Deng, H. Progress and prospects of climate change impacts on hydrology in the arid region of northwest China. Environ. Res. 2015, 139, 11–19. [Google Scholar] [CrossRef]
- Chahine, M.T. The hydrological cycle and its influence on climate. Nature 1992, 359, 373–380. [Google Scholar] [CrossRef]
- McColl, K.A.; Alemohammad, S.H.; Akbar, R.; Konings, A.G.; Yueh, S.; Entekhabi, D. The global distribution and dynamics of surface soil moisture. Nat. Geosci. 2017, 10, 100–104. [Google Scholar] [CrossRef]
- Ugbaje, S.U.; Bishop, T.F. Hydrological Control of Vegetation Greenness Dynamics in Africa: A Multivariate Analysis Using Satellite Observed Soil Moisture, Terrestrial Water Storage and Precipitation. Land 2020, 9, 15. [Google Scholar] [CrossRef]
- Cho, E.; Choi, M. Regional scale spatio-temporal variability of soil moisture and its relationship with meteorological factors over the Korean peninsula. J. Hydrol. 2014, 516, 317–329. [Google Scholar] [CrossRef]
- Zuo, Z.; Zhang, R. Influence of soil moisture in eastern China on the East Asian summer monsoon. Adv. Atmos. Sci. 2015, 33, 151–163. [Google Scholar] [CrossRef]
- Wei, W.; Shi, Z.; Yang, X.; Wei, Z.; Liu, Y.; Zhang, Z.; Ge, G.; Zhang, X.; Guo, H.; Zhang, K.; et al. Response of summer air temperature in China to soil moisture anomalies in East Asia and its statistical assessment. J. Meteorol. Sci. 2016, 36, 581–592. (In Chinese) [Google Scholar]
- Zhang, J.; Liu, Z.; Chen, L. Reduced soil moisture contributes to more intense and more frequent heat waves in northern China. Adv. Atmos. Sci. 2015, 32, 1197–1207. [Google Scholar] [CrossRef]
- Gentine, P.; Entekhabi, D.; Heusinkveld, B. Systematic errors in ground heat flux estimation and their correction. Water Resour. Res. 2012, 48, W09541. [Google Scholar] [CrossRef]
- Su, B.; Wang, A.; Wang, G.; Wang, Y.; Jiang, T. Spatiotemporal variations of soil moisture in the Tarim River basin, China. Int. J. Appl. Earth Obs. Geoinf. 2016, 48, 122–130. [Google Scholar] [CrossRef]
- Piao, S.; Ciais, P.; Huang, Y.; Shen, Z.; Peng, S.; Li, J.; Zhou, L.; Liu, H.; Ma, Y.; Ding, Y.; et al. The impacts of climate change on water resources and agriculture in China. Nature 2010, 467, 43–51. [Google Scholar] [CrossRef]
- Cheng, S.; Huang, J. Enhanced soil moisture drying in transitional regions under a warming climate. J. Geophys. Res. Atmos. 2016, 121, 2542–2555. [Google Scholar] [CrossRef]
- Liu, Y.; Pan, Z.; Zhuang, Q.; Miralles, D.G.; Teuling, A.J.; Zhang, T.; An, P.; Dong, Z.; Zhang, J.; He, D.; et al. Agriculture intensifies soil moisture decline in Northern China. Sci. Rep. 2015, 5, 11261. [Google Scholar] [CrossRef]
- Kalnay, E.; Kanamitsu, M.; Kistler, R.; Collins, W.; Deaven, D.; Gandin, L.; Iredell, M.; Saha, S.; White, G.; Woollen, J.; et al. The NCEP/NCAR reanalysis 40-year project. Bull. Am. Meteorol. Soc. 1996, 77, 437–472. [Google Scholar] [CrossRef]
- Mann, H.B. Non-Parametric Test Against Trend. Econometrica 1945, 13, 245–259. [Google Scholar] [CrossRef]
- Kendall, M.G. Rank Correlation Methods; Griffin: London, UK, 1975. [Google Scholar]
- Gocic, M.; Trajkovic, S. Analysis of changes in meteorological variables using Mann-Kendall and Sen’s slope estimator statistical tests in Serbia. Glob. Planet. Chang. 2013, 100, 172–182. [Google Scholar] [CrossRef]
- Lu, C.-H.; Kanamitsu, M.; Roads, J.O.; Ebisuzaki, W.; Mitchell, K.E.; Lohmann, D. Evaluation of Soil Moisture in the NCEP–NCAR and NCEP–DOE Global Reanalyses. J. Hydrometeorol. 2005, 6, 391–408. [Google Scholar] [CrossRef]
- Lai, X.; Wen, J.; Cen, S.X.; Song, H.Q.; Tian, H.; Shi, X.K.; He, Y.; Huang, X. Numerical simulation and evaluation study of soil moisture over China by suing CLM4.0 Model. Adv. Meteorol. 2014, 38, 499–512. (In Chinese) [Google Scholar]
- Zhu, G.; Pan, H.; Zhang, Y.; Guo, H.; Yong, L.; Wan, Q.; Ma, H.; Li, S. Spatial-temporal characteristics of soil moisture in China. Acta Geogr. Sin. 2016, 9, 1494–1508. (In Chinese) [Google Scholar]
- Li, M.; Ma, Z. Soil moisture drought detection and multi-temporal variability across China. Sci. China Earth Sci. 2015, 58, 1798–1813. [Google Scholar] [CrossRef]
- Hale, R.C.; Gallo, K.P.; Owen, T.W.; Loveland, T.R. Land use/land cover change effects on temperature trends at U.S. Climate Normals stations. Geophys. Res. Lett. 2006, 33, L11703. [Google Scholar] [CrossRef]
- Marshall, C.H.; Pielke Sr, R.A.; Steyaert, L.T.; Willard, D.A. The Impact of Anthropogenic Land-Cover Change on the Florida Peninsula Sea Breezes and Warm Season Sensible Weather. Mon. Weather. Rev. 2004, 132, 28–52. [Google Scholar] [CrossRef]
- Zhou, S.; Williams, A.P.; Berg, A.M.; Cook, B.I.; Zhang, Y.; Hagemann, S.; Lorenz, R.; Seneviratne, S.I.; Gentine, P. Land-atmosphere feedbacks exacerbate concurrent soil drought and atmospheric aridity. Proc. Natl. Acad. Sci. USA 2019, 116, 18848–18853. [Google Scholar] [CrossRef] [PubMed]
- Huang, J.; Yu, H.; Dai, A.; Wei, Y.; Kang, L. Drylands face potential threat under 2 degree global warming target. Nat. Clim. Chang. 2017, 7, 417–422. [Google Scholar] [CrossRef]
- Fu, Q.; Feng, S. Responses of terrestrial aridity to global warming. J. Geophys. Res. Atmos. 2014, 119, 7863–7875. [Google Scholar] [CrossRef]
- Dirmeyer, P.A. The terrestrial segment of soil moisture-climate coupling. Geophys. Res. Lett. 2011, 38, 136. [Google Scholar] [CrossRef]
- Diffenbaugh, N.S.; Pal, J.S.; Giorgi, F.; Gao, X. Heat stress intensification in the Mediterranean climate change hotspot. Geophys. Res. Lett. 2007, 34, 224–238. [Google Scholar] [CrossRef]
- Zhang, J.; Yang, J.; An, P.; Ren, W.; Pan, Z.; Dong, Z.; Han, G.; Pan, Y.; Pan, S.; Tian, H. Enhancing soil drought induced by climate change and agricultural practices: Observational and experimental evidence from the semiarid area of northern China. Agric. Meteorol. 2017, 243, 74–83. [Google Scholar] [CrossRef]
- Samaniego, L.; Thober, S.; Kumar, R.; Wanders, N.; Rakovec, O.; Pan, M.; Zink, M.; Sheffield, J.; Wood, E.F.; Marx, A. Anthropogenic warming exacerbates European soil moisture droughts. Nat. Clim. Chang. 2018, 8, 421–426. [Google Scholar] [CrossRef]
- Marvel, K.; Cook, B.I.; Bonfils, C.J.W.; Durack, P.J.; Smerdon, J.E.; Williams, A.P. Twentieth-century hydroclimate changes consistent with human influence. Nature 2019, 569, 59–65. [Google Scholar] [CrossRef]
- Matson, P.A.; Parton, W.J.; Power, A.G.; Swift, M.J. Agricultural Intensification and Ecosystem Properties. Science 1997, 277, 504–509. [Google Scholar] [CrossRef]


© 2020 by the authors. Licensee MDPI, Basel, Switzerland. This article is an open access article distributed under the terms and conditions of the Creative Commons Attribution (CC BY) license (http://creativecommons.org/licenses/by/4.0/).