Applicability and Hydrologic Substitutability of TMPA Satellite Precipitation Product in the Feilaixia Catchment, China


1
School of Civil Engineering and Transportation, South China University of Technology, Guangzhou 510640, China
2
State Key Laboratory of Subtropical Building Science, South China University of Technology, Guangzhou 510640, China
3
Guangdong Engineering Technology Research Center of Safety and Greenization for Water Conservancy Project, Guangzhou 510640, China
*
Author to whom correspondence should be addressed.
Water 2020, 12(6), 1803; https://doi.org/10.3390/w12061803
Submission received: 18 May 2020
/
Revised: 20 June 2020
/
Accepted: 20 June 2020
/
Published: 24 June 2020
(This article belongs to the Section Hydrology)
Abstract
:The assessment of various precipitation products’ performances in extreme climatic conditions has become a topic of interest. However, little attention has been paid to the hydrological substitutability of these products. The objective of this study is to explore the performance of the Tropical Rainfall Measuring Mission Multi-Satellite Precipitation Analysis (TMPA) product in the Feilaixia catchment, China. To assess its applicability in extreme consecutive climates, several statistical indices are adopted to evaluate the TMPA performance both qualitatively and quantitatively. The Cox–Stuart test is used to investigate extreme climate trends. The Soil and Water Assessment Tool (SWAT) model is used to test the TMPA hydrological substitutability via three scenarios of runoff simulation. The results demonstrate that the overall TMPA performance is acceptable, except at high-latitudes and locations where the terrain changes greatly. Moreover, the accuracy of the SWAT model is high both in the semi-substitution and full-substitution scenarios. Based on the results, the TMPA product is a useful substitute for the gauged precipitation in obtaining acceptable hydrologic process information in areas where gauged sites are sparse or non-existent. The TMPA product is satisfactory in predicting the runoff process. Overall, it must be used with caution, especially at high latitudes and altitudes.
1. Introduction
High-accuracy and fine-resolution precipitation estimates are crucial for many fields such as hydrology, agriculture, water resource management, and disaster forecasting and response [1]. Currently, precipitation data are primarily obtained via discrete ground-based rainfall stations. However, because of the large variations in the precipitation process, it is difficult to truly reflect the spatial and temporal distributions of precipitation using discrete rainfall sites, particularly in areas where rainfall stations are unevenly and less densely distributed, such as in northwestern China and the Tibetan Plateau.
With the rapid development of remote-sensing technology, a series of satellite rainfall products with high spatial and temporal resolutions has been created, including the Tropical Rainfall Measuring Mission (TRMM), Climate Prediction Center Morphing (CMORPH) technique, Precipitation Estimation from Remotely Sensed Information using Artificial Neural Networks (PERSIANN), Global Satellite Mapping of Precipitation (GSMaP), and others. Remote-sensing satellite rainfall data are being increasingly used to overcome the limitations of station-based low-accuracy rainfall data [2,3]. The TRMM product is used for the quantitative acquisition of tropical and subtropical rainfalls. Its daily scale product, TRMM Multi-satellite Precipitation Analysis (TMPA) 3B42 V7, is timely and exhibits a high spatial resolution and sufficient coverage. The TMPA has become one of the most widely used satellite rainfall products worldwide [4,5]. Therefore, it is particularly important to analyze the applicability of the TMPA product; research is being conducted in this field worldwide. Wang et al. conducted an evaluation of TRMM on the Xiangjiang River Basin, and the results showed that TRMM tends to underestimate precipitation in the winter and in high-elevation areas [6]. Zad et al. applied the gauge data of the Pahang River Basin in Malaysia to evaluate the multi-time scale of the TRMM 3B42 products, but the performance was unsatisfactory; thus, they recommended that a prior correction should be made before the actual application [7]. Kenabatho et al. evaluated the TRMM 3B42 products in the Notwane catchment of Botswana, showing that the accuracy of the TRMM data is higher than that of the multi-site stochastic rainfall model, but the capability of the TRMM data to reflect extreme rainfall must still be improved [8]. Overall, the performance of TRMM indicates that its capability of capturing extreme climate is weak, and further corrections should be carried out before it is used in practical applications.
Due to the impact of urbanization and greenhouse gas emissions from human activities, the global climate has undergone dramatic changes [9]. The frequent occurrence of extreme rainfall events has seriously affected daily human activities and safety and has become a great concern to experts [10]. Most scholars have focused on the magnitude and frequency of extreme weather events, and there is limited literature devoted to the consecutiveness of extreme weather events [11,12]. However, studying the consecutiveness of extreme climate events is necessary and has practical significance [13]. The consecutive occurrence of extreme rainfall events has a greater impact on human daily activities and traveling and causes more damage and losses to the ecological environment and to crop growth [14]. Therefore, it is more practical to consider the consecutiveness of extreme rainfall events, particularly in the subtropical monsoon climatic zone of southeastern China, such as the Feilaixia catchment. Furthermore, long-sequence hydro-meteorological factors trend analysis has also been a very challenging topic in recent years, particularly the trend of long-sequence hydro-meteorological factors. Presently, the most widely used trend analysis method is the Mann–Kendall trend test (M-K), which can effectively distinguish whether a process is in natural fluctuation or exhibits trends in the changes. Many scholars have conducted research using this method. For example, Singh and Goyal used the M-K test to analyze extreme rainfall in the Teesta River Basin and predicted that the intensity and frequency of future precipitation events will increase in this region [15]. Salman et al. conducted the M-K test in Iraq and demonstrated that the temperature in Iraq increases two to seven times faster than that of the global temperature [16]. A different method, termed the Cox–Stuart test [17], is also applicable to the analysis of long-term hydro-meteorological factors trends. Given the advantages that Cox–Stuart test is simple, fast, and independent of the data sequence structure, this study intends to adopt this method to evaluate and analyze the trends of consecutive extreme precipitation in Feilaixia catchment.
The amount of water resources in a basin is typically the research focus. Rainfall–runoff process simulations are also important as they are the basis for water resource calculations and non-point source pollution load simulations. As one of the most widely used rainfall products, TMPA substitutability for gauged precipitation in hydrology is also critical. However, limited literature exists regarding the hydrological substitutability of the TMPA product [18].
As we have insufficient information on the accuracy and adaptability of the TMPA, it is necessary to explore the TMPA product’s spatio-temporal accuracy in mountainous areas. Additionally, to address the research gap, the hydrologic substitutability of the TMPA is analyzed using the SWAT model. Taking the Feilaixia catchment, a typical mountainous area, as an example, precipitation data of 24 rainfall gauge stations in the area were used to conduct an in-depth accuracy and adaptability analysis of the TMPA product at the daily scale. Consecutive extreme rainfall indices such as consecutive dry days (CDD, d), consecutive wet days (CWD, d), and monthly maximum consecutive five-day precipitation (RX5day, mm) were adopted to evaluate the capability of the TMPA to capture consecutive extreme precipitation. Then, the Cox–Stuart trend test was used to analyze the trends of the consecutive extreme precipitation indices in the catchment. Finally, the SWAT model was applied to conduct an in-depth analysis of the substitutability of the TMPA by comparing and analyzing the results of the TMPA and gauged precipitation in runoff simulations. Thus, the comprehensive performance of the TMPA product was evaluated in the Feilaixia catchment. The conclusions obtained in this study are intended to provide reference values for similar mountainous areas or floodplains with frequent flash floods and guidance for the application of the TMPA product in catchments similar to the Feilaixia catchment.
2. Study Area and Materials
The Feilaixia catchment in southeastern China has an area of approximately 34,097 km2. Figure 1 shows the location, topography, and stations of the Feilaixia catchment. Located in a humid area in southern China, the Feilaixia catchment belongs to the subtropical monsoon climate zone, and the average annual rainfall exceeds 1700 mm. The temporal rainfall distribution is uneven, where 70% of the total rainfall falls in the monsoon season. Over 70% of the total area is covered with vegetation, and the average annual temperature is approximately 21 °C. The elevation of the watershed gradually decreases from north to south. The terrain of the northeastern part is diverse because of the Dadong Mountain. The primary rivers in the catchment include the Zhenshui River in the northeast, Wushui River in the northwest, Lianjiang River in the southwest, and Wengjiang River in the southeast. Frequent consecutive heavy rainfall events have recently occurred in the Feilaixia catchment. For example, from May 7 2017 to May 9 2017, heavy rainfall with a duration of 12 h and accumulated rainfall of over 300 mm occurred in this catchment, seriously impacting the safety of the residents and causing severe property damage.
Considering the integrity of the data time sequences and spatial distribution characteristics of the sites, the daily rainfall data recorded by the 24 rainfall stations in the Feilaixia catchment from 1998 to 2015 were selected (Figure 1) as the research data. The data were sourced from the Hydrology Bureau of the Guangdong Province, China.
TMPA merges precipitation estimates from different types of satellites to obtain precipitation products from 50° S to 50° N at a 0.25° spatial resolution. The TMPA product is computed twice; the first computation is a real-time monitoring product calculated approximately 9 h after real time, and the second is a post-real-time research-quality product calculated approximately 10–15 days following the end of each month. Obtained from the NASA website (https://www.nasa.gov/), the post-real-time TMPA 3B42 V7 product was used in this study. Before performing the data analysis, the quality of the data must be strictly controlled using RClimdex 1.0 (Climate Research Branch, Environment Canada Downsview, Ontario, Canada) [19,20], including for any cases where the date of the recording is inconsistent with that of reality, the rainfall was less than zero, or the recorded value seriously deviates from the actual meteorology in the region.
Additional inputs were required to operate the SWAT model. The runoff data from the Hengshi hydrologic station (Figure 1) were provided by the Hydrology Bureau of the Guangdong Province. Meteorological data such as the temperature, humidity, wind speed, and solar radiation of four weather stations (Figure 1) were obtained from the China Meteorological Data Network (http://data.cma.cn). A 90-m resolution digital elevation model was obtained from the Computer Network Information Center, Chinese Academy of Sciences (Figure 1). Land use data collected in 2009 were obtained from the Global Change Parametric Database of the Computer Network Information Center, Chinese Academy of Sciences (http://www.csdb.cn). The land use change in the Feilaixia catchment is very small and can be ignored between 1998 and 2015; it is predominately agricultural and forested land. Therefore, we only use the static land use data for simulation. The soil data were obtained from the Global Soil Database, which was jointly developed by the Food and Agriculture Organization of the United Nations and the International Institute of Applied System Analysis.
3. Methods
3.1. Climatic Indices
During the 1998–2001 Climate Change Detection Conference, the World Meteorological Organization proposed a set of extreme climate indices [21], of which 27 are considered core indicators. These indices are characterized by a sufficient signal-to-noise ratio for period-to-period trend detection. Among these, three indices related to consecutive extreme precipitation were chosen to investigate consecutive extreme precipitation in the Feilaixia catchment, including CDD, CWD, and RX5day.
3.2. Statistical Performance Indices
3.2.1. Rainfall Detected Statistical Indices
Rainfall detected statistical indices are the performance criteria used to measure the rainfall and non-rainfall events of the TMPA product and gauged data [22]. Therefore, these indices are also widely used in the evaluation of TRMM products [7,8]. Equations (1)–(4) define the statistical indices used in this study. Based on the China Meteorological Administration standards, the threshold of rainfall events is defined as 0.1 mm/days [23], and a, b, c, and d are defined as the number of days that the TMPA successfully detected rainfall events, failed to detect no-rainfall events, failed to detect rainfall events, and successfully detected no-rainfall events, respectively, as listed in Table 1.
The probability of detection (POD), false alarm ratio (FAR), accuracy, and frequency bias index (FBI) were used. The value ranges of the first three measurements are all 0–1, and the ideal values are 1, 0, and 1, respectively. Theoretically, the FBI is in the range of 0 to ∞, and the ideal value is 1. When the value falls in the range from 0 to 1, it indicates that the TMPA underestimates the number of rain days; the converse is true when the value is in the range from 1 to ∞.
3.2.2. Quantitative Statistical Indices
To further quantitatively evaluate the TMPA products, four performance indices were used, including the Pearson Correlation Coefficient (PCC), bias, root mean square error (RMSE), and mean error (ME) [8]. Their formulas are as follows:
In the equations, is the total amount of gauged data (or TMPA data), and are the satellite and gauged values, respectively, and and denote the mean satellite and gauged values, respectively. PCC represents the degree of correlation between the TMPA and gauged data. The value ranges from 0 to 1. The closer the value is to 1, the higher the correlation between the TMPA and gauged data. The bias represents the degree of deviation; the closer it is to 0, the smaller the deviation. Similarly, the closer the RMSE is to 0, the greater the consistency. ME represents the average degree of dispersion; the closer it is to 0, the smaller the degree of dispersion.
3.3. Cox–Stuart Test
Proposed by Cox and Stuart [24], the Cox–Stuart test is a distribution-free test that can quickly determine whether there is a trend in a time series. Based on the sign test, it is suitable for testing whether a data time series has an increasing or decreasing trend [17,25]. The Cox–Stuart test divides the data sequence by the middle position, thus splitting it into two parts to form data pairs and then subtracts each data pair to obtain the differences . Then, the number of positive and negative are counted and recorded as and , respectively. When is greater, the sequence has a decreasing trend, and when is greater, the sequence has an increasing trend.
The trend absence null hypothesis was tested. ( or ) was taken as the test statistic; thus, , where represents the number of pairs except for the number of cases where . Then, the significance level was calculated using the following equation:
The significance level was determined. For example, the significance level is set to 0.05. When the p value is less than or equal to 0.05, the null hypothesis can be rejected, and the data are considered to have an increasing (or decreasing) trend at the 0.05 significance level.
In this study, the trend strength was categorized into four levels based on the p value of each climatic index at each station. When 0 < p ≤ 0.05, the trend was defined as an extremely strong upward trend. The other three trend strengths were defined as a strong upward trend (0.05 < p ≤ 0.1), weak upward trend (0.1 < p ≤ 0.25), or no significant trend (p > 0.25). Similarly, when the test statistic is , the trend strength was categorized into four levels, including an extremely strong downward trend (0 < p ≤ 0.05), strong downward trend (0.05 < p ≤ 0.1), weak downward trend (0.1 < p ≤ 0.25), and no significant trend (p > 0.25).
3.4. Soil and Water Assessment Tool Model
The Soil and Water Assessment Tool (SWAT) model was developed by Dr. Jeff Arnold of the Agricultural Research Center, United States Department of Agriculture [26]. It is a macroscale hydrologic model, and it can reveal the hydrological characteristics of a mountainous catchment, such as the Feilaixia catchment. The SWAT model can simulate a variety of different hydrological processes in complex watersheds, such as runoff, sediment load, and non-point source pollution simulations. The basin hydrological processes that SWAT simulates are divided into surface runoff and channel routing segments. The surface runoff process is determined using the Soil Conservation Service curve number method or the Green–Ampt method. The channel routing is based on either the Muskingum method or variable storage routing model.
In this study, the SWAT model was used to simulate the runoff process in the Feilaixia catchment from 1998 to 2011. The Nash–Sutcliffe (NS) coefficient, relative error (RE), PCC, and RMSE were used to evaluate the model simulation accuracy. The equations for NS and RE are as follows:
In the equations, is the number of runoff observations, and and represent the observation and simulation values, respectively. is the average value of the observations. After surveying numerous literatures, it was found that when NS exceeds 0.7 and RE is within 5%, the SWAT model performance is superior. While the performance is acceptable when NS exceeds 0.5 and RE is within 10% [18,27,28].
4. Results and Discussion
4.1. Rainfall-detected and Quantitative Performance of the TMPA Product
As we all know, unquantifiable deviations will occur if the meteorological observational data is interpolated into the spatial data. To avoid this issue, the gauge stations’ coordinates were used to extract the corresponding grid data for the satellite precipitation (Assuming that the measurement stations in the catchment are sufficiently dense). For the case where there are two or more rain gauge observations in one grid point, the average value of the observations is taken as the observation value of the corresponding grid point for evaluation and comparison.
4.1.1. Results from the Rainfall Detected Statistical Indices
Using the inverse distance weighted method, the spatial distributions of the four indices are shown in Figure 2. In Figure 2a, the POD, varying from 0.586 to 0.685, is poor in most of the northwestern catchment areas. Relatively speaking, it performs better in the southeastern region. Located in the northwestern region of the catchment, Dadong Mountain has an altitude of 1900 m, which indicates that the TMPA performs better at low altitudes than at high altitudes. In Figure 2c, the accuracy performance is similar to that of the POD. In Figure 2b, the FAR distribution map illustrates that the TMPA performs better in the downstream but worse in areas with higher altitudes or large changes in terrain, such as upstream areas, particularly in the Wushui River, where the TMPA showed more invalid reports and false forecasts. In addition, Figure 2d ranges from 0.727 to 0.877, indicating that the TMPA underestimates the number of rainfall days for the entire catchment. A slight underestimation occurred in the eastern part of the catchment, while a more significant underestimation occurred in the western and southern parts. In terms of latitude, Mantas et al. concluded that the TMPA performed better in the middle and northern Peruvian Andes than in the southern ones at higher latitudes by comparing the POD, FAR, and FBI [29]. In the study conducted by Cai et al. in the HunTai Basin in China, the TMPA did not achieve the desired accuracy when capturing extreme precipitation events at mid to high latitudes [27]. Jiang et al. also concluded that the TRMM has a high bias at high latitudes in the Bohai Basin of China [30]. In terms of elevation and topography, Prakash et al. found that TMPA products exhibit larger systematic errors for the mountainous regions of northeastern India [31]. Chen et al. further demonstrated the weak adaptability of the TMPA product at high altitudes [32]. The results obtained in this study tend to confirm these findings and demonstrate that, to a certain extent, the TMPA product performed better in lower latitudes and flat terrain areas but worse in areas of higher altitudes and large changes in terrain.
4.1.2. Results from Quantitative Statistical Indices
The spatial distribution maps of the four quantitative indices are shown in Figure 3. In Figure 3a, the PCC varies from 0.577 and 0.703, indicating that the two data sets exhibit a strong correlation, particularly in the middle and downstream areas. In addition, the PCC range of the two datasets at the monthly scale is 0.890–0.969. For TMPA, the larger the time scale is, the higher the accuracy. Both at the daily and monthly scales, the TMPA exhibits a stronger correlation with the gauged data in low-latitude and low-altitude areas. In Figure 3b, the bias ranged from −11.776% to 20.812%. In the main channel of the downstream and northeastern parts, the bias exhibited a slight underestimation of up to approximately 10%. In the northwestern part, at a high latitude and altitude and with large changes in terrain, the TMPA exhibits a clear overestimation of up to 20%. As shown in Figure 3c, the RMSE range is 8.851–12.116 mm. Figure 3d indicates that the ME performance is similar to that of the bias.
The results above are similar to those of Wang et al. in the Beijiang and Dongjiang River Basins, showing that TMPA has a substantial capability to capture rainfall data at a daily scale [33]. However, from the bias perspective, TMPA significantly overestimated precipitation at high latitudes and altitudes, and it slightly underestimated precipitation in the primary downstream channel and northeastern part, which can be explained in two ways. On the one hand, human activities and the high degree of urbanization in the main river area may be the cause, as the heat islands created by human activities may enhance rainfall. The TMPA product cannot accurately capture this type of phenomenon. On the other hand, the elevation of the northwestern part is generally higher than that of the main river area; thus, the water vapor cannot pass over this part, resulting in TMPA underestimation in the main river area and overestimation in the northwestern part. The TMPA particularly underestimated the rainstorm center in Yingde. The Dadong Mountain is located along the northwest side of Yingde, with a maximum altitude of nearly 1900 m. During the summer, the southeast monsoon results in abundant precipitation in the catchment. However, because of the topography, water vapor cannot pass over Dadong Mountain; therefore, a stable rainstorm center is formed in Yingde, leading to the underestimation by TMPA. The TMPA product performs poorly in considering the deviations caused by the actual terrain.
4.2. Detection of Consecutive Extreme Indices and Trend Analysis
4.2.1. Evaluation and Analysis of Three Consecutive Extreme Precipitation Indices
RClimdex 1.0 was used to calculate the selected three indices between the gauged data and TMPA. The quantitative statistical results of the three consecutive extreme indices are listed in Table 2.
The average PCCs of the CDD, CWD and RX5day were 0.297, 0.335, and 0.603, respectively, and the highest PCC was 0.932 at Pingshi station, which indicates that the capability of the TMPA product to capture consecutive extreme precipitation must be further enhanced. The bias values of the CDD were all positive, indicating that the TMPA generally overestimated the CDDs in the catchment, and there was a high systematic deviation with an average of 24.134%. The CWD of most stations showed negative values, indicating that the TMPA generally slightly underestimated the CWDs in the catchment, and the average was −6.292%. Underestimating the CWD can cause more serious impacts. For example, adopting TMPA for CWD estimation can directly impact the attention that relevant agencies pay to the consecutive extreme rainfall days. The overall mean value of the bias for RX5day is −4.526%, illustrating that the TMPA exhibits excellent simulation capabilities for RX5day. The mean RMSE of the CDD is 17.36 days, indicating that the TMPA has a gap of approximately 17 days of overestimation for the CDDs and deviates greatly from the gauged dataset. The average RMSE of the CWD is only 3.098 days, indicating that the TMPA has a 3-day underestimation of the CWDs during the year; these results are considered to be acceptable. RX5day has an average deviation of approximately 60 mm, displaying a high degree of deviation from the gauged dataset. The ME performance is similar to that of the bias. The MEs of all stations for the CDD are positive, showing that the CDDs are overestimated by the TMPA. The majority of the CWD values are negative, indicating their underestimation by the TMPA, and the degree of dispersion is acceptable at −0.72 days. The mean ME of RX5day is weakly underestimated, by approximately 11 mm, showing that the capability of the TMPA product is superior in capturing the maximum consecutive 5-day precipitation.
To further explore the applicability of the TMPA product for consecutive extreme climates, RX5day is used as a representation for monthly scale assessments to understand the performances of the TMPA dataset during flooding and dry periods. The results are shown in Figure 4.
Figure 4a indicates that the PCC values of each month are greater than 0.5, and they are greater than 0.8 from July to August and from October to December, indicating that the correlation between the two datasets is particularly high during these months and is only slightly worse from February to April. Because the flood season in the catchment is from April to September, the overall performance of the TMPA during the flood season is acceptable. Figure 4b shows that the biases are lower from May to November (within 10%). The bias is negative during July–September, indicating that TMPA slightly underestimates the consecutive precipitation during the post-flood period. In addition, the deviation from January to March during the post-dry period is significant, and all the values are positive, indicating that the TMPA showed a significant overestimation during the dry season. As shown in Figure 4c, the consistency of the two datasets during the dry season is better. In contrast, the RMSE value is higher during the flood period from April to September, which is also reasonable because the RX5day during the flood period is much higher than that during the dry season. Figure 4d is similar to Figure 4b, where the superior performance occurs from June to November. The ME was positive and large during the pre-flood period from April to May, demonstrating that TMPA significantly overestimated the consecutive precipitation during the pre-flood season. However, ME is negative during the post-flood season from July to September, confirming that TMPA underestimated the consecutive precipitation during the post-flood period. The results of this study are similar to those of the studies conducted by Hur et al. in Singapore [34] and by Zulkafli et al. [28] in northern Peru and southeastern Ecuador, indicating that there is indeed a plateauing phenomenon in the accuracy of the TMPA.
4.2.2. Trend Analysis of Consecutive Extreme Precipitation Indices Using the Cox–Stuart Test
Figure 5 shows the spatial distribution trends of three consecutive extreme precipitation indices in the Feilaixia catchment from 1998 to 2015 based on the Cox–Stuart test. According to the results obtained for the gauged station dataset, as shown in Figure 5a,c,e, the CDD exhibits various upward trends in the main river area and downstream of the catchment (primarily a strong upward trend). There is an extremely strong upward trend in the upstream area of the Lianjiang River in the western part, indicating that this region is prone to consecutive extreme drought events and requires more attention. The results are consistent with those obtained by Wu et al. [11] who used the Mann–Kendall test and those of the drought study in the Pearl River Basin conducted by Zhang et al. [35]. The CWD displays an extremely strong upward trend in the southeastern and west-central parts, indicating that the consecutive extreme precipitation weather of these regions significantly increased. Therefore, consecutive precipitation events in the southeastern part are critical. In addition, there are many weak upward trends in the upstream areas, while various downward trends occur in the western and east-central parts. RX5day displays an extremely strong upward trend in the southeastern and southwestern parts and a strong upward trend in the northeastern region, which indicate the strong probability of flood disasters. Because of Dadong Mountain, the slopes of the middle and upper stream areas are steep; thus, the runoff confluence time is greatly shortened. In addition, the river system shows a broad-leaved vein distribution, further accelerating the flow rate and increasing the possibility of consecutive flood disasters. The remaining regions exhibit weak upward or no significant trends. As we all know, trend analysis requires at least 25–30 years of the data sequence, but the TRMM-era precipitation products were developed in 1998. Therefore, there will be some uncertainty in the results of the above trend analysis.
The results of the TMPA dataset are shown in Figure 5b,d,f. The CDD shows an extremely strong upward trend in the western region, consistent with that of the gauged station dataset. However, the performances in the upstream and the southeastern parts are distinct from those of the gauged dataset and exhibit strong upward trends. The CWD shows an extremely strong downward trend in the western region, which is consistent with the gauged dataset. However, the performance of the TMPA in other regions is unsatisfactory, particularly in the southeastern part where it is nearly impossible to capture the significant upward trend of the consecutive precipitation climate. RX5day displays a strong upward trend in the middle section of Lianjiang in the southwestern region, which is consistent with the gauged dataset. The main channel trend is also consistent with that of the site dataset, displaying a weak upward trend. However, the TMPA cannot accurately capture the extremely strong upward trend in the southeastern region or the downward trend in the northwestern region. In general, the TMPA does not adequately capture consecutive extreme precipitation climates and must be revised before it can be practically used.
4.3. Hydrologic Substitutability Analysis of the TMPA 3B42-V7 Product Using the SWAT Model
It is well known that model parameters are the decisive factors in hydrological simulation results, such as those of the SWAT model. Therefore, the SWAT model was used in the Feilaixia catchment and divided into 27 sub-basins and 262 hydrologic response units. The hydrologic substitutability of the TMPA product was evaluated according to the precision performances of the SWAT model under three different scenarios (Table 3).
Scenario 1 was a comparison scenario where the SWAT model was driven by the gauged precipitation. In Scenario 1, a set of initial parameters was calibrated and fixed as the static parameters set. Scenario 2 was a semi-substituted scenario, where the SWAT model was driven by the TMPA precipitation, and the static parameters set was adopted to directly perform the runoff simulation. This scenario represented the situation that gauged precipitation with partially missing data in time or space. Scenario 3 was a fully substituted scenario. In this scenario, the initial parameters set was thoroughly re-calibrated by the TMPA product. This scenario reflects the results achieved by only using the remote-sensing precipitation. Considering the continuity and integrity of the runoff data, the warm-up period for all scenarios was from 1998 to 1999, the calibration period was from 2000 to 2007, and the validation period was from 2008 to 2011. According to the knowledge of the SWAT model and the basic situation prevailing in the Feilaixia catchment, 14 parameters with strong sensitivities were selected for the calibration, such as CN2, CH_N2, GWQMN, GW_DELAY, and SOL_BD.
The daily runoff simulation processes under the three scenarios are shown in Figure 6. Under the three scenarios, the model is more accurate in the simulation of medium and low flows, and the peak time simulations also matched. However, the simulation of the flood peak flow is underestimated to various extents, which is clear under Scenario 2, where the relative error is as high as −4.81%, particularly during 2002–2003. In contrast, Scenario 3 performs slightly better than Scenario 2 by using the re-calibrated parameters set. The results once again verify the high rain underestimation shortcoming of the TMPA product, as many researchers have also claimed. This may be because of the adoption of the Climatological Calibration Algorithm in the TMPA satellite rainfall estimation algorithm [36]. This method compensates for the overestimation of the low rainfall by underestimating the precipitation of high rainfall intensity, which is beneficial for reducing systematic error, but it is not conducive to improving the simulation accuracy of the storm flood peaks. Table 4 shows the SWAT model accuracy indices under each scenario. During the calibration and validation periods, the NS coefficients in Scenario 1 are 0.81 and 0.85, and 0.73 and 0.78 in Scenario 2. When based solely on the TMPA product, the NS coefficients of Scenario 3 are 0.72 and 0.79. The NS coefficients of the validation period are all superior to those of the calibration period under the three scenarios, and the remaining three indices, RE, PCC, and RMSE, also demonstrate similar performances. This may be because, during the validation period, the rainfall in each year is fairly steady, and the runoff distribution was gentler than that during the calibration period. It is also possible that the SWAT model has a higher adaptability to the validation period. Note that the performances under Scenarios 2 and 3 are similar, although the performance of Scenario 3 is a slightly better than of Scenario 2 for the peak time simulation. The results indicate that no matter the semi-substituted scenario or the fully substituted scenario, the performance of the TMPA product is acceptable, as all the NS coefficients are greater than 0.7. Hence, if some or all gauge precipitation data are missing, the TMPA data can be useful to complement or act as a substitute for gauge data to obtain satisfactory hydrologic results in subtropical monsoon climate regions where gauge data are only partially available or not available.
5. Conclusions
In this study, the daily gauged precipitation data in the Feilaixia catchment were used to quantitatively and qualitatively evaluate the TMPA product in subtropical monsoon climate regions, and the trends of the consecutive extreme precipitation indices were analyzed using the Cox–Stuart test. The SWAT model was also used to simulate the substitutability of the TMPA product. After comparing our results to those in the literature, some interesting findings were obtained:
1. The TMPA product exhibited higher daily adaptability at lower latitudes and in flat terrain areas both in terms of qualitative and quantitative performance, while more invalid reports and false forecasts appeared at high latitudes and in areas with greater terrain changes. This conclusion was similar to those of Mantas et al. and Prakash et al. [29,31].
2. The capability of the TMPA to capture the RX5day was superior to that of the CDD and CWD. The TMPA was prone to overestimating the CDD and underestimating the CWD. The underestimation of CWDs resulted in relevant agencies paying insufficient attention to consecutive precipitation events, leading to some serious consequences in the humid regions of the South China, such as underestimation of the flood duration and inadequate attention to the occurrence of flood disasters. In addition, the capability of the TMPA to capture consecutive extreme rainfall tended to flatten, because the monthly scale RX5day results indicated that the TMPA tended to overestimate rainfall during the pre-flood period (April–June) and dry season and underestimate consecutive rainfall during the post-flood period (July–September). Moreover, the TMPA can sufficiently capture the upward trend of consecutive drought events in the west region, but it fails to capture the significant upward trend of consecutive rainfall in the southeastern Feilaixia catchment, which was insufficient in the humid regions of southern China. Overall, the capability of the TMPA product to capture consecutive extreme precipitation must be further enhanced.
3. The SWAT model runoff simulation results for the Feilaixia catchment under the three scenarios showed that the accuracy under Scenario 1, which was driven by the gauged data, was higher than that under Scenario 2, with the static parameters set, and Scenario 3, which was solely based on the TMPA product. Moreover, the performances under Scenarios 2 and 3 are nearly the same, as all the NS coefficients are greater than 0.7 during the calibration and validation periods for both scenarios. Therefore, to a certain extent, the TMPA satellite rainfall data can be used to drive the hydrological models to obtain sufficiently accurate and reliable results in subtropical monsoon climate regions where gauged precipitation data are missing or even in cases without gauged data.
These results should be considered with caution, because satellite rainfall products remain inaccurate in their representations of some actual regions. There are also some sources of uncertainty that must be considered, such as sensors and algorithms, which can lead to different results than those of this study.
Author Contributions
Conceptualization, X.C. and G.H.; methodology, X.C.; software, X.C.; validation, X.C.; formal analysis, X.C.; investigation, X.C. and G.H.; resources, G.H.; data curation, X.C. and G.H.; writing—original draft preparation, X.C.; writing—review and editing, X.C. and G.H.; visualization, X.C.; supervision, G.H.; project administration, G.H.; funding acquisition, G.H. All authors have read and agreed to the published version of the manuscript.
Funding
This research was funded by Guangdong Province water conservancy science and technology innovation project, grant number 2016-22, and Water resources conservation and protection fund project in Guangdong province, grant number 201711031.
Acknowledgments
The authors deeply appreciate the editors and the anonymous reviewers for their helpful comments and suggestions.
Conflicts of Interest
The authors declare no conflict of interest.
References
- Hou, A.Y.; Kakar, R.K.; Neeck, S.; Azarbarzin, A.A.; Kummerow, C.D.; Kojima, M.; Oki, R.; Nakamura, K.; Iguchi, T. The global precipitation measurement mission. Bull. Amer. Meteor. Soc. 2014, 95, 701–722. [Google Scholar] [CrossRef]
- Adler, R.F.; Gu, G.; Sapiano, M.; Wang, J.J. Global precipitation: Means, variations and trends during the satellite era (1979–2014). Surv. Geophys. 2017, 38, 679–699. [Google Scholar] [CrossRef] [Green Version]
- Maggioni, V.; Massari, C. On the performance of satellite precipitation products in riverine flood modeling: A review. J. Hydrol. 2018, 558, 214–224. [Google Scholar] [CrossRef]
- Sekaranom, A.B.; Masunaga, H. Origins of heavy precipitation biases in the TRMM PR and TMI products assessed with CloudSat and reanalysis data. J. Appl. Meteorol. Clim. 2019, 58, 37–54. [Google Scholar] [CrossRef]
- Salles, L.; Satge, F.; Roig, H.; Almeida, T.; Olivetti, D.; Ferreira, W. Seasonal effect on spatial and temporal consistency of the new GPM-based IMERG-v5 and GSMaP-v7 satellite precipitation estimates in Brazil’s central plateau region. Water 2019, 11, 668. [Google Scholar] [CrossRef] [Green Version]
- Wang, J.L.; Chen, H.; Xu, C.Y.; Zeng, Q.; Wang, Q.J.; Kim, J.S.; Chen, J.; Guo, S.L. Tracking the error sources of spatiotemporal differences in TRMM accuracy using error decomposition method. Hydrol. Res. 2018, 49, 1960–1976. [Google Scholar] [CrossRef]
- Zad, S.M.; Zulkafli, Z.; Muharram, F. Satellite rainfall (TRMM 3B42-V7) performance assessment and adjustment over Pahang River Basin, Malaysia. Remote Sens. 2018, 10, 388. [Google Scholar] [CrossRef] [Green Version]
- Kenabatho, P.K.; Parida, B.P.; Moalafhi, D.B. Evaluation of satellite and simulated rainfall products for hydrological applications in the Notwane catchment, Botswana. Phys. Chem. Earth 2017, 100, 19–30. [Google Scholar] [CrossRef]
- Golroudbary, V.R.; Zeng, Y.J.; Mannaerts, C.M.; Su, Z.B. Response of extreme precipitation to urbanization over the Netherlands. J. Appl. Meteorol. Clim. 2019, 58, 645–661. [Google Scholar] [CrossRef]
- Wilhelm, B.; Arnaud, F.; Enters, D.; Allignol, F.; Legaz, A.; Magand, O.; Revillon, S.; Giguet-Covex, C.; Malet, E. Does global warming favour the occurrence of extreme floods in European Alps? First evidences from a NW Alps proglacial lake sediment record. Clim. Chang. 2012, 113, 563–581. [Google Scholar] [CrossRef]
- Wu, C.H.; Huang, G.R.; Yu, H.J.; Chen, Z.Q. Spatial and temporal distributions of trends in climate extremes of the Feilaixia catchment in the upstream area of the Beijiang River Basin, South China. Int. J. Climatol. 2014, 34, 3161–3178. [Google Scholar] [CrossRef]
- Tong, S.; Li, X.; Zhang, J.; Bao, Y.; Bao, Y.; Na, L.; Si, A. Spatial and temporal variability in extreme temperature and precipitation events in Inner Mongolia (China) during 1960–2017. Sci. Total Environ. 2019, 649, 75–89. [Google Scholar] [CrossRef]
- Changnon, D.; Gensini, V.A. Changing spatiotemporal patterns of 5- and 10-Day Illinois heavy precipitation amounts, 1900–2018. J. Appl. Meteoro.l Clim. 2019, 58, 1523–1533. [Google Scholar] [CrossRef]
- Shi, J.; Cui, L.; Wen, K.; Tian, Z.; Zhang, B. Trends in the consecutive days of temperature and precipitation extremes in China during 1961–2015. Environ. Res. 2018, 161, 381–391. [Google Scholar] [CrossRef] [PubMed]
- Singh, V.; Goyal, M.K. Spatio-temporal heterogeneity and changes in extreme precipitation over eastern Himalayan catchments India. Stoch. Env. Res. Risk Assess. 2017, 31, 2527–2546. [Google Scholar] [CrossRef]
- Salman, S.A.; Shahid, S.; Ismail, T.; Chung, E.S.; Al-Abadi, A.M. Long-term trends in daily temperature extremes in Iraq. Atmos. Res. 2017, 198, 97–107. [Google Scholar] [CrossRef]
- Fatichi, S.; Barbosa, S.M.; Caporali, E.; Silva, M.E. Deterministic versus stochastic trends: Detection and challenges. J. Geophys. Res. Atmos. 2009, 114, D18121. [Google Scholar] [CrossRef] [Green Version]
- Kumar, B.; Lakshmi, V. Accessing the capability of TRMM 3B42 V7 to simulate streamflow during extreme rain events: Case study for a Himalayan River Basin. J. Earth. Syst. Sci. 2018, 127, 27. [Google Scholar] [CrossRef] [Green Version]
- Zhang, X.; Yang, F. RClimDex (1.0)—User Manual; Climate Research Branch Environment Canada: Downsview, ON, Canada, 2004. [Google Scholar]
- Santos, C.A.C.D.; Neale, C.M.U.; Rao, T.V.R.; Silva, B.B.D. Trends in indices for extremes in daily temperature and precipitation over Utah, USA. Int. J. Climatol. 2011, 31, 1813–1822. [Google Scholar] [CrossRef]
- Folland, C.K.; Horton, B.; Paul, S. Report of WMO Working Group on Climate Change Detection Task Group on Climate Change Indices; World Meteorological Organisation: Geneva, Switzerland, 1999. [Google Scholar]
- Wilks, D.S. Statistical Methods in the Atmospheric Sciences, 3rd ed.; Academic Press: Cambridge, MA, USA, 2005. [Google Scholar] [CrossRef]
- Yang, Y.; Tang, J.; Xiong, Z.; Dong, X. Evaluation of high-resolution gridded precipitation data in arid and semiarid regions: Heihe River Basin, Northwest China. J. Hydrometerol. 2017, 18, 3075–3101. [Google Scholar] [CrossRef]
- Cox, D.R.; Stuart, A. Some quick sign tests for trend in location and dispersion. Biometrika 1955, 42, 80–95. [Google Scholar] [CrossRef] [Green Version]
- Conover, W.J. Practical nonparametric statistics. Technometrics 1972, 14, 977–979. [Google Scholar] [CrossRef]
- Arnold, J.G.; Srinivasan, R.; Muttiah, R.S.; Williams, J.R. Large area hydrologic modeling and assessment part 1: Model development. J. Am. Water Resour. Assoc. 1998, 34, 73–89. [Google Scholar] [CrossRef]
- Cai, Y.; Jin, C.; Wang, A.; Guan, D.; Wu, J.; Yuan, F. Comprehensive precipitation evaluation of TRMM 3B42 with dense rain gauge networks in a mid-latitude basin, northeast, China. Theor. Appl. Climatol. 2016, 126, 659–671. [Google Scholar] [CrossRef]
- Zulkafli, Z.; Buytaert, W.; Onof, C.; Manz, B.; Tarnavsky, E.; Lavado, W.; Guyot, J. A Comparative performance analysis of TRMM 3B42 (TMPA) versions 6 and 7 for hydrological applications over Andean–Amazon River Basins. J. Hydrometeor. 2014, 15, 581–592. [Google Scholar] [CrossRef]
- Mantas, V.M.; Liu, Z.; Caro, C.; Pereira, A.J.S.C. Validation of TRMM multi-satellite precipitation analysis (TMPA) products in the Peruvian Andes. Atmos. Res. 2015, 163, 132–145. [Google Scholar] [CrossRef]
- Jiang, D.; Zhang, H.; Li, R. Performance evaluation of TMPA version 7 estimates for precipitation and its extremes in Circum-Bohai-Sea region, China. Theor. Appl. Climatol. 2016, 130, 1021–1033. [Google Scholar] [CrossRef]
- Prakash, S.; Mitra, A.K.; Aghakouchak, A.; Pai, D. Error characterization of TRMM multisatellite precipitation analysis (TMPA-3B42) products over India for different seasons. J. Hydrol. 2015, 529, 1302–1312. [Google Scholar] [CrossRef]
- Chen, Y.; Ebert, E.E.; Walsh, K.J.E.; Davidson, N.E. Evaluation of TRMM 3B42 precipitation estimates of tropical cyclone rainfall using PACRAIN data. J. Geophys. Res. Atmos. 2013, 118, 2184–2196. [Google Scholar] [CrossRef]
- Wang, Z.; Zhong, R.; Lai, C. Evaluation and hydrologic validation of TMPA satellite precipitation product downstream of the Pearl River Basin, China. Hydrol. Process. 2017, 31, 4169–4182. [Google Scholar] [CrossRef]
- Hur, J.; Raghavan, S.V.; Nguyen, N.S.; Liong, S.Y. Are satellite products good proxies for gauge precipitation over Singapore? Theor. Appl. Climatol. 2017, 132, 921–932. [Google Scholar] [CrossRef]
- Zhang, Q.; Xu, C.Y.; Zhang, Z. Observed changes of drought/wetness episodes in the Pearl River basin, China, using the standardized precipitation index and aridity index. Theor. Appl. Climatol. 2009, 98, 89–99. [Google Scholar] [CrossRef]
- Yong, B.; Ren, L.; Hong, Y.; Gourley, J.; Tian, Y.; Huffman, G.J.; Chen, X.; Wang, W.; Wen, Y. First evaluation of the climatological calibration algorithm in the real-time TMPA precipitation estimates over two basins at high and low latitudes. Water Resour. Res. 2013, 49, 2461–2472. [Google Scholar] [CrossRef] [Green Version]
Figure 1.
Location, topography, and stations of the Feilaixia catchment.
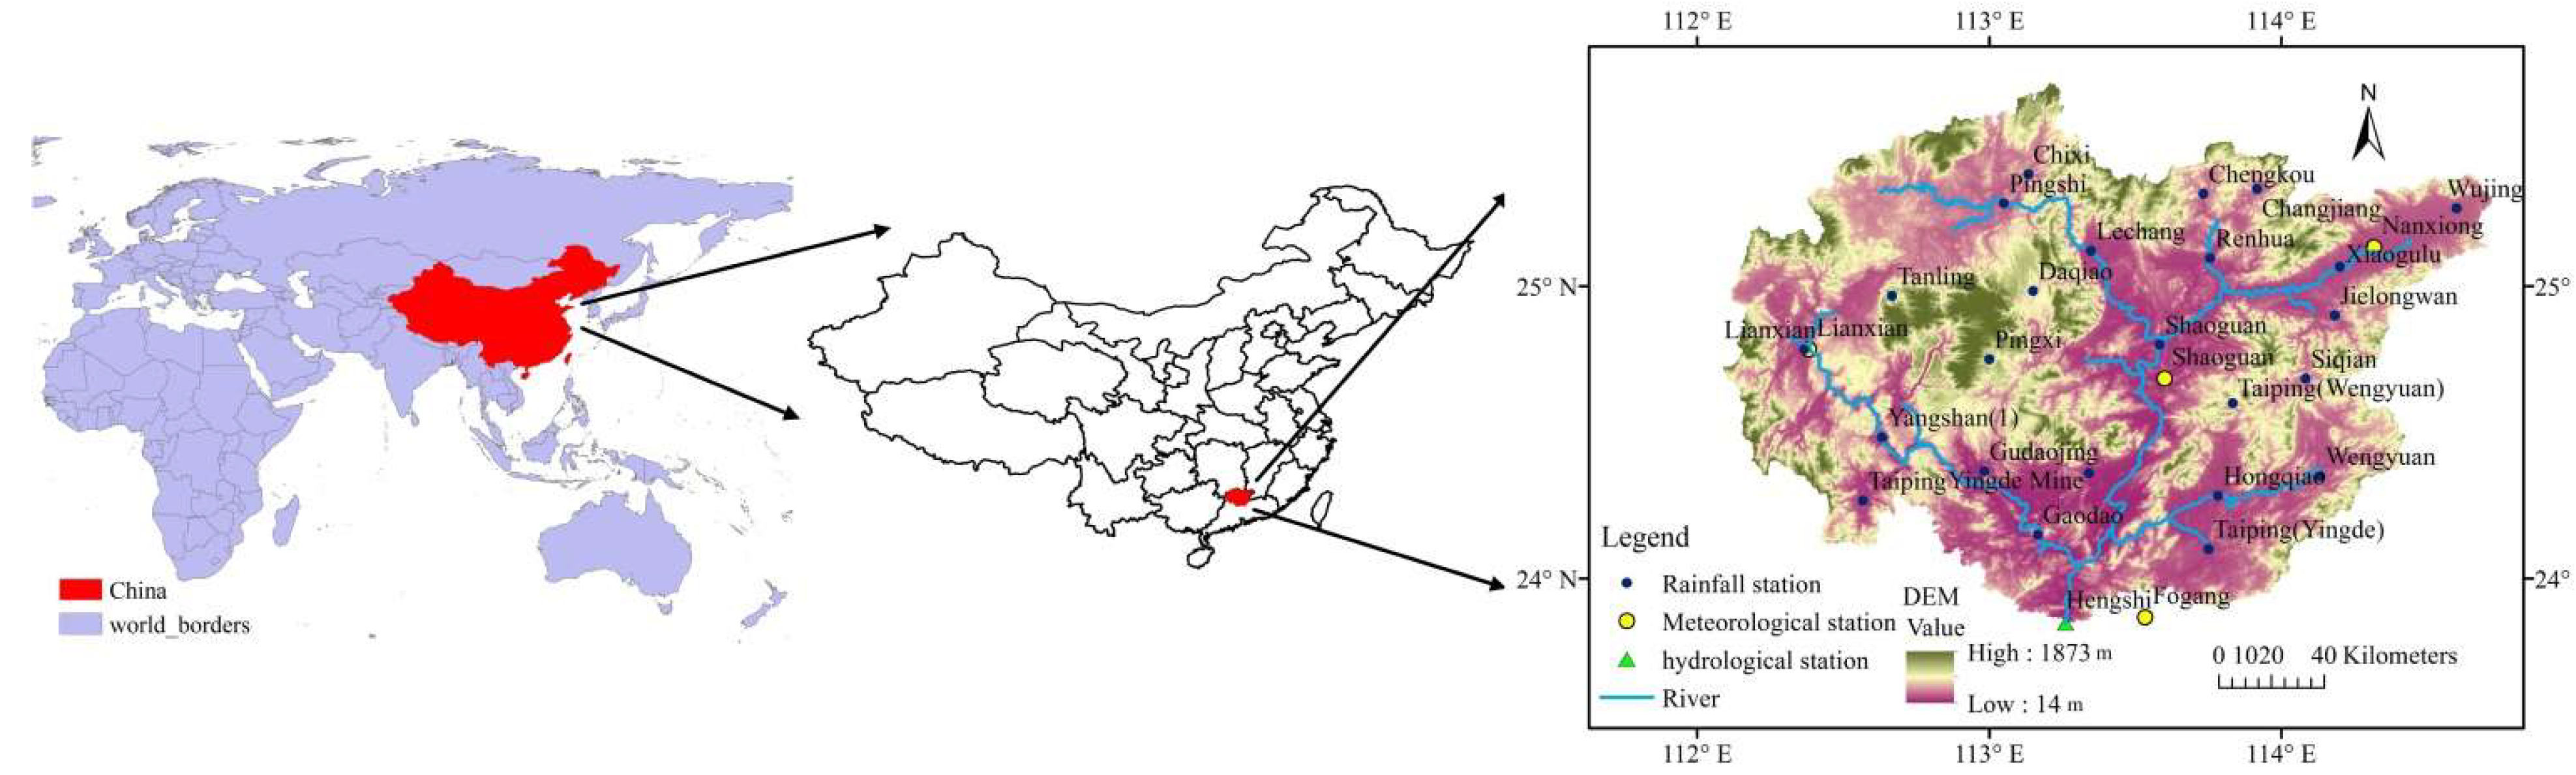
Figure 2.
Spatial distributions of the four detected statistical indices: (a) POD; (b) FAR; (c) ACC; and (d) FBI.
Figure 2.
Spatial distributions of the four detected statistical indices: (a) POD; (b) FAR; (c) ACC; and (d) FBI.
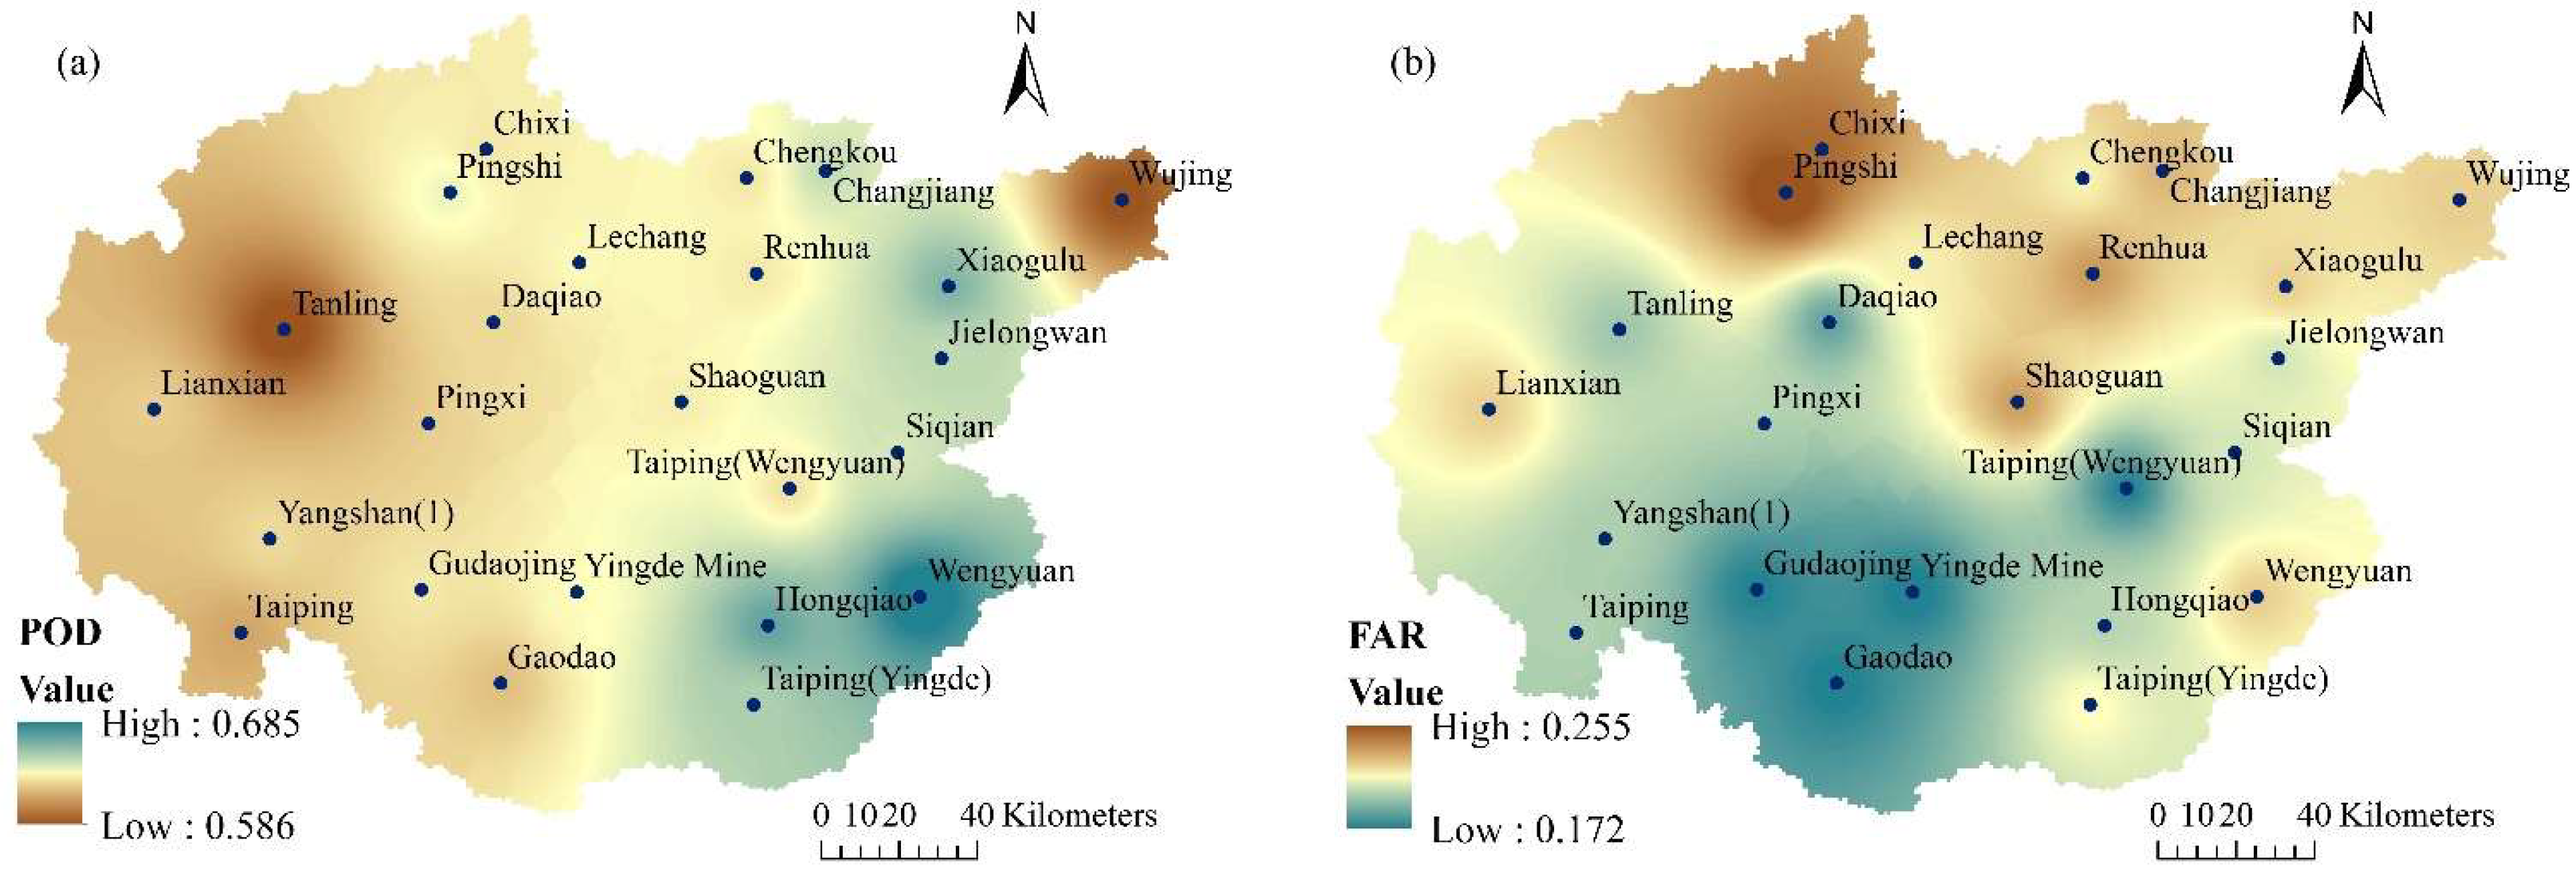
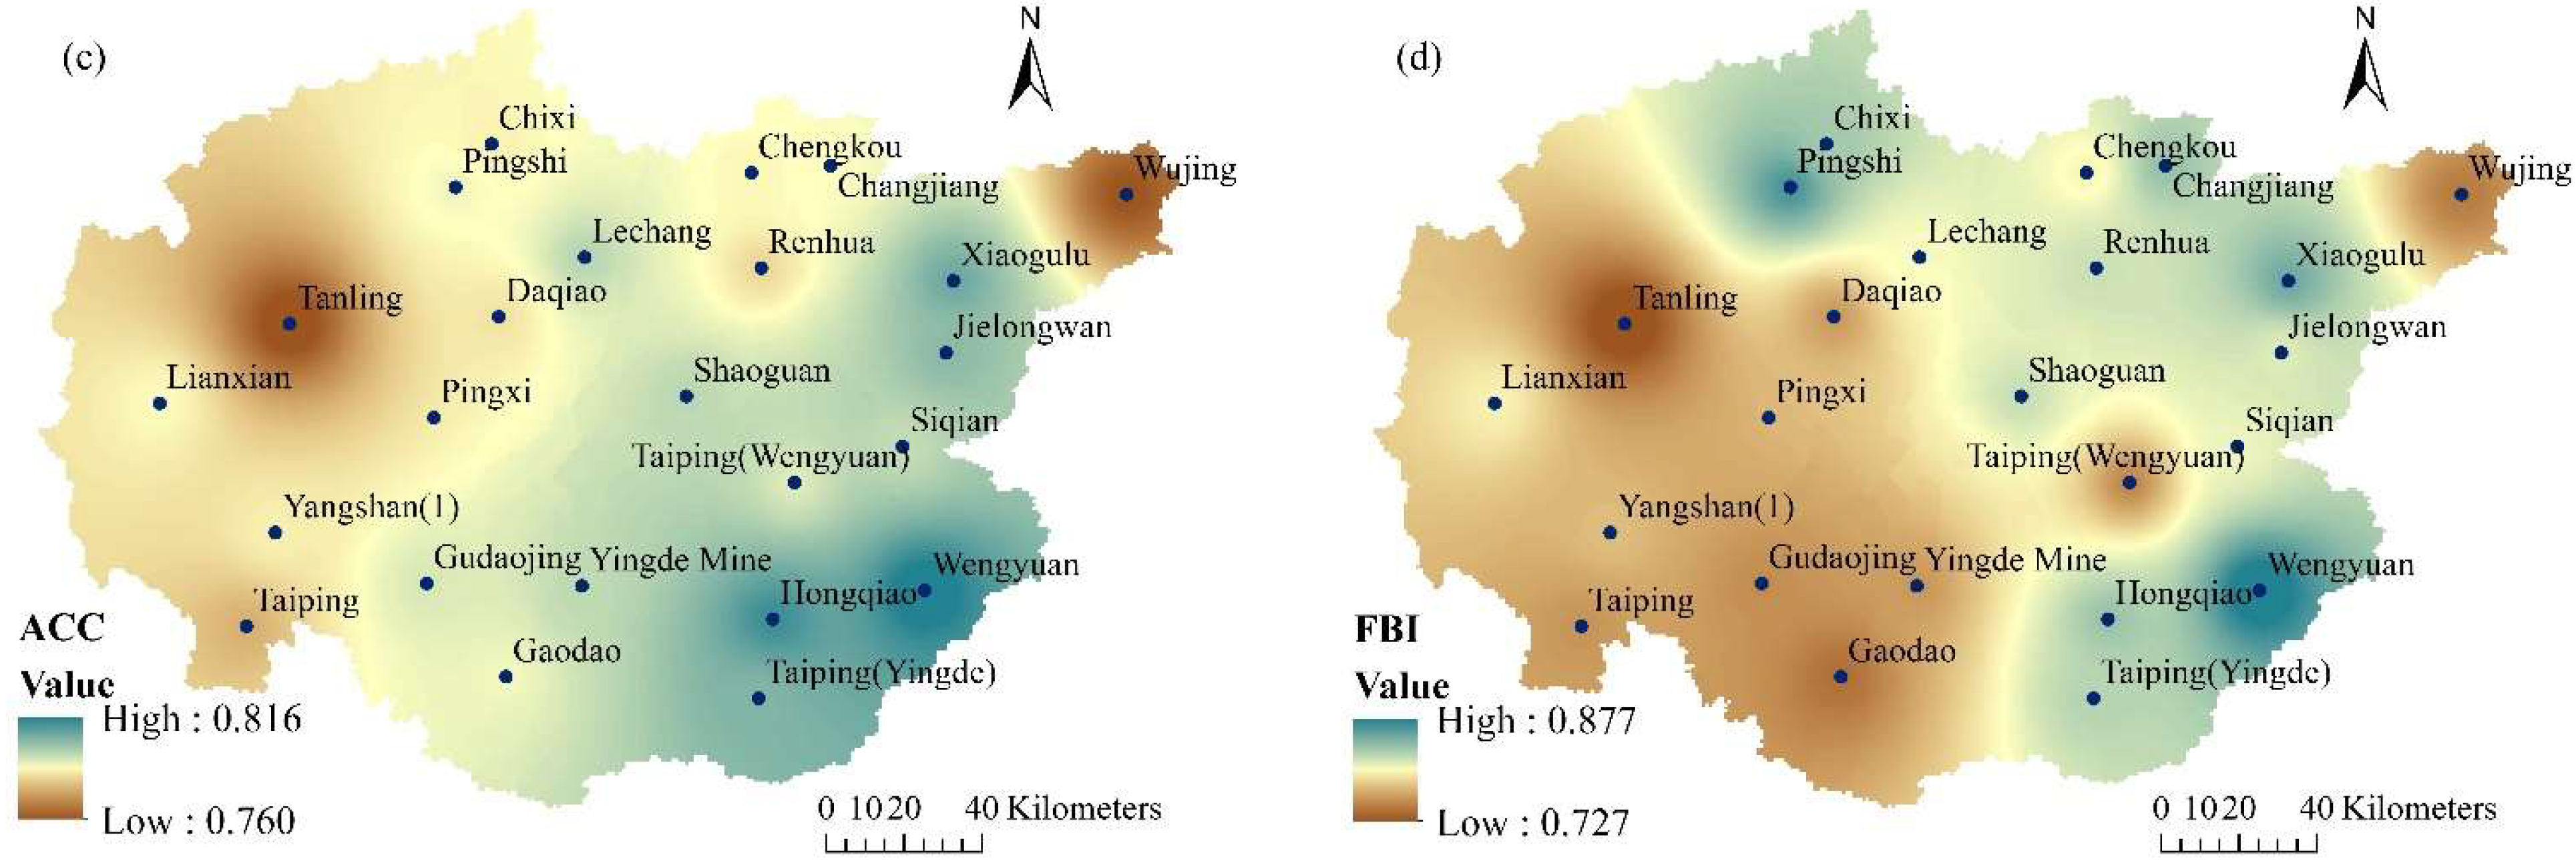
Figure 3.
Spatial distributions of the four quantitative statistical indices: (a) PCC; (b) Bias; (c) RMSE; and (d) ME.
Figure 3.
Spatial distributions of the four quantitative statistical indices: (a) PCC; (b) Bias; (c) RMSE; and (d) ME.
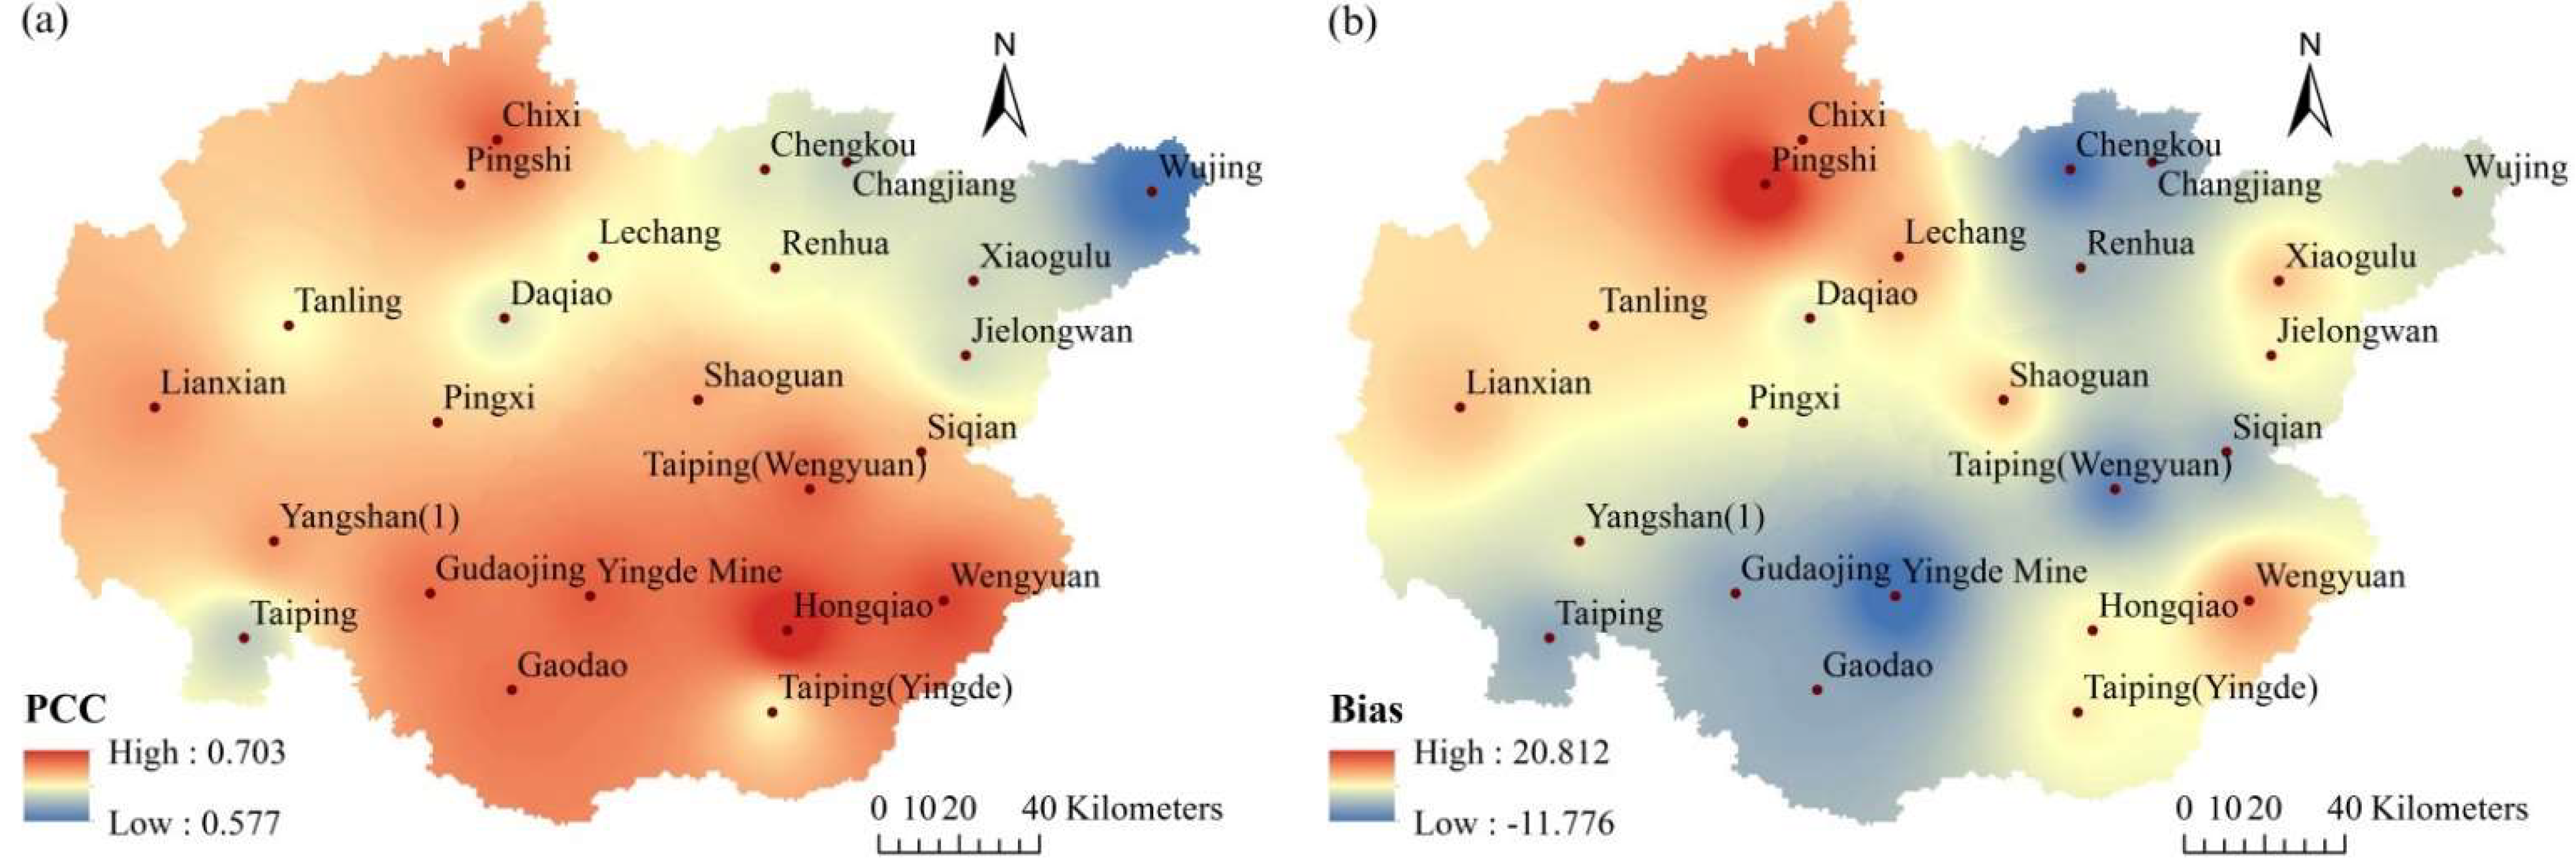
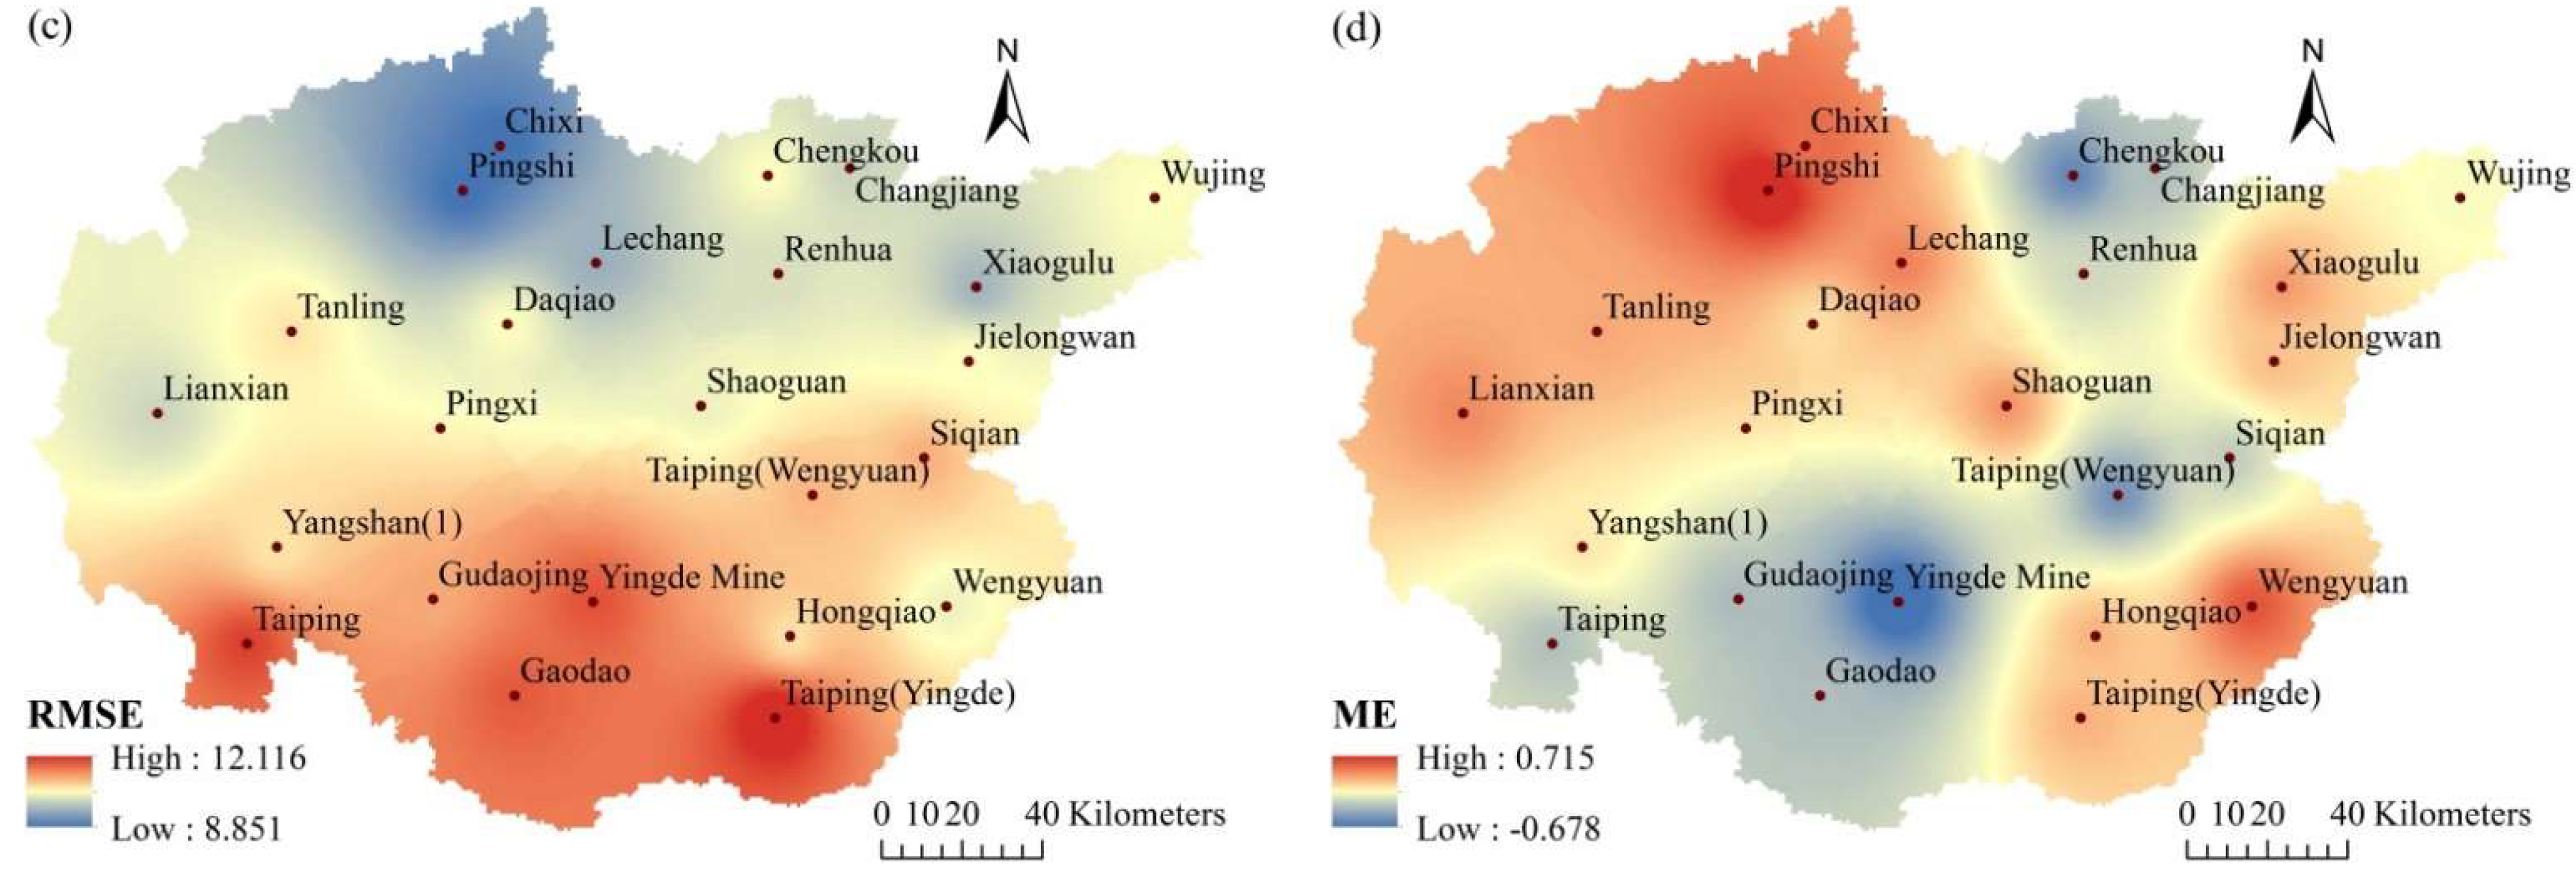
Figure 4.
Box diagrams of the four statistical performance indices for RX5day at a monthly scale from 1998 to 2015: (a) PCC; (b) Bias; (c) RMSE; and (d) ME.
Figure 4.
Box diagrams of the four statistical performance indices for RX5day at a monthly scale from 1998 to 2015: (a) PCC; (b) Bias; (c) RMSE; and (d) ME.
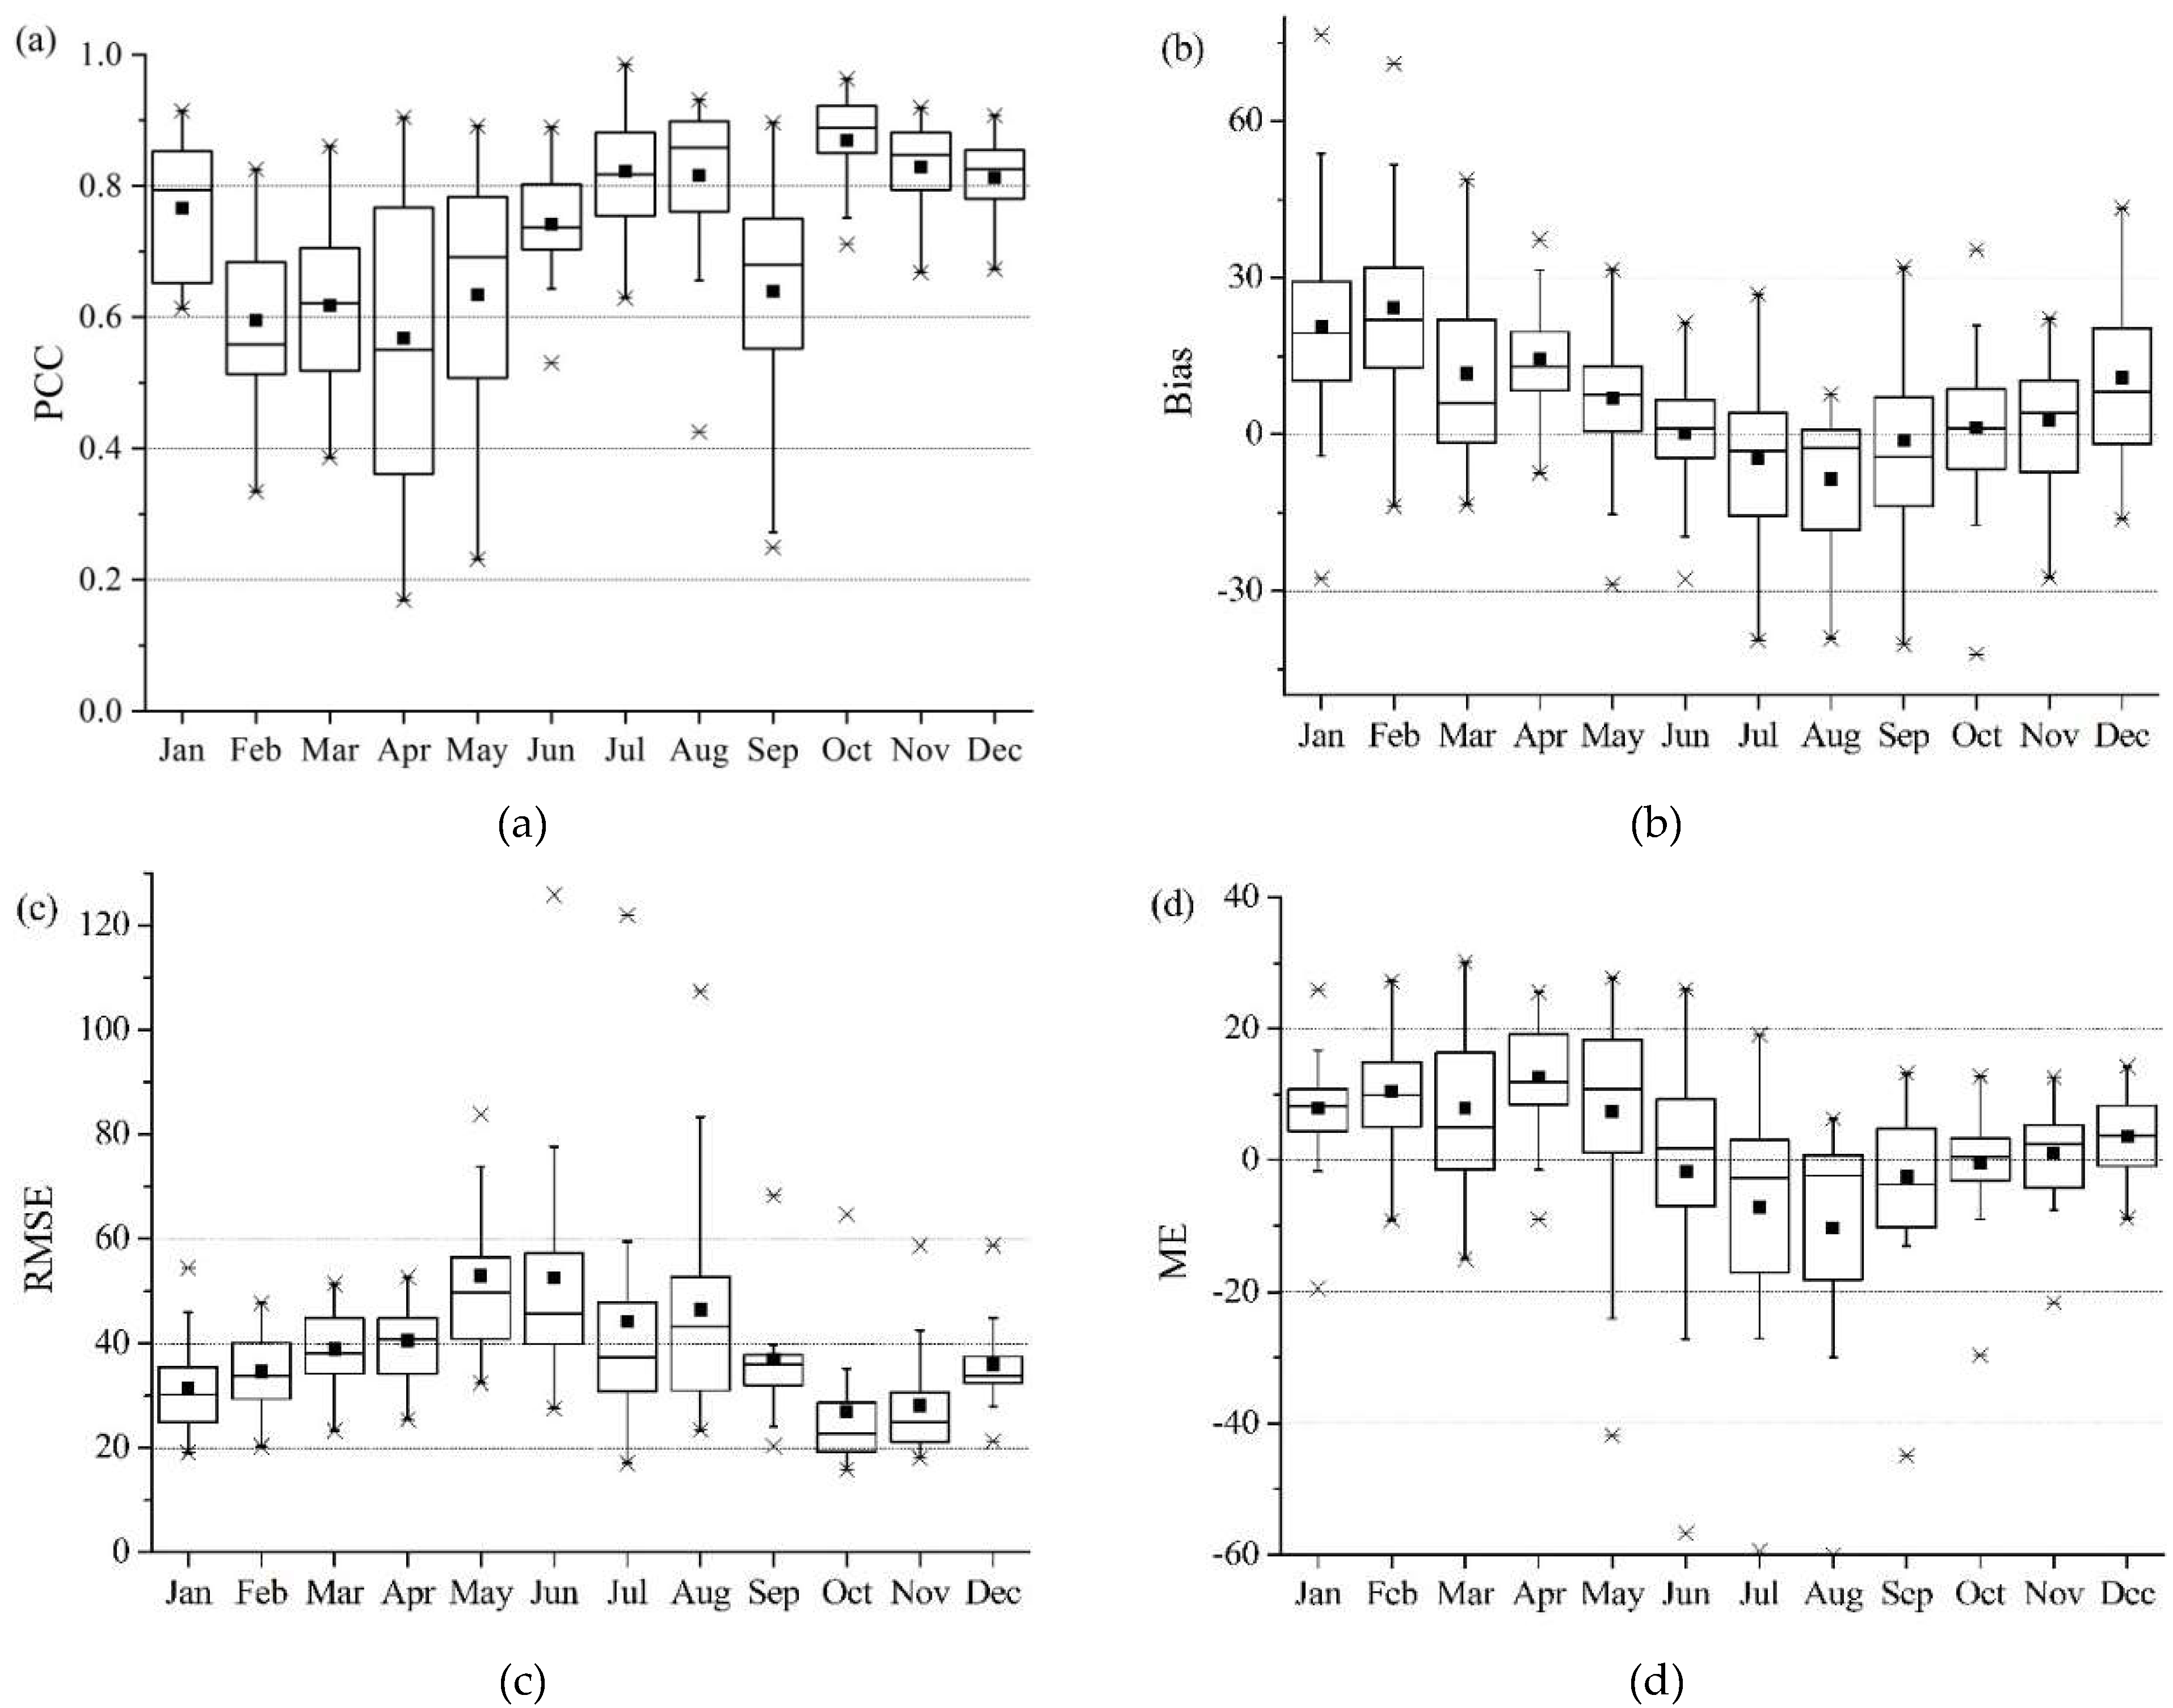
Figure 5.
Spatial distribution maps of three consecutive extreme indices of the two datasets using the Cox–Stuart test.
Figure 5.
Spatial distribution maps of three consecutive extreme indices of the two datasets using the Cox–Stuart test.


Figure 6.
Runoff calibration and validation processes in the Feilaixia catchment under the three scenarios: (a) Scenario 1; (b) Scenario 2; and (c) Scenario 3.
Figure 6.
Runoff calibration and validation processes in the Feilaixia catchment under the three scenarios: (a) Scenario 1; (b) Scenario 2; and (c) Scenario 3.


Table 1.
Rainfall event definitions.
| Rainfall Event | Station | ||
|---|---|---|---|
| Rain | No Rain | ||
| TMPA | Rain | a | b |
| No Rain | c | d | |
Table 2.
Results of three consecutive extreme climate event indices from 1998 to 2015.
| CDD | ||||
|---|---|---|---|---|
| PCC | Bias (%) | RMSE (d) | ME (d) | |
| Minimum | −0.014 | 4.802 | 13.762 | 1.889 |
| 1st quartile | 0.127 | 16.787 | 15.852 | 6.139 |
| Median | 0.319 | 25.808 | 16.400 | 8.750 |
| 3rd quartile | 0.405 | 30.991 | 18.729 | 10.417 |
| Maximum | 0.638 | 39.813 | 24.369 | 12.111 |
| Mean | 0.297 | 24.134 | 17.360 | 8.153 |
| CWD | ||||
| PCC | Bias (%) | RMSE (d) | ME (d) | |
| Minimum | −0.214 | −28.520 | 1.599 | −4.389 |
| 1st quartile | 0.140 | −9.192 | 2.600 | −1.028 |
| Median | 0.384 | −6.477 | 2.953 | −0.667 |
| 3rd quartile | 0.495 | −0.949 | 3.468 | −0.083 |
| Maximum | 0.783 | 2.685 | 5.050 | 0.222 |
| Mean | 0.335 | −6.292 | 3.098 | −0.720 |
| RX5day | ||||
| PCC | Bias (%) | RMSE (mm) | ME (mm) | |
| Minimum | 0.141 | −29.851 | 33.700 | −66.871 |
| 1st quartile | 0.439 | −8.638 | 46.833 | −18.422 |
| Median | 0.648 | −4.188 | 53.943 | −8.032 |
| 3rd quartile | 0.746 | −0.201 | 70.838 | −0.498 |
| Maximum | 0.932 | 11.950 | 114.896 | 20.863 |
| Mean | 0.603 | −4.526 | 60.260 | −11.422 |
Table 3.
Scenario information.
| Scenario | Precipitation Input | Parameters Set | Remarks |
|---|---|---|---|
| 1 | Gauged data | Calibrated a set of initial parameters and termed them the static parameter set | Traditional scenario |
| 2 | TMPA data | The static parameter set | Scenario where gauged precipitation is partially missing in time or space (semi-substituted scenario) |
| 3 | TMPA data | Re-calibrated the initial parameter set | Scenario with no actual gauged precipitation (fully substituted scenario) |
Table 4.
Results of the four evaluation indices for the runoff simulations under three scenarios.
| Calibration Period (2000–2007) | Validation Period (2008–2011) | |||||||
|---|---|---|---|---|---|---|---|---|
| NS | RE (%) | PCC | RMSE (mm) | NS | RE (%) | PCC | RMSE (mm) | |
| Scenario 1 | 0.81 | 4.27 | 0.900 | 546.41 | 0.85 | −0.83 | 0.923 | 468.20 |
| Scenario 2 | 0.73 | −4.81 | 0.853 | 655.57 | 0.78 | −2.89 | 0.888 | 562.95 |
| Scenario 3 | 0.72 | 1.19 | 0.850 | 661.47 | 0.79 | −6.17 | 0.889 | 559.04 |
© 2020 by the authors. Licensee MDPI, Basel, Switzerland. This article is an open access article distributed under the terms and conditions of the Creative Commons Attribution (CC BY) license (http://creativecommons.org/licenses/by/4.0/).
Share and Cite
MDPI and ACS Style
Chen, X.; Huang, G. Applicability and Hydrologic Substitutability of TMPA Satellite Precipitation Product in the Feilaixia Catchment, China. Water 2020, 12, 1803. https://doi.org/10.3390/w12061803
AMA Style
Chen X, Huang G. Applicability and Hydrologic Substitutability of TMPA Satellite Precipitation Product in the Feilaixia Catchment, China. Water. 2020; 12(6):1803. https://doi.org/10.3390/w12061803
Chicago/Turabian StyleChen, Xiaoli, and Guoru Huang. 2020. "Applicability and Hydrologic Substitutability of TMPA Satellite Precipitation Product in the Feilaixia Catchment, China" Water 12, no. 6: 1803. https://doi.org/10.3390/w12061803
Note that from the first issue of 2016, this journal uses article numbers instead of page numbers. See further details here.