Applicability and Hydrologic Substitutability of TMPA Satellite Precipitation Product in the Feilaixia Catchment, China
Abstract
1. Introduction
2. Study Area and Materials
3. Methods
3.1. Climatic Indices
3.2. Statistical Performance Indices
3.2.1. Rainfall Detected Statistical Indices
3.2.2. Quantitative Statistical Indices
3.3. Cox–Stuart Test
3.4. Soil and Water Assessment Tool Model
4. Results and Discussion
4.1. Rainfall-detected and Quantitative Performance of the TMPA Product
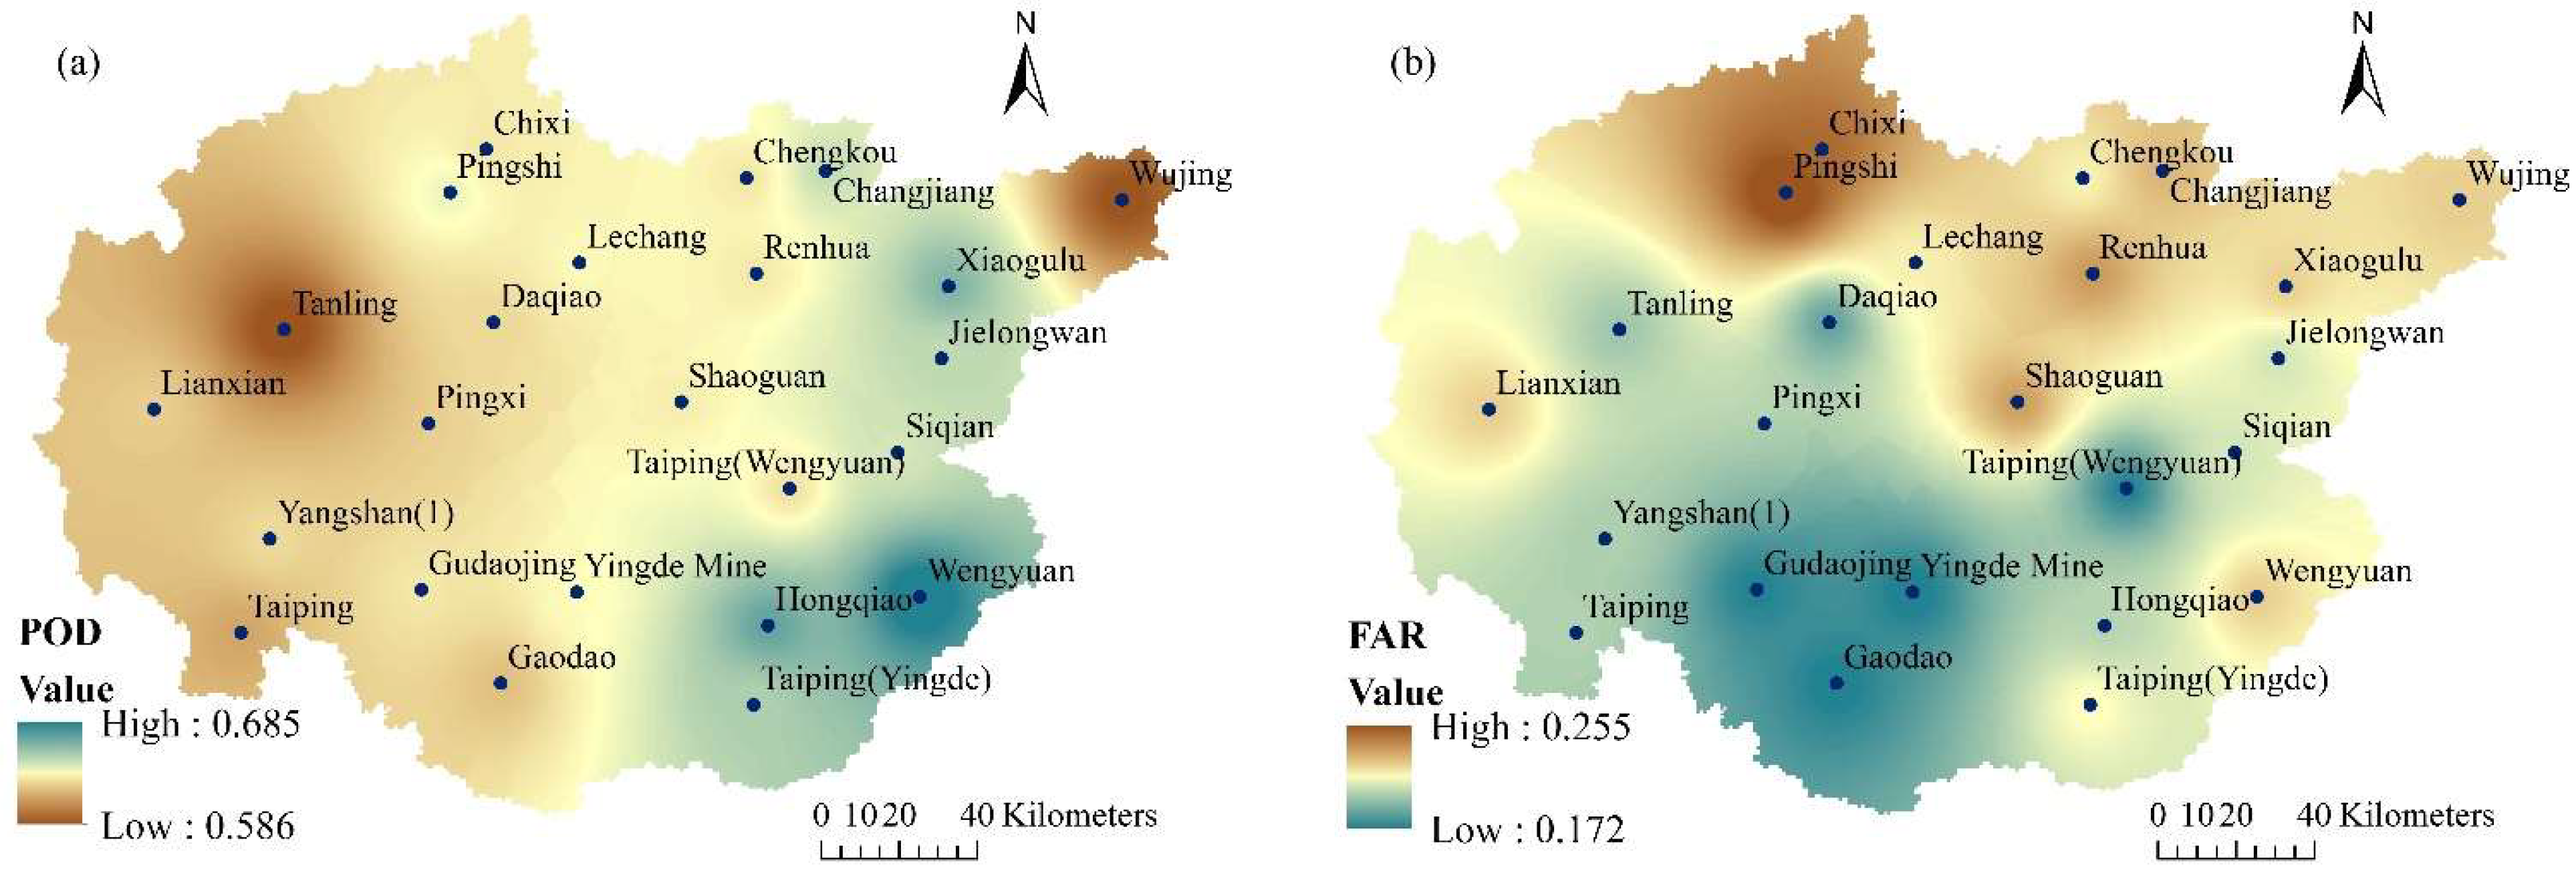
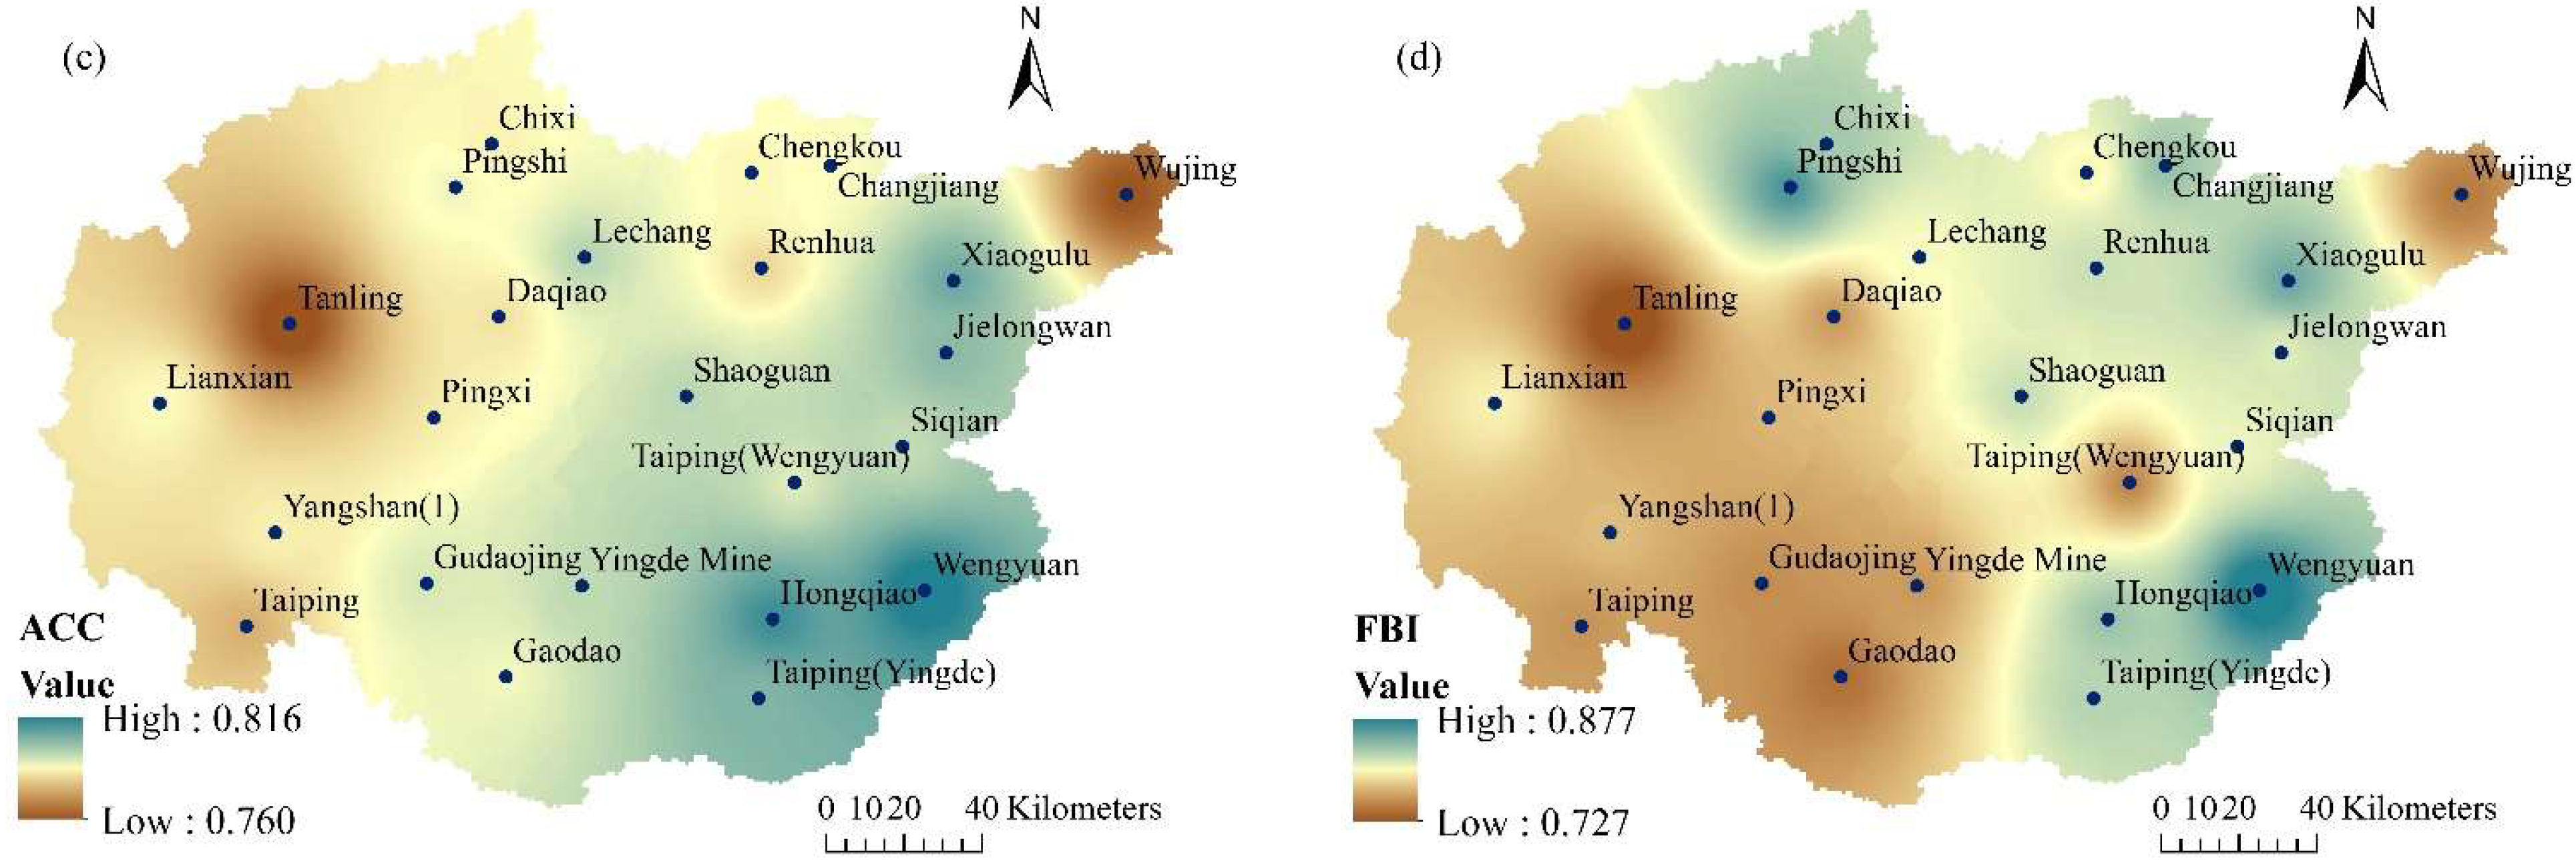
4.1.1. Results from the Rainfall Detected Statistical Indices
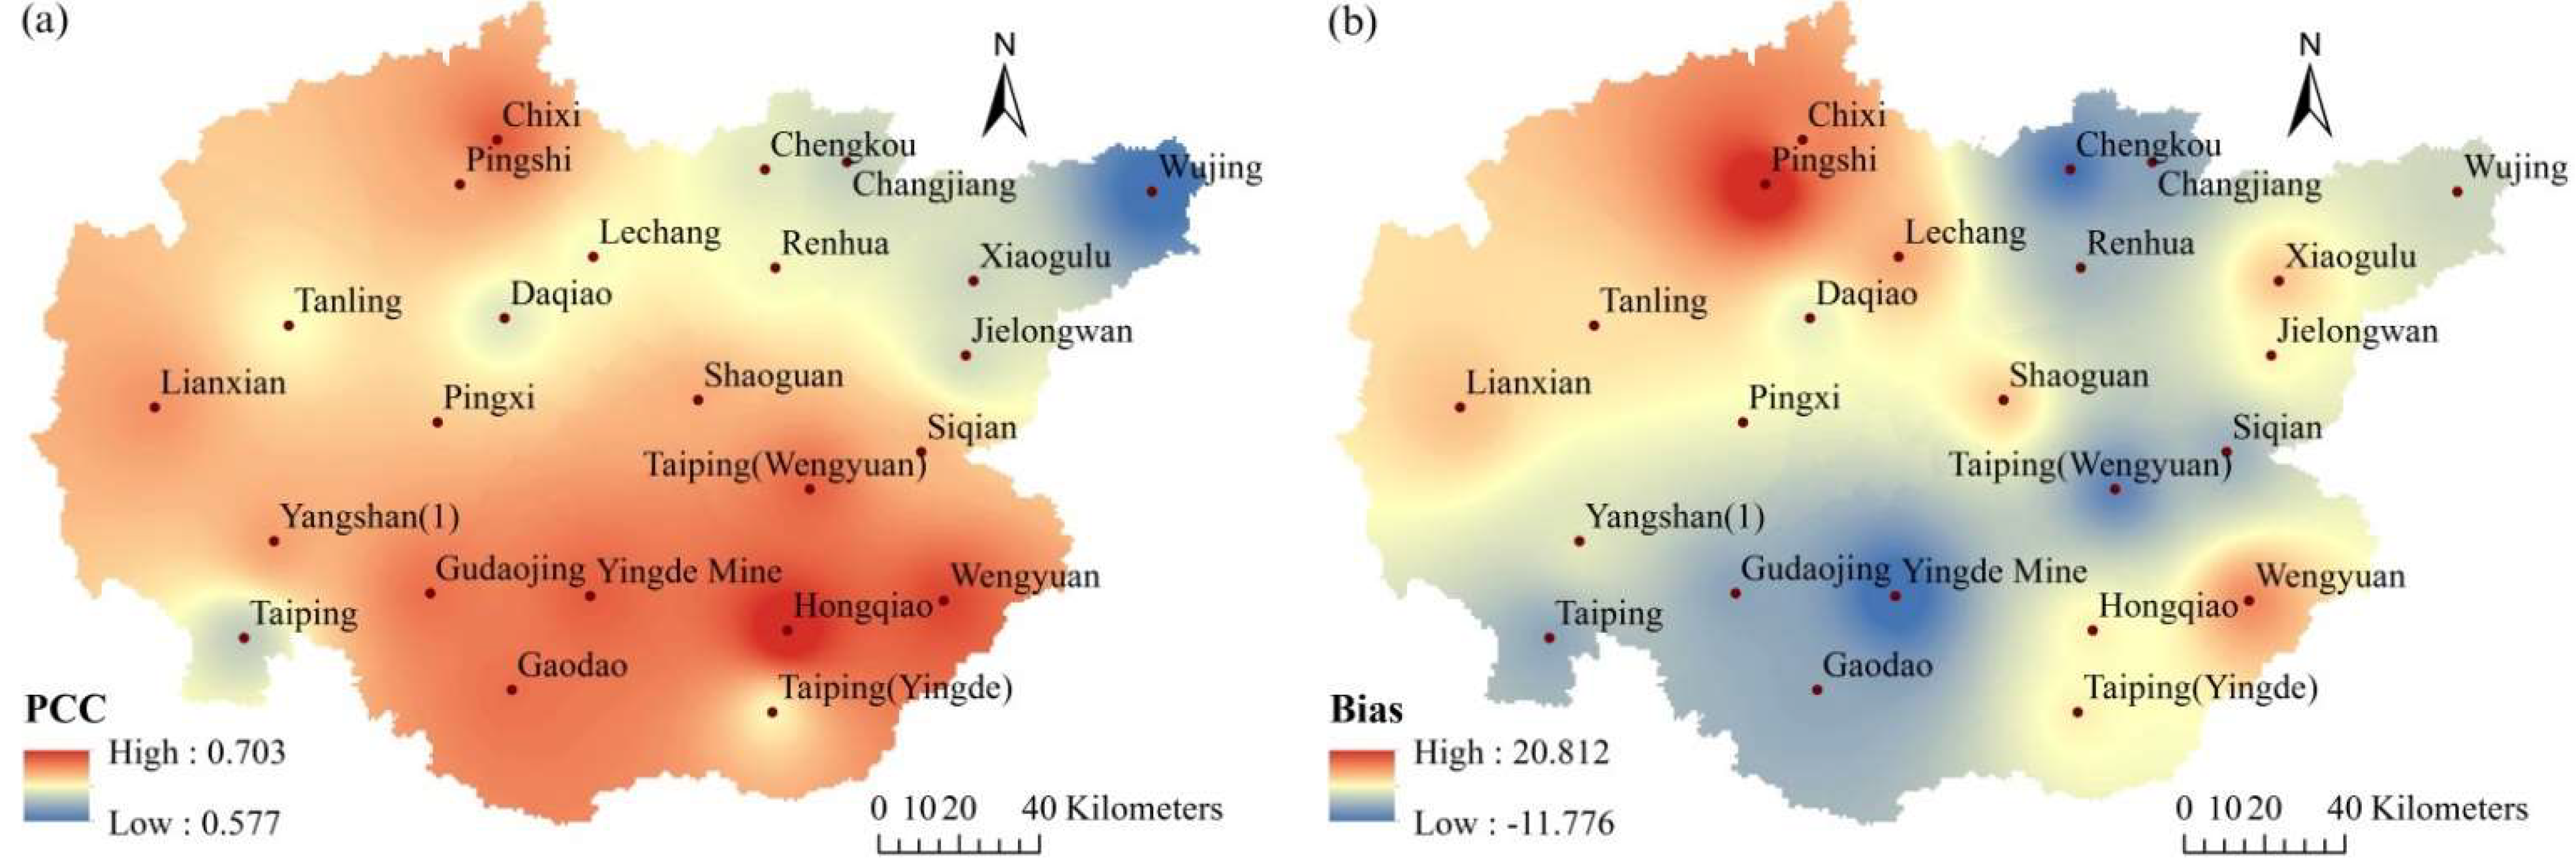
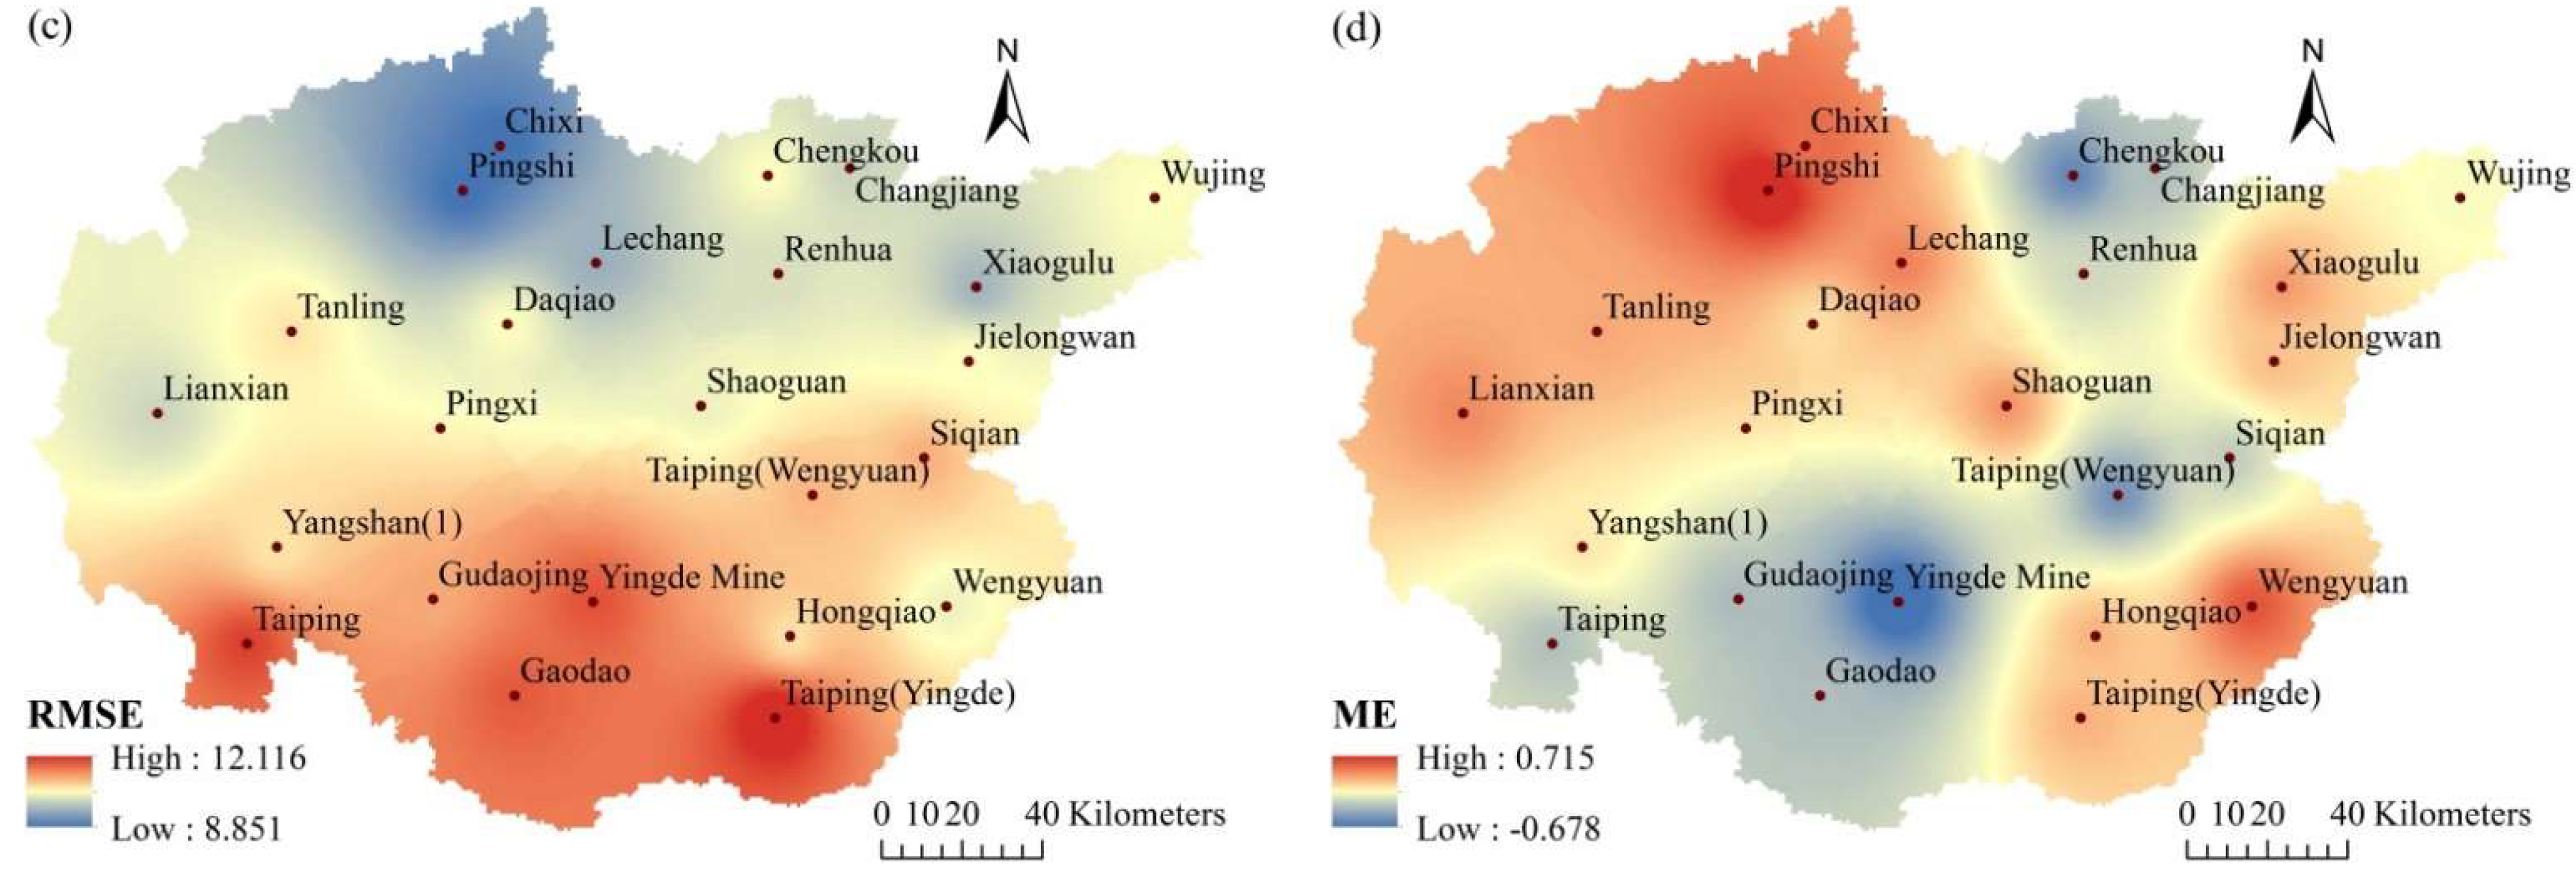
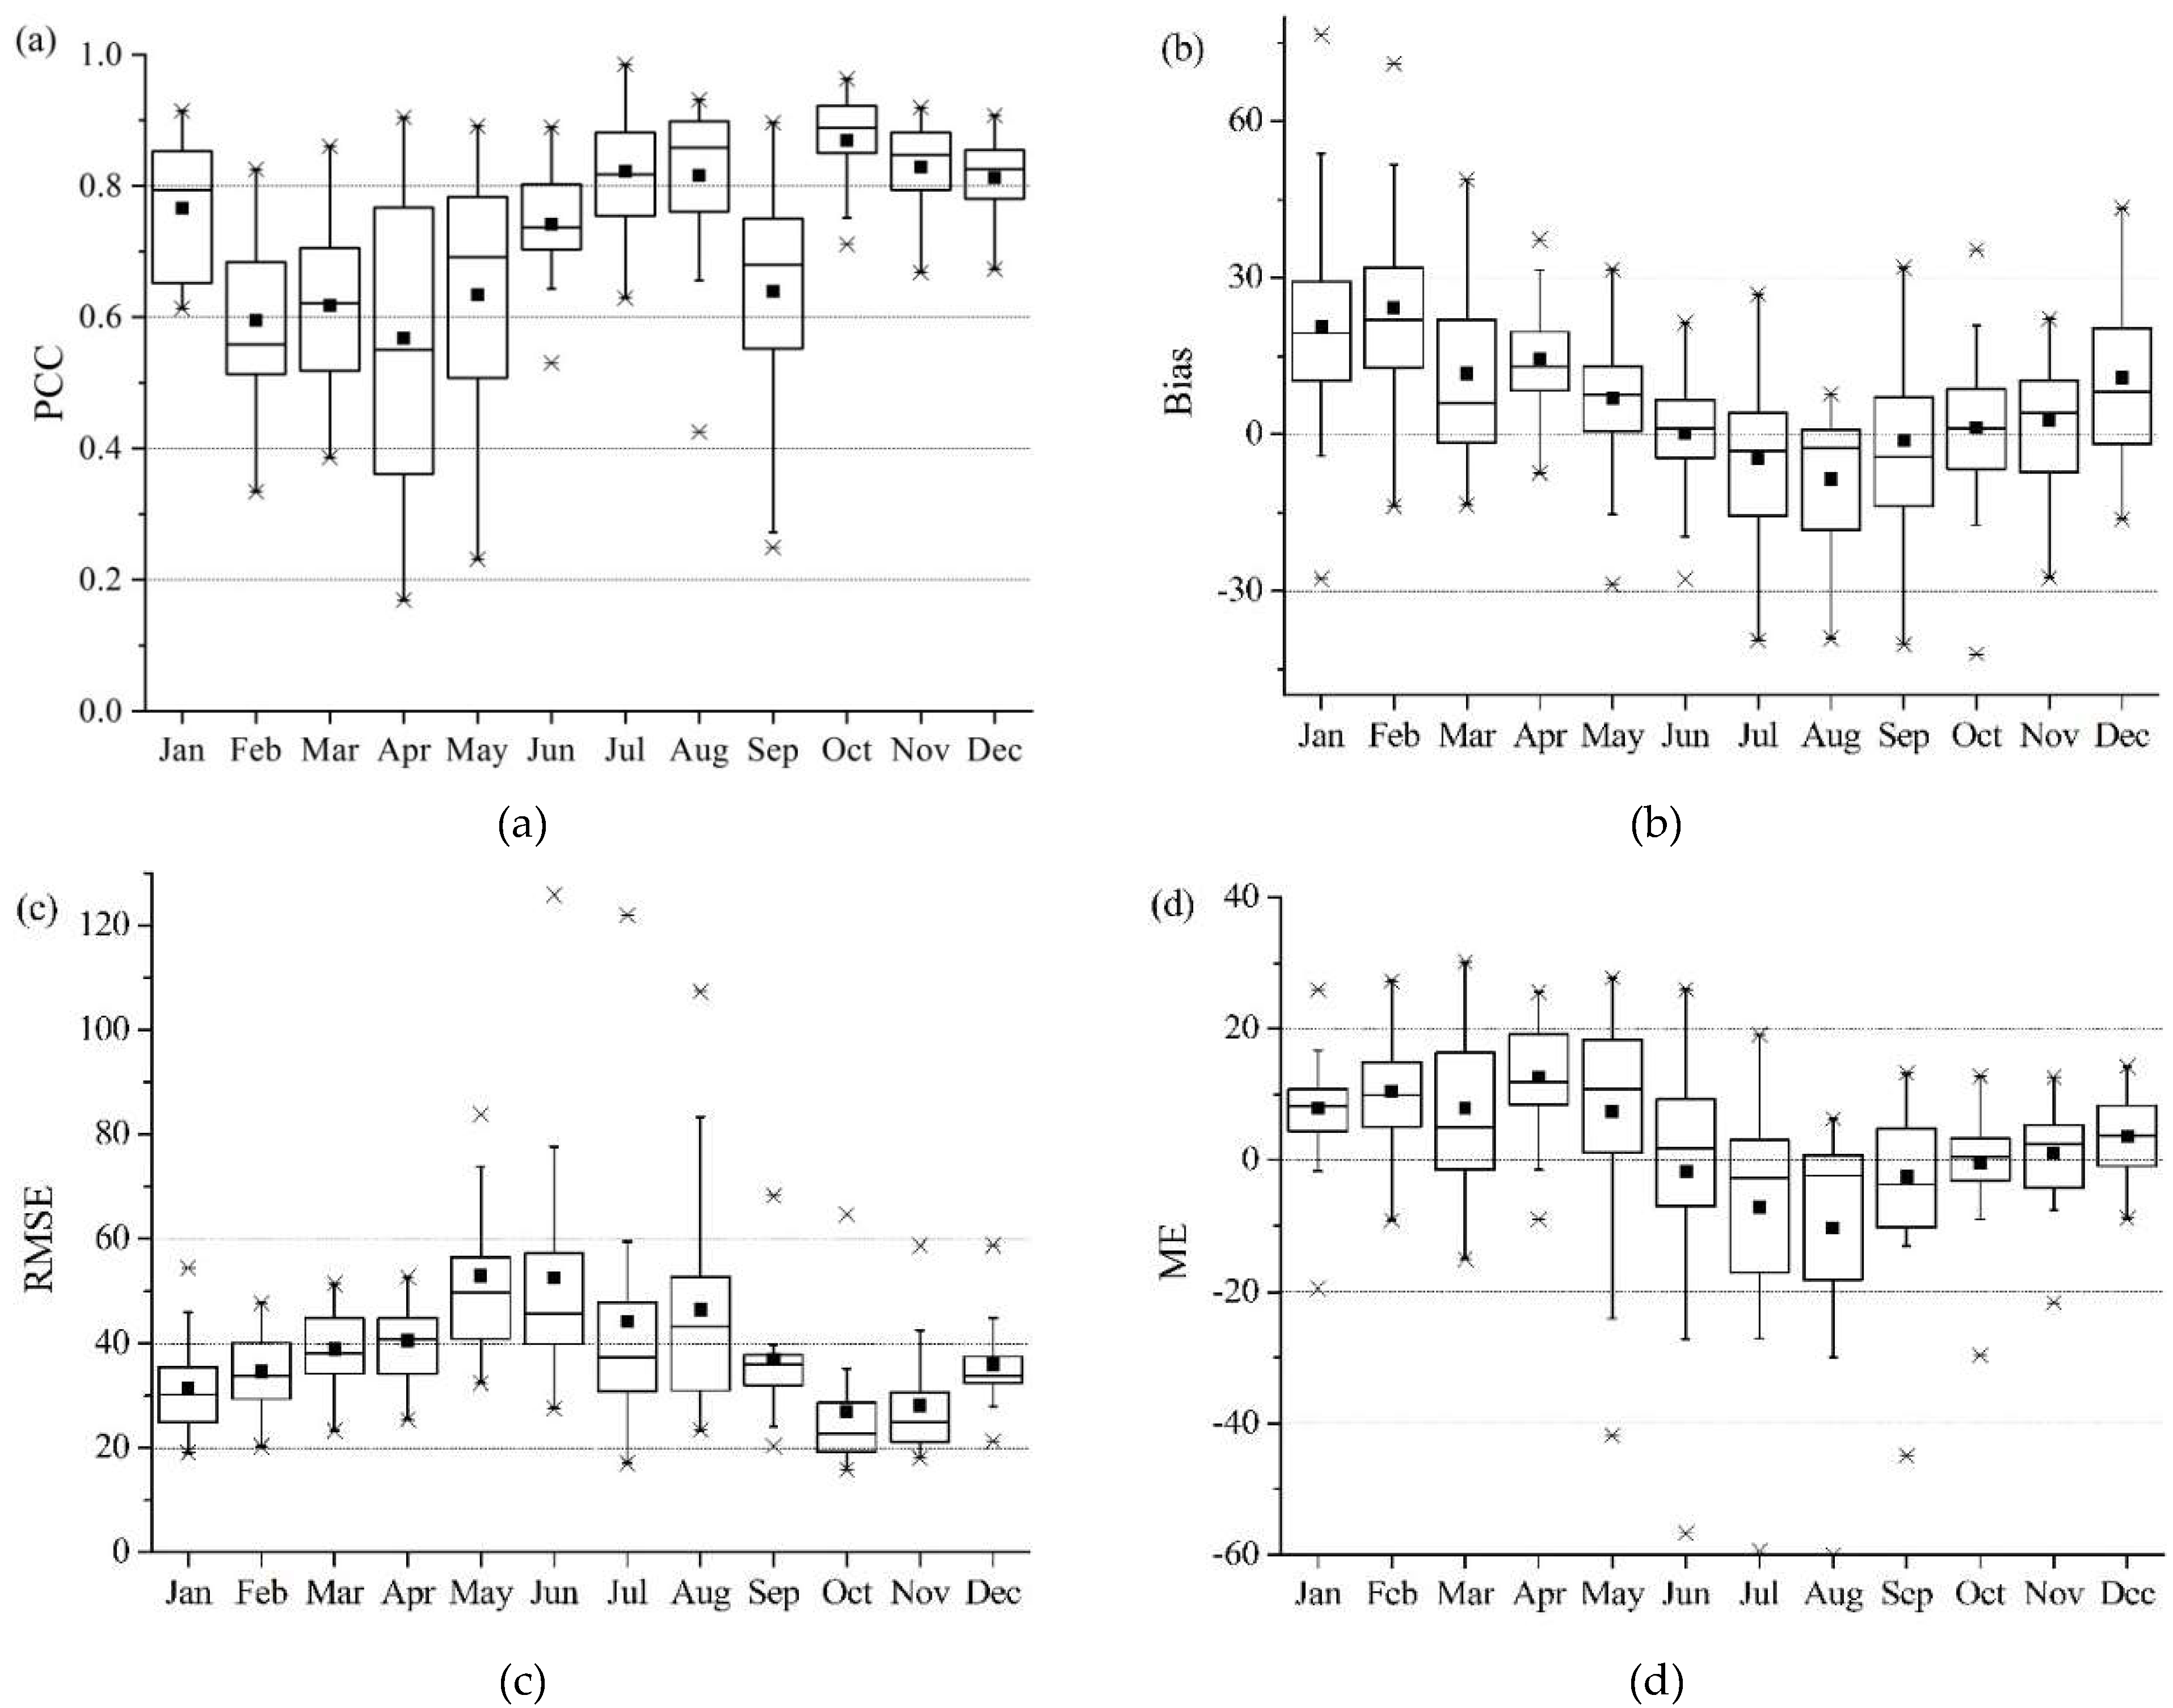
4.1.2. Results from Quantitative Statistical Indices
4.2. Detection of Consecutive Extreme Indices and Trend Analysis
4.2.1. Evaluation and Analysis of Three Consecutive Extreme Precipitation Indices
4.2.2. Trend Analysis of Consecutive Extreme Precipitation Indices Using the Cox–Stuart Test
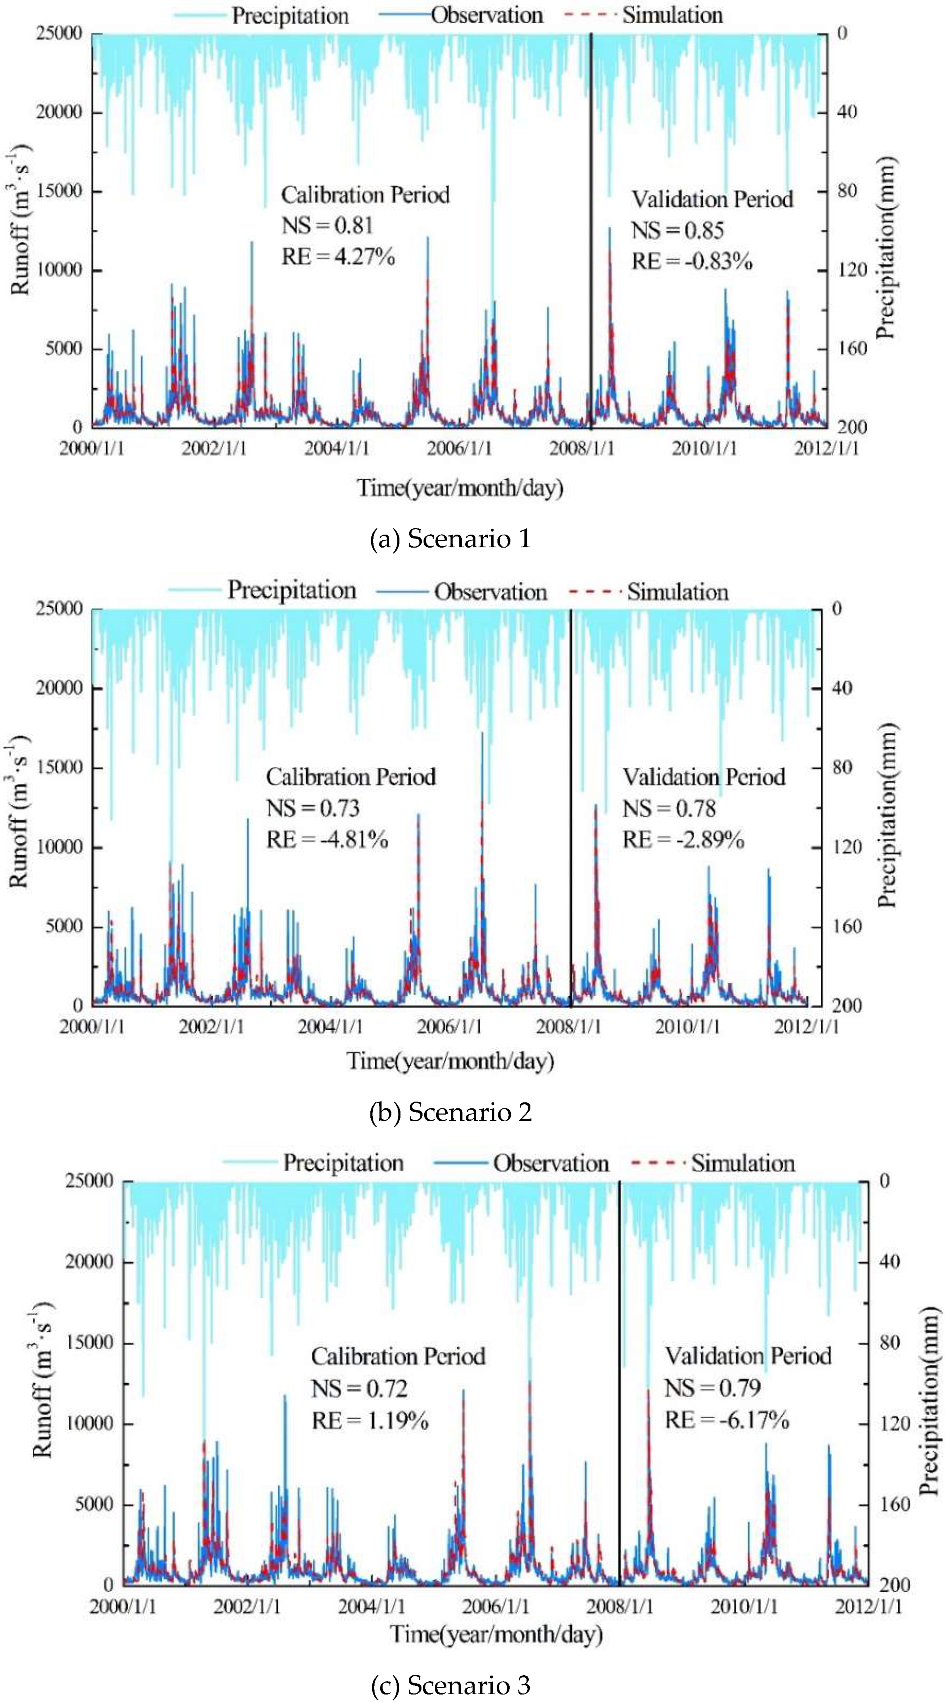
4.3. Hydrologic Substitutability Analysis of the TMPA 3B42-V7 Product Using the SWAT Model
5. Conclusions
Author Contributions
Funding
Acknowledgments
Conflicts of Interest
References
- Hou, A.Y.; Kakar, R.K.; Neeck, S.; Azarbarzin, A.A.; Kummerow, C.D.; Kojima, M.; Oki, R.; Nakamura, K.; Iguchi, T. The global precipitation measurement mission. Bull. Amer. Meteor. Soc. 2014, 95, 701–722. [Google Scholar] [CrossRef]
- Adler, R.F.; Gu, G.; Sapiano, M.; Wang, J.J. Global precipitation: Means, variations and trends during the satellite era (1979–2014). Surv. Geophys. 2017, 38, 679–699. [Google Scholar] [CrossRef]
- Maggioni, V.; Massari, C. On the performance of satellite precipitation products in riverine flood modeling: A review. J. Hydrol. 2018, 558, 214–224. [Google Scholar] [CrossRef]
- Sekaranom, A.B.; Masunaga, H. Origins of heavy precipitation biases in the TRMM PR and TMI products assessed with CloudSat and reanalysis data. J. Appl. Meteorol. Clim. 2019, 58, 37–54. [Google Scholar] [CrossRef]
- Salles, L.; Satge, F.; Roig, H.; Almeida, T.; Olivetti, D.; Ferreira, W. Seasonal effect on spatial and temporal consistency of the new GPM-based IMERG-v5 and GSMaP-v7 satellite precipitation estimates in Brazil’s central plateau region. Water 2019, 11, 668. [Google Scholar] [CrossRef]
- Wang, J.L.; Chen, H.; Xu, C.Y.; Zeng, Q.; Wang, Q.J.; Kim, J.S.; Chen, J.; Guo, S.L. Tracking the error sources of spatiotemporal differences in TRMM accuracy using error decomposition method. Hydrol. Res. 2018, 49, 1960–1976. [Google Scholar] [CrossRef]
- Zad, S.M.; Zulkafli, Z.; Muharram, F. Satellite rainfall (TRMM 3B42-V7) performance assessment and adjustment over Pahang River Basin, Malaysia. Remote Sens. 2018, 10, 388. [Google Scholar] [CrossRef]
- Kenabatho, P.K.; Parida, B.P.; Moalafhi, D.B. Evaluation of satellite and simulated rainfall products for hydrological applications in the Notwane catchment, Botswana. Phys. Chem. Earth 2017, 100, 19–30. [Google Scholar] [CrossRef]
- Golroudbary, V.R.; Zeng, Y.J.; Mannaerts, C.M.; Su, Z.B. Response of extreme precipitation to urbanization over the Netherlands. J. Appl. Meteorol. Clim. 2019, 58, 645–661. [Google Scholar] [CrossRef]
- Wilhelm, B.; Arnaud, F.; Enters, D.; Allignol, F.; Legaz, A.; Magand, O.; Revillon, S.; Giguet-Covex, C.; Malet, E. Does global warming favour the occurrence of extreme floods in European Alps? First evidences from a NW Alps proglacial lake sediment record. Clim. Chang. 2012, 113, 563–581. [Google Scholar] [CrossRef]
- Wu, C.H.; Huang, G.R.; Yu, H.J.; Chen, Z.Q. Spatial and temporal distributions of trends in climate extremes of the Feilaixia catchment in the upstream area of the Beijiang River Basin, South China. Int. J. Climatol. 2014, 34, 3161–3178. [Google Scholar] [CrossRef]
- Tong, S.; Li, X.; Zhang, J.; Bao, Y.; Bao, Y.; Na, L.; Si, A. Spatial and temporal variability in extreme temperature and precipitation events in Inner Mongolia (China) during 1960–2017. Sci. Total Environ. 2019, 649, 75–89. [Google Scholar] [CrossRef]
- Changnon, D.; Gensini, V.A. Changing spatiotemporal patterns of 5- and 10-Day Illinois heavy precipitation amounts, 1900–2018. J. Appl. Meteoro.l Clim. 2019, 58, 1523–1533. [Google Scholar] [CrossRef]
- Shi, J.; Cui, L.; Wen, K.; Tian, Z.; Zhang, B. Trends in the consecutive days of temperature and precipitation extremes in China during 1961–2015. Environ. Res. 2018, 161, 381–391. [Google Scholar] [CrossRef] [PubMed]
- Singh, V.; Goyal, M.K. Spatio-temporal heterogeneity and changes in extreme precipitation over eastern Himalayan catchments India. Stoch. Env. Res. Risk Assess. 2017, 31, 2527–2546. [Google Scholar] [CrossRef]
- Salman, S.A.; Shahid, S.; Ismail, T.; Chung, E.S.; Al-Abadi, A.M. Long-term trends in daily temperature extremes in Iraq. Atmos. Res. 2017, 198, 97–107. [Google Scholar] [CrossRef]
- Fatichi, S.; Barbosa, S.M.; Caporali, E.; Silva, M.E. Deterministic versus stochastic trends: Detection and challenges. J. Geophys. Res. Atmos. 2009, 114, D18121. [Google Scholar] [CrossRef]
- Kumar, B.; Lakshmi, V. Accessing the capability of TRMM 3B42 V7 to simulate streamflow during extreme rain events: Case study for a Himalayan River Basin. J. Earth. Syst. Sci. 2018, 127, 27. [Google Scholar] [CrossRef]
- Zhang, X.; Yang, F. RClimDex (1.0)—User Manual; Climate Research Branch Environment Canada: Downsview, ON, Canada, 2004. [Google Scholar]
- Santos, C.A.C.D.; Neale, C.M.U.; Rao, T.V.R.; Silva, B.B.D. Trends in indices for extremes in daily temperature and precipitation over Utah, USA. Int. J. Climatol. 2011, 31, 1813–1822. [Google Scholar] [CrossRef]
- Folland, C.K.; Horton, B.; Paul, S. Report of WMO Working Group on Climate Change Detection Task Group on Climate Change Indices; World Meteorological Organisation: Geneva, Switzerland, 1999. [Google Scholar]
- Wilks, D.S. Statistical Methods in the Atmospheric Sciences, 3rd ed.; Academic Press: Cambridge, MA, USA, 2005. [Google Scholar] [CrossRef]
- Yang, Y.; Tang, J.; Xiong, Z.; Dong, X. Evaluation of high-resolution gridded precipitation data in arid and semiarid regions: Heihe River Basin, Northwest China. J. Hydrometerol. 2017, 18, 3075–3101. [Google Scholar] [CrossRef]
- Cox, D.R.; Stuart, A. Some quick sign tests for trend in location and dispersion. Biometrika 1955, 42, 80–95. [Google Scholar] [CrossRef]
- Conover, W.J. Practical nonparametric statistics. Technometrics 1972, 14, 977–979. [Google Scholar] [CrossRef]
- Arnold, J.G.; Srinivasan, R.; Muttiah, R.S.; Williams, J.R. Large area hydrologic modeling and assessment part 1: Model development. J. Am. Water Resour. Assoc. 1998, 34, 73–89. [Google Scholar] [CrossRef]
- Cai, Y.; Jin, C.; Wang, A.; Guan, D.; Wu, J.; Yuan, F. Comprehensive precipitation evaluation of TRMM 3B42 with dense rain gauge networks in a mid-latitude basin, northeast, China. Theor. Appl. Climatol. 2016, 126, 659–671. [Google Scholar] [CrossRef]
- Zulkafli, Z.; Buytaert, W.; Onof, C.; Manz, B.; Tarnavsky, E.; Lavado, W.; Guyot, J. A Comparative performance analysis of TRMM 3B42 (TMPA) versions 6 and 7 for hydrological applications over Andean–Amazon River Basins. J. Hydrometeor. 2014, 15, 581–592. [Google Scholar] [CrossRef]
- Mantas, V.M.; Liu, Z.; Caro, C.; Pereira, A.J.S.C. Validation of TRMM multi-satellite precipitation analysis (TMPA) products in the Peruvian Andes. Atmos. Res. 2015, 163, 132–145. [Google Scholar] [CrossRef]
- Jiang, D.; Zhang, H.; Li, R. Performance evaluation of TMPA version 7 estimates for precipitation and its extremes in Circum-Bohai-Sea region, China. Theor. Appl. Climatol. 2016, 130, 1021–1033. [Google Scholar] [CrossRef]
- Prakash, S.; Mitra, A.K.; Aghakouchak, A.; Pai, D. Error characterization of TRMM multisatellite precipitation analysis (TMPA-3B42) products over India for different seasons. J. Hydrol. 2015, 529, 1302–1312. [Google Scholar] [CrossRef]
- Chen, Y.; Ebert, E.E.; Walsh, K.J.E.; Davidson, N.E. Evaluation of TRMM 3B42 precipitation estimates of tropical cyclone rainfall using PACRAIN data. J. Geophys. Res. Atmos. 2013, 118, 2184–2196. [Google Scholar] [CrossRef]
- Wang, Z.; Zhong, R.; Lai, C. Evaluation and hydrologic validation of TMPA satellite precipitation product downstream of the Pearl River Basin, China. Hydrol. Process. 2017, 31, 4169–4182. [Google Scholar] [CrossRef]
- Hur, J.; Raghavan, S.V.; Nguyen, N.S.; Liong, S.Y. Are satellite products good proxies for gauge precipitation over Singapore? Theor. Appl. Climatol. 2017, 132, 921–932. [Google Scholar] [CrossRef]
- Zhang, Q.; Xu, C.Y.; Zhang, Z. Observed changes of drought/wetness episodes in the Pearl River basin, China, using the standardized precipitation index and aridity index. Theor. Appl. Climatol. 2009, 98, 89–99. [Google Scholar] [CrossRef]
- Yong, B.; Ren, L.; Hong, Y.; Gourley, J.; Tian, Y.; Huffman, G.J.; Chen, X.; Wang, W.; Wen, Y. First evaluation of the climatological calibration algorithm in the real-time TMPA precipitation estimates over two basins at high and low latitudes. Water Resour. Res. 2013, 49, 2461–2472. [Google Scholar] [CrossRef]



| Rainfall Event | Station | ||
|---|---|---|---|
| Rain | No Rain | ||
| TMPA | Rain | a | b |
| No Rain | c | d | |
| CDD | ||||
|---|---|---|---|---|
| PCC | Bias (%) | RMSE (d) | ME (d) | |
| Minimum | −0.014 | 4.802 | 13.762 | 1.889 |
| 1st quartile | 0.127 | 16.787 | 15.852 | 6.139 |
| Median | 0.319 | 25.808 | 16.400 | 8.750 |
| 3rd quartile | 0.405 | 30.991 | 18.729 | 10.417 |
| Maximum | 0.638 | 39.813 | 24.369 | 12.111 |
| Mean | 0.297 | 24.134 | 17.360 | 8.153 |
| CWD | ||||
| PCC | Bias (%) | RMSE (d) | ME (d) | |
| Minimum | −0.214 | −28.520 | 1.599 | −4.389 |
| 1st quartile | 0.140 | −9.192 | 2.600 | −1.028 |
| Median | 0.384 | −6.477 | 2.953 | −0.667 |
| 3rd quartile | 0.495 | −0.949 | 3.468 | −0.083 |
| Maximum | 0.783 | 2.685 | 5.050 | 0.222 |
| Mean | 0.335 | −6.292 | 3.098 | −0.720 |
| RX5day | ||||
| PCC | Bias (%) | RMSE (mm) | ME (mm) | |
| Minimum | 0.141 | −29.851 | 33.700 | −66.871 |
| 1st quartile | 0.439 | −8.638 | 46.833 | −18.422 |
| Median | 0.648 | −4.188 | 53.943 | −8.032 |
| 3rd quartile | 0.746 | −0.201 | 70.838 | −0.498 |
| Maximum | 0.932 | 11.950 | 114.896 | 20.863 |
| Mean | 0.603 | −4.526 | 60.260 | −11.422 |
| Scenario | Precipitation Input | Parameters Set | Remarks |
|---|---|---|---|
| 1 | Gauged data | Calibrated a set of initial parameters and termed them the static parameter set | Traditional scenario |
| 2 | TMPA data | The static parameter set | Scenario where gauged precipitation is partially missing in time or space (semi-substituted scenario) |
| 3 | TMPA data | Re-calibrated the initial parameter set | Scenario with no actual gauged precipitation (fully substituted scenario) |
| Calibration Period (2000–2007) | Validation Period (2008–2011) | |||||||
|---|---|---|---|---|---|---|---|---|
| NS | RE (%) | PCC | RMSE (mm) | NS | RE (%) | PCC | RMSE (mm) | |
| Scenario 1 | 0.81 | 4.27 | 0.900 | 546.41 | 0.85 | −0.83 | 0.923 | 468.20 |
| Scenario 2 | 0.73 | −4.81 | 0.853 | 655.57 | 0.78 | −2.89 | 0.888 | 562.95 |
| Scenario 3 | 0.72 | 1.19 | 0.850 | 661.47 | 0.79 | −6.17 | 0.889 | 559.04 |
© 2020 by the authors. Licensee MDPI, Basel, Switzerland. This article is an open access article distributed under the terms and conditions of the Creative Commons Attribution (CC BY) license (http://creativecommons.org/licenses/by/4.0/).
Share and Cite
Chen, X.; Huang, G. Applicability and Hydrologic Substitutability of TMPA Satellite Precipitation Product in the Feilaixia Catchment, China. Water 2020, 12, 1803. https://doi.org/10.3390/w12061803
Chen X, Huang G. Applicability and Hydrologic Substitutability of TMPA Satellite Precipitation Product in the Feilaixia Catchment, China. Water. 2020; 12(6):1803. https://doi.org/10.3390/w12061803
Chicago/Turabian StyleChen, Xiaoli, and Guoru Huang. 2020. "Applicability and Hydrologic Substitutability of TMPA Satellite Precipitation Product in the Feilaixia Catchment, China" Water 12, no. 6: 1803. https://doi.org/10.3390/w12061803
APA StyleChen, X., & Huang, G. (2020). Applicability and Hydrologic Substitutability of TMPA Satellite Precipitation Product in the Feilaixia Catchment, China. Water, 12(6), 1803. https://doi.org/10.3390/w12061803


