Abstract
Two recently recognised incised valleys in the Manfredonia Gulf are described. The first (CCV) is correlated with the current Carapelle and Cervaro streams. The second (OSFV) is correlated mostly with the current Ofanto River. Six seismic facies and seven unconformity-bounded seismic units have been identified, which infilled CCV and OSFV. In CCV, during the sea-level ranges from −29 to −18 and from −18 to −4.7 m b.s.l., two barrier/spit-backbarrier systems formed in the most landward sector of the valley. The lower system was attributed to a time interval between 9.2 ka BP and ca. 8.3 ka BP, chronologically constrained by the ZS2 borehole. In OSFV, during the sea level ranges from −39 to −29, and from −29 and to −18 m b.s.l., two beach/spit-backbarrier systems, arranged in a “continuous” landward backstepping pattern, formed. The phase that contributed most to the beach/spit-backbarrier systems formation is that which is coeval with the formation of the sapropel S1 in the Mediterranean. The conservation of barrier/spit-backbarrier systems arranged in a “continuous” landward backstepping pattern, is due to a strong and continued sediment supply that occurred during the sapropel S1 formation, coupled with low-gradient settings and a regime of slow sea-level rise.
1. Introduction
The term coastal barrier refers to different geomorphological features at different times. Otvos [1] reviewed the nomenclature and classification of coastal barriers and considered two main types: (1) barrier islands, parallel to the shore and located between the inshore and open marine environments, and (2) barrier spits, which are linked to the mainland shore. Modern barrier islands are found worldwide, located mainly along wave-dominated coasts, and these islands were subjected to rising sea levels of the late Holocene [2]. Barrier-lagoon systems include the shoreface sector, the barrier, and the backbarrier sector, where wash-over fans and lagoons develop [1,3].
The formation of these systems is controlled by the interplay of wave energy, sediment supply, accommodation and sea-level oscillations [4,5,6]. In particular, barriers and backbarrier-lagoons can develop when the substrate gradient is less than 0.8° [7].
The responses of coastal barrier and backbarrier systems to sea-level rise are crucial issues, in the light of the future sea level rise due to global warming. Studies of evolving barrier morphology indicate several responses to sea-level rise, all of which are strongly influenced by local factors. Most low-gradient coasts form transgressive barriers during sea-level rise. These barriers were composed almost entirely of tidal delta and wash-over deposits that retrograded into estuarine/lagoonal environments as sea-level rose [7]. The seabed exposed by the retreating barrier is a ravinement surface [7,8]. Typically, the two main responses of coastal barriers to sea-level rise are identified as [9] rollover and overstepping. Rollover is the dominant retreat process and consists of a continuous migration of the barrier systems following shoreline retreat, with almost complete reworking of shoreface and barrier deposits [10,11,12]. The overstepping process involves the partial preservation of transgressive deposits or barrier morphology and is generally associated with a fast rate of sea-level rise [13,14]. Overstepping involves near-instantaneous drowning of the barrier by the sea and translation of the marine, wave-influenced shoreline to the landward margin of the former lagoon, which may be several kilometres away [15]. Barrier overstepping has been attributed to a combination of rapid sea-level rises, such as those associated with meltwater pulses [16], with other particularly favourable circumstances, such as early cementation (beachrock and aeolianite formation) or gravelly sediments [12,17,18,19,20].
The preservation potential of drowned barriers (only possible in the case of overstepping) and related transgressive deposits is considered to be relatively low in comparison to the deposits associated with regressive coasts [13,21].
In this study, we describe the formation and landward migration of coastal barrier/spit and backbarrier systems during the last post-Würm transgression. This migration affected an incised valley created by the Carapelle and Cervaro streams and a shallow and very wide valley created by the Ofanto River and its tributary San Ferdinando stream, which have been progressively infilled. The aim of this study is to provide an example of how coastal environments migrate landwards in response to slow transgression, on low-gradient substrates and in the presence of shallow incised valleys.
2. Regional Setting
The Manfredonia Gulf is the natural offshore continuation of the Tavoliere di Puglia Plain, the second largest plain in Italy characterised by several Quaternary marine and alluvial terraces [22,23,24,25,26]. The coastal area is subsiding, at a maximum rate of 0.21 mm/year between MIS 5.5 and the present day [22].
The Gulf extends ca. 83 km seaward from the coastline. The seabed has an average slope of approximately 0.07° towards the east [27]. The gulf has a microtidal regime.
In the Gulf, Trincardi et al. [28,29], Maselli and Trincardi [30], Maselli et al. [31], and De Santis and Caldara [32] recognised an extensive unconformity (today buried) representing the low-stand surface of subaerial exposure (LSSE) formed during the last glacial maximum (LGM). The Manfredonia Incised Valley (MIV) cuts into the LSSE (Figure 1); it is a sinuous valley elongated for more than 60 km in a W-E direction from the inner shelf to the mid-outer shelf. On the LSSE, the transgressive system tract (TST) and the high-stand system tract (HST) were deposited from the beginning of the last sea-level rise. The TST also constitutes most of the infilling of the MIV.
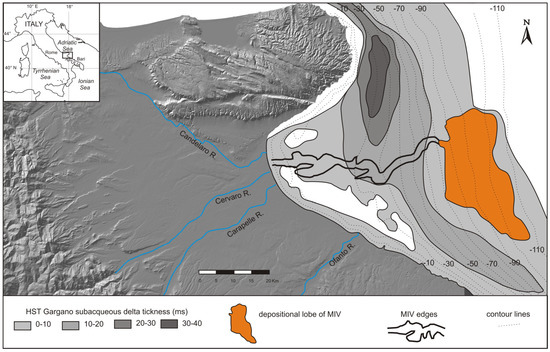
Figure 1.
Simplified map showing position of the Manfredonia Incised Valley (MIV) and of its depositional lobe, high-stand system tract (HST) Gargano sub-acqueous delta (gray tones) and bathymetry of the Manfredonia Gulf shelf with 10-m-spaced contours. Redrawn from literature data [29,31,32].
The Manfredonia Gulf was also affected by deposition of the so-called Gargano subaqueous delta [33]. This delta was formed on the eastern and southeastern sides of the Gargano promontory (Figure 1). This subaqueous deposit represents the southernmost portion of the Holocene HST developing along the western side of the Adriatic. The HST rests above a regional down-lap surface (maximum flooding surface; mfs) that marks the time that the maximum landward shoreline shift occurred, approximately 5.5 cal. ka BP during the end of the late-Pleistocene to Holocene sea-level rise [30,33,34,35].
Following the work of Maselli et al. [36] in the central Adriatic Sea, the TST is found to consist of a tripartite deposit, recording the step-wise nature of sea-level rise. The three distinct units, each deposited during a specific interval of the last sea-level rise, are the lower TST unit (lTST), middle TST (mTST) and upper TST (uTST). The lTST formed as sea-level rose between −120 and −95 m, the mTST between −95 and −60 m, and the uTST between −60 m and the position of the shoreline that was reached at the time of maximum marine ingression (5.5 cal. ka BP). The boundary between the lTST and mTST consists of the S1 surface, whereas the boundary between the mTST and the uTST consists of the S2 surface. S1 and S2 are regional erosional surfaces generated by reduced sediment inputs and enhanced marine reworking as a consequence of Meltwater Pulses 1A and 1B (MWP-1A and MWP-1B), respectively [37]. Within the mTST, another regional erosional surface (Si), can be detected, thus dividing the mTST into two different subunits (mTST-1 below and mTST-2 above the Si, respectively). The stratigraphic complexity of the mTST unit, recording the Bölling-Allerød and Younger Dryas events, can best be explained by sea-level oscillations, including a minor sea-level fall during the Younger Dryas event, which likely formed the Si surface. This conclusion is consistent with the formation of a Younger Dryas shoreline deposit ca. −75 m depth, which is within the mTST unit.
3. Methods
3.1. Seismic Survey
Seismic surveys were carried out in the Manfredonia Gulf (southern Adriatic) in 2016 and 2017 using the motorboat “ISSEL”, which is owned by the Interuniversity Consortium for Sea Sciences (Con.I.S.Ma.). The following instruments and sensors were mobilised: (i) AppliedAcoustic Squid CSP-P 350J “sparker” source; and (ii) Geo-Resources Geo-Sense single channel seismic acquisition system with 8 hydrophone streamer and amplification/filtering stage.
The data was processed using the IXSEA DELPH software. Through the use of the system, all the necessary steps for filtering, gaining and interpreting the data have been performed.
Track-line positioning is based on D-GPS navigation, assuring a sub-metric position accuracy using the WGS84 datum.
The seismic survey comprised 15 sparker profiles oriented perpendicular to the coastline and 12 sparker profiles subparallel to the coastline for a total of ca. 580 km (Figure 2). The minimum and maximum water depths were <8 m and ca. 97 m, respectively.
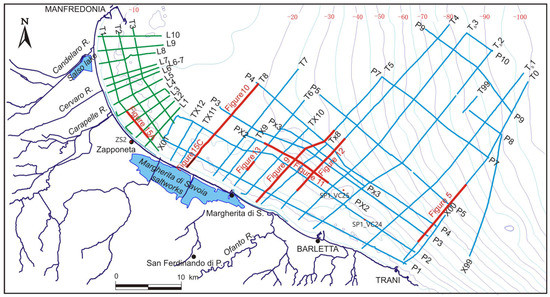
Figure 2.
Study area with seismic profiles acquired in the two surveys: in green colour those of the 2013–2014, in blue colour those of the 2016–2017; the red parts of the seismic profiles correspond to the sections reported in the figures indicated. The black part in seismic profile T8 is reported in Figure 13C. Contour line of the present sea bottom and positions of ZS2 borehole and SP1_VC24 and SP1_VC25 vibro-cores are also shown. The abbreviations of seismic profiles are shown at their ends.
The data were subsequently converted into a digital format/image for interpretation. Each seismic profile was imported into TEI Delph Map with Seismic GIS, allowing for immediate georeferencing and interpretation of acquired data. Finally, a buried erosional surface (ES1) was reconstructed using a triangular interpolation method in GIS.
In addition to the surveys described above, this work reports the seismic profile T1, which was acquired and processed within other surveys carried out between 2013 and 2014 using sub-bottom profiler Benthos CHIRP III in the Manfredonia Gulf, immediately NW of the area investigated in the present study (Figure 2). For the technical details of that survey see [32,38].
3.2. Seismic Facies and Unconformity-Bounded Seismic Units
For this work, seismic facies and unconformity-bounded seismic units (UBSUs) belonging to the TST have been identified (Figure 3).
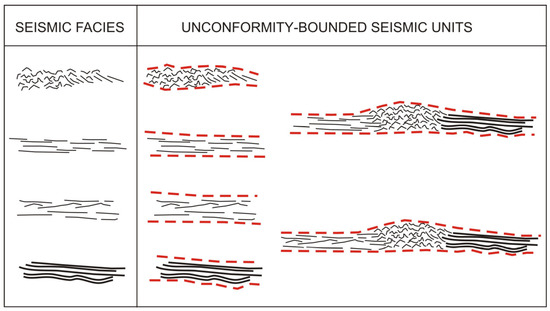
Figure 3.
Conceptual scheme of relationships between seismic facies and unconformity-bounded seismic units (UBSUs) applied in this study. The red dashed lines are the unconformity. The symbols of the seismic facies used in this figure are indicative only.
By seismic facies we mean groups of reflections whose parameters (bedform geometry, lateral continuity, amplitude, frequency, and interval velocity) differ from those of adjacent groups of reflections [39]. We also used the spatial extension of seismic facies, along with the reciprocal position between facies, to infer depositional environments and formative processes. The seismic facies interpretation is also supported by previous study, e.g., some general seismic facies characteristics of the latest Quaternary transgressive deposits and incised valley infillings were established (i.e., [13,15,40,41,42,43]). More specifically for the southern Adriatic, Maselli and Trincardi [30], Maselli et al. [36], and Maselli et al. [31] provide a complete description of the seismic facies that characterise the TST and HST.
The seismic facies interpretations are also based on two vibro-cores drilled in 2015 in the Manfredonia Gulf: SP1_VC24 (intercepted by profile P2); and SP1_VC25 (close to profile PX2) on behalf of the Puglia Basin Authority (AdB) for a sand resource study of the Apulian continental shelf. The chronological constraint of the transgressive UBSUs is based on a borehole drilled in Zapponeta town (ZS2) in 2012 by the AdB during a seismic microzonation project; this borehole was directly analysed by the authors. Seismic facies, coupled with the identification of discontinuity surfaces, were used to separate the TST sediments into UBSUs. More precisely, UBSUs have been distinguished based on unconformities, interpretable as surfaces of erosion or discontinuity in sedimentation. The UBSUs in some cases are made up of a single seismic facies, in other cases of multiple seismic facies (Figure 3) that transit into one another (i.e., the seismic units described in [17] and [44]).
In this work, the seismic facies have been recognised based only on seismic sparker profiles, because they are almost all of the profiles present in the study area. In the single sub-bottom profile T1, only the unconformity bounded seismic units have been recognised.
3.3. Age Range Evaluation and Chronological Constraints
For an approximate assessment of the age of the UBSUs, we have modified the method based on the current depth of the units, already applied in the southern Adriatic (see for example the age estimation made by Maselli and Trincardi [30] for the units 2C and 2D of area 3 of the MIV or the age estimation made by Pellegrini et al. [45] for the Palaeo Gargano compound delta).
One of the seismic facies (seismic facies 2) was found to be helpful in an approximated evaluation of the age range of the UBSUs. Seismic facies 2 has been interpreted in this study as a high-energy marine deposit and therefore deposited at (or close to) sea level; this interpretation is validated also because the seismic facies 2 is intercepted by vibro-cores SP1_VC24 and SP1_VC25, where it is present between the sea bottom and the bottom of the two vibro-cores. In addition, the interpretation of seismic facies 2 is in accordance with Trincardi et al. [28] (p. 86) which defined the sediments cropping out at the sea bottom in the area were the two vibro-cores have been realised as “proximal transgressive sandy deposits of beach or paralic environment”.
Having said that, because seismic facies 2 forms sedimentary bodies within different UBSUs arranged in a landward backstepping pattern [46] on the ES1, it follows that each of these bodies indicates an approximated sea-level range if we consider the base and the top of the body. Then, we considered the local sea-level curve (site 25 in [47]) to infer two ages corresponding to two sea levels that we associated with the base and top of each sedimentary body formed by seismic facies 2. These two sea levels have been corrected considering a possible subsidence calculated for the Holocene deposits of our study area. In conclusion, we associate each sedimentary body formed by seismic facies 2 with two approximated palaeo sea-levels and therefore with an approximated age range (Figure 4).
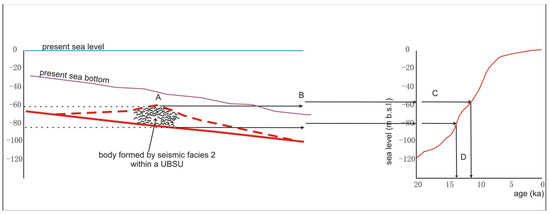
Figure 4.
Conceptual sketch illustrating the method used for the approximated evaluation of the age range of the discontinuity-bounded seismic units. A: recognition of the depth below present sea level of the base and the top of the bodies formed by seismic facies 2; B: correction of these depths in order to remove the subsidence; C: projection of these corrected depths on the sea level curve considered; D: reading of the corresponding age range.
If the body formed by seismic facies 2 belongs to an UBSUcontaining multiple seismic facies, we extend to the whole unit the approximated age range obtained from the facies 2 body. This procedure allowed us to link the UBSUs at some sea-level ranges and therefore at corresponding age ranges.
The timing of the deposition of transgressive UBSUs was chronologically constrained by the ZS2 borehole, which intercepts the transgressive fill of the inland sector of an incised valley recognised in this study. Three samples of this perforation were dated using the 14C method at DirectAMS Laboratories, Bothell, Washington (laboratory ID: D-AMS). The radiocarbon dates were calibrated using the CALIB 7.1 program. The IntCal13, Marine/IntCal13, and Marine13 datasets [48] were used for terrestrial, transitional and marine samples, respectively (Table 1). The percentage of marine carbon was calculated based on the δ13C value [49]. A ΔR correction (ΔR =121 ± 60) calculated for the southern Adriatic Sea off Barletta (http://intcal.qub.ac.uk/marine/) was used. Furthermore, the ZS2 borehole intercepted a pumice layer, which has been identified.

Table 1.
Samples dated with the 14C method coming from ZS2 borehole. For the location of the samples in the core, see Figure 4.
4. Data and Results
We present the following seismic and stratigraphic data regarding the most inner part of the Manfredonia Gulf continental shelf: (1) the erosional surface that formed during the last sea-level fall, sub-aerial exposure of the shelf and erosional reworking during subsequent sea level rise; (2) the main landforms described by the erosional surface; (3) borehole and vibro-cores; (4) seismic facies recognizable within uTST; and (5) UBSUs belonging to the uTST.
4.1. Erosional Surface ES1
The seismic survey allowed us to identify a regional erosional surface (ES1). In some cases, the ES1 appears as a clearly visible reflector, with moderate to high amplitude, coinciding with a more or less evident angular unconformity between the underlying reflectors and the overlying reflectors; in other cases, the ES1 appears instead as an abrupt contact between very different seismic facies. However, in both cases, ES1 is identified as a surface that separates the substrate from younger sediments having a very different seismic architecture. The substrate is almost always characterised by seaward-inclined reflectors, referable to oblique-tangential clino-forms [39] which dip at low angles (usually fractions of a degree) and are truncated up-dip by the ES1. Sediments above ES1, on the other hand, are highly variable in that they are characterised by numerous seismic facies (Figure 5).
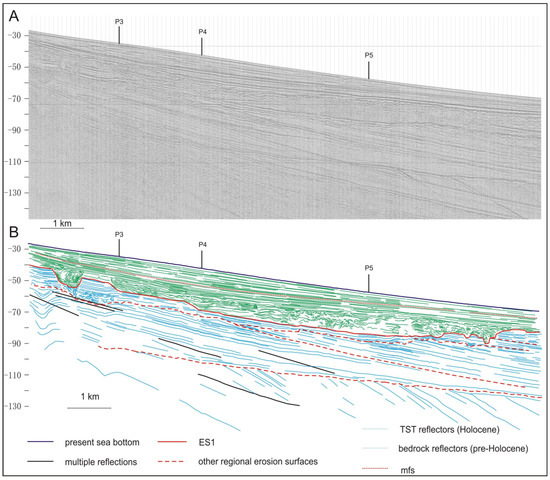
Figure 5.
Part of seismic profile T0 (A) and its interpretation (B), showing the erosional surface (ES1) on a regional scale. Note that ES1 is identified as a surface that separates the substrate from younger sediments having a different seismic architecture.
4.2. Erosive Landform: Incised Valley A and B
ES1 presents three main erosive landforms (Figure 6). The north-western, not the subject of this work, is already known in the literature as Manfredonia incised valley (MIV [30,32]).
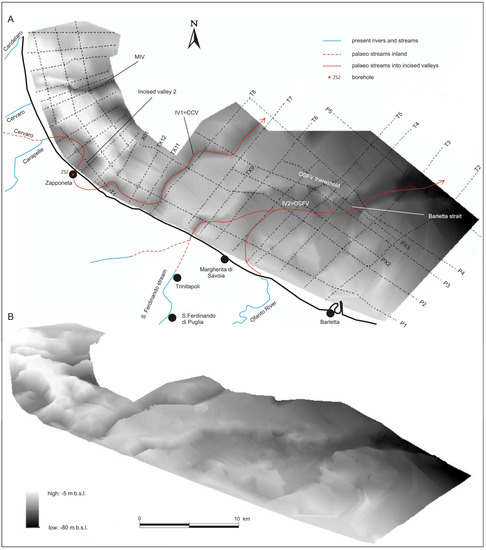
Figure 6.
Digital Elevation Model (DEM) of the erosional surface ES1 both in plan view (A) and in oblique view (B). For the former, seismic profiles and the reconstructed drainage network are also shown. The seismic profiles showed in the following figures are indicated with their names.
The central is an incised valley (hereinafter incised valley 1: IV1; Figure 6), that reaches a depth (in profiles T8 and P1) of ca. −37 m b.s.l. and ca. 18/22 m below the surrounding ES1. In the P2 profile, the maximum depth is ca. −38 m. b.s.l., which reaches −50 m. b.s.l. in profile P4.
This valley has a meandering course at the turn of the current coastline.
The south-eastern landform is another incised valley (hereinafter incised valley 2: IV2; Figure 6), which appears, in the sector closest to the coast, as two different sub-incisions. These two sub-incisions merge in a single wide and shallow valley with a very rugged and irregular bottom. The IV2 reaches a maximum width of 11.9 km (profile P2) and narrows to approximately 2.5 km in correspondence with the Barletta strait (Figure 6). The IV2 reaches depths between ca. −13/−15 m b.s.l. (profile T4) and ca. −50 m b.s.l. at the Barletta strait; a topographic low is present at the intersection between profiles P3 and T5, where the bottom reaches −48 m b.s.l. With respect to the surrounding ES1, the IV2 shows decreasing depths towards the open sea, between ca. 17 m and less than 10 m b.s.l.
Above the ES1 surface, a series of units were deposited during the last transgressive phase; they constitute the infilling of the IV1 and IV2.
4.3. Borehole and Vibrocores
The borehole and vibro-cores intersect only transgressive sediments lying above ES1.
4.3.1. Borehole ZS2
The borehole ZS2 (Figure 7), drilled in the town of Zapponeta, is 30 metres deep. The ground level is 1.2 m above sea level. From the bottom up, the recognised lithological units are as follows:
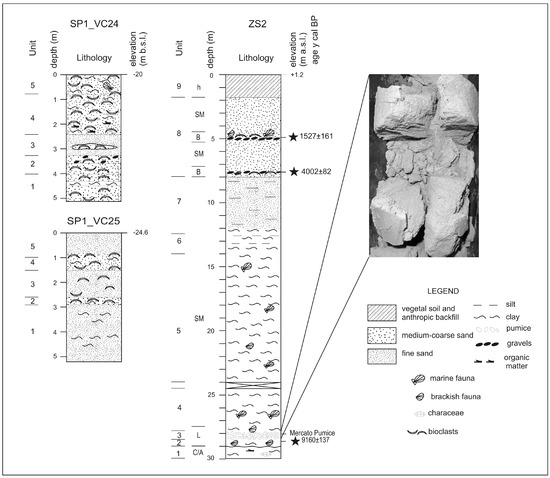
Figure 7.
Stratigraphic logs of ZS2 borehole and SP1_VC24 and SP1_VC25 vibro-cores; a photo showing a particular of the Mercato pumice layer in ZS2 borehole has been reported. C/A = continental/alluvial; L = lagoonal; SM = shallow marine; B = beach; h = anthropic.
- from 30 to 29 m below ground level (−28.8 to −27.8 m b.s.l.), light grey clay with Cyprideis torosa, Pulmonata, Characeae and vegetal remnants;
- from 29 to 28.5 m (−27.8 to −27.3 m b.s.l.), dark grey clay rich in Cerastoderma glaucum (Bruguiere), Abra segmentum (Recluz), Turboella lineolata (Michaud), and Hydrobiidae spp.;
- from 28.5 to 27.8 m (−27.3 to −26.6 m b.s.l.), graded light grey pumice, from very coarse to medium-fine;
- from 27.8 to 24.5 m (−26.6 to −23.3 m b.s.l.), very dark and dark grey clay rich in C. glaucum and Bittium reticulatum (Da Costa) in the lowest 30 cm. In the remaining part of the unit, the fauna is different: first, the fauna is composed of species such as Ostea edulis (Linneo), Modiolus barbatus (Linneo) and Mysella bidentata (Montagu); then, the fauna comprises M. bidentata, Nucula nitidosa (Winckworth), Abra nitida (Müller), and Dentalium inaequicostatum (Dautz);
There is an interval from 24.5 to 24.0 m (−23.3 to −22.8 m b.s.l.) where no sediment recovery was obtained. Subsequently, the stratigraphy continues as follows;
- 5.
- from 30 to 29 m below ground level (−28.8 to −27.8 m b.s.l.), light grey clay with Cyprideis torosa, Pulmonata, Characeae and vegetal remnants;
- 6.
- from 29 to 28.5 m (−27.8 to −27.3 m b.s.l.), dark grey clay rich in Cerastoderma glaucum (Bruguiere), Abra segmentum (Recluz), Turboella lineolata (Michaud), and Hydrobiidae spp.;
- 7.
- from 28.5 to 27.8 m (−27.3 to −26.6 m b.s.l.), graded light grey pumice, from very coarse to medium-fine;
- 8.
- from 27.8 to 24.5 m (−26.6 to −23.3 m b.s.l.), very dark and dark grey clay rich in C. glaucum and Bittium reticulatum (Da Costa) in the lowest 30 cm. In the remaining part of the unit, the fauna is different: first, the fauna is composed of species such as Ostea edulis Linneo, Modiolus barbatus Linneo and Mysella bidentata (Montagu); then, the fauna comprises M. bidentata, Nucula nitidosa (Winckworth), Abra nitida (Müller), and Dentalium inaequicostatum (Dautz).
There is an interval from 24.5 to 24.0 m (−23.3 to −22.8 m b.s.l.) where no sediment recovery was obtained. Subsequently, the stratigraphy continues as follows:
- 9.
- from 24.0 to 14.0 m (−22.8 to −12.8 m b.s.l.), grey, dark grey, or leaden clay, generally with abundant and diversified fauna: Tellina distorta (Poli), Corbula gibba (Olivi), M. bidentata, Pitar rudis (Poli), Gouldia minima (Montagu), A. nitida, Nuculana pella (Linneo), N. nitidosa, and D. inaequicostatum. Many ossicles of Asteroidea and vertebrae of Ophiuroidea are present;
- 10.
- from 14.0 to 12.45 m (−12.8 to −11.25 m. b.s.l.), dark grey clay layers alternating with a thin layer of light grey silt containing rare specimens of A. nitida, C. gibba, N. pella, N.a nitida, and Odostomia sp.;
- 11.
- from 12.45 to 8.0 m (−11.25 to −6.8 m b.s.l.), dark grey to light grey fine silty sand, containing rare specimens of A. nitida and N. pella;
- 12.
- from 8.0 to 1.75 (−6.8 to −0.55 m b.s.l.), grey brown to dark grey medium-coarse sand; two thin layers of gravels in a sandy matrix with abundant shell fragments (Glycymeris sp., Chamelea gallina (Linneo), Donax sp.) are present at approximately −6.5 and −3.5 m, respectively; and
- 13.
- from 1.75 to 0.0 m (−0.55 to +1.2 m b.s.l.), vegetal soil and anthropic backfill.
Three samples from this borehole have been 14C dated (Table 1).
In addition, the level of pumice present from 28.5 to 27.8 m (−27.3 to −26.6 m b.s.l.) was attributed to the eruption of the Mercato Pumice [50] of the Somma-Vesuvius volcanic complex, dated to 8890 ± 90 cal year BP [51,52].
4.3.2. Vibro-cores SP1_VC24 and SP1_VC25
Vibro-core SP1_VC24 was obtained 5 km offshore at a water depth of 20 m, and this core was intercepted by the seismic profile P2 (Figure 2). Coring ceased at 5.13 m below the seabed, and from the bottom up the core consists of the following units (Figure 7):
- from 5.13 to 3.59 m, bioclastic coarse material with some pelitic intercalation;
- from 3.59 to 3.27 m, coarse black sand with abundant bioclasts and pebbles;
- from 3.27 to 2.43 m, fine and very fine light olive brown sand. Pockets of coarse bioclastic black sand are present;
- from 2.43 to 0.79 m, bioclastic gravel and coarse sand in a grey pelitic matrix, with abundant vegetal remnants towards the lower part of the level; and
- from 0.79 m to the sea floor, bioclastic gravel of bivalves and gastropods in a clayey-sandy, dark grey matrix.
Vibro-core SP1_VC25 was obtained 8 km offshore at a water depth of 24.6 m and is located very close to seismic profile PX2 (Figure 2). The coring ceased at 5.20 m below the seabed, and from the bottom upwards, the core consists of the following units (Figure 7):
- from 5.20 to 2.92 m, very fine ochre pelitic sand, with many clay intercalations of various greyish shades;
- from 2.92 to 2.61 m, bioclastic gravel in an ochre sandy/pelitic matrix;
- from 2.61 to 1.52 m, very fine ochre sand with rare small bioclasts;
- from 1.52 to 0.78 m, bioclastic gravel in an ochre sandy/pelitic matrix; and
- from 0.78 m to the sea floor, fine and very fine ochre sand.
4.4. Seismic Facies
In this section, we describe the seismic facies recognised in the sediments belonging to the TST, which cover ES1 and infill the IV1 and IV2.
- Facies 1 (Figure 8A,B). This facies is only present at the bottom of the incised valleys and is characterised by high amplitude down-lapping reflector or sets of concave and/or convex and/or wavy reflectors; reflectors also show frequent changes in dip direction; the lateral continuity is low-medium. In the seismic profiles normal to the narrow valley axes, the reflectors present a conformable channel infill pattern.
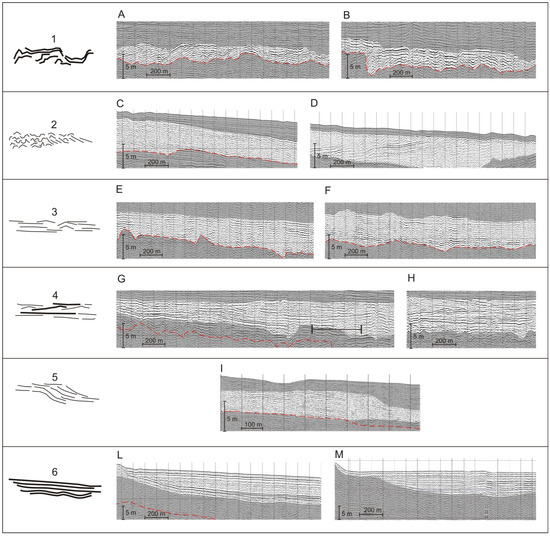 Figure 8. Examples of the seismic facies recognised in the study area in the sparker profiles. On the left the six seismic facies are drawn, with the corresponding number; the drawings roughly summarize the main characteristics of the facies. On the right are examples of each seismic facies, taken from the studied profiles. (A,B): facies 1; (C,D): facies 2a and 2b, respectively; (E,F): facies 3; (G,H): facies 4; I: facies 5; (L,M): facies 6. The shaded areas cover seismic facies different from that described in each row. The red dashed line represents the ES1. All the profile segments shown are along valleys except that of box A, which is across the IV2.
 - Facies 2. These seismic facies can be divided into two subtypes: 2a and 2b. Facies 2a (Figure 8C): this facies, in general, has a chaotic, non-symmetrical internal configuration with reflectors of low or very low amplitude and very low lateral continuity. Commonly, these facies contains V and Λ-shaped reflectors. Alternatively, the reflectors are undulating, concave, convex or oblique-parallel, but always with low amplitude and very low lateral continuity. Facies 2b (Figure 8D): the reflectors are sigmoidal and/or clinoform with moderate-high amplitude and medium-high lateral continuity, which alternate with low amplitude reflectors or with chaotic and non-symmetrical packages, and all are inclined landward. Facies 2 overlies ES1 on the shelf and previous infilling units in IV1 and IV2. From offshore to onshore, a transition between facies 2 and facies 3 or 4 is often observed.
- Facies 3 (Figure 8E,F). This facies is characterised by moderate amplitude and plane-parallel reflectors with medium lateral continuity; sometimes, reflectors are weakly undulating with low lateral continuity. This facies overlies ES1 or seismic facies 1. The relationship with seismic facies 2 is twofold: in some cases, facies 2 transitions landwards into facies 3; in other cases, facies 3 is surmounted by facies 2.
- Facies 4 (Figure 8G,H). This facies is characterised by moderate to high amplitude, medium-high lateral continuity plane-parallel reflectors alternating with wavy or gently inclined reflectors. The relationship of facies 4 with seismic facies 2 is twofold: in some cases, facies 2 transitions landwards into facies 4; in other cases, facies 5 is surmounted by facies 2.
- Facies 5 (Figure 8I). This facies is characterised by moderate amplitude and medium lateral continuity reflectors, with the presence of a topset, fore-set and bottomset; thus, it is a pro-gradational seismic facies. Downdip, this facies transitions into facies 3.
4.5. Unconformity-Bounded Seismic Units
We identified seven UBSUs that lie above ES1 and/or infilled the IV1 and IV2.
4.5.1. Unit Au
Unit Au (the subscript letter u in the abbreviation of the units indicates that all units belong to upper part of TST) consists of seismic facies 1, occupies discontinuous portions of the IV1 and IV2 bottom and lies always above ES1 (Figure 9, Figure 10, Figure 11 and Figure 12). Unit Au reaches a maximum thickness of ca. 9 m.
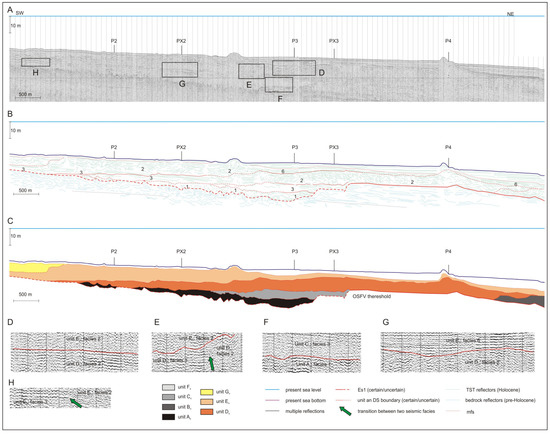
Figure 9.
Part of seismic profile T5. Seismic section (A), interpretation (B), seismic unit recognised (C), enlargement of some significant sectors of the unconformities between units and some transitions between different seismic facies (D–H). In this profile, in particular, the two sets of opposite inclined reflectors that characterise the central body (seismic facies 2) of the unit Du, the position of the central body of unit Eu (seismic facies 2) above the backbarrier deposits (seismic facies 3) of the former unit Du, and the landward backstepping pattern of unit Du and unit Eu are evident. The legend reported below applies until Figure 13 and for Figure 15; the numbers reported in the interpretations of Figure 9, Figure 10, Figure 11, Figure 12 and Figure 13 indicate the seismic facies.
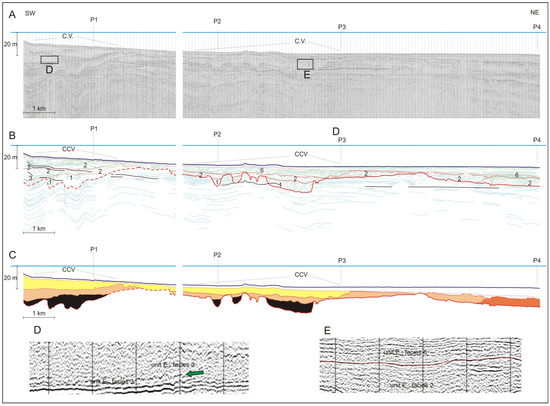
Figure 10.
Part of seismic profile T8. Seismic section (A), its interpretation (B), seismic units recognised (C), and enlargement of some significant sectors of the unconformities between units, with some transitions between different seismic facies (D,E). This profile intercepts two parts of the CCV. In the landward side of the profile, note the superimposition of unit Eu and unit Gu, which are two successive barrier/spit-backbarrier systems. In both systems, as the transgression progressed, the barrier/spit retreated landwards and covered the backbarrier sediments through over-wash and/or tidal inlet deposits, as evidenced by the reflectors in seismic facies 2b down-lapping landwards onto the plane-parallel reflector of seismic facies 3.
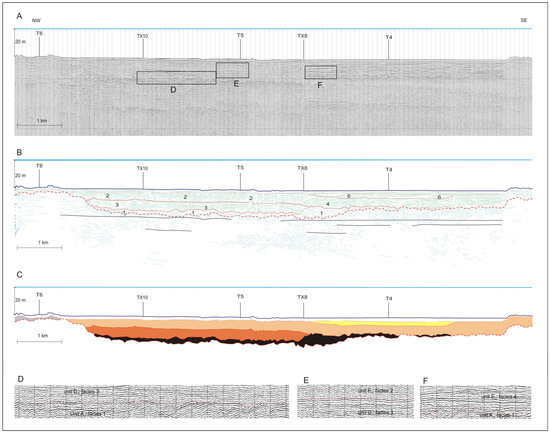
Figure 11.
Part of seismic profile PX2. Seismic section (A), its interpretation (B), seismic units recognised (C), enlargement of some significant sectors of the unconformities between units (D–F). The evidence that the unit Du is intercepted by this profile only in the NW sector of the OSFV indicates that this system is much more extended into the OSFV in this sector than that of the SE. Note also the position of the central body of unit Eu (seismic facies 2) above the backbarrier deposits of the previous unit Du (seismic facies 3) and the transition, within unit Eu, between the central body at the NW (seismic facies 2) and the seismic facies 4 in the SE sector.
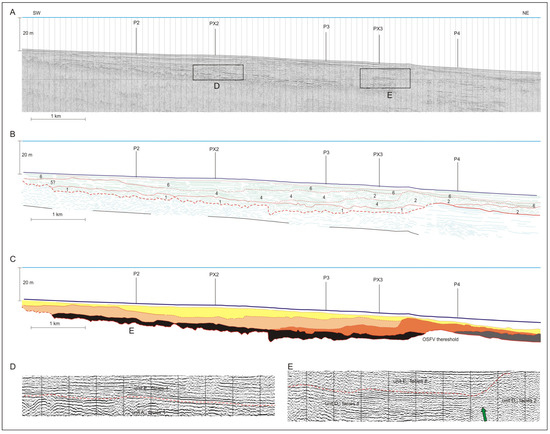
Figure 12.
Part of seismic profile T4. Seismic section (A), interpretation (B), seismic unit recognised (C), and enlargement of some significant sectors of the unconformities between units and, with some transitions between different seismic facies within some units (D,E). In this profile we note the seismic facies 4 which characterises the backbarrier deposits of both unit Du and unit Eu, as well as the smaller width of the central bodies (seismic facies 2a) of unit Du and unit Eu, with respect to seismic profile T5 (Figure 9).
4.5.2. Unit Bu
4.5.3. Unit Cu
Unit Cu occupies only a small lower area of the IV2 at the intersection of profiles T5 and P3 (Figure 6 and Figure 9), and it never exceeds a depth of −38 b.s.l. Overall, this unit has a lenticular shape, lies above unit Au and ES1, reaches a maximum thickness of ca. 5 m and consists exclusively of seismic facies 3.
4.5.4. Unit Du
Unit Du is present between depths of ca. −40 m b.s.l. and ca. −30 b.s.l., and lies on unit Au, unit Bu, and ES1.
In the IV1 sector (profile T8, Figure 10), unit Du is present exclusively seawards and outside the IV1 and lies on the ES1. Here, unit Du is composed of seismic facies 2a, with some sets of landward-dipping reflectors, and the unit reaches a maximum thickness of ca. 7 m.
Passing to IV2 sector, unit Du changes proceeding from the NW to the SE. At the NW (profile T6), unit Du consists only of the seismic facies 2a, lies on ES1 and is present exclusively seawards and outside the IV2. Moving to the SE (profile T5; Figure 9), unit Du centres on the threshold that separates the IV2 from the continental shelf and consists of a central body formed by seismic facies 2a which transitions into seismic facies 3 inside the IV2 (landwards) and seismic facies 6 on the shelf (seawards). The central body is characterised by two sets of opposing inclined reflectors towards the NE and the SW (Figure 9). This internal organisation of the seismic facies within unit Du remains even further to the SE (profile T4; Figure 12), with the difference that the central body of seismic facies 2a appears narrower than that in profile T5 and transitions into seismic facies 4 inside the IV2.
Into the IV2, unit Du extends landwards much further in the NW area (where it appears with seismic facies 3) than in the SW area, where unit Du it is not present (profile PX2; Figure 11A–C).
The central body formed by seismic facies 2 stops at the Barletta strait. This is visible in profile PX3 which is elongated along the external threshold of the IV2 (Figure 6) and then it runs across the central body of the unit Du.
4.5.5. Unit Eu
Unit Eu is present between depths of ca. −30 m and ca. −16 b.s.l., and lies on ES1, unit Au, unit Bu, and unit Du.
In the IV1 sector, unit Eu is formed by seismic 2a both on the shelf and in the seaward part of the valley (profile T8, Figure 10). In the landward part of the valley, unit Eu consists of seismic facies 3 at the base, surmounted by seismic facies 2b (Figure 10).
Passing to IV2 sector, unit Eu appears to be the most complex system in terms of internal organisation, and it changes proceeding from the NW to the SE. To the NW (profile T6), unit Eu is composed of a very thin central body of seismic facies 2a, which seaward transitions into seismic facies 6 and landwards transitions first into facies 3 and then into seismic facies 5; this latter forms a body up to 10 m tick with an evident rollover point between the fore-set and the topset at ca. −19 m (Figure 13). Moving to the SE (profile T5; Figure 9), the central body reaches a thickness of ca. 8 m and transitions landward into seismic facies 3 and seaward into seismic facies 6. Even further to the SE (profile T4; Figure 12), unit Eu is constituted by a body formed by seismic facies 2a, up to ca. 5 m thick, which transitions landwards into seismic facies 4.
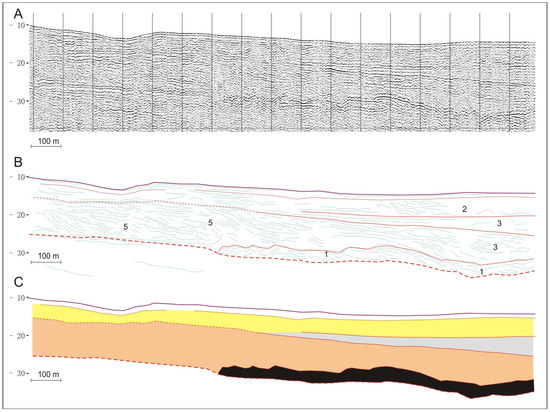
Figure 13.
Part of seismic profile T6 showing the small deltaic body D1=San Fernando delta (SFD). Seismic section (A), interpretation (B), seismic unit recognised (C).
The central body of unit Eu, constituted by seismic facies 2a, is much wider in the NW sector of the IV2 compared to the SE sector. In fact, facies 2a reaches landwards the profile PX2 (Figure 11A–C) only in the NW sector, while, in the SE sector, it gives way to facies 4 (Figure 11A–C).
The deposition of unit Eu involves most of the IV2 infilling and its division into two residual sub-basins, which consist of two areas not completely infilled. The first is a smaller sub-basin located to the NW in front of the sedimentary body formed by seismic facies 5 visible in profile T6 (Figure 13). The second is a larger sub-basin located to the SE in the sector behind the Barletta strait and is visible in profiles PX2 and T4 (Figure 11 and Figure 12).
4.5.6. Unit Fu
Unit Fu infills the NW sub-basin and lies always on unit Eu. Unit Fu formed after deposition of unit Eu, in front of the sedimentary body formed by seismic facies 5 (Figure 13). Unit Fu consists of seismic facies 3 whose reflectors onlap both onto the down-lapping reflectors of the sedimentary body formed by seismic facies 5 (Figure 13) on the landward side and on the chaotic reflectors (facies 2a) of unit Eu on the seaward side of the sub-basin.
4.5.7. Unit Gu
Unit Gu is present between depths of ca. −22 m b.s.l. and ca. −4.7 b.s.l., and lies on ES1, unit Fu, unit Du, and unit Eu. The unit Gu infills the last residual depressions of the IV1 and IV2 and cancels them completely.
In the IV1 sector, unit Gu is composed of seismic facies 2b, 3 and 6. Proceeding from the SW to the NE (profile T8; Figure 10), unit Gu shows a sedimentary body consisting of seismic facies 3 which is surmounted by seismic facies 2b and has a maximum thickness of ca. 10 m; seawards, seismic facies 2 transitions into seismic facies 6, which have a maximum thickness of ca. 7 m (profile T8; Figure 10).
In the IV2 sector, unit Gu is composed of seismic facies 2a and 6 and fills the residual accommodation within the sub-basin left in the SE sector in front of Barletta strait after deposition of unit Eu. In some cases, thin beds of seismic facies 2a, overlaid by the draping reflectors of seismic facies 6, occur (profiles T6 and T5; Figure 9). In other cases, only seismic facies 6, which drapes or onlaps onto underlying units and systems, occur (profile T4; Figure 12). A depo-centre of up to ca. 6 m thickness is observed at the turn of the intersection between profiles T4 and PX2 (Figure 11 and Figure 12).
5. Discussion
5.1. Erosional Surface ES1
Based on data previously collected in the Manfredonia Gulf [30,32] and in the adjacent areas [36], the ES1 is interpreted as the surface of subaerial exposure formed during the last sea-level low stand attained during the LGM.
The ES1 describes the two incised valleys IV1 and IV2. Regarding the IV1, we believe that this valley is the seaward continuation of “incised valley 2” (Figure 6) from De Santis and Caldara [32]. Our data further support that it is unified valley of the Carapelle and Cervaro streams. Historical maps up to and including that of Marzolla [53] shows the two streams merged more or less at the current position of the Carapelle mouth. After 1851 the lower stretch of the Cervaro stream was diverted to the north, bringing its mouth into Salso Lake, and then the stream was diverted to its current position [54]. For this reason, we refer to this landform as the Cervaro-Carapelle valley (CCV).
The IV2 is an incised valley (Figure 6) which appears, in the sector closest to the current coastline, as two different incisions. The main incision corresponds to the present Ofanto River mouth. The second incision is placed in correspondence with the probable mouth of an inactive stream; this mouth is masked today by the Margherita di Savoia saltworks. This stream is not indicated with its proper name in recent and historical maps; however, because of its proximity to the town of San Ferdinando di Puglia, we named it San Ferdinando stream. As a consequence, we indicated the IV2 as Ofanto and San Ferdinando valley (OSFV), where the San Ferdinando stream is a tributary of the Ofanto river.
5.2. Borehole ZS2 and Vibrocores SP1_VC24 and SP1_VC52
Since borehole ZS2 intercepts the transgressive filling of the CCV (Figure 6), it allows the reconstruction of its sedimentary palaeoenvironments. From 30 to 29 m, the environment is continental and characterised by the presence of stagnant freshwater. From 29 to 27.5 m, a euryhaline and eurytherm lagoon (LEE, sensu [55]) is established, which was initially confined and then became more open. Lagoon sedimentation was interrupted by a pyroclastic episode. Starting from 27.5 m, there is a rapid marine transgression characterised by a strong sedimentary instability typical of the heterogeneous palaeo-community [56]. This palaeo-community developed at the passage between the infralittoral zone and the terrigenous mud biocoenosis (VTC, sensu [55]) of the circalittoral zone. After a transition phase (from 12.45 to 8.0 m), starting at 8.0 m, a regressive phase occurred characterised by fine well-sorted sand biocoenosis (SFBC, sensu [55]) with some beach-layers. Finally, the succession is closed by an anthropic deposit.
The borehole ZS2 also provides two important chronological constraints for the transgressive filling of CCV and allows for an assessment of the subsidence rate of the area during the Holocene.
The chronological constraints are: (i) sample ZS2 28.65, located at −27.45 m b.s.l., consisting of lagoonal environment clays rich in Cerastoderma glaucum, which provided an age of 9160 ± 137 cal year BP; and (ii) the level of coarse pumice, whose base is located at −27.30 m b.s.l., which is attributed to the Mercato pumice eruption that occurred at 8890 ± 90 cal year BP [51,52].
Above the pumice level, the lagoonal clays rich in Cerastoderma glaucum reoccur. When the Mercato eruption occurred, local sea level was ca. −24.3 m b.s.l. [47]. If we consider the base of pumice level (currently at −27.30 m b.s.l.) as the bottom of the palaeo lagoon on the eve of the eruption, it follows that the palaeo lagoon was max. ca. 3 m deep if no subsidence occurred. However, if we consider that Cerastoderma glaucum generally lives up to a maximum depth of −2 m [57,58,59,60], we hypothesize that, at the date of the Mercato pumice eruption, the lagoon bottom (base of the pumice layer) was at ca. −26.3 m b.s.l. The current position of the base of the pumice at −27.3 m b.s.l. implies a total subsidence of one meter, with a rate of 0.11 mm/a.
The subsidence value of one meter was used to correct the palaeo sea-levels obtained from the current position of the base and the top of the bodies formed by seismic facies 2.
The vibro-cores SP1_VC24 and SP1_VC25 show a predominantly sandy deposit rich in coarse bioclasts, with a minor content of silt and/or clay, which we interpret as a high energy beach deposited at (or close to) sea level (beach/shoreface).
5.3. Interpretation of Seismic Facies
Facies 1. The characteristics of this seismic facies, its position, and the similarity with other seismic facies of fluvial origin [40,42] suggest a fluvial lag which was most likely deposited under high-energy conditions. The deposition of this facies occurred when streams incised the substrate and developed during both the low-stand and transgression until the arrival of the sea.
Facies 2. The interpretation of the seismic facies 2 was based also on the vibro-cores SP1_VC24 and SP1_VC25 (Figure 2), which intercept only this facies from the sea bottom to borehole bottom (Figure 14). Overall, the data allows us to interpret seismic facies 2a as a predominantly sandy deposit rich in coarse bioclasts, with a minor content of silt and/or clay. Based on this evidence, we interpret this facies as the expression of high-energy coastal sediments in a beach/shoreface environment. This interpretation is in accordance with Trincardi et al. [28], who defined the transgressive sediments cropping out at the sea bottom in the area where the two vibro-cores are located as “proximal transgressive sandy deposits of beach or paralic environment”. Facies 2b is interpreted as a beach/shoreface deposit within a transgressive barrier or spit that migrated landward by wave erosion and over-washing. In fact, landward-dipping reflectors are dominant in transgressive barriers, and they can be interpreted as former flood-tidal deltas and wash-over fans, which generally overlie sandy-muddy deposits that formed in a backbarrier environment [61,62]. In conclusion, seismic facies 3 represents deposits that formed following arrival of the sea and wave action: this wave action reworked ES1 and created a coastal high-energy palimpsest deposit due to mixing among reworked sediments from the substrate with coeval sediments.
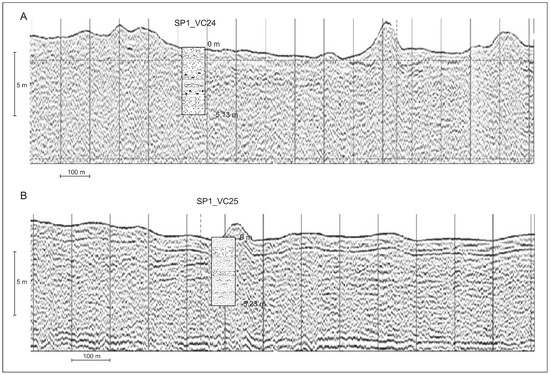
Figure 14.
Seismic facies 2 within profiles P2 (A) and PX2 (B), with stratigraphic logs of the two vibrocores SP1_VC24 and SP1_VC25.
Facies 3. The position of facies 3 with respect to facies 2 is a fundamental element for its interpretation: the transition between facies 2 and 3 is interpreted as a passage from a beach/barrier/spit environment to a low-energy environment; therefore, facies 3 is interpreted as a backbarrier deposit (perhaps a semi-enclosed bay/microtidal estuarine lagoon). The cases where facies 2 lies above facies 3 are interpreted as resulting from the migration of coastal environments landwards, when the beach passed over the backbarrier during progression of the marine transgression.
Facies 4. As in the case of facies 3, the transition between facies 2 and 4 is interpreted as a passage from a beach/barrier/spit environment to a lower energy environment. In addition, the position of facies 4 in the area of the IV2, near the opening towards the sea, allows us to interpret this seismic facies as a deposit of open backbarrier (perhaps bay/ microtidal estuarine lagoon), probably of silty nature. The proximity to the opening implies the presence of currents and channels, which create a moderate energy environment. Thus, the wavy undulations which characterise this facies can be interpreted in some cases as channel features, in other cases as deformation of the estuarine/lagoon bottom due to waves or currents.
Facies 5. This seismic facies is interpreted as a deltaic body. Thus, the body formed by seismic facies 5 within unit Eu represents a small delta (D1; Figure 13) up to ca. 10 m thick.
Facies 6. This seismic facies is interpreted as a lower shoreface/offshore, probably silty-clay deposit that lies around or below the wave action base. It is formed due to the rapid landward shift in the shoreline, which was in turn due to the low-gradient substrate.
5.4. Interpretation of UBSUs and Transgressive Architecture (Sea Level Ranges and Deposition of UBSUs)
We have linked the UBSUs at four sea-level ranges and therefore at four corresponding age ranges. The sea-levels which define the ranges are: −39 m, −29 m, −18 m, −4.7 m. The first two values are derived from upper and/or lower limit of bodies formed by seismic facies 2, corrected considering a subsidence of 1 m. The level −18 m is derived from the small coastal deltaic body (D1; seismic facies 5) visible within the unit Eu, by assuming its rollover point between the fore-set and the topset as a proxy of sea level (according to [30,45,63]), after a correction to remove the subsidence of 1m. The level −4.7 m is that coinciding with the maximum landward shift of the shoreline (ca. 5.5 ka BP; [47] and marks the end of the late-Pleistocene to Holocene transgression [30,33,34,35].
5.4.1. Sea-Level Range 1: up to ca. −39 m b.s.l.
This phase coincides with a sea-level rise up to ca. −39 m b.s.l., i.e., until ca. 9.8 ka BP [47]. In this phase, the sea entered the OSFV occupying only the lowest reaches, corresponding to the Barletta strait and the northernmost corner (intersection between profiles P3 and T5; Figure 6). In this phase, unit Au, unit Bu, and unit Cu were deposited.
Unit Au contains only seismic facies 1, corresponding to a fluvial lag. In the OSFV, this unit extends both below and above −39 m b.s.l., while in the CCV, it extends only above the −39 m b.s.l. Thus, it was deposited in a subaerial environment on the bottom of the two valleys until the arrival of the sea.
Unit Bu consists exclusively of seismic facies 2a and is interpreted as a beach deposit formed on the shelf above the ES1 in conjunction with a sea-level rise of up to −39 m.
Unit Cu consists exclusively of seismic facies 3, and its deposition is correlated to the final phases of sea-level rise up to −39 m. We interpret this unit as an enclosed bay/lagoon deposit that formed when the sea began to enter the OSFV through the Barletta strait, without having yet submerged the IV2 threshold.
5.4.2. Sea-Level Range 2: from ca. −39 to ca. −29 m b.s.l.
This range coincides with a sea-level rise from ca. −39 to ca. −29 m b.s.l., i.e., from ca. 9.8 ka BP to ca. 9.2 ka BP [47].
In CCV sector, this phase involves the deposition of part of unit Au and unit Du. Unit Au maintains the same characteristics as those described in the previous phase. Unit Du is constituted only of seismic facies 2a; thus, unit Du is interpreted as a simple beach deposit of high-energy environment deposited on the ES1.
In the OSFV sector, this phase involves the deposition of unit Du; the OSFV threshold is not jet submerged in the NW sector of the valley (profile T6), while it is fully submerged in the central and south-eastern sector (profiles T5 and T4; Figure 9 and Figure 12). Therefore, unit Du is confined to the outside of the valley in the first sector, while it centres on the threshold in the central and south-eastern sector. Considering the overall geometry of unit Du, as well as the seismic facies that constitute it, we believe that it consists of a central body composed of a beach/spit that, into the OSFV, transitions into backbarrier deposits (perhaps semi-enclosed bay/microtidal estuarine lagoon) and towards the shelf into the lower shoreface/offshore deposits. In particular, the presence of a spit is inferred from the two sets of opposing inclined reflectors that characterise the central body consisting of seismic facies 2a (Figure 9), from the progressive narrowing of the central body proceeding from the NW to the SE (compares profiles T5 and T4; Figure 9 and Figure 12), and from its terminations at the correspondence of the Barletta strait (profile PX3).
5.4.3. Sea-Level Range 3: from ca. −29 to ca. −18 m b.s.l.
This range coincides with sea-level rising from ca. −29 m to ca. −18 m b.s.l., which occurred from ca. 9.2 ka BP to ca. 8.3 ka BP [47].
In the CCV sector, deposition of unit Eu only occurred. We interpret the infilling of the landward part by unit Eu (profile T8; Figure 10) as a transgressive barrier/spit that migrated landward and covered the backbarrier deposits [64,65]. This system formed at the unified mouth of the Carapelle and Cervaro streams.
Passing to OSFV, deposition of units Eu and Fu occurred. In the NW sector (profile T6) rising sea levels submerged the threshold only in this phase, albeit slightly. The small delta D1 recognisable within unit Eu is located seaward of the probable position of the San Ferdinando stream mouth before it was covered by the Margherita di Savoia saltworks. Thus, we named this feature the San Ferdinando delta (SFD).
The deposition of unit Eu involves most of the OSFV infilling and its division into two residual sub-basins, the most northwest of which, placed in front of SFD, is rapidly filled by unit Fu in the last part of this same phase, after the SFD formation (Figure 13). Considering the overall geometry of unit Eu, as well as the seismic facies that constitute it, we interpret unit Eu as a complex coastal system consisting of lower shoreface/offshore deposits that pass landwards into to beach/spit deposits, then to backbarrier deposits (perhaps a semi-enclosed bay/ microtidal estuarine lagoon) in which a small fluvial delta flow.
5.4.4. Sea-Level Range 4: from ca. −18 to ca. −4.7 m b.s.l
This range coincides with a sea-level rise from ca. −18m to ca. −4.7 m b.s.l. This phase involves the deposition of unit Gu both in the CCV and OSFV sectors.
In the CCV sector, based on the seismic facies and their mutual positions, unit Gu is interpreted as a transgressive spit-barrier sandy deposit that overlies backbarrier deposits (perhaps a semi-enclosed bay/microtidal estuarine lagoon), which passes seaward into the lower shoreface/offshore deposits.
In the OSFV sector, based on the seismic facies and their mutual positions, unit Gu is interpreted as a sandy beach deposit of high energy at the bottom (seismic facies 2a) dating back only to the earliest moments of the phase. Then, the beach deposit was quickly replaced by lower shoreface/offshore deposits (seismic facies 6), which are probably silty-clayey, dating back to when the shoreline transgressed rapidly across the gentle slope of the shelf.
5.5. Focus on Beach/Spit-Backbarrier Systems in CCV and OSFV Infilling
In this section, we propose models for the formation and evolution dynamics of beach/spit-backbarrier systems in the infilling of CCV and OSFV.
5.5.1. CCV Infilling
We interpret the landward sector of CCV as the superimposition of two successive barrier/spit-backbarrier systems at the unified mouth of the Carapelle-Cervaro streams, with the lower system belonging to unit Eu, and the upper systems belonging to unit Gu (Figure 10). In both systems, as the transgression progressed, the barrier/spit retreated landwards and covered the backbarrier sediments through over-wash and/or tidal inlet deposits, as evidenced by the reflectors in seismic facies 2b down-lapping landwards onto the plane-parallel reflector of seismic facies 3 (Figure 10).
The ZS2 borehole (Figure 7) intercepts the infilling of CCV (Figure 6 and Figure 15) and allows the correlation between sparker profile T8 and CHIRP profile T1, and a chronological validation of the age range attributed to unit Eu. In particular, in profile T1 we recognise three seismic units correlated with units Au, Eu, Gu (Figure 15B).
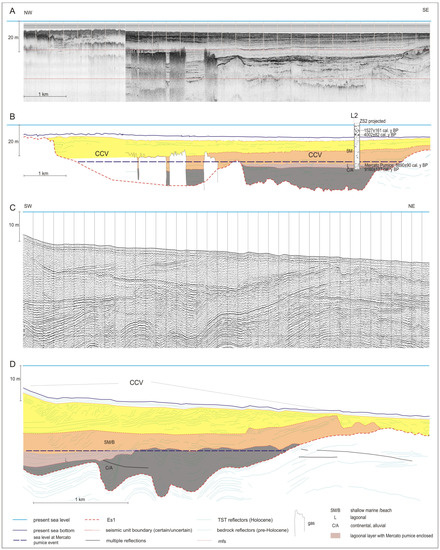
Figure 15.
Southeastern sector of the profile T1 (A) and its interpretation (B), in which the stratigraphic log of ZS2 borehole has been projected. Inland sector of the T8 profile (C) and its interpretation (D). The lagoonal level containing the Mercato pumice in borehole ZS2 has been correlated both to a series of very high-amplitude reflectors placed roughly at the same depth in the nearby profile T1 at the base of unit Eu and to seismic facies 3 reflectors placed roughly at the same depth at the base of unit Eu in profile T8.
The lagoonal deposit with the enclosed Mercato pumice (dated at 9160 ± 137 and 8890 ± 90 cal year BP) in ZS2 borehole (Figure 15B) is correlated with a series of very high-amplitude reflectors visible roughly at the same depth at the base of unit Eu in the CCV sector shown by profile T1 (Figure 15A,B) and, in terms of both depth and sedimentary environment, with seismic facies 3 visible at the base of unit Eu in the near profile T8 (Figure 15C,D). This confirms the age range attributed to unit Eu according to our method of age range evaluation (from ca. 9.2 ka BP to ca. 8.3 ka BP) which, in addition, is within the time of sapropel S1a formation in Mediterranean [66,67].
About the presence of two barrier/spit-backbarrier systems that characterise the inner part of the CCV (units Eu and Gu), we hypothesise that it is due to the abrupt sea-level rise that occurred during the so-called 8.2 event [68,69,70]. This sea-level jump may have drowned the lower barrier/spit-backbarrier system (unit Eu); subsequently, the conditions were appropriate for construction of a new system over the previous one (unit Gu). This hypothesis is consistent with a scheme in which unit Eu is attributed to the sapropel S1a event, and unit Gu can be attributed to sapropel S1b, as these units are separated by a discontinuity dating back to the 8.2 event [67].
5.5.2. OSFV Infilling
With rising sea level, the inherited morphology of the OSFV favors the creation of beach/spit-backbarrier systems associated with the Ofanto river mouth. The first evidence of the creation of a real beach/spit-backbarrier system (unit Du) occurs during sea-level range 2 (Figure 16). Sea-level rise flooded the threshold separating the OSFV from the shelf. The threshold appears to play an important role in triggering the formation of the system. In fact, the first spit that forms (within unit Du) is perched on the bedrock high of the threshold (Figure 9 and Figure 12). The presence of the high provided material for the construction of the spit (as marine erosion affected the high) and promoted the deposition of material transported by the littoral drift. This feature appears to be like other barriers, such as barrier system of the Miquelon-Langlade island [71]. The landward expansion of the unit Du was enabled by the initial infilling of the OSFV (unit Cu).
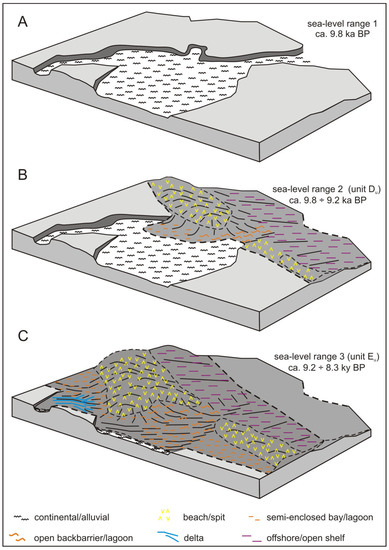
Figure 16.
Three-dimensional model of the main phases of OSFV infilling, involving the deposition of unit Du and unit Eu. (A) sea-level range 1: up to ca. −39 m b.s.l.; (B) sea-level range 2: from ca. −39 to ca. −29 m b.s.l.: deposition of unit Du; (C) sea-level range 3: from ca. −29 m to ca. −18 m b.s.l.: deposition of unit Eu.
The accretion of the unit Du spit left an opening in the Barletta strait (profile PX3). This landform, inherited from the time of the OSFV incision, is only modified by spit accretion but remains as an opening between the OSFV and the open sea. This opening influenced the different hydrodynamics that affect the backbarrier deposits. In the NW sector (profile T5, Figure 9), these deposits are composed of seismic facies 3, which indicates a low-energy environment. In the SE sector (profile T4, Figure 12), these deposits are composed of the wavy facies 4, which indicate relatively high energy due to the presence of channels, currents and/or waves in the sector closest to the opening to the sea.
During sea-level range 3, a general landward shift in the beach/spit-backbarrier system (unit Eu) occurs, together with an increase in sediment supply, resulting in a greater thickness and extension of the unit Eu (Figure 16). Compared to the sea level range 2, the different hydrodynamics within the backbarrier is conserved between the NW and the SE sectors, with the same characteristics and same causes. In its final stages, this phase resulted in the near-complete infilling of the OSFV.
The small delta (SFD) that formed during sea level range 3 at the inner edge of the OSFV within unit Eu is important to test our age model; in fact, the sea level of −18 m, reconstructed from the rollover point of SFD, corresponds to an age of ca. 8.3 ka BP [47], that is, within the formation period of sapropel S1a [66,72]. This data supports the attribution of the unit Eu to the sapropel S1a, as in the CCV sector.
5.6. Palaeoenvironmental and Palaeoclimatic Considerations
The overall characteristics of the OSFV infilling suggest sediment movement proceeded from the NW to the SE. All the units decrease in size in this direction, and the OSFV infilled is faster in the NW sector than in the SE sector. In particular, the construction of a sandy spit points to a littoral drift from the N-NW to the E-SE; that is, in the opposite direction of the current littoral drift in the Manfredonia Gulf.
The direction of sediment transport reconstructed in this work suggests a scenario such as that described by De Santis and Caldara [73] for the period preceding the Holocene climatic transition (ca. 5.5–4.5 cal ka BP). For that period, the authors recognised a strong southward and south-eastward littoral drift in the Manfredonia Gulf, which was promoted by the prevalence and dominance of the N, E and NE winds, in turn promoted by more frequent cyclogenesis to the E, S and SE of the Italian Peninsula. Therefore, this littoral drift pattern in the Manfredonia Gulf seems to have been active from at least ca. 9.8 ka BP, when the first beach/spit-backbarrier system started to form (unit Du).
We consider units Du, Eu, and Gu as beach/spit-backbarrier systems that were arranged in a landward backstepping pattern, which involved partial preservation of transgressive deposits or spit morphology. According to the literature, the preservation of relict barrier within a backstepping sequence is rare [12,21] and has been attributed to combinations of rapid sea-level rise, such as those associated with meltwater pulses [16], and accompanied by particularly favourable circumstances, such as early cementation (beach-rock and aeolianite formation) or gravelly sediments [12,14,17].
In our case, the barrier system overstepping occurred after MWP-1B and is therefore in a regime of sea-level rise slower than the previous period [13,74]. Furthermore, the overstepping affected loose and mostly sandy sediments, as demonstrated by the vibro-core collected in this study and by the previous studies [28,30,31]. Therefore, to justify the partial preservation of two barrier systems arranged in a landward backstepping pattern, we believe that a strong and continued supply of sediments attenuated or compensated for the erosive actions. In this context, subsequent units or systems may partially cover and protect previous systems (Figure 17A–C).
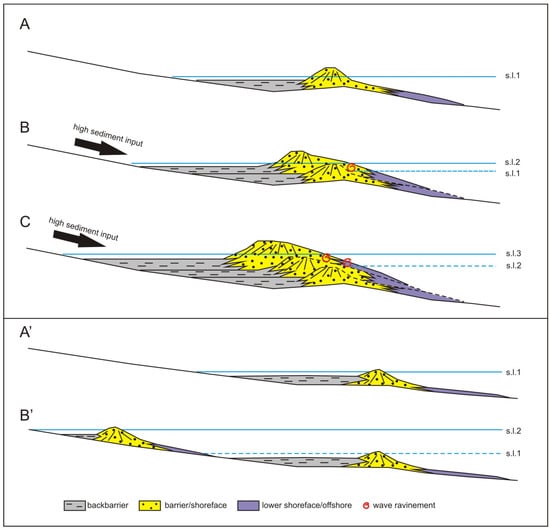
Figure 17.
Comparison between our observed “continuous” landward backstepping pattern (A–C) and the model of backstepping of Sanders and Kumar [75] and Rampino and Sanders [76] (A’–B’).
We correlate this strong and continued sediment supply with the sapropel S1 event. In fact, the chronological constraint provided by the borehole ZS2 and the sea level reconstructed thanks to SFD allows the consideration of unit Eu as coeval with formation of sapropel S1a. As this conclusion confirms and validates our age range evaluation method based on seismic facies 2, it appears that unit Du and, probably, at least part of unit Gu, were also formed simultaneously with the deposition of sapropel S1 in the Mediterranean. Thus, units Du, Eu, and Gu represent the shallow-water equivalent of the cm-thick sapropel layers that accumulated offshore in the deeper southern Adriatic basin.
During the minima of the precession of the equinoxes, the northward shift in the African monsoon led to increased precipitation and river runoff in northern African and eastern European regions, which favoured water column stratification and reduced deep-water ventilation of the eastern Mediterranean Sea and Adriatic. This allowed for the accumulation and preservation of organic matter in deep marine sediments and the formation of sapropels [77,78,79]. The youngest of such events, sapropel S1, occurred from ca. 10/9.0 to ca. 6.8 cal ka BP [66,67] and formed in two distinct pulses (S1a and S1b), which are separated by an interruption in sapropel formation, dating to ca. 8.3–7.8 cal ka BP in the Adriatic Sea [67] due to a short-lived episode of cooler and drier conditions [66].
Overall, units Du, and Eu demonstrate a period of increased sediment influx to the sea, which has promoted the formation of complex coastal systems. In particular, the formation of the small delta within unit Eu shows a period of increased precipitation during the S1a sapropel event in this area of southern Italy [80] and not only in the northern African and eastern European regions.
Therefore, the roles of the S1 event in the creation and partial preservation of our complex beach/spit-backbarrier systems (units Du, Eu, and Gu) seem to be as follows: i) a direct role in the formation of the beach/spit-backbarrier systems of units Du, Eu, and Gu, due to the increased sediment supply; and ii) an indirect role in the partial conservation of previous beach/spit-backbarrier systems because the same increased sediment supply that created a subsequent system also allowed partial protection and conservation of a previous system from wave ravinement action.
The “in-place drowning” transgressive model for low-gradient shelves [75,76], although questioned later [11], predicts that a barrier island-lagoon system develops during conditions of slow relative sea-level rise (Figure 17A’); the barriers can be drowned and preserved due to a very rapid pulse of relative sea-level rise, such as the MWP-1A and MWP-1B, which are recognized in most of the sea-level curves. Later, a new barrier forms landwards during newly created conditions of slower relative sea-level rise (Figure 17B’). This is the case, for example, in the barriers systems of the northern Adriatic [13], a low-gradient setting [81]; due to the episodic occurrence of very high rates of sea-level rise up to 60 mm/a [74], some barriers were overstepped and drowned. As a result, two barriers can be several kilometres apart [81]. A similar case is that described by Cooper et al. [15] in Tijucas Bay (southern Brazil), where a former sandy shoreface-barrier was overstepped during the 8.2 ka event and decoupled from the contemporary shoreline. Upon overstepping, the wave-influenced shoreline was shifted from the barrier to the landward margin of the former backbarrier (over 7 km cross-shore distance).
Our study instead suggests that, in situations of high and continued sedimentary inputs, low-gradient settings and sea-level rise lower than those recorded during MWP-1A and MWP-1B, a stacking pattern of the barrier systems that we define as “continuous” backstepping may be generated, in which the next barrier system partially covers the previous one (Figure 17A–C). Continued sediment supply is a key factor in our model. In an extreme situation, a very strong and continuous sediment supply, along with a slow sea-level rise, can generate a prograding barrier system [82]. Instead, in our case, a fine balance between SLR and sediment supply causes a continuous landward backstepping.
6. Conclusions
Holocene sea-level rise has affected most of the LGM surface (ES1) in our study area between the last phases of the MWP−1B [13,74,83,84] and the subsequent slower rise until the maximum landward shift in the shoreline occurred. This implies that in our study area, the upper part of the TST was deposited (uTST [36]), as well as the subsequent HST, from 5.5 ka to present day.
In the innermost area of the Manfredonia Gulf, the post-Würm transgression resulted in the backfilling of two erosive landforms incised within the ES1 which we documented for the first time.
The first landform (CCV), located further to the NW, is correlated with the current Carapelle and Cervaro streams and consists of a meandering incised valley with stretches parallel to the current coastline in the most landward sector and a straighter route on the shelf, where it flows as a tributary into the so-called MIV.
The second erosive landform (OSFV), which is present farther to the SE, is correlated with the current San Ferdinando stream and Ofanto River. The OSFV consists of two separate incisions that join to form a very wide and shallow valley.
Six different seismic facies and seven UBSUs have been identified, which have covered the ES1 and/or infilled the CCV and OSFV. The UBSUs in some cases are made up of a single seismic facies, in other cases of multiple seismic facies that transit into one another.
We have identified some approximated age ranges for the different units, starting from the current position of one of the seismic facies identified, seismic facies 2. It has been interpreted as deposited at (or close to) contemporary sea level. Since seismic facies 2 forms several sedimentary bodies (belonging to different units) in a landward backstepping pattern on ES1, we associated two sea levels with the base and top of each sedimentary body. Then, we considered the local sea-level curve to infer two ages corresponding to these two sea levels. Thus, several sedimentary bodies formed by seismic facies 2 can be correlated to many sea-level ranges and therefore to age ranges.
Both in the CCV and OSFV, some barrier/spit-backbarrier systems, arranged in a landward backstepping pattern, were formed. One of these (unit Eu) was attributed to the sea level range between −29 to −18 m b.s.l. and, thus, to a time interval between 9.2 ka BP and ca. 8.3 ka BP. This age range attribution, obtained from the current position of sedimentary bodies formed by seismic facies 2 included in unit Eu, was chronologically constrained both in CCV and OSFV.
In CCV the chronological constraint was obtained thanks to a dated lagoonal deposit with enclosed Mercato pumice present in the ZS2 borehole, which intercepts unit Eu. In OSFV, the chronological constraint was obtained thanks to a small delta included in unit Eu, in that the rollover point of the delta was assumed as a sea-level indicator, and thus as an age indicator.
The chronological constraint identified for unit Eu validated the age range evaluation method based on the current position of sedimentary bodies formed by seismic facies 2. Thus, it results that most of the OSFV and CCV infilling is coeval with the formation of the sapropel S1a in the Mediterranean.
The role of the S1 event in the creation and partial preservation of our complex beach/spit-backbarrier systems seem to be both direct and indirect: direct in the formation of the systems, due to the increased sediment supply; indirect in the partial conservation of previous systems because the same increased sediment supply, coupled with the low gradient setting and slow relative sea-level rise, promoted what we call a “continuous” backstepping. This latter, in turn allowed the partial protection and conservation of the previous barrier system from wave ravinement action.
The progression of the infilling units into CCV and OSFV indicates a prevalent littoral drift from the N-NW to the E-SE; that is, in a direction contrary to the current littoral drift of the Manfredonia Gulf. This evidence allows us to extend the climatic phase of frequent cyclogenesis to the E, S and SE of the Italian Peninsula, identified by De Santis and Caldara [73] before the middle-late Holocene transition (5.5–4.5 ka cal BP), backwards in time to at least ca. 9.8 ka BP.
Author Contributions
Conceptualization, V.D.S., M.C., L.P.; methodology, V.D.S.; software, V.D.S., M.C.; formal analysis, V.D.S., M.C.; investigation, V.D.S., M.C.; data curation, V.D.S., M.C.; writing—original draft preparation, V.D.S.; writing—review and editing, V.D.S., M.C.; supervision, V.D.S., M.C., L.P.; funding acquisition, V.D.S., L.P. All authors have read and agreed to the published version of the manuscript.
Funding
This research received no external funding.
Acknowledgments
We are very grateful to (1) Puglia Basin Authority (AdB) for cores of borehole ZS2 obtained within the “Studio di fattibilità per il monitoraggio e la messa in sicurezza delle aree urbane a rischio di stabilità statica e vulnerabilità strutturale Comune e Provincia di Foggia, Codice DT 011, affidato dalla Regione Puglia all’Autorità di Bacino della Puglia e finanziato con fondi assegnati con delibera CIPE n. 20/2004”; (2) Puglia Basin Authority (AdB) for stratigraphic descriptions of vibrocores SP1_VC24 and SP1_VC25, obtained within the “Piano operativo per l’individuazione di giacimenti di sabbia sottomarini utilizzabili per il ripascimento artificiale dei litorali sabbiosi in erosione della regione. P.O.R. Puglia 2000–2006-FESR-Asse IV sistemi locali di sviluppo, misura 4.16”; (3) Con.I.S.Ma. (Interuniversity Consortium for Sea Sciences) for use of the motorboat “ISSEL”, within the research agreement n. 270-2017 “Rilievi sismici sulla piattaforma continentale pugliese”; (4) Ionic University section of the University of Bari for instruments and sensors used for navigation and seismic campaign; (5) En.Su (Environmental Survey) and Francesco De Giosa for data processing; and (6) Roberto Sulpizio for the anticipation of some results of the pumice analyses in borehole ZS2.
Conflicts of Interest
The authors declare no conflicts of interest.
References
- Otvos, E.G. Coastal barriers-nomenclature, processes, and classification issues. Geomorphology 2012, 139–140, 39–52. [Google Scholar] [CrossRef]
- Stutz, M.I.; Pilkey, O.H. Open-ocean barrier islands. Global influence of climatic, oceanographic, and depositional settings. J. Coast. Res. 2011, 27, 207–222. [Google Scholar] [CrossRef]
- Otvos, E.G. Coastal barriers, northern Gulf - Last Eustatic Cycle; genetic categories and development contrasts. A review. Quat. Sci. Rev. 2018, 193, 212–243. [Google Scholar] [CrossRef]
- Hesp, P.A.; Short, A.D. Barrier morphodynamics. In Handbook of Beach and Shoreface Morphodynamics; Short, A.D., Ed.; John Wiley & Sons: Hoboken, NJ, USA, 1999; pp. 307–333. ISBN 978-0-471-96570-1. [Google Scholar]
- De Santis, V.; Caldara, M.; Torres, T.; Ortiz, J.E.; Sánchez-Palencia, Y. A review of MIS 7 and MIS 5 terrace deposits along the Gulf of Taranto based on new stratigraphic and chronological data. Ital. J. Geosci. 2018, 137, 349–368. [Google Scholar] [CrossRef]
- De Santis, V.; Caldara, M.; Torres, T.; Ortiz, J.E.; Sánchez-Palencia, Y. The role of beach ridges, spits, or barriers in understanding marine terraces processes on loose or semiconsolidated substrates: Insights from the givoni of the Gulf of Taranto (southern Italy). Geol. J. 2020, 55, 2951–2975. [Google Scholar] [CrossRef]
- Roy, P.S.; Cowell, P.J.; Ferland, M.A.; Thom, B.G. Wave dominated coast. In Coastal Evolution, Late Quaternary Shoreline Morphodynamics; Carter, R.W.G., Woodroffe, C.D., Eds.; Cambridge University Press: Cambridge, UK, 1994; pp. 121–186. ISBN 0-521-59890-7. [Google Scholar]
- Zecchin, M.; Catuneanu, O.; Caffau, M. Wave-ravinement surfaces: Classification and key characteristics. Earth-Sci. Rev. 2019, 188, 210–239. [Google Scholar] [CrossRef]
- Mellett, C.L.; Plater, A.J. Drowned Barriers as Archives of Coastal-Response to Sea-Level Rise. In Barrier Dynamics and Response to Changing Climate; Moore, L.J., Murray, A.B., Eds.; Spinger: Berlin/Heidelberg, Germany, 2018; pp. 57–89. ISBN 978-3-319-68086-6. [Google Scholar]
- Swift, D.J.P.; Moslow, T.F. Holocene transgression in south-central Long Island, New York-discussion. J. Sediment. Petrol. 1982, 53, 1014–1019. [Google Scholar]
- Leatherman, S.P.; Rampino, M.R.; Sanders, J.E. Barrier island evolution in response to sea level rise; discussion and reply. J. Sediment. Res. 1983, 53, 1026–1033. [Google Scholar] [CrossRef]
- De Falco, G.; Antonioli, F.; Fontolan, G.; Lo Presti, V.; Simeone, S.; Tonielli, R. Early cementation and accommodation space dictate the evolution of an overstepping barrier system during the Holocene. Mar. Geol. 2015, 369, 52–66. [Google Scholar] [CrossRef]
- Storms, J.E.A.; Weltje, G.J.; Terra, G.J.; Cattaneo, A.; Trincardi, F. Coastal dynamics under conditions of rapid sea-level rise: Late Pleistocene to Early Holocene evolution of barrier-lagoon systems on the northern Adriatic shelf (Italy). Quat. Sci. Rev. 2008, 27, 1107–1123. [Google Scholar] [CrossRef]
- Mellett, C.L.; Hodgson, D.M.; Mauz, B.; Lang, A.; Selby, I.; Plater, A.J. Preservation of a drowned gravel barrier complex: A landscape evolution study from the northeastern English Channel. Mar. Geol. 2012, 315–318, 115–131. [Google Scholar] [CrossRef]
- Cooper, J.A.G.; Green, A.N.; Meireles, R.P.; Klein, A.H.F.; Souza, J.; Toldo, E.E. Sandy barrier overstepping and preservation linked to rapid sea level rise and geological setting. Mar. Geol. 2016, 382, 80–91. [Google Scholar] [CrossRef]
- Green, A.N.; Cooper, J.A.G.; Salzmann, L. Geomorphic and stratigraphic signals of postglacial meltwater pulses on continental shelves. Geology 2014, 24, 151–154. [Google Scholar] [CrossRef]
- Green, A.N.; Cooper, J.A.G.; Leuci, R.; Thackeray, R. Formation and preservation of an overstepped segmented lagoon complex on a high-energy continental shelf. Sedimentology 2013, 60, 1755–1768. [Google Scholar] [CrossRef]
- Belknap, D.F.; Kraft, J.C. Preservation potential of transgressive coastal lithosomes on the U.S. Atlantic Shelf. Mar. Geol. 1981, 41, 419–442. [Google Scholar]
- Belknap, D.F.; Kraft, J.C. Influence of antecedent geology on evolution of barrier systems. Mar. Geol. 1985, 63, 235–262. [Google Scholar] [CrossRef]
- Belknap, D.F.; Kraft, J.C.; Dunn, R.K. Transgressive valley-fill lithosomes: Delaware and Maine. In Incised-Valley Systems: Origin and Sedimentary Sequences; Dalrymple, R., Boyd, R., Zaitlin, B., Eds.; SEPM: Broken Arrow, OK, USA, 1994; Volume 51, pp. 303–320. [Google Scholar]
- Storms, J.E.A.; Swift, D.J.P. Shallow marine sequences as the building blocks of stratigraphy: Insights from numerical modelling. Basin Res. 2003, 15, 287–303. [Google Scholar] [CrossRef]
- De Santis, V.; Caldara, M.; Torres, T.; Ortiz, J.E. Stratigraphic units of the Apulian Tavoliere Plain: Chronology, correlation with marine isotope stages and implication regarding vertical movements. Sediment. Geol. 2010, 228, 255–270. [Google Scholar] [CrossRef]
- De Santis, V.; Caldara, M.; Pennetta, L.; Torres, T.; Ortiz, J.E. Unconformity bounded stratigraphic units in an Italian alluvial plain area: Recognising and dating. J. Sediment. Res. 2013, 83, 96–114. [Google Scholar] [CrossRef]
- De Santis, V.; Caldara, M.; Torres, T.; Ortiz, J.E. Two middle Pleistocene warm stages in the terraced deposits of the Apulia region (southern Italy). Quat. Int. 2014, 332, 2–18. [Google Scholar] [CrossRef]
- De Santis, V.; Caldara, M.; Pennetta, L. The marine and alluvial terraces of Tavoliere di Puglia plain (southern Italy). J. Maps 2014, 10, 114–125. [Google Scholar] [CrossRef]
- Caldara, M.; Pennetta, L. Pleistocenic buried abrasion platforms in Southeastern “Tavoliere“ (Apulia, South Italy). Alp. Mediterr. Quat. 1991, 4, 303–309. [Google Scholar]
- Fabbri, A.; Gallignani, P. Ricerche geomorfologiche e sedimentologiche nell’Adriatico meridionale. Giorn Geol. 1972, 38, 453–498. [Google Scholar]
- Trincardi, F.; Argnani, A.; Correggiari, A. Note Illustrative della Carta Geologica dei Mari Italiani, alla scala 1:250,00, Foglio NK33-6 Vieste, e Foglio NK33-8/9 Bari; ISPRA: Roma, Italy, 2011; pp. 1–194. [Google Scholar]
- Trincardi, F.; Correggiari, A.; Ridente, D.; Verdicchio, G.; Cattaneo, A.; Minisini, D.; Remia, A.; Taviani, M.; Asioli, A.; Piva, A.; et al. Carta Geologica dei Mari Italiani, Foglio NK33-8/9 Bari; ISPRA: Roma, Italy, 2011. [Google Scholar]
- Maselli, V.; Trincardi, F. Large-scale single incised valley from a small catchment basin on the western Adriatic margin (central Mediterranean Sea). Glob. Planet Chang. 2013, 100, 245–262. [Google Scholar] [CrossRef]
- Maselli, V.; Trincardi, T.; Asioli, A.; Ceregato, A.; Rizzetto, F.; Taviani, M. Delta growth and river valleys: The influence of climate and sea level changes on the South Adriatic shelf (Mediterranean Sea). Quat. Sci. Rev. 2014, 99, 146–163. [Google Scholar] [CrossRef]
- De Santis, V.; Caldara, M. Evolution of an incised valley system in the southern Adriatic Sea (Apulian margin): An onshore-offshore correlation. Geol. J. 2016, 51, 263–284. [Google Scholar] [CrossRef]
- Cattaneo, A.; Correggiari, A.; Langone, L.; Trincardi, F. The late-Holocene Gargano subaqueous delta, Adriatic shelf: Sediment pathways and supply fluctuations. Mar. Geol. 2003, 193, 61–91. [Google Scholar] [CrossRef]
- Trincardi, F.; Asioli, A.; Cattaneo, A.; Correggiari, A.; Langone, L. Stratigraphy of the late-Quaternary deposits in the Central Adriatic basin and the record of short-term climatic events. Memorie-Istituto Italiano di Idrobiologia 1996, 55, 39–70. [Google Scholar]
- Correggiari, A.; Trincardi, F.; Langone, L.; Roveri, M. Styles of failure in heavily-sedimented highstand prodelta wedges on the Adriatic shelf. J. Sediment. Res. 2001, 71, 218–236. [Google Scholar] [CrossRef]
- Maselli, V.; Hutton, E.W.; Kettner, A.J.; Syvitski, J.P.M.; Trincardi, F. High-frequency sea level and sediment supply fluctuations during Termination I: An integrated sequence-stratigraphy and modeling approach from the Adriatic Sea (Central Mediterranean). Mar. Geol. 2011, 287, 54–70. [Google Scholar] [CrossRef]
- Cattaneo, A.; Trincardi, F. The late-Quaternary transgressive record in the Adriatic epicontinental sea: Basin widening and facies partitioning. In Isolated Shallow Marine Sand Bodies: Sequence Stratigraphic Analysis and Sedimentologic Interpretation; Bergman, K., Snedden, J., Eds.; SEPM: Broken Arrow OK, USA, 1999; Volume 64, pp. 127–146. [Google Scholar]
- Caldara, M.; Capolongo, D.; Del Gaudio, V.; De Santis, V.; Pennetta, L.; Maiorano, P.; Simone, O. Note Illustrative Della Carta Geologica d’Italia alla Scala 1:50.000 Foglio, 409 “Zapponeta”; Istituto Superiore per la Protezione e la ricerca Ambientale: Roma, Italy, in press.
- Mitchum, R.M.; Vail, P.R.; Sangree, J.B. Seismic stratigraphy and global changes in sea-level, part 6. Stratigraphic interpretation of seismic reflection patterns in depositional sequences. In Seismic Stratigraphy-Applications to Hydrocarbon Exploration; Payton, C.E., Ed.; AAPG Memoires: Boulder, Tulsa, OK, USA, 1977; Volume 26, pp. 117–133. ISBN 117-133. [Google Scholar]
- Esker, D.; Eberli, G.P.; McNeill, D.F. The Structural and Sedimentological Controls on the Reoccupation of Quaternary Incised Valleys, Belize Southern Lagoon. AAPG Bull. 1998, 82, 2075–2109. [Google Scholar]
- Maio, C.V.; Gontz, A.M.; Sullivan, R.M.; Madsen, S.M.; Weidman, C.R.; Donnelly, J.P. Subsurface evidence of storm-driven breaching along a transgressing barrier system, Cape Cod, U.S.A. J. Coast. Res. 2015, 32, 264–279. [Google Scholar] [CrossRef][Green Version]
- Nordfjord, S.; Goff, J.A.; Austin, J.A.; Gulick, S.P.S. Seismic facies of incised-valley fills, New Jersey continental shelf: Implications for erosion and preservation processes acting during latest Pleistocene-Holocene transgression. J. Sediment. Res. 2006, 76, 1284–1303. [Google Scholar] [CrossRef]
- Labaune, C.; Tesson, M.; Gensous, B.; Parize, O.; Imbert, P.; Delhaye-Prat, V. Detailed architecture of a compound incised valley system and correlation with forced regressive wedges: Example of Late Quaternary Têt and Agly rivers, western Gulf of Lions, Mediterranean Sea, France. Sediment. Geol. 2010, 223, 360–379. [Google Scholar] [CrossRef]
- Raynal, O.; Bouchette, F.; Certain, R.; Sabatier, P.; Lofi, J.; Séranne, M.; Dezileau, L.; Briqueu, L.; Ferrer, P.; Courp, T. Holocene evolution of a Languedocian lagoonal environment controlled by inherited coastal morphology (northern Gulf of Lions, France). Bull. Soc. Geol. France 2010, 181, 211–224. [Google Scholar] [CrossRef]
- Pellegrini, C.; Maselli, V.; Cattaneo, A.; Piva, A.; Ceregato, A.; Trincardi, F. Anatomy of a compound delta from the post-glacial transgressive record in the Adriatic Sea. Mar. Geol. 2015, 362, 43–59. [Google Scholar] [CrossRef]
- Catuneanu, O.; Galloway, W.E.; Kendall, C.G.S.t.C.; Miall, A.D.; Posamentier, H.W.; Strasser, A.; Tucker, M.E. Sequence stratigraphy: Methodology and Nomenclature. Newsl. Stratigr. 2011, 44/3, 173–245. [Google Scholar] [CrossRef]
- Lambeck, K.; Antonioli, F.; Anzidei, M.; Ferranti, L.; Leoni, G.; Silenzi, S. Sea level change along the Italian coasts during Holocene and prediction for the future. Quat. Int. 2011, 232, 250–257. [Google Scholar] [CrossRef]
- Reimer, P.J.; Bard, E.; Bayliss, A.; Warren Beck, J.; Blackwell, P.G.; Bronk Ramsey, C.; Buck, C.E.; Cheng, H.; Lawrence Edwards, R.; Friedrich, M.; et al. IntCal13 and Marine13 radiocarbon age calibration curves 0-50000 years cal BP. Radiocarbon 2013, 55, 1869–1887. [Google Scholar] [CrossRef]
- Di Rita, F.; Simone, O.; Caldara, M.; Gehrels, W.R.; Magri, D. Holocene environmental changes in the coastal Tavoliere Plain (Apulia, southern Italy): A multiproxy approach. Palaeogeogr. Palaeoclimatol. Palaeoecol. 2011, 310, 139–151. [Google Scholar] [CrossRef]
- Sulpizio, R.; (University of Bari, Bari, Italy). Personal communication, 2019.
- Andronico, D.; Calderoni, G.; Cioni, R.; Sbrana, A.; Sulpizio, R.; Santacroce, R. Geological map of Somma-Vesuvius volcano. Period Miner. 1995, 64, 77–78. [Google Scholar]
- Santacroce, R.; Cioni, R.; Marianelli, P.; Sbrana, A.; Sulpizio, R.; Zanchetta, G.; Donahue, D.J.; Joron, J.L. Age and whole rock—glass compositions of proximal pyroclastics from the major explosive eruptions of Somma-Vesuvius: A review as a tool for distal tephrostratigraphy. J. Volcanol. Geotherm. Res. 2008, 177, 1–18. [Google Scholar] [CrossRef]
- Marzolla, B. Provincia di Capitanata; Real Officio Topografico della Guerra: Napoli, Italy, 1851. [Google Scholar]
- Caldara, M.; Pennetta, L.; Simone, O. Holocene Evolution of the Salpi Lagoon (Puglia, Italy). J. Coast. Res. 2002, 36, 124–133. [Google Scholar] [CrossRef]
- Pérès, J.M. The Mediterranean benthos. Oceanogr. Mar. Biol. 1967, 5, 449–533. [Google Scholar]
- Picard, J. Recherches qualitatives sur les Biocoenoses marines des substrats meubles dragables de la région marseillaise. Recueil Trav. Stat. Mar. Endoume 1965, 36, 1–102. [Google Scholar]
- Gravina, M.F.; Ardizzone, G.D.; Scaletta, F.; Chimenz, C. Descriptive analysis and classification of benthic communities in some Mediterranean coastal lagoons (central Italy). Mar. Ecol. 1989, 10, 141–216. [Google Scholar] [CrossRef]
- Lambeck, K.; Antonioli, F.; Purcell, A.; Silenzi, S. Sea-level change along the Italian coast for the past 10,000 yr. Quat. Sci. Rev. 2004, 23, 1567–1598. [Google Scholar] [CrossRef]
- Primavera, M.; Simone, O.; Fiorentino, G.; Caldara, M. The Palaeo-environmental study of the Alimini Piccolo Lake enables a reconstruction of Holocene sea-level changes in south-east Italy. Holocene 2011, 21, 553–563. [Google Scholar] [CrossRef]
- Vacchi, M.; Marriner, N.; Morhange, C.; Spada, G.; Fontana, A.; Rovere, A. Multiproxy assessment of Holocene relative sea-level changes in the western Mediterranean: Sea-level variability and improvements in the definition of the isostatic signal. Earth-Sci. Rev. 2016, 155, 172–197. [Google Scholar] [CrossRef]
- Billy, J.; Robin, N.; Hein, C.J.; FitzGerald, D.M.; Certain, R. Impact of relative sea-level changes since the last deglaciation on the formation of a composite paraglacial barrier. Mar. Geol. 2018, 400, 76–93. [Google Scholar] [CrossRef]
- Tillmann, T.; Wunderlich, J. Barrier rollover and spit accretion due to the combined action of storm surge induced washover events and progradation: Insights from ground-penetrating radar surveys and sedimentological data. J. Coast. Res. 2013, 65, 600–605. [Google Scholar] [CrossRef]
- Patruno, S.; Hampson, G.J.; Jackson, C.A.-L. Quantitative characterisation of deltaic and subaqueous clinoforms. Earth-Sci. Rev. 2015, 142, 79–119. [Google Scholar] [CrossRef]
- Montes, A.; Bujalesky, G.G.; Paredes, J.M. Geomorphology and internal architecture of Holocene sandy-gravel beach ridge plain and barrier spits at Río Chico area, Tierra del Fuego, Argentina. J. S. Am. Earth Sci. 2018, 84, 172–183. [Google Scholar] [CrossRef]
- Timmons, E.A.; Rodriguez, A.B.; Mattheus, C.R.; DeWitt, R. Transition of a regressive to a transgressive barrier island due to backbarrier erosion, increased storminess, and low sediment supply: Bogue Banks, North Carolina, USA. Mar. Geol. 2010, 278, 100–114. [Google Scholar] [CrossRef]
- Ariztegui, D.; Asioli, A.; Lowe, J.J.; Trincardi, F.; Vigliotti, L.; Tamburini, F.; Chondrogianni, C.; Accorsi, C.A.; Bandini Mazzanti, M.; Mercuri, A.M.; et al. Palaeoclimate and the formation of sapropel S1: Inferences from Late Quaternary lacustrine and marine sequences in the central Mediterranean region. Palaeogeogr. Palaeoclimatol. Palaeoecol. 2000, 158, 215–240. [Google Scholar] [CrossRef]
- Tesi, T.; Asioli, A.; Minisini, D.; Maselli, V.; Dalla Valle, G.; Gamberi, F.; Langone, L.; Cattaneo, A.; Montagna, P.; Trincardi, F. Large-scale response of the Eastern Mediterranean thermohaline circulation to African monsoon intensification during sapropel S1 formation. Quat. Sci. Rev. 2017, 159, 139–154. [Google Scholar] [CrossRef]
- Cronin, T.M.; Vogt, P.R.; Willard, D.A.; Thunell, R.C.; Halka, J.; Berke, M.; Pohlman, J. Rapid sea level rise and ice sheet response to 8200-year climate event. Geophys. Res. Lett. 2007, 34. [Google Scholar] [CrossRef]
- Kendall, R.A.; Mitrovica, J.X.; Milne, G.A.; Törnqvist, T.E.; Li, Y. The sea-level fingerprint of the 8.2 ka climate event. Geology 2008, 36, 423–426. [Google Scholar] [CrossRef]
- Hijma, M.P.; Coen, K.M. Timing and magnitude of the sea-level jump preluding the 8200 yr event. Geology 2010, 38, 275–278. [Google Scholar] [CrossRef]
- Billy, J.; Robin, N.; Hein, C.J.; FitzGerald, D.M.; Certain, R. Dominance of inherited geologic framework on the development of coastal barrier system. J. Coast. Res. 2018, 85, 406–410. [Google Scholar] [CrossRef]
- De Rijk, S.; Hayes, A.; Rohling, E.J. Eastern Mediterranean sapropel S1 interruption: An expression of the onset of history of climatic deterioration around 7 ka B.P. Mar. Geol. 1999, 153, 337–343. [Google Scholar] [CrossRef]
- De Santis, V.; Caldara, M. The 5.5-4.5 kyr climatic transition as recorded by the sedimentation pattern of coastal deposits of Apulia region, southern Italy. Holocene 2015, 25, 1313–1329. [Google Scholar] [CrossRef]
- Liu, J.P.; Milliman, J.D. Reconsidering melt-water pulses 1A and 1B: Global impacts of rapid sea-level rise. J. Ocean U China 2004, 3, 183–190. [Google Scholar] [CrossRef]
- Sanders, J.E.; Kumar, N. Evidence of shoreface retreat and in-place “drowning” during Holocene submergence of barriers, shelf off Fire Island, New York. Geol. Soc. Am. Bull. 1975, 86, 65–76. [Google Scholar] [CrossRef]
- Rampino, M.R.; Sanders, J.E. Holocene transgression in south-central Long Island, New York. J. Sediment. Petrol. 1980, 50, 1063–1080. [Google Scholar]
- Grant, K.M.; Grimm, R.; Mikolajewicz, U.; Marino, G.; Ziegle, M.; Rohling, E.J. The timing of Mediterranean sapropel deposition relative to insolation, sea-level and African monsoon changes. Quat. Sci. Rev. 2016, 140, 125–141. [Google Scholar] [CrossRef]
- Rossignol-Strick, M.; Nesteroff, W.; Olive, P.; Vergnaud-Grazzini, C. After the deluge: Mediterranean stagnation and sapropel formation. Nature 1982, 295, 105–110. [Google Scholar] [CrossRef]
- Rohling, E.J. Review and new aspects concerning the formation of eastern Mediterranean sapropels. Mar. Geol. 1994, 122, 1–28. [Google Scholar] [CrossRef]
- Piccarreta, M.; Caldara, M.; Capolongo, D.; Boenzi, F. Holocene geomorphic activity related to climatic change and human impact in Basilicata, southern Italy. Geomorphology 2011, 128, 137–147. [Google Scholar] [CrossRef]
- Cattaneo, A.; Steel, R.J. Transgressive deposits: A review of their variability. Earth-Sci. Rev. 2003, 62, 187–228. [Google Scholar] [CrossRef]
- Billy, J.; Robin, N.; Hein, C.J.; Certain, R.; FitzGerald, D.M. Insight into the late Holocene sea-level changes in the NW Atlantic from a paraglacial beach-ridge plain south of Newfoundland. Geomorphology 2015, 248, 134–146. [Google Scholar] [CrossRef]
- Bard, E.; Hamelin, B.; Fairbanks, R.G. U-Th ages obtained by mass spectrometry in corals from Barbados: Sea level during the past 130,000 years. Nature 1990, 346, 456–458. [Google Scholar] [CrossRef]
- Bard, E.; Hamelin, B.; Arnold, M.; Montaggioni, L.; Cabioch, G.; Faure, G.; Rougerie, F. Deglacial sea-level record from Tahiti corals and the timing of global Meltwater discharge. Nature 1996, 382, 241–244. [Google Scholar] [CrossRef]
© 2020 by the authors. Licensee MDPI, Basel, Switzerland. This article is an open access article distributed under the terms and conditions of the Creative Commons Attribution (CC BY) license (http://creativecommons.org/licenses/by/4.0/).