Article

Spatial Differentiation of the Maximum River Runoff Synchronicity in the Warta River Catchment, Poland

Institute of Physical Geography and Environmental Planning, Adam Mickiewicz University, Krygowskiego 10, 61-680 Poznań, Poland
*
Author to whom correspondence should be addressed.
Water 2020, 12(6), 1782; https://doi.org/10.3390/w12061782
Submission received: 8 May 2020 / Revised: 13 June 2020 / Accepted: 19 June 2020 / Published: 23 June 2020
(This article belongs to the Section Hydrology)

Abstract

:
Based on daily flows recorded in the period 1971–2010, the synchronous occurrence of the annual (AMAXq), winter (WMAXq), and summer (SMAXq) maximum specific runoffs in 39 sub-catchments of the Warta River catchment (WRC) in Poland was analyzed. First, trends in the flows were detected using the non-parametric Mann–Kendall (M-K) test. Then, the degree of the synchronous and asynchronous occurrences of the maximum specific runoffs (MAXq) in respective sub-catchments in relation to the Gorzów Wielkopolski gauge closing the WRC was calculated. Finally, the reasons for the detected spatial and temporal differences were discussed. The study revealed a noticeable variability of the analyzed parameters. The highest synchronicity of AMAXq and WMAXq in relation to the closing Gorzów Wielkopolski gauge was revealed in the man-made Kościański and Mosiński canals and in the sub-catchments of the Noteć, Wełna, and lower Prosna rivers. While compared to AMAXq and WMAXq, the summer maxima showed relatively lower degrees of synchronicity, an increase in the synchronous occurrence of SMAXq in the southern part of WRC, and a decrease in its central part were identified. It was concluded that the stronger synchronicity of WMAXq resulted from the nival regime of the investigated rivers. Consequently, the annual maxima were most often associated with the winter half-year. The detected differences of synchronicity of the annual and seasonal runoffs are conditioned by climate, more specifically by the course of winter and resulting from it snow cover thickness, and also the amount and intensity of rainfall in summer.

1. Introduction

Hydrological analyses often search for determining relations and dependencies between hydrological, climatic, and physiographic parameters of a catchment and measuring the strength of the identified relationships. In recent years, such studies have gained increasing attention, due to the advancing climate change, and consequently, the more frequently observed variations of the hydrological cycle. For example, Budyko [1,2] proposed a model allowing detecting relations between climate, evapotranspiration, and runoff. The model has been proved useful for predicting catchment energy and water balances [3]. It was applied among others to assess the climate change-induced modification of potential evaporation and runoff sensitivity in the Yellow River Basin in China [4], which is characterized by limited water resources. However, some researchers [5,6,7] pointed to its limitations, such as the mutual independence of precipitation, evaporation, and evapotranspiration. For these reasons, [7] proposed a hydrological model that is able to conduct a spatially explicit assessment of changing hydrological regime in terms of the blue and green water dynamics in temperate mid-latitude river basins.
Recently, in the multidimensional analyses of hydro-meteorological data, the copula function has been widely applied. Copulas were introduced by [8], and originally they were used in economic sciences, primarily in the analysis of market and credit risks [9,10]. The main advantage of the copulas is their wide applicability, since the copula function relaxes the normality assumption and allows determining correlations of data regardless of their statistical distributions. Investigating the synchronous occurrence of hydrological phenomena is one of these analyses in which the copula function can be used. Its successful applications include analyses of relationships between the flow volume and the amount of sediment carried by river water [11,12,13], and between the river flow and the outlets of its two tributaries [14], as well as studies of variability of flow synchronicity in different periods [15]. That method was used to analyze dependences of the maximum annual [16] and annual average [17] water levels of coastal lakes in Poland in relation to water levels of the Baltic Sea. For example, relationships between precipitation and droughts in Beijing [18], and the probabilistic behaviors of the Standardized Precipitation Index (SPI)based droughts in Guangdong Province in South China [19] were also investigated with the help of the copulas.
In this research, based on data collected at a number of water gauges, the copula function was applied to determine the spatial and temporal differentiation of the synchronous occurrence of the maximum runoffs in a relatively large-scale catchment, more specifically in the Warta River catchment (WRC) in Poland. The analyses were carried out at three different time intervals, namely in the whole hydrological year (November–October), and in the winter (November–April) and summer (May–October) half-years, respectively. Such a temporal approach refers to the division of the hydrological year in Poland, and it is justified by clearly different water supply conditions in the Central European river catchments in winter and summer. This allowed detecting seasonal differences in the course of the analyzed maximum flows. In this study, the synchronous occurrence (synchronicity) means an event in which the occurrence of the maximum flows at two gauges in the analyzed period (hydrological year, winter half-year, and summer half-year) falls within the same probability range (for more details, see Section 2.2.3).
The Warta River is a mid-size European river, a tributary of the Odra River, located in the central and western part of Poland and draining the North European Plain to the Baltic Sea [20]. For centuries, the Warta River has played the key role in the socio-economic development of the Greater Poland (Wielkopolska) region, including its administrative capital: the city of Poznań [21,22]. While it is one of the most productive agricultural regions of Poland, most of the WRC is situated in the driest part of the country. According to [23], the climatic water balance of the vegetation period (April–September) for 1970–2004 ranged between −200 and −250 mm, showing the lowest data in the area lying to the east of Poznań. In the second part of the 20th century, the mean annual precipitation in Poznań was only 543 mm [24]. As a result, the observed water deficits in WRC make this area of special interest to scholars. Numerous researchers, as for example [25,26,27,28], investigated the risk and uncertainty aspects of low flows of the Warta River in relation to the projected climate changes. Some studies have been carried out on both seasonal [29,30,31] and long-term [32,33,34,35] variability of flows and elements of the water balance in WRC. Other analyses aimed to identify changes in the hydrological regime of the Warta mainstream and rivers in its catchment [36,37,38,39].
While a wide spectrum of studies on the hydrology of WRC has been carried out, the encounter probability of the synchronous runoff maxima in that area has not been addressed yet. In order to overcome that research gap, this research aimed at recognizing and better understanding the synchronous occurrence of the runoff maxima in respective sub-catchments of WRC.
The results of this study would give an answer to the following elementary question: To what extent do the elementary catchments behave similarly (in terms of the maximum flows) to the catchment as a whole, closed by the Gorzów Wielkopolski gauge? This is of particular importance in rational water resources management, including flood protection, reservoir water storage, and water supply in WRC, which has one of the poorest water resources in Europe.

2. Materials and Methods

2.1. Materials and Study Area

Daily flows in WRC are measured at 72 gauges located on 39 rivers. In this study, data recorded at 58 water gauges (Figure 1) in the period 1971–2010 were used. They were derived from resources of the Institute of Meteorology and Water Management—National Research Institute in Warsaw, Poland.
The Warta River is the third longest river in Poland: its total length is 808 km. It is the largest right-bank tributary of the Oder (Odra) River, and most of its catchment area (54,519 km2) lies below 200 m a.s.l. [33]. However, it has relatively diversified terrain and extends from highlands in the south through lowlands of Central Poland to the lake district in the north. The study area covers WRC from its source in the Kraków-Częstochowa Upland to the water gauge in Gorzów Wielkopolski (No. 13 in Figure 1), which controls 52,186 km2 of the WRC.
The catchment area is divided by two proglacial stream valleys: the Toruń-Eberswalde Valley includes the lower and middle Noteć River and the lower Warta River, and the Warsaw-Berlin Valley includes the middle part of the Warta River. In this context, as far as the basin is concerned, it is important to note that the hydrographic net is well developed. The rivers with big longitudinal slopes are in the northern and southern parts of the catchment area [33]. In the whole WRC, sandy soils cover 45% of the land, loamy soils cover 41% of the land, and organic and alluvial soils cover 14% of the land. Arable land constitutes 48%, grassland constitutes 10.3%, forests constitute 30.2%, and “other” occupies 11.5% of the area, being a region of intensive agriculture [40].
According to the Köppen–Geiger classification of climates, WRC lies within the transition zone between a humid continental (Cfb) and oceanic climate (Dfb) with relatively cold winters and warm summers [41]. Woś [24] described its climate as warm, with both marine and continental features, shaped primarily by the polar air masses formed over the Northern Atlantic Ocean. The average annual air temperature in the study area is about 7.5–8.5 °C, and the average annual precipitation varies from 520 mm in the north-eastern part of the catchment (the Kujawy region) to 675 mm in the southern uplands [24].
The specific runoff in WRC shows considerable spatial differences, with the highest values in the southern (uplands) and northern (lake district), and the lowest in the central part. In the upper Noteć River, an average specific runoff is below 2 dm3·s−1·km2 (less than 70 mm), which makes that area has the lowest specific runoff in the whole of Europe, recorded only in the Caspian Lowland. According to [42] for the period 1921–1970, the specific mean runoff was 4 dm3·s−1·km2, which equaled 127 mm, and the runoff coefficient was 23.9%. The annual runoff in WRC is also spatially diversified—the highest values, exceeding 200 mm, and locally even 300 mm, are recorded in its northern and southern parts. Noticeably lower runoffs (below 150 mm, locally even below 80 mm) are in the central and western parts [43]. The average annual runoff for WRC at the Gorzów Wielkopolski gauge is only 127 mm (Table 1), which makes this region one of the poorest in Europe in terms of water resources. The highest annual groundwater runoff, similarly to the annual surface runoff, is in the upper part of WRC. In its central and western parts, it rarely exceeds 100 mm, with the local minima in the central part even lower than 40 mm. The average annual groundwater runoff in WRC at Gorzów Wielkopolski gauge is 97 mm (Table 1). The highest percent share of the groundwater runoff is recorded in the Warta sub-catchments located in the northern part of the study area (Table 1). According to some researchers [44,45,46,47,48,49], these sub-catchments have different drainage structure with a clearly dominant share of groundwater runoff. There is a noticeable difference between the northern part of WRC and its other parts in terms of variability (stability) of the maximum annual flows. Relatively high stability is recorded in the middle reaches of the Noteć River and in sub-catchments of its right tributaries, such as the Gwda, Drawa, and Piława rivers [43]. By contrast, low stability is concluded in the upper reaches of the Warta River and in partial catchments of the Noteć, Sama, Powa, and Mogilnica rivers [43].
According to division by [50], rivers of the study area represent three sub-types of nival hydrological regime, namely weakly, moderately, and strongly developed [43]. Rotnicka [51] applied Ward’s hierarchical grouping to distinguish 12 types of hydrological periods for rivers of the Odra River basin and the West Przymorze (Pomerania) catchments in Poland. It was found that most rivers in the central part of WRC represented the contrasting, five-period regime, with the deep low-water period in summer and autumn, and the high-water period in spring. In the rest of the WRC, the rivers represented mainly the four-period regime with the average low-water period in summer–autumn, and the high high-water period in early spring. Much less contrasting types of regimes are represented by rivers in the northern and southern parts of WRC, including the three-period lowland type of regime with the average low-water period in summer–autumn and the low high-water period in late winter or early spring (the Drawa River) or even the one-period type of regime (the upper Gwda River).
The geographical position of the study area and location of the analyzed water gauges are shown in Figure 1.
Basic data on the Warta River and its tributaries analyzed in terms of the synchronous and asynchronous occurrences of the runoff maxima are given in Table 1.

2.2. Methods

2.2.1. Data Analysis

At the preliminary stage of the research the continuity of the source data recorded at the respective water gauges in the multi-year period 1971–2010 was analyzed. As a result, among the original 72 gauges, 58 were selected for further studies. Next, values of the maximum annual, winter, and summer flows were converted into the annual (AMAXq), winter (WMAXq) and summer (SMAXq) specific runoffs (dm3·s−1·km−2), respectively, and then verified with the use of the non-parametric Mann–Kendal test.

2.2.2. Mann–Kendal (M–K) Test

In the second stage of the study, tendencies of fluctuations of calculated data sets at the respective gauges were analyzed. This involved the application of the rank-based non-parametric Mann–Kendall (M-K) test, which detects trend in temporal sequences [52]. The M-K test is applicable in cases when the data values xi of a time series can be assumed to obey the model:
xi = f(t) + εi
where f(t) is a continuous monotonic increasing or decreasing function of time, and the residuals εi can be assumed to be from the same distribution with zero mean. Therefore, it is assumed that the variance of the distribution is constant in time.
The M-K test statistic S is calculated using the formula:
S = k = 1 n 1 j = k + 1 n sgn ( x j x k )
where xj and xk are the time-series observations in chronological order in years j and k, j > k, respectively, n is the length of time series, and:
sgn ( x j x k ) = { 1 if   x j x k > 0 0 if   x j x k = 0 1 if   x j x k < 0 .
An upward (increasing) or downward (decreasing) trend is determined by a positive or negative value of Z. First, the variance of S is computed by the following equation, which takes into account that ties may be present:
VAR ( S ) = 1 18 [ n ( n 1 ) ( 2 n + 5 ) p = 1 q t p ( t p 1 ) ( 2 t p + 5 ) ]
where q is the number of tied groups, and tp is the number of data values in the pth group.
The values of S and VAR(S) are used to compute the test statistic Z as follows:
Z = { S 1 VAR ( S ) if   S > 0 0 if   S = 0 S + 1 VAR ( S ) if   S < 0 .
Then, the null hypothesis of no trend, H0, is tested in order to accept or reject it. The xi observations are randomly ordered chronologically, contrary to the alternative hypothesis H1, where there is an increasing or decreasing monotonic trend. In this study, the null hypothesis (H0) was that there had been no trend in AMAXq, WMAXq, and SMAXq over time. The alternate hypothesis (H1) was that there had been a trend (increasing or decreasing) over time.
The test statistic Z (normal approximation) is computed if all time series are longer than 10. The statistic Z has a normal distribution. The absolute value of Z can be compared to the standard normal cumulative distribution in order to identify if there is a monotone trend or not at the specified level of significance.
A huge number of studies used the M–K non-parametric test because of ease of usage and flexibility to missing values, but also because of appealing features such as skewed distribution, as presented in the papers of [53,54].

2.2.3. Application of the Copula Theory

The concept of copula was introduced by [8], which defined copula as a joint distribution function of standard uniform random variables. Modeling joint distribution using copula relaxes the restriction of traditional flood frequency analysis by selecting marginals from different families of probability distribution functions for flood characteristics [55]. Copulas are a powerful tool for modeling and sampling multivariate, nonlinearly interrelated data [18].
First, the best matching statistical distributions were selected for the analyzed data series. Karmakar and Simonovic [55] suggested that the following distributions reflected the maximum values in series of hydrological data: Weibull, Gamma, Gumbel, and log-normal. Parameters of the distributions were estimated by means of the maximum likelihood method. For the purpose of an assessment of the goodness of fit of a given distribution in the data series, the Akaike information criterion (AIC) was applied [56], which was calculated from the following formulas:
AIC = Nlog (MSE) + 2(no. of fitted parameters),
where MSE is the mean square error, and N is the sample size, or
AIC = −2log(maximum likelihood for model) + 2(no. of fitted parameters).
The best model is the one that has the minimum AIC value [56].
In the next step, the copula method was used to construct the joint distribution of MAXq at the given gauge and at gauge Gorzów Wielkopolski closing WRC. In general, a bivariate Archimedean copula can be defined as:
C θ ( u , v ) = ϕ 1 { ϕ ( u ) + ϕ ( v ) }
where u and v are marginal distributions, the θ, subscript of copula C, is the parameter hidden in the generating function ϕ , and ϕ is a continuous function called a generator that strictly decreases and is convex from I = [0,1] to [0, ϕ (0)] [57].
The Archimedean copula family is often applied in hydrological studies, for example in flood frequency analyses. It was found that copula-based flood frequency analysis performs better than a conventional flood frequency analysis, as joint distribution based on a copula fits the empirical joint distribution (i.e., from observed data using a plotting position formula) better than the established standard joint parametric distribution [58].
A large variety of copulas belongs to the Archimedean copula family and can be applied when the correlation between hydrological variables is positive or negative. The proofs of these properties have been reported by [59,60]. For this reason, one-parameter Archimedean copulas, including the Clayton family, the Gumbel–Hougaard family, and the Frank family, were used in this study. The Gumbel–Hougaard and Clayton copula families are appropriate only for positively correlated variables, while the Frank family is appropriate for both negatively and positively correlated variables (Table 2).
where Dk (x) is Debye function, for any positive integer k.
D k ( x ) = k k x 0 x t k e t 1 d t .
The best-fitted joint distribution was selected through comparison to the empirical joint distribution using the Akaike information criterion (AIC), as mentioned earlier.
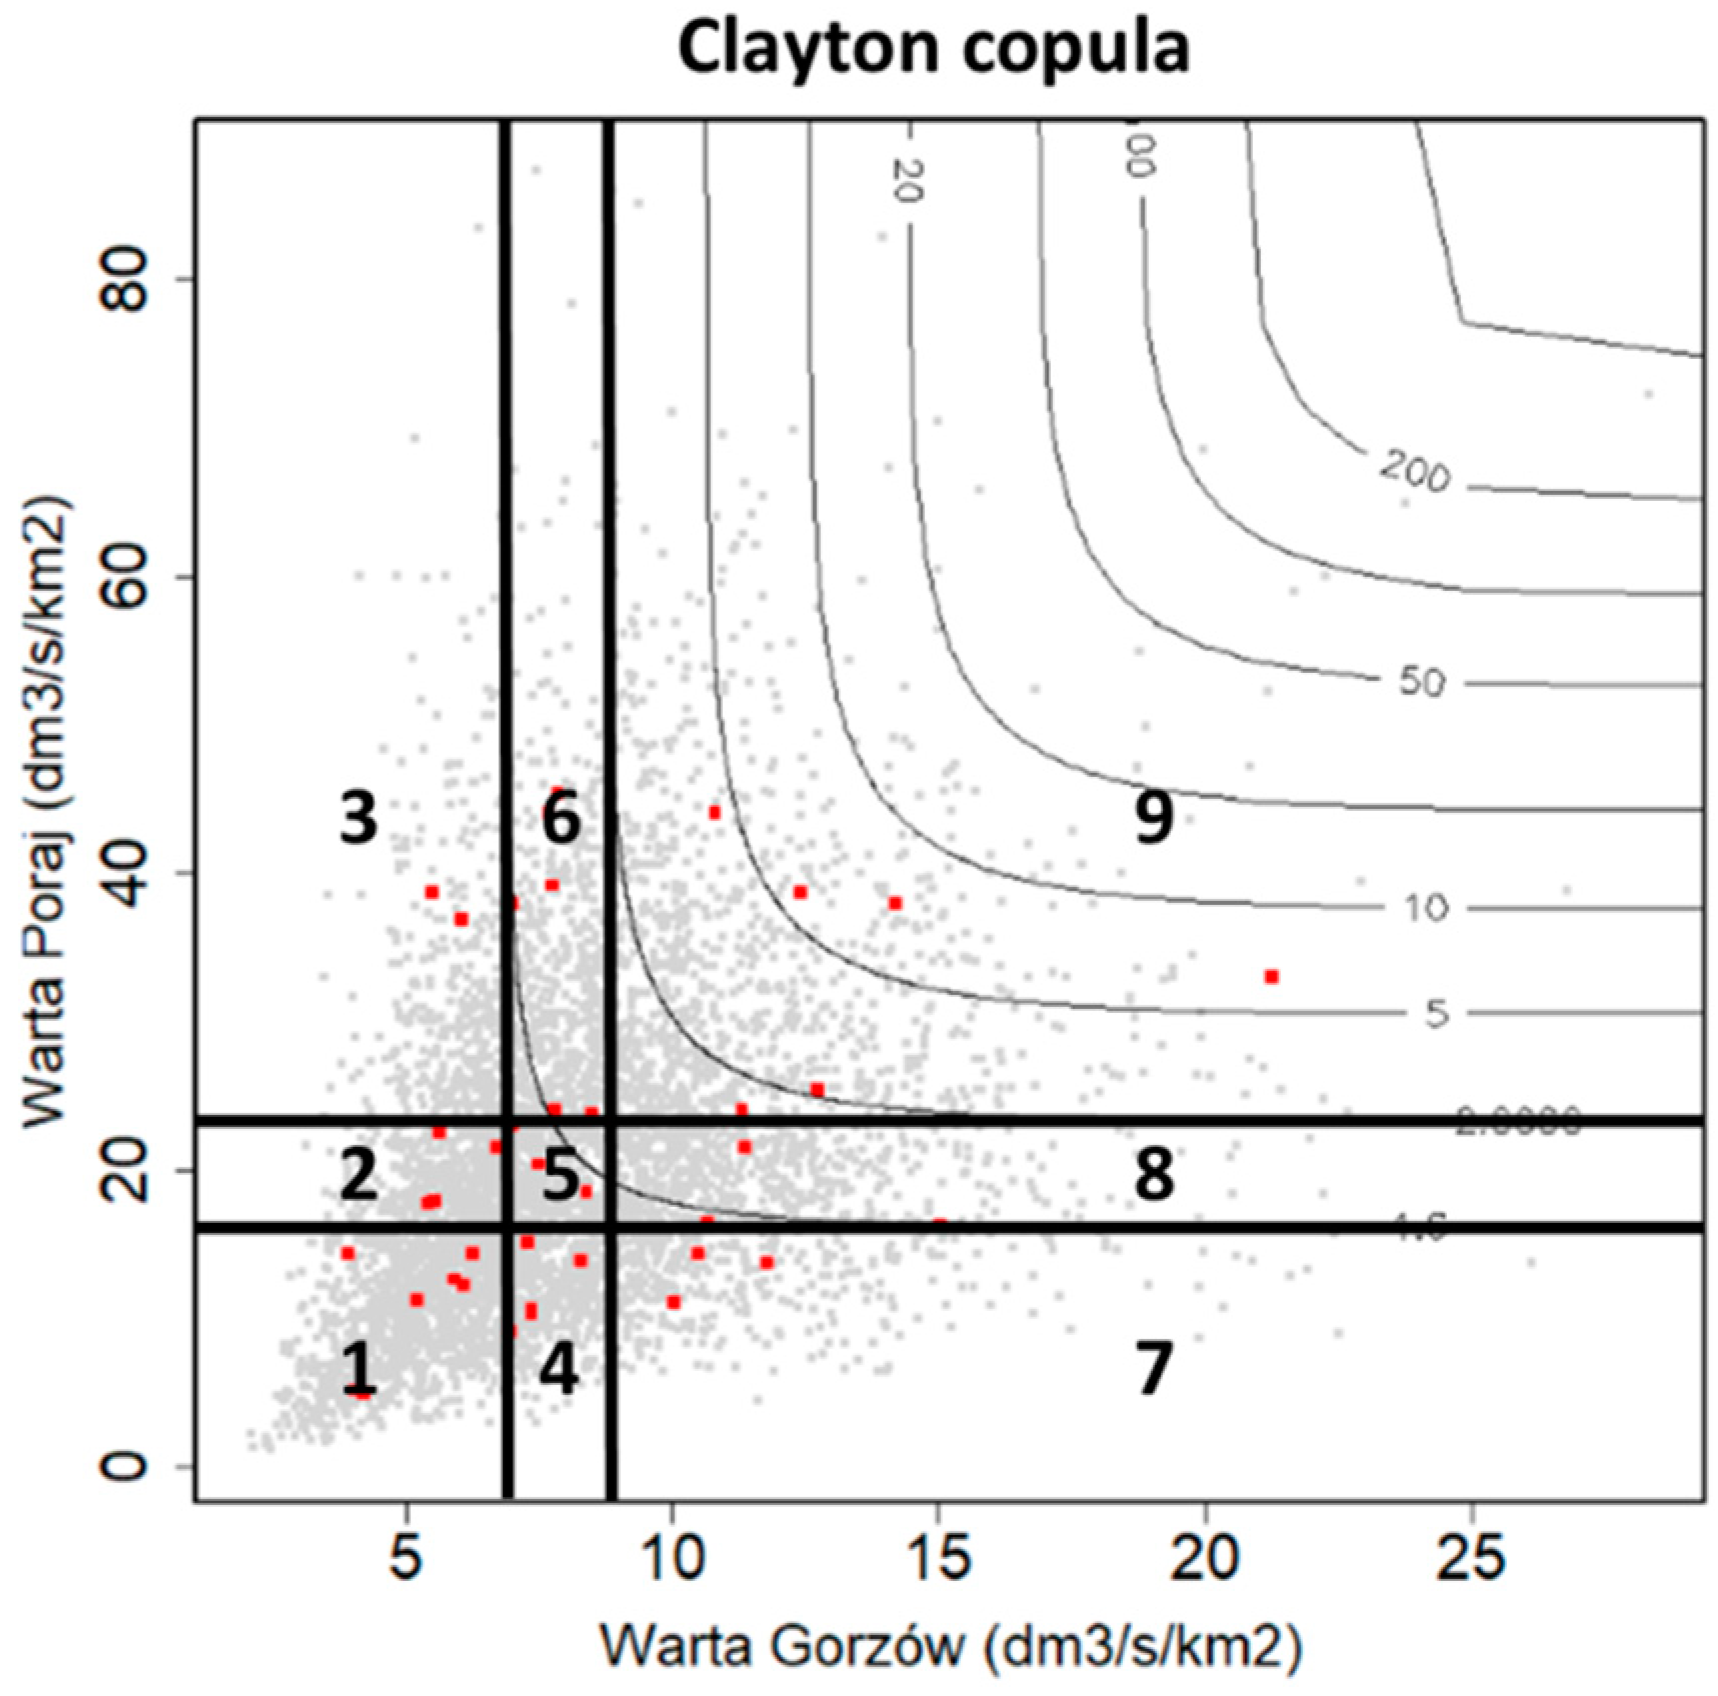
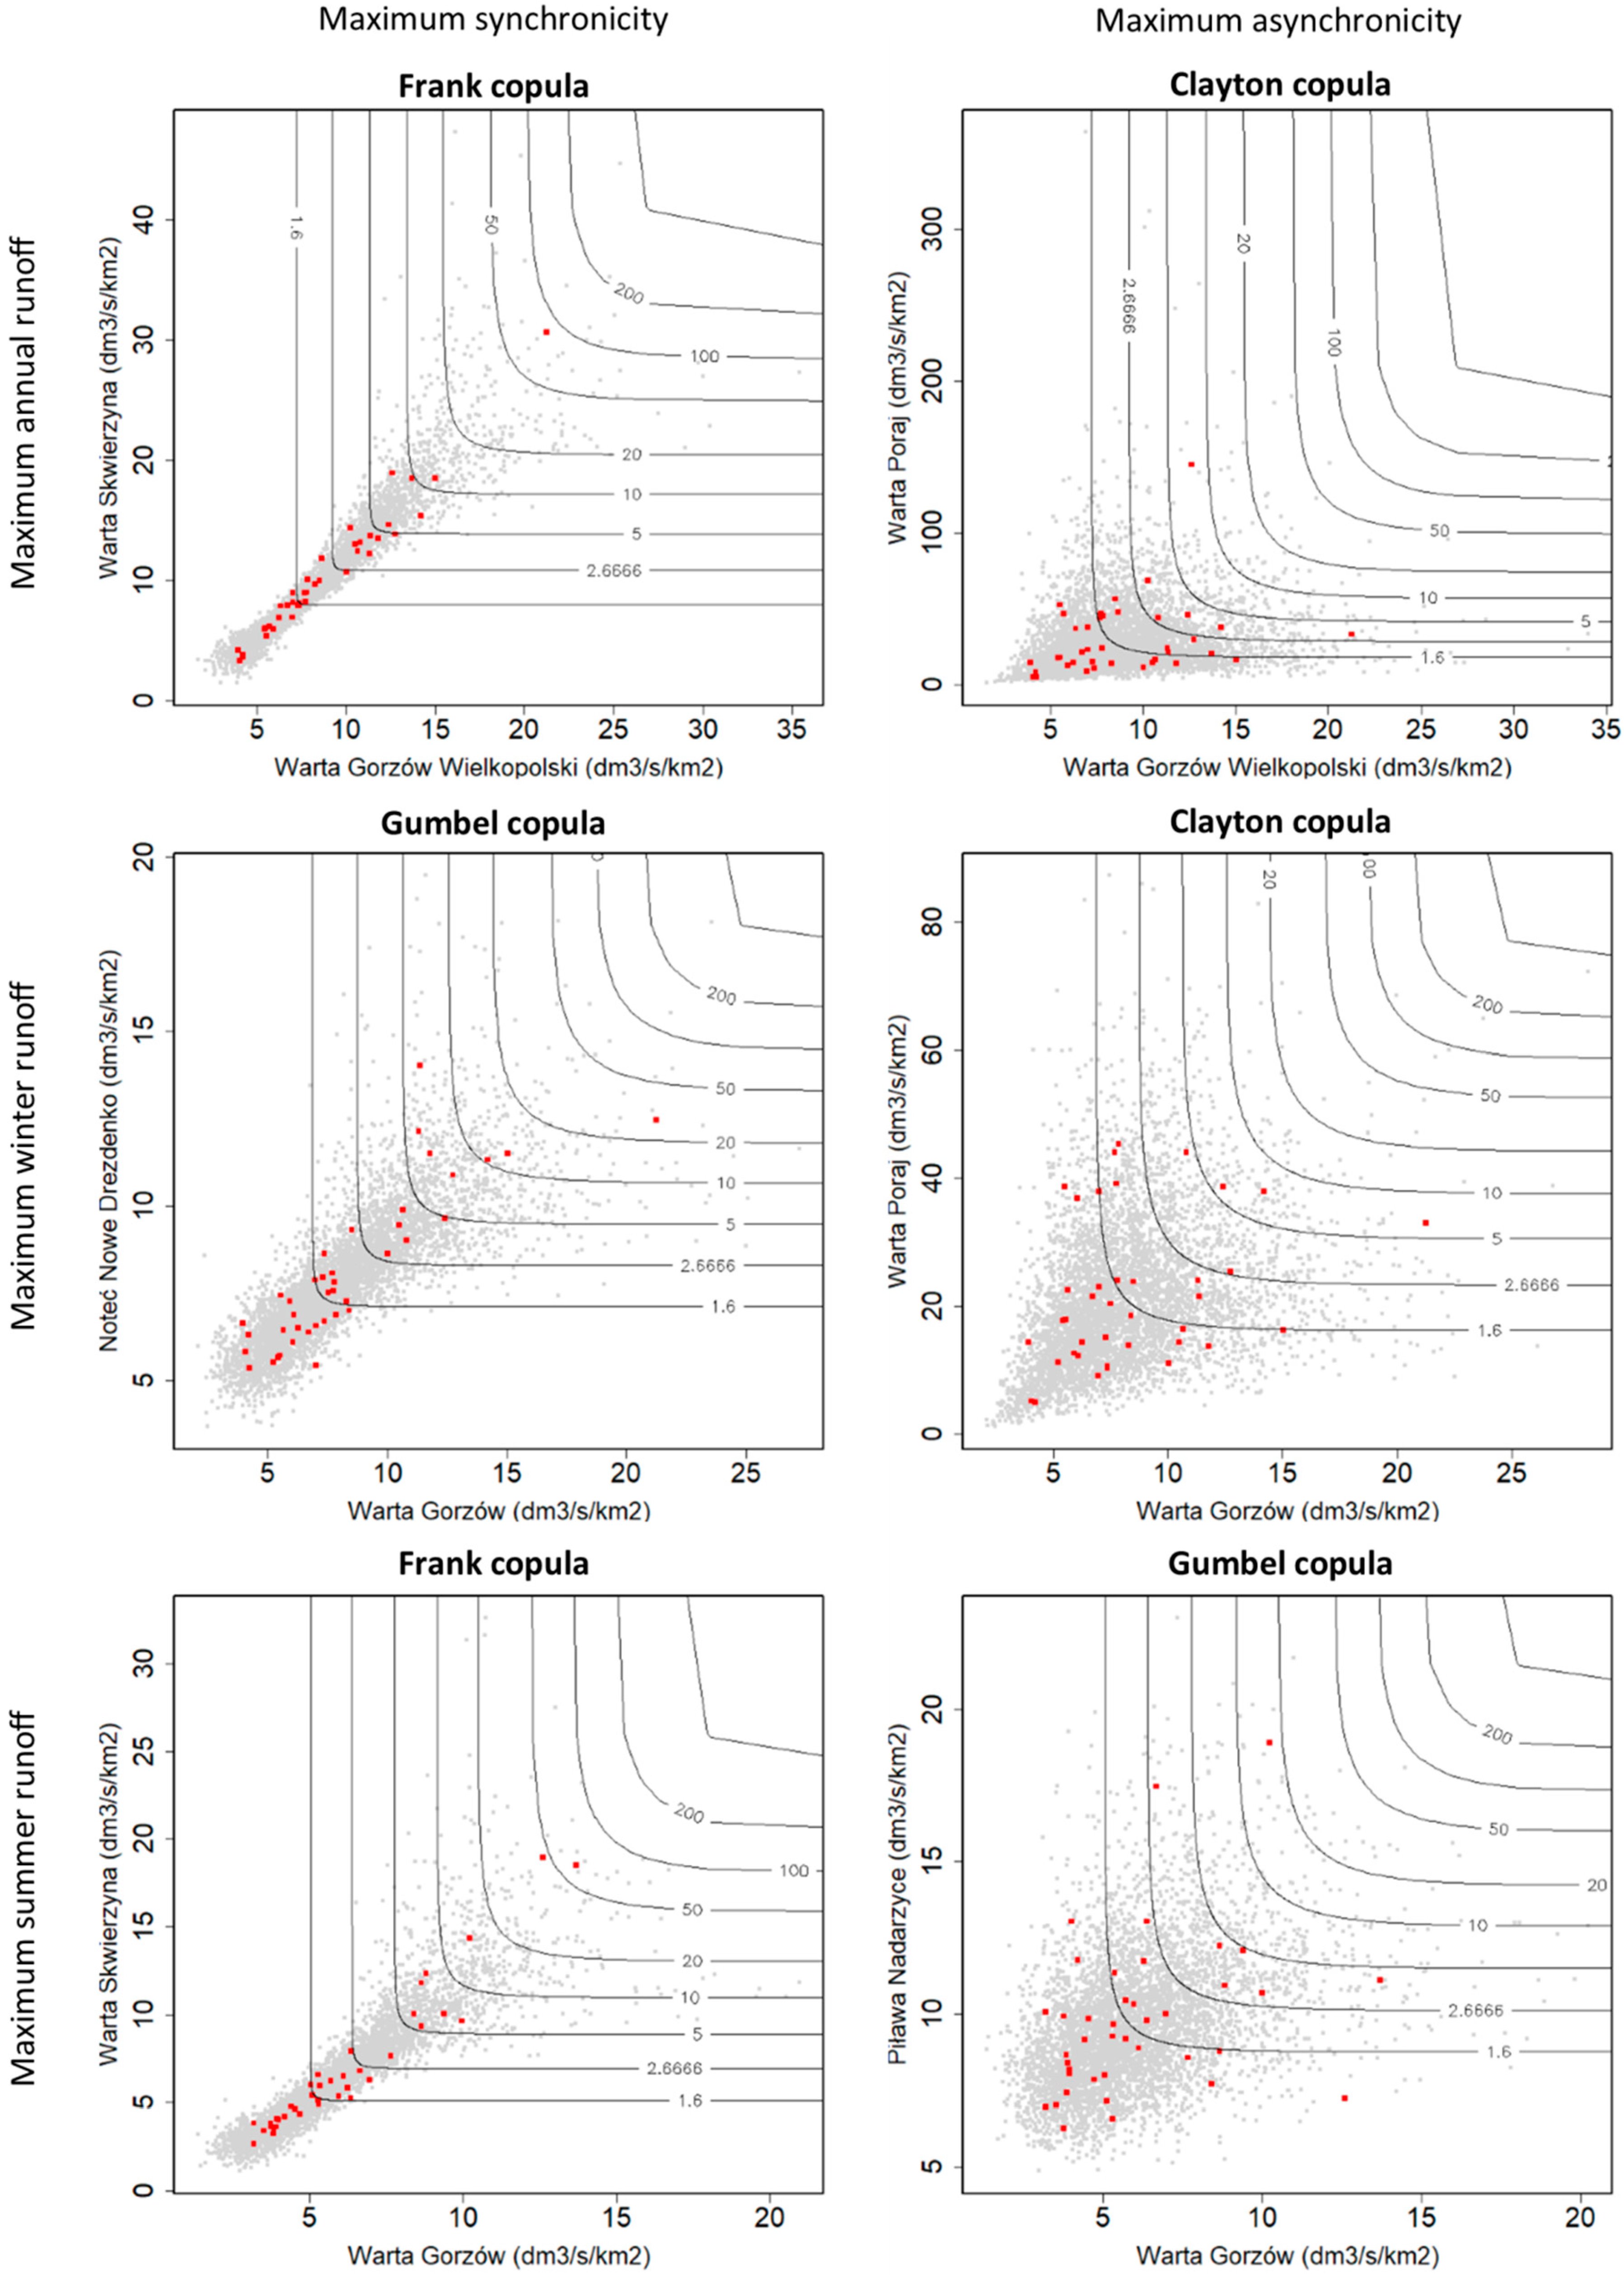
In the analysis, all water gauges were compared with the water gauge in Gorzów Wielkopolski closing WRC. For each compared pairs of series, based on previously calculated parameters of statistical distribution of marginal data series, 5000 hypothetical points were randomly generated. They were used for the selection of the best-fitted copula family for a given pair of data series and then for the development of an appropriate copula. Based on empirical pairs (red points in the Figure 2) of values for particular years and randomly generated hypothetical points (gray one in the Figure 2), graphs with probability curves (expressed in return periods) were developed (Figure 2).
The next stage involved calculation of the degree of synchronicity (synchronous occurrence) and asynchronicity (asynchronous occurrence) of AMAXq, WMAXq, and SMAXq, respectively. For each pair of gauges, probability curves at a level of 62.5% (once in 1.6 years), 37.5% (once in approximately 2.7 years), 20% (once in 5 years), 10% (once in 10 years), 2% (once in 50 years), 1% (once in 100 years), 0.5% (once in 200 years), and 0.2% (once in 500 years) were presented (Figure 2 and Figure 3).
Then, the obtained data were analyzed based on probabilities of 62.5% and 37.5% [11,14]. Nine sectors were designated, representing different relations between probable values of MAXq. Based on generated points with a distribution imitating the shared distribution of values from comparable water gauge stations and their participation in particular sectors (Figure 2), three sectors with the synchronous occurrences of MAXq were designated:
  • Sector 1: LHqG–LHqR (XG62.5%, YR62.5%);
  • Sector 5: MHqG–MHqR (G62.5% < XG37.5%, R62.5% < YR37.5%);
  • Sector 9: HHqG–HHqR (X > G37.5%, Y > R37.5%);
and six sectors with the asynchronous occurrences:
  • Sector 2: LHqG–MHqR (XG62.5%, R62.5% < YR37.5%);
  • Sector 3: LHqG–HHqR (XG62.5%, Y > R37.5%);
  • Sector 4: MHqG–LHqR (G62.5% < XG37.5%, YR62.5%);
  • Sector 6: MHqG–HHqR (G62.5% < XG37.5%, Y > R37.5%);
  • Sector 7: HHqG–LHqR (X > G37.5%, YR62.5%);
  • Sector 8: HHqG–MHqR (X > G37.5%, R62.5% < YR37.5%).
where X = the values of x coordinates of generated points, Y = the values of y coordinates of generated points, G62.5% = the value of MAXq with a probability of exceedance of 62.5% at the Gorzów Wielkopolski gauge, G37.5% = the value of MAXq with a probability of exceedance of 37.5% at the Gorzów Wielkopolski gauge, R62.5% = the value of MAXq with a probability of exceedance of 62.5% at the relative gauge, R37.5% = the value of MAXq with a probability of exceedance of 37.5% at the relative gauge, q = specific runoff, LH = “low high”, MH = “mean high”, and HH = “high high”.
The percent share of points in sectors 1, 5, and 9 allowed determination of the degree of synchronicity of MAXq between the two analyzed gauges in a given time unit. The asynchronous occurrence was additionally divided into two types of asynchronicity: moderate (the percent share of points in sectors 2, 4, 6, 8) and high (the percent share of points in sectors 3 and 7), respectively.
The synchronous and asynchronous occurrences of AMAXq, WMAXq, and SMAXq were determined through a calculation of threshold values of probability ranges:
  • Probable MAXq with a probability of occurrence of <62.5% was designated as LHq;
  • Probable MAXq with a probability of occurrence in a range >62.5% and <37.5% was designated as MHq;
  • Probable MAXq with a probability of occurrence >37.5% was designated as HHq.
For example, the occurrence of LHq in a given river (water gauge) is a synchronous event if LHq also occurs in the Warta River at the Gorzów Wielkopolski gauge in a given time unit, and it is asynchronous if MHq or HHq occurs.
The sum of respective synchronous and asynchronous events is always 100%.
For example, if the synchronous occurrence of AMAXq in a given sub-catchment compared to AMAXq recorded at gauge Gorzów Wielkopolski is 75%, this means that in 3 out of 4 years, the probable AMAXq at a given gauge is within the same probability range as the probable AMAXq for WRC closed by gauge Gorzów Wielkopolski.
In turn, the asynchronous situation may be exemplified by the occurrence of the high MAXq in the Warta River at gauge Gorzów Wielkopolski (e.g., a “100-year water”, p = 1%) and the occurrence of a low MAXq in one of the partial catchments (e.g., at the level of p = 90%).
In the description of the results, the term “synchronicity”/“asynchronicity” means the synchronous/asynchronous occurrence of MAXq relative to the Gorzów Wielkopolski gauge closing the whole WRC.
The mathematical and statistical processing of analysis results employed statistical procedures included in MS Excel and RStudio software. QGIS and MS Publisher software was used to visualize the obtained results.

3. Results

3.1. Mann–Kendall (M–K) Test

Ozga-Zielińska et al. [61] recommended the use of only statistically homogenous and trendless data sets for calculating the maximum flows. Moreover, in this study, the Gorzów Wielkopolski gauge showed no statistically significant trends, so comparing it with gauges having statistically significant trends would have disturbed the analysis. Consequently, based on the M-K test results, gauges with statistically significant trends at the level α ≤ 0.05 were excluded from further analyses. That procedure was carried out separately for each group (annual, winter half-year, and summer half-year) of data. This resulted in a selection of 47 gauges for the analyses of the annual maxima, 45 for the winter half-year maxima, and 47 for the summer half-year maxima, respectively (Table A1).

3.2. Synchronous Occurrence of Specific Runoffs

3.2.1. Annual Maximum Specific Runoff (AMAXq)

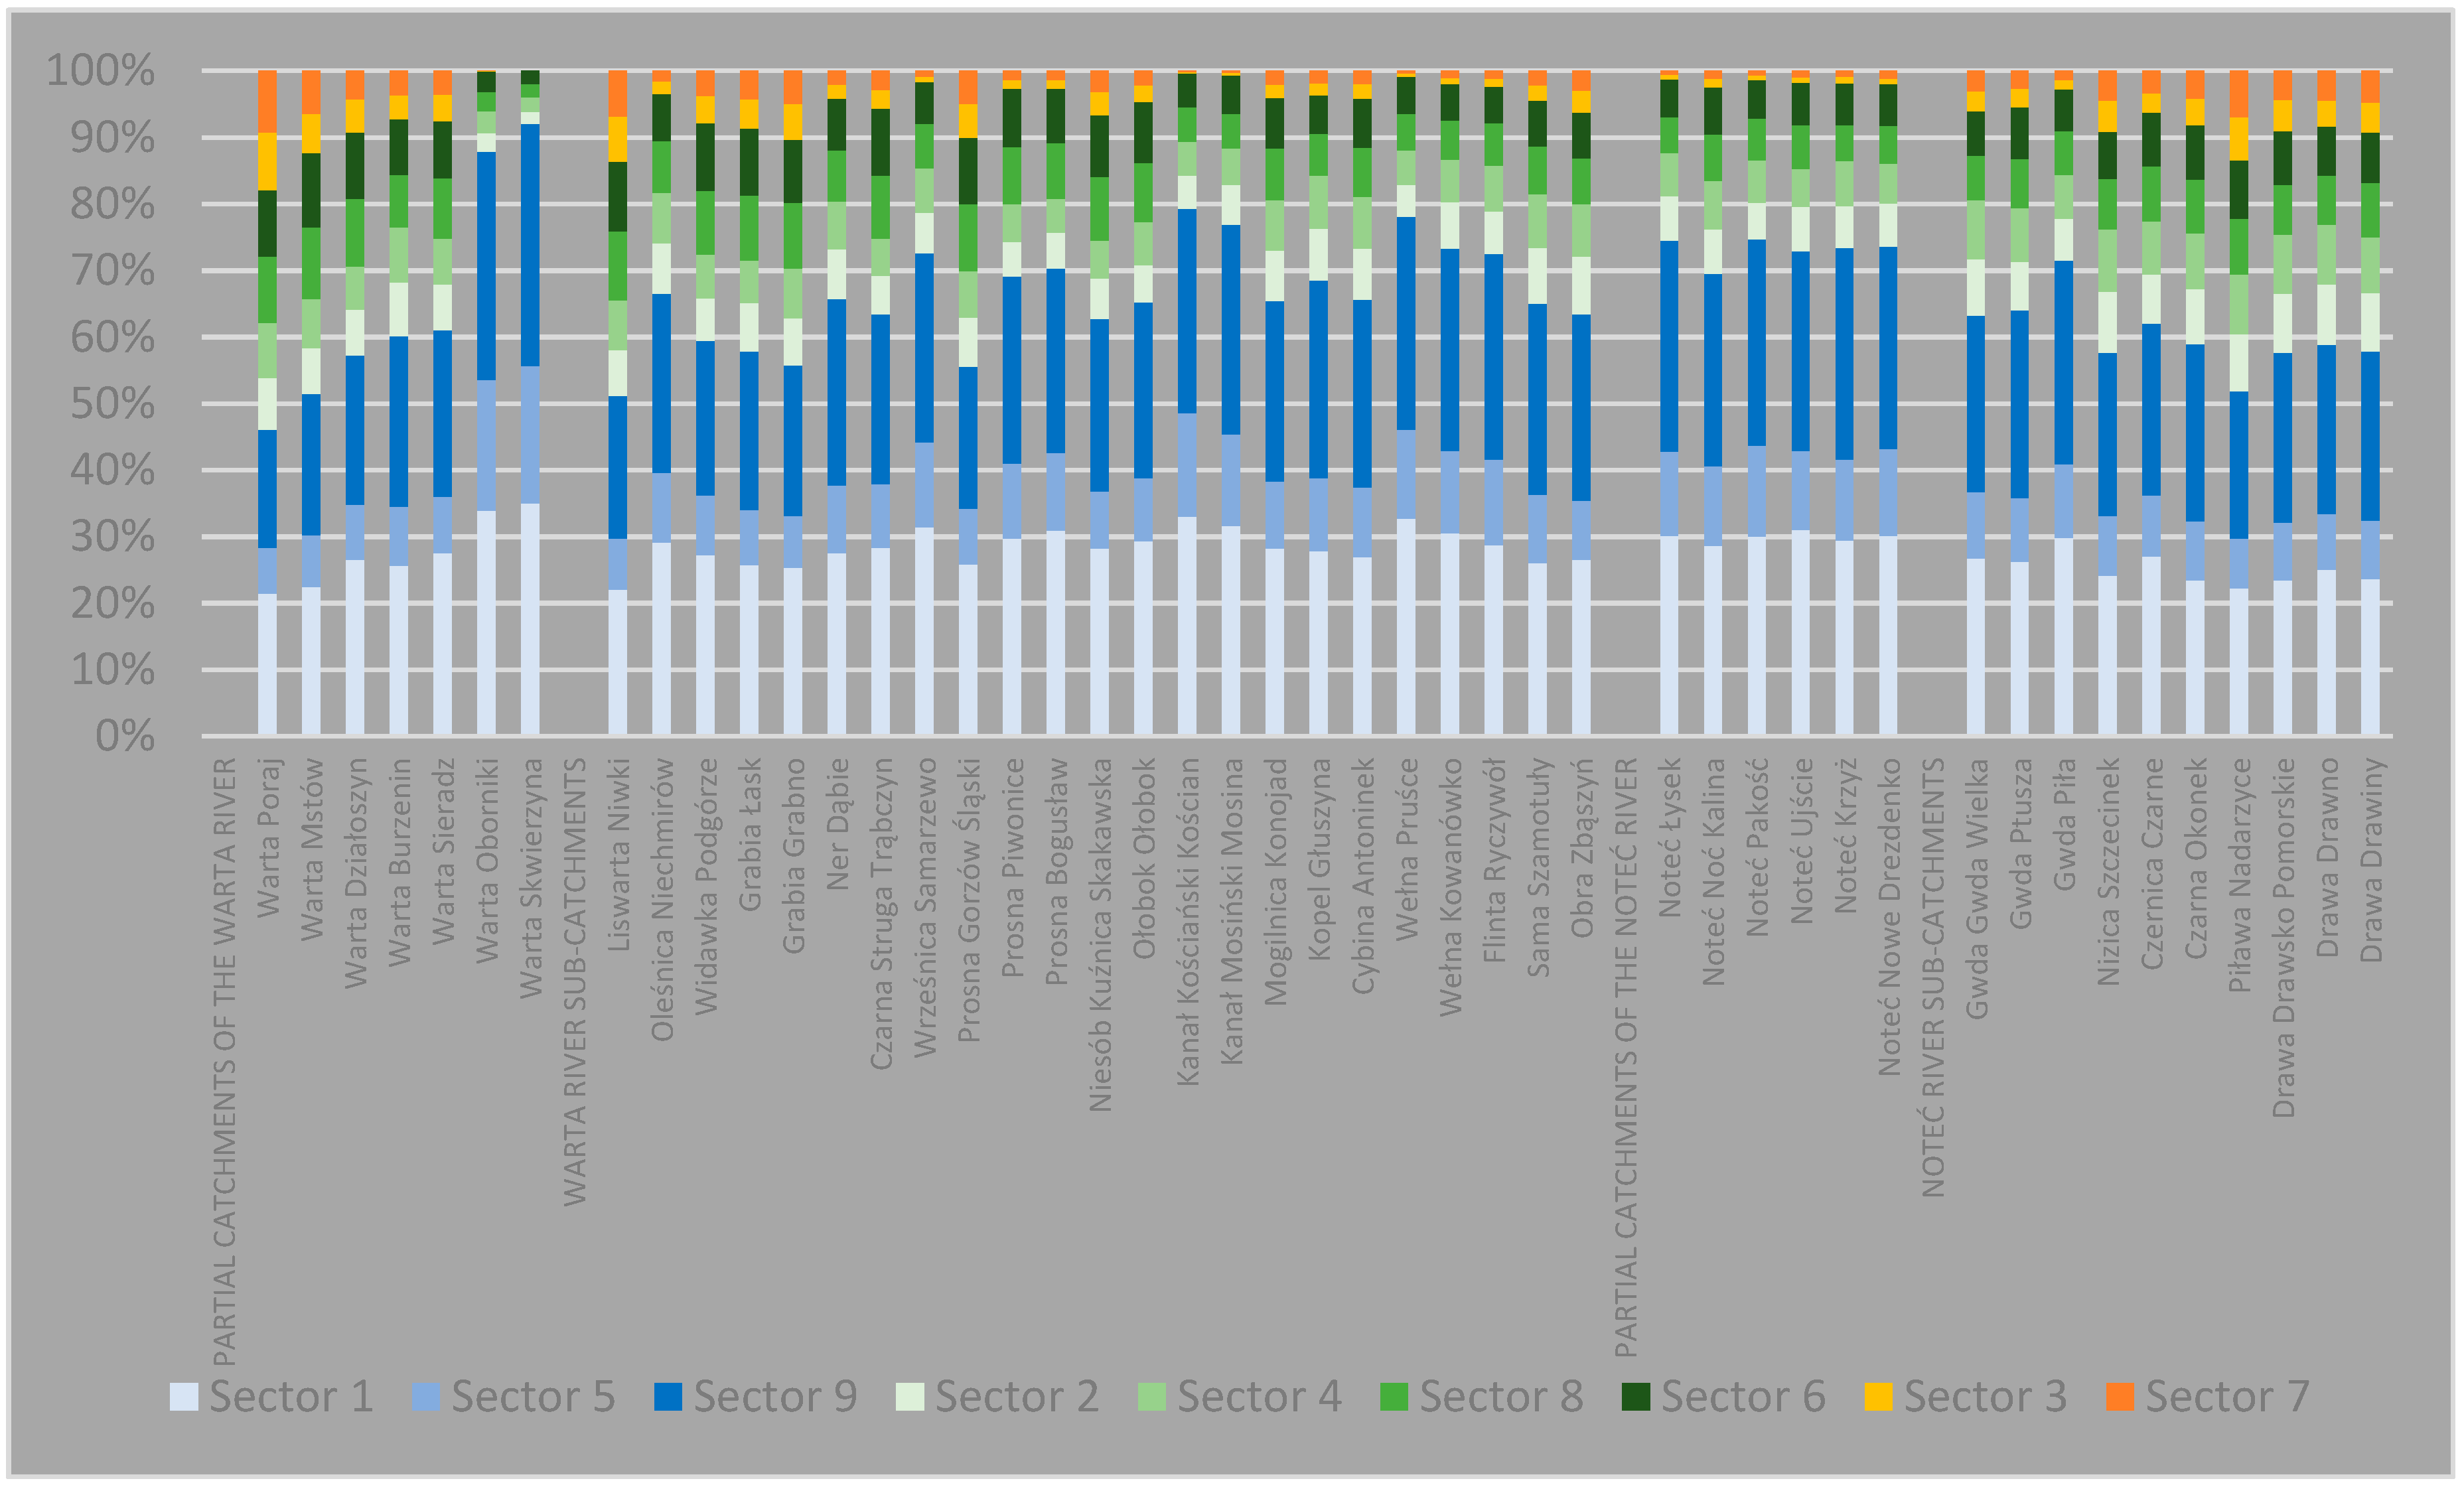
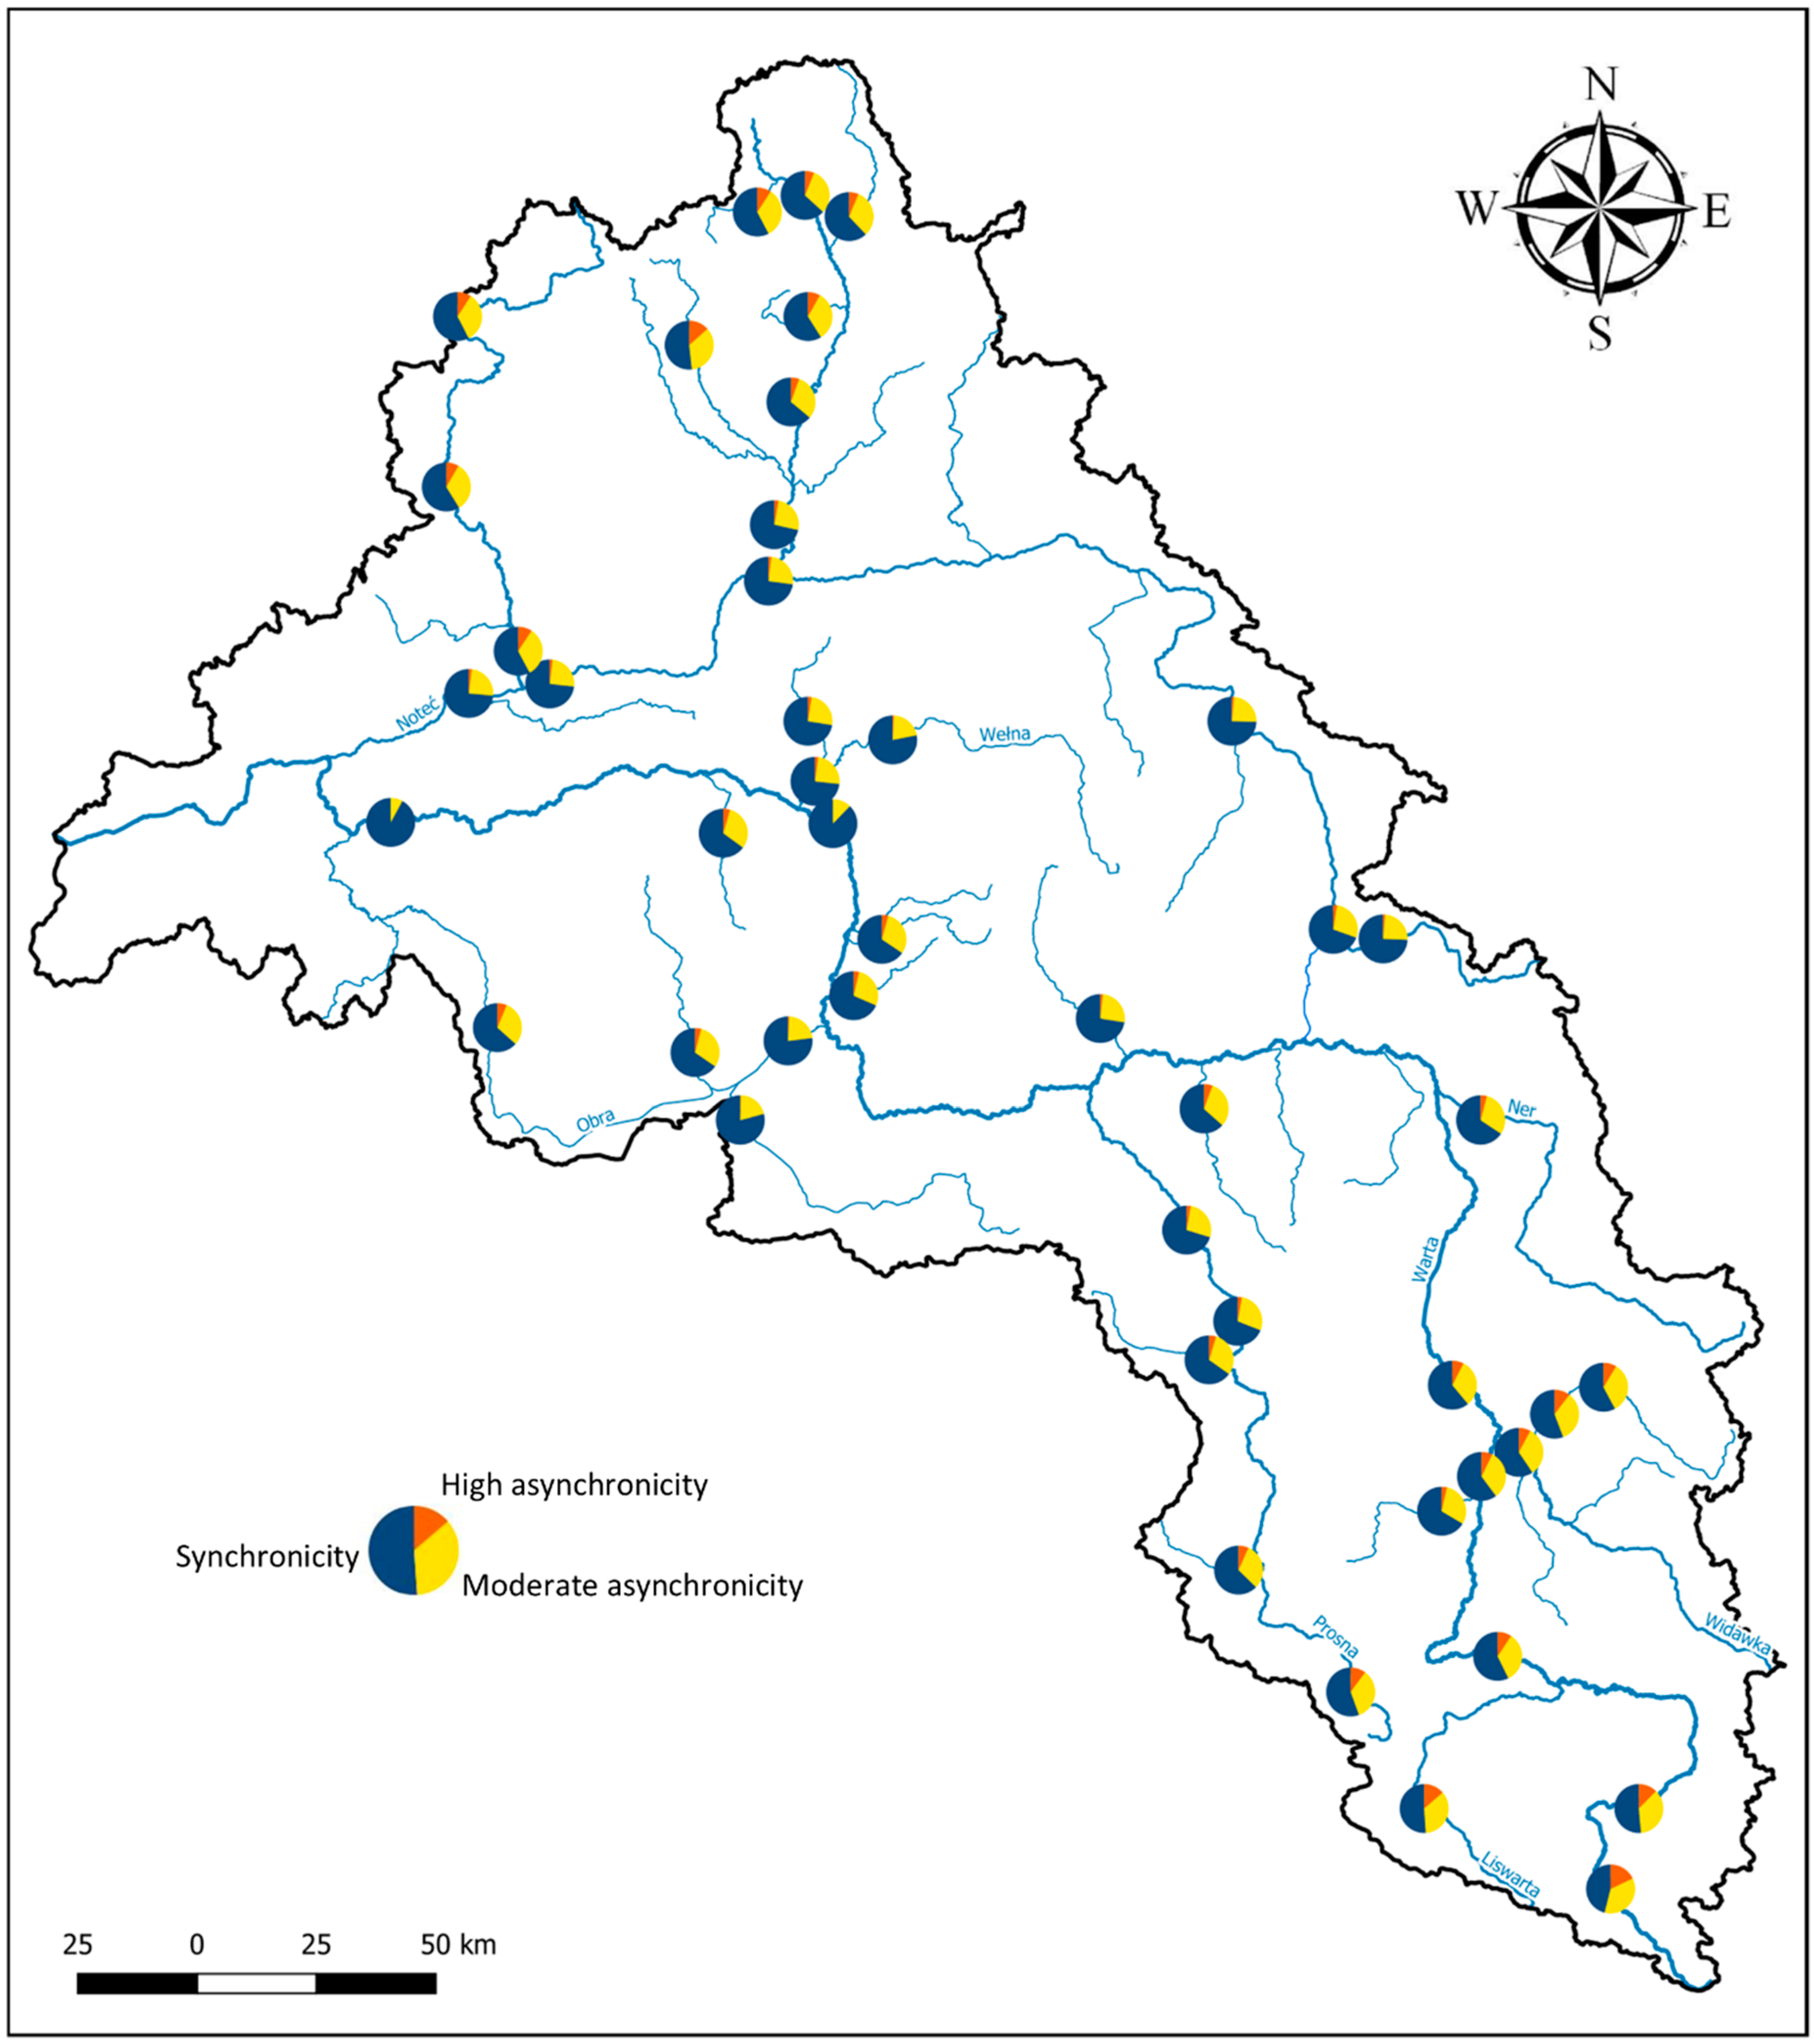
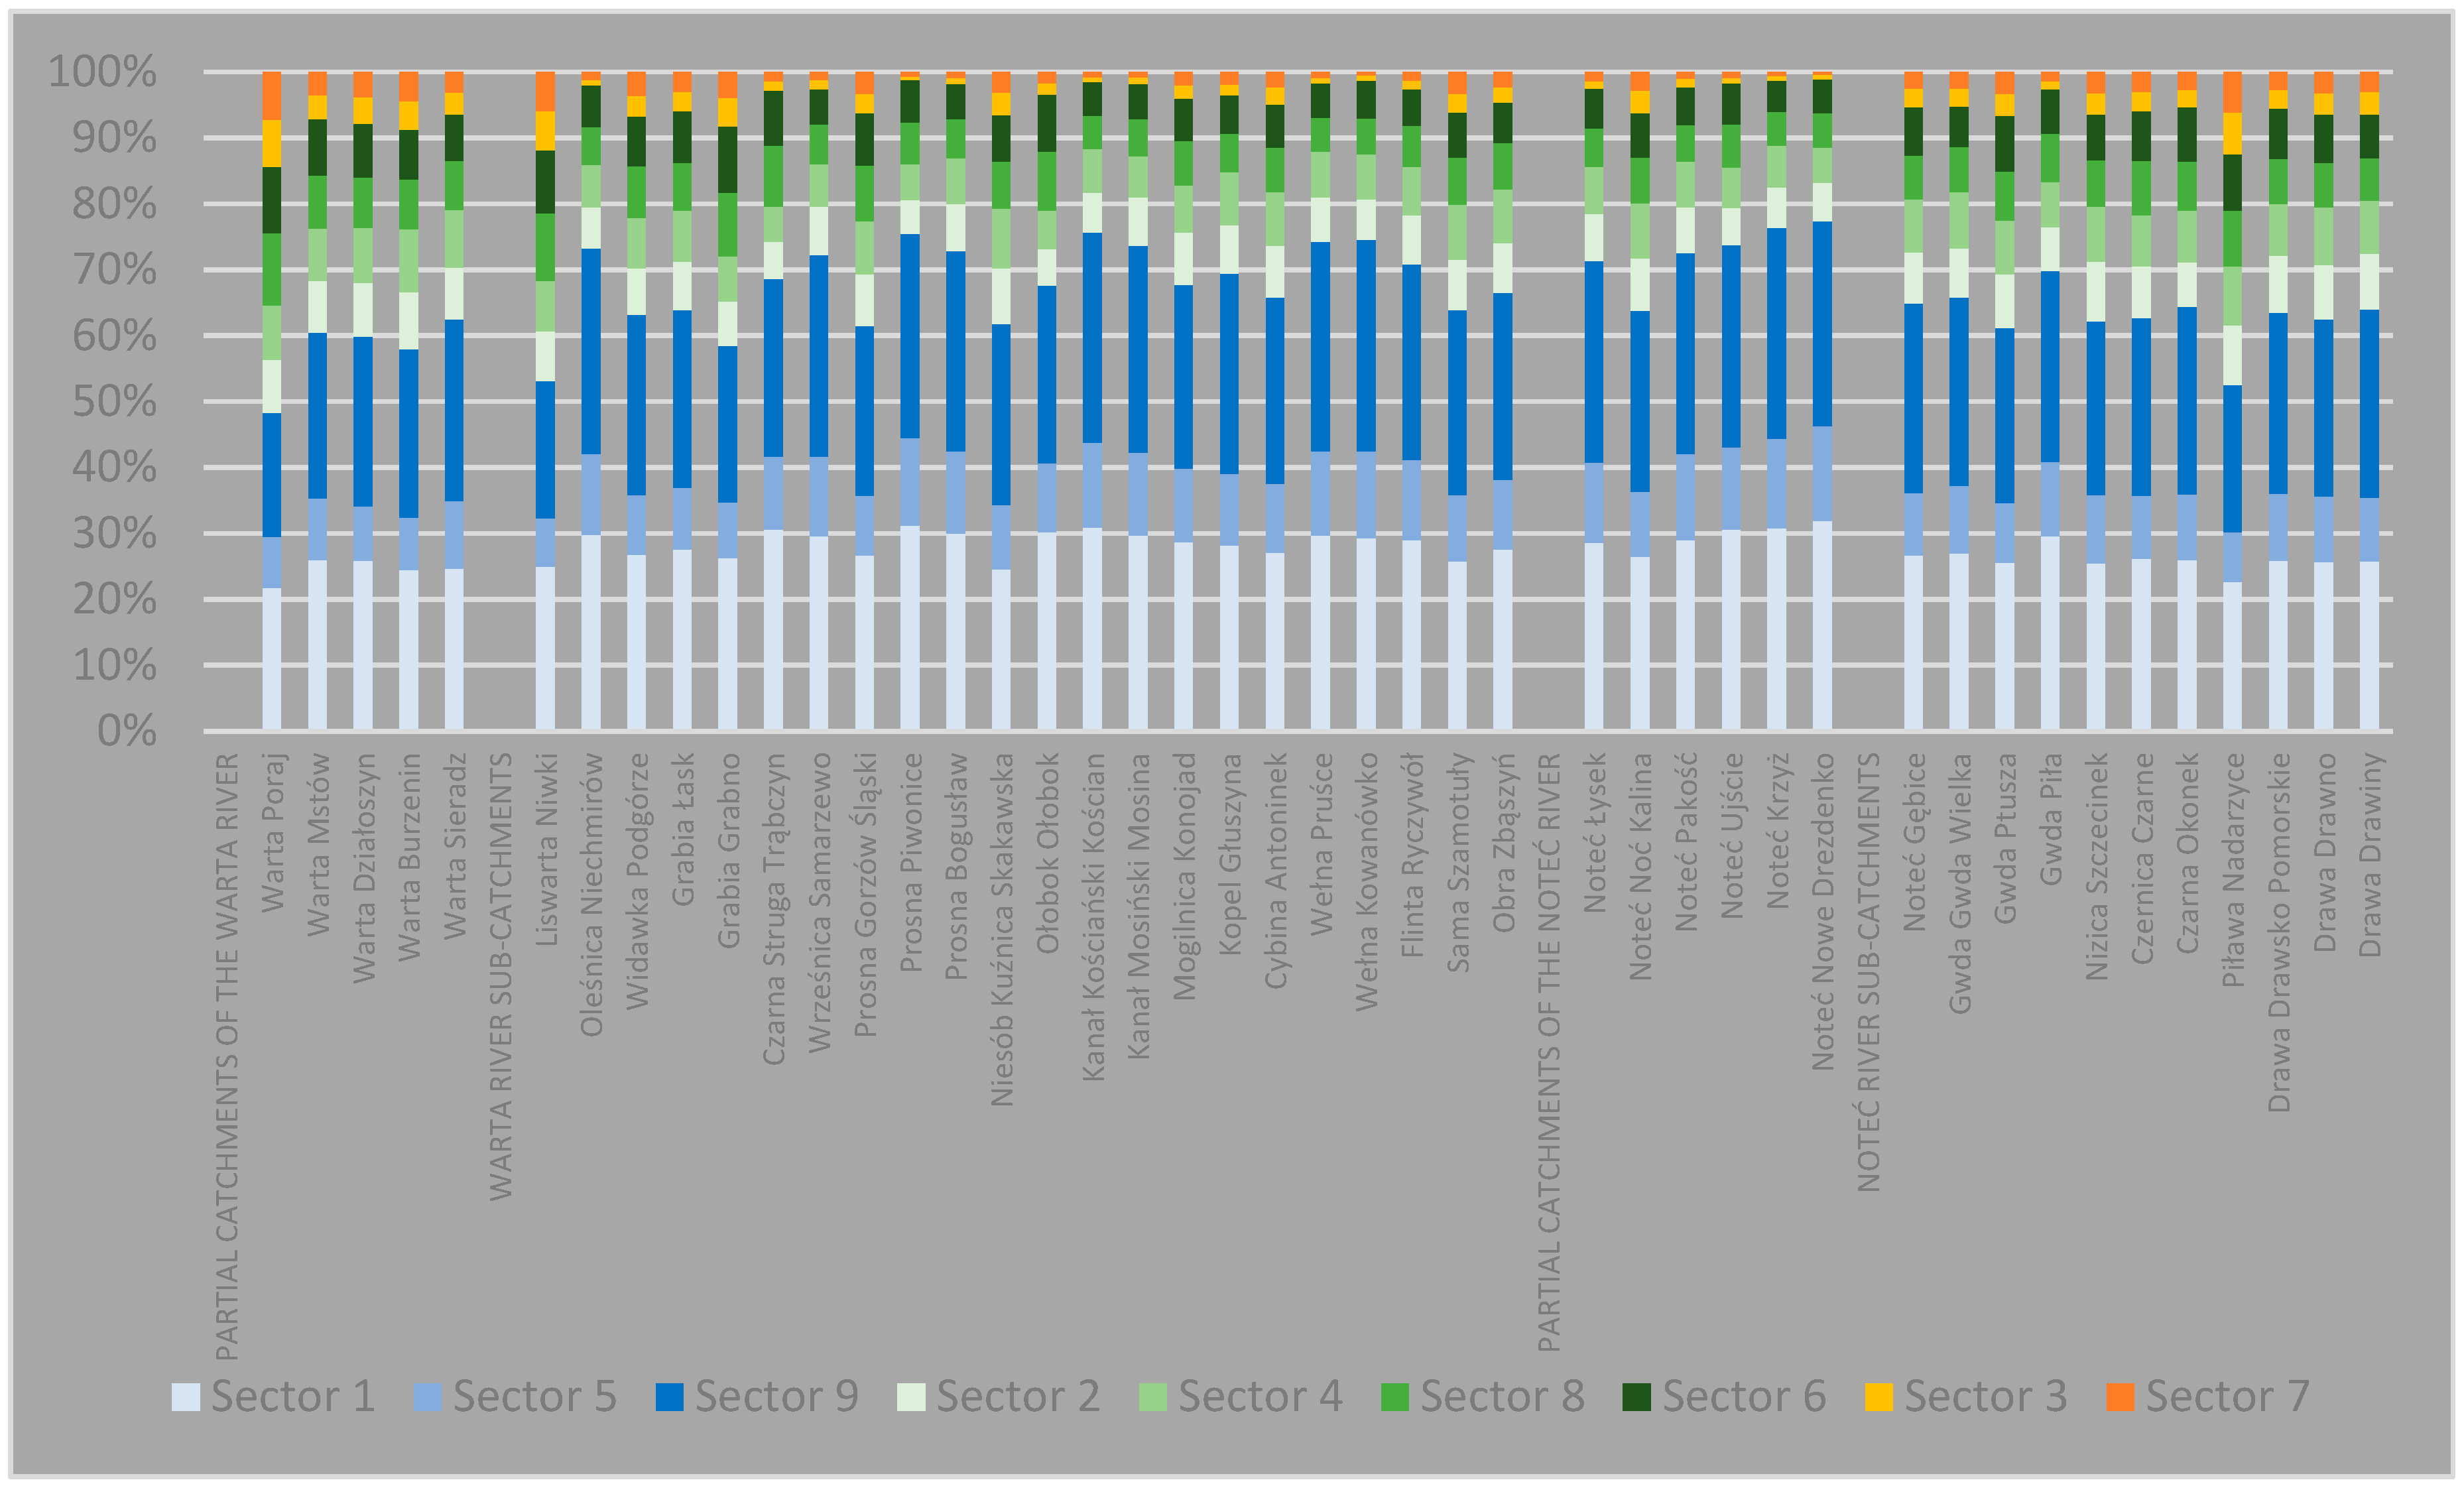
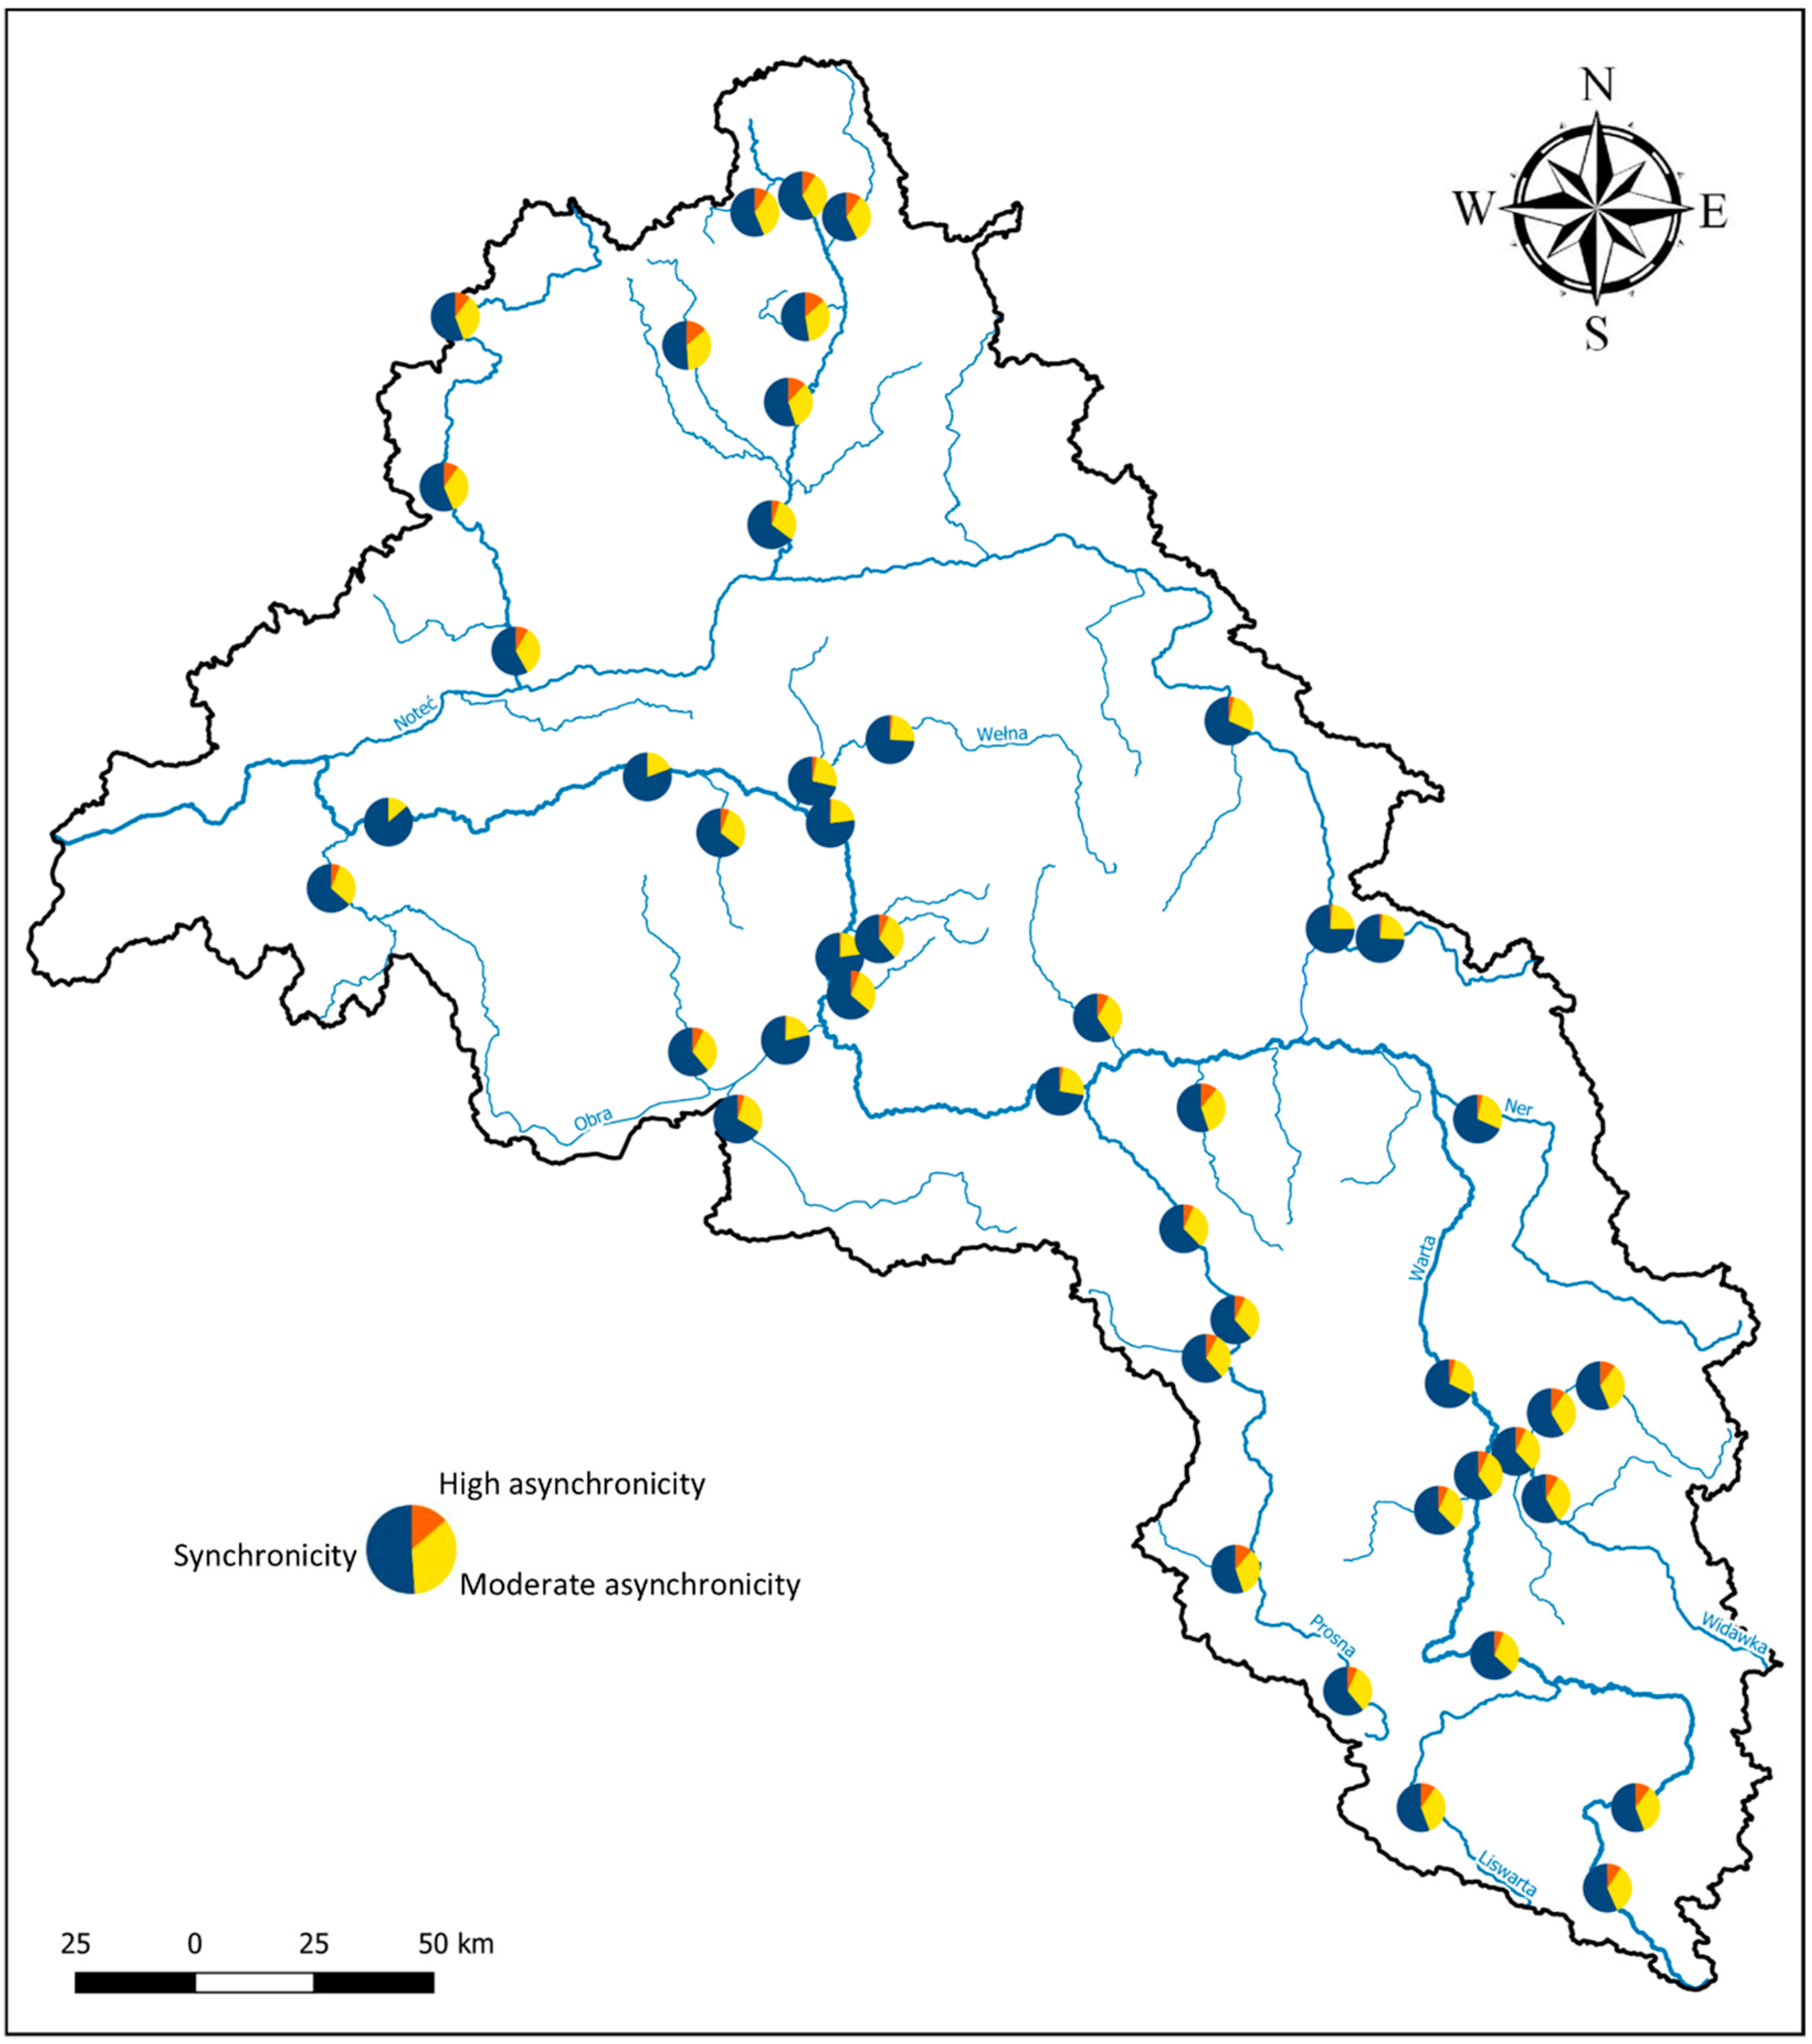
Analysis of the spatial differentiation of the degree of the synchronous and asynchronous occurrences of AMAXq in the hydrological year (Figure 3, Figure 4 and Figure 5, Table A2) proved that the largest (70–80%) synchronicity was observed in sub-catchments of the central part of the study area, including the Wrześnica River, the man-made Kościański and Mosiński canals, the Wełna and Flinta rivers, and the Noteć River sub-catchment (without the upper and middle reaches of its right tributaries). Relatively lower synchronicity (below 65%) was recorded in the sub-catchments located in the southern (the upper Warta, Liswarta, Widawka, and upper Prosna rivers) and northern (the upper Gwda, Nizica, Czernica, Czarna and Piława rivers—51.8%, and the Drawa River along its whole course) parts of the study area. Generally, in relation to the Gorzów Wielkopolski gauge, AMAXq in the partial catchments of larger rivers showed higher synchronicity, while in sub-catchments of smaller rivers, higher asynchronicity was more pronounced. The average synchronous occurrence of AMAXq in all analyzed sub-catchments was about 65.7%, while its average asynchronous occurrence reached 34.3% (28.8% of the moderate and 5.5% of the high asynchronicity).
Along the course of the Warta River mainstream, an increasing asynchronous occurrence of AMAXq was observed. As a rule, the shorter distance to the closing of the Gorzów Wielkopolski gauge, the greater degree of synchronicity of the analyzed events (Figure 4 and Figure 5). The maxima in the upper Warta catchment, between its source and the Poraj gauge, showed the lowest synchronicity (and the highest asynchronicity). This is the only case in the whole study area, in which most calculated events (53.9%) were asynchronous, which was conditioned by both relatively large distance between gauges Poraj and Gorzów Wielkopolski, and clearly different types of flow regime between the rivers in the upper (upland) and lower (lowland) reaches of the WRC.
In turn, at the Skwierzyna gauge, located on the Warta mainstream about 30 km above gauge Gorzów Wielkopolski, and above the mouth of the Noteć River, the synchronicity AMAXq was higher than 92%, while high asynchronicity was not detected. Relatively, the highest synchronicity of AMAXq was also concluded in the man-made Kościański Canal (above 79%), the middle Wełna River (78%), and the Mosiński Canal (77%). The synchronous occurrence of AMAXq increased along the Prosna and Gwda rivers, but it did not change much in the Noteć and Drawa rivers. In some cases, the decreasing probability of the synchronous occurrence of AMAXq along the river course was detected, as for example in the Wełna River (78% at gauge Pruśce, 73% at gauge Kowanówko) and the Grabia River (57.8% at gauge Łask, 55.8% at gauge Grabno). These may occur when a tributary with a lower synchronicity of MAXq discharges into such a river, as for example the Flinta River, the right tributary of the Wełna River, for which the synchronicity of AMAXq at gauge Ryczywół was 72.5%.
Besides the southern part of the Warta River catchment, the high asynchronicity of AMAXq was also recorded in the northern, lake-district part of the Noteć River sub-catchment. In the highlands, the high asynchronicity reached nearly 18% in the upper WRC at the Poraj gauge, and it exceeded 10% in the study area below the Mstów gauge, in the sub-catchments of the upper Liswarta, upper Prosna, and lower Grabia rivers. In the northern part of the WRC, asynchronicity higher than 5% was detected in eight sub-catchments, including the Piława River, where it exceeded 10% (13.4% at gauge Nadarzyce). In the sub-catchments of the central part of the WRC, high asynchronicity was below 5%, and only in the Obra River was it slightly higher (6.2%).

3.2.2. Winter Maximum Specific Runoff (WMAXq) (November–April)

Compared to AMAXq the synchronous occurrence of WMAXq in most catchments was slightly higher (Figure 3, Figure 6, and Figure 7, Table A2). The synchronicity was lower only at 13 gauges, of which five gauges were located in the Noteć River sub-catchment, including two in the middle and lower Gwda River and three in the upper and middle Noteć River. Relatively lower synchronicity was also detected at the Burzenin gauge on the Warta River mainstream.
The average synchronous occurrence of WMAXq calculated for all analyzed sub-catchments was about 66.2%, while the asynchronous occurrence was 33.8% (28.8% of the moderate and 5% of high asynchronicity).
The general increase in the synchronous occurrence of WMAXq can be explained by the nival moderately developed or nival strongly developed regimes of most rivers in WRC (Table 1). Such rivers are characterized by the spring season floods caused by snowmelt. In the study area, the spring thaw is usually a regional phenomenon, increasing the snowmelt flow in most of WRC. Consequently, when the size of the snowmelt flow is similar in the catchment, the synchronous occurrence of WMAXq is observed; when the snowmelt flow is only a local (sub-catchment) phenomenon, its asynchronous occurrence is recorded. Hence, it can be assumed that the degree of synchronicity of WMAXq depends on the snow cover depth (similar or different in the respective sub-catchments) and, in general, weather conditions (cold and snowy or warm and snowless winter).
Similar to AMAXq, these recorded in the winter half-year (WMAXq) showed higher synchronicity in the sub-catchments of the central part of the study area, while they were lower in the northern and southern parts of WRC. Once again, an exception was the upper Warta River above the Poraj gauge (Figure 3, Figure 6, and Figure 7, Table A2), where in most cases, the WMAXq values were asynchronous. However, this asynchronous occurrence in the winter half-year decreased to 51.7%, including 14.4% of the high asynchronicity. Only in two sub-catchments, i.e., of the Piława (12.5%) and upper Liswarta (11.8%) rivers, was the high asynchronicity of WMAXq higher than 10%. Compared to AMAXq, the high asynchronicity of WMAXq averaged for the whole WRC decreased by about 0.5%, while the averaged moderate asynchronicity remained at the same level (28.8%).
In comparison to the annual maxima, the percent share of the synchronous occurrence of WMAXq in the sub-catchments of the man-made Kościański and Mosiński canals and the Wełna River decreased by about 3.5%. However, they still showed one of the highest synchronicities (73.6–75.6%) in the whole study area. A noticeably higher synchronous occurrence of WMAXq was detected in the lower reaches of the Noteć River (77.3% at gauge Nowe Drezdenko), while it was slightly lower in the sub-catchments of the Oleśnica, Wrześnica, Prosna (Piwonice and Bogusław gauges), Wełna, and middle Noteć rivers.

3.2.3. Summer Maximum Specific Runoff (SMAXq) (May–October)

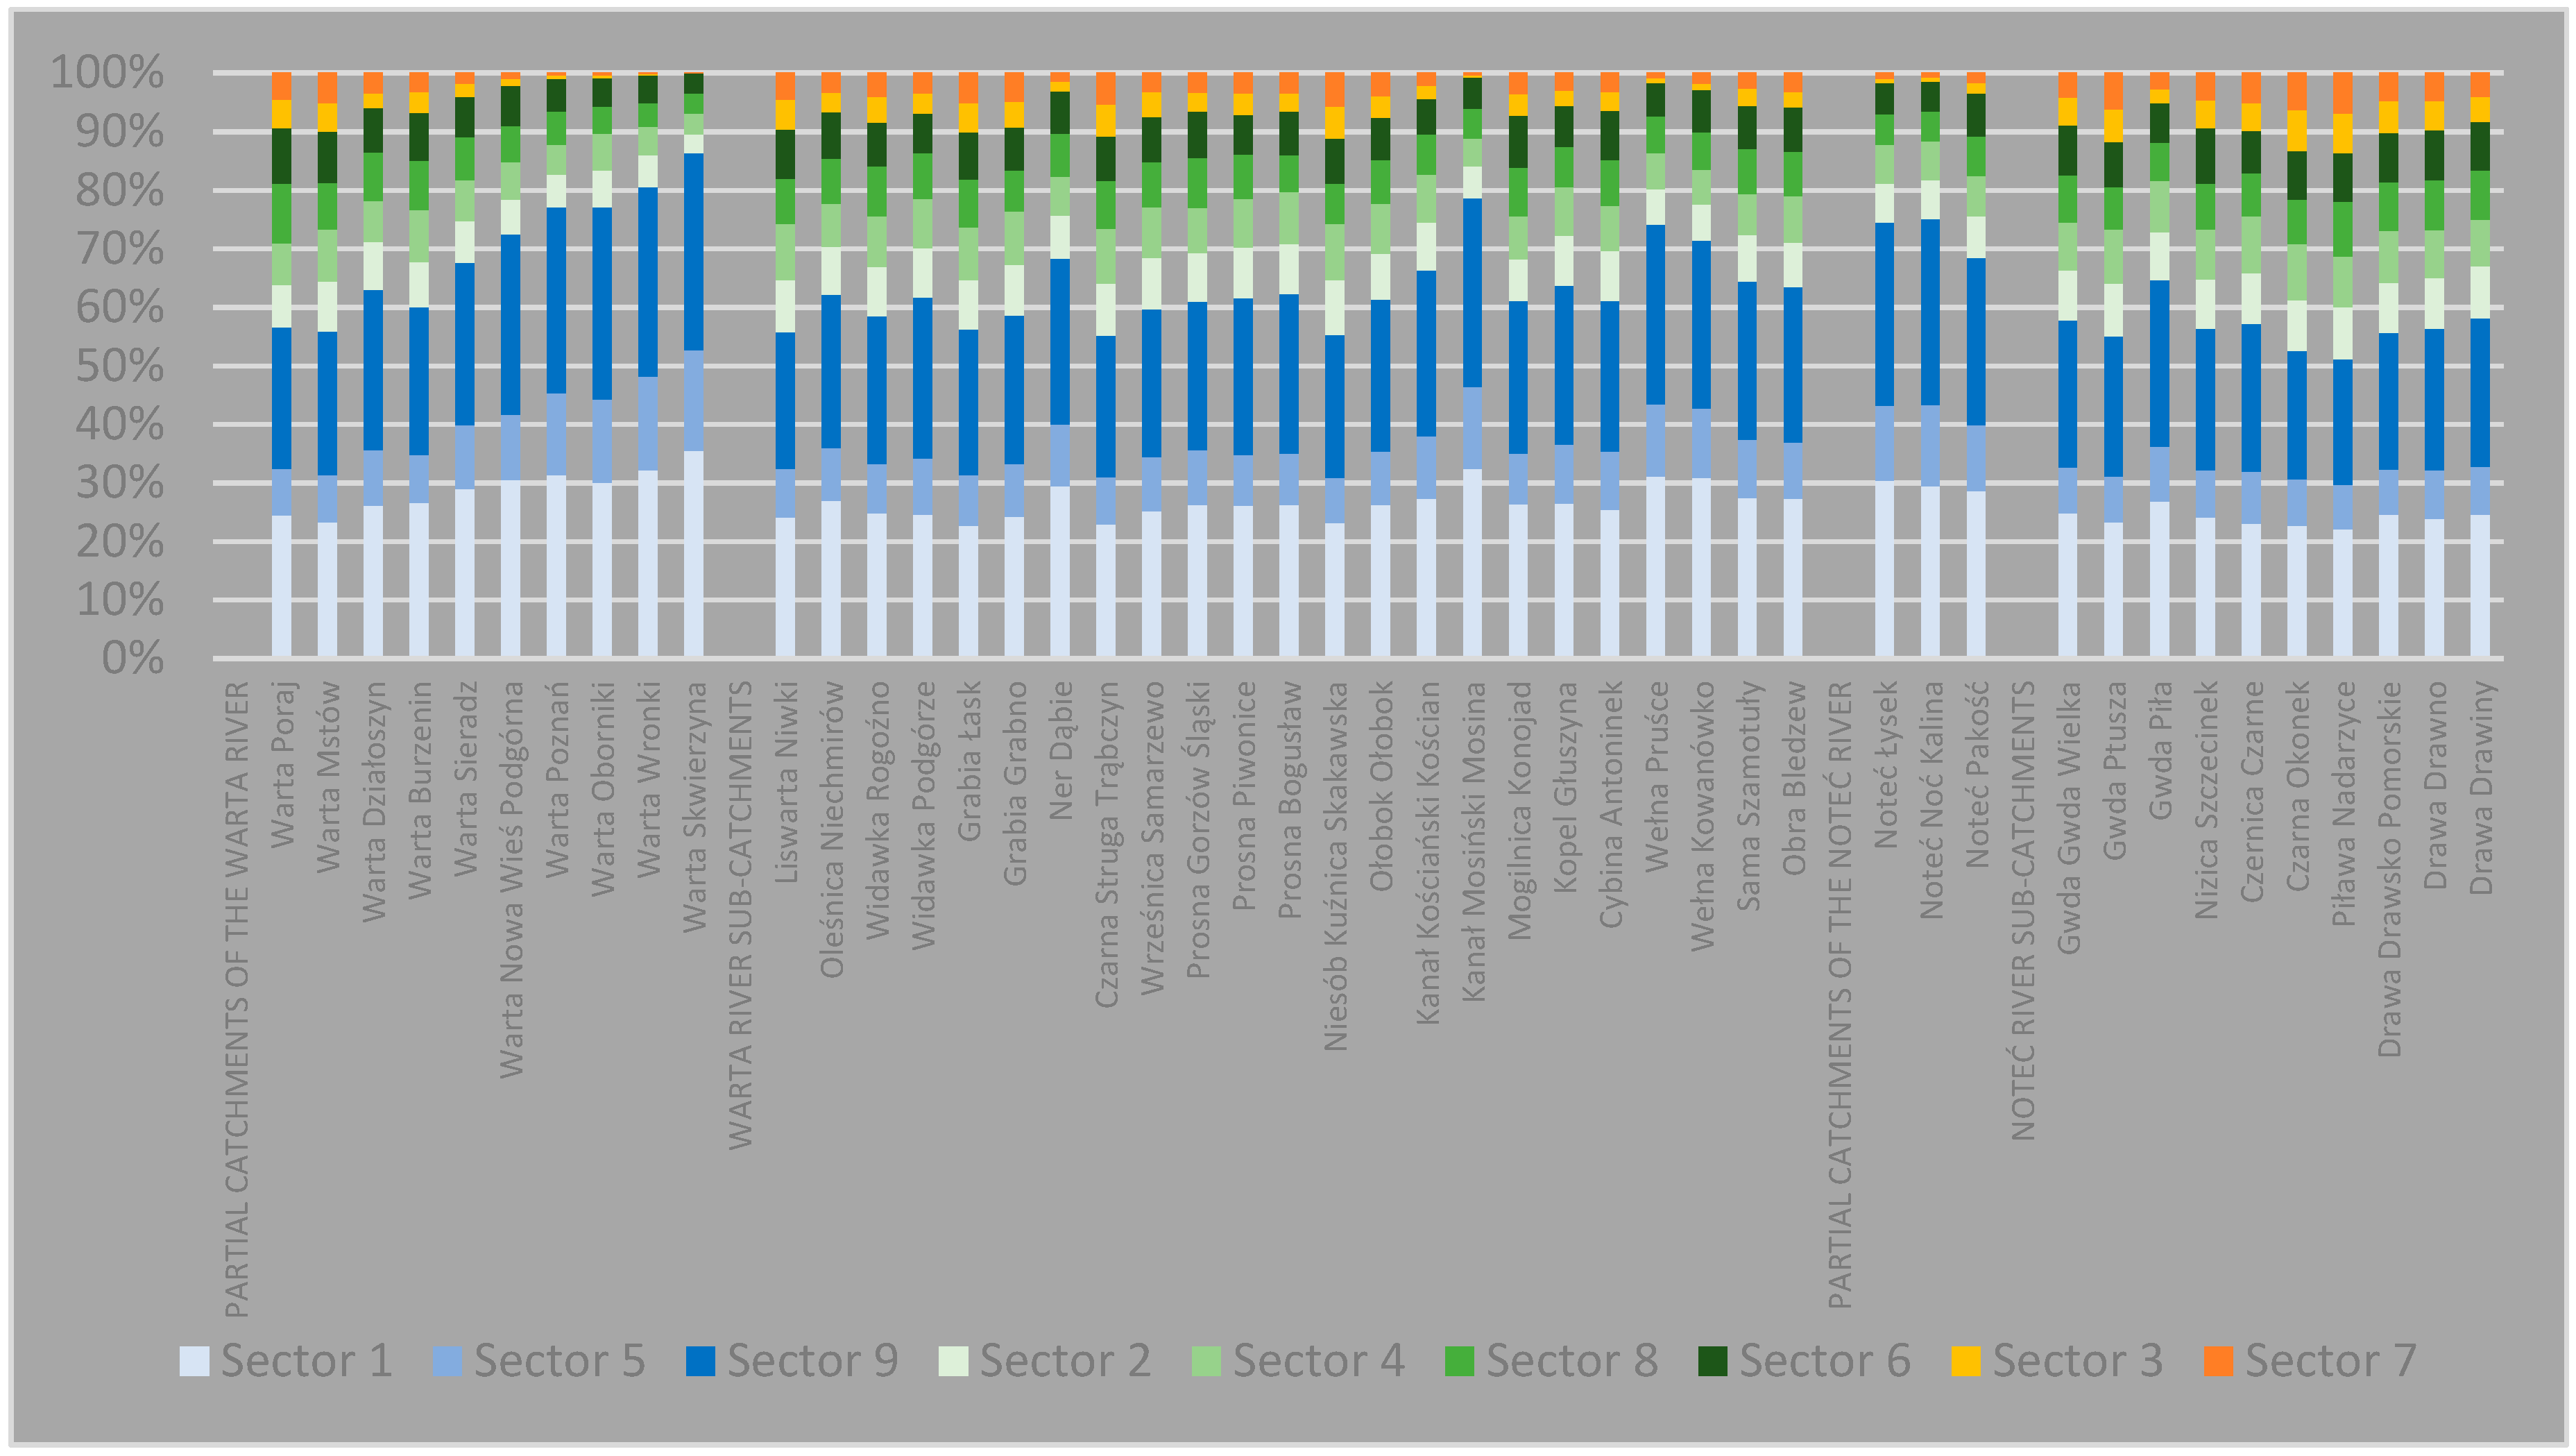
Compared to the annual and winter half-year, SMAXq (Figure 3, Figure 8, and Figure 9, Table A2) had the lowest average synchronicity (63.5%), which resulted in the highest average asynchronicity of the studied events (36.5%), including the moderate asynchronicity of about 30% and the high asynchronicity of 6.5%. However, compared to the values calculated for AMAXq, the direction of changes was different.
In the summer half-year, there was a clear increase in the synchronicity of the maximum flows in the southern part of WRC. It was particularly visible in the upper WRC above the Poraj gauge, where the percent share of the synchronous occurrence of SMAXq in relation to AMAXq increased by about 10%. An increase of 4.5–5.5% was also recorded in the sub-catchments of the upper Liswarta and upper Prosna rivers, and of 2–3% in the Widawka, lower Grabia and Ner rivers. A similar increase in the northern part of the study area was concluded only in the sub-catchment of the Noteć River below the Noć Kalina gauge. In the southern part of the WRC, the summer synchronicity decreased only in the sub-catchment of the Oleśnica River.
The synchronous occurrence of SMAXq along the Warta River mainstream above the Sieradz gauge increased (or remained at a similar level), while it decreased in the middle and lower reaches (by 10.7% at the Oborniki gauge). This variability can be explained by the more frequent occurrence of summer floods caused by heavy rainfall in the southern than in the central part of the study area. The maximum flows in the Warta River mainstream below the Sieradz gauge were remarkably reduced by the Jeziorsko Reservoir, and consequently also the synchronous occurrence of SMAXq in the middle reaches of the Warta River was lower.
Changes of the SMAXq synchronicity in the central and northern parts of WRC were opposite to these recorded in its southern part. The percent share of synchronous events in the summer half-year compared to AMAXq decreased in all catchments except for the Mosiński Canal (increase by 1.7%) and the Noteć River at gauge Noć Kalina (increase by 5.6%). The largest increase in the asynchronicity of SMAXq in the central part of WRC was recorded in the Wrześnica River and the Kościański Canal (by 13%), which was followed by the Czarna Struga (about 8.3%) and the sub-catchment of the middle and lower Prosna River, including its tributary: the Niesób River (7.5–8%). Changes were similar in most of the sub-catchments of the Noteć River, where an increase of the asynchronous events from 0.7% to 9% was detected, with the largest in the tributaries of the Gwda River (increase between 5.5% and 9%).
It is worth noting that while the highest asynchronicity of AMAXq and WMAXq of the Warta River in relation to the Gorzów Wielkopolski gauge was detected in the upper WRC (the Poraj gauge), in the summer half-year, the highest asynchronicity was concluded in the sub-catchments of the Piława (51.2%) and Czarna (52.6%) rivers. In addition, the asynchronous SMAXq higher than 40% was found in other 16 sub-catchments (Figure 8 and Figure 9, Table A2).
In addition, the spatial distribution of the high asynchronicity of SMAXq was clearly different from that observed in the case of AMAXq and WMAXq; the SMAXq values exceeding 10% were recorded in the sub-catchments of the Piława, Czarna, Gwda (below gauge Ptusza), Niesób, Czarna Struga, Drawa (below gauge Drawsko Pomorskie), and Grabia (below gauge Łask) rivers (Figure 6). Among these sub-catchments, there were no partial catchments of the Warta River mainstream. However, the percent share of the high asynchronicity above the Mstów gauge reached 9.9%, while above the Poraj gauge, it exceeded 9.4%. The lowest values (below 1%) of the high (extreme) asynchronicity of SMAXF in the Warta mainstream were recorded at the Poznań gauge and below it, and also in the man-made Mosiński Canal.
In general, since the annual maxima occur more frequently in the winter half-year, the detected synchronicity of SMAXq is relatively lower compared to WMAXq (and AMAXq).

4. Discussion and Conclusions

The research aimed at detection of the synchronous and asynchronous occurrences of the maximum annual and seasonal (winter and summer) flows in respective sub-catchments of WRC in relation to the Gorzów Wielkopolski gauge closing the study area. In the first part of the study, the source data recorded at 72 gauges in the multi-year period 1971–2010 were checked in terms of their continuity. This resulted in a selection of 58 data sets for further analyses. Next, the M-K test was applied to detect statistically significant trends in the analyzed data series; the gauges with statistically significant trends at the level α ≤ 0.05 were excluded, and finally, 47 water gauges for the analyses of AMAXq, 45 for the WMAXq, and 47 for SMAXq, respectively, were identified. Then, the copula function was used to calculate the synchronous and asynchronous encounter probabilities and the degrees of synchronicity and asynchronicity of respectively AMAXq, WMAXq, and SMAXq at the respective gauges in relation to the Gorzów Wielkopolski gauge closing the WRC.
It needs to be underlined that since the analyzed maximum flows resulted from different water supply conditions (snowmelt and rainfall) in the proposed procedure of model construction, besides the annual period, two different seasons (winter and summer) were also considered. Otherwise, based only on the maximum annual flows in the whole hydrological year, the analysis may have led to wrong conclusions. One example is that two, in fact, unrelated maximum flows (one occurred as a result of snowmelt, the other caused by intense summer rainfall) would have been recognized as the synchronous events. This confirms that the applied method should be adapted to the particular (individual) characteristics of the analyzed catchment.
It was found that there was a noticeable spatial and temporal variability of the synchronous and asynchronous occurrences of the maximum flows in the study area. This variability was associated with the seasonal changes of water supply, and also the physical–geographical conditions of water circulation in WRC, which for example have an impact on the percent share of groundwater flow in the total flow, noticeably higher in the southern and northern parts of the study area (see Table 1). In particular, the differences were distinctively marked in its southern part, including the upper reaches of the Warta River mainstream and the upper sections of its tributaries: the Liswarta and Prosna rivers. The most asynchronous occurrences of AMAXq and WMAXq were identified at the Poraj gauge on the Warta River mainstream, while in the case of SMAXF, the northerly Piława River showed the highest degree of asynchronicity. In general, MAXq in these sub-catchments showed the weakest relationships (synchronicity) with the maxima recorded at the Gorzów Wielkopolski gauge.
At the same time, the highest synchronicity with the maximum flows at the Gorzów Wielkopolski gauge was found at gauges located on the man-made Kościański and Mosiński canals, as well as in the sub-catchments of the Noteć, Wełna, and lower Prosna rivers. In the summer half-year, an increase in the synchronous occurrence of MAXq in the southern part of the Warta River catchment (compared to the annual and winter maxima), and a decrease in its central part were identified. For each of the analyzed half-years, the reasons for the detected spatial differences in the degree of synchronicity were discussed. It was concluded that the stronger synchronicity of WMAXq resulted from the nival regime of the studied rivers. Consequently, the annual maxima are most often recorded in the winter half-year. The detected differences of synchronicity of the annual and seasonal flows are conditioned by climate, more specifically by the course of winter and different snow cover thickness, and also the amount and intensity of rainfall in summer, which supports the thesis about different water supply conditions and courses of the maximum flows in the respective seasons.
The WRC belongs to the most developed and productive agricultural regions of Poland, but at the same time with only about 127 mm of the average annual flow, it is one of the driest parts of the country, and also one of the poorest regions in Europe in terms of available water resources. This makes the WRC of particular interest to researchers aiming to recognize its hydro-climatologic [27,28,29,30,31,32,33,34,35,36,37,38,39] characteristics, and predict future runoff trends in that area in relation to the projected climate change [25,26]. However, while these analyses focus mostly on variations of flows recorded in separated gauging stations, there is lack of research on probabilistic relationships between them in terms of the synchronous and asynchronous occurrences of the annual and seasonal flow maxima in WRC. This paper is the first attempt to fill this gap and determine dependencies between the maximum flows, and on this basis detect their spatial and temporal differences in that area with the help of selected Archimedean copulas.
The copula function is a very useful tool allowing such analyses. A growing number of papers prove that copulas can be successfully applied in hydrology. These include analyses of relationships between the river flow volume and sediment [12,13], and the synchronous–asynchronous encounter probability of the annual flows at the confluence of two streams [62]. The copula method was also used to determine correlations between the maximum [16] or mean [17] annual water levels in the Polish coastal lakes with the Baltic Sea water levels.
It is also worth noting that while previous papers investigated the synchronous occurrence of the annual flows at two or three water gauges, this research analyzed the synchronicity of the annual and seasonal maximum flows recorded in nearly 50 profiles in the WRC, which allowed determining the catchment-scale spatio-temporal variability of MAXq. It also resulted in detecting the sensitivity of this relatively large hydrographic unit to the occurrence of the flood events in its respective parts (sub-catchments), which are shaped by specific physical–geographical characteristics (including the varied hydro-geological, morphological, and climatic conditions) of the WRC.
These findings, besides broadening knowledge on the hydrology of the third largest river system in Poland, also have a considerable practical (applicative) potential. Forecasting the maximum flows in WRC with the use of the copula function can help to reconsider existing regional plans of water resources development and enhance their management, in terms of flood protection, reservoir water storage, and water supply in the region characterized by one of the poorest water resources in Poland and Europe. These include reducing the risk of overlapping flood waves on the Warta River so that they do not pose a threat to cities located along it, as for example Poznań, and the management of the flood water storage in the existing Jeziorsko Reservoir on the Warta mainstream. Moreover, results of the analyses can be taken into account in case of the planned for construction of the Wielowieś Klasztorna Reservoir on the Prosna River, which is designed to protect the southern Wielkopolska against floods, but also mitigate the droughts that have been recorded more and more frequently in the region.
It should be noted that river catchments with similar physical–geographical conditions and patterns of water supply in the yearly cycle may exhibit similar behavior. Therefore, this study may serve as a reference point for analyses in such catchments. However, in the case of rivers displaying different flow regimes, the presented methodology may require modification and adaptation to the local conditions of water supply, and the occurrence and course of high-water periods, for example in terms of division of the hydrological year into smaller temporal units. The presented study is the first analysis of that kind concerning a relatively large hydrographic unit. As such, it may serve as a starting point for the construction of more detailed whole-basin models in terms of synchronicity of the flow maxima.
Nevertheless, the analysis of only one variable (the maximum outflow) characterizing the hydrology of a given area (catchment) is an obvious simplification. In fact, a river catchment is a complicated system that depends on many factors, including climate (e.g., precipitation, temperature), geomorphology (land slope, depressions, retention, and infiltration capacity of soil) geology (permeability of rocks), human activity (land use, hydro-engineering structures), etc. Moreover, although the obtained values of synchronicity allow determining the probability of co-occurrence of the analyzed flow maxima, they do not answer the question of to what extent the flow maxima in a given sub-catchment influences the formation of floods in another sub-catchment. So, it would be useful to create a correlation matrix of the ‘peer-to-peer’ relationships, in which the strength of interdependence (co-occurrence) would be determined for any pair of gauges. In this study, the two-dimensional (2D) copula functions were used. So, the three-dimensional (3D) copulas, successfully used in hydrological analyses, should also be applied to construct multidimensional joint distributions for catchments characterized by different runoff regimes.
The future research should also concentrate on further, more detailed analyses of the synchronous occurrence of the maximum flows of single flood waves recorded in the WRC after individual pulses of an increased water supply, e.g., after sudden snowmelt or heavy rain. The constructed models can focus not only on the synchronous occurrences of the maximum flows, but also on the flow minima, and include the flood and drought risk analysis in measurable economic dimensions.

Author Contributions

Conceptualization, A.P., L.S. and D.W.; methodology, A.P., L.S. and D.W.; software, A.P., L.S. and D.W.; validation, A.P.; formal analysis, A.P., L.S. and D.W.; investigation, A.P., L.S. and D.W.; writing—original draft preparation, A.P.; writing—review and editing, A.P., L.S. and D.W.; visualization, A.P.; supervision, A.P., L.S. and D.W. All authors have read and agreed to the published version of the manuscript.

Funding

This research received no external funding.

Conflicts of Interest

The authors declare no conflict of interest.

Appendix A

Table A1. Results of the Mann–Kendall (M-K) test Z statistics.
No.*RiverGaugeMaximum
AnnualWinter Half-YearSummer Half-Year
2WartaPoraj−1.54−1.92−1.55
3WartaMstów−0.52−0.92−0.36
5WartaDziałoszyn−1.43−1.72−1.57
6WartaBurzenin−1.18−1.51−1.46
7WartaSieradz−1.01−1.31−1.20
8WartaNowa Wieś Podgórna−2.30−2.34−0.62
9WartaPoznań−2.02−2.13−0.93
10WartaOborniki−1.89−2.00−0.83
11WartaWronki−2.11−2.11−0.96
12WartaSkwierzyna−1.90−2.02−0.94
13WartaGorzów Wielkopolski−1.64−1.60−1.08
14LiswartaNiwki0.43−0.55−0.69
16OleśnicaNiechmirów−1.26−1.21−0.92
17WidawkaSzczerców−3.32−3.95−2.60
18WidawkaRogoźno−2.69−2.84−1.46
19WidawkaPodgórze−1.07−1.07−1.13
20GrabiaŁask−1.54−1.90−0.29
21GrabiaGrabno0.12−0.09−0.44
23NerDąbie−1.82−2.06−0.98
26Czarna StrugaTrąbczyn0.310.27−1.15
27WrześnicaSamarzewo−1.22−0.63−0.96
28ProsnaGorzów Śląski−0.48−0.21−1.95
29ProsnaMirków−1.99−2.11−2.57
30ProsnaPiwonice−1.50−1.60−1.61
31ProsnaBogusław−1.76−1.71−1.58
32NiesóbKuźnica Skakawska−0.57−0.44−1.48
33OłobokOłobok0.720.59−1.11
34Kanał KościańskiKościan−1.78−1.32−1.31
35Kanał MosińskiMosina−0.64−0.01−1.05
36MogilnicaKonojad−0.34−0.02−0.65
37KopelGłuszyna0.140.930.31
38CybinaAntoninek−0.050.41−0.63
40WełnaPruśce−1.32−0.91−1.33
41WełnaKowanówko−0.98−0.54−1.74
42FlintaRyczywół−1.06−0.33−2.07
43SamaSzamotuły−0.96−0.44−1.06
44ObraZbąszyń−1.36−1.36−2.69
45ObraBledzew−2.23−2.47−0.75
47NotećŁysek−1.25−0.93−0.69
48NotećNoć Kalina−0.35−0.26−0.29
49NotećPakość−1.51−1.26−0.47
50NotećUjście 1−1.67−1.43−2.07
52NotećKrzyż−1.88−1.62−2.18
53NotećNowe Drezdenko−1.46−1.34−2.04
54NotećGębice−2.24−1.79−3.34
55GąsawkaŻnin−2.23−2.07−2.05
57GwdaGwda Wielka−0.52−0.300.08
58GwdaPtusza0.540.990.58
59GwdaPiła−0.73−0.24−1.89
60NizicaSzczecinek−0.71−0.69−0.37
61CzernicaCzarne−1.12−1.00−1.00
62CzarnaOkonek−0.72−0.38−0.84
63PiławaNadarzyce−1.33−0.73−1.58
64PiławaZabrodzie−2.56−2.40−2.47
65DobrzycaWiesiółka−2.25−1.98−2.11
68DrawaDrawsko Pomorskie−0.94−0.98−0.35
69DrawaDrawno−1.52−1.00−1.46
70DrawaDrawiny−0.90−0.79−1.91
* Numbering of the gauges in accordance with Figure 1. Statistically significant trends at p < 0.05, p < 0.01, p < 0.001.
Table A2. The percent share of the synchronous and asynchronous occurrences of the annual (AMAXq), winter (WMAXq), and summer (SMAXq) maximum specific runoffs in respective gauges in relation to the Gorzów Wielkopolski gauge closing the Warta River catchment (WRC) (numbering of the gauges in accordance with Figure 1).
No.RiverGaugeANNUAL (XI–X) MAXIMAWINTER (XI–IV) MAXIMASUMMER (V–X) MAXIMA
S * (%)MA * (%)HA * (%)S * (%)MA * (%)HA * (%)S * (%)MA * (%)HA * (%)
2WartaPoraj46.1035.9617.9448.2637.3214.4256.6433.989.38
3WartaMstów51.4636.1612.3860.4632.407.1455.8834.209.92
5WartaDziałoszyn57.2633.509.2459.8632.327.8262.9831.026.00
6WartaBurzenin60.1832.547.2857.9033.368.7460.0033.226.78
7WartaSieradz61.0231.487.5062.4831.046.4867.6628.344.00
8WartaNowa Wieś Podgórna------72.4825.322.20
9WartaPoznań------77.1621.920.92
10WartaOborniki87.8212.100.08---77.1222.060.82
11WartaWronki------80.5819.040.38
12WartaSkwierzyna92.067.940.00---86.3813.560.06
14LiswartaNiwki51.1235.2213.6653.1435.0211.8455.7434.69.66
16OleśnicaNiechmirów66.529.963.5473.2624.761.9862.1831.186.64
18WidawkaRogoźno------58.5233.048.44
19WidawkaPodgórze59.4632.747.8063.1430.146.7261.7431.426.84
20GrabiaŁask57.8233.528.6663.9030.205.9056.2033.7610.04
21GrabiaGrabno55.8033.8810.3258.4033.308.3058.6232.089.30
23NerDąbie65.7030.124.18---68.3628.503.14
26Czarna StrugaTrąbczyn63.4630.925.6268.5828.602.8255.1833.9610.86
27WrześnicaSamarzewo72.5625.761.6872.2425.162.6059.7032.787.52
28ProsnaGorzów Śląski55.6034.3210.0861.4432.346.2261.0032.446.56
30ProsnaPiwonice69.0828.182.7475.4423.301.2661.6031.327.08
31ProsnaBogusław70.3027.042.6672.7825.421.8062.3031.146.56
32NiesóbKuźnica Skakawska62.7030.666.6461.7631.686.5655.2433.5811.18
33OłobokOłobok65.2230.124.6667.5629.043.4061.3831.067.56
34Kanał KościańskiKościan79.2420.340.4275.6222.821.5666.3429.244.42
35Kanał MosinskiMosina76.9422.300.7673.5824.581.8478.6620.600.74
36MogilnicaKonojad65.4030.524.0867.7228.224.0661.1231.587.30
37KopelGłuszyna68.5227.823.6669.4227.023.5663.7630.625.62
38CybinaAntoninek65.5830.204.2265.8229.204.9861.1032.446.46
40WełnaPruśce78.0821.040.8874.2624.041.7074.1224.181.70
41WełnaKowanówko73.3224.622.0674.5624.101.3471.3825.762.86
42FlintaRyczywół72.5425.082.3870.8426.582.58---
43SamaSzamotuły64.9830.504.5263.9029.906.2064.3830.085.54
44ObraZbąszyń63.4030.366.2466.4828.864.66---
45ObraBledzew------63.4430.725.84
47NotećŁysek74.4824.161.3671.3226.182.5074.4423.841.72
48NotećNoć Kalina69.5627.902.5463.7829.966.2675.1423.421.44
49NotećPakość 274.6623.961.3872.5425.182.2868.4028.203.40
50NotećUjście 172.9425.221.8473.7424.541.72---
52NotećKrzyż73.3624.721.9276.3022.401.30---
53NotećNowe Drezdenko73.5624.422.0277.3021.581.12---
54Noteć (Zachodni)Gębice---64.8829.785.34---
57GwdaGwda Wielka63.2430.746.0265.7429.045.2257.7233.368.92
58GwdaPtusza63.9830.545.4861.2032.106.7055.0233.2011.78
59GwdaPiła71.5225.682.8069.7827.622.6064.7030.205.10
60NizicaSzczecinek57.6833.169.1662.2031.326.4856.3034.349.36
61CzernicaCzarne62.0631.666.2862.6431.445.9257.2232.949.84
62CzarnaOkonek58.9632.948.1064.4230.225.3652.5634.1213.32
63PiławaNadarzyce51.8234.7813.4052.4635.0212.5251.1635.1813.66
68DrawaDrawsko Pomorskie57.6033.349.0663.4631.045.5055.6434.2010.16
69DrawaDrawno58.8232.868.3262.5031.066.4456.3633.969.68
70DrawaDrawiny57.8632.889.2664.0029.586.4258.1433.568.30
* Note: S—synchronicity; MA—moderate asynchronicity; HA—high asynchronicity; “-” means that the given data series were not analyzed due to the detected statistically significant trend (see Table A1).

References

  1. Budyko, M.I. The Heat Balance of the Earth’s Surface; U.S. Department of Commerce: Washington, DC, USA, 1958.
  2. Budyko, M.I. Climate and Life; Academic Press: New York, NY, USA, 1974. [Google Scholar]
  3. Donohue, R.J.; Roderick, M.L.; McVicar, T.R. On the importance of including vegetation dynamics in Budyko’s hydrological model. Hydrol. Earth Syst. Sci. 2007, 11, 983–995. [Google Scholar] [CrossRef] [Green Version]
  4. Liu, Q.; McVicar, T.R. Assessing climate change induced modification of Penman potential evaporation and runoff sensitivity in a large water-limited basin. J. Hydrol. 2012, 464, 352–362. [Google Scholar] [CrossRef]
  5. Greve, P.; Gudmundsson, L.; Orlowsky, B.; Seneviratne, S.I. The Budyko framework beyond stationarity. Hydrol. Earth Syst. Sci. Discuss. 2015, 12, 6799–6830. [Google Scholar] [CrossRef] [Green Version]
  6. Carmona, A.M.; Poveda, G.; Sivapalan, M.; Vallejo-Bernal, S.M.; Bustamante, E. A scaling approach to Budyko’s framework and the complementary relationship of evapotranspiration in humid environments: Case study of the Amazon River basin. Hydrol. Earth Syst. Sci. 2016, 20, 589–603. [Google Scholar] [CrossRef] [Green Version]
  7. Du, L.; Rajib, A.; Merwade, V. Large scale spatially explicit modeling of blue and green water dynamics in a temperate mid-latitude basin. J. Hydrol. 2018, 562, 84–102. [Google Scholar] [CrossRef]
  8. Sklar, A. Fonction de re’ partition a’ n dimensions et leurs marges; Publications de L’Institute de Statistique de l’Université de Paris: Paris, France, 1959; Volume 8, pp. 229–231. [Google Scholar]
  9. Pitera, M. Application of the Copula Function in Finance and Statistics, with Special Regard to the Valuation of Instruments Based on Credit Risk and Debt Instruments. Master’s Thesis, Jagiellonian University, Kraków, Poland, 2010. (In Polish). [Google Scholar]
  10. Kharoubi-Rakotomalala, C.; Maurer, F. Copulas in Finance Ten Years Later. J. Appl. Bus. Res. 2013, 29, 1555–1566. [Google Scholar] [CrossRef]
  11. Zhang, J.; Ding, Z.; You, J. The joint probability distribution of runoff and sediment and its change characteristics with multi-time scales. J. Hydrol. Hydromech. 2014, 62, 218–225. [Google Scholar] [CrossRef] [Green Version]
  12. Zhou, N.Q.; Zhao, L.; Shen, X.P. Copula-based Probability Evaluation of Rich-Poor Runoff and Sediment Encounter in Dongting Lake Basin. Sci. Geogr. Sin. 2014, 34, 242–248. (In Chinese) [Google Scholar] [CrossRef]
  13. You, Q.; Jiang, H.; Liu, Y.; Liu, Z.; Guan, Z. Probability Analysis and Control of River Runoff–sediment Characteristics based on Pair-Copula Functions: The Case of the Weihe River and Jinghe River. Water 2019, 11, 510. [Google Scholar] [CrossRef] [Green Version]
  14. Gu, H.; Yu, Z.; Li, G.; Ju, Q. Nonstationary Multivariate Hydrological Frequency Analysis in the Upper Zhanghe River Basin, China. Water 2018, 10, 772. [Google Scholar] [CrossRef] [Green Version]
  15. Chen, J.; Gu, S.X.; Zhang, T. Synchronous-Asynchronous Encounter Probability Analysis of High-Low Runoff for Jinsha River, China, using Copulas. MATEC Web Conf. 2018, 246, 01094. [Google Scholar] [CrossRef]
  16. Plewa, K.; Perz, A.; Wrzesiński, D.; Sobkowiak, L. Probabilistic Assessment of Correlations of Water Levels in Polish Coastal Lakes with Sea Water Level with the Application of Archimedean Copulas. Water 2019, 11, 1292. [Google Scholar] [CrossRef] [Green Version]
  17. Perz, A.; Plewa, K. Synchronous Occurrence of Mean Water Levels of Coastal Lakes and the Baltic Sea. Bad. Fizjogr. Ser. A Geogr. Fiz. 2019, A70, 65–82. (In Polish) [Google Scholar]
  18. Fan, L.L.; Wang, H.R.; Wang, C.; Lai, W.L.; Zhao, Y. Exploration of Use of Copulas in Analysing the Relationship between Precipitation and Meteorological Drought in Beijing, China. Adv. Meteorol. 2017, 43, 1–11. [Google Scholar] [CrossRef]
  19. Liu, C.; Zhang, Q.; Singh, V.P.; Cui, Y. Copula-based evaluations of drought variations in Guangdong, South China. Nat Hazards 2011, 59, 1533–1546. [Google Scholar] [CrossRef]
  20. Okoński, B. Radial Growth of Pedunculate Oak and European Ash on Active River Terraces. Hydrologic and Climatic Controls. Infrastruct. Ecol. Rural Areas 2017, III/1, 1075–1091. [Google Scholar] [CrossRef]
  21. Kaniecki, A. Poznań. History of the City Written with Water; Wydawnictwo PTPN: Poznań, Poland, 2005. (In Polish) [Google Scholar]
  22. Sobkowiak, L. Changes in water relations in the area of Poznań. In Waters of the Greater Poland Region; Choiński, A., Ed.; Wydawnictwo Naukowe UAM: Poznań, Poland, 2019. (In Polish) [Google Scholar]
  23. Łabędzki, L.; Kanecka-Geszke, E.; Bąk, B.; Słowińska, S. Estimation of Reference Evapotranspiration Using the FAO Penman-Monteith Method for Climatic Conditions of Poland; Institute of Technology and Life Sciences: Falenty, Poland, 2011; Available online: https://www.intechopen.com/books/evapotranspiration/estimation-of-reference-evapotranspiration-using-the-fao-penman-monteith-method-for-climatic-conditi (accessed on 8 May 2020). [CrossRef] [Green Version]
  24. Woś, A. Climate of Poland in the Second Half of the 20th Century; Wydawnictwo Naukowe UAM: Poznań, Poland, 2010. (In Polish) [Google Scholar]
  25. Kundzewicz, Z.W.; Chałupka, M. Low Flows of the River Warta, Poland—Risk and Uncertainty Aspects. Modelling and Management of Sustainable Basin-Scale Water Resource Systems (Proceedings of a Boulder Symposium, July 1995); IAHS Publ.: Wallingford, UK, 1995; No. 231. [Google Scholar]
  26. Szwed, M.; Karg, G.; Pińskwar, I.; Radziejewski, M.; Graczyk, D.; Kędziora, A.; Kundzewicz, Z.W. Climate change and its effect on agriculture, water resources and human health sectors in Poland. Nat. Hazards Earth Syst. Sci. 2010, 10, 1725–1737. [Google Scholar] [CrossRef]
  27. Kozek, M. Spatial Variability of Low Flows in the Upper Warta River Catchment. Acta Sci. Pol. Formatio Circumiectus 2018, 17, 67–76. [Google Scholar] [CrossRef]
  28. Kozek, M.; Tomaszewski, E. Selected Characteristics of Hydrological Drought Progression in the Upper Warta River Catchment. Acta Sci. Pol. Formatio Circumiectus 2018, 17, 77–87. [Google Scholar] [CrossRef]
  29. Wrzesiński, D. The Seasonal Structure of the River Runoff in Selected Catchments of the Warta River Drainage Basin. Quaest. Geogr. 2000, 21, 97–110. [Google Scholar]
  30. Wrzesiński, D. Parametrization of Base Flows of the Warta Drainage Basin. Physiogr. Res. West. Pol. Ser. A Phys. Geogr. 2001, 52, 148–191. (In Polish) [Google Scholar]
  31. Jokiel, P. Seasonal and long-term variability of water balance elements in Central Poland. In Water Resources of Central Poland at the Beginning of the 21st Century; Jokiel, P., Ed.; Wydawnictwo UŁ: Łódź, Poland, 2004. (In Polish) [Google Scholar]
  32. Graczyk, D.; Kundzewicz, Z.W.; Szwed, M. Variability of change in the flow of the river Warta 1822–1994. In Detecting Changes of Climate and Hydrological Processes; Kundzewicz, Z.W., Radziejewski, M., Eds.; Wydawnictwo Sorus, Research Center for Agricultural and Forest Environment: Poznan, Poland, 2002. (In Polish) [Google Scholar]
  33. Ilnicki, P.; Farat, R.; Górecki, K.; Lewandowski, P. Impact of climatic change on river discharge in the driest region of Poland. Hydrol. Sci. J. 2014, 59, 1117–1134. [Google Scholar] [CrossRef] [Green Version]
  34. Miler, A.T. Variability of the Warta River water discharge in the city of Poznań as influenced by the Jeziorsko reservoir. Arch. Environ. Prot. 2015, 41, 53–59. [Google Scholar] [CrossRef] [Green Version]
  35. Wrzesiński, D.; Perz, A. Trends in river runoff changes. In Waters of the Greater Poland Region; Choiński, A., Ed.; Wydawnictwo Naukowe UAM: Poznań, Poland, 2019. (In Polish) [Google Scholar]
  36. Wrzesiński, D. Impact of Man-Made Processes on the River Flow with Special Attention Paid to Extreme Phenomena: The Case of The Kiełbaska and Widawka River Catchments. Physiogr. Res. West. Pol. Ser. A Phys. Geogr. 1996, 47, 127–141. (In Polish) [Google Scholar]
  37. Wrzesiński, D. Detection of changes in the hydrological regime of the Warta in the Poznań profile over the years 1822-2005. In River Outflow and Its Regional Conditions; Wrzesiński, D., Ed.; Bogucki Wydawnictwo Naukowe: Poznań, Poland, 2010. (In Polish) [Google Scholar]
  38. Kałuża, T.; Sroka, Z.; Lewandowska, J. Impact of Decreasing the Normal Damming Level of the Jeziorsko Reservoir on Low Flows in the Warta River. Acta Sci. Pol. Formatio Circumiectus 2017, 16, 107–122. [Google Scholar] [CrossRef] [Green Version]
  39. Wrzesiński, D.; Sobkowiak, L. Detection of changes in flow regime of rivers in Poland. J. Hydrol. Hydromech. 2018, 66, 55–64. [Google Scholar] [CrossRef] [Green Version]
  40. Ilnicki, P.; Górecki, K.; Melcer, B. Eutrophication of Rivers in the Warta Catchment in 1992–2002; University of Life Sciences: Poznań, Poland, 2008. (In Polish) [Google Scholar]
  41. Peel, M.C.; Finlayson, B.L.; McMahon, T.A. Updated world map of the Köppen-Geiger climate classification. Hydrol. Earth Syst. Sci. 2007, 11, 1633–1644. [Google Scholar] [CrossRef] [Green Version]
  42. Pasławski, Z.; Koczorowska, J.; Olejnik, K. Average Outflow in the Warta River Catchment. Water Manag. 1972, 6, 214–218. (In Polish) [Google Scholar]
  43. Wrzesiński, D.; Perz, A. Detection of Changes in the Flow Regime of Rivers in Poland. Physiogr. Res. West. Pol. Ser. A Phys. Geogr. 2016, 67, 289–304. [Google Scholar] [CrossRef] [Green Version]
  44. Dynowska, I. Types of River Regimes in Poland. Zeszyty Naukowe UJ, Prace Geograficzne 28; Wydawnictwo UJ: Kraków, Poland, 1971. (In Polish) [Google Scholar]
  45. Orsztynowicz, J. Groundwater Outflow of Polish Rivers. Water Manag. 1973, 5, 168–173. (In Polish) [Google Scholar]
  46. Paszczyk, J.L. The Role of Groundwater in the River Outflow and the Water Balance of Poland; Wydawnictwo UMCS: Lublin, Poland, 1975. (In Polish) [Google Scholar]
  47. Gutry-Korycka, M. Structure of Poland’s Natural Water Balance (1931–1960. Prace i Studia Geograficzne, 7, Studia Hydrologiczne; Wydawnictwo UW: Warszawa, Poland, 1985. (In Polish) [Google Scholar]
  48. Tomaszewski, E. Seasonal Changes of the Groundwater Outflow in Poland in 1971–1990. Acta Geogr. Lodz. 2001, 79. (In Polish) [Google Scholar]
  49. Bogdanowicz, R. Hydrological Conditions of Transport of Selected Nitrogen and Phosphorus Compounds by the Oder and Vistula Rivers and the Przymorze Rivers to the Baltic Sea; Wydawnictwo UG: Gdańsk, Poland, 2004. (In Polish) [Google Scholar]
  50. Dynowska, I. Regime of River Flow Sheet: 32.3. In Atlas of the Republic of Poland; IG PZ PAN: Warsaw, Poland, 1994. (In Polish) [Google Scholar]
  51. Rotnicka, J. A Typology of Hydrological Periods for Use in River Regime Studies. Quaest. Geogr. 1993, 15/16, 77–95. [Google Scholar]
  52. Kendall, M. Rank Correlation Methods; Griffin & Co.: London, UK, 1975. [Google Scholar]
  53. Önöz, B.; Bayazit, M. The power of statistical tests for trend detection. Turk. J. Eng. Environ. Sci. 2003, 27, 247–251. [Google Scholar]
  54. Partal, T.; Küçük, M. Long-term trend analysis using discrete wavelet components of annual precipitations measurements in Marmara region (Turkey). Phys. Chem. Earth Parts A/B/C 2006, 31, 1189–1200. [Google Scholar] [CrossRef]
  55. Karmakar, S.; Simonovic, S.P. Flood Frequency Analysis Using Copula with Mixed Marginal Distributions; Water Resources Research Report, Report No: 055; The University of Western Ontario: London, ON, Canada, 2007. [Google Scholar]
  56. Akaike, H. A new look at the statistical model identification. IEEE Trans. Autom. Control 1974, 19, 716–722. [Google Scholar] [CrossRef]
  57. Nelsen, R.B. An Introduction to Copulas; Springer Series in Statistics; Springer: New York, NY, USA, 1999. [Google Scholar]
  58. Chen, L.; Guo, S.L. Copulas and Its Application in Hydrology and Water Resources; Springer Water; Springer: Singapore, 2019. [Google Scholar]
  59. Genest, C.; Favre, A.-C. Everything you always wanted to know about copula Modeling but were afraid to ask. J. Hydrol. Eng. 2007, 12, 347–368. [Google Scholar] [CrossRef]
  60. Genest, C.; Rivest, L.-P. Statistical inference procedure for bivariate Archimedean copulas. J. Am. Stat. Assoc. 1993, 88, 1034–1043. [Google Scholar] [CrossRef]
  61. Ozga-Zielińska, M.; Brzeziński, J.; Ozga-Zieliński, B. Rules for Calculating the Maximum Annual Flows with a Specified Probability of Exceedance in Designing Hydrotechnical Facilities; Long Flow Measurement Series; Wydawnictwo IMGW: Warsaw, Poland, 1999. (In Polish) [Google Scholar]
  62. Kuchment, L.S.; Demidov, V.N. On the application of copula theory for determination of probabilistic characteristics of springflood. Russ. Meteorol. Hydrol. 2013, 38, 263–271. [Google Scholar] [CrossRef]
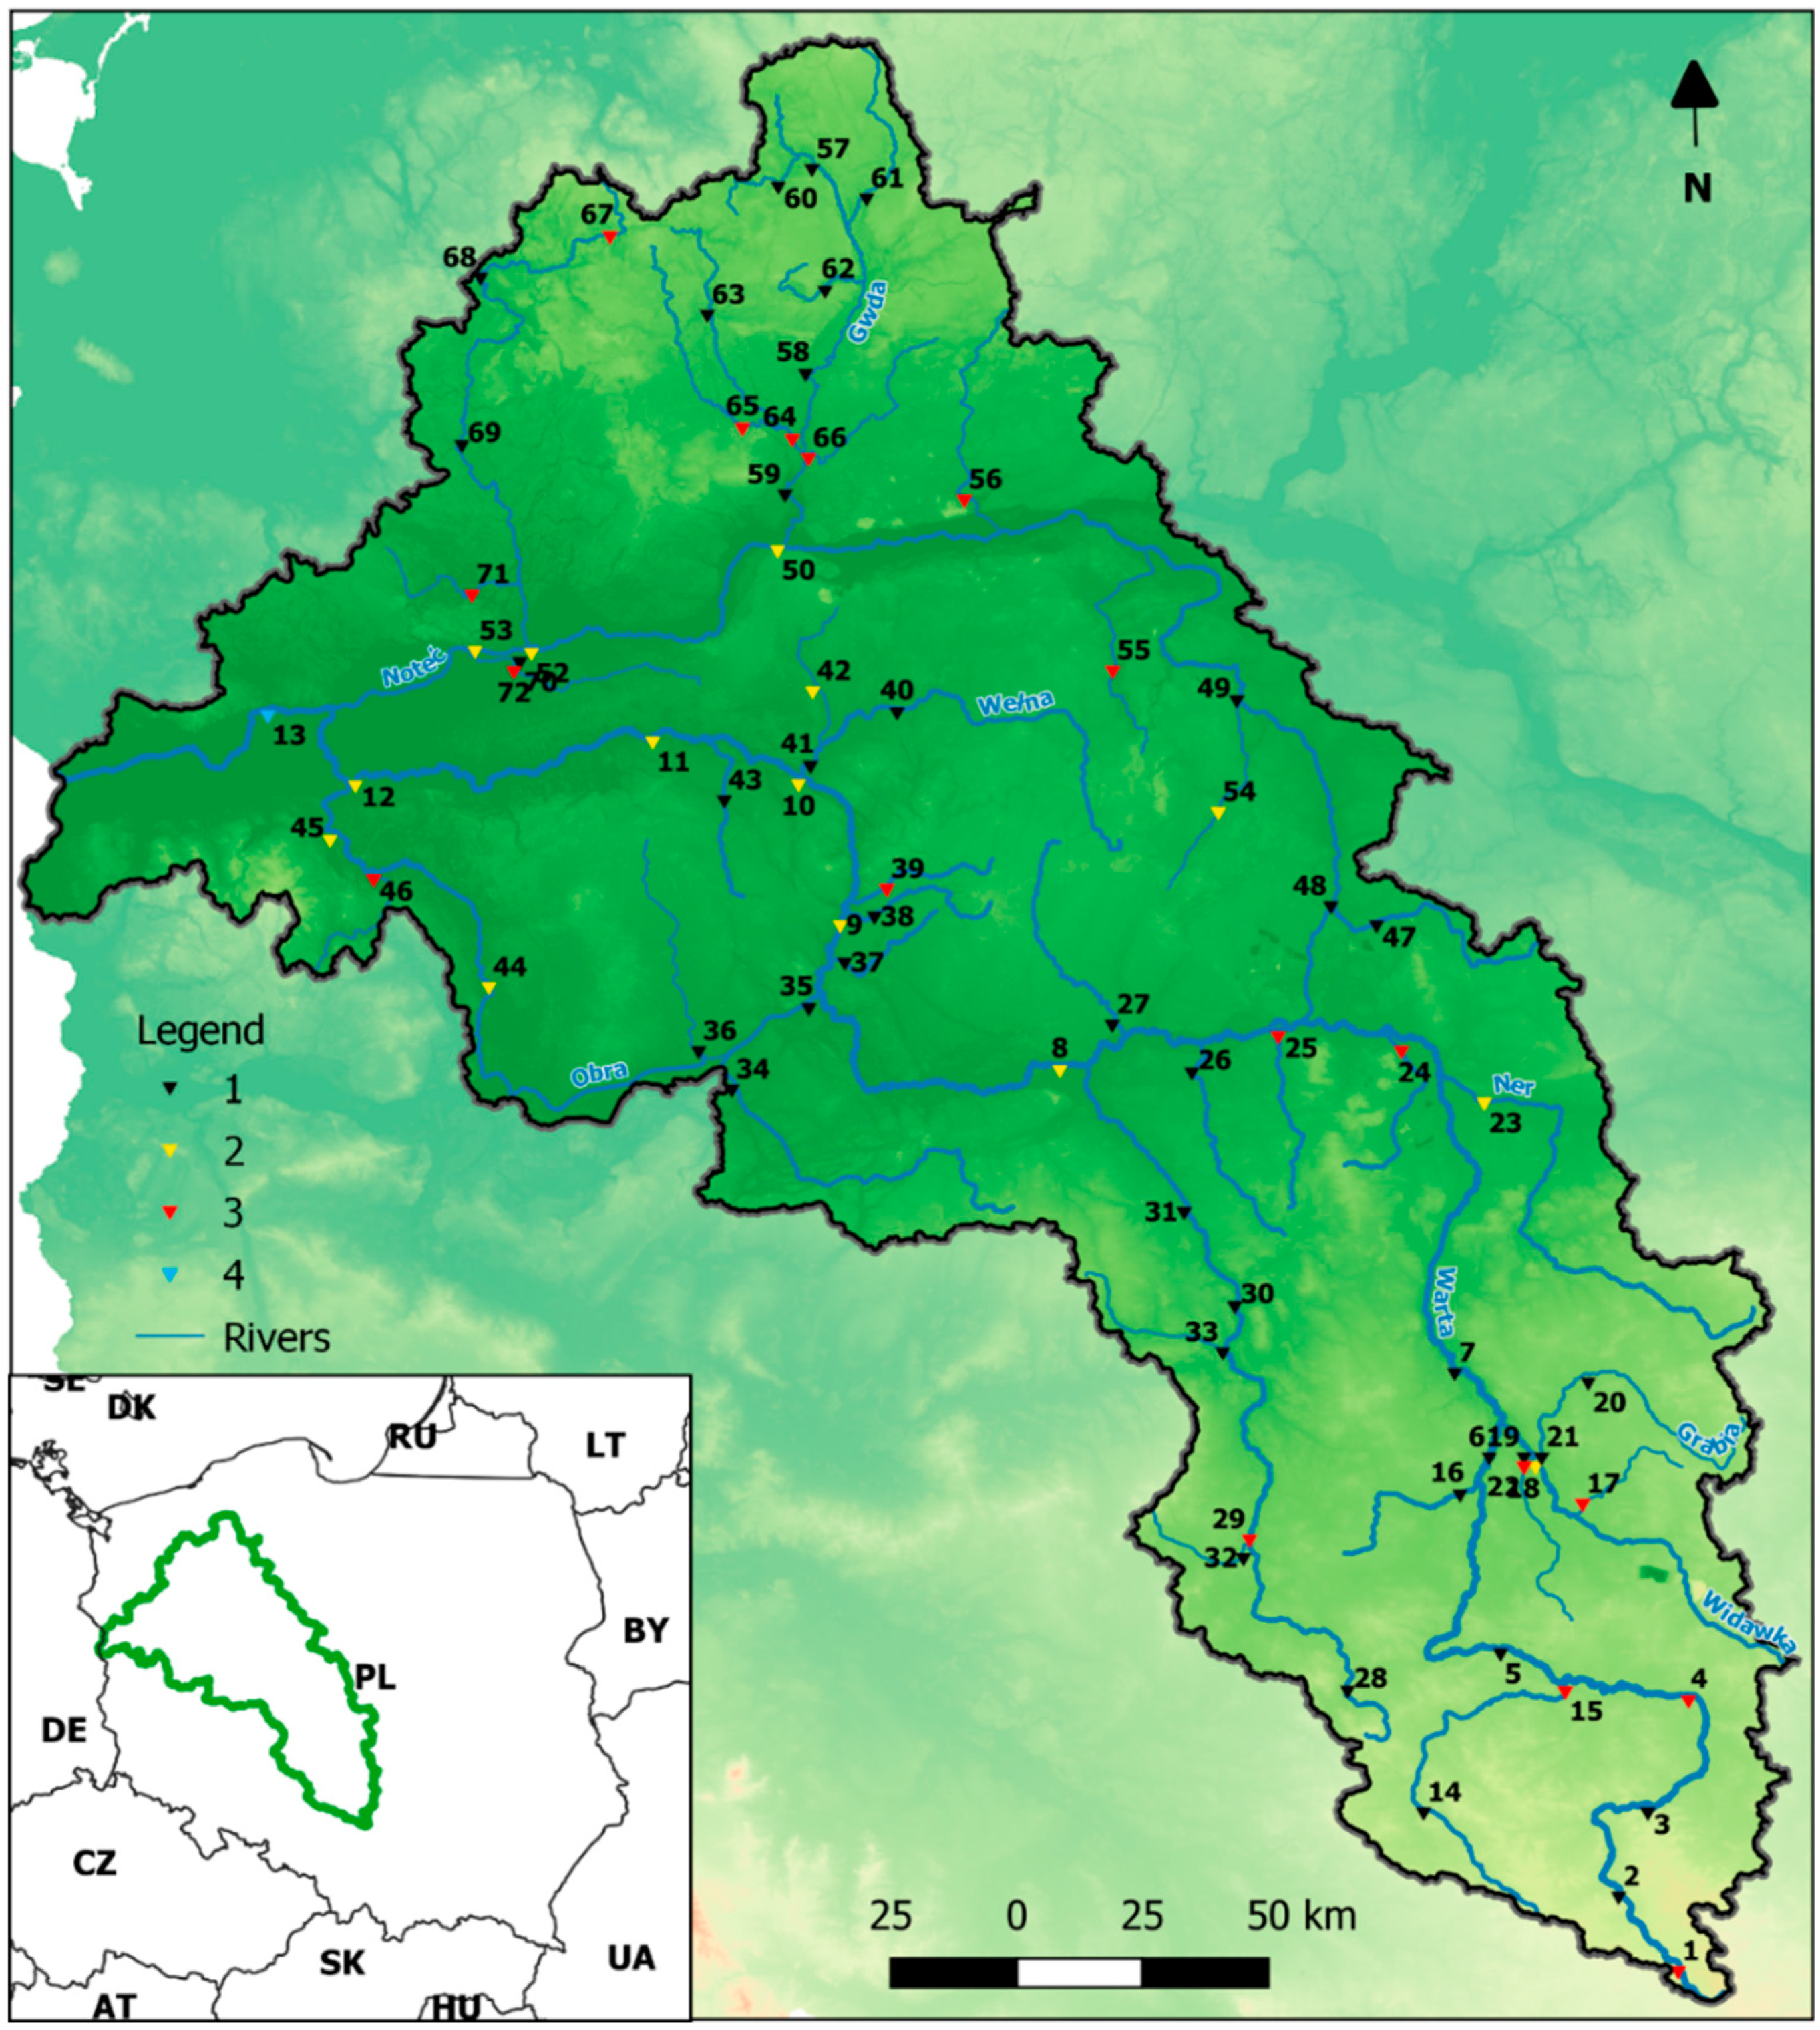
Figure 1. Location of water gauges in the Warta River catchment (numbering of gauges in accordance with Table 1): 1—gauges with full continuity of source data and with statistically insignificant trends in all analyzed periods, 2—gauges with full continuity of source data and with statistically significant trends in one or two analyzed periods, 3—gauges excluded from final analysis, i.e., gauges with incomplete source data or with statistically insignificant trends in all analyzed periods, 4—gauge Gorzów Wielkopolski closing the Warta River catchment.
Water 12 01782 g001
Figure 2. Example of combined accumulated curves of the probability of exceedance of the maximum specific runoffs and the determination of sectors (1–9) with their various degrees of synchronicity or asynchronicity.
Water 12 01782 g002
Figure 3. Copula plots of gauges with the maximum synchronicity and asynchronicity of the maximum runoffs in analyzed periods.
Water 12 01782 g003
Figure 4. The percent share of separated types of the annual maximum specific runoff (AMAXq) dependencies between analyzed sub-catchments and the Gorzów Wielkopolski gauge closing the Warta River catchment (WRC) (in the hydrographic order).
Water 12 01782 g004
Figure 5. The pie charts showing the percent share of the synchronous and asynchronous occurrences of the annual maximum specific runoffs (AMAXq) in the Warta River catchment (WRC).
Water 12 01782 g005
Figure 6. The percent share of separated types of the winter maximum specific runoff (WMAXq) dependencies between analyzed sub-catchments and the Gorzów Wielkopolski gauge closing the Warta River catchment (WRC) (in the hydrographic order).
Water 12 01782 g006
Figure 7. The pie charts showing the percent share of the synchronous and asynchronous occurrences of the winter maximum specific runoffs (WMAXq) in the Warta River catchment (WRC).
Water 12 01782 g007
Figure 8. The percent share of separated types of the summer maximum specific runoff (SMAXq) dependencies between analyzed sub-catchments and the Gorzów Wielkopolski gauge closing the Warta River catchment (WRC) (in the hydrographic order).
Water 12 01782 g008
Figure 9. The pie charts showing the percent share of the synchronous and asynchronous occurrences of the summer maximum specific runoffs (SMAXq) in the Warta River catchment (WRC).
Water 12 01782 g009
Table 1. Major characteristics and flow regime of the analyzed rivers in the Warta River catchment in 1971–2010.
No.RiverGaugeCatchment Area A (km2)Total Flow H (mm)Groundwater FlowFlow Variability (Cv)Flow IrregularityType of River Regime *
(mm)(%)DailyAnnualMinMax
1WartaKręciwilk6638426268.20.6100.2260.2050.548441
2WartaPoraj39023312556.30.8810.3790.2950.8381011
3WartaMstów98820512360.30.7610.3170.2500.579712
4WartaBobry180019312466.10.6680.3170.4570.5732452
5WartaDziałoszyn408819213266.80.6470.2650.2340.552352
6WartaBurzenin543718612567.00.6300.2740.2520.599352
7WartaSieradz814017712567.70.5990.2480.2040.495272
8WartaNowa Wieś Podgórna20,7631469564.70.6120.2770.2810.527292
9WartaPoznań25,1261288764.30.6210.2950.2670.518292
10WartaOborniki26,7891358764.10.6260.2960.2780.489302
11WartaWronki30,6841298364.50.6360.3090.2490.503252
12WartaSkwierzyna31,2681278866.20.6200.3030.2540.505252
13WartaGorzów Wielkopolski52,1861279774.00.5200.2640.2510.408172
14LiswartaNiwki21822111452.40.9310.2490.3360.4311682
15LiswartaKule15571599356.00.8690.2970.3450.6071152
16OleśnicaNiechmirów5921325642.11.3620.4430.3990.7213123
17WidawkaSzczerców72124920783.10.4100.2500.3500.670342
18WidawkaRogoźno126820817074.70.5240.2440.3020.525311
19WidawkaPodgórze235418612865.90.6890.2600.3270.491541
20GrabiaŁask4721809653.41.0610.3050.3930.5751923
21GrabiaGrabno8111658248.31.1100.3290.3340.5231153
22NiecieczWidawa2421314836.91.4680.5420.9180.71610,2673
23NerDąbie171218911355.50.7200.2750.3780.4171162
24KiełbaskaKościelec47616712767.80.5470.2230.3330.486342
25PowaPosoka3321134438.61.3350.4340.6580.86135503
26Czarna StrugaTrąbczyn4231154034.21.4340.4890.8130.72130433
27WrześnicaSamarzewo360933739.01.3290.5450.5930.6842783
28ProsnaGorzów Śląski1641719253.91.3580.2700.3070.7034072
29ProsnaMirków12551306447.71.0180.2860.3800.5411562
30ProsnaPiwonice29381236852.10.9590.3160.3860.5741272
31ProsnaBogusław43041186149.50.9680.3420.3560.5791312
32NiesóbKuźnica Skakawska2461236752.41.0520.2830.4010.7175543
33OłobokOłobok4471154741.61.2870.3860.4450.5475503
34Kanał KościańskiKościan1247984344.61.0040.5060.8700.6033343
35Kanał MosinskiMosina2492784051.21.0210.5130.7270.5462443
36MogilnicaKonojad663772633.11.4400.6530.7040.79713253
37KopelGłuszyna3691053636.31.2880.5320.5940.6117053
38CybinaAntoninek1711075854.50.9360.4420.8340.54117073
39GłównaWierzenica2221023837.51.1850.5930.6700.67918003
40WełnaPruśce1130955252.71.0320.5560.6810.7474103
41WełnaKowanówko25971075350.71.0680.5500.6380.7741823
42FlintaRyczywół276753546.51.1700.5220.8830.5557283
43SamaSzamotuły395853843.31.3620.6730.8020.94510253
44ObraZbąszyń12911115653.10.8420.4310.7300.4071583
45ObraBledzew26181116056.00.6570.3390.5370.320492
46PaklicaMiędzyrzecz2791146456.20.6150.2560.6920.3591662
47NotećŁysek306894349.61.1260.5680.8140.77311,1003
48NotećNoć Kalina440995454.10.9770.4700.5590.6273343
49NotećPakość 216201106359.50.9790.5880.5620.8781312
50NotećUjście 16308945356.00.7190.4370.4720.432522
51NotećUjście 211,2551329773.30.4620.2680.2530.292112
52NotećKrzyż12,6101349872.90.4510.2610.2550.275112
53NotećNowe Drezdenko15,97014411678.10.3940.2160.2020.27092
54Noteć (Western)Gębice1821095554.80.9260.5190.7470.7423932
55GąsawkaŻnin1481166655.50.9520.5440.7870.67117133
56ŁobżonkaWyrzysk6351276049.60.8800.4000.4800.4703522
57GwdaGwda Wielka42625920579.20.5250.2820.2590.363232
58GwdaPtusza205217412269.30.3780.1860.1830.246102
59GwdaPiła470418114477.60.3530.1770.2180.24482
60NizicaSzczecinek16116510463.90.7610.3390.5390.38122802
61CzernicaCzarne41121114769.90.5970.2700.1910.487182
62CzarnaOkonek1041136153.50.9930.3310.4400.6482092
63PiławaNadarzyce34723220588.10.2830.1530.2770.230101
64PiławaZabrodzie136817815184.10.3300.1900.2400.27081
65DobrzycaWiesiółka89216112882.30.4010.2070.2180.445112
66GłomiaDobrzyca5691579560.40.7170.2720.3790.5531642
67DrawaStare Drawsko6720110451.41.0640.4760.4780.6552403
68DrawaDrawsko Pomorskie60921516171.10.5540.2360.2890.334222
69DrawaDrawno126722618481.40.3840.1890.2380.253102
70DrawaDrawiny329820518288.90.2800.1230.1940.23361
71Mierzęcka StrugaMierzęcin5331048379.50.5000.2230.4260.305692
72MiałaChełst29213610879.60.3720.2010.3620.269441
* Types of river flow regimes: 1—nival weakly developed, 2—nival moderately developed, 3—nival strongly developed. Source: after [43], modified.
Table 2. Copula function, parameter space, generating function Φ(t), and functional relationship of Kendall’s τθ with a copula parameter for selected single-parameter bivariate Archimedean copulas.
Copula Family C θ ( u , v ) Generator   ϕ ( t ) Parameter   θ Kendall s   τ θ
Clayton m a x ( ( u θ + v θ 1 ) 1 θ , 0 ) 1 θ ( t θ 1 ) [ 1 , ) \ { 0 } τ = θ / ( 2 + θ )
Gumbel–Hougaard e x p { [ ( l n   u ) θ + ( l n   v ) θ ] 1 θ } ( ln t ) θ [ 1 , ) ( θ 1 ) / θ
Frank 1 θ l n [ 1 + ( e θ u 1 ) ( e θ v 1 ) e θ 1 ] l n e θ t 1 e θ 1 ( , ) \ { 0 } 1 + 4 [ D 1 ( θ ) 1 ] / θ