Article

Assessment of Future Water Demand and Supply under IPCC Climate Change and Socio-Economic Scenarios, Using a Combination of Models in Ourika Watershed, High Atlas, Morocco

by
Houssam Ayt Ougougdal
1,*,
Mohamed Yacoubi Khebiza
1,
Mohammed Messouli
1 and
Asia Lachir
1,2
1
Department of Environmental Sciences, Cadi Ayyad University, Marrakech 40-000, Morocco
2
National School of Architecture-Agadir, New University Complex, Marrakech 80-000, Morocco
*
Author to whom correspondence should be addressed.
Water 2020, 12(6), 1751; https://doi.org/10.3390/w12061751
Submission received: 18 May 2020 / Revised: 13 June 2020 / Accepted: 15 June 2020 / Published: 19 June 2020

Abstract

:
Climate change will affect the water resources system, on global and regional levels. Over the past thirty years, the High Atlas Mountains in Morocco have experienced severe droughts, which causes a decrease in water supply that affects both agriculture and the urban water system. In this paper, we assess the impact of climate change and socio-economic activities on water supply and demand in the Ourika watershed (High Atlas of Morocco), then we evaluate the efficiency and sustainability of regional adaptation strategies for water supply management. For this, we simulate and analyze the future water situation using the statistical downscaling model (SDSM) and the water assessment and planning tool (WEAP). After the model’s calibration and validation, the precipitation, minimum (Tmin) and maximum (Tmax) temperatures, water demand and unmet water demand were projected for 2100 horizon, using different climate change scenarios. The results revealed that the model’s performance, calibration and validation were found to be satisfactory. The analysis shows that the mean precipitation will decrease by 49.25% and 34.61% by 2100, under A2 and B2 emission scenarios of the Intergovernmental Panel on Climate Change (IPCC). The projected mean Tmax and Tmin will be warmer than the baseline period, with Tmax increasing by 4.2 °C (A2) and 3.6 °C (B2), and Tmin by 3.5 °C (A2) and 2.9 °C (B2) by 2100. The results also show that water demand and the unmet water demand will increase in all scenarios, the pressure on water resources will increase, leading to water scarcity. The results reveal that, under the influence of climate change, future unmet water demand is expected to reach 64 million cubic meters (MCM) by 2100. The results demonstrate that the assessments of the proposed adaptation strategies are effective, but not sufficient to ensure water sustainability for the Ourika watershed.

1. Introduction

Climate change is unequivocal, global and will have severe consequences, even under the most optimistic scenario [1]. Among the most important impacts of climate change are the rise in surface temperature and the reduction in precipitation in some regions [2] and declining water quantity and quality [3,4]. Indeed, water resources are the most vulnerable to climate change [5]. It is estimated that more than a third of the world’s population (∼2.4 billion people for 2000) live in countries under water stress and this will rise to two thirds by 2025 [6]. Climate change, population growth, and economic activities are leading to water scarcity, an unpleasant situation in which demand for water increases beyond water supply [7]. Previous studies have considered the Mediterranean region as a global “hot spot” in terms of climate change, where precipitation is likely to decrease with increasing temperatures [8,9,10]. They are among the countries most threatened by water stress, due to the extreme interannual, spatial, and temporal variability of water resources and the decrease in water inflows expected in the coming decades [11]. When problems related to water quantity and quality occur, it can have repercussions, not only on flora and fauna, but also on the economy, health and well-being of the human population.
Located in one of the driest regions of the world, Morocco stands out as one of the most vulnerable countries to climate change [12]. It has extremely low water resources, a low per capita supply of fresh water, and is considered one of the most stressed countries in terms of water resources, due to rapid population growth. The renewable freshwater per capita is below the United Nations “absolute water scarcity” level. In this context of water scarcity, the gap between supply and demand will widen in the years ahead. Morocco is highly dependent on surface water resources, notably for its agricultural sector [9]. The share of agriculture in the national economy is considerable at 8 billion USD, which corresponds to 14.5% of gross domestic product (GDP) for 2014. Water scarcity is a limiting factor in local economic development. The first effects are already visible in the Ourika watershed, where water resources are limited to start with, and are decreasing in both quantity and quality under the combination of decreasing supply and a growing population. Decrease in the river streamflow, agriculture and increased tourism flux are putting even more pressure on the Ourika water resource. An analysis of climate data over the last decades shows an increase in average temperature of 0.76 °C (1990–2001 and 2002–2014), and a decrease in precipitation and the proportion of snow.
Therefore, there is an urgent need to quantify the possible climate change impacts on water resources in this region. Despite the importance of this issue to local population and regional agriculture, to date there are no studies assessing the impact of climate change on water supply and demand using the outputs of global climate models (GCMs).
The water resources of a region depend on both the rainfall amount and temperature. Therefore, for estimating the future impact of climate change, GCMs are used to simulate the climate system. Projections of future climate change are made using a hierarchy of climate models that simulate changes in a response to a set of anthropogenic forcing’s scenarios [13]. The results of the GCMs are based on a large-scale grid resolution (>250 km) [14]. Because of this coarse spatial resolution, the output of GCMs needs downscaling, in order to be used to study the environmental and hydrological impacts of climate change at regional and local levels [15,16].
Hydrological models allow one to study the relationship between climate and water resources [17]. Scientists around the world have used various hydrological models for water resource assessments. For example, the soil and water assessment tool (SWAT) watershed model [18], the water resources management model (WRMM) [19], the JAMS J2000 framework [20], the spatial agro hydro salinity model (SAHYSMOD) [21], the modular simulator (ModSim) [22], the hydrologic land-surface processes of mass and energy transfer model (PROMET) [23], and the water assessment and planning tool (WEAP), which has been widely used in different basins of the world in recent decades [24].
To analyze the impact of climate change and different socio-economic scenarios on water supply and demand in the Ourika watershed, and to improve decision-making capacities in water resource management, the WEAP hydrological model was used. The WEAP model has been used in previous studies around the world [25,26], and in Africa [27,28,29]. The objective of this study is to explore the incidence of climate change and socio-economic scenarios on water supply and demand, in the Ourika watershed up to the year 2100, and to analyze the sustainability of the proposed adaptation measures to climate change. In this study, therefore, the statistical downscaling model (SDSM) is used to produce high resolution climate data, using the large-scale climate variables derived from GCMs. The statistically downscaled results are then used to drive the WEAP model. The impact of future climate change and socio-economic scenarios are evaluated by comparing various WEAP responses to different climate projection scenarios and baseline conditions. This study’s results are necessary to address future problems threatening a region where 80% of its surface water is used for agriculture. This sector is particularly vulnerable to extensive anthropogenic activities, climate change and its consequent variability in climate and climate extremes, such as droughts and floods. The Ourika watershed is known to face a decreasing trend in rainfall, especially during the rainy season, the availability and quality of water resources, environmental degradation, and population growth.

2. Materials and Methods
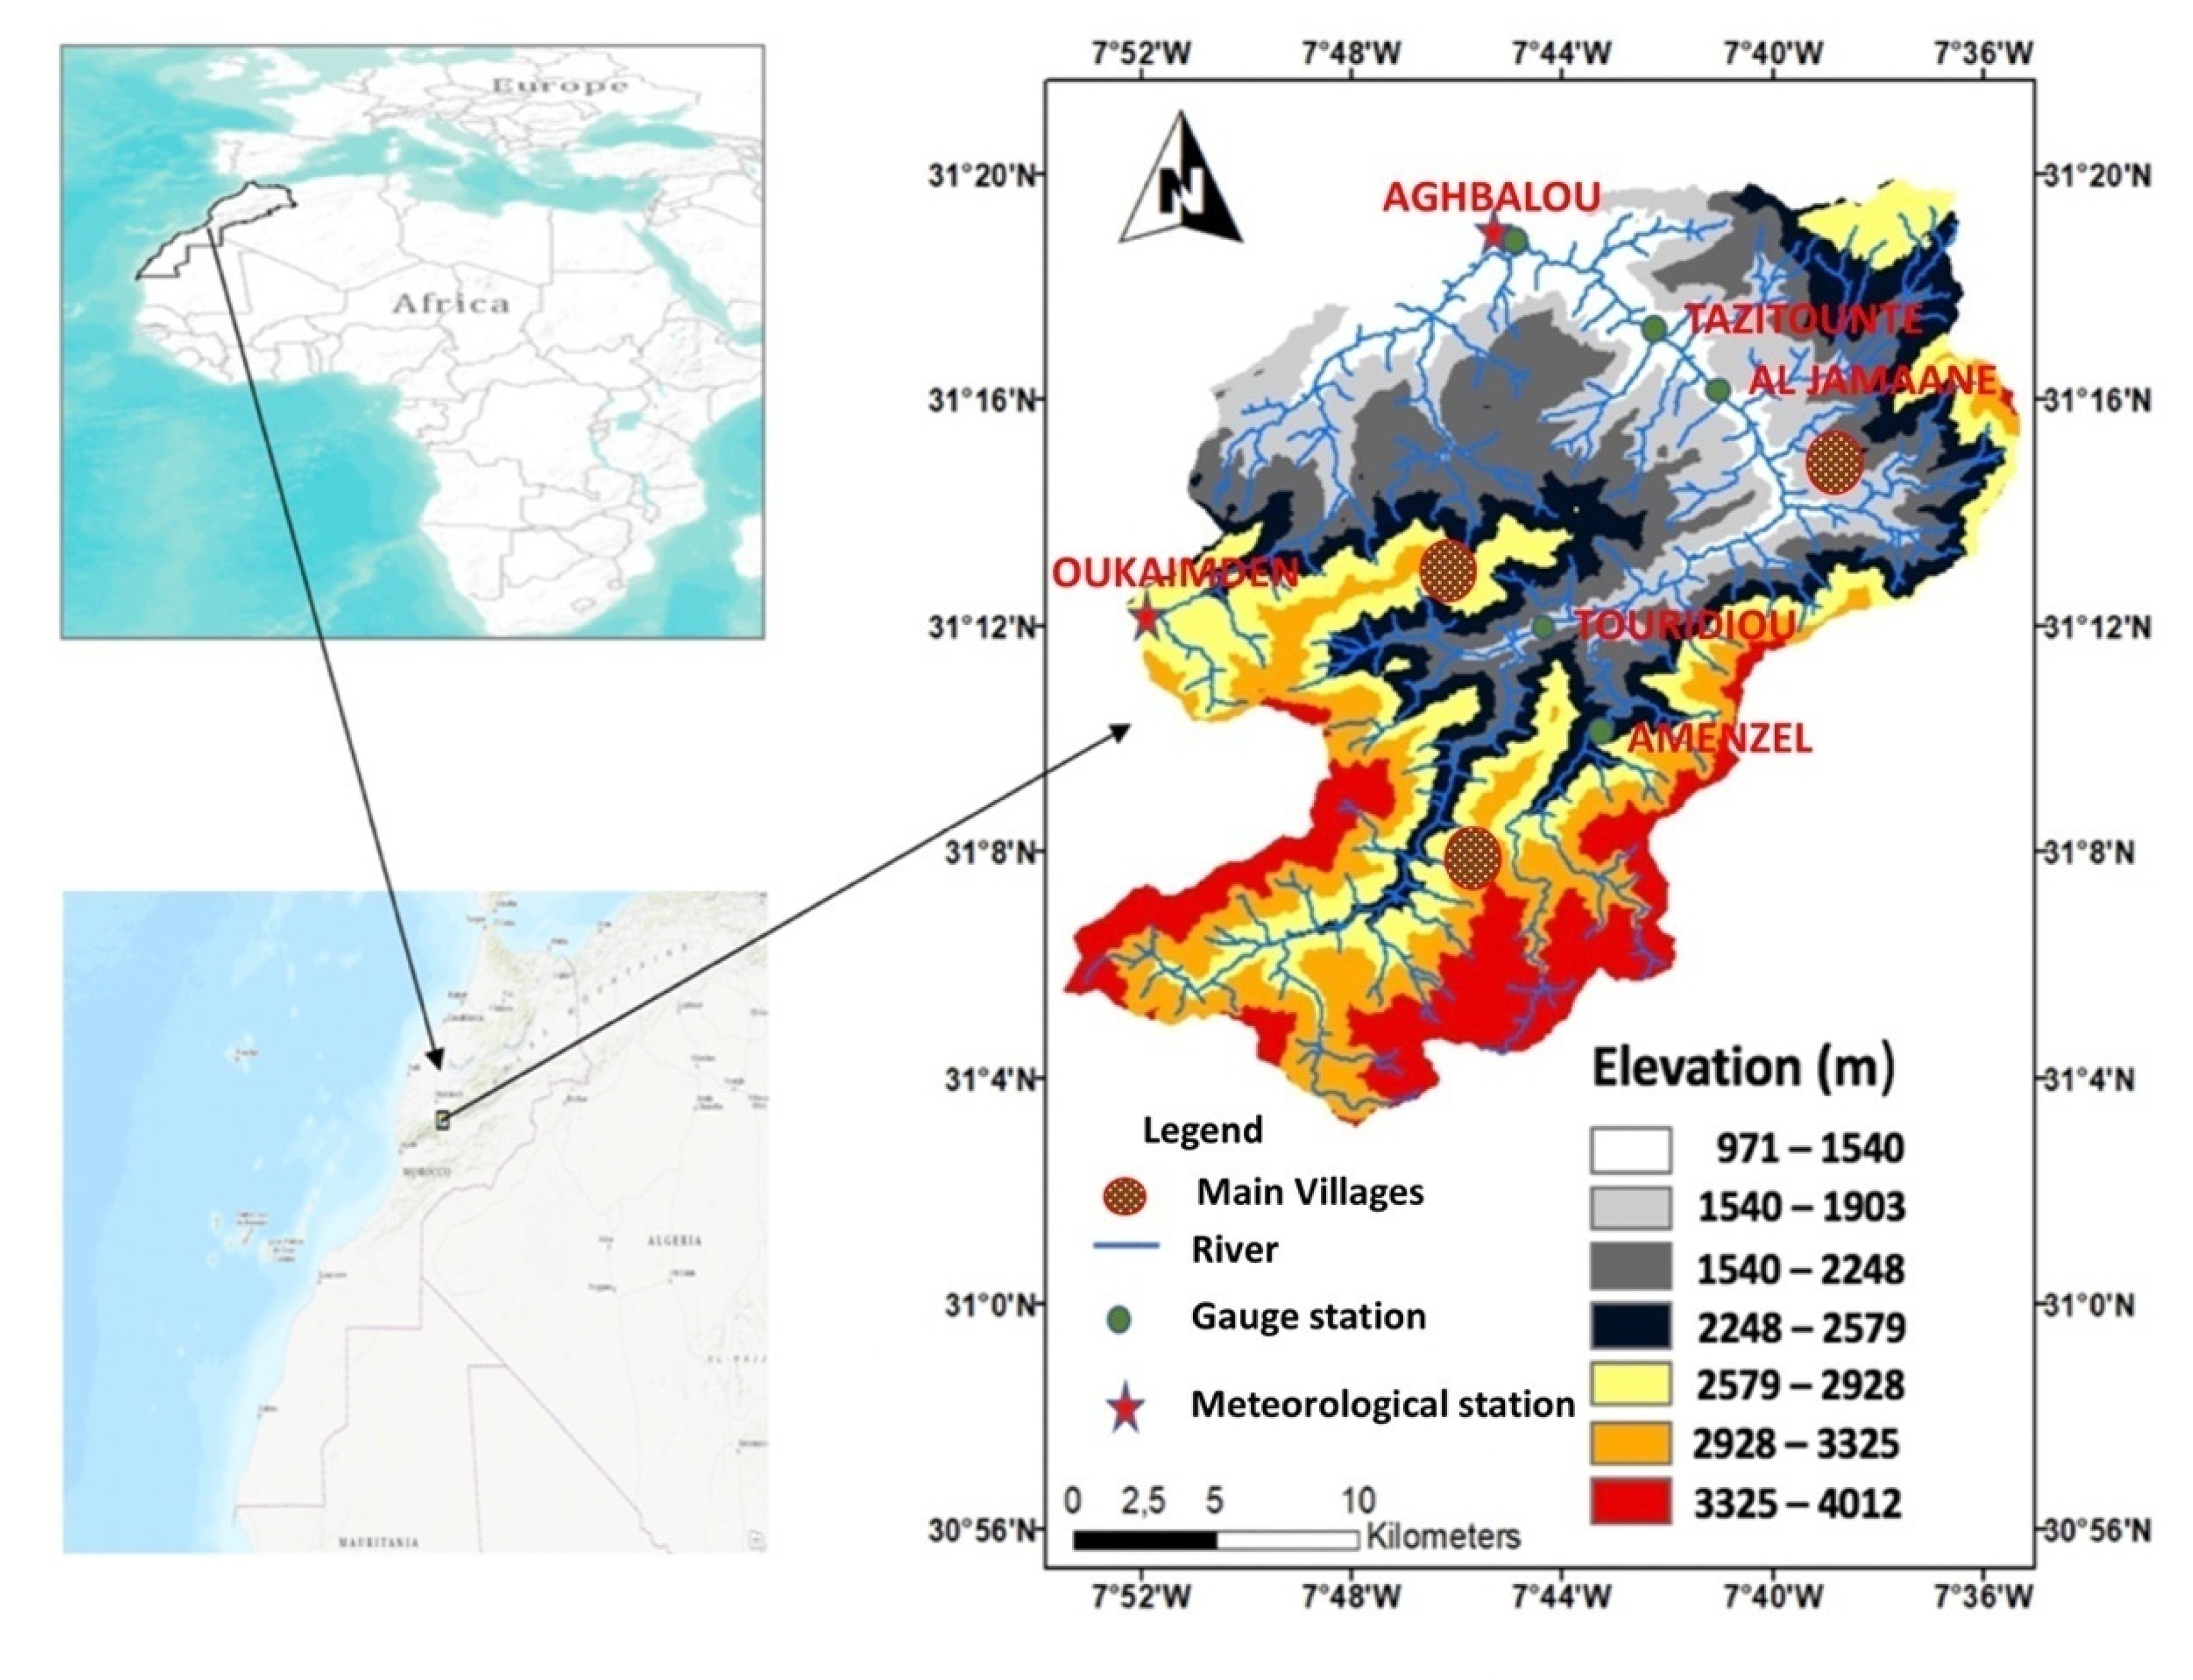
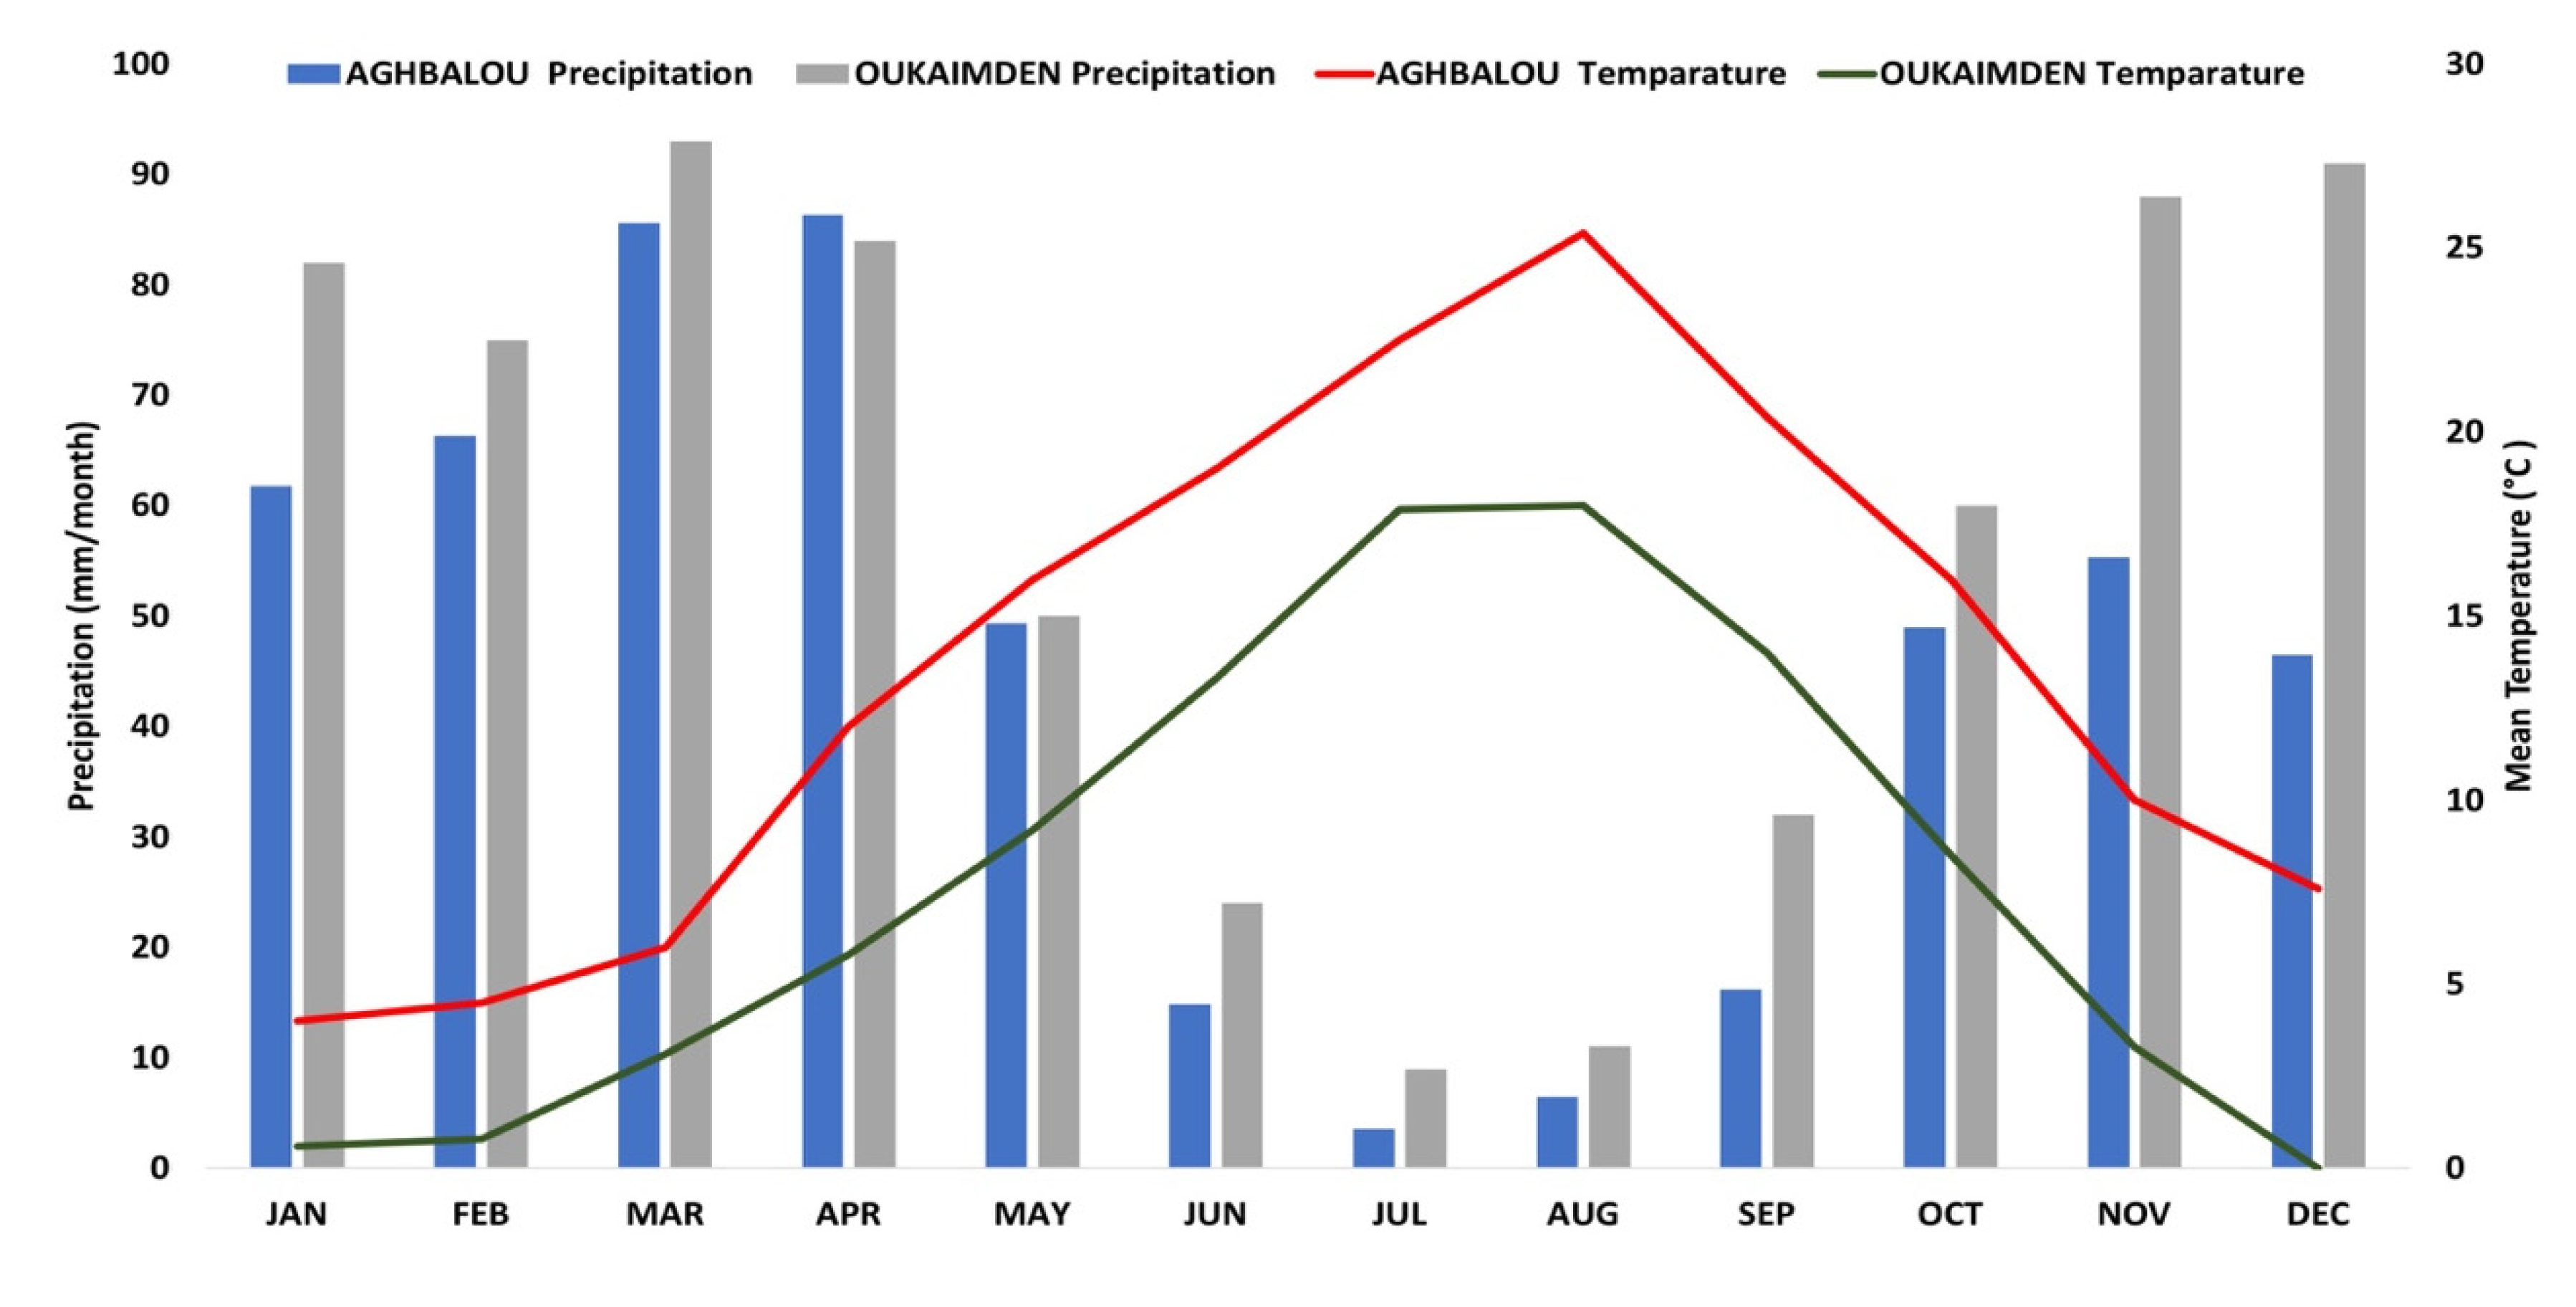
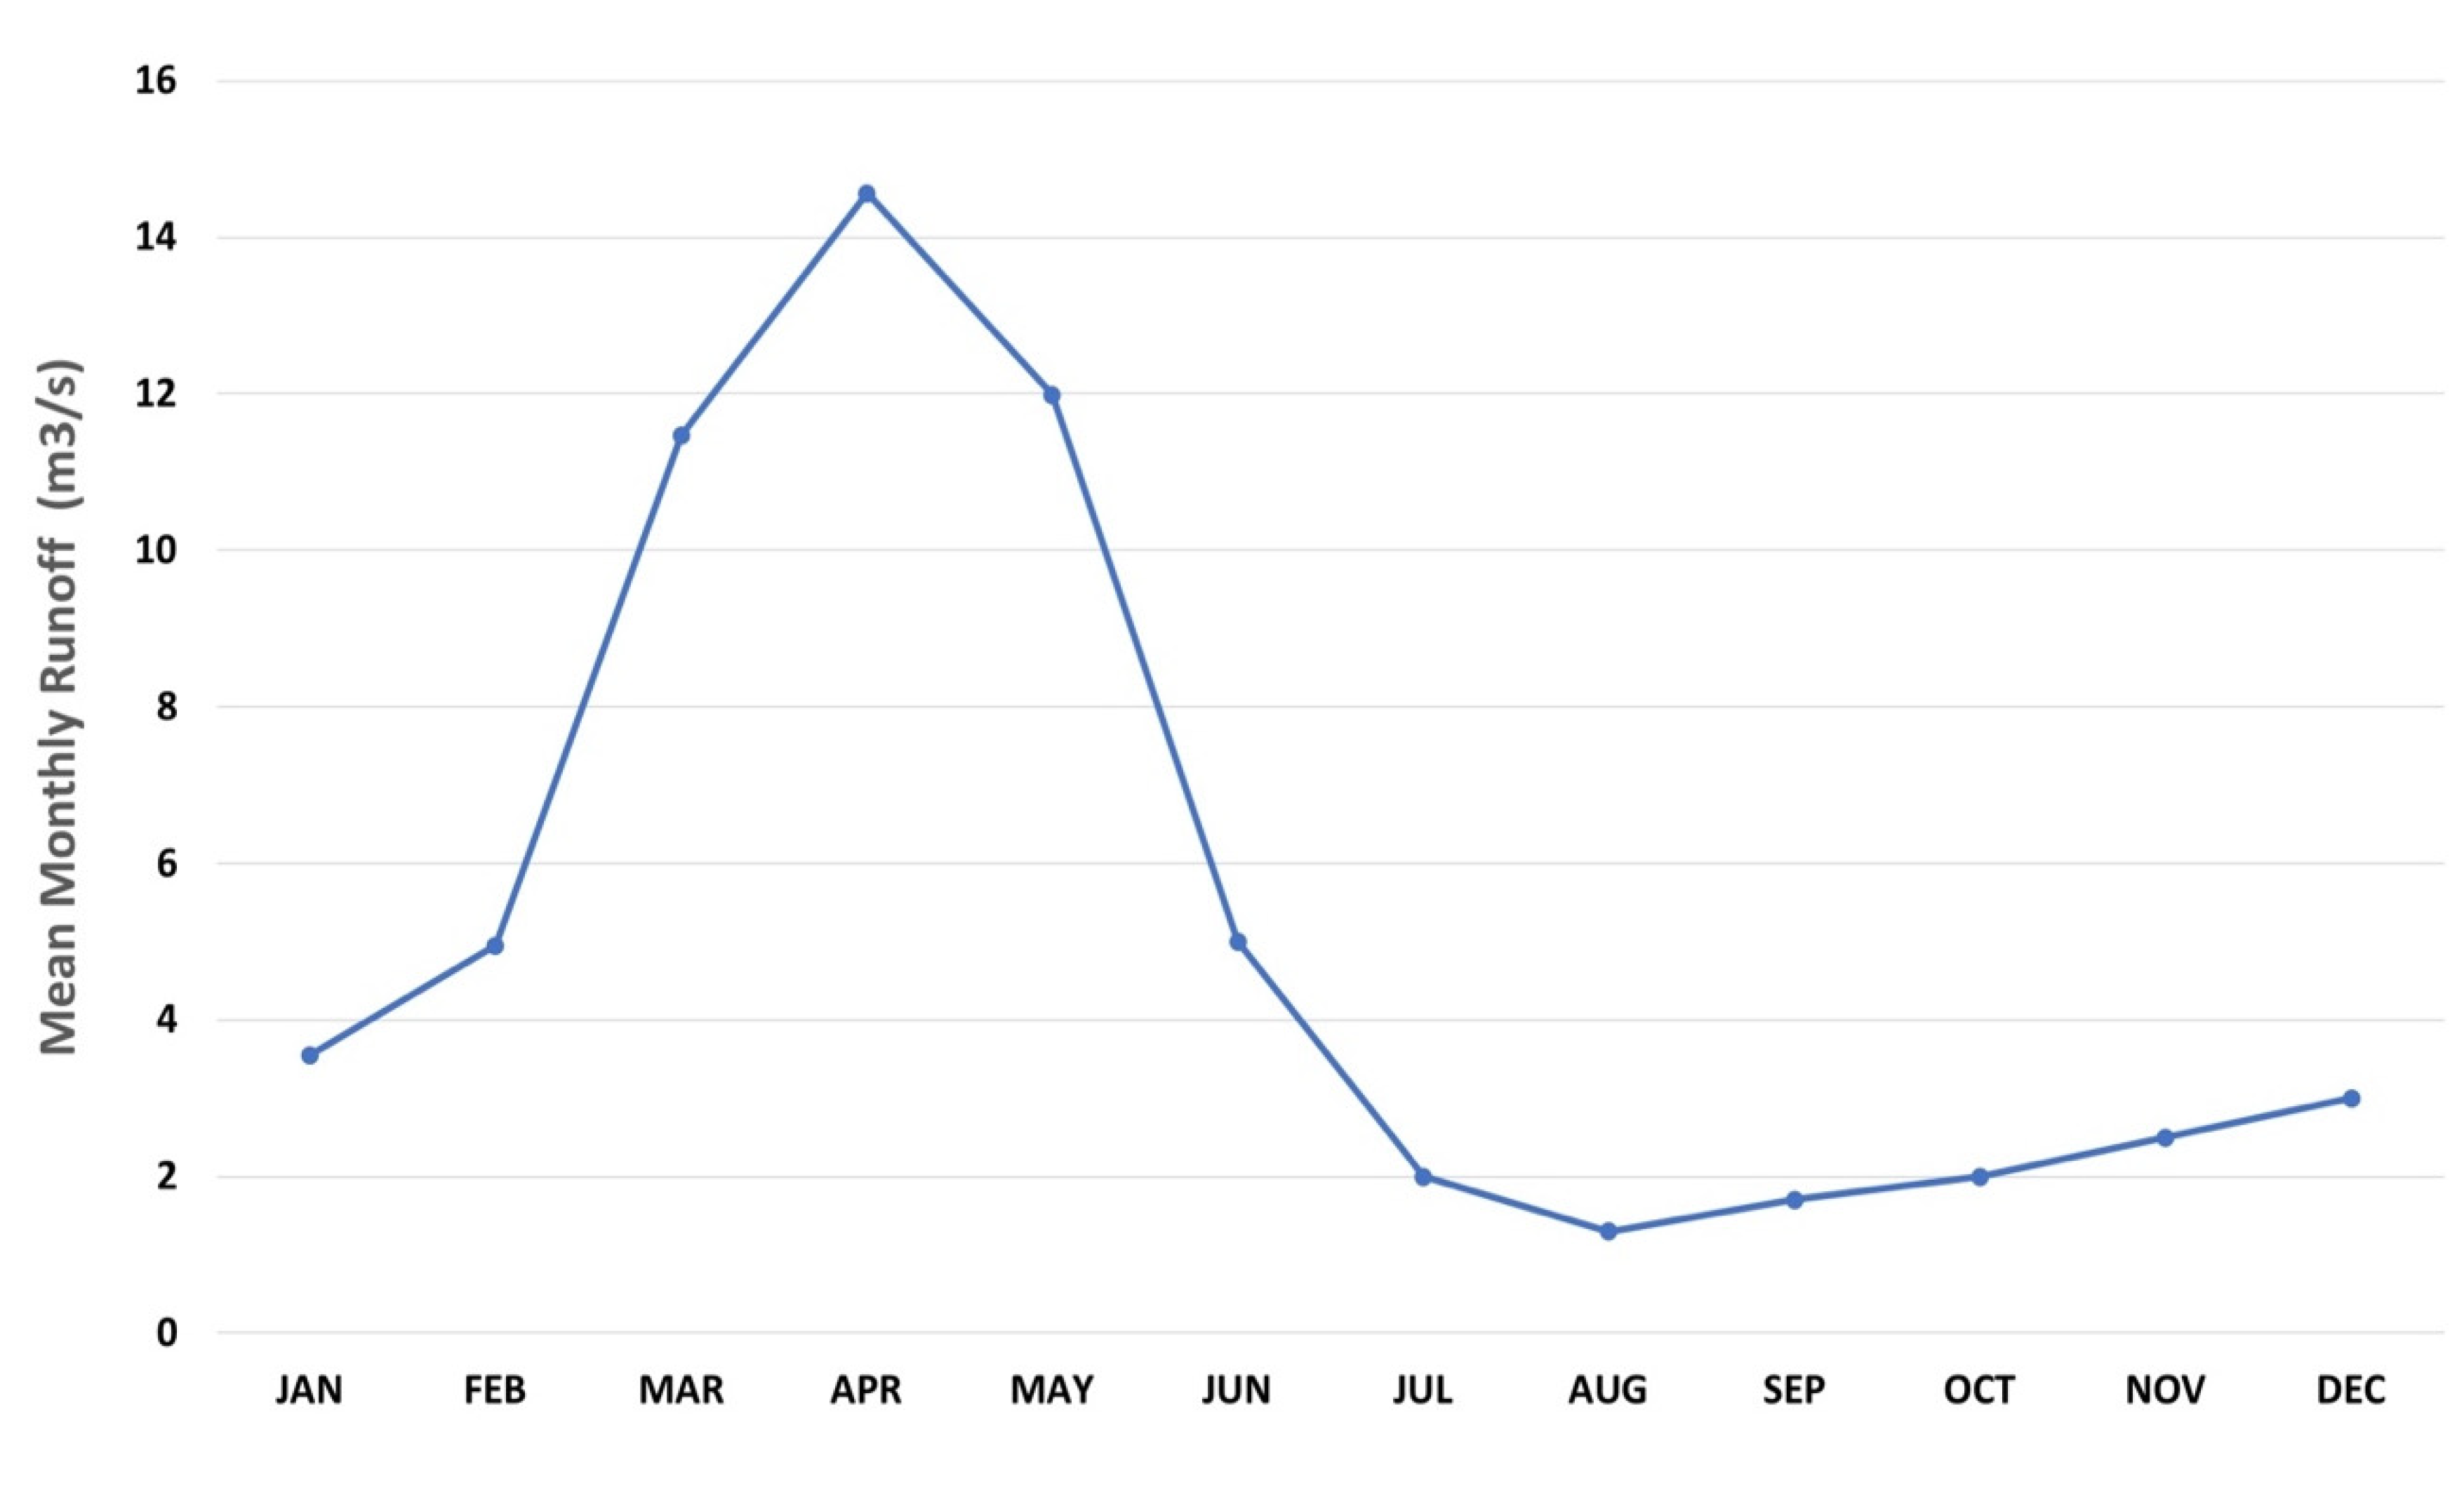
2.1. Study Area

The Ourika watershed is located in the south of Marrakech (Morocco) in a semi-arid to sub-humid climate. It is one of the major watersheds in the Tensift basin of the High Atlas mountain (the highest mountains in North Africa). Geographically, the watershed is located between longitudes 7°53′ and 7°35′ West, and latitudes 31°20 and 31°4′ North, and has an area of 507 km2 (Figure 1).
The size and the height of the mountain make the climate of this region variable [30]. The amount and intensity of precipitation are generally controlled by altitude. The elevation ranges between 974 m and 4001 m above seas level (Jebel n’Tarourt) and about 75% of the watershed area is located between 1600 and 3200 m.a.s.l. Above these high-altitude areas, winter precipitation mainly falls as snow. The average annual precipitation is 541 mm per year at the river outlet and can exceed 700 mm per year at the upstream area of the basin [31]. The average monthly temperatures range from 21.5 to 32 °C for maximums and from 4 to 5.7 °C for minimums. The average annual temperature is 17.6 °C at Aghbalou station for the period of (1970–2014) (Figure 2). The Ourika River originates in the southwestern part of the Atlas Mountains in the North and flows through several villages. Its water is used to meet the daily needs of domestic water for the local residents and tourists, and most importantly to irrigate croplands and orchards (e.g., Ourika Organic Aromatic Gardens, Paradise of saffron). The water fluxes of Ourika river have inter-annual variations with a succession of dry and wet years. Minimum monthly mean flows occur in August. However, in this month, thunderstorms can alter the Ourika river mean summer hydrological regime and cause devastating torrential floods [30]. The maximum flows are recorded in winter and spring respectively. The spring period has the highest flows, due to the high level of precipitation and snowmelt. The months from January to June account for 78% of annual flows (Figure 3). Geomorphologically, the Ourika watershed is characterized by steep slopes and impermeable and compact rock formations, occupying more than 55% of the total area [30]. They consist mainly of crystalline and fissured soils, semi-permeable soils (Triassic red clays, schist, flysch, granite, and basalt). As for the permeable grounds (limestone, basalt, and alluvium), they represent less than 6%. In terms of land use, the forest dominates much of the catchment area, followed by agriculture and rocky outcrops [30].

2.2. Data Collection

To develop the SDSM-WEAP model, different data sources were used (Table 1), including meteorological stations (observed data), GCMs data from the National Centre for Environmental Prediction (NCEP), Hadley Centre Climate Model-version 3 (HadCM3) for A2 and B2 scenarios, and the digital elevation model (DEM) used for watershed delineation and MODIS land cover datasets. The streamflow measurements from 5 gauging stations and evapotranspiration data were acquired from the Regional Water Agency (Tensift Watershed Agency) and Al Haouz Regional Agricultural Development Office (Regional Office for Agricultural Development of Al Haouz ORMVAH). Supplementary data, including population, livestock, water use rates, water consumption, and irrigation area were acquired from different sources and are subsequently validated by socio-economic surveys.

2.3. Climate Change

SDSM is an open source software that produces high-resolution climate change scenarios. It is a decision support tool [32] for assessing the impact of global climate change at local and regional scale. Two types of daily predictors data required for this study; the 26 predictors of the reanalyzed NCEP data for the period of 1961–2014; and the 26 predictors of HadCM3, for A2 and B2 scenarios, for the period of 1961–2100. These were used to generate future climate projections. A2 and B2 scenarios were used instead of 1. Intergovernmental Panel on Climate Change (IPCC)’s newest emission scenarios, because they are more representative of the trajectory of Moroccan society evolution and the changes associated with climate indicators [33]. The SDSM downscaling process is achieved by computing a statistical relationship between the predictors of NCEP variables and the predictands (local surface variables: precipitation, maximum temperature, and minimum temperatures) [34], using the monthly (SDSM–M) and annual (SDSM–A) sub-models. The NCEP atmospheric predictors and the daily observed local data were used for calibration and validation of the SDSM model.
Daily local climate data are used as predictand variables for downscaling experiments and precipitations and max and min temperatures were measured at the Aghbalou and Oukaimden weather stations. The simulated data were extracted for three periods of 30 years each between 2014 and 2100: the 20 s (2014–2040), 50 s (2041–2070), and 80 s (2071–2100). To ensure the reliability of the data, the SDSM allows quality control and identifies missing or outliers’ values before model calibration [35]. Data quality control is followed by screening downscaling predictors [36], to select the most appropriate ones that determine the downscaled climate scenario. Many indicators can be used in this process. In this study, the partial correlation, correlation matrix, and P value were used. The identical approach was used in previous studies [37,38,39].
In general, the calibration of a model is very important; it permits the model to develop the best correspondence between the observed data and simulated data. The data used for calibration in this study covered 30 years (1970–2000), and the period from 2001 to 2014 is used to validate the model. The SDSM calibration calculates the parameters of the multiple regression equations for a set of probable predictors and each predictand [40]. The SDSM outputs and the observed data were compared using several parameters, the coefficient of determination (R2), the explained variance (E%), root mean square error (RMSE), standard error (SE), mean (μ), standard deviation (Ϭ), relative error in mean (RE μ), and relative error in standard deviation (RE Ϭ) for temperature and precipitation, during the periods of calibration and validation. To improve the quality of outputs from climate models, the correction of biases has become an essential approach in downscaling studies [41]; bias correction is applied to remove or reduce biases in daily time series of downscaled data. In this study, the method developed by [42] was adopted for bias correction. Equations (1) and (2) are used to debias daily Tmax, Tmin, and precipitation data.
Tdeb = TSCEN (TCONT − Tobs)
Pdeb = PSCEN (Pobs/PCONT)
where deb are the corrected predictands for (2014–2100). SCEN represents uncorrected downscaled daily data by SDSM for (2014–2100), CONT represents downscaled outputs for the base line period (1970–2014). Obs represent observed values.

2.4. Hydrological Model

The WEAP is a user-friendly tool that takes an integrated approach to water resources planning and policy analysis. The model is based on the water balance concept to reproduce hydrological processes [24]. It can be applied to a single river basin or at the level of a complex basin system [28]. It provides an integrated assessment of hydrology, land use, hydrogeology, climate, water quality, water allocation. WEAP is a conceptual model, which allows the mapping of the physical system [43]. The elements of the natural system (watersheds, rivers, lakes) and the components of the technical system can be represented as a set of interconnected components. The WEAP contains various approaches for modeling water balance processes for a watershed [35]; the “Soil Moisture Model” method was selected for this study. The “Soil Moisture Model” method is considered the most efficient for simulating the processes of the hydrological cycle. The model requires different input variables for hydrological simulation, such as precipitation, temperature, vegetation cover, relative humidity, and latitude, from which water balance components such as infiltration, evapotranspiration, and runoff are estimated [17].

2.5. Calibration and Validation of WEAP

Calibration and validation of the models are necessary and used to ensure the quality and accuracy of the results; it involves improving reliability, by modifying the parameters so that the simulated results correspond closely to the measured data [44,45,46]. WEAP includes an interface to a parameter estimation tool (PEST) that allows the user to automate the process of comparing WEAP results with historical observations and to modify the model parameters to improve its accuracy. The PEST tool is a non-linear parameter, considered as a unique calibration tool. PEST executes, as many times as necessary, the control of a model, while changing its parameters until the differences between the simulations of the selected model and a set of observed data are minimized in the direction of weighted least squares [47]. PEST has five methods that allow calibration and validation. The rain-runoff method for model calibration was chosen because all required data are available. The calibration of the WEAP model for the Ourika river was performed using monthly streamflow gauge data at five stations, using the historical data from 2000 to 2008. Data from 2009 to 2014 were used for validation. Statistical parameters, such as Nash–Sutcliffe efficiency (NSE), the coefficient of determination (R2), was taken into account, to evaluate the performance of the calibration results.

2.6. Demand Sites and Supply Sources

For modeling purposes, the Ourika watershed was divided into 3 sub-watersheds depending on soil types, drainage network, topography, and differences in climate and land cover. The main demand sites are Setti Fatma, Toubkal, and Oukaimden. These sites represent the counties of the Ourika watershed, where the population and its activities, including agriculture and livestock, are concentrated. Tourism is putting increasing pressure on water resources. The water consumption habits of tourists are very different from those of the local population, and their numbers are increasing annually. Its combination with the water demand of local residents and rural activities leads to the overexploitation of surface water. For agriculture, the irrigated croplands are the major consumers of water. The average water requirement is estimated at 7500 m3/ha. Irrigation of agricultural land is still carried out by the traditional method SEGUIAS. It is an open-air irrigation canal, adopted in North Africa, and is often found in oases. Given the climate of the study region, these systems involve significant water losses through evaporation, infiltration, or evacuation. All the sources of supply for existing and planned development in the Ourika watershed are supplied by the surface water resources of the main Ourika River and its tributaries.

2.7. Scenarios Development

Watershed-based water management is an approach that brings together all water users to develop planned, concerted, and consensual actions in the general interest. This participatory approach brings together people from different fields with sometimes divergent interests. The WEAP allows us to build different current scenarios and to simulate them in the future, to answer various “what if” questions [48], and to compare them to the current situation. For this study, six scenarios were developed considering socio-economic factors and climate change (population growth, high population growth, A2 and B2 scenarios), to predict the gap between water supply and demand in the future.
We have also developed scenarios to simulate the reliability and sustainability of adaptation strategies that managers plan to implement, to mitigate the impacts of climate change on supply water resources. These management intervention options were identified to meet current and future water demands at a minimal cost. The six scenarios developed are described below:
(1) Reference Scenario (RS): The first baseline scenario constructed was the current situation of water supply and demand conditions in the watershed. It serves as a basis for further analysis of the current state and comparison with the other simulated scenarios. The current accounts are chosen to serve, as the base year of the model and the entire information system is entered into the current accounts from which scenarios are created. The scenarios explore possible changes to the system in the years to come after the year of the current accounts. The current situation (2014) is extended in the future (2015–2100). Water demand was assumed to increase with population growth (1.18%) and water irrigation techniques will not change.
(2) High Population Growth Scenario (HPG): Under this scenario population, growth rate is increased from 1.18% to 3.5 %, and all the other parameters are kept as in the reference scenario.
(3) Climate Change Scenario (CC): The third scenario uses the results of downscaled climate change scenarios A2 and B2 with a population growth rate of 1.8% to drive the WEAP for climate change impact assessment.
(4) New Irrigation Techniques Scenario (NIT): Agriculture is the main source of income for the population in the Ourika watershed. This fragile ecosystem is increasingly degraded as a result of a combination of several factors, including climatic disturbances that are causing effects already felt by farmers. We evaluated the impact of drip irrigation as the first adaptation strategy to climate change under A2 and B2 scenarios. This technique allows saving between 25% and 30% of the irrigation water [24,29]. We assume that this technique will cover 50% of agricultural land by 2025 and 100% by 2030.
(5) Improvement of Living Conditions Scenario (ILC): The potential in terms of wastewater discharge at the level of the Ourika watershed is about 3.1 million cubic meters (MCM) in 2014. It would be 4.3 MCM in 2030, with an annual evolution of around 0.08 MCM. This potential is calculated from the population’s water consumption, with a return to the sewer system of 80%. Given that there are no wastewater treatment plants, the installation of a water treatment plant is a key adaptation strategy. We evaluated a wastewater treatment plant to save about 30% of domestic water. This strategy is evaluated under both climate change scenarios.
(6) The combination of NIT and ILC adaptation strategies: This scenario simulates the combination of the two assumptions NIT and ILC under A2 and B2 scenarios.

3. Results

3.1. Climate Change Projection

3.1.1. Downscaling Performance

To assess SDSM performance, a number of statistical parameters were used. The E% are 65%, 79%, and 21% for T-max, T-min, and precipitation. During the model calibration process, the R2 value of the monthly (SDSM-M) and annual (SDSM-A) responses to A2 and B2 scenarios lies between 78.12 and 82.4%, for both T-max and T-min, and between 46% to 60% for precipitation. During the model validation with bias correction, the R2 value for monthly and annual models was between 88% and 97.3% for both T-max and T-min and between 58% and 74% for precipitation. The bias correction improved almost all statistical indicators. The RMSE decreases to 9.76 mm/month, and RE_Ϭ decreases by 5.47%, as shown in Table 2.
These results indicate the strong applicability of SDSM to downscaling Tmax, Tmin, and precipitation under A2 and B2 scenarios after Bias correction was applied in the Ourika watershed. The results are globally satisfactory and comparable to previous studies’ results [13,25]. This may be due to the use of a longer calibration period (30 years). A series of observed data of 30 years or older can be used to generate probability distribution functions in SDSM or statistical downscaling procedures [13].

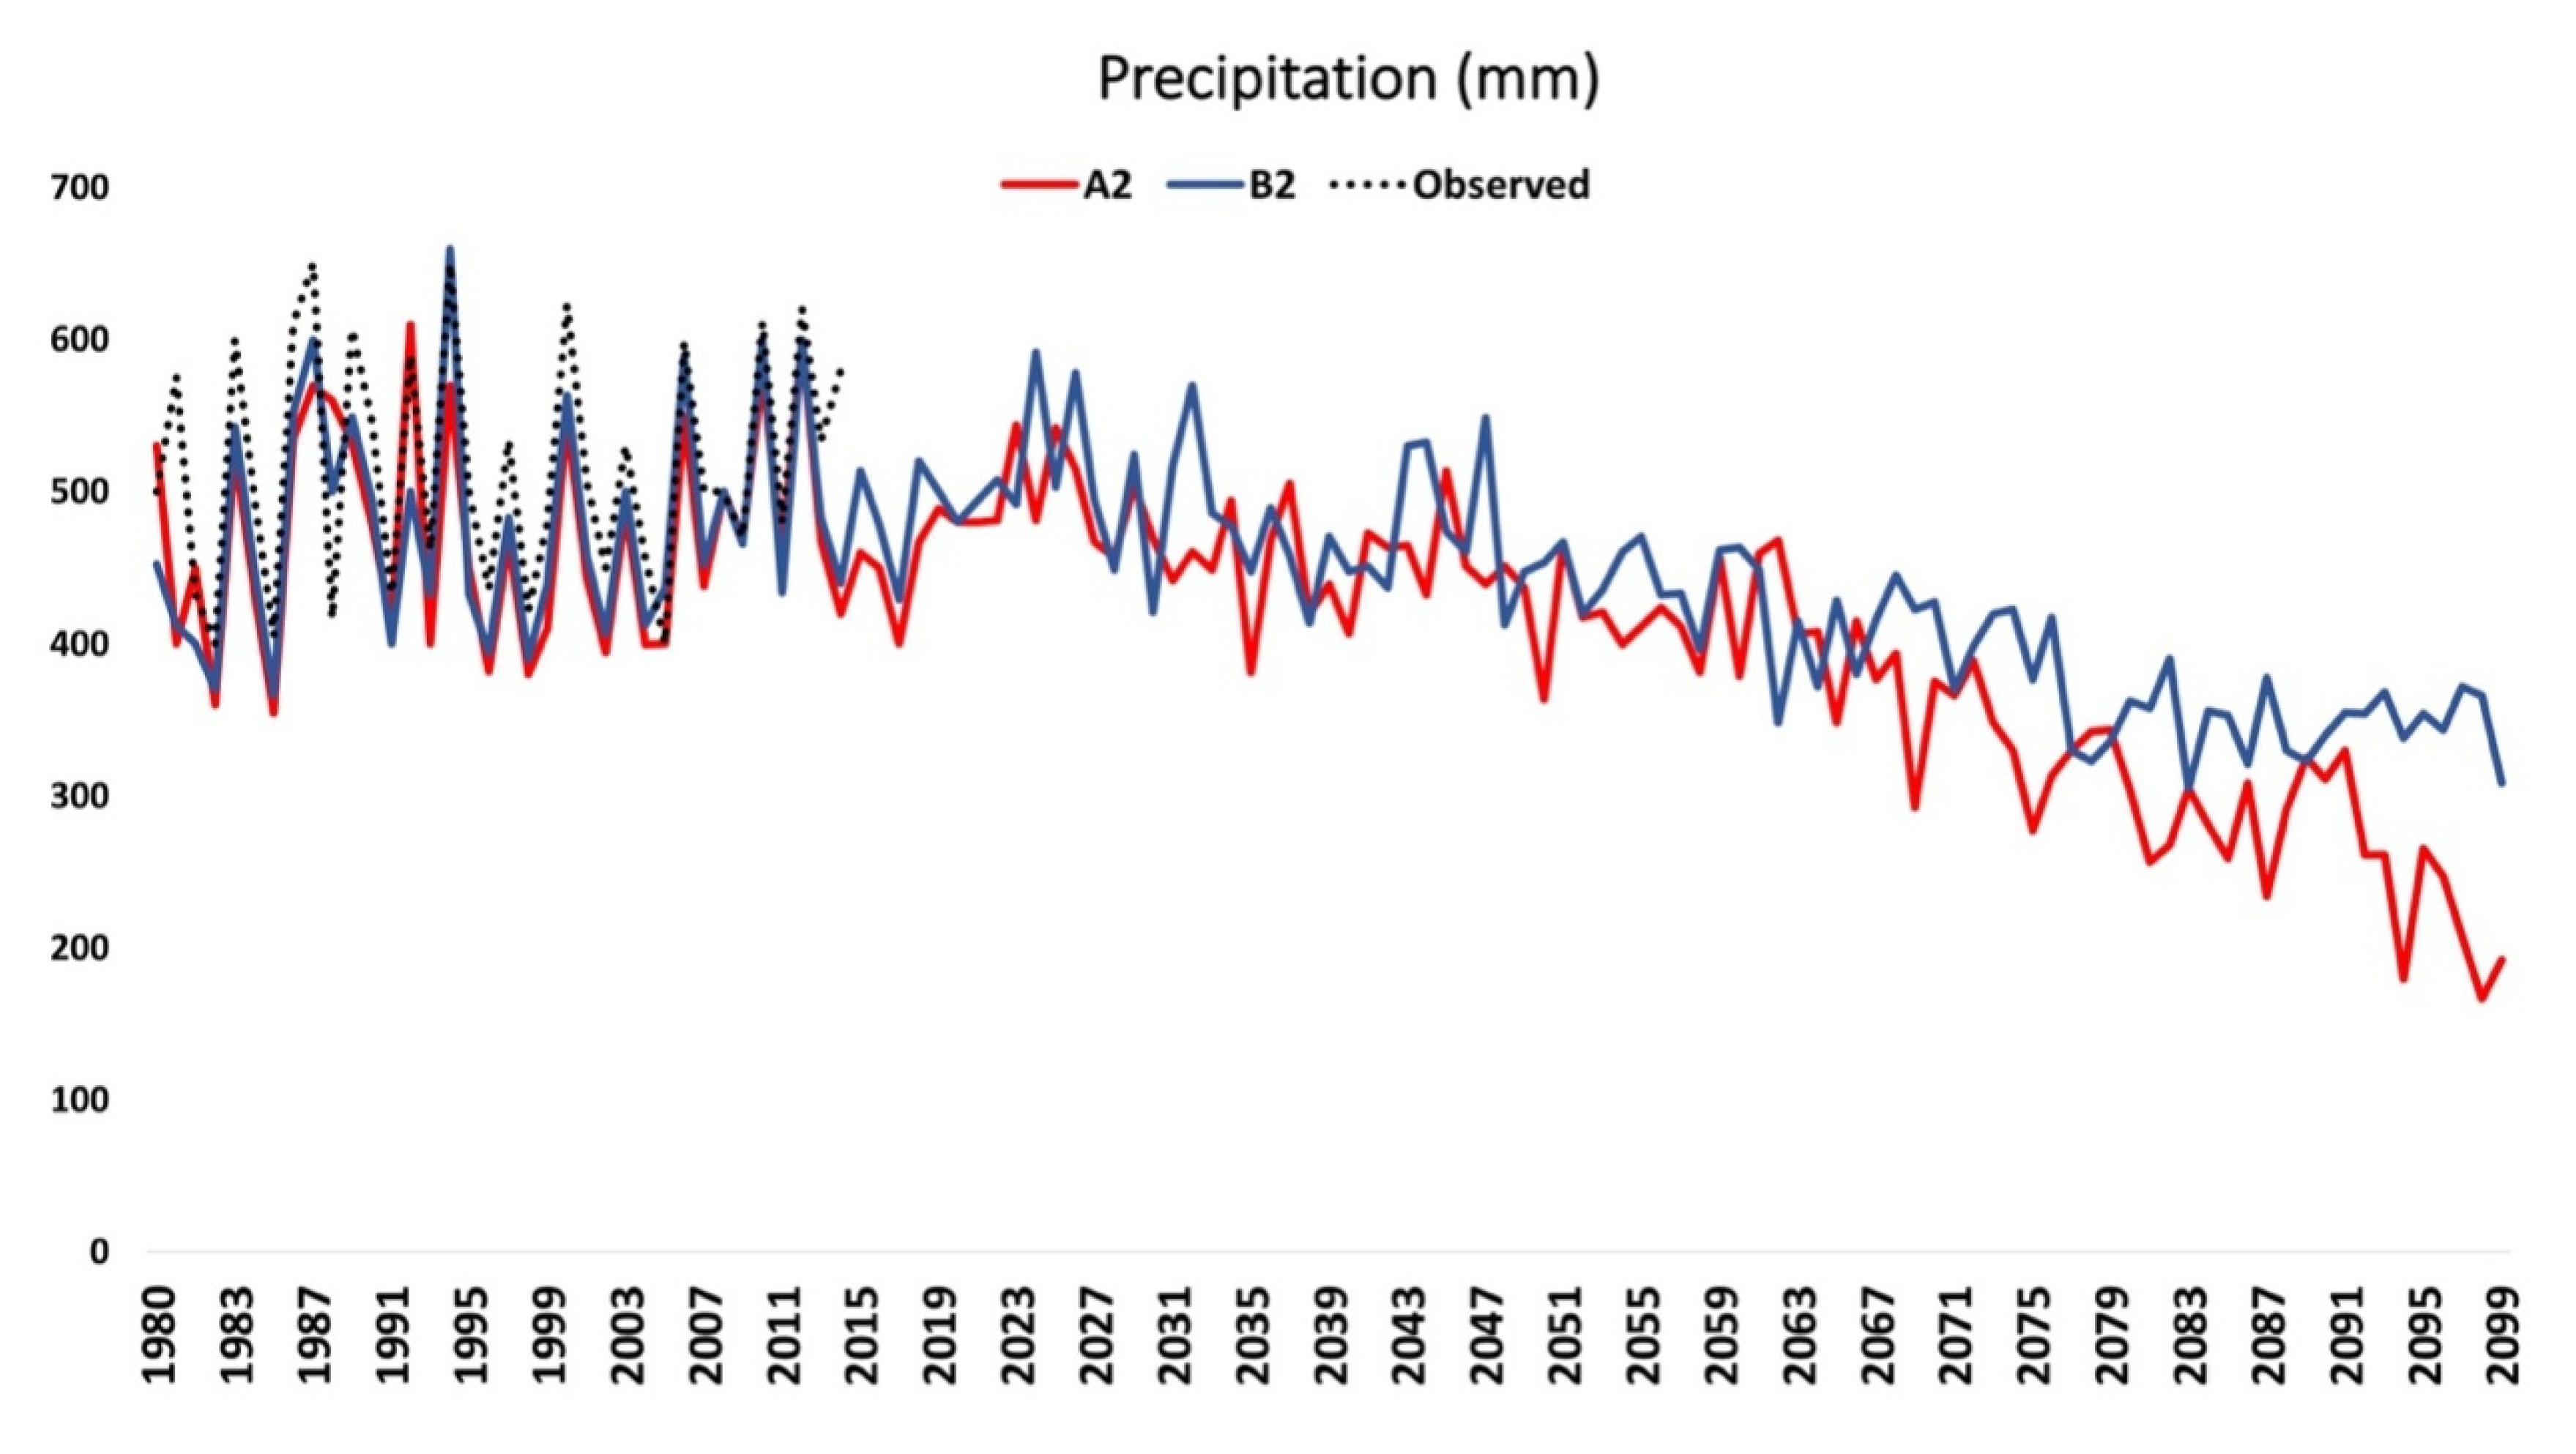
3.1.2. Precipitation Projections

The downscaled precipitation shows a decreasing trend in average annual precipitation for both scenarios over all three-time horizons (Figure 4). Projected mean annual precipitation is shown in Table 3. Mean annual precipitation decreased in A2 by 9.98% in the 20s, 33.56% in the 50s and 49.25% in the 80s and the B2 by about 8.21% in the 20s, 23.68% in the 50s and 34.61% in the 80s. The results show that the A2 scenario is more severe than B2 and resulted in more rainfall reduction. These results are consistent with other watershed climate projections studies in Morocco. As an example, we compare our precipitation projections to those of [49] and [50] and found that they present similar trends.
In Morocco, Seif-Ennasr et al. [49] indicated that precipitation would decrease by 10%, 30%, 60%, for the 20s, 50s, and 80s respectively, under the RCP 4.5 scenario. Other study [50] reported a decrease in the order of 21.33% by 2050, under the scenario RCP 8.5. Another study, under identical climatic and morphological conditions as our study area, indicated a decrease of 5 to 10% in 2011–2040, 10 to 40% in 2041–2070 and 40 to 60% by the end of the century (2071–2100), under both scenarios A2 and B2 [29].

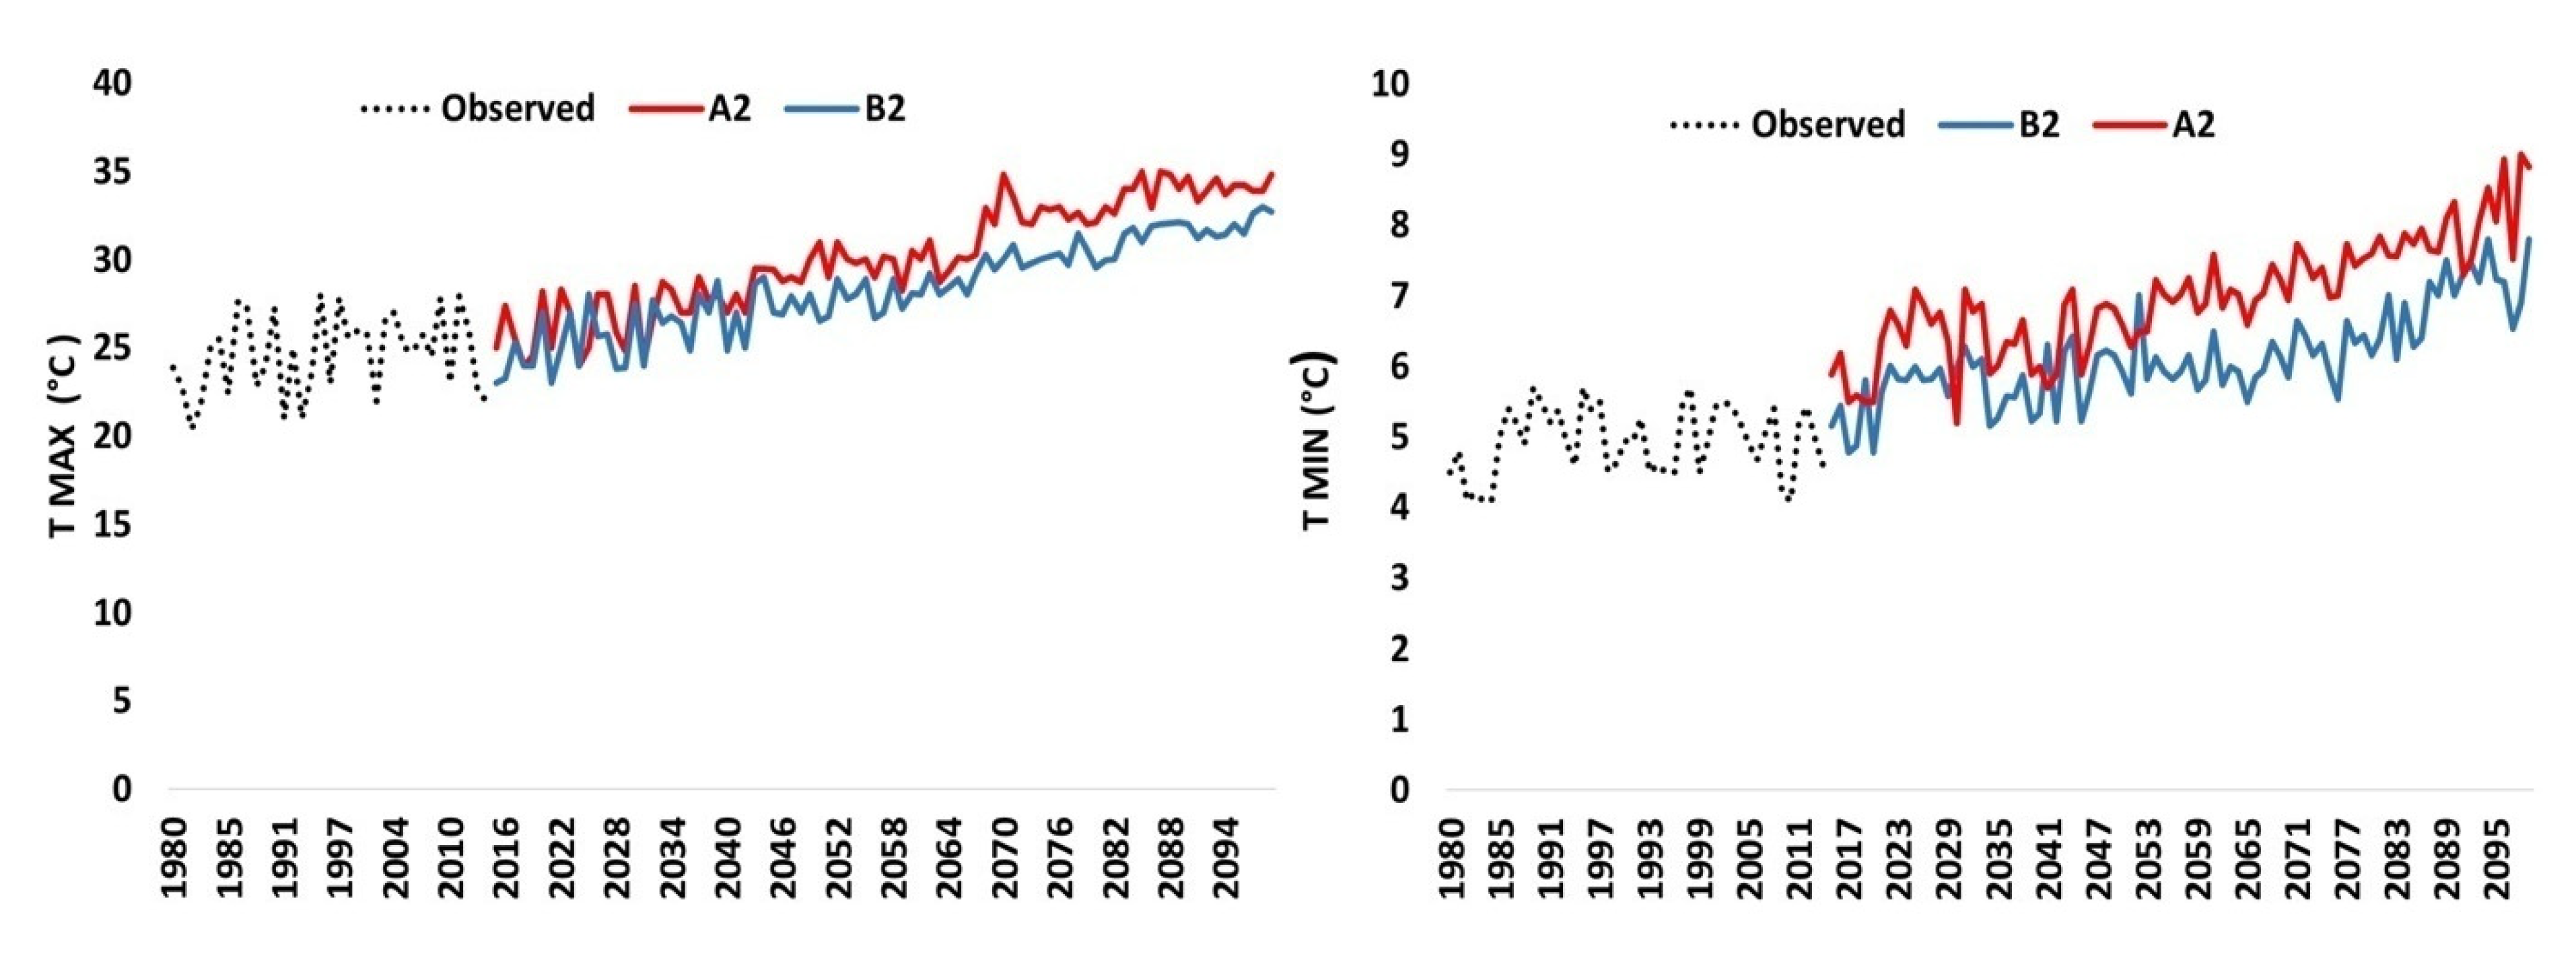
3.1.3. Temperature Projection

The Ourika watershed mean Tmax and Tmin are projected to be warmer than the corresponding baseline (Table 3). Both Tmax and Tmin are projected to increase under A2 and B2 and for all time horizons by about 1.6 °C, 2.7 °C, 4.2 °C and about 1.3 °C, 2.2 °C, 3.6 °C in the 20s, 50s, and 80s, under A2 and B2 scenarios, respectively (Figure 5). The mean annual Tmin also increased in all two scenarios in all periods; the mean Tmin increase by 2 °C,2.6 °C, 3.5 °C and 1.6 °C, 2.1 °C, 2.9 °C in the 20s, 50s, and 80s, under A2 and B2. Similarly to several other studies ex; [51,52], the projected temperature increase is more severe under A2 than B2. In the Ourika watershed, these changes in precipitation and temperature are expected to reduce the agricultural and domestique water supply and impact water demand significantly.

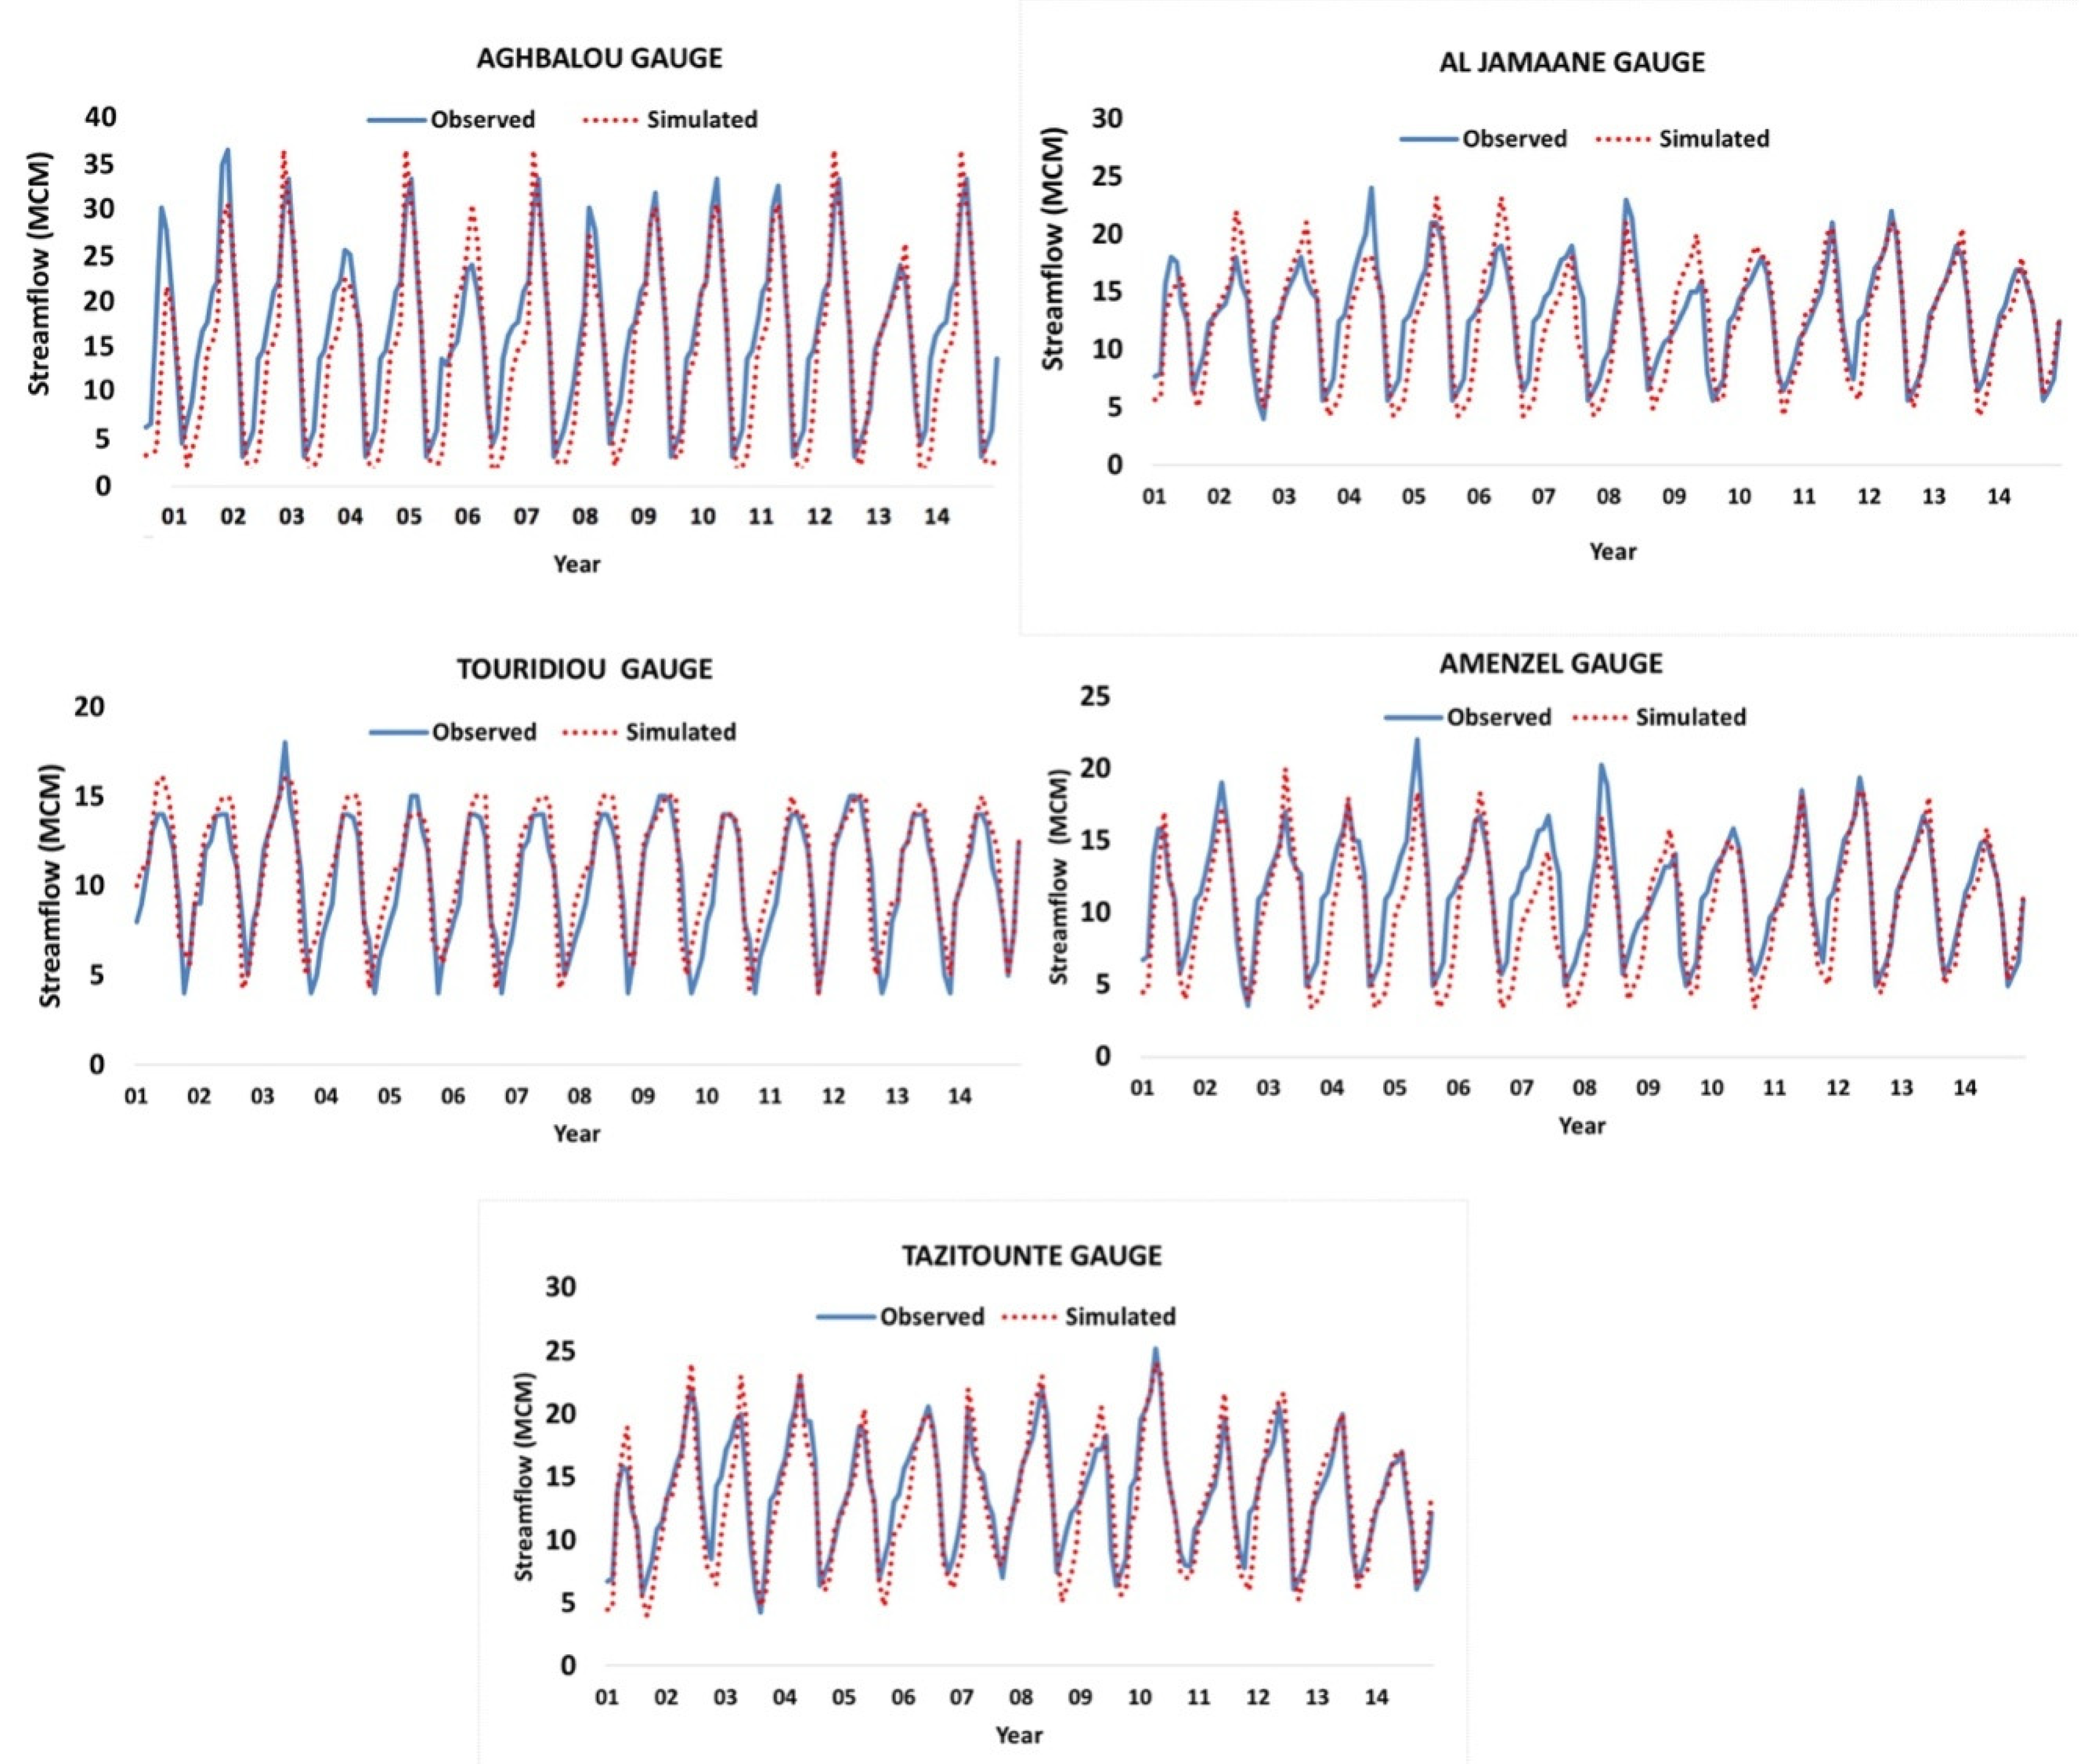
3.2. WEAP Calibration and Validation

Calibration and validation of the WEAP model over the Ourika River were performed using monthly streamflow data from five-gauge stations. Model performance was evaluated with PEST by calculating NSE, R2, and r, for all the calibration and validation periods. The results show that the R2 values ranged from 0.64% to 0.89%, with a mean of 0.76%. The NSE values ranged from 0.61 to 0.85 with a mean of 0.70. The efficiency of Nash–Sutcliffe varies from −∞ to 1 [53]. Effectiveness of 1 means that the modeled flow corresponds perfectly to the observed data [54]. Calibration results showed excellent agreement with the model validation result (Figure 6). This confirms that the WEAP model accurately simulated the streamflow in the study area. Similar results have been reported by [55]. The model’s performance is considered satisfactory to simulate long-term changes in water resource availability and to explore its sensitivity to human activities, climate change, and adaptation measures.

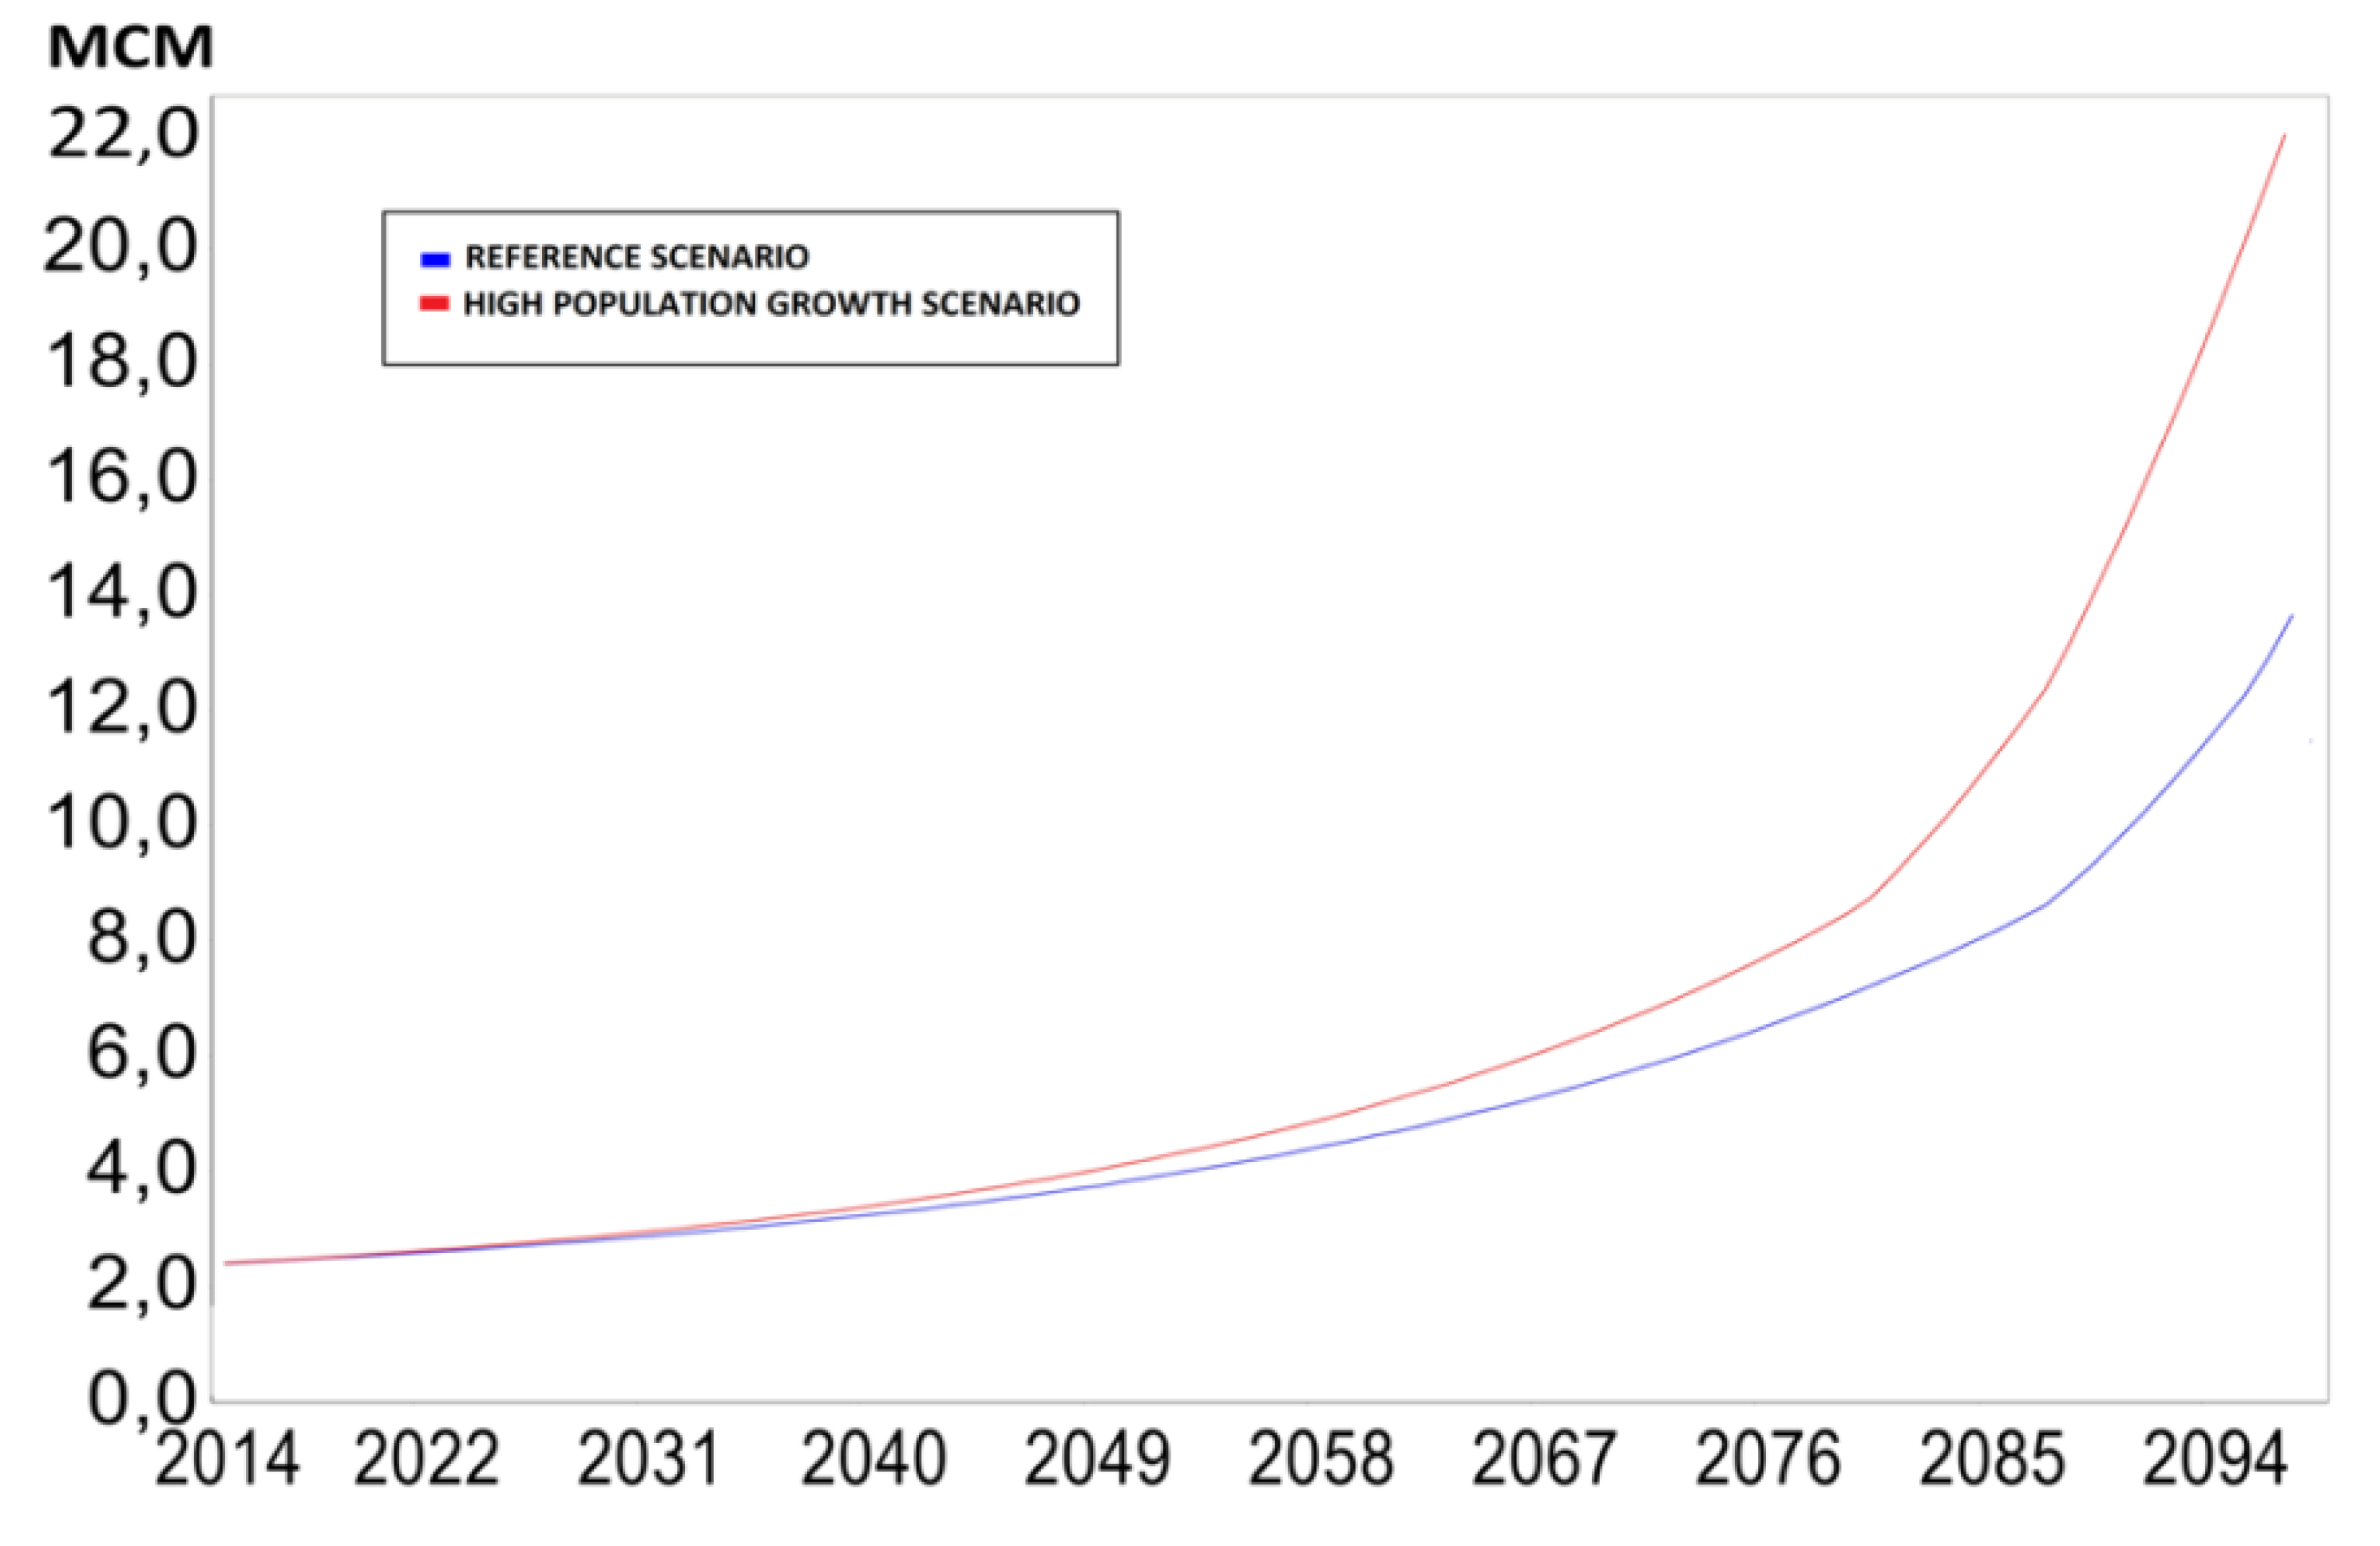
3.3. References Scenario (RS) and High Population Growth Scenario (HPG)

In Figure 7, we analyze the relationship between water supply and demand, in the reference scenario (RS), and in the high population growth scenario (HPG). The results show that population growth leads to an increase in water demand. The availability of water in a scenario of low population growth would induce insufficient water supply. For the (RS), the results show that, by 2100, the demand for domestic water will have increased. Likewise for the demand for water for agriculture and livestock. Estimates of future water supply and demand conditions indicate that the average water demand coverage in the Ourika watershed will decrease from 93.06% to 61.11% by 2100. The unmet water demand (quantity of water that cannot be physically delivered to the demand site; useful for understanding the extent of the shortage) was 2.5 MCM in 2014 and will be in the order of 14 MCM in 2100; that is, a more than five-fold increase. The reference scenario shows a water shortage in the supply system, while water demand increases. The second scenario (HPG) showed that a high population growth rate will increase unmet demand, as this scenario has a severe effect on water supply and demand. An increased population growth rate from 1.18% (RS) to 3.5% (HPG) induces an increase in water demand for all demand sectors. Consequently, the unmet demand is estimated at 21.8 MCM in 2100. The availability of water (HPG) would result in a much more limited amount of water. Unmet demand in the Ourika watershed is caused largely by population growth, the high per capita water use, as well as declining water inflows and increased human activities (agriculture, tourism, habitat, and deforestation). Hellegers et al. [56] have found that in the Middle East and North African countries, water availability is limited in the face of rapidly increasing water demand. The results obtained are in line with those obtained by [57], who concluded that, at the level of the Upper Indus Basin in Pakistan in 2014, average water demand coverage would decrease from 90% to 75% in 2050.

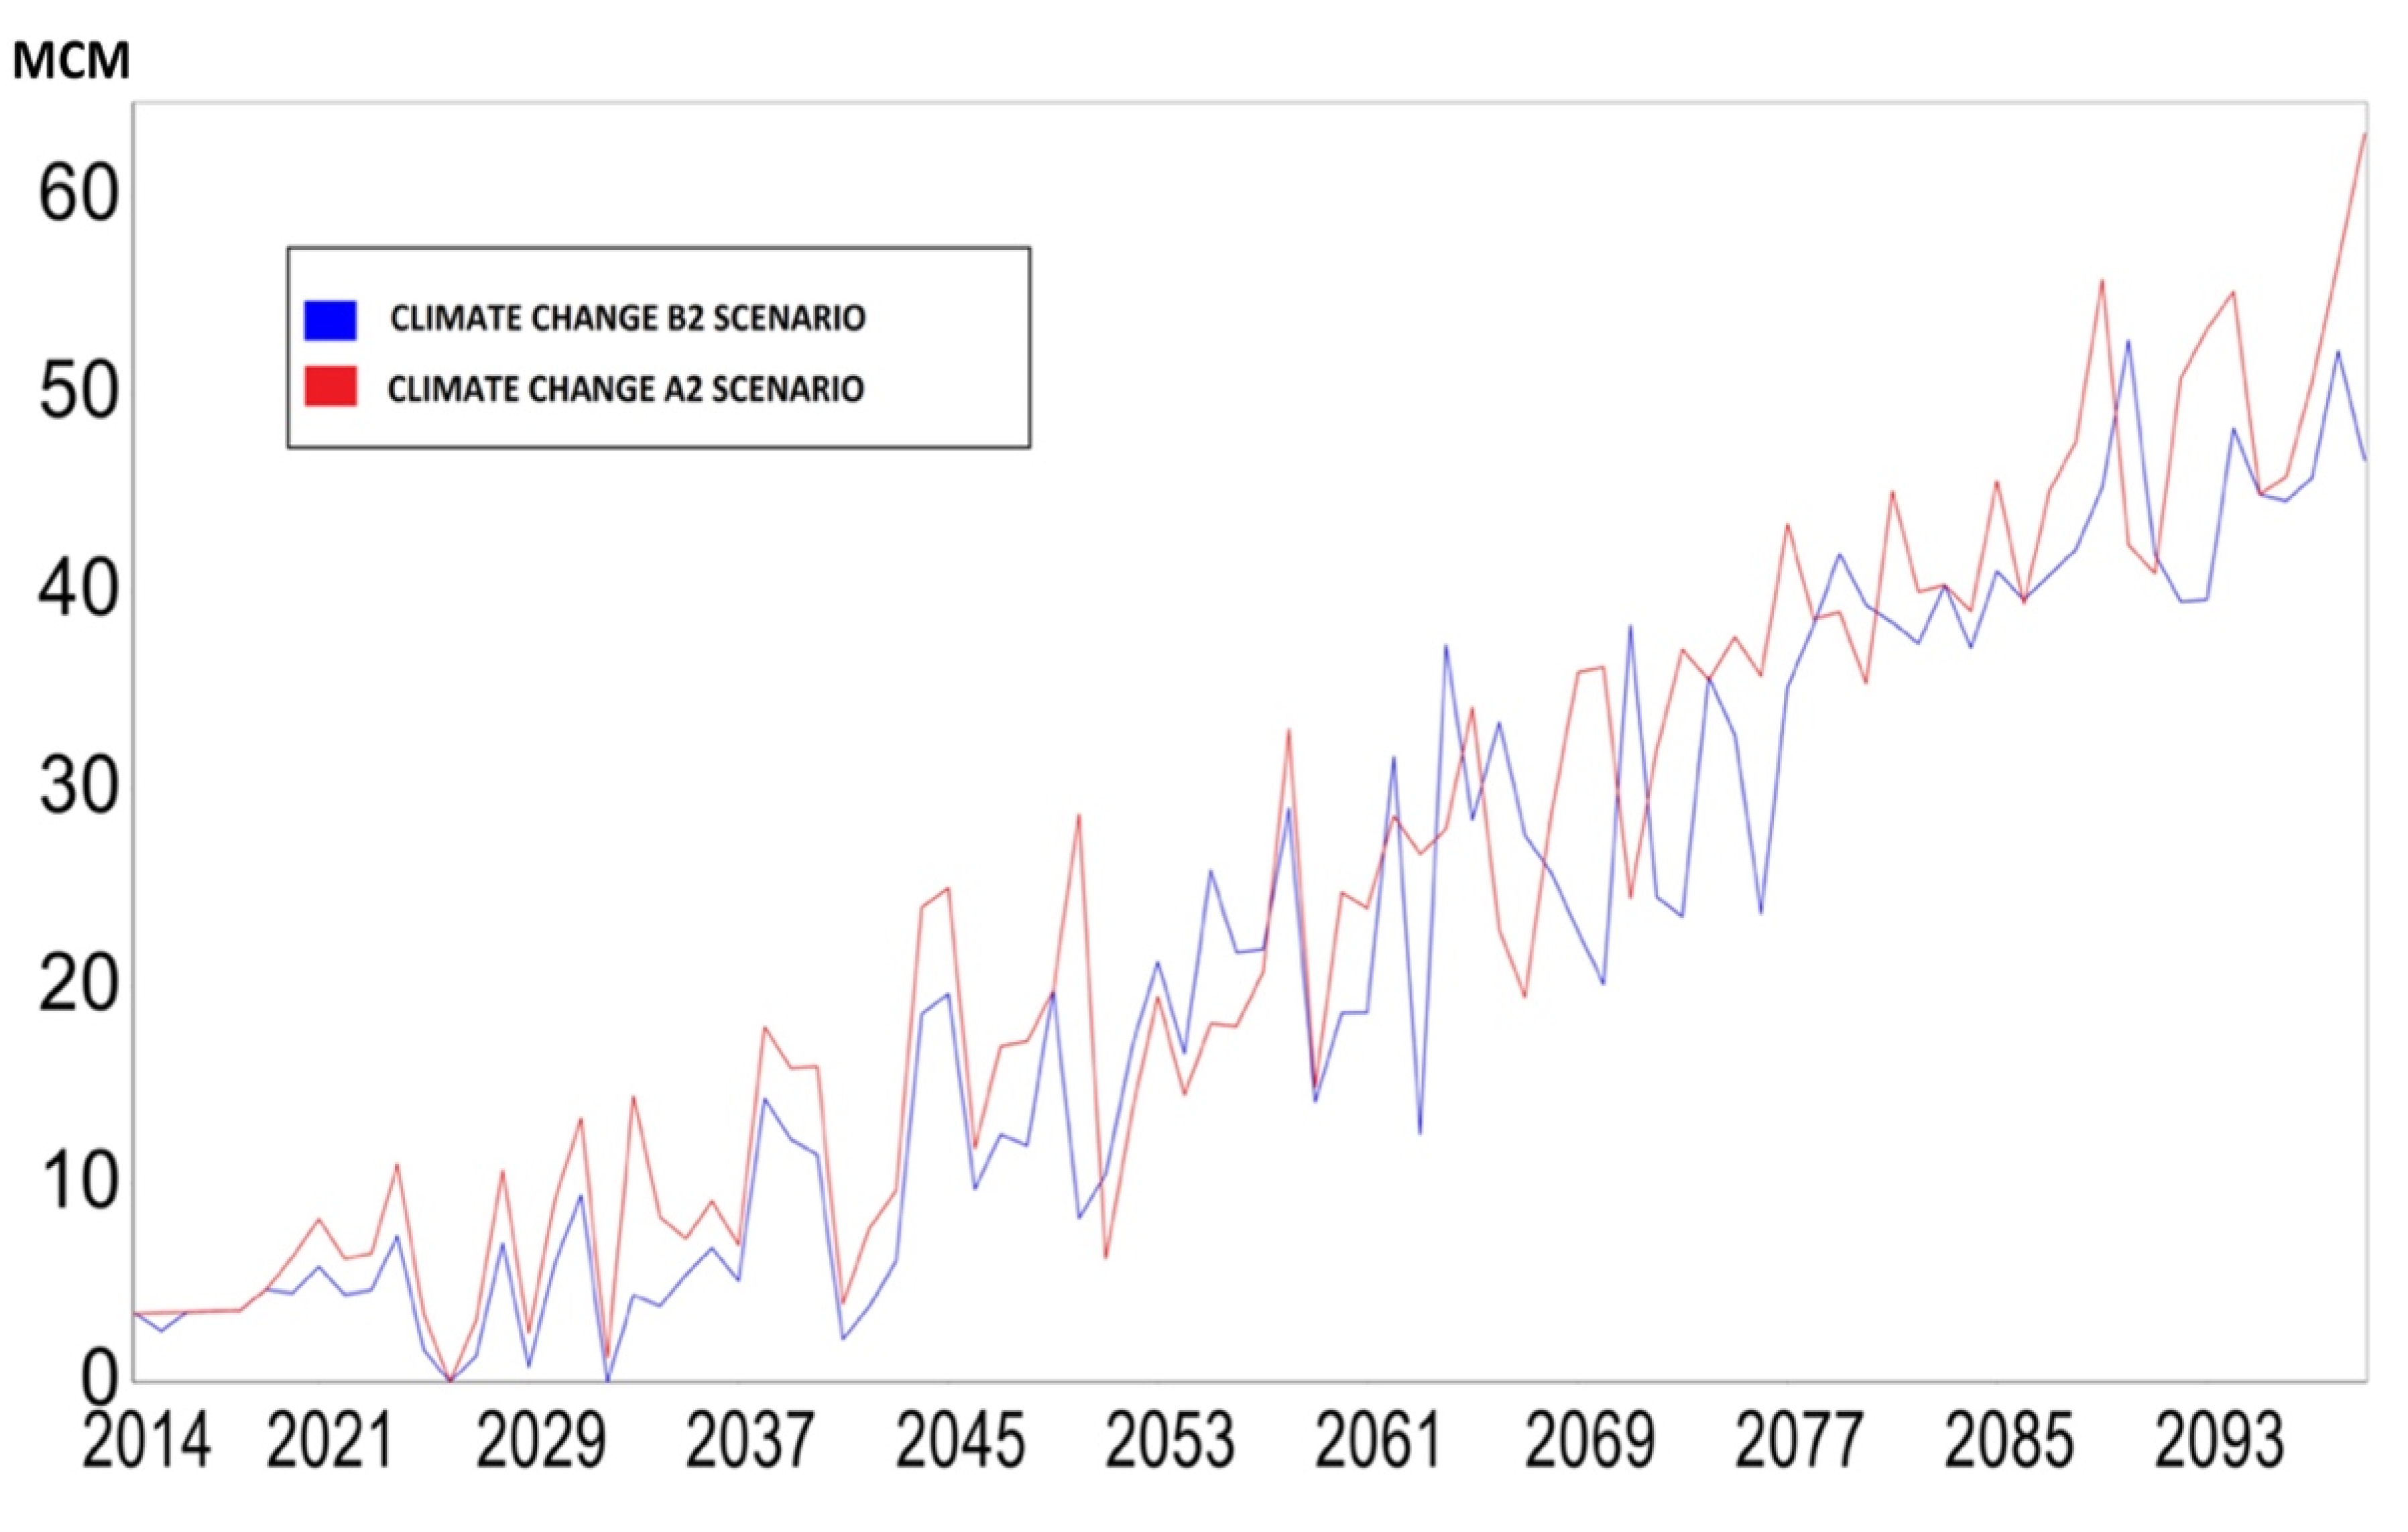
3.4. Climate Change Scenario (CC)

The WEAP model predicts an increase in future water demand in the Ourika watershed according to the two climate change scenarios A2 and B2. In the (CC) scenario, agricultural and domestic water demand will continue to increase. The results indicate that unmet water demand in 2100 is estimated at 52 MCM and 64 MCM for scenarios B2 and A2 (Figure 8). Future imbalances in water supply and demand are estimated at between 55% and 65% in 2100. A study [29] on the Rheraya watershed in Morocco reports that the average unmet water demand would significantly increase by 70% of the total annual demand by 2100. Another study [58] on water resource trends in the Middle East and North Africa under the impact of climate change shows that demand will increase by 50% and supply will decrease by 12% by 2050, leading to a considerable increase in water scarcity. On the other hand, a study carried in Mali [59] using the WEAP socio-economic and climate change scenarios model reported an increase in water demand from 76 MCM to 224 MCM by 2050. A study conducted in Morocco by [56] suggested that, for the average future climate projection, the water supply and demand imbalances will reach 15.7 billion m3 per year, or about 60% of total future demand. In the Ourika watershed, potential future climate change may lead to early snowmelt, which could increase water availability at a time of year when demand is relatively low. This could have a negative effect on the dry-months (July–August) supply. The Ourika may experience a temporal opposition of phase between water availability and need. This results in a loss of a significant amount of water every month in the medium and low mountain areas. On the other hand, during summer and autumn, water needs are at a maximum level, while water availability is very low. In addition, increasing temperatures are likely to speed up the evaporation of water and land surfaces and accelerate transpiration. Several studies have shown the possible decrease in water flow in several regions of the world [60,61]. The decrease in water flow in the Ourika watershed is directly related to climate change, followed by anthropogenic over exploitation. Water stress will affect most watersheds in Morocco. In surface-water watershed, already suffering from water stress, population growth, tourism pressure, and climate change exacerbates existing water problems. The WEAP estimated that more than three-quarters of local water resources are consumed for agriculture to ensure local food security. Agriculture is the largest water consuming sector in the world, and the Ourika watershed is not an exception. In 2014 agricultural water demand was about 79%, with an additional 8% for livestock, while domestic water use reached 13%. Our study indicates that climate change is expected to have the strongest impact on the Ourika watershed, where the agriculture is very important for the local economy, and in particular for small farmers.

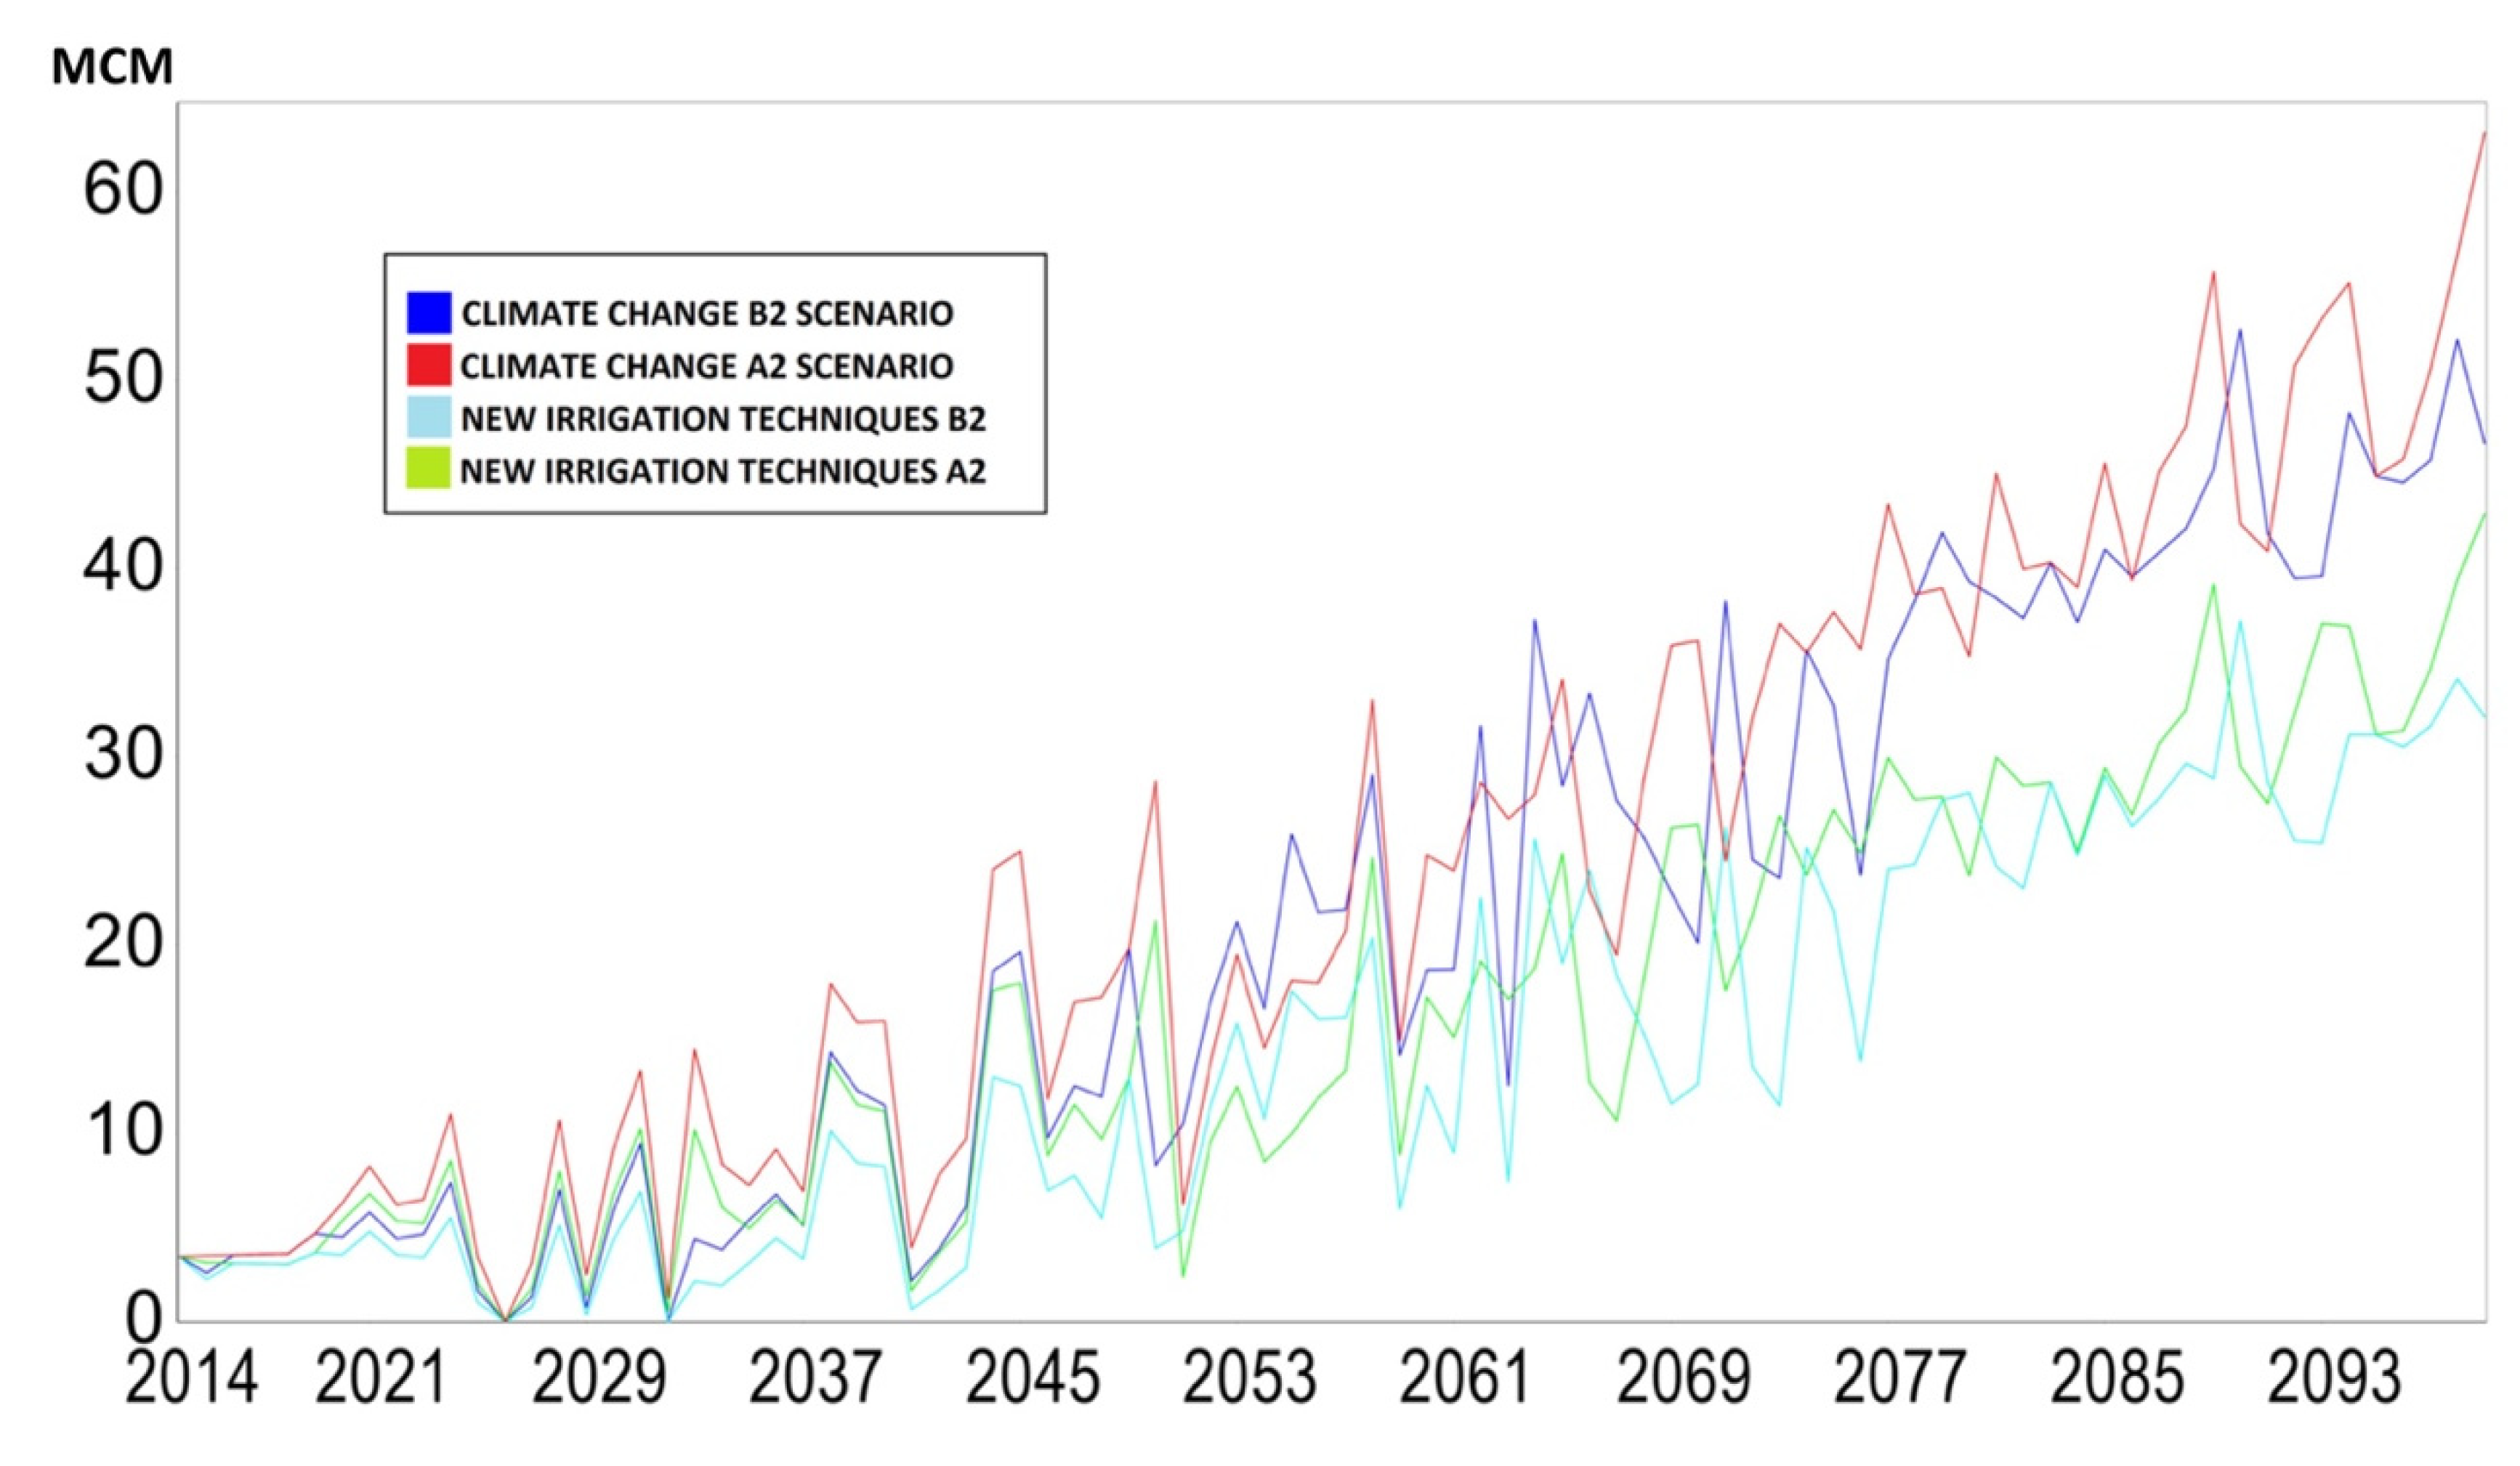
3.5. New Irrigation Technique Scenario (NIT)

This scenario was developed based on the low irrigation efficiency in the study area. The study results show that unmet water demand for agriculture would decrease by 28 MCM to reach 38 and 32 MCM, under scenarios A2 and B2, respectively (Figure 9). This is due to the widespread use of drip irrigation, which reduces water losses through infiltration and evaporation. This decrease could be the result of farmers awareness and the introduction of new and efficient irrigation techniques, as suggested in the Moroccan Green Plan and the Moroccan National Program of Irrigation water Economy. The SEGUIAS irrigation method seems inadequate to ensure current resource management and mitigate the effects of drought. According to Schilling et al. [9], climate change will lead to a 15–40% drop in primary agricultural production in the 21st century in Morocco, and future droughts are likely to unbalance social stability, by causing severe shocks on food prices. The effects of climate change on water demand are expected to be more important in agriculture than in other sectors [62]. Santillán et al. [63] showed that, in Morocco, as well as in the warmest and driest areas, irrigation may not be enough, and planning strategies would be needed.

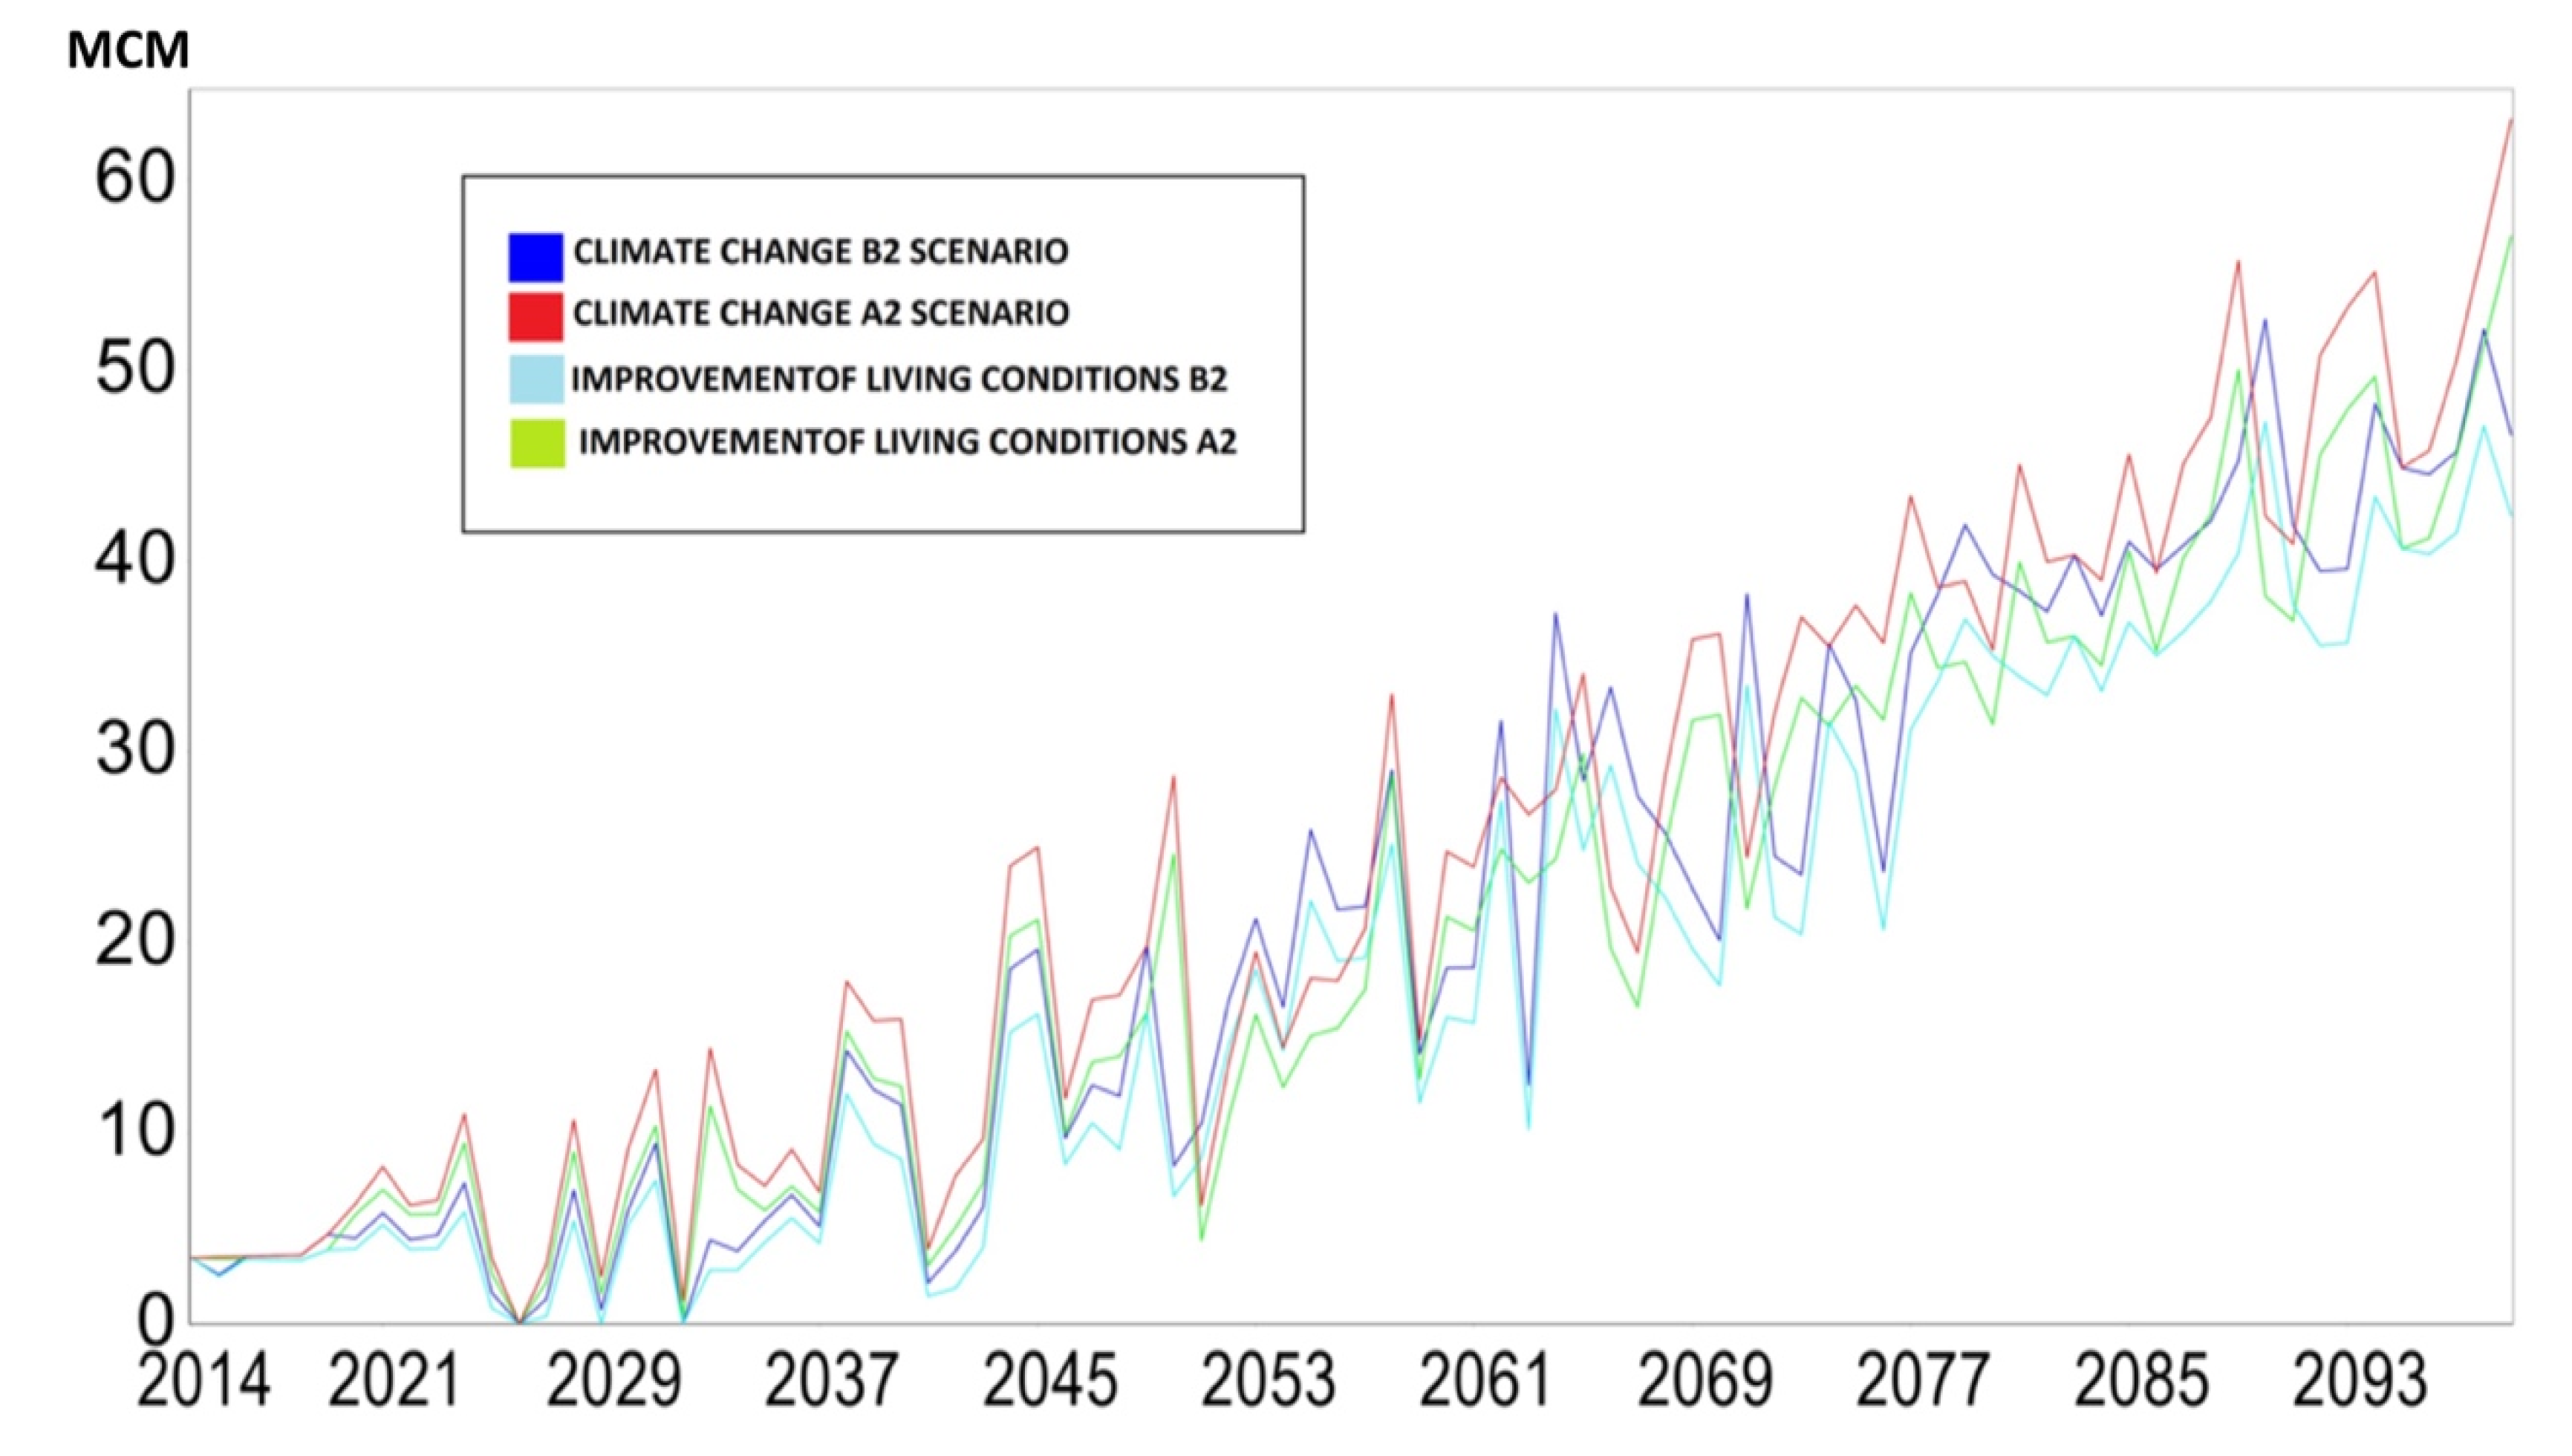
3.6. Improvement of Living Conditions (ILC)

In this scenario, we have assumed that 30% of wastewater is treated and used for various appropriate purposes such as cleaning, washing, and flushing. The results show that unmet water demand would decrease by 52 and 42 MCM in scenarios A2 and B2, respectively in 2100 (Figure 10). This decrease could be the result of the design of a sewerage system, water treatment and the re-use of treated water.

3.7. Combination of the Two Adaptation Strategies (NIT + ILC)

The combination of the two previous adaptation strategies will probably have a positive impact on the management and conservation of water resources in the Ourika watershed. The unmet demand will remain present all along the century. The results show that unmet water demand will drop to 34 and 26 MCM in scenarios A2 and B2, respectively. This scenario’s results show that unmet water demand would decrease by about 50% and 44% in scenarios B2 and A2, respectively (Figure 11).
Increasing resilience to climate change, rational and rigorous management of water resources in the Ourika watershed, is of paramount importance for the sustainable development of the region, to meet the needs of the population, to develop the potential of agricultural land and to avoid water scarcity to be an obstacle to local socio-economic progress. To mitigate the impacts of climate change and strengthen the adaptive management capacity of the Ourika watershed, several management intervention options were simulated to meet water demands with minimal possible cost and environmental impact. The results obtained should be taken into account in planning water supply. Schilling et al. [9] mentioned that Morocco’s adaptive capacities are weaker than in Europe, but greater than the capacity of the African continent, which makes these countries even more vulnerable to climate change. Therefore, the combination of the two strategies does not ensure a complete supply in the Ourika watershed. Other studies showed similar results; Amin et al. [57] estimated that the installation of dams as an adaptation strategy would reduce unmet demand in 2025 to about 60% in the study basin; Birhanu et al. [64] indicated that no water management strategy would cover 100% of the water demand by 2025 in the city of Addis Ababa, also, the results of Guermazi et al. [65] showed that it is not enough to use a single optimal cropping strategy to avoid aquifer depletion by 2050, in the Regueb watershed in Tunisia.
The planning and maintenance of water supply systems are another important aspect to increase water system resilience to climate change. Moreover, [66] confirms the usefulness of the planning water supply system based on climate change scenarios to ensure an optimal resource distribution in response to the expected reductions in water availability while satisfying current demands. Vulnerability measures for water distribution systems, as developed in [67], can inform about the capacity of the water distribution system to meet users’ needs and help to carry out proper management and maintenance of the system to ensure adequate response to natural and made-man damages.
In the Ourika watershed, the scenario of the adaptation strategy for irrigation water management is more promising for water conservation in the future. It provided better results, in the face of pressures exacerbated by climate change and population growth. This was also proven by [49], who ranked irrigation first among the 14 adaptation measures studied. The above findings indicate that, by implementing appropriate management strategies, it may be possible to improve water resource management, the irrigation deficit, and save water consumption. We consider that the results also demonstrate that the assessments of the proposed adaptation strategies are effective, but not sufficient to ensure water sustainability for the Ourika watershed.

4. Conclusions

This study combines two models, the SDSM for future climate projection and the WEAP to simulate water supply and demand in the Ourika watershed, to assess the impact of climate change and socio-economic scenarios. Like the Mediterranean basins, the SDSM results show that the Ourika watershed will face an increase in temperature and a decrease in precipitation. The developed WEAP model shows that, in the future, climatic variables and socio-economic factors will be the two main drivers of water scarcity in the basin. The results indicate that climate change and population growth exacerbate the difference between water demand and unmet demand. The unmet water demand will be 64 MCM in 2100, under the A2 climate change scenario. All scenarios reveal water shortages. Even though the proposed adaptation strategies showed a positive impact on the long-term preservation of water resources, they are not sufficient to ensure water sustainability for the Ourika watershed. Thus, we conclude that better management policies are needed in the watershed, to ensure the sustainability of water resources in the long term.
In regard to the used data and modeling approach, as with all modeling studies, there are uncertainties in the GCM results for precipitation and temperature. Although parameter calibration ensures model applicability, the conceptual nature of the SDSM tends to overestimate temperature values and underestimate precipitation values. These sources of uncertainty are taken into account in the validation and analysis of the model output. Among this modeling approach limitations, we highlight the small number of climate stations in the study area. We also suggest that future studies in the Ourika watershed use a set of GCMs other than NCEP with the most recent RCP scenarios (representative concentration pathways). These studies could provide a better understanding of modeling and simulation uncertainties. However, the high-resolution climatological data presented in this study are shown to be useful for future climate change and hydrological studies in this region.

Author Contributions

Conceptualization, M.Y.K., M.M., H.A.O.; Methodology, M.Y.K., M.M., H.A.O.; Models calibration and Validation, H.A.O., M.Y.K., A.L.; Formal Analysis, H.A.O., A.L.; Data Curation H.A.O., M.M.; Writing—Original Draft Preparation, H.A.O.; Writing—Review and Editing, A.L.; Supervision, M.Y.K. All authors have read and agreed to the published version of the manuscript.

Funding

This research received no external funding.

Acknowledgments

The authors would like to thank the regional water agency and the Regional Office of Agricultural Development Al Haouz for the great help and support to data exchange. We are grateful to SEI for the WEAP software license granted to M.Y.K.

Conflicts of Interest

The authors declare no conflicts of interest.

References

  1. Intergovernmental Panel on Climate Change. IPCC Fourth Assessment Report. Climate Change: Synthesis Report; Intergovernmental Panel on Climate Change: Geneva, Switzerland, 2007. [Google Scholar]
  2. Stocker, T.; Qin, D.; Plattner, G.; Tignor, M.; Allen, S.; Boschung, J.; Nauels, A.; Xia, Y.; Bex, V.; Midgley, P.M. Climate Change 2013: The Physical Science Basis. Contribution of Working Group I to the Fifth Assessment Report of the Intergovernmental Panel on Climate Change; Cambridge University Press: Cambridge, UK; New York, NY, USA, 2013; pp. 1–14. [Google Scholar]
  3. Trenberth, K.E.; Fasullo, J.T.; Shepherd, T.G. Attribution of climate extreme events. Nat. Clim. Chang. 2015, 58, 725–730. [Google Scholar] [CrossRef]
  4. Flato, G.; Marotzke, J.; Abiodun, B.; Braconnot, P.; Chou, S.C.; Collins, W.J. Evaluation of climate models. The physical science basis. Contribution of working group I to the fifth assessment report of the intergovernmentalpanel on climate change. Clim. Chang. 2013, 5, 741–866. [Google Scholar] [CrossRef] [Green Version]
  5. Chang, H.; Bonnette, M.R. Climate change and water-related ecosystem services: Impacts of drought in California, USA. Ecosyst. Health Sustain. 2016, 2, 1254. [Google Scholar] [CrossRef]
  6. Vörösmarty, C.J.; McIntyre, P.B.; Gessner, M.O.; Dudgeon, D.; Prusevich, A.; Green, P.; Glidden, S.; Bunn, S.E.; Sullivan, C.A.; Reidy Liermann, C.; et al. Global threats to human water security and river biodiversity. Nature 2010, 467, 555–561. [Google Scholar] [CrossRef]
  7. Hoekstra, A.Y.; Mekonnen, M.M.; Chapagain, A.K.; Mathews, R.E.; Richter, B.D. Global monthly water scarcity: Blue water footprints versus blue water availability. PLoS ONE 2012, 7, e32688. [Google Scholar] [CrossRef]
  8. Lionello, P.; Abrantes, F.; Congedi, L.; Dulac, F.; Gacic, M.; Gomis, D.; Goodess, C.; Hoff, H.; Kutiel, H.; Luterbacher, J.; et al. Introduction: Mediterranean climate: Background information. Clim. Mediter. Reg. 2012. [Google Scholar] [CrossRef] [Green Version]
  9. Schilling, J.; Freier, K.P.; Hertig, E.; Scheffran, J. Climate change, vulnerability and adaptation in North Africa with focus on Morocco. Agric. Ecosyst. Environ. 2012, 156, 12–26. [Google Scholar] [CrossRef]
  10. Lionello, P.; Scarascia, L. The relation between climate change in the Mediterranean region and global warming. Reg. Environ. Chang. 2018, 18, 1481–1493. [Google Scholar] [CrossRef]
  11. Ulbrich, U.; Xoplaki, E.; Dobricic, S.; García-Herrera, R.; Lionello, P.; Adani, M.; Baldi, M.; Barriopedro, D.; Coccimiglio, P.; Dalu, G.; et al. Past and current climate changes in the Mediterranean region. Reg. Assess. Clim. Chang. Mediter. 2013, 9–52. [Google Scholar] [CrossRef]
  12. Simonneaux, V.; Cheggour, A.; Deschamps, C.; Mouillot, F.; Cerdan, O.; Le Bissonnais, Y. Land use and climate change effects on soil erosion in a semi-arid mountainous watershed (High Atlas, Morocco). J. Arid Environ. 2015, 122, 64–75. [Google Scholar] [CrossRef] [Green Version]
  13. Gulacha, M.M.; Mulungu, D.M. Generation of climate change scenarios for precipitation and temperature at local scales using SDSM in Wami-Ruvu River Basin Tanzania. Phys. Chem. Earth Part A/B/C 2017, 100, 62–72. [Google Scholar] [CrossRef]
  14. Gebremeskel, S.; Liu, Y.B.; de Smedt, F.; Hoffmann, L.; Pfister, L. Analysing the effect of climate changes on streamflow using statistically downscaled GCM scenarios. Int. J. River Basin Manag. 2004, 2, 271–280. [Google Scholar] [CrossRef]
  15. Park, J.Y.; Park, M.J.; Joh, H.K.; Shin, H.J.; Kwon, H.J.; Srinivasan, R.; Kim, S.J. Assessment of MIROC3.2 HiRes climate and CLUE-s land use change impacts on watershed hydrology using SWAT. Trans. ASABE 2011, 54, 1713–1724. [Google Scholar] [CrossRef]
  16. Xu, C.Y. From GCMs to river flow: A review of downscaling methods and hydrologic modelling approaches. Prog. Phys. Geogr. 1999, 23, 229–249. [Google Scholar] [CrossRef]
  17. Olsson, T.; Kämäräinen, M.; Santos, D.; Seitola, T.; Tuomenvirta, H.; Haavisto, R.; Lavado-Casimiro, W. Downscaling climate projections for the Peruvian coastal Chancay-Huaral Basin to support river discharge modeling with WEAP. J. Hydrol. Reg. Stud. 2017, 13, 26–42. [Google Scholar] [CrossRef]
  18. Arnold, J.G.; Fohrer, N. SWAT2000: Current Capabilities and Research Opportunities in Applied Watershed Modelling. Hydrol. Process. 2005, 19, 563–572. [Google Scholar] [CrossRef]
  19. Cutlac, I.M.; Horbulyk, T.M. optimal water allocation under short-run water scarcity in the South Saskatchewan River Basin. J. Water Resour. Plan. Manag. 2011, 137, 92–100. [Google Scholar] [CrossRef]
  20. De Cardoso Salis, H.H.; Monteiro da Costa, A.; Moreira Vianna, J.H.; Azeneth Schuler, M.; Künne, A.; Sanches Fernandes, L.F.; Leal Pacheco, F.A. Hydrologic Modeling for Sustainable Water Resources Management in Urbanized Karst Areas. Int. J. Environ. Res. Public Health 2019, 16, 2542. [Google Scholar] [CrossRef] [PubMed] [Green Version]
  21. Inam, A.; Adamowski, J.; Prasher, S.; Halbe, J.; Malard, J.; Albano, R. Coupling of a distributed stakeholder-built system dynamics socio-economic model with SAHYSMOD for sustainable soil salinity management–Part 1: Model development. J. Hydrol. 2017, 551, 596–618. [Google Scholar] [CrossRef]
  22. Heidari, A. Application of multidisciplinary water resources planning tools for two of the largest rivers of Iran. J. Appl. Water Eng. Res. 2018, 6, 150–161. [Google Scholar] [CrossRef]
  23. Mauser, W.; Prasch, M. Regional Assessment of Global Change Impacts: The Project GLOWA-Danube; Springer: Berlin, Germany, 2015. [Google Scholar] [CrossRef]
  24. Asghar, A.; Iqbal, J.; Amin, A.; Ribbe., L. Integrated hydrological modeling for assessment of water demand and supply under socio-economic and IPCC climate change scenarios using WEAP in Central Indus Basin. J. Water Supply Res. Technol.—AQUA 2019, 68, 136–148. [Google Scholar] [CrossRef] [Green Version]
  25. Salomón-Sirolesi, M.; Farinós-Dasí, J. A New Water Governance Model Aimed at Supply–Demand Management for Irrigation and Land Development in the Mendoza River Basin, Argentina. Water 2019, 11, 463. [Google Scholar] [CrossRef] [Green Version]
  26. Miraji, M.; Liu, J.; Zheng, C. The Impacts of Water Demand and Its Implications for Future Surface Water Resource Management: The Case of Tanzania’s WamiRuvu Basin (WRB). Water 2019, 11, 1280. [Google Scholar] [CrossRef] [Green Version]
  27. Amisigo, B.; McCluskey, A.; Swanson, R. Modeling impact of climate change on water resources and agriculture demand in the Volta Basin and other basin systems in Ghana. Sustainability 2015, 7, 6957–6975. [Google Scholar] [CrossRef] [Green Version]
  28. Metobwa, O.G.M.; Mourad, K.A.; Ribbe, L. Water demand simulation using WEAP 21: A case study of the Mara River Basin, Kenya. Int. J. Nat. Resour. Ecol. Manag. 2018, 3, 9–18. [Google Scholar] [CrossRef]
  29. Rochdane, S.; Reichert, B.; Messouli, M.; Babqiqi, A.; Khebiza, M.Y. Climate change impacts on water supply and demand in Rheraya Watershed (Morocco), with potential adaptation strategies. Water 2012, 4, 28–44. [Google Scholar] [CrossRef] [Green Version]
  30. Saidi, M.E.; Daoudi, L.; Aresmouk, M.E.H.; Fniguire, F.; Boukrim, S. Floods of Oued Ourika (High Atlas, Morocco): Extreme events in semi-arid mountain condition. Comun. Geol. 2010, 97, 113–128. [Google Scholar]
  31. Baba, M.; Gascoin, S.; Jarlan, L.; Simonneaux, V.; Hanich, L. Variations of the Snow Water Equivalent in the Ourika Catchment (Morocco) over 2000–2018 Using Downscaled MERRA-2 Data. Water 2018, 10, 1120. [Google Scholar] [CrossRef] [Green Version]
  32. Wilby, R.L.; Dawson, C.W.; Barrow, E.M. SDSM—A decision support tool for the assessment of regional climate change impacts. Environ. Modell. Softw. 2001, 17, 145–157. [Google Scholar] [CrossRef]
  33. Karmaoui, A.; Minucci, G.; Messouli, M.; Khebiza, M.Y.; Ifaadassan, I.; Babqiqi, A. Climate Change Impacts on Water Supply System of the Middle Draa Valley in South Morocco. In Climate Change, Food Security and Natural Resource Management; Springer: Cham, Switzerland, 2019; pp. 163–178. [Google Scholar]
  34. Mahmood, R.; Babel, M.S. Future changes in extreme temperature events using the statistical downscaling model (SDSM) in the trans-boundary region of the Jhelum riverbasin. Weather Clim. Extrem. 2014, 5, 56–66. [Google Scholar] [CrossRef] [Green Version]
  35. Wilby, R.L.; Dawson, C.W. Using SDSM Version 3.1—A Decision Support Tool for the Assessment of Regional Climate Change Impacts. 2004 User Manual. Available online: https://unfccc.int/resource/cd_roms/na1/v_and_a/Resoursce_materials/Climate/SDSM/SDSM.Manual.pdf (accessed on 12 March 2020).
  36. Huang, J.; Zhang, J.; Zhang, Z.; Xu, C.; Wang, B.; Yao, J. Estimation of future precipitation change in the Yangtze River basin by using statistical downscaling method. Stoch. Environ. Res. Risk 2011, 25, 781–792. [Google Scholar] [CrossRef]
  37. Mahmood, R.; Babel, M.S. Evaluation of SDSM developed by annual and monthly sub-models for downscaling temperature and precipitation in the Jhelum basin, Pakistan and India. Theor. Appl. Climatol. 2013, 113, 27–44. [Google Scholar] [CrossRef]
  38. Hassan, Z.; Shamsudin, S.; Harun, S. Application of SDSM and LARS-WG for simulating and downscaling of rainfall and temperature. Theor. Appl. Climatol. 2013, 116, 243–257. [Google Scholar] [CrossRef]
  39. Deb, P.; Kiem, A.S.; Babel, M.S.; Chu, S.T.; Chakma, B. Evaluation of climate change impacts and adaptation strategies for maize cultivation in the Himalayan foothills of India. J. Water. Clim. Chang. 2015, 6, 596–614. [Google Scholar] [CrossRef]
  40. Dibike, Y.B.; Coulibaly, P. Temporal neural networks for downscaling climate variability and extremes. Neural Netw. 2006, 19, 135–144. [Google Scholar] [CrossRef]
  41. Chen, J.; Brissette, F.P.; Lucas-Picher, P. Assessing the limits of bias-correcting climate model outputs for climate change impact studies. J. Geophys. Res. Atmos. 2015, 120, 1123–1136. [Google Scholar] [CrossRef]
  42. Salzmann, N.; Frei, C.; Vidale, P.L.; Hoelzle, M. The application of Regional Climate Model output for the simulation of high-mountain permafrost scenarios. Glob. Planet. Chang. 2007, 56, 188–202. [Google Scholar] [CrossRef]
  43. Li, X.; Zhao, Y.; Shi, C.; Sha, J.; Wang, Z.L.; Wang, Y. Application of Water Evaluation and Planning (WEAP) model for water resources management strategy estimation in coastal Binhai New Area, China. Ocean Coast. Manag. 2015, 106, 97–109. [Google Scholar] [CrossRef]
  44. Ingol-Blanco, E.; McKinney, D.C. Development of a Hydrological Model for the Rio Conchos Basin. J. Hydrol. Eng. 2013, 18, 340–351. [Google Scholar] [CrossRef]
  45. Ahmadaali, J.; Barani, G.A.; Qaderi, K.; Hessari, B. Analysis of the effects of water management strategies and climate change on the environmental and agricultural sustainability of Urmia Lake Basin, Iran. Water 2018, 10, 160. [Google Scholar] [CrossRef] [Green Version]
  46. Khalil, A.; Rittima, A.; Phankamolsil, Y. The projected changes in water status of the Mae Klong Basin, Thailand, using WEAP model. Paddy Water Environ. 2018, 16, 439–455. [Google Scholar] [CrossRef]
  47. Agarwal, S.; Patil, J.P.; Goyal, V.C.; Singh, A. Assessment of Water Supply–Demand Using Water Evaluation and Planning (WEAP) Model for Ur River Watershed, Madhya Pradesh, India. J. Inst. Eng. 2019, 100, 21–32. [Google Scholar] [CrossRef]
  48. Sieber, J.; Purkey, D. Water Evaluation and Planning System; User Guide; Stockholm Environment Institute; US Center: Somerville, MA, USA, 2015; Available online: https://www.weap21.org/downloads/WEAP_User_Guide.pdf (accessed on 12 March 2020).
  49. Seif-Ennasr, M.; Zaaboul, R.; Hirich, A.; Caroletti, G.N.; Bouchaou, L.; El Morjani, Z.E.A.; Beraaouz, E.; McDonnellb, R.A.; Choukr-Allah, R. Climate change and adaptive water management measures in ChtoukaAït Baha region (Morocco). Sci. Total Environ. 2016, 573, 862–875. [Google Scholar] [CrossRef] [PubMed]
  50. Ouhamdouch, S.; Bahir, M. Climate change impact on future rainfall and temperature in semi-arid areas (Essaouira Basin, Morocco). Environ. Process. 2017, 4, 975–990. [Google Scholar] [CrossRef]
  51. Gebrehiwot, T.; van der Veen, A. Assessing the evidence of climate variability in the northern part of Ethiopia. J. Dev. Agric. Econ. 2013, 5, 104–119. [Google Scholar] [CrossRef] [Green Version]
  52. Gebremeskel, G.; Kebede, A. Estimating the effect of climate change on water resources: Integrated use of climate and hydrological models in the Werii watershed of the Tekeze river basin, Northern Ethiopia. Agric. Nat. Resour. 2018, 52, 195–207. [Google Scholar] [CrossRef]
  53. Gupta, H.V.; Kling, H. On typical range, sensitivity, and normalization of Mean Squared Error and Nash-Sutcliffe Efficiency type metrics. Water Resour. Res. 2011, 47. [Google Scholar] [CrossRef]
  54. Ritter, A.; Muñoz-Carpena, R. Performance evaluation of hydrological models: Statistical significance for reducing subjectivity in goodness-of-fit assessments. J. Hydrol. 2013, 480, 33–45. [Google Scholar] [CrossRef]
  55. Okyereh, S.A.; Ofosu, E.A.; Kabobah, A.T. Modelling the impact of Bui dam operations on downstream competing water uses. Water-Energy Nexus 2019, 2, 1–9. [Google Scholar] [CrossRef]
  56. Hellegers, P.; Immerzeel, W.; Droogers, P. Economic concepts to address future water supply–demand imbalances in Iran, Morocco and Saudi Arabia. J. Hydrol. 2013, 502, 62–67. [Google Scholar] [CrossRef]
  57. Amin, A.; Iqbal, J.; Asghar, A.; Ribbe, L. Analysis of current and future water demands in the Upper Indus Basin under IPCC climate and socio-economic scenarios using a hydro-economic WEAP model. Water 2018, 10, 537. [Google Scholar] [CrossRef] [Green Version]
  58. Droogers, P.; Immerzeel, W.W.; Terink, W.; Hoogeveen, J.; Bierkens, M.F.P.; Van Beek, L.P.H.; Debele, B. Water resources trends in Middle East and North Africa towards 2050. Hydrol. Earth Syst. Sci. 2012, 16, 3101–3114. [Google Scholar] [CrossRef] [Green Version]
  59. Toure, A.; Diekkrüger, B.; Mariko, A.; Cissé, A.S. Assessment of groundwater resources in the context of climate change and population growth: Case of the klela basin in southern mali. Climate 2017, 5, 45. [Google Scholar] [CrossRef]
  60. Gebrechorkos, S.H.; Bernhofer, C.; Hülsmann, S. Impacts of projected change in climate on water balance in basins of East Africa. Sci. Total Environ. 2019, 682, 160–170. [Google Scholar] [CrossRef] [PubMed]
  61. Hammouri, N.; Adamowski, J.; Freiwan, M.; Prasher, S. Climate change impacts on surface water resources in arid and semi-arid regions: A case study in northern Jordan. Acta Geod. Geophys. 2017, 52, 141–156. [Google Scholar] [CrossRef] [Green Version]
  62. Wang, X.J.; Zhang, J.Y.; Shahid, S.; Guan, E.H.; Wu, Y.X.; Gao, J.; He, R.M. Adaptation to climate change impacts on water demand. Mitig. Adapt. Strateg. Glob. Chang. 2016, 21, 81–99. [Google Scholar] [CrossRef]
  63. Santillán, D.; Garrote, L.; Iglesias, A.; Sotes, V. Climate change risks and adaptation: New indicators for Mediterranean viticulture. Mitig. Adapt. Strateg. Glob. Chang. 2019, 1–19. [Google Scholar] [CrossRef]
  64. Birhanu, B.; Kebede, S.; Masetti, M.; Ayenew, T. WEAP-MODFLOW dynamic modeling approach to evaluate surface water and groundwater supply sources of Addis Ababa city. Acque Sotterr.-Ital. J. Groundw. 2018, 7. [Google Scholar] [CrossRef]
  65. Guermazi, E.; Milano, M.; Reynard, E.; Zairi, M. Impact of climate change and anthropogenic pressure on the groundwater resources in arid environment. Mitig. Adapt. Strateg. Glob. Chang. 2019, 24, 73–92. [Google Scholar] [CrossRef]
  66. Maiolo, M.; Mendino, G.; Pantusa, D.; Senatore, A. Optimization of drinking water distribution systems in relation to the effects of climate change. Water 2017, 9, 803. [Google Scholar] [CrossRef]
  67. Maiolo, M.; Pantusa, D.; Carini, M.; Capano, G.; Chiaravalloti, F.; Procopio, A. A new vulnerability measure for water distribution network. Water 2018, 10, 1005. [Google Scholar] [CrossRef] [Green Version]
Figure 1. The study area map showing the locations of the river, stream flow gauges, climate stations, villages and elevation.
Water 12 01751 g001
Figure 2. Monthly mean temperature and precipitation at weather stations for the period of (1970–2014) in Ourika watershed.
Water 12 01751 g002
Figure 3. Monthly mean runoff in the Ourika watershed for the period of (1970–2014).
Water 12 01751 g003
Figure 4. Projected precipitation for the future period until 2100.
Water 12 01751 g004
Figure 5. Projected Max and Min Temperatures for the future period until 2100.
Water 12 01751 g005
Figure 6. Observed and simulated monthly streamflow for calibration and validation periods of the five-gauge stations obtained from water assessment and planning tool (WEAP) model for the Ourika watershed.
Water 12 01751 g006
Figure 7. The unmet water demand for the reference scenario and high population growth scenario.
Water 12 01751 g007
Figure 8. Annual unmet water demand under climate change scenario.
Water 12 01751 g008
Figure 9. Change in unmet water demand under climate change scenarios associated with new irrigation techniques.
Water 12 01751 g009
Figure 10. Change in unmet water demand under climate change scenario associated with improvement of living conditions.
Water 12 01751 g010
Figure 11. Change in unmet water demand under climate change scenario associated with the combination of two adaptation strategies.
Water 12 01751 g011
Table 1. Sources and information of the used datasets.
DataDescriptionSources
Remote sensing dataDigital Elevation Model 30 m; MODIS land cover (2014);USGS (https://earthexplorer.usgs.gov)
Large-scale climate variablesNCEP: Reanalyzed atmospheric dataset (1961–2014)
HadCM3: A2 and B2 scenarios, (1961–2099)
NCEP (https://www.ncep.noaa.gov)
HADCM3 (https://www.ipcc-data.org/)
Climate dataPrecipitation; Temperature; Humidity; EvapotranspirationTensift Watershed Agency (Morocco);
Hydrological dataGauge stations data: (2000–2014)Tensift Watershed Agency (Morocco);
Demand dataLand use data
Urban sector
Population Water use rates
Water consumption
Agricultural demand
Population and growth rates
Tensift Watershed Agency; (Morocco);
Regional Office for Agricultural Development of Al Haaouz; (Morocco);
Table 2. Statistical comparison of downscaled and observed mean monthly precipitation, maximum and minimum temperatures, during calibration and validation after bias correction.
PredictandCalibrationValidation (with Bias Correction)
E%SER2 %RMSEμϬRE μ%RE Ϭ%
Precipitation (mm/day)21.00.52
Statistical Downscaling Model (SDSM)-M
SDSM-A
74
58
9.76
23.54
65.00
72
13.41
21.63
−4.85
−7.19
−5.47
−3.0
Tmax (°C/day)65.03.16R2 %RMSEμϬRE μ °CRE Ϭ °C
SDSM-M
SDSM-A
88.0
90.0
1.21
1.80
18.65
23.00
4.07
7.31
−0.3
−0.16
−0.28
−1.76
Tmin (°C/day)79.02.64
SDSM-M
SDSM-A
96.0
97.3
0.96
1.33
5.12
8.14
4.33
5.12
−0.07
−0.16
−0.14
−0.98
Table 3. Projected changes in average annual precipitation, T-max and T-min (°C), compared to baseline period in Ourika watershed.
Predictand20s50s80s
A2B2A2B2A2B2
P (%)9.988.2133.5623.6849.2534.61
Tmax (°C)1.61.32.72.24.23.6
Tmin (°C)2.01.32.62.13.52.9

