Article

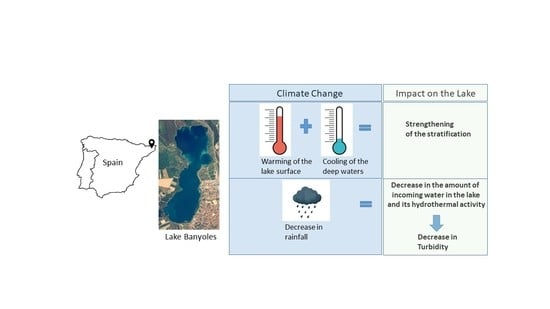
The Mixing Regime and Turbidity of Lake Banyoles (NE Spain): Response to Climate Change

1
Department of Physics, University of Girona, 17003 Girona, Spain
2
Institut de Ciències del Mar, CSIC, 08003 Barcelona, Spain
3
Water Quality Department, Aigües de Banyoles, 17820 Banyoles, Spain
*
Author to whom correspondence should be addressed.
Water 2020, 12(6), 1621; https://doi.org/10.3390/w12061621
Submission received: 8 May 2020 / Revised: 3 June 2020 / Accepted: 4 June 2020 / Published: 6 June 2020

Abstract

:
This study analyses the water temperature changes in Lake Banyoles over the past four decades. Lake Banyoles, Spain’s second highest lake, situated in the western Mediterranean (NE Iberian Peninsula). Over the past 44 years, the warming trend of the lake’s surface waters (0.52 °C decade−1) and the cooling trend of its deep waters (−0.66 °C decade−1) during summer (July–September) have resulted in an increased degree of stratification. Furthermore, the stratification period is currently double that of the 1970s. Meanwhile, over the past two decades, lake surface turbidity has remained constant in summer. Although turbidity did decrease during winter, it still remained higher than in the summer months. This reduction in turbidity is likely associated with the decrease in groundwater input into the lake, which has been caused by a significant decrease in rainfall in the aquifer recharge area that feeds the lake through groundwater sources. As a unique freshwater sentinel lake under the influence of the climate change, Lake Banyoles provides evidence that global warming in the western Mediterranean boosts the strength and duration of the lake’s stratification and, in response, the associated decrease in the turbidity of its epilimnion.

Graphical Abstract

1. Introduction

Lakes can be considered sentinels of current climate condition and, therefore, are critical to understanding the effects global climate change on aquatic ecosystems [1]. Studies of lake responses to climate change have assessed the warming of the surface layers in lakes around the globe [2]. From 1985 to 2009, the summer surface water temperature of 211 lakes studied warmed at a rate in the range of 0–1 °C decade−1 (depending on the region) [2]. O’Reilly et al. [2] attributed this trend in the temperature of the water surface to the rapid annual increase in air temperature (with a mean of 0.25 °C decade−1). Zhang et al. [3] attributed the increase in the temperature of the water surface to the increment in the air temperature and the wind velocity reduction.
Lakes can be classified according to their stratification, i.e., whether they mix continuously, mix frequently, or never mix at all. Monomictic lakes, for instance, are those that mix once a year, while meromictic lakes are permanently stratified [4]. The evolution of the thermal stratification in 26 globally-distributed lakes [2] proved that lake stratification depends on lake morphometry, the surface average temperature of the lake and its temperature trend [2,5]. A decrease in long term trends of the surface wind speed was found to reduce the mixing in lake Võrtsjärv (Estonia) [6]. The warming trend of surface water layers of lakes also results in an increase in the lake stratification strength [7]. This implies that lakes currently classified as monomictic may shift to permanently stratified systems by the end of the 21st century [4,8]. In other words, the increase in the length of stratification indicates that those lakes will tend to mix less frequently in response to climate change. Moreover, the strengthening of stratification has been found to have collateral effects. For example, the stratification of the water column plays a crucial role in their productivity since it determines the transport of the nutrients being transported through it [6]. For instance, in the case of Lake Tanganyika (the African Great Lake), a decrease in the supply of nutrients from its bottom waters consequently led to a decrease in its aquatic productivity [9]. On the other hand, Lake Superior, the largest of the Laurentian Great Lakes, has experienced an increase in the warming of its surface waters due to climate change, which has produced a subsequent increase in the lake’s productivity because of the now shorter ice-cover period and the higher temperature of its surface waters [10]. In lake Võrtsjärv [6], the increase in the lake stratification has resulted in a decrease in the lake sediment resuspension, giving the opportunity to phytoplankton species to thrive in the water column where they were not previously present. Moreover, long-term studies on lakes have shown that the water clarity also impacts on its water temperature [11] and its stratification [12]. In this sense, the water clarity can enhance or inhibit the warming effects caused by climate change depending on the lake depth and also on the direction of the change of the water clarity [12].
Many continental aquatic environments (rivers, lakes and wetlands) depend on underground waters, and the recharge of those aquifers directly depends on the amount of rain that falls [13]. This is especially relevant in semiarid areas where recharge usually takes place after intense rainfall events [14]. The close dependence of aquatic ecosystems on subterranean waters and rainfall patterns makes them vulnerable to any variability in rainfall, (something which is more accentuated in the Mediterranean area [15]) and, as such, is a priority for the European Framework Directive of Water (2006/118/EC).
There is a distinct lack of literature concerning the impact climate change has had on the Spanish Mediterranean lakes and also its impact on the west Mediterranean area. Therefore, knowledge of the evolution of Lake Banyoles (NE Spain) might provide some significant and valuable information concerning the effects of climate change might have in the region. As the average air temperature on the Iberian Peninsula is predicted to increase 1.2 °C every 30 years in winter and of 2.1 °C every 30 years in summer [15,16] throughout the 21st century, it is essential to further quantify the increase in water temperature that water bodies are experiencing, as well as understand the impact this increase will have on their mixing regimes and biogeochemistry status. Herein, we address the surface and deep-water temperature trends of the lake and the impact climate change is having on the strength and the length of its stratification. Furthermore, we provide key data on the evolution of the lake’s surface turbidity over the past two decades. This manuscript will contribute to broadening knowledge about the responses natural, fresh-water inland lakes in the Mediterranean area are making to climate change.

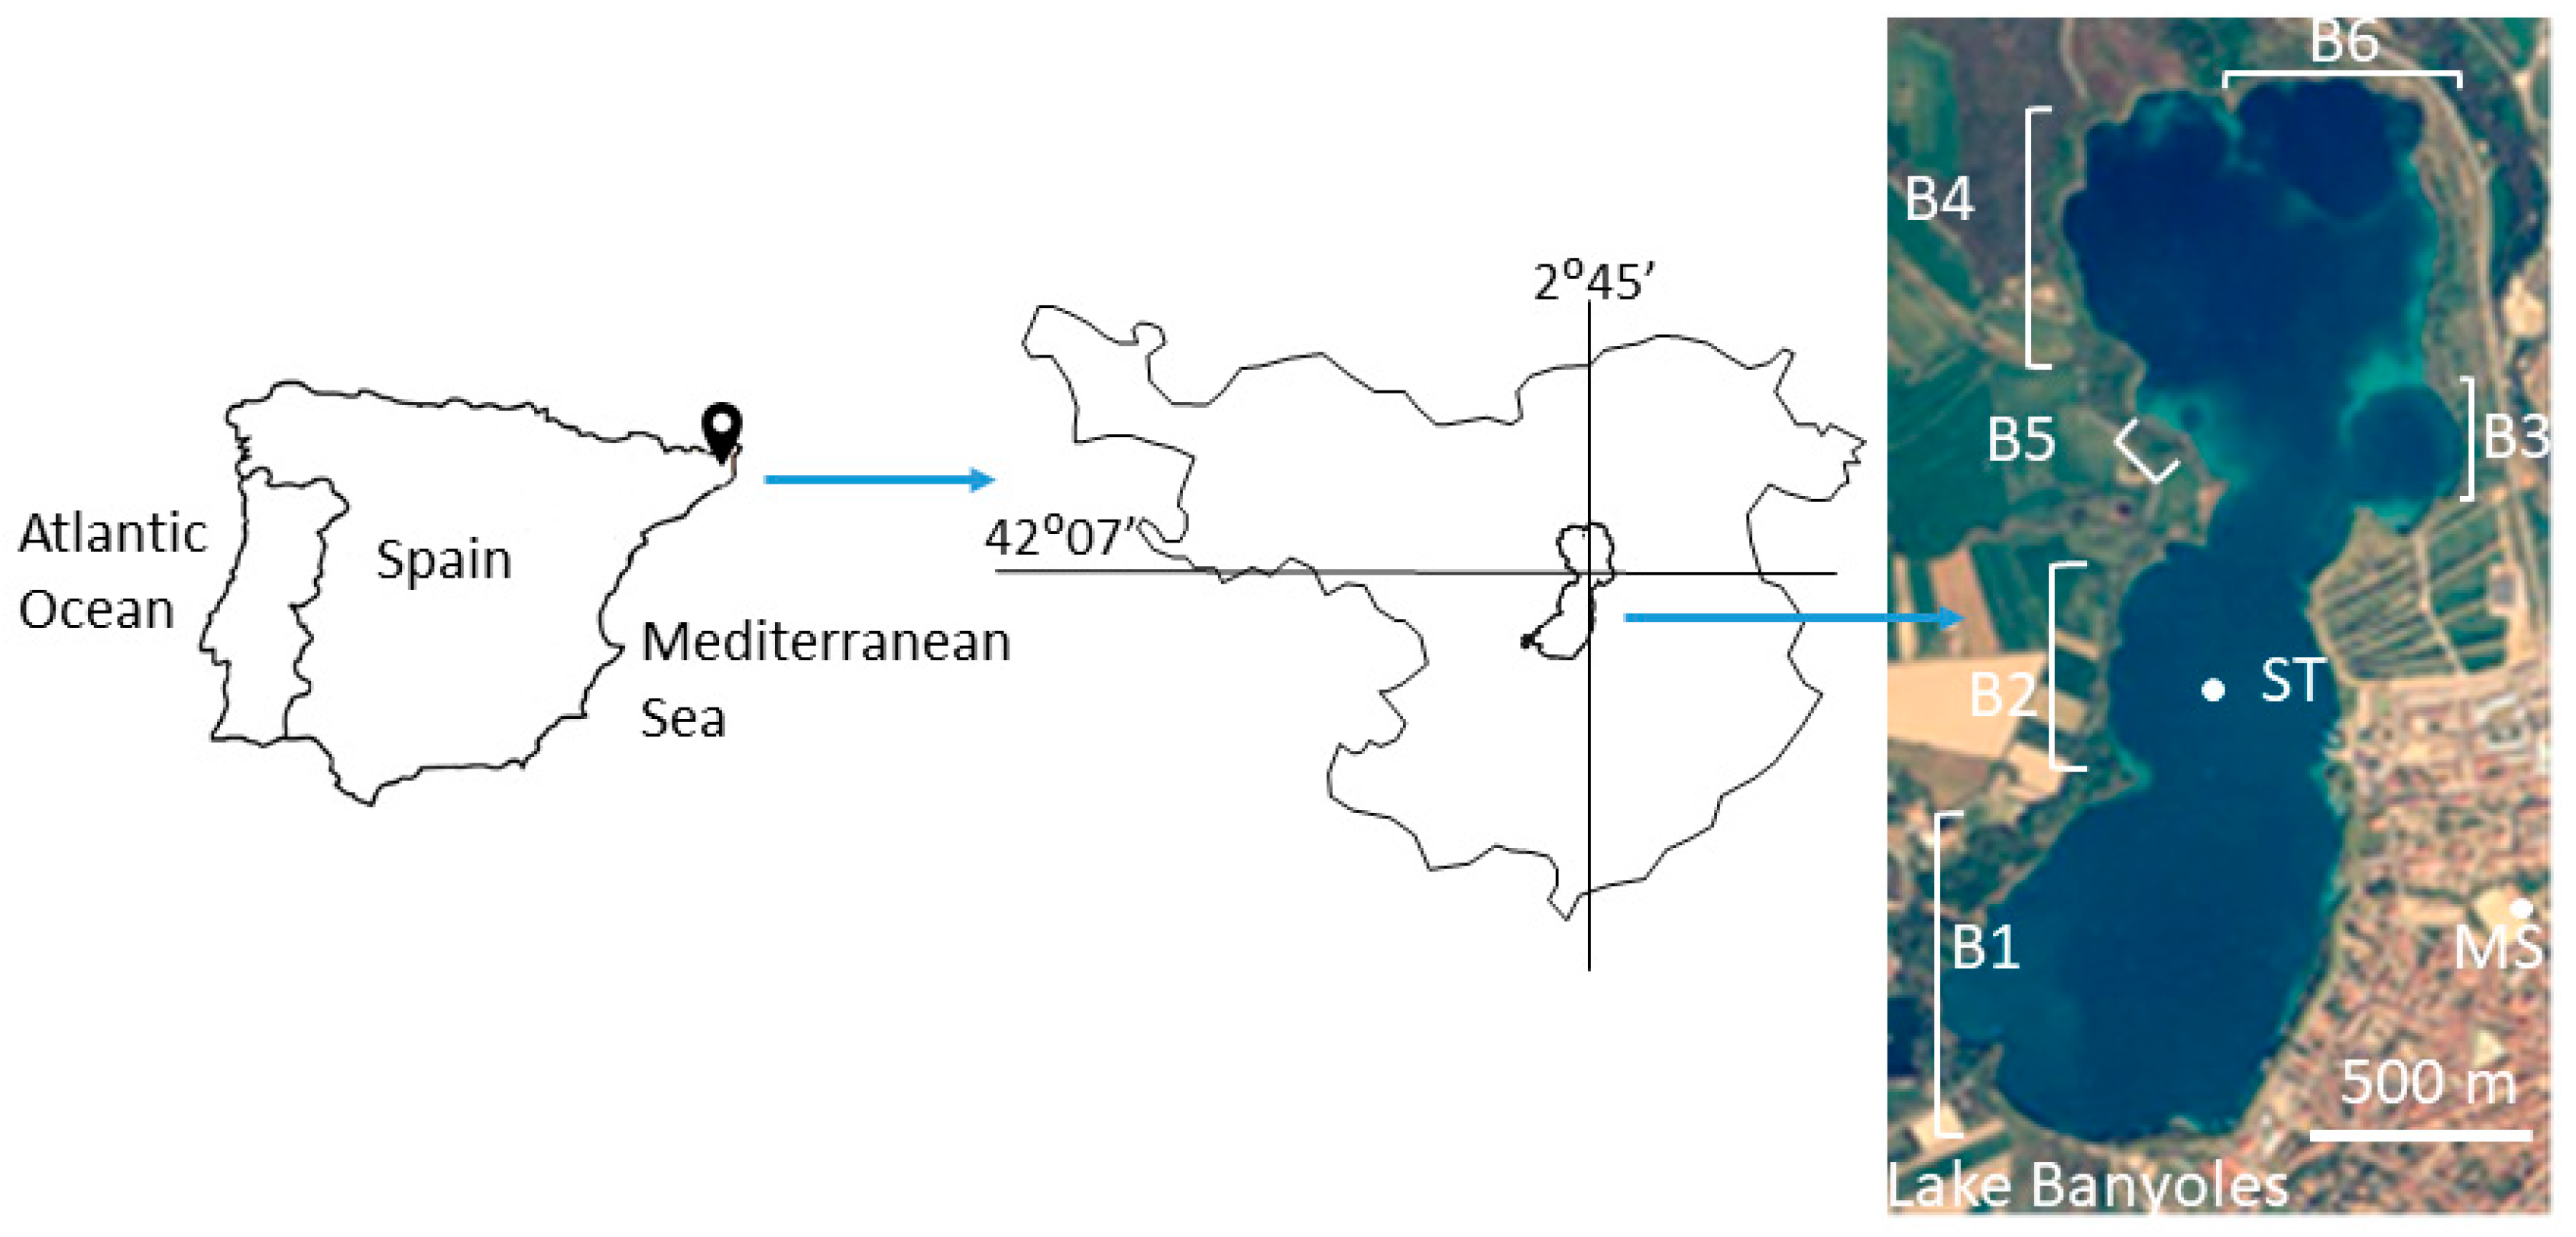
2. Materials and Methods
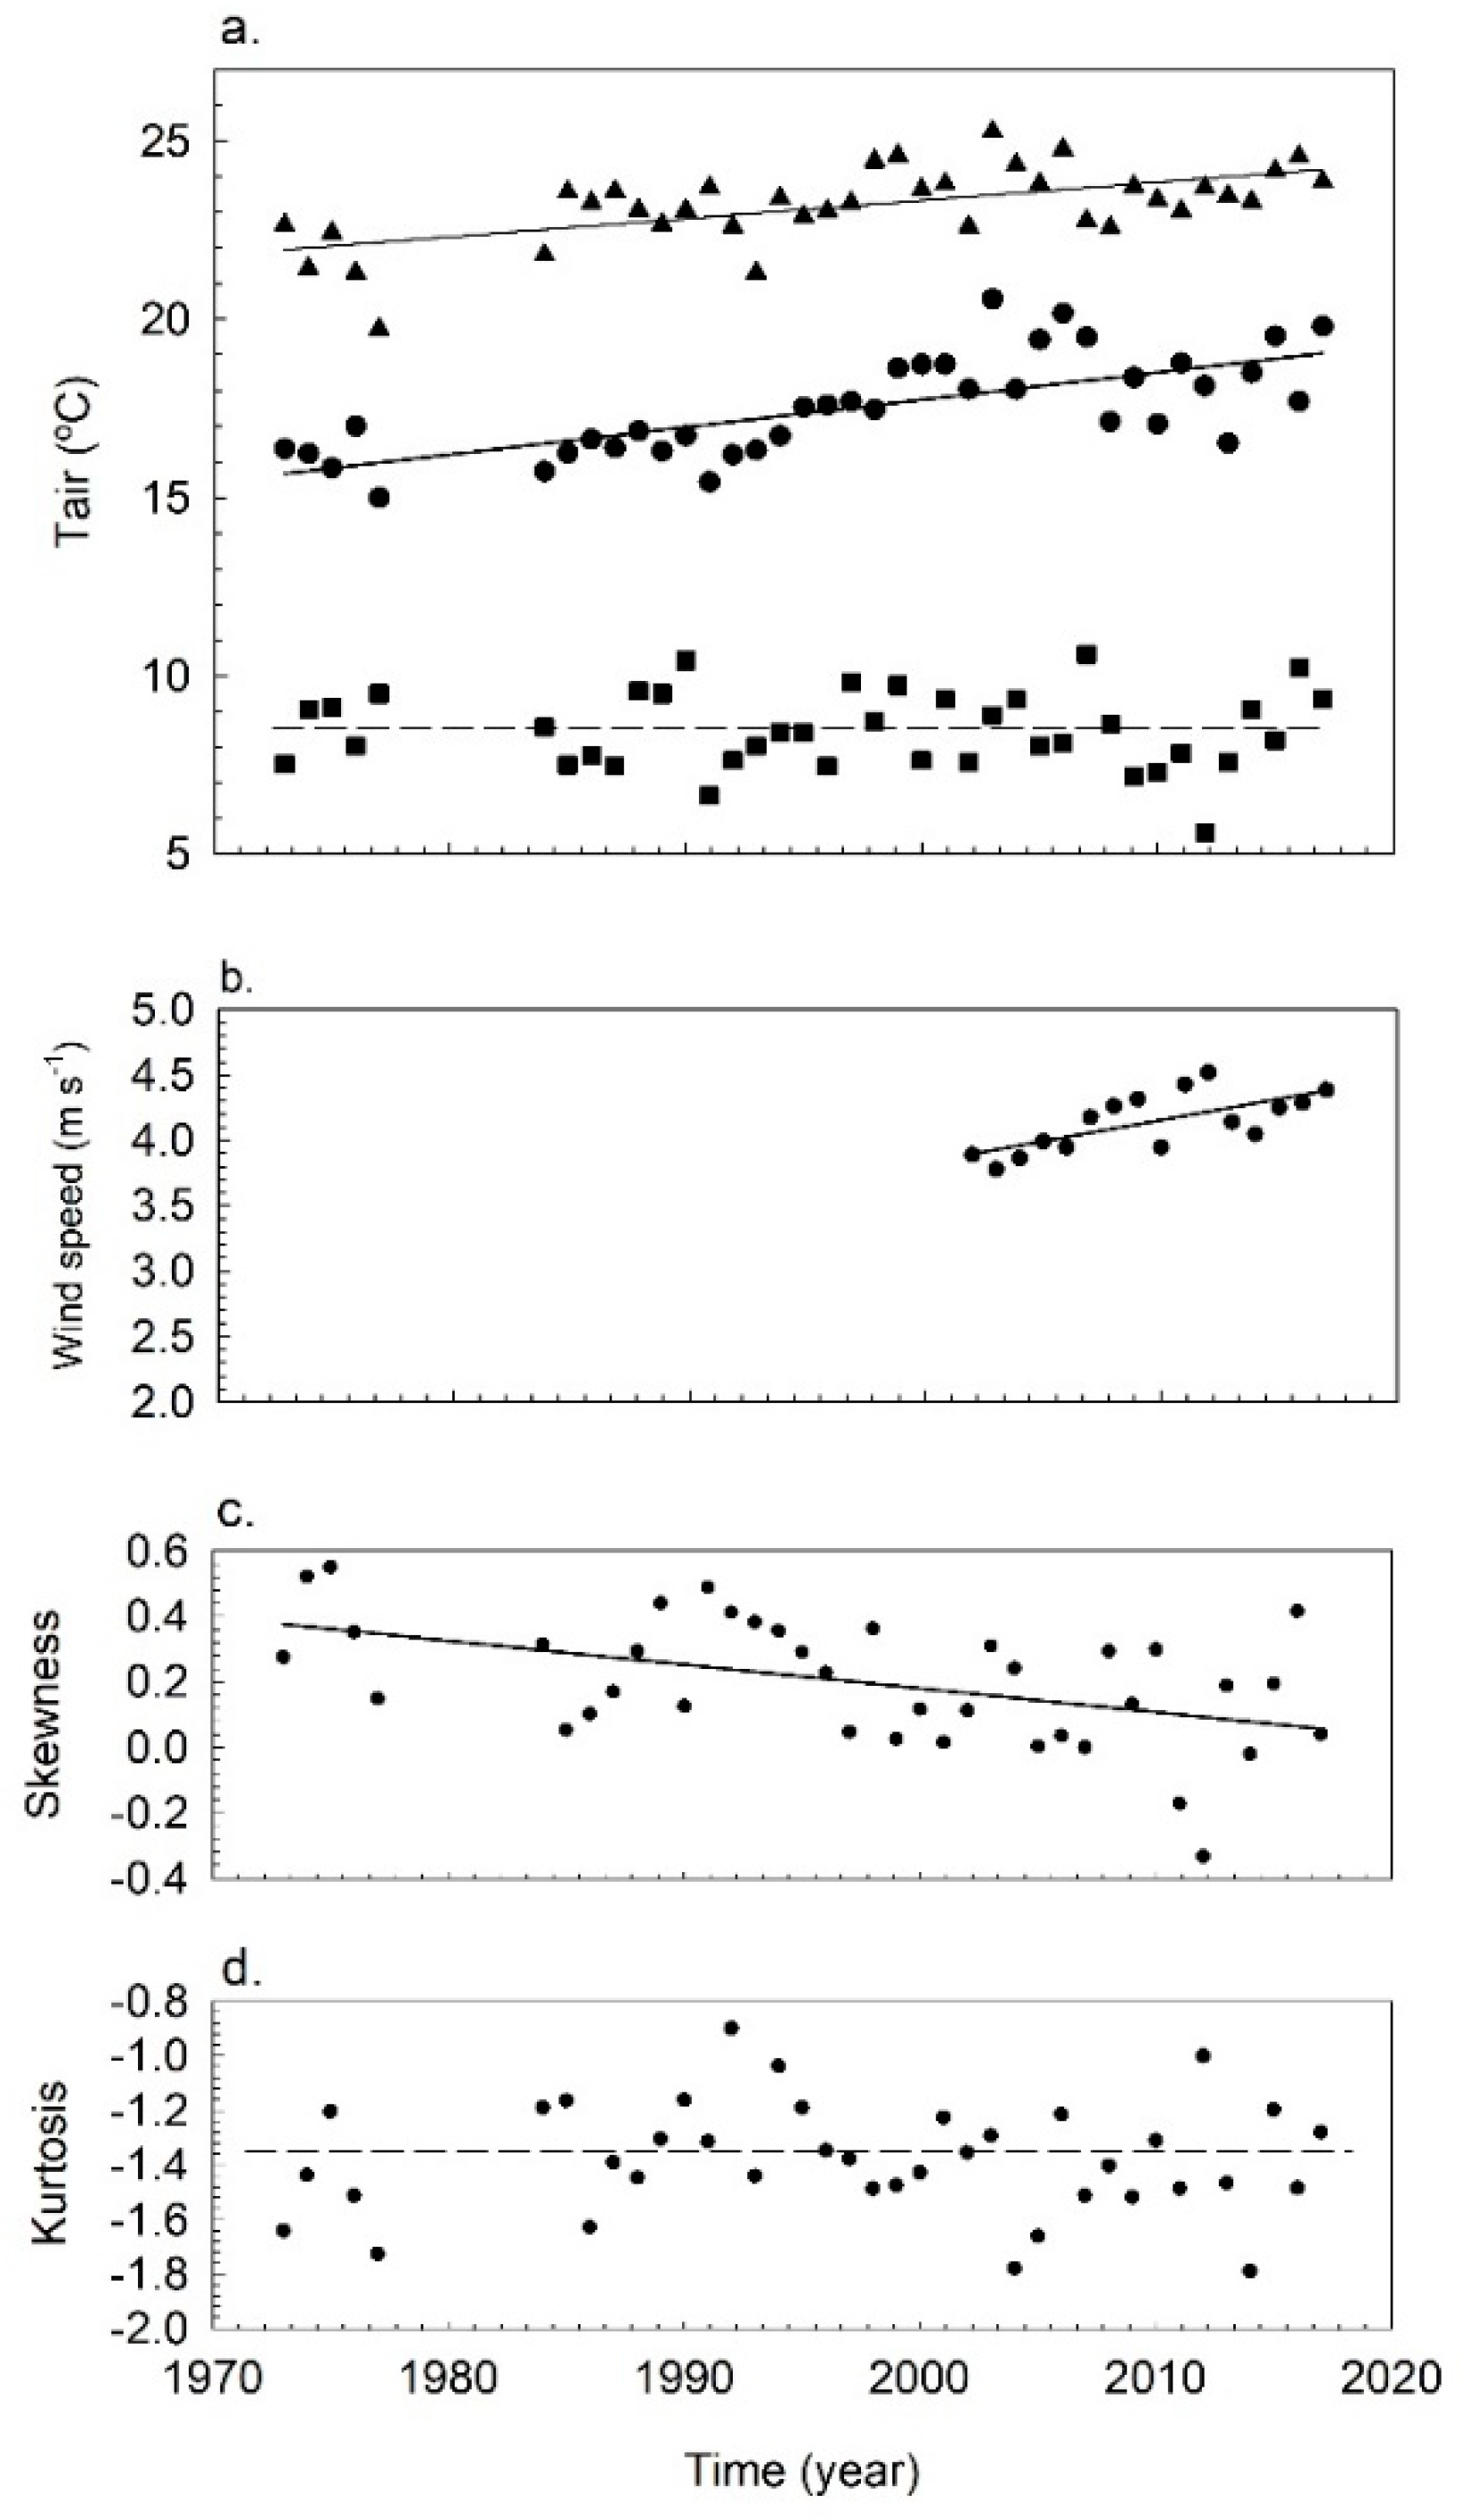
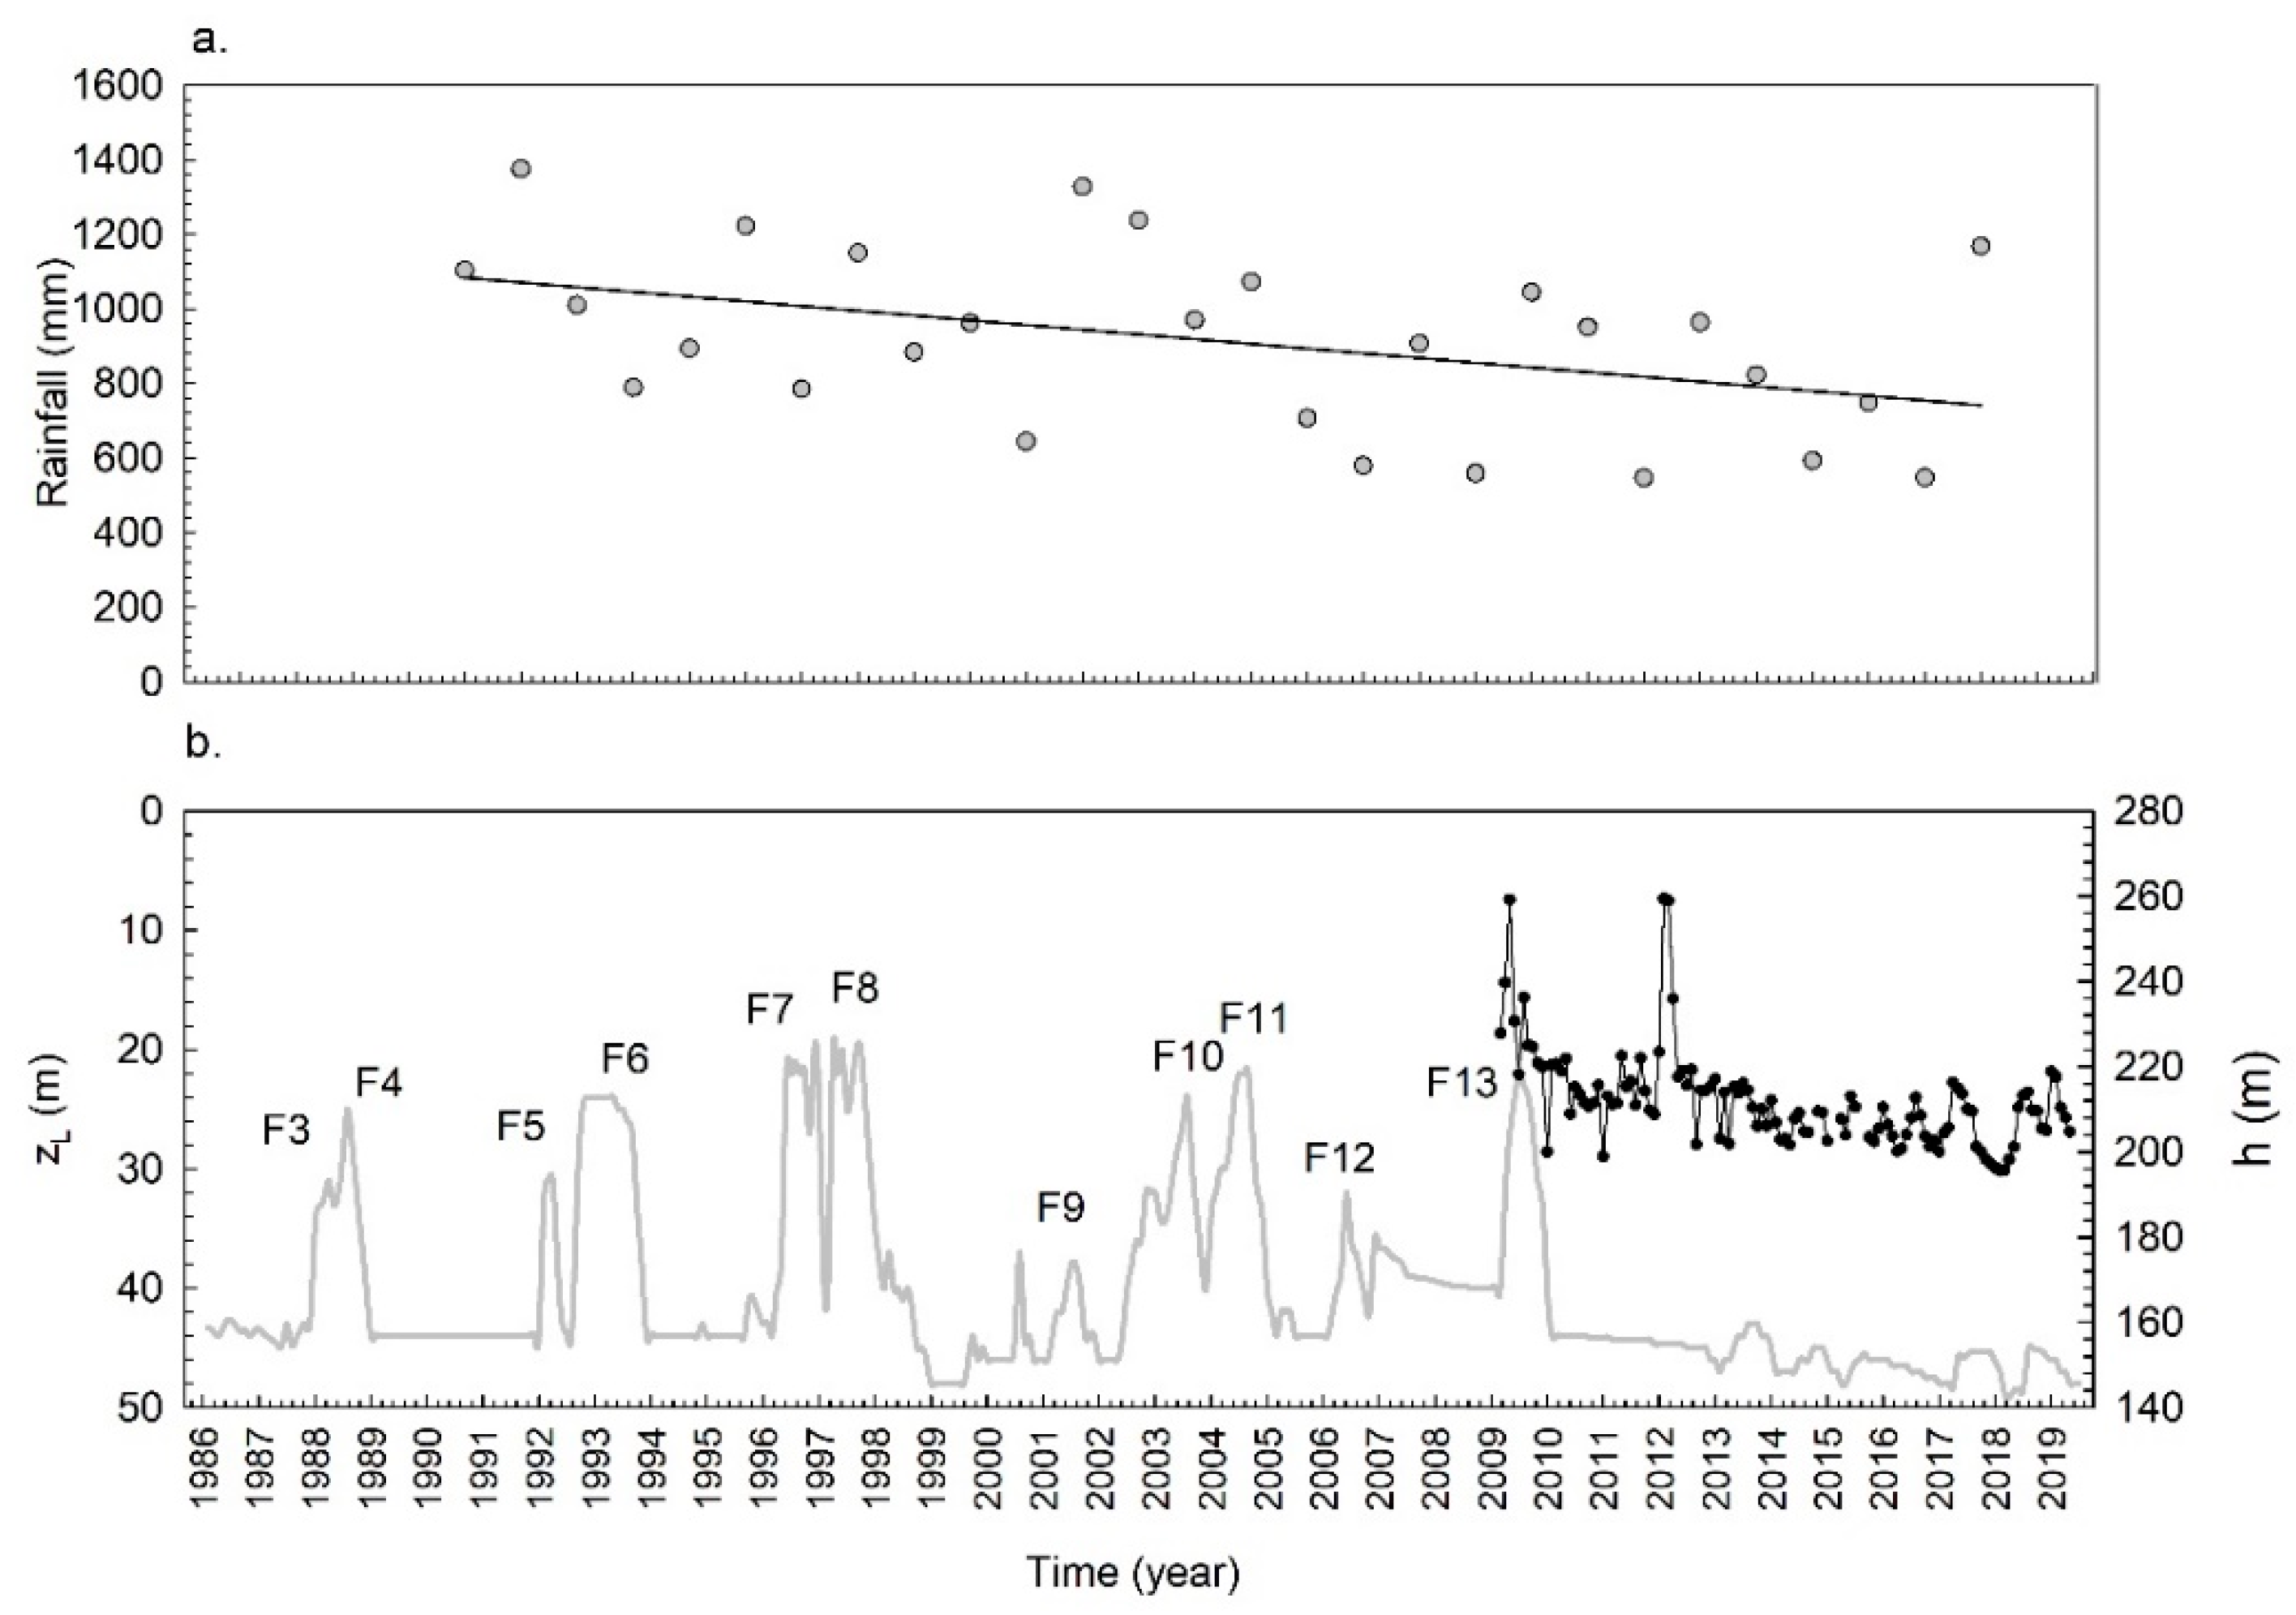
Lake Banyoles, listed on the Ramsar List of Wetlands of International Importance, is not only the largest fresh-water tectonic-karstic lake in Spain but also its second largest natural lake. Lake Banyoles is also the largest lake on the east coast of the Iberian Peninsula with a surface area of 110 ha, a volume of 10 × 106 m3, a mean depth of 14 m and a maximum depth of 132 m [17,18]. Located in the pre-Pyrenees (42°07′ N, 2°45′ E) of eastern Catalonia (Spain), Lake Banyoles is situated in a region that has a humid Mediterranean climate (Figure 1). Water enters Lake Banyoles through groundwater springs that supply the 85% of total incoming water of the lake. The aquifer recharge area that feeds the lake covers around 150 km2 and it undergoes intense hydrological fluctuations that are related to the local variability in the rainfall in the aquifer recharge area. Lake Banyoles is a multibasin lake of mixed tectonic-karstic origin, composed of six main basins (Figure 1(B1–B6)). B1 is the largest and accounts for the total supply of underground water, while the remainder of the water (15%) is supplied by river inflows, runoff and rainfall. In fact, although B2 usually remains inactive (i.e., does not supply water to the lake), during periods of intense rainfall (of 200 mm) it may eventually supply water to the lake at a rate comparable to B1 [19,20] and the rest of the basins (B3–B6) remain inactive. An underlying fault (at the east of the lake) acts as a barrier to ground water movement in the complex series of confined aquifers and thus forces the vertical discharge of the ground water flow through the bottom of the basins. The warm groundwater entering from the bottom entrains sediment forming a muddy layer with a constant water temperature of 19 °C, warmer that the clear water layer situated above [20]. The sharp sediment interface that separates the muddy layer from the clear water layer above is known as the lutocline. The lutocline can be detected through seismic profiling [18,21,22,23] or by a sharp increase in the water temperature due to the warm groundwater entering the lake [20]. The depth of the lutocline from the surface is designated as zL. The difference in temperature between the suspension zone below the lutocline and the water above, induces the development of hydrothermal plumes that form vertically through the lake water column [24,25] in the same way that convective plumes develop from localized sources [26] in oceanic and atmospheric deep convections [27,28,29], microbursts [30], urban heat islands [31] and polynyas [32]. Therefore, basin B1, and eventually basin B2, produce turbid hydrothermal plumes that transport sediment from the lutocline of the lake upwards. The maximum height the hydrothermal plumes can travel vertically depends on the difference in temperature between the water below the lutocline and the water above it, as well as on the velocity of the incoming water [24]. In addition, the stratification of the water column with the thermocline ranging from 5 m depth in early spring to 17 m depth in late autumn [33] poses a barrier to the penetration of the hydrothermal plumes [34]. During the lake’s mixing period, or for weak stratifications of the water column, the hydrothermal plumes travel up to the lake’s surface. However, during the lake’s stratified period, these plumes remain confined in the hypolimnetic waters [34]. While the sediments in B1 are permanently in suspension, those in B2 usually remain compacted at the bottom of the basin except in periods of high rainfall when sediment resuspends and migrates upwards, thus producing the fluidization of the sediment [23]. These fluidization events are detected when measuring the depth of the lutocline (zL) in B2 from seismic profiles or by measuring a sharp temperature increase with depth [25]. Lake Banyoles has also five outflow streams situated at the east part of the lake that maintain the water level. Moreover, Lake Banyoles does not present any ice cover along the winter.
The underlying confined aquifer in Lake Banyoles is recharged by rainfall from two watersheds located in the Alta-Garrotxa mountain range, approximately 40 km north-west of the lake [21]. The rainfall data from the recharge area for the period 1990–2019 have been obtained from the meteorological weather station situated in Darnius (the nearest weather station to the recharge area, 30 km north of lake Banyoles, 42°21.907′ N and 2°50.155′ E, meteorological station Davis Vantage Pro 2, Davis Instruments, Hayward, CA, USA). The meteorological data for Banyoles for the period 1973–2019 have been obtained from the meteorological weather station situated 0.5 km east from the lake (42°6.986′ N and 2°45.321′ E, Davies Pantage Pro 6150C, Davis Instruments, Hayward, CA, USA). The wind speed in this station was recorded since 2002. Therefore, wind velocity data is available for the period 2002–2019.
Lake temperature profiles were taken monthly from 1976–2019 at the same station in Lake Banyoles (ST in basin B2, Figure 1) employing Richter and Weise reversing thermometers from 1976 to 1995 (Richter&Weise, Berlin, Germany), and a CTD75M (Sea&Sun Technologies, Trappenkamp, Germany) from 1995 to 2019. Temperatures with the reversing thermometers were taken at five depths (0.5 m, 5 m, 20 m, 40 m and 50 m) between 10:00 am and 11:00 am and with an accuracy of 0.1 °C. The shallowest depth that could be measured with the CTD75M was z = 0.5 m for technical limitations of the reversing thermometers. With the CTD75M, vertical profiles were taken at 0.5 m and every meter from a 1 m depth downwards with an accuracy of 0.01 °C. When the sensors were changed in 1995, overlapping data were used to confirm that there were no jumps in the data that could introduce bias into the long-term trends. The reversing thermometers are still used now to compare the results to those obtained with the CTD75M. Since data was obtained on different days of each month, a spline fitting interpolation [35] was used to fit the data to a daily basis scale and then to obtain the mean monthly temperature at selected depths of the water column.
Two main periods have been considered in this study. The months of July, August and September (JAS period) were considered characteristic of the summer period, while the months of December, January and February (DJF) were considered a proxy for the winter period [2]. The mean temperature of each period was the mean temperature of all the days of the three months in the period.
In this study, the depth of the lutocline (zL) was obtained from the temperature profiles as the depth at which a sudden increase in temperature of at least 0.5 °C was found. The temporal variations in the piezometric level recorded in the Lake Banyoles aquifer were obtained from the Catalan Water Agency (Agència Catalana de l’Aigua in Catalan) for the period 2008–2019 [17].
The turbidity in Lake Banyoles has been monitored at the surface of the lake (z = 0.5 m) with a HACH 2100 sensor (HACH Company, Loveland, CO, USA) at a frequency of five measurements per week at the same hour every day. The sensor measured the turbidity in NTU following ISO 7027 [36]. Measurements were carried out and kindly provided by the Banyoles Water Board (Aigües de Banyoles S.A in Catalan). Mean monthly turbidity values were calculated for each year and the means over the JAS and DJF periods were also calculated from the monthly values.
All the linear regressions and statistics were made by Excel (Office16, Microsoft Corporation, Redmond, WA, USA) with the Regression analysis tool. Both the p-values and the regression coefficients are given in all the curve fittings carried out. Plots were made with Sigmaplot (version 11.0, Systat Software Inc., San Jose, CA, USA).

3. Results

Over the past 46 years, the air temperature in Banyoles has risen during the summer months of the JAS period at a warming rate of 0.52 °C decade−1, R2 = 0.3643 and p < 0.01 (Figure 2a). In the months at the beginning of the lake’s stratification (i.e., March, April and May, MAM period), the air temperature has also risen over the last 46 years at a rate of 0.88 °C decade−1 (R2 = 0.4293, p < 0.01). In contrast, winter air temperatures in the DJF period have remained constant at 8.40 ± 1.16 °C (Figure 2a). During the period 2002–2019 the wind velocity averaged over the months of the beginning of the stratification (MAM period) increased at a rate of 0.30 m s−1 decade−1 (R2 = 0.3014 and p < 0.05) (Figure 2b).
The skewness of the annual temperature distribution was positive at the beginning of the period studied, indicating that springs were warmer than autumns. However, the skewness decreased with time at a rate of −0.073 decade−1, indicating that there is a tendency with time to have warmer autumns (Figure 2c). The kurtosis for the annual air temperature distribution has negative with constant values for the entire period under study (kurtosis = −1.36 ± 0.23), indicating that the air temperature distribution is flat (Figure 2d) with no extreme values for the whole period of study.
The water temperature for the surface layer (at z = 0.5 m) during the JAS period increased with time at a warming trend of 0.52 °C decade−1 (R2 = 0.4873 and p < 0.05, Figure 3a). Anomalies in the surface water temperatures relative to the 1985-2009 mean have also been calculated and increased from −2.2 °C in 1976 to 0.97 °C in 2019 (data not shown). In the winter period (DJF), the temperature of the surface layer remained constant (11.21 ± 1.30 °C, Figure 3a). In contrast to the trend observed for the surface layer, the water temperature of the hypolimnion (z = 20 m) cooled with time in the JAS period at a rate of −0.66 °C decade−1 (R2 = 0.2832, p < 0.05, Figure 3a). Nevertheless, during the winter period (DJF), the temperature of the hypolimnion remained constant (10.88 ± 0.89 °C) for the period studied (Figure 3a) and did not differ from the surface layers.
The stratification of the water column depends on the temperature of these layers in such a way that the greater the difference in temperature between layers the stronger the stratification of the water column is expected. In the present study, the difference in the water temperature between the surface layer at z = 0.5 m and the hypolimnetic waters at z = 20 m (ΔTw) will be considered to characterize the strength of the stratification. The strength of the stratification in the month of August increased for the period studied at a warming rate of 1.18 °C decade−1 (R2 = 0.4742, p < 0.05). The evolution of the onset of the stratification was studied for different ΔTw. The first Julian day with water temperature differences between the surface and the hypolimnion in the rate 1 °C < ΔTw < 4 °C, did not show any clear trend for the period studied (data not shown). For ΔTw = 4 °C, data presented a decrease with time, but the trend was not significant (p > 0.05). However, the first Julian day with a Δ Tw = 5 °C presented a significant tendency to decrease with time at a rate of −9.15 days decade−1 (R2 = 0.3939, p < 0.01, Figure 3b) and it was considered as the threshold to characterize the onset of the stratification. The decrease obtained in the onset of the stratification indicates that the start of stratification is shifting towards earlier onsets. The length of stratification was taken as the number of days per year for which ΔTw ≥ 5 °C. Under such an assumption, the length of the stratification for the period studied increased with time at a trend of 21.10 days decade−1 (R2 = 0.7569 with p < 0.01, Figure 3b).
During the period studied, rainfall decreased at a rate of 126.6 mm decade−1 (Figure 4a). Considering that the mean rainfall during this period is 739.84 mm, the reduction in rainfall is −17.11% decade−1. The depth of the lutocline (zL) in basin B2 from 1985 to 2019 varied between 49 m and 20 m (Figure 4b), but from 2010 to 2019 it increased from 44 m to 49 m. The piezometric level (h) of the aquifer also gradually decreased from 220 m in 2009 to 200 m in 2019 (Figure 4b). The turbidity of the surface water during the winter period (DJF) decreased during the 2002–2017 period (Figure 5) at a rate of −0.29 FTU decade−1 (R2 = 0.4150, p < 0.01). In contrast, for the summer period (JAS), turbidity remained constant (1.14 ± 0.25 FTU) with a lower value than in winter.

4. Discussion

4.1. The Long-Term Thermal Evolution in Lake Banyoles over the Past Four Decades

For the period 1980–1999, global air temperatures increased 0.32 °C decade−1 [37]. This warming rate is slightly below that found in the present study of 0.40 °C decade−1 for the period 1985–2019 (R2 = 0.2860, p < 0.01). The decrease in the skewness observed indicates a trend towards warmer autumns compared to the beginning of the study. The constant negative kurtosis indicates that the distribution of temperature during the year remains flat, indicating the absence of periods with extreme temperatures during the whole period. The warming trend of air coincides with the 0.52 °C decade−1 warming trend of the surface layer of the water column. The anomaly in the surface water temperature for the studied period aligns with the warming anomalies observed for different lakes around the globe [2]. The most frequent anomalies are around 0.5 °C decade−1, (like those in the area around Lake Banyoles), but other sites present even higher anomalies as is the case of Lake Tanganyika (0.9 °C decade−1, for the period 1913 and 2000) [38].
Contrary to what has been found in summer for the surface layer of Lake Banyoles, in the winter period the temperature of the surface layer remains constant. This differs from the findings in other lakes. For example, in winter, the surface layers of Lake Piburger See (Tyrol, Austria) warmed at a rate 0.36 °C decade−1 [39]. Meanwhile, the reversed tendencies of the surface waters towards warming and the bottom waters towards cooling in Lake Banyoles during the summer, resulted in an increase in the strength of the stratification. This is in accordance with the results found, for example, in Lake Tahoe (USA) [40]. In their work, Coats et al. [40] found that stratification increased 1.25 times each decade. In the present study, stratification increased 1.30 times per decade, which also agrees with the findings of Coats et al. [40]. In addition, this study demonstrates that the onset of the stratification is earlier and the stratified period of the lake lasts longer, lengthening with time at a rate of 21.1 days decade−1. This result indicates that by the first decade of the 22nd century, Lake Banyoles is expected to be permanently stratified.

4.2. The Long-Term Evolution of the Turbidity in Lake Banyoles

The strengthening of the stratification in Lake Banyoles in terms of both the strength and time duration does not allow for the full vertical development of the turbid hydrothermal plumes migrating upwards due to the impossibility of the plumes penetrating through the thermocline to the surface layers of the lake [34]. Hydrothermal plumes have also been described to develop in the water column of the large Lake Yellowstone (US) [41]. There, the hydrothermal plumes have been found to travel upwards in the water column until the depth where their neutral buoyancy was attained. Bearing in mind that the Yellowstone region has not only been found to have warmed during the last decades but has also presented a reduction in rainfall [42], the results found for Lake Banyoles can provide some clues as to how larger lakes with hydrothermal activity may evolve in similar future climate-change scenarios. Moreover, the mixed period of Lake Banyoles is becoming shorter with time, therefore reducing the period when the hydrothermal turbid plumes travel up to the lake’s surface. All of these factors amount to a decrease in the constant supply of sediment to the surface of the lake, thus reducing turbidity at the surface waters in the winter period. It is expected that by the last decade of this century the turbidity in the winter period will be equal to that of the summer period, indicating that the lake’s epilimnion will have the same turbidity throughout the entire year. The decrease in turbidity, in turn, might also accelerate the warming of the lake’s surface, by enhancing light penetration to the deeper layers of the lake, therefore enhancing the stratification. A decrease in the overturn of a lake has also been correlated to a decrease in wind velocity [8] (known as atmospheric stilling). However, in the area of study, the wind speed increased during the period of study, therefore, the increase in the strength of the stratification is not attributed to the impact of wind velocity, but rather to the increase of air temperature.
The increase in the strength of the stratification together with the tendency of the lake towards becoming permanently stratified might cause various problems such as a reduction of oxygen in the bottom waters of the lake as well as a reduction in the availability of phosphorus in the lake’s surface water at the beginning of the growing season, thus favouring a tendency towards oligotrophic conditions [43].
The turbidity in Lake Banyoles is lower in the stratified period than in the mixed period. This is likely to be caused by the fact that hydrothermal plumes become trapped below the thermocline during the stratified period of the lake [34]. Furthermore, the decrease in the turbidity of the surface layer in the winter period from 2002 is attributed to the decrease in the incoming water caused by the decrease in rainfall which, in turn, causes a decrease in the buoyancy of the hydrothermal turbid plumes [24]. While a decrease in rainfall could also cause a reduction in the supply of sediment from runoff, Serra et al. [25] demonstrated that the particle size distribution of suspended sediment in the epilimnion of the lake was the same as the particles situated at the lutocline, therefore implying that the supply of particles due to the runoff has little impact on the waters of Lake Banyoles compared to the supply of sediment from the turbid plumes.
The time evolution of zL presents peaks that are due to the fluidization events of basin B2 [23]. These fluidization events result from periods of intense and accumulated rainfall in the aquifer recharge area [19]. From 1985 until 2019, the lutocline in B2 experienced 11 fluidization events, (plus two more not shown during 1976 and 1977). The last fluidization event (F13) was detected between October–November 2009 (Figure 3b) with the lutocline undergoing a vertical upwards displacement of ~8 m. However, from 2009 to 2019 no fluidization events have been observed, which also coincides with a decrease during this same period in the piezometric level of the recharge aquifer of the lake (Figure 3b) owing to the observed decrease in rainfall. A decrease in rainfall in the range of −0.1 to −0.5% [44,45] has been also observed in the Lake Kinneret region (Israel, Syria, Lebanon) for the period 1975–2010. Bonacci [46] found a decrease in the water level of the karst lake Vrana (Croatia), which they attributed to being caused partially by the decrease in rainfall in the period 1985–2015. Their results on the decrease in rainfall for the period studied align with those observed in the present work. In Lake Banyoles, the extent and intensity of the fluidization events depend not only on the rainfall of the particular month in question, but also on the rainfall accumulated in the aquifer recharge area during the previous ten months [19]. Therefore, the decrease in rainfall in the last decades explains why there has been a decrease in both the piezometric level and the frequency of fluidization events. In addition, the decrease in the incoming water is expected to produce a decrease in the buoyancy of the hydrothermal turbid plumes [24] which, in turn, will reduce the supply of sediment to the water surface and decrease the turbidity of the surface waters of the lake.

5. Conclusions

To conclude, the surface water temperature of the karstic Mediterranean Lake Banyoles during summer has increased over the past 44 years at a rate of 0.52 °C decade−1 and the temperature of the bottom layer has decreased at a rate of −0.66 °C decade−1 resulting, therefore, in a strengthening of the lake’s summer stratification. Lake stratification has expanded from approximately three months in the 1970s to approximately six months in the 2010s, with the long-term tendency of the lake predicted to present whole-year stratification by the end of the 21st century. During the lake’s stratified period, the hydrothermal plumes that vertically migrate up to the surface, remain confined at the hypolimnetic layers of the lake. Since the stratified period is likely to lengthen with decades, the hydrothermal plumes will thus remain confined in hypolimnetic waters for longer periods. In addition, because the hydrothermal plumes are losing buoyancy due to the decrease in the incoming water, in winter the hydrothermal plumes are unlikely to reach the surface of the lake, thus producing the observed decrease in the top waters’ turbidity. All the reported results prove the vulnerability of Lake Banyoles, especially in terms of lake-surface warming which, in turn, results in a decrease in the surface-water turbidity. The results observed for Lake Banyoles can provide information on the fate of other, albeit bigger, lakes with hydrothermal activity as well as the small lakes situated in the Mediterranean area facing future climate-change scenarios.

Author Contributions

Conceptualization, J.C. and T.S.; methodology, T.S., R.B. and J.P.; formal analysis, J.C. and T.S.; investigation, J.C., R.B., J.P. and T.S.; data curation, T.S., R.B. and J.P.; writing—original draft preparation, T.S.; writing—review and editing, T.S. and J.C. All authors have read and agreed to the published version of the manuscript.

Funding

This study was funded by Aigües de Banyoles (AB-UDG/2020/1).

Acknowledgments

The authors are very grateful to the Agència Catalana de l’Aigua for the piezometric data for the Banyoles aquifer, to Enric Estragués and Gabriel Estragués for providing the meteorological data from the Banyoles weather station (www.meteobanyoles.com) to Jordi Quintana for providing the meteorological data from the Darnius station (www.cannirus.net) and to Aigües de Banyoles for providing the data for the turbidity of the surface of Lake Banyoles.

Conflicts of Interest

The authors declare no conflict of interest.

References

  1. Adrian, R.; Reilly, C.M.O.; Zagarese, H.; Baines, S.B.; Hessen, D.O.; Keller, W.; Livingstone, D.M.; Sommaruga, R.; Straile, D.; Van Donk, E. Lakes as sentinels of climate change. Limnol. Oceanogr. 2009, 54, 2283–2297. [Google Scholar] [CrossRef]
  2. O’Reilly, C.M.; Sharma, S.; Gray, D.K.; Hampton, S.E.; Read, J.S.; Rowley, R.; Schneider, P.; Lenters, J.; McIntyre, P.B.; Kraemer, B.M.; et al. Rapid and highly variable warming of lake surface waters around the globe. Geophys. Res. Lett. 2015, 42, 773. [Google Scholar] [CrossRef] [Green Version]
  3. Zhang, X.; Wang, K.; Frassl, M.; Boehrer, B. Reconstructing Six Decades of Surface Temperatures at a Shallow Lake. Water 2020, 12, 405. [Google Scholar] [CrossRef] [Green Version]
  4. Kirillin, G. Modeling the impact of global warming on water temperature and seasonal mixing regimes in small temperate lakes. Boreal Environ. Res. 2010, 15, 279–293. [Google Scholar]
  5. Toffolon, M.; Piccolroaz, S.; Majone, B.; Soja, A.-M.; Peeters, F.; Schmid, M.; Wüest, A. Prediction of surface temperature in lakes with different morphology using air temperature. Limnol. Oceanogr. 2014, 59, 2185–2202. [Google Scholar] [CrossRef] [Green Version]
  6. Janatian, N.; Olli, K.; Cremona, F.; Laas, A.; Nõges, P. Atmospheric stilling offsets the benefits from reduced nutrient loading in a large shallow lake. Limnol. Oceanogr. 2019, 65, 717–731. [Google Scholar] [CrossRef]
  7. Woolway, R.I.; Merchant, C.J. Worldwide alteration of lake mixing regimes in response to climate change. Nat. Geosci. 2019, 12, 271–276. [Google Scholar] [CrossRef]
  8. Woolway, R.I.; Meinson, P.; Nõges, P.; Jones, I.D.; Laas, A. Atmospheric stilling leads to prolonged thermal stratification in a large shallow polymictic lake. Clim. Chang. 2017, 141, 759–773. [Google Scholar] [CrossRef] [Green Version]
  9. O’Reilly, C.M.; Alin, S.R.; Plisnier, P.-D.; Cohen, A.S.; McKee, B.A. Climate change decreases aquatic ecosystem productivity of Lake Tanganyika, Africa. Nature 2003, 424, 766–768. [Google Scholar] [CrossRef]
  10. O’Beirne, M.D.; Werne, J.P.; Hecky, R.E.; Johnson, T.C.; Katsev, S.; Reavie, E.D. Anthropogenic climate change has altered primary productivity in Lake Superior. Nat. Commun. 2017, 8, 15713. [Google Scholar] [CrossRef] [Green Version]
  11. Shatwell, T.; Thiery, W.; Kirillin, G. Future projections of temperature and mixing regime of European temperate lakes. Hydrol. Earth Syst. Sci. 2019, 23, 1533–1551. [Google Scholar] [CrossRef] [Green Version]
  12. Rose, K.C.; Winslow, L.A.; Read, J.S.; Hansen, G.J.A. Climate-induced warming of lakes can be either amplified or suppressed by trends in water clarity. Limnol. Oceanogr. Lett. 2016, 1, 44–53. [Google Scholar] [CrossRef]
  13. Casamitjana, X.; Menció, A.; Quintana, X.; Soler, D.; Compte, J.; Martinoy, M.; Pascual, J. Modeling the salinity fluctuations in salt marsh lagoons. J. Hydrol. 2019, 575, 1178–1187. [Google Scholar] [CrossRef]
  14. Wood, W.W.; Sanford, W.E. Chemical and Isotopic Methods for Quantifying Ground-Water Recharge in a Regional, Semiarid Environment. Ground Water 1995, 33, 458–468. [Google Scholar] [CrossRef]
  15. IPCC. Climate Change 2014: Impacts, Adaptation, and Vulnerability. Part A: Global and Sectoral Aspects; Cambridge University Press: Cambridge, UK, 2014. [Google Scholar]
  16. Moreno, J.M.; Aguiló, E.; Alonso, S.; Álvarez Cobelas, M.; Anadón, R.; Ballester, F.; Benito, G.; Catalán, J.; de Castro, M.; Cendrero, A.; et al. A Preliminary Assessment of the Impacts in Spain Because of Climate Change; Report of the Ministry of Environment: Castilla la Mancha, Spain, 2005. [Google Scholar]
  17. Gutiérrez, F.; Fabregat, I.; Roqué, C.; Carbonel, D.; Zarroca, M.; Linares, R.; Yechieli, Y.; García-Arnay, Á.; Sevil, J. Sinkholes in hypogene versus epigene karst systems, illustrated with the hypogene gypsum karst of the Sant Miquel de Campmajor Valley, NE Spain. Geomorphology 2019, 328, 57–78. [Google Scholar] [CrossRef] [Green Version]
  18. Canals, M.; Got, H.; Juliá, R.; Serra, J. Solution-collapse depressions and suspensates in the limnocrenic lake of banyoles (ne Spain). Earth Surf. Process. Landf. 1990, 15, 243–254. [Google Scholar] [CrossRef]
  19. Soler, M.; Serra, T.; Colomer, J.; Romero, R. Anomalous rainfall and associated atmospheric circulation in the northeast Spanish Mediterranean area and its relationship to sediment fluidization events in a lake. Water Resour. Res. 2007, 43, 1–14. [Google Scholar] [CrossRef] [Green Version]
  20. Casamitjana, X.; Roget, E. Resuspension of sediment by focused groundwater in Lake Banyoles. Limnol. Oceanogr. 1993, 38, 643–656. [Google Scholar] [CrossRef]
  21. Morellon, M.; Anselmetti, F.S.; Valero-Garcés, B.; Giralt, S.; Ariztegui, D.; Saez, A.; Mata, P.; Barreiro-Lostres, F.; Rico, M.; Moreno, A. The influence of subaquatic springs in lacustrine sedimentation: Origin and paleoenvironmental significance of homogenites in karstic Lake Banyoles (NE Spain). Sediment. Geol. 2014, 311, 96–111. [Google Scholar] [CrossRef] [Green Version]
  22. Serra, T. Seasonal development of a turbid hydrothermal lake plume and the effects on the fish distribution. Water Res. 2002, 36, 2753–2760. [Google Scholar] [CrossRef]
  23. Colomer, J.; Serra, T.; Soler, M.; Casamitjana, X. Sediment fluidization events in a lake caused by large monthly rainfalls. Geophys. Res. Lett. 2002, 29, 101. [Google Scholar] [CrossRef] [Green Version]
  24. Colomer, J.; Serra, T.; Piera, J.; Roget, E.; Casamitjana, X. Observations of a hydrothermal plume in a karstic lake. Limnol. Oceanogr. 2001, 46, 197–203. [Google Scholar] [CrossRef]
  25. Serra, T.; Soler, M.; Julià, R.; Casamitjana, X.; Colomer, J. Behaviour and dynamics of a hydrothermal plume in Lake Banyoles, Catalonia, NE Spain. Sedimentology 2005, 52, 795–808. [Google Scholar] [CrossRef]
  26. Maxworthy, T. Convenction Into Domains With Open Bounaries. Annu. Rev. Fluid Mech. 1997, 29, 327–371. [Google Scholar] [CrossRef]
  27. Schott, F.; Visbeck, M.; Fischer, J. Observations of vertical currents and convection in the central Greenland Sea during the winter of 1988/89. J. Geophys. Res. 1993, 981, 14401–14422. [Google Scholar] [CrossRef] [Green Version]
  28. Schott, F.; Visbeck, M.; Send, U.; Fischer, J.; Stramma, L.; Desaubies, Y. Observations of Deep Convection in the Gulf of Lions, Northern Mediterranean, during the Winter of 1991/92. J. Phys. Oceanogr. 1996, 26, 505–524. [Google Scholar] [CrossRef] [Green Version]
  29. Fernando, H.; Iv, D.S. Vortex structures in geophysical convection. Eur. J. Mech. B Fluids 2001, 20, 437–470. [Google Scholar] [CrossRef]
  30. Lundgren, T.S.; Yao, J.; Mansour, N.N. Microburst modelling and scaling. J. Fluid Mech. 1992, 239, 461–488. [Google Scholar] [CrossRef]
  31. Lu, J.; Arya, S.P.; Snyder, W.H.; Lawson, R.E., Jr. A laboratory study of the urban heat island in a calm and stably stratified environment. Part I: Temperature field. J. Appl. Meteorol. 1997, 36, 1377–1391. [Google Scholar] [CrossRef]
  32. Chapman, D.C.; Gawarkiewicz, G. Shallow Convection and Buoyancy Equilibration in an Idealized Coastal Polynya. J. Phys. Oceanogr. 1997, 27, 555–566. [Google Scholar] [CrossRef]
  33. Roget, E.; Colomer, J.; Casamitjana, X.; Llebot, J.E. Bottom currents induced by baroclinic forcing in Lake Banyoles (Spain). Aquat. Sci. 1993, 55, 206–227. [Google Scholar] [CrossRef]
  34. Colomer, J. Hydrothermal plumes trapped by thermal stratification. Geophys. Res. Lett. 2003, 30, 2092. [Google Scholar] [CrossRef] [Green Version]
  35. Vollmer, M.K.; Bootsma, H.A.; Hecky, R.E.; Patterson, G.; Halfman, J.D.; Edmond, J.M.; Eccles, D.H.; Weiss, R.F. Deep-water warming trend in Lake Malawi, East Africa. Limnol. Oceanogr. 2005, 50, 727–732. [Google Scholar] [CrossRef] [Green Version]
  36. International Standard ISO 7027. Water Quality Determination of Turbidity; ISO: Geneva, Switzerland, 1990.
  37. Jones, P.D.; New, M.; Parker, D.E.; Martin, S.; Rigor, I.G. Surface air temperature and its changes over the past 150 years. Rev. Geophys. 1999, 37, 173–199. [Google Scholar] [CrossRef]
  38. Verburg, P.; Kling, H.; Hecky, R.E. Ecological Consequences of a Century of Warming in Lake Tanganyika. Science 2003, 301, 505–507. [Google Scholar] [CrossRef] [Green Version]
  39. Niedrist, G.H.; Psenner, R.; Sommaruga, R. Climate warming increases vertical and seasonal water temperature differences and inter-annual variability in a mountain lake. Clim. Change 2018, 151, 473–490. [Google Scholar] [CrossRef] [Green Version]
  40. Coats, R.; Pérez-Losada, J.; Schladow, G.; Richards, R.; Goldman, C. The Warming of Lake Tahoe. Clim. Chang. 2006, 76, 121–148. [Google Scholar] [CrossRef]
  41. Sohn, R.A.; Luttrell, K.; Shroyer, E.; Stranne, C.; Harris, R.N.; Favorito, J.E. Observations and Modeling of a Hydrothermal Plume in Yellowstone Lake. Geophys. Res. Lett. 2019, 46, 6435–6442. [Google Scholar] [CrossRef] [Green Version]
  42. Notaro, M.; Emmett, K.; O’Leary, D. Spatio-Temporal Variability in Remotely Sensed Vegetation Greenness Across Yellowstone National Park. Remote Sens. 2019, 11, 798. [Google Scholar] [CrossRef] [Green Version]
  43. Yankova, Y.; Neuenschwander, S.; Köster, O.; Posch, T. Abrupt stop of deep-water turnover with lake warming: Drastic consequences for algal primary producers. Sci. Rep. 2017, 7, 13770. [Google Scholar] [CrossRef] [PubMed] [Green Version]
  44. Ziv, B.; Saaroni, H.; Pargament, R.; Harpaz, T.; Alpert, P. Trends in rainfall regime over Israel, 1975–2010, and their relationship to large-scale variability. Reg. Environ. Chang. 2013, 14, 1751–1764. [Google Scholar] [CrossRef]
  45. Tal, A. The implications of climate change driven depletion of Lake Kinneret water levels: The compelling case for climate change-triggered precipitation impact on Lake Kinneret’s low water levels. Sci. Total Environ. 2019, 664, 1045–1051. [Google Scholar] [CrossRef]
  46. Bonacci, O. Preliminary analysis of the decrease in water level of Vrana Lake on the small carbonate island of Cres (Dinaric karst, Croatia). Geol. Soc. Lond. Spéc. Publ. 2017, 466, 307–317. [Google Scholar] [CrossRef]
Figure 1. Location of Lake Banyoles and photograph of Lake Banyoles. The photograph of Lake Banyoles was kindly provided by the Institut Cartogràfic de Catalunya. B1–B6 represent the location of the different basins of Lake Banyoles. ST represents the sampling station where temperature and turbidity were measured. MS represents the location of the meteorological station in Lake Banyoles.
Water 12 01621 g001
Figure 2. Temporal evolution of the air temperature for the July, August and September (JAS) period (solid triangles), the March, April and May (MAM) period (solid circles) and December, January and February (DJF) period (solid squares) (a), temporal evolution of the mean wind speed (in m s−1) averaged over the March, April and May (MAM) period (b), temporal evolution of the skewness of the air temperature distribution for the period 1973–2018 (c) and temporal evolution of the kurtosis for the air temperature distribution for the period 1973–2018 (d).
Water 12 01621 g002
Figure 3. Temporal evolution of the water temperature for the surface layer at z = 0.5 m (solid circles) and for the hypolimnion, at z = 20 m, (open circles) for the July, August and September (JAS) period. Solid triangles and open triangles correspond to the December, January and February (DJF) period (a). Temporal evolution of stratification onset (in grey solid symbols) and stratification length in open symbols (b).
Water 12 01621 g003
Figure 4. Temporal evolution of the rainfall at the Darnius weather station (a). Temporal evolution of the depth of the lutocline (zL) (continuous grey line) and the piezometric level of the aquifer in Banyoles (black solid circles) (h) (b). F1–F13 correspond to the fluidization events observed by monitoring the lutocline depth with time.
Water 12 01621 g004
Figure 5. Temporal evolution of the turbidity of the surface layer of Lake Banyoles. Solid black symbols represent the mean turbidity during the December, January and February (DJF) period and solid grey symbols represent the mean turbidity during the July, August and September (JAS) period.
Water 12 01621 g005

