Article

Assessing Hydrological Connectivity Mitigated by Reservoirs, Vegetation Cover, and Climate in Yan River Watershed on the Loess Plateau, China: The Network Approach

1
Key Laboratory of Ecosystem Network Observation and Modeling, Institute of Geographical Sciences and Natural Resources Research, Chinese Academy of Sciences, Beijing 100101, China
2
College of Resources and Environment, University of Chinese Academy of Sciences, Beijing 100049, China
3
Hunan Province Cooperative Innovation Center for the Construction & Development of Dongting Lake Ecological Economic Zone, Hunan University of Art and Sciences, Changde 415000, China
4
College of Earth Sciences, Chengdu University of Technology, Chengdu 610059, China
*
Author to whom correspondence should be addressed.
Water 2020, 12(6), 1742; https://doi.org/10.3390/w12061742
Submission received: 6 May 2020 / Revised: 13 June 2020 / Accepted: 16 June 2020 / Published: 18 June 2020
(This article belongs to the Section Hydrology)

Abstract

:
Hydrologic connectivity is related to the water-mediated transport of matter, energy, and organisms within or between elements of the hydrologic cycle. It reflects the hydrological consequences caused by topographic, land cover, and climatic factors, and is an important tool to characterize and predict the hydrological responses to climate and landscape change. In the Loess Plateau region, a large number of reservoirs have been constructed to trap sediment and storage water for drinking, irrigation, and industries. The land cover has been significantly reshaped in the past decades. These changes may alter the watershed hydrological connectivity. In this study, we mapped the spatial pattern of hydrological connectivity with consideration of reservoir impedances, mitigation of climate, and land cover in the Yan River watershed on the Loess Plateau by using the network index (NI) approach that is based on topographical wetness index. Three wetness indices were used, i.e., topographical wetness index (TWI), SAGA (System for Automated Geoscientific Analyses) wetness index (WIS), and wetness index adopted aridity index (AI) determined by precipitation and evapotranspiration (WIPE). In addition, the effective catchment area (ECA) was also employed to reveal the connectivity of reservoirs and river networks to water source areas. Results show that ECA of reservoirs and rivers account for 35% and 65%, respectively; the hydrological connectivity to the reservoir was lower than that to the river networks. The normalized hydrological connectivity revealed that the connectivity to river channels maintained the same distribution pattern but with a decreased range after construction of reservoirs. As revealed by comparing the spatial patterns of hydrological connectivity quantified by NI based on WIS and WIPE respectively, vegetation cover patterns had significantly alternated watershed hydrological connectivity. These results imply a decreased volume of flow in river channels after reservoir construction, but with same temporal period of flow dynamic. It is illustrated that the network index (NI) is suitable to quantify the hydrological connectivity and it is dynamic in the context of human intervention and climate change.

1. Introduction

Hydrological connectivity is related to the water-mediated transport of matter, energy, and organisms within or between elements of the hydrologic cycle [1,2]. It relates to the ease of water movement across the landscape, is affected by landscape attributes [3], and is a key indicator to characterize and predict hydrological responses to climatic and landscape changes [2,4]. Hydrological connectivity may be described structurally by the physical adjacency of landscape features, or functionally by describing water-driven transmission of materials [5,6,7,8]. Structural connectivity is a constraint for functional connectivity [9,10]. Structural hydrologic connectivity indicates potential water movement, while functional hydrologic connectivity quantifies actual delivery of water-driven materials [2,11]. Hydrological connectivity reflects the coupling between hillslopes and channels, and indicates ease of runoff or sediment transmission in hillslope–channel systems [3,12,13,14,15]. Climate, hillslope runoff potential, topography, and land cover are key factors in quantifying hydrological connectivity [3,16,17]. The effective catchment area (ECA) defined by Fryirs, Brierley, Preston and Spencer [15] is a simple indicator of catchment hydrology connectivity. It is defined as the areas that directly transport water and sediment to the river network, and potentially quantifies the impact of natural or human-made obstacles on runoff and sediment discharge to the target landscape parcels [12]. The hydrological connectivity may be controlled by locations or landscape patches that plays a “switch” role [13,18], such as topographical ponds, reservoirs, and patches with low soil water content. Lane, et al. [19] and Lane, et al. [16] developed the network index (NI) approach to quantify the hydrological connectivity of a location by identifying the driest point on the flow path to river network. NI indicates the tendency to produce saturated overland flow (SOLF) that is discharged into river networks based on the topographic wetness index (TWI) originally defined in Topographic Hydrologic Model (TOPMODEL) [20]. TWI represents the potential of a location to accumulate soil moisture. Hence its spatial distribution pattern reflects the spatial pattern of saturated soil water content in a catchment under the influence of surface runoff [21]. The NI approach supposes the point with lowest TWI on the flow path that connects a point on a hillslope to the drainage network controls the connectivity of this point to the drainage network by surface overland flow [19]. However, the TWI approach also presumes that there are no drivers on soil moisture creation and connectivity other than topographic forcing, which has been identified as an unsatisfactory aspect to understand hydrological connectivity in all environments [2,3].
Regional climate factors (e.g., precipitation, evapotranspiration) and vegetation cover greatly affect the spatial pattern of soil moisture content [3,22]. Therefore, it is necessary to integrate relevant parameters into indicators of hydrological connectivity. The Loess Plateau in China is a hotspot of landscape change driven by human intervention recently [23]. Additionally, the climate has also significantly changed in the past decades [24]. Consequently, the runoff and sediment discharge into the Yellow River have been decreasing [25,26]. Climate change and human activities each contribute half, respectively, to the decrease of runoff [25]. Human activities are the main cause of the decrease in sediment transport [26]. On the Loess Plateau, revegetation and dam construction are considered the two critical measures to control the hydrological and sedimentological connectivity [14]. Thousands of reservoirs were constructed [27], and vegetation cover was rapidly improved [24]. Therefore, quantifying the hydrological connectivity by integrating landscape attributes and climate is helpful to understand the impact of human activities.
In this study, we try to assess the alternation on hydrological connectivity pattern by reservoir construction, precipitation, and land cover in the Yan River watershed on the Loess Plateau. The hydrological connectivity is quantified by using NI that based on TWI, the SAGA (System for Automated Geoscientific Analyses) wetness index (WIS), and a new wetness index incorporating precipitation and evapotranspiration (WIPE), respectively. Also, the ECA was adopted to indicate the impact of reservoir construction on connectivity of water source area to river network.

2. Methodology

2.1. Regional Setting

The Yan River is a first-order tributary to the Yellow River (Figure 1). The Yan River watershed is located in the middle of the Loess Plateau. It covers an area of 7687 km2 with a main river channel length of 289.9 km. The Yan River watershed has a temperate semi-arid climate with average annual rainfall of 520 mm, and average annual temperature ranging from 8.8–11.2 °C. Rainfall is strongly seasonal, of which 69% occurs during June and September. The mean annual runoff volume in the watershed is 2.89 × 10⁸ m3 (36 mm in runoff depth), which transports sediment 7.8 × 10⁴ t km−2 yr−1 [28]. The watershed was described as “hilly and gully,” with a minimum elevation of 495 m in the south-east and a maximum of 1795 m in the north-west. The dominated soil type is silty loess and alluvial soil. Land use in the watershed is composed of residential land, terrace construction land, dam farmland, forestland, shrub, grassland, arable land, and waterbodies etc. Check dam construction and revegetation are the two principal soil-loss controls in the Yan River watershed. In decades before 2010, a total of 721 reservoirs were constructed in this watershed (Figure 1). Physical cascading from hill slopes to reservoirs and dam farmlands is the primary mode of landscape connectivity. After the launch of the Grain for Green Project in 1999, vast vegetation restoration has dramatically reduced runoff discharge and sediment export from hillslopes [29].

2.2. Quantifying Hydrological Connectivity Based on Wetness Index

The network index (NI) approach proposed by Lane, Reaney and Heathwaite [16] is employed to quantify the hydrological connectivity of a location to destinations including river network and reservoirs. NI of a location equals to the lowest value of the wetness index encountered along the runoff flow path to destinations. Topographic wetness index (TWI) proposed by Beven and Kirkby [20], SAGA (System for Automated Geoscientific Analyses) wetness index (WIS) described by Böhner and Selige [22], and wetness index integrating precipitation and evapotranspiration (WIPE) proposed in this study were employed in deriving NI value. The effective catchment area (ECA) [13,15] was also modified by taking NI as weight before being applied to quantify the connectivity of river network and reservoirs to the upper catchments.

2.2.1. Wetness Indices

TWI was proposed by Beven and Kirkby [20] to relate the topographic structure of the basin to average soil moisture storage. It is a representation of divergent and convergent flow patterns in hilly terrains [22], and quantifies the tendency of soil water distribution affected by topography. The local upslope area that indicates the over-flow availability. The local slope gradient reveals the drainage potential. According to Beven and Kirkby [20], TWI assumes that a large fraction of hillslope flow occurs as slope-parallel lateral flow, thus flow accumulation should increase with local contributing areas and decrease with local slopes. The upper slope area and local slope, which indicate the wetness of a location, are integrated to determine TWI. Structurally, TWI is suitable to delineate the soil wetness pattern. It also is highly correlated with measured soil moisture [30,31]. Though developed in a more humid climate than this study, TWI is potentially a suitable indicator to reflect the static soil moisture pattern in this semi-arid environment of this study, where annual precipitation is over 500 mm. The loess soil in this region has a rather uniform soil texture that evolved on very thick loess with the depth maximum over 300 m. Besides, the quick subsurface runoff on the Loess Plateau is not the dominant water drainage path due to the weak aggregated soil [32]. On the Loess Plateau, the topography controls the spatial pattern of shallow-layer soil moisture content, as reported by Yang et al. [33] and Wang et al. [34]. In a small watershed located in the studied watershed in this work, Wang, et al. [35] reported a correlation of soil moisture to TWI, which increased along with soil depth as the relative impacts of solar radiation and land cover decreased. Based on the field observation on the south-west Loess Plateau with lower precipitation than Yan River watershed, Yang, Chen and Wei [33] also demonstrated that the TWI positively correlates to soil moisture in soil surface (0–1 m). Studies in other semi-arid regions also revealed a significant correlation between TWI and soil moisture, such as Gómez-Plaza et al. [36] in a semi-arid area of southeast Spain, and Kaiser et al. [37] in central Montana, USA. Therefore, the hydrological connectivity index is calculated based on TWI and its decedent version. TWI is calculated by following equation:
T W I = I n ( α tan β )
where α is the specific catchment area (SCA) defined as the local upslope area draining through a unit contour length, which equals to grid cell width in this study; and β is the local slope gradient [20].
However, in rather flat areas, such as broad river valleys, small differences in elevation lead to random flow patterns, which distinctly limit the predictive capacity of all relevant secondary terrain indices. Böhner and Selige [22] proposed a modified calculation of specific catchment area for the flat terrain. This method applies the iteration form to modify the specific catchment area (SCAM) of each grid cell [38]. The calculation of SCAM is given by Equations (2) and (3).
S C A M = S C A max ( 1 15 ) β exp ( 15 β ) f o r S C A < S C A max ( 1 15 ) β exp ( 15 β )
W I S = I n ( S C A M tan β )
where WIS is the wetness index and is computed by using a tangent function of slope angle β and SCAM.
Mapping the spatial distribution of the wetness index on a large scale should consider the spatial heterogeneity of climatic conditions [39]. Since climate variations at a microscale are closely related to the terrain, local terrain variables (such as slope, aspect, or altitude), to a certain extent, are found to be a suitable substitute for topographic climate variations [40]. In the wet season, soil moisture saturation has low variability, whereas in the dry season, the vertical water movement caused by evapotranspiration will bias the moisture estimated by the TWI approach [30,41]. We attempt to extend the predictive power of wetness index by integrating climate variables (WIPE). The aridity index (AI) determined by precipitation (P) and evapotranspiration (E) is adopted to calculate WIPE, see Equation (4).
W I P E = I n ( S C A M i = 1 n P i i = 1 n E i 1 tan β ) = I n ( S C A M tan β ) I n ( i = 1 n P i i = 1 n E i )
where WIPE is modified wetness index by adopting AI; Pi is the mean annual precipitation and Ei is the evapotranspiration of grid cell i, and n is the number of grid cells in upslope area. AI expresses the ratio of precipitation to evapotranspiration, see Equation (5).
A I = I n ( i = 1 n E i i = 1 n P i )
A high AI value indicates a drier climate, and a low AI value expresses a moister climate. Combining Equations (4) and (5), WIPE can be expressed as following:
W I P E = W I s + A I

2.2.2. Network Index-Based Hydrological Connectivity

The network index (NI) approach, based on topographical wetness indices, is adopted to quantify the hydrological connectivity. It assumes that the lowest value of the topographic wetness index on the flow path connecting a point on a hillslope to the drainage network controls the surface overland flow connectivity of that point to the sinks. Calculation of NI is illustrated by Figure 2. The procedure of calculation is similar to that described by Liu and Fu [14] for the sedimentological connectivity. NI is assigned as the minimum value of wetness indices on the flow path connecting the target grid to the sinks (drainage network and reservoir in this study).
For comparative analysis, the original values of NI were normalized into the range (0, 1) by using Equation (7), and thus generated normalized hydrological connectivity indices.
H C = N I N I min N I max N I min
where HC is the normalized hydrological connectivity index, NImin and NImax are the minimum NI and the maximum NI in the watershed, respectively.
The normalized hydrological connectivity indices (HC_TWI, HC_WIS) calculated based on TWI and WIS describes the static hydrological connectivity determined by the topography. When using WIPE to calculate the NI, we can get a semi-dynamic description of watershed hydrological connectivity (HC_WIPE). HC_WIPE partly represents the functional aspect of hydrological connectivity. Therefore, the difference between HC_WIPE and HC_WIS (HCdif) can represent the dominance of the structural or functional connectivity in certain degree. If HC_ WIPE is greater than HC_WIS (HCdif > 0), the area is dominated by functional connectivity. If HC_WIPE is less than HC_WIS (HCdif < 0), it means that the functional connectivity of the area is weak and is mainly dominated by structural connectivity.
H C d i f = H C _ W I P E H C _ W I S

2.2.3. Effective Catchment Area

The effective catchment area (ECA) is defined as the area that contributes sediment or water from hillslope to the sinks [13,15]. A reservoir directly controls water discharged into rivers [25], and results in a reduced ECA of drainage network. When identifying the ECA for rivers, a reservoir was considered as a sink to runoff flow. Since the connectivity to sinks of a location on hillslopes potentially determines the possibility of water discharge, the hydrological connectivity weighted ECA (ECAHC) given by Equation (9) was proposed.
E C A H C = i = 1 n ( H C i × A )
where, HCi is normalized hydrological connectivity of the grid cell i, and A is pixel acreage. ECAHC equals ECA if all points are connected to the river with HC equals 1.

2.3. Data Sources and Analysis

The Advanced Land Observing Satellite (ALOS) World 3D Digital Elevation Model (DEM) with a spatial resolution 30 m was freely obtained from Japan Aerospace Exploration Agency (JAXA), Tsukuba, Ibaraki, Japan (https://www.eorc.jaxa.jp/ALOS/en/aw3d30/). The annual precipitation data of 52 rainfall stations in the Yan River watershed and surrounding areas are derived from the hydrological data of the Yellow River basin. Then the precipitation of stations was interpolated to obtain annual precipitation of the watershed. The evapotranspiration data was sourced from the MOD16 yearly evapotranspiration dataset [42], which is a globally operational evapotranspiration product provided by MODIS (Moderate Resolution Imaging Spectroradiometer) sensors on NASA EOS Terra and Aqua satellites. The annual MOD16A3 evapotranspiration data (https://search.earthdata.nasa.gov/) with a spatial resolution of 500 m was used. The calculation of hydrology connectivity was conducted by using Arc/info 10.0 (Environmental Systems Research Institute Inc., Sacramento, CA, USA) with a script in Arc Macro Language (AML) following approach of Liu and Fu [14]. Wetness indices were computed by using SAGA 6.3.0 and ArcMap 10.4.1 (Environmental Systems Research Institute Inc., CA, USA).

3. Results

3.1. Spatial Pattern of the Wetness Index

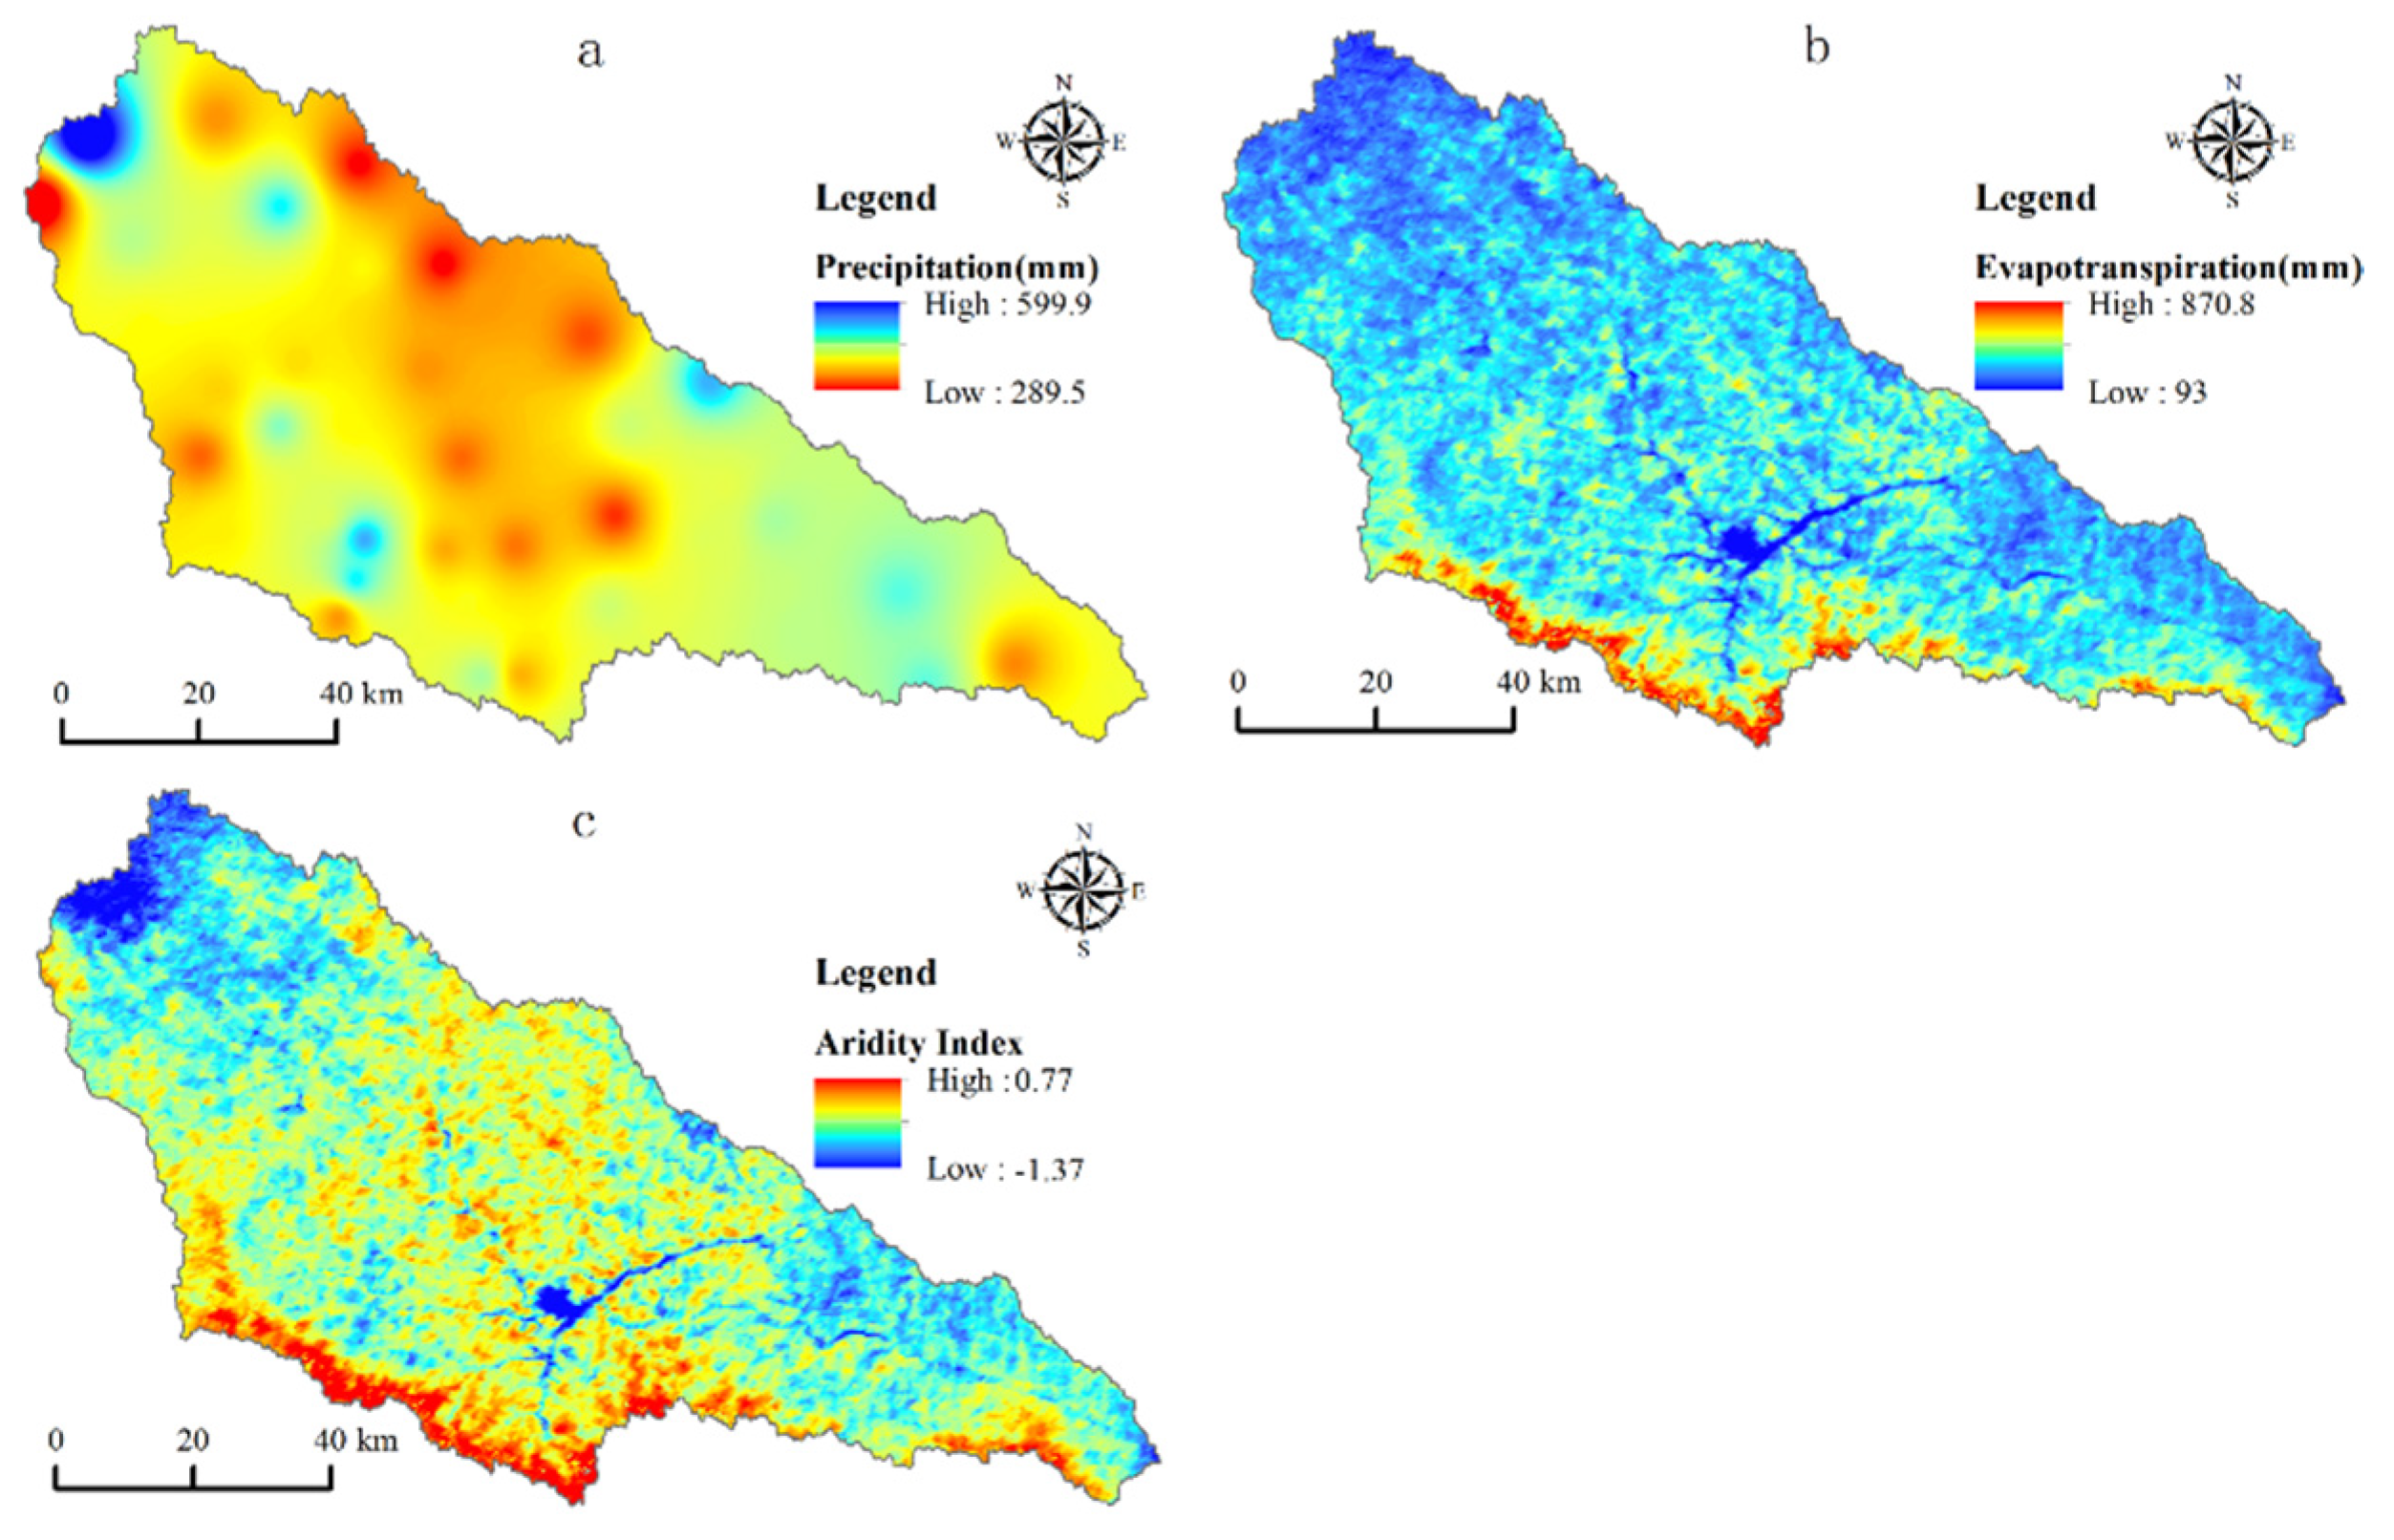
The aridity in the Yan River watershed had great spatial variation due to the great spatial heterogeneity of precipitation and evapotranspiration. In 2015, the annual precipitation ranged from 289.5–599.9 mm, with an average of 400.5 mm. It was higher in downstream and upstream areas than in the middle part of the watershed (Figure 3a). The average and maximum annual evapotranspiration in the Yan River watershed was 334 mm and 870.8 mm, respectively. In the southern parts of the watershed, the evapotranspiration was the highest (Figure 3b) due to the great forest cover (Figure 1). Consequently, the greater AI appeared in the southern part of the Yan River watershed (Figure 3c). The high AI in the middle part of the watershed was related to the small amount of precipitation.
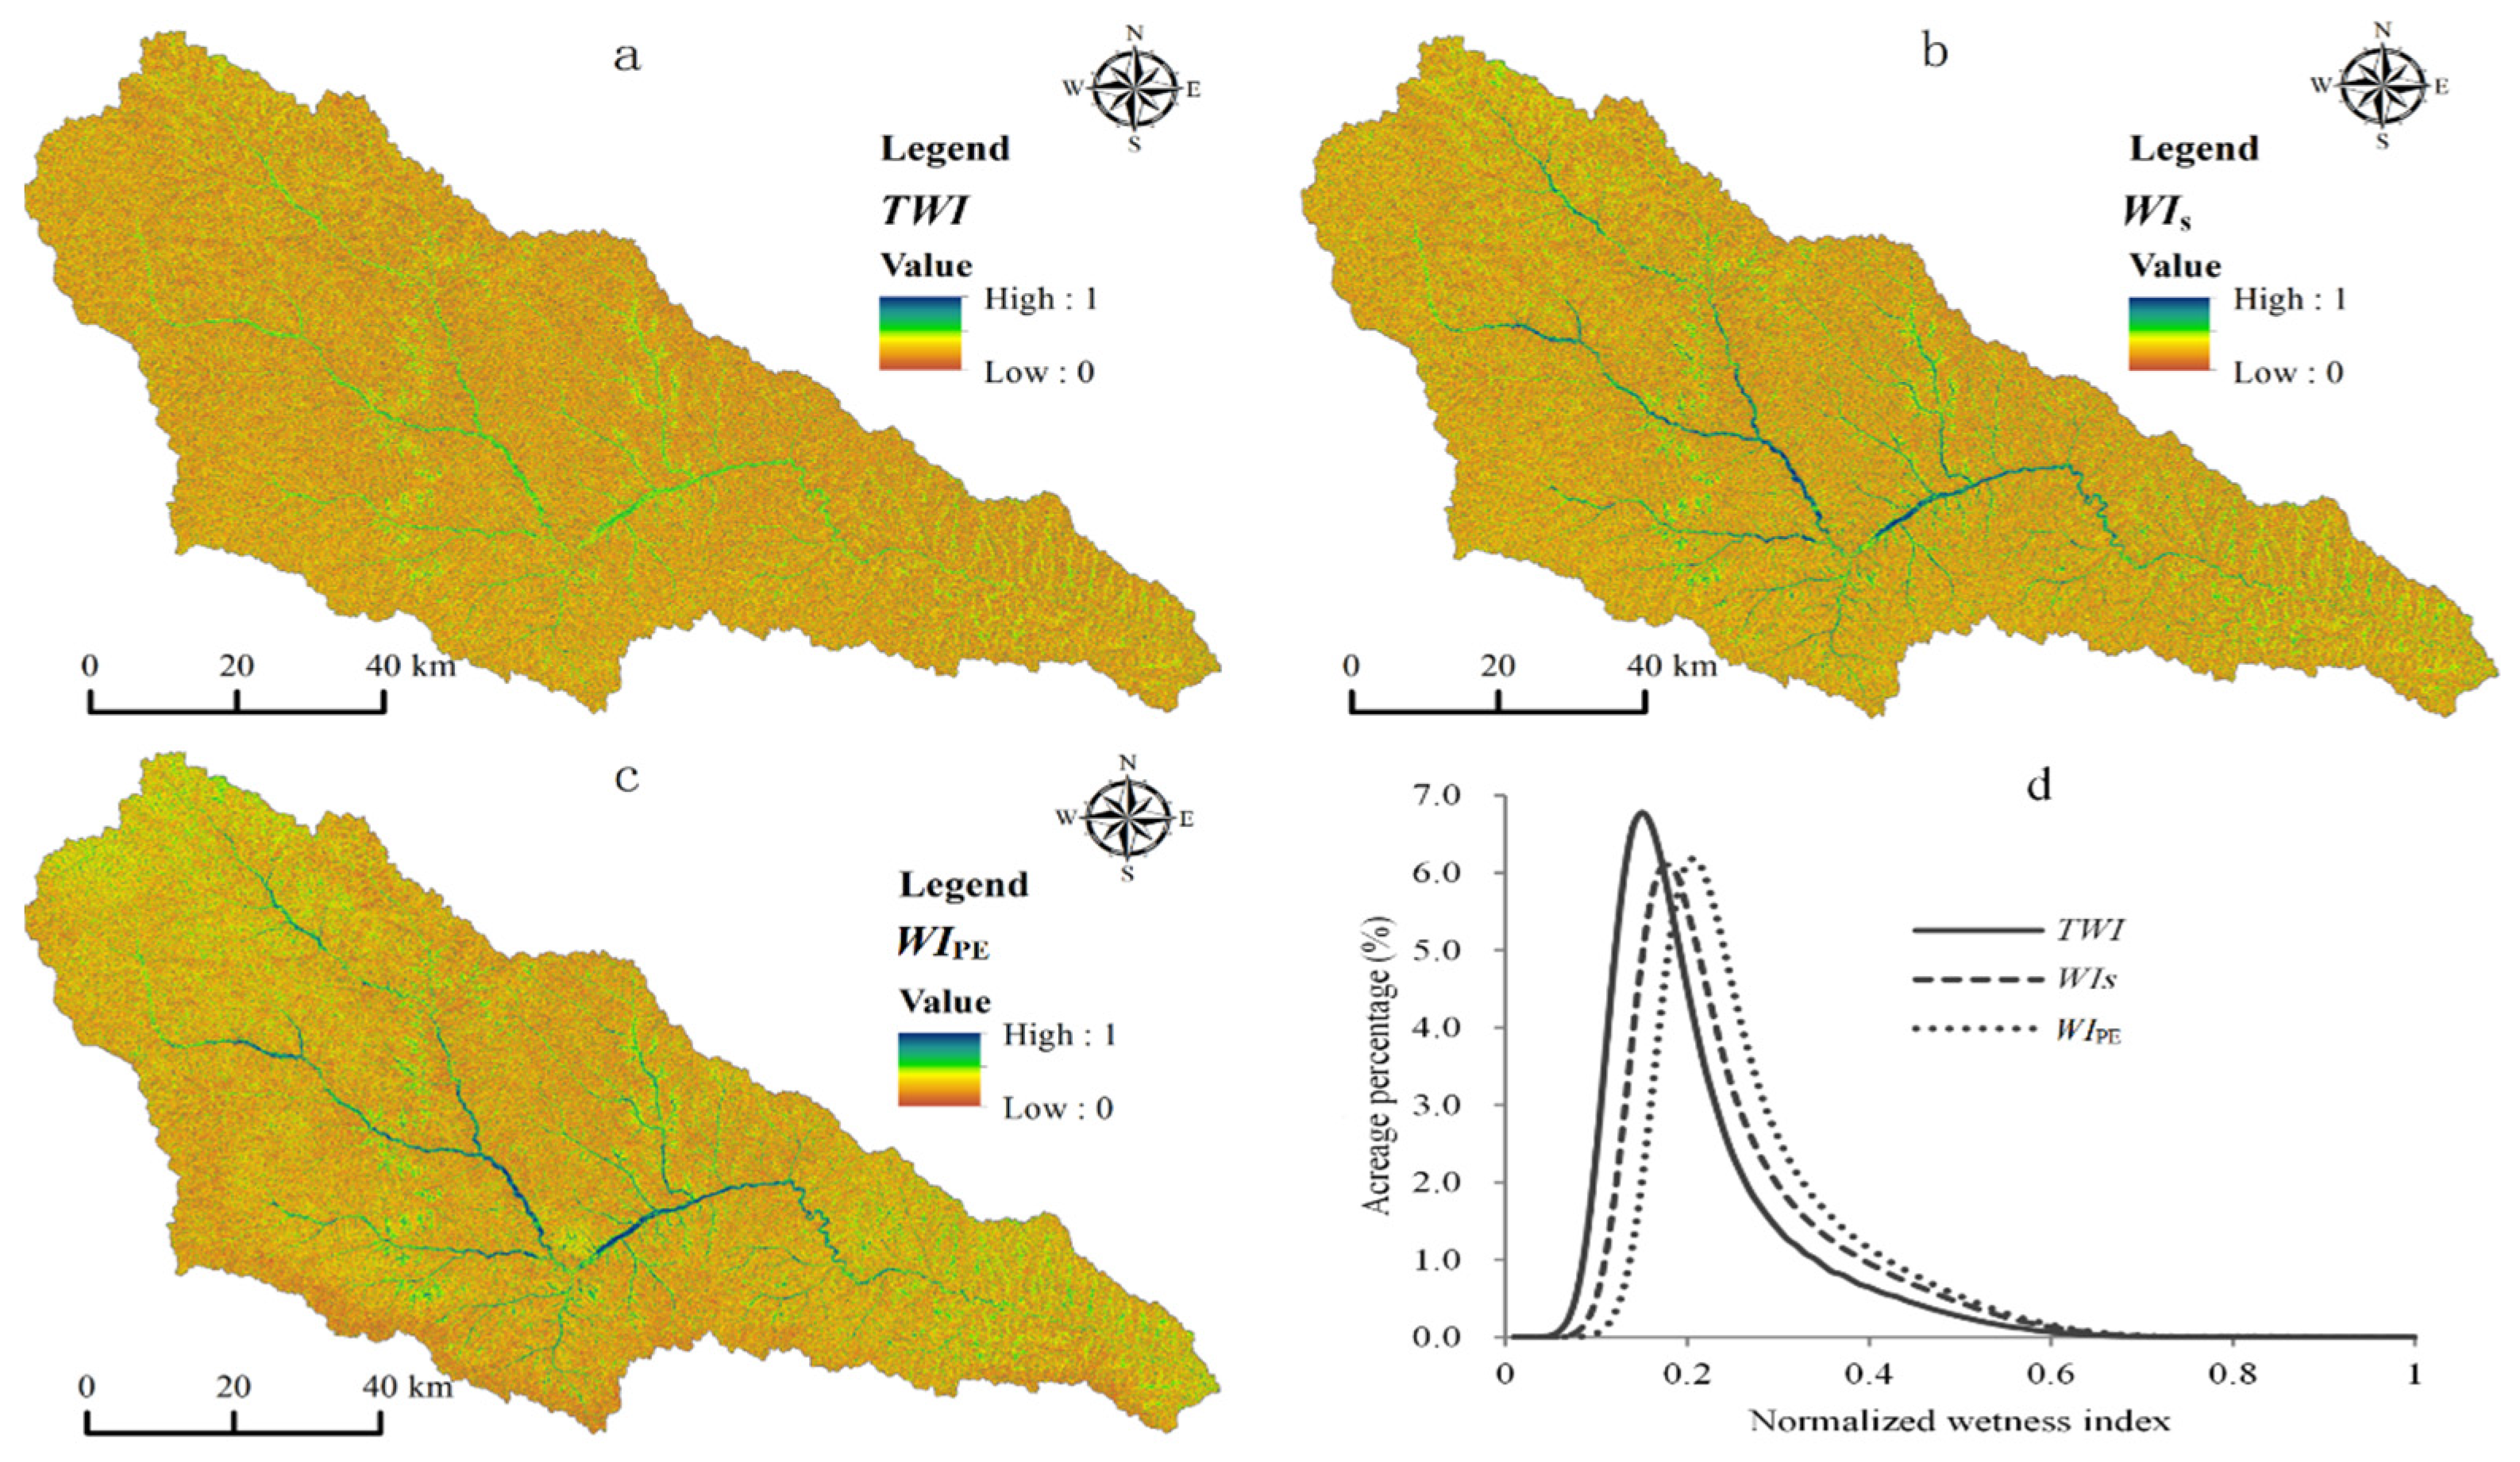
Spatial patterns of the three wetness indices are similar (Figure 4). As reflected by the spatial pattern of WIPE, the large spatial variation of AI contributed to the great spatial variation of wetness index in Yan River watershed. Two high-wetness areas extend along the north–south direction in the middle of Yan River watershed. As illustrated by Figure 4, WIS and WIPE had higher values in the flat river valley (Figure 4b,c). WIPE in the upper and lower reaches was higher than in middle reaches, which is consistent with the spatial pattern of precipitation and evapotranspiration (Figure 3). WIPE was larger than TWI and WIS in Yan River watershed. The mean value of WIPE, TWI, and WIS were 0.27, 0.21, and 0.25, respectively. As illustrated by Figure 4d, the acreage distribution curves of the three wetness indices were right-skewed. The value of the TWI was lower than that of the WIS and WIPE. It is obvious that the climate and land cover led to a change of the wetness pattern in this watershed.

3.2. Variation of Hydrological Connectivity

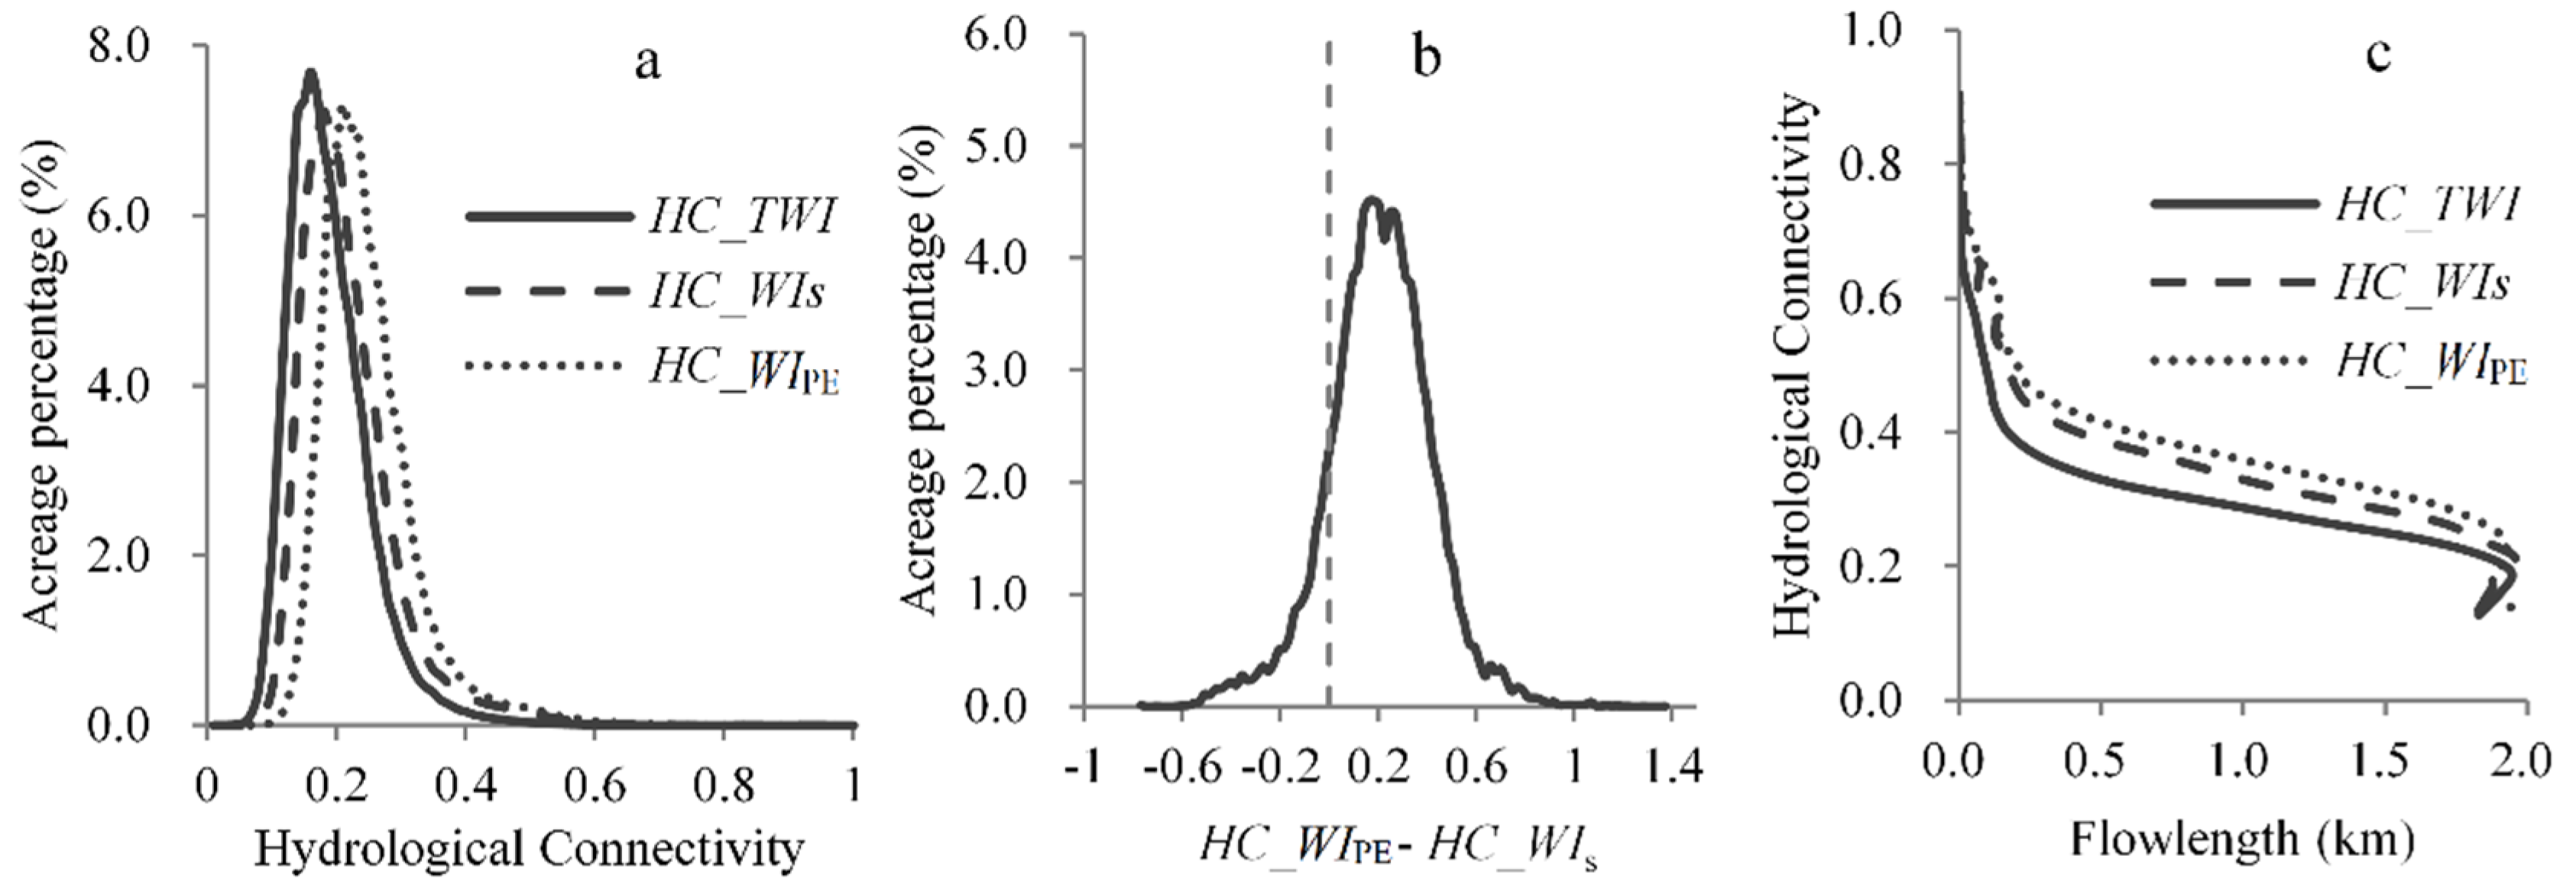
The spatial pattern of hydrological connectivity (HC_TWI, HC_WIS, and HC_WIPE) calculated based on the three wetness indices is displayed in Figure 5, and their acreage distribution is given in Figure 6. The HC_TWI in the Yan River watershed was low compared with HC_WIS and HC_WIPE, with an average value of 0.19, while HC_WIS and HC_WIPE were 0.22 and 0.25, respectively. In the upper reaches of the watershed, there were patches of low HC_TWI between ~0.3–0.4. In other parts, HC_TWI ranged from 0.1 to 0.3. The overall level of HC_WIS in the Yan River watershed was significantly higher than HC_TWI, particularly in the river valley, where the highest hydrological connectivity occurred (HC_TWI > 0.4). The value of HC_WIPE in the Yan River watershed was higher than that of HC_TWI and HC_WIS, and with greatest spatial variation. HC_WIPE in the southern part of the Yan River watershed was rather low, which is consistent with the greater vegetation coverage. In the middle reaches of the Yan River watershed, the terrain was complex, with a large number of hills, wide valleys, and a terrace distribution. HC_WIPE not only reflects the impact of topography on hydrological connectivity, but also the impact of climate and land cover. Correspondingly, it shows complex spatial variation in this area. The spatial pattern and acreage distribution of the differences between HC_WIPE and HC_WIS, as given in Figure 5d and Figure 6b, showed that climate and land cover dramatically reshaped the spatial pattern of hydrological connectivity. Except for the southern forest area, the difference between HC_WIPE and HC_WIS in the Yan River watershed was greater than 0. Along with increasing flow length, the hydrological connectivity quantified based on the three wetness indices are decreased (Figure 6c). Whether flow length was small or is great, the difference among the three connectivity indices was small. There was a turning point in hydrological connectivity between 0.4 and 0.5 (Figure 6c), which indicates that areas with greater hydrological connectivity were close to the river network.

3.3. Hydrological Connectivity Mitigated by Reservoirs

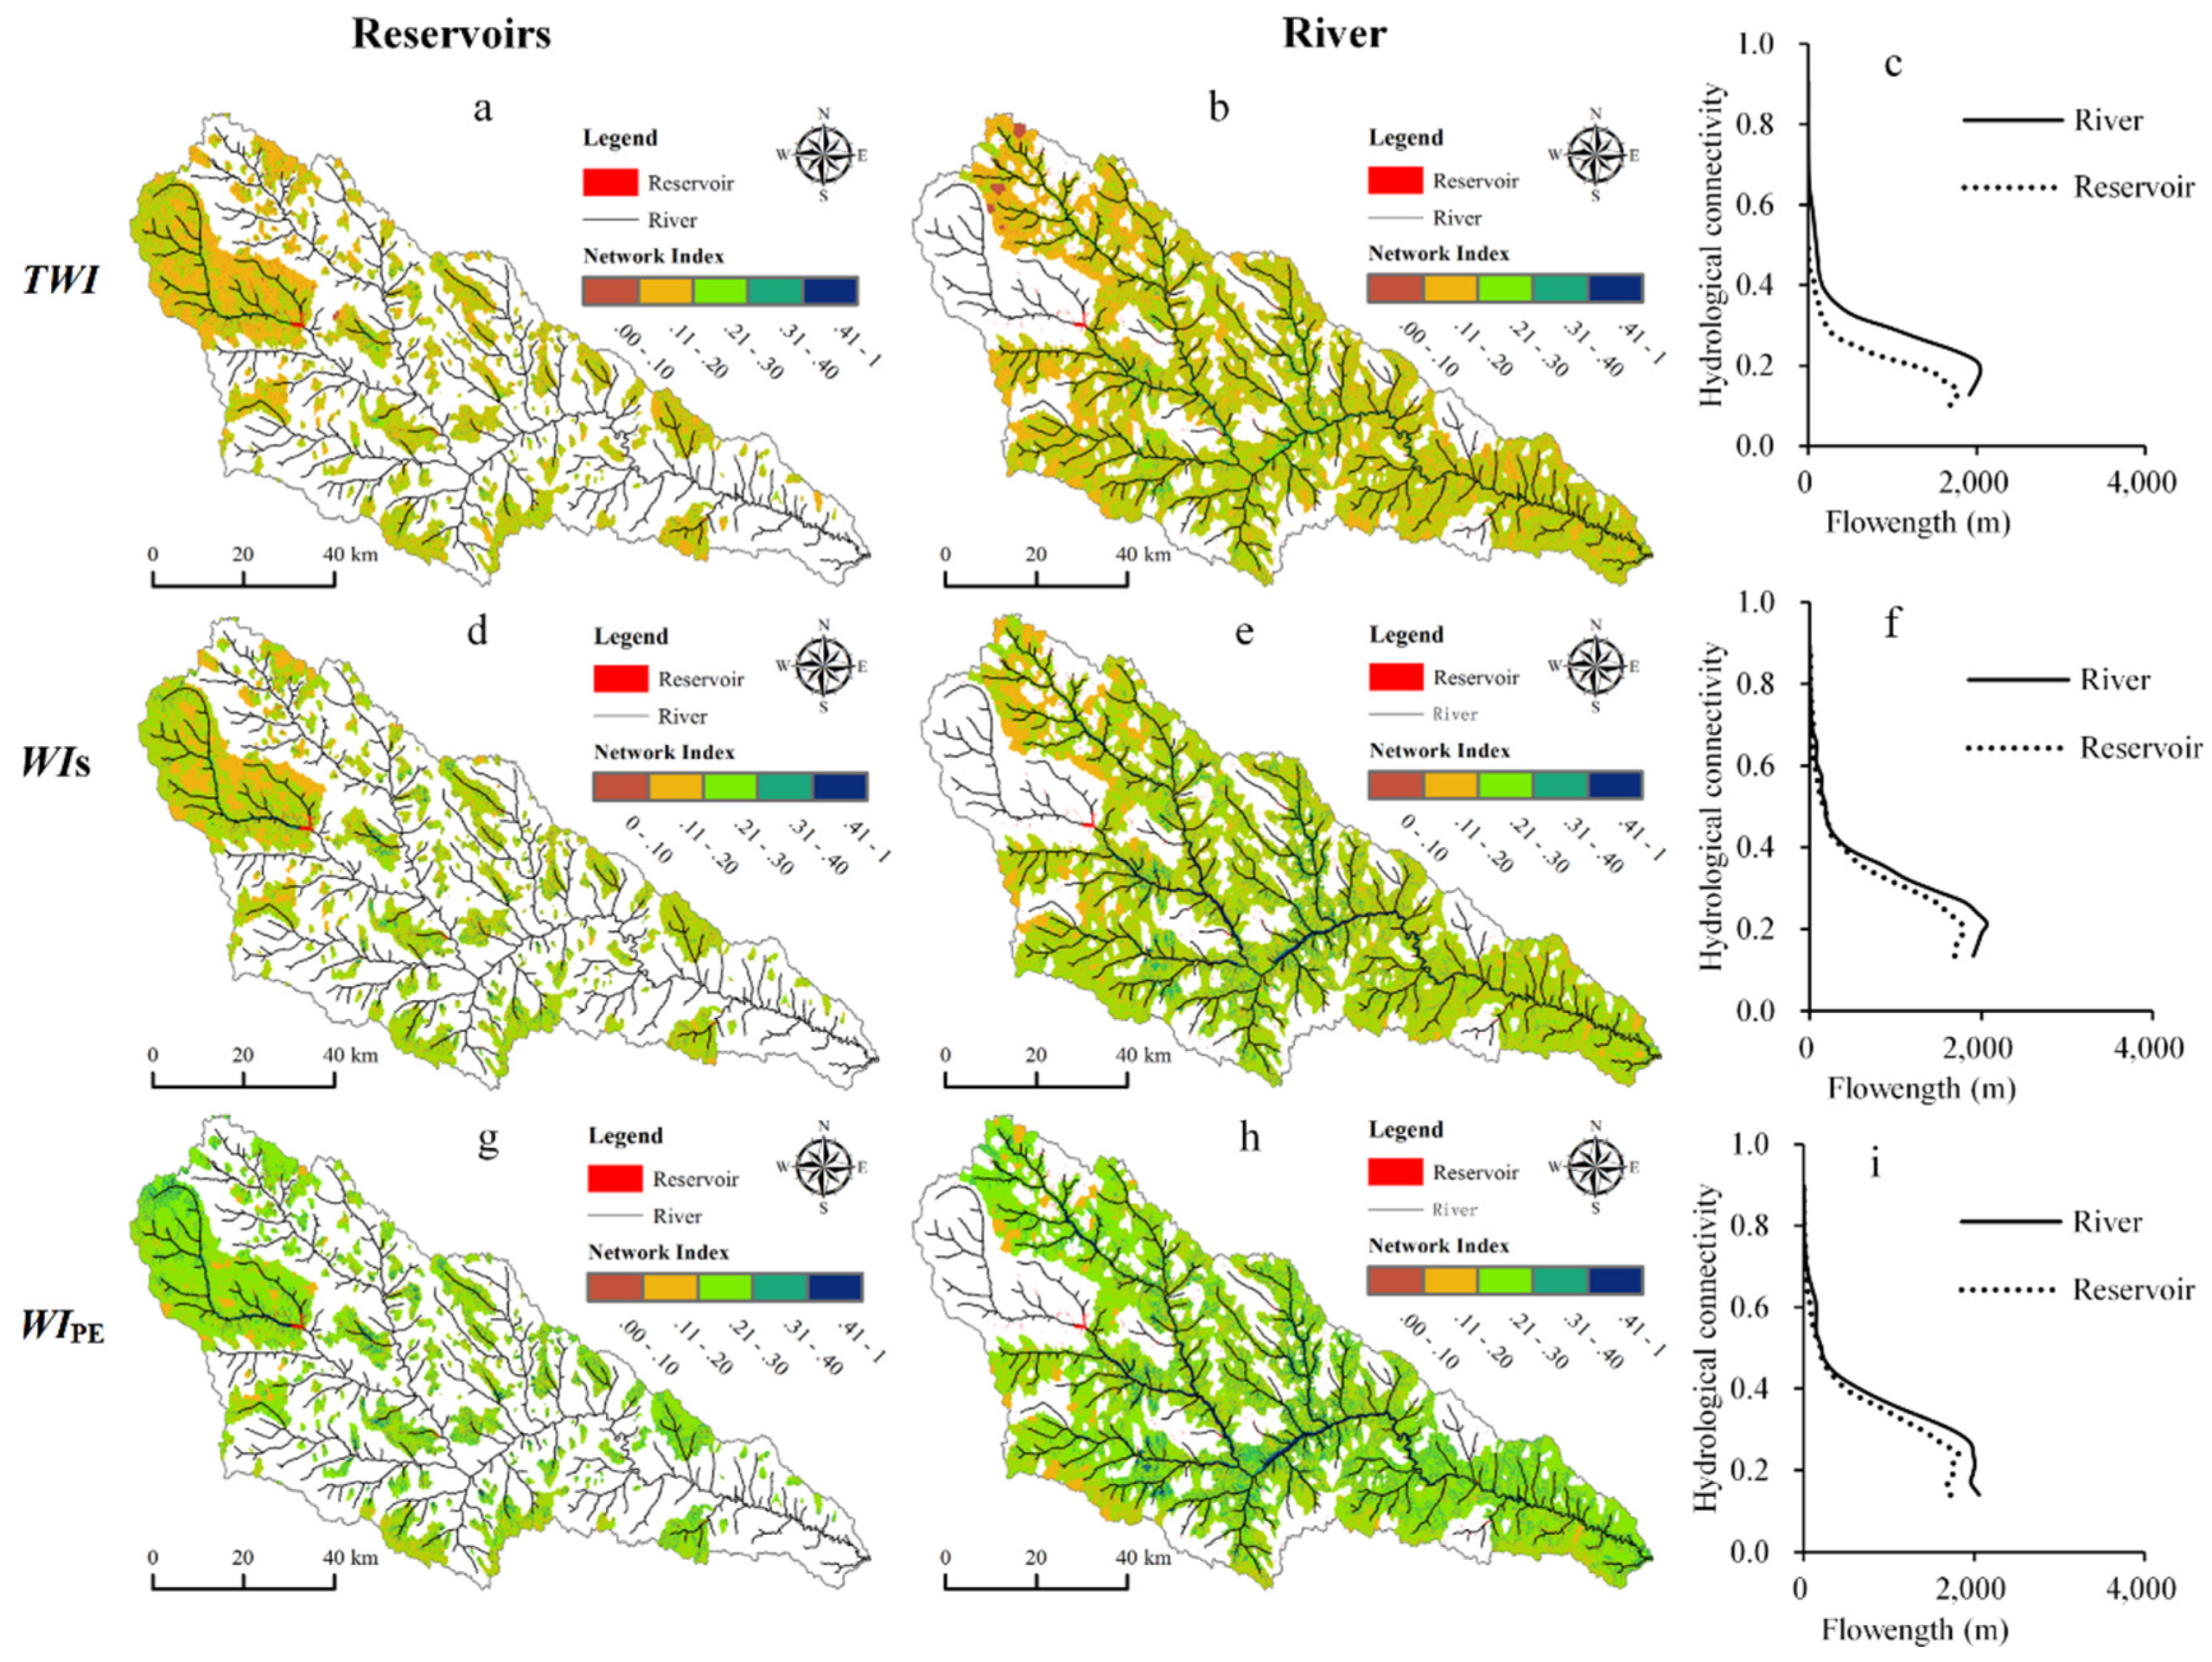
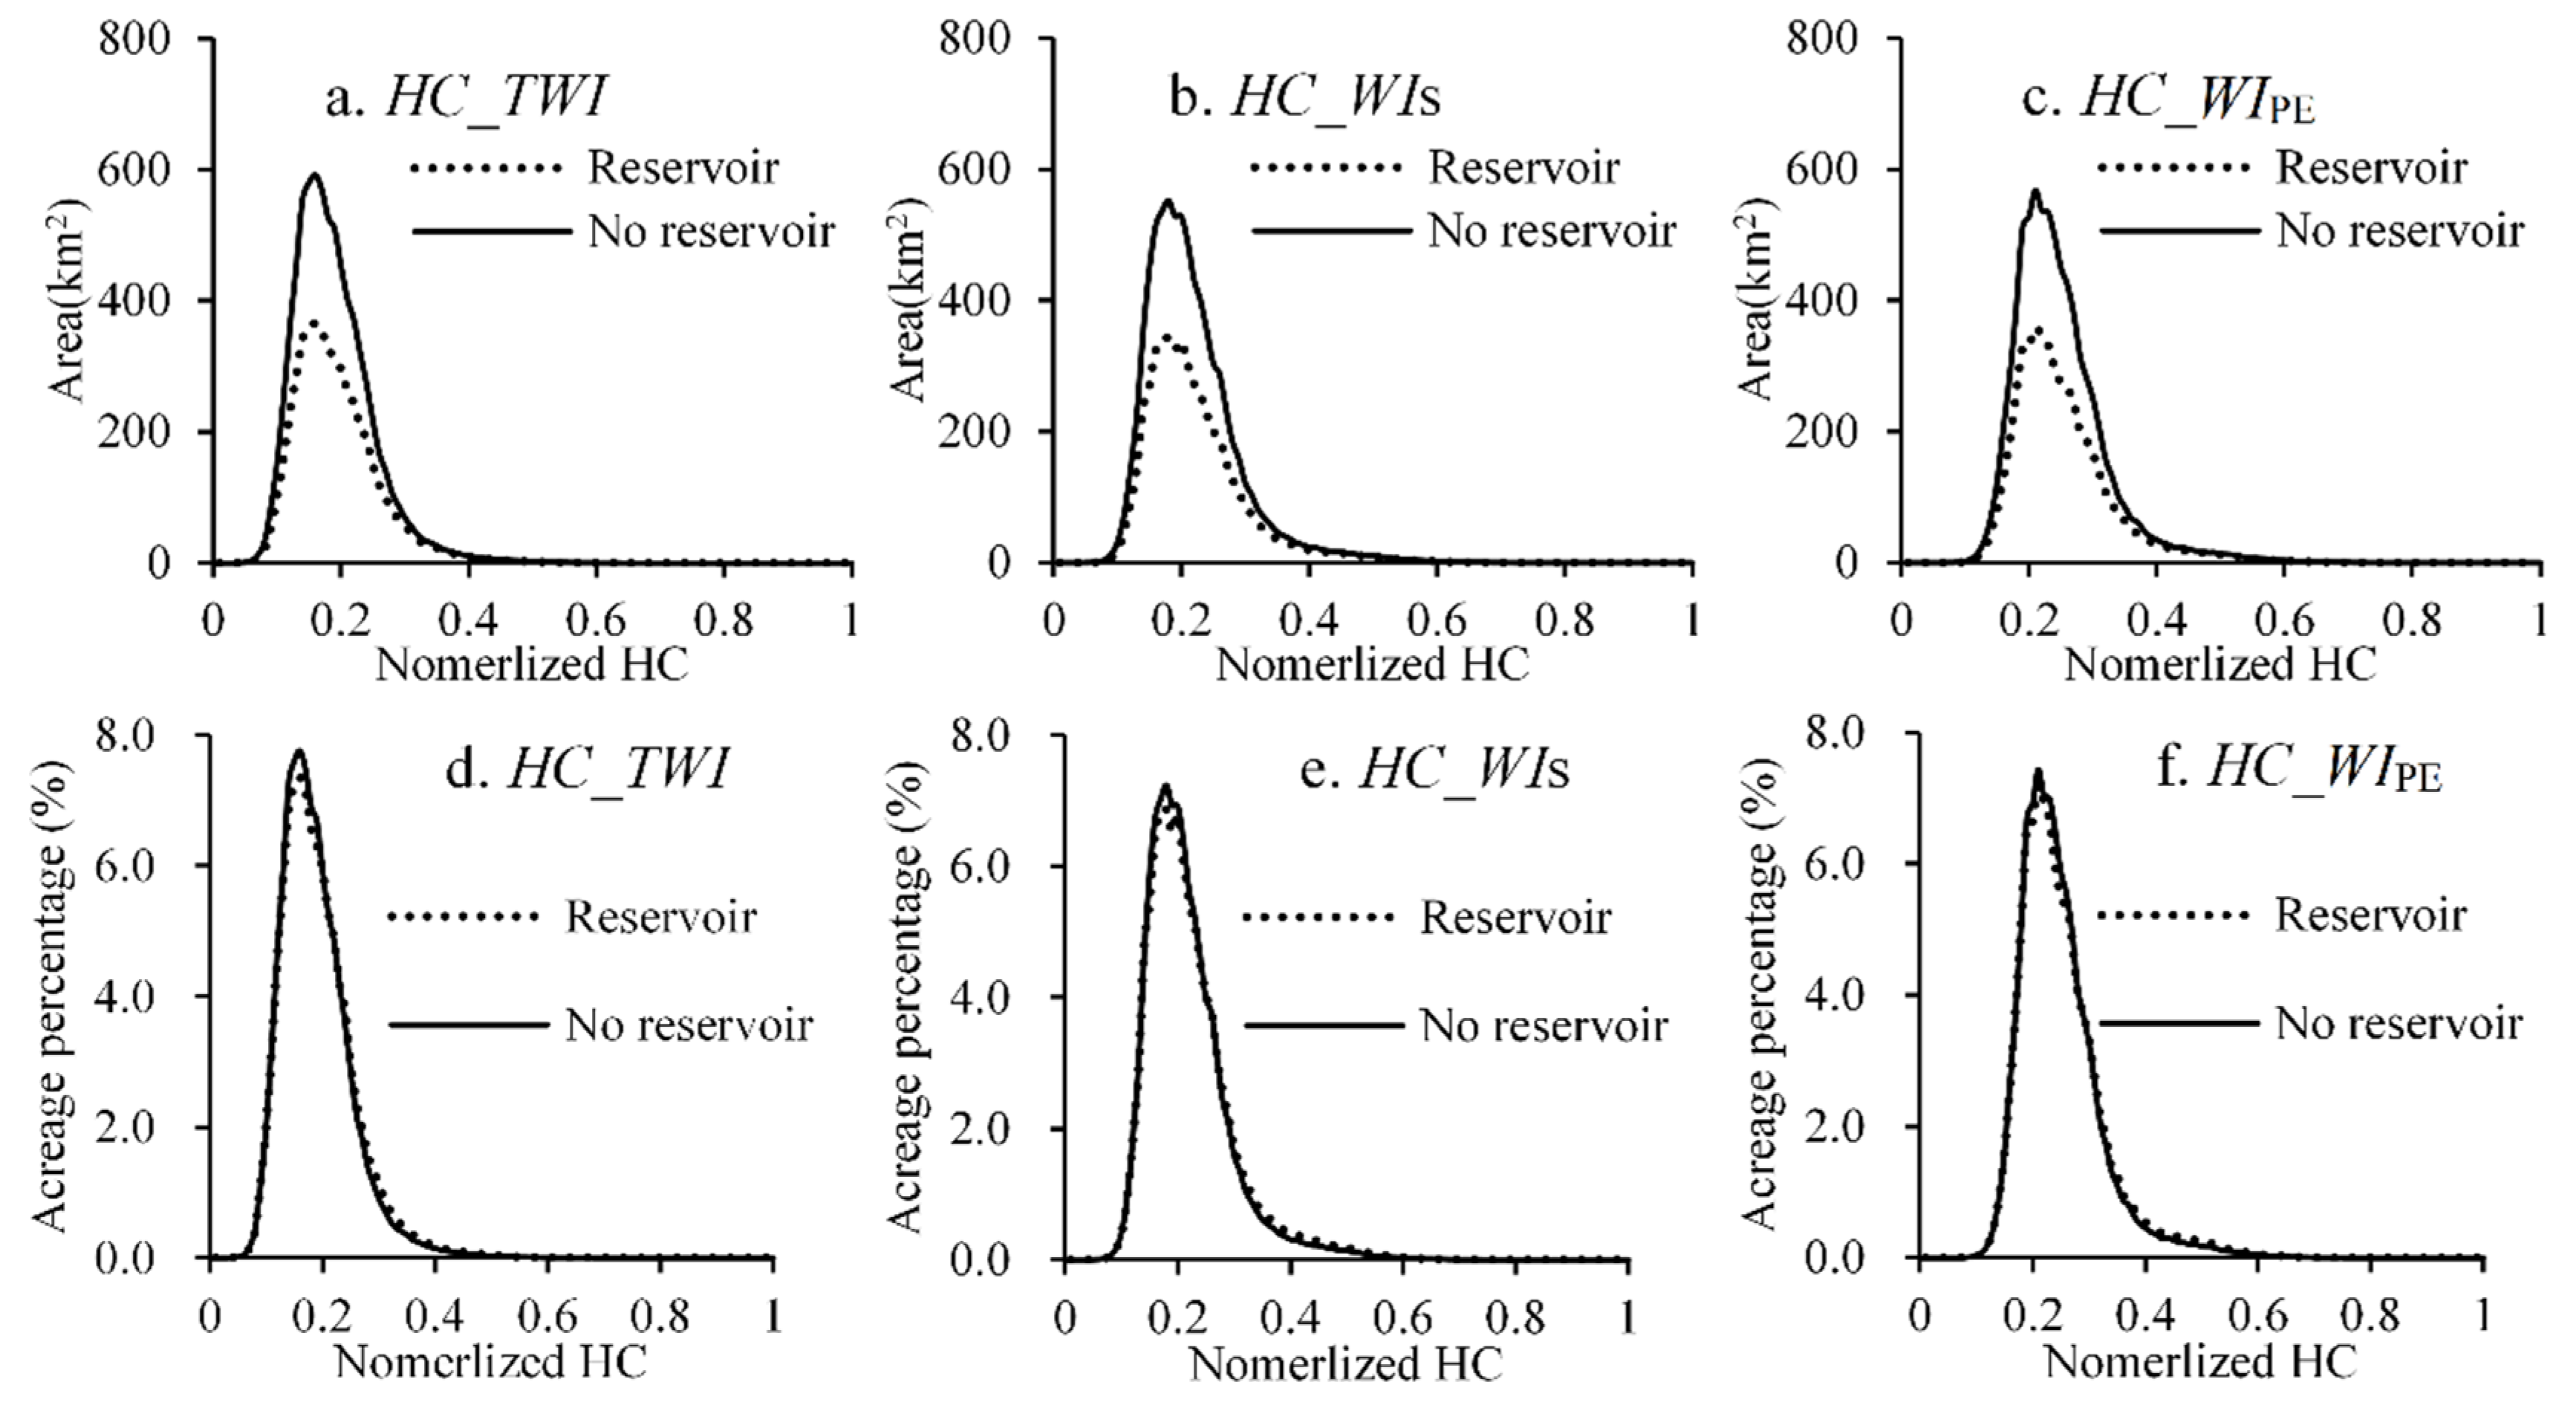
The large number of reservoirs controlled a large part of the Yan River watershed (Figure 7). The ECA of reservoirs was 2637 km2 (35% of the watershed acreage), and was 4978 km2 (65% of the watershed acreage) of the river trunk. After construction of reservoirs, it was significantly lower than that under the scenario without reservoirs (Figure 8a–c). The spatial pattern of connectivity to the river network and the reservoir is shown in Figure 7. In the effective catchment area of the reservoir, the values of HC_TWI and HC_WIS were both smaller; but the values of HC_TWI were higher than those of HC_TWI in the vicinity of the reservoir. The spatial distribution pattern of hydrological connectivity in the effective catchment of the river network is consistent with that of whole watershed (Figure 6 and Figure 7). In the effective catchment of the river network, the hydrological connectivity was significantly higher than that in the effective catchment of reservoirs. The difference among the three connectivity indices in the effective area of river networks was similar with that of reservoirs. It is apparent that the patterns of hydrological connectivity delineated by the three connectivity indices in the effective area of reservoirs were similar to that of river network. When flow length was short, the hydrological connectivity to reservoirs was very close to that to river network (Figure 7c,f,i). However, the areal distribution curves of hydrological connectivity indices within contribute area of the river network were very similar before and after reservoir construction (Figure 8d–f). These results imply that the degree of connectivity to rivers was reduced as the construction of reservoirs, but the distribution pattern of connectivity stayed the same.

4. Discussion

4.1. Impact of Reservoirs, Land Cover and Climate on Hydrological Connectivity Pattern

Human activities, such as vegetation restoration and construction of reservoirs and terraces, have caused great changes in the landscape pattern, which lead to spatial and temporal variation in the hydrological responses [25]. Revegetation, terracing, reservoir construction and climate in the Yan River watershed influenced the hydrologic regime [43] by changing the hydrological connectivity. A large number of studies have revealed a decline of runoff and sediment transport in the middle reaches of the Yellow River in recent decades [25,26]. Among these measures, check dam/reservoir was considered to be the dominant factor influencing the hydrological regime [44,45]. About 721 reservoirs impounding reservoirs were constructed in the Yan River watershed. Thus, the effective source area of river network was significantly reduced. The reservoirs interrupt the longitudinal stream flow, decreasing the velocity and peak rates and allowing more time for infiltration and sediment trapping [46,47], and promoting recharge to groundwater [48]. Consequently, the reservoirs caused a greater reduction in runoff discharged into lower river channel [49].
However, there are uncertainties when describing the hydrological connectivity by using the approach of this study. Uncertainty of the wetness index is responsible for this. Though the TWI is well correlated with the measured soil moisture [50,51], uncertain flow directions can result in unrealistic values of specific upslope areas in flat regions [22,52,53]. Our results show that the WIS simulates higher and more uniform wetness value than the TWI in the valley area (Figure 3). Moreover, climatic conditions will bias the moisture estimated by TWI [30,31,50]. Spatial patterns of WIPE show that the wetness value significantly decreased in the southern forest area of the Yan River watershed compared with the spatial distribution of WIS due to greater evapotranspiration, and the WIPE of the upper part of the catchment was significantly greater than WIS due to great precipitation. Besides, there are great uncertainties in estimating evapotranspiration [54,55].

4.2. Hydrological Implications of Mitigated Connectivity Pattern

A change in hydrological connectivity may alter hydrological response patterns. As revealed by Figure 8a–c, the acreage of areas hydrologically connected to the river network decreased as a result of construction of reservoirs. However, the acreage distribution patterns of hydrological connectivity were nearly the same. This depends on the spatial variation of topographical pattern and may not occur in other watersheds. In the Yan River watershed, the mosaic of gully and hilly topography are similar from upper tributaries to lower trunks. Though there are a large number of reservoirs that interrupt the hydrological connectivity, the normalized hydrological connectivity to river channels stayed in the same distribution pattern but with a decreased range (Figure 8). It is implied that the volume of flow in river channels will decrease, but with the same temporal period of flow dynamic.
There are rainfall thresholds for a reservoir’s ability to impact the hydrological processes. In small rainfall events, only areas with high hydrologic connectivity can discharge runoff into rivers and reservoirs. The construction of reservoirs may have a greater impact on small precipitation events considering the water discharge into downstream river channel. Polyakov, et al. [56] reported small rainfall events failed to produce runoff that reached the watershed outlet when there were soil and water conservation infrastructures. Hood, et al. [57] revealed that check dams and revegetation delayed runoff peak mainly for small storms with short durations and dry soil conditions. When the magnitude of rainfall events breaks certain thresholds, the upslope area of reservoirs would reconnect to the river channel down the reservoirs. In terms of large storm events, the low hydrological connectivity and small ECA after the construction of the reservoir will lead to a reduction in the runoff volume to the river and a reduction in the frequency of flooding [25,56]. In addition, the construction of the reservoirs will cause the reduced runoff velocity, and thus delay the flood peak. It is reported that in the valleys with check dams and promoted hillslope vegetation cover, runoff peak was delayed by 2.6 times compared with the scenario without reservoirs [58]. Guyassa, Frankl, Zenebe, Poesen and Nyssen [58] also found a negative correlation between rainfall intensity and runoff lag time, which indicates that the smaller the rainfall intensity, the longer the lag time before runoff reach the lower gully sections. Accordingly, when certain rainfall thresholds are broken, there will be multiple peaks of river flow as a result of alternation of hydrological connectivity caused by reservoirs, of which the first one mainly contributes to runoff from the effective catchment of the river without impedance of reservoirs, and second one contributes to the delayed runoff from upper catchment of reservoirs.

5. Conclusions

In this study, the spatial pattern of hydrological connectivity as a result of reservoir construction, climate and land cover in the Yan River watershed on the Loess Plateau was mapped by following the network index (NI) approach and based topographical wetness index (TWI), SAGA wetness index (WIS), and wetness index (WIPE) integrated aridity index (AI) determined by precipitation and evapotranspiration. Also, the effective catchment area (ECA) was adopted. By integrating the precipitation and evapotranspiration, the comprehensive impacts of climate and vegetation cover on the hydrological connectivity to rivers reservoirs was delineated. By using the NI approach, the impact of reservoir construction and vegetation cover on watershed hydrological connectivity was revealed.
The ECA of the reservoirs in the Yan River watershed is 2637 km2, and that of the rivers is 4978 km2, which accounts for 35% and 65% of the total acreage of the Yan River watershed, respectively. The area hydrologically connected to the river network decreased as a result of construction of reservoirs, but the acreage distribution patterns of hydrological connectivity were nearly the same. Due to the similar mosaic of gully and hilly topography from upper tributaries to lower trunks, though there are a large number of reservoirs in upper reaches, distribution patterns of the normalized hydrological connectivity to river channels stayed the same but with a decreased range. These results imply a decreased volume of flow in river channels with same temporal period of flow dynamic after reservoir construction. The spatial patterns of hydrological connectivity quantified by NI based on WIS and WIPE reveal that the vegetation cover pattern reshaped the spatial pattern of hydrological connectivity.
This study also illustrated that the NI approach is suitable to quantify the hydrological connectivity and it dynamic as a result of human intervention and climate.

Author Contributions

L.Z. collected and processed data and wrote the manuscript; Y.L. (Yu Liu) designed the research, guided and supervised data collecting, and revised the manuscript; Y.L. (Yong Luo) participated in research design and preparing the manuscript. All authors have read and agreed to the published version of the manuscript.

Funding

This research was funded by the National Science Foundation of China, grant number 4167011589, and the International Partnership Program of the Chinese Academy of Sciences, grant number 121311KYSB20170004).

Acknowledgments

We give our thanks to the reviewers for their efforts to improve the manuscript; We thank Culf Alistair from the ScientificSoftware & Technical Writing for the language polish.

Conflicts of Interest

The authors declare no conflict of interests.

References

  1. Freeman, M.C.; Pringle, C.M.; Jackson, C.R. Hydrologic connectivity and the contribution of stream headwaters to ecological integrity at regional scales. JAWRA J. Am. Water Resour. Assoc. 2007, 43, 5–14. [Google Scholar] [CrossRef]
  2. Bracken, L.J.; Wainwright, J.; Ali, G.; Tetzlaff, D.; Smith, M.W.; Reaney, S.M.; Roy, A. Concepts of hydrological connectivity: Research approaches, pathways and future agendas. Earth Sci. Rev. 2013, 119, 17–34. [Google Scholar] [CrossRef] [Green Version]
  3. Bracken, L.J.; Croke, J. The concept of hydrological connectivity and its contribution to understanding runoff-dominated geomorphic systems. Hydrol. Process. 2007, 21, 1749–1763. [Google Scholar] [CrossRef]
  4. Gao, C.; Gao, X.; Jia, P. Summary comments on hydrologic connectivity. Chin. J. Appl. Environ. Biol. 2017, 23, 586–594. [Google Scholar]
  5. Larsen, L.G.; Choi, J.; Nungesser, M.K.; Harvey, J.W. Directional connectivity in hydrology and ecology. Ecol. Appl. 2012, 22, 2204–2220. [Google Scholar] [CrossRef]
  6. Wainwright, J.; Turnbull, L.; Ibrahim, T.G.; Lexartza-Artza, I.; Thornton, S.F.; Brazier, R.E. Linking environmental régimes, space and time: Interpretations of structural and functional connectivity. Geomorphology 2011, 126, 387–404. [Google Scholar] [CrossRef]
  7. Wang, L.; Zou, C.; O’Donnell, F.; Good, S.P.; Franz, T.; Miller, G.R.; Caylor, K.K.; Cable, J.M.; Bond, B. Characterizing ecohydrological and biogeochemical connectivity across multiple scales: A new conceptual framework. Ecohydrology 2010, 5, 221–233. [Google Scholar] [CrossRef]
  8. Turnbull, L.; Wainwright, J.; Brazier, R.E. A conceptual framework for understanding semi-arid land degradation: Ecohydrological interactions across multiple-space and time scales. Ecohydrology 2008, 1, 23–34. [Google Scholar] [CrossRef] [Green Version]
  9. Rinderer, M.; Ali, G.; Larsen, L.G. Assessing structural, functional and effective hydrologic connectivity with brain neuroscience methods: State-of-the-art and research directions. Earth Sci. Rev. 2018, 178, 29–47. [Google Scholar] [CrossRef]
  10. Turnbull, L.; Wainwright, J. From structure to function: Understanding shrub encroachment in drylands using hydrological and sediment connectivity. Ecol. Indic. 2019, 98, 608–618. [Google Scholar] [CrossRef] [Green Version]
  11. Larsen, L.; Newman, S.; Saunders, C.; Harvey, J.W. Complex networks of functional connectivity in a wetland reconnected to its floodplain. Water Resour. Res. 2017, 53, 6089–6108. [Google Scholar] [CrossRef] [Green Version]
  12. Fryirs, K. (Dis)Connectivity in catchment sediment cascades: A fresh look at the sediment delivery problem. Earth Surf. Process. Landf. 2012, 38, 30–46. [Google Scholar] [CrossRef]
  13. Fryirs, K.; Brierley, G.; Preston, N.J.; Kasai, M. Buffers, barriers and blankets: The (dis)connectivity of catchment-scale sediment cascades. Catena 2007, 70, 49–67. [Google Scholar] [CrossRef]
  14. Liu, Y.; Fu, B. Assessing sedimentological connectivity using WATEM/SEDEM model in a hilly and gully watershed of the Loess Plateau, China. Ecol. Indic. 2016, 66, 259–268. [Google Scholar] [CrossRef]
  15. Fryirs, K.; Brierley, G.; Preston, N.J.; Spencer, J. Catchment-scale (dis)connectivity in sediment flux in the upper Hunter catchment, New South Wales, Australia. Geomorphology 2007, 84, 297–316. [Google Scholar] [CrossRef]
  16. Lane, S.N.; Reaney, S.M.; Heathwaite, A.L. Representation of landscape hydrological connectivity using a topographically driven surface flow index. Water Resour. Res. 2009, 45. [Google Scholar] [CrossRef] [Green Version]
  17. Lexartza-Artza, I.; Wainwright, J. Hydrological connectivity: Linking concepts with practical implications. Catena 2009, 79, 146–152. [Google Scholar] [CrossRef]
  18. Zehe, E.; Sivapalan, M. Threshold behaviour in hydrological systems as (human) geo-ecosystems: Manifestations, controls, implications. Hydrol. Earth Syst. Sci. 2009, 13, 1273–1297. [Google Scholar] [CrossRef] [Green Version]
  19. Lane, S.N.; Brookes, C.J.; Kirkby, M.J.; Holden, J. A network-index-based version of TOPMODEL for use with high-resolution digital topographic data. Hydrol. Process. 2004, 18, 191–201. [Google Scholar] [CrossRef]
  20. Beven, K.J.; Kirkby, M.J. A physically based, variable contributing area model of basin hydrology. Hydrol. Sci. Bull. 1979, 24, 43–69. [Google Scholar] [CrossRef] [Green Version]
  21. Pourali, S.H.; Arrowsmith, C.; Chrisman, N.; Matkan, A.A.; Mitchell, D. Topography wetness index application in flood-risk-based land use planning. Appl. Spat. Anal. Policy 2014, 9, 39–54. [Google Scholar] [CrossRef]
  22. Böhner, J.; Selige, T. Spatial prediction of soil attributes using terrain analysis and climate regionalisation. Gott. Geogr. Abh. 2006, 115, 13–28. [Google Scholar]
  23. Lü, Y.; Fu, B.; Feng, X.; Zeng, Y.; Liu, Y.; Chang, R.; Sun, G.; Wu, B. A policy-driven large scale ecological restoration: Quantifying ecosystem services changes in the Loess Plateau of China. PLoS ONE 2012, 7, e31782. [Google Scholar] [CrossRef]
  24. Fu, B.; Wang, S.; Liu, Y.; Liu, J.; Liang, W.; Miao, C. Hydrogeomorphic ecosystem responses to natural and anthropogenic changes in the Loess Plateau of China. Annu. Rev. Earth Planet. Sci. 2017, 45, 223–243. [Google Scholar] [CrossRef]
  25. Wang, H.; Yang, Z.; Saito, Y.; Liu, J.P.; Sun, X. Interannual and seasonal variation of the Huanghe (Yellow River) water discharge over the past 50 years: Connections to impacts from ENSO events and dams. Glob. Planet. Chang. 2006, 50, 212–225. [Google Scholar] [CrossRef]
  26. Wang, S.; Fu, B.; Piao, S.; Lü, Y.; Ciais, P.; Feng, X.; Wang, Y. Reduced sediment transport in the Yellow River due to anthropogenic changes. Nat. Geosci. 2015, 9, 38–41. [Google Scholar] [CrossRef]
  27. Xu, X.-Z.; Zhang, H.-W.; Zhang, O. Development of check-dam systems in gullies on the Loess Plateau, China. Environ. Sci. Policy 2004, 7, 79–86. [Google Scholar] [CrossRef]
  28. Zhou, Z.; Li, J. The correlation analysis on the landscape pattern index and hydrological processes in the Yanhe watershed, China. J. Hydrol. 2015, 524, 417–426. [Google Scholar] [CrossRef]
  29. Fu, B.; Liu, Y.; Lü, Y.; He, C.; Zeng, Y.; Wu, B. Assessing the soil erosion control service of ecosystems change in the Loess Plateau of China. Ecol. Complex. 2011, 8, 284–293. [Google Scholar] [CrossRef]
  30. Zhu, H.; Shi, Z.; Fang, N.; Wu, G.; Guo, Z.; Zhang, Y. Soil moisture response to environmental factors following precipitation events in a small catchment. Catena 2014, 120, 73–80. [Google Scholar] [CrossRef]
  31. Chaplot, V.; Walter, C. Subsurface topography to enhance the prediction of the spatial distribution of soil wetness. Hydrol. Process. 2003, 17, 2567–2580. [Google Scholar] [CrossRef]
  32. Liu, Y.; Fu, B.; Lü, Y.; Wang, Z.; Gao, G. Hydrological responses and soil erosion potential of abandoned cropland in the Loess Plateau, China. Geomorphology 2012, 138, 404–414. [Google Scholar] [CrossRef]
  33. Yang, L.; Li, J.; Wei, W. Effects of vegetation restoration on the spatial distribution of soil moisture at the hillslope scale in semi-arid regions. Catena 2015, 124, 138–146. [Google Scholar] [CrossRef]
  34. Wang, Y.; Sun, H.; Zhao, Y. Characterizing spatial-temporal patterns and abrupt changes in deep soil moisture across an intensively managed watershed. Geoderma 2019, 341, 181–194. [Google Scholar] [CrossRef]
  35. Wang, H.; Yang, Q.; Yao, Z. Correlation of soil moisture and Topographic Wetness Index at a scale of small watershed. Bull. Soil Water Conserv. 2009, 29, 110–113, (In Chinsese with English abstract). [Google Scholar]
  36. Gómez-Plaza, A.; Martínez-Mena, M.; Albaladejo, J.; Castillo, V.M. Factors regulating spatial distribution of soil water content in small semiarid catchments. J. Hydrol. 2001, 253, 211–226. [Google Scholar] [CrossRef]
  37. Kaiser, K.E.; McGlynn, B.L. Nested scales of spatial and temporal variability of soil water content across a semiarid montane catchment. Water Resour. Res. 2018, 54, 7960–7980. [Google Scholar] [CrossRef]
  38. Conrad, O.; Bechtel, B.; Bock, M.; Dietrich, H.; Fischer, E.; Gerlitz, L.; Wehberg, J.; Wichmann, V.; Böhner, J. System for Automated Geoscientific Analyses (SAGA) v. 2.1.4. Geosci. Model Dev. 2015, 8, 1991–2007. [Google Scholar] [CrossRef] [Green Version]
  39. Jasper, K.; Calanca, P.; Fuhrer, J. Changes in summertime soil water patterns in complex terrain due to climatic change. J. Hydrol. 2006, 327, 550–563. [Google Scholar] [CrossRef]
  40. Speight, J.G. A parametric approach to landform regions. In Progress in Geomorphology, Special Publication No.7; Institute of British Geographers, Alden & Mowbray Ltd. at the Alden Press: Oxford, UK, 1974; pp. 213–230. [Google Scholar]
  41. Seneviratne, S.I.; Corti, T.; Davin, E.L.; Hirschi, M.; Jaeger, E.B.; Lehner, I.; Orlowsky, B.; Teuling, A.J. Investigating soil moisture–climate interactions in a changing climate: A review. Earth Sci. Rev. 2010, 99, 125–161. [Google Scholar] [CrossRef]
  42. Mu, Q.; Zhao, M.; Running, S.W. Improvements to a MODIS global terrestrial evapotranspiration algorithm. Remote Sens. Environ. 2011, 115, 1781–1800. [Google Scholar] [CrossRef]
  43. Liu, X.Y.; Wang, F.G.; Yang, S.T.; Li, X.Y.; Ma, H.B.; He, X.Z. Sediment reduction effect of level terrace in the hilly-gully region in the Loess Plateau. J. Hydraul. Eng. 2014, 45, 793–800. [Google Scholar]
  44. Bonacci, O.; Tadic, Z.; Trninic, D. Effects of dams and reservoirs on the hydrological characteristics of the lower drava river. Regul. Rivers Res. Manag. 1992, 7, 349–357. [Google Scholar] [CrossRef]
  45. Hu, W.-W.; Wang, G.; Deng, W.; Li, S.-N. The influence of dams on ecohydrological conditions in the Huaihe River basin, China. Ecol. Eng. 2008, 33, 233–241. [Google Scholar] [CrossRef]
  46. Mishra, A.; Froebrich, J.; Gassman, P.W. Evaluation of the SWAT Model for assessing sediment control structures in a small watershed in India. Trans. ASABE 2007, 50, 469–477. [Google Scholar] [CrossRef]
  47. Wohl, E. Human impacts to mountain streams. Geomorphology 2006, 79, 217–248. [Google Scholar] [CrossRef] [Green Version]
  48. Callow, N.; Smettem, K. The effect of farm dams and constructed banks on hydrologic connectivity and runoff estimation in agricultural landscapes. Environ. Model. Softw. 2009, 24, 959–968. [Google Scholar] [CrossRef]
  49. Xu, Y.D.; Fu, B.J.; He, C.S. Assessing the hydrological effect of the check dams in the Loess Plateau, China, by model simulations. Hydrol. Earth Syst. Sci. 2013, 17, 2185–2193. [Google Scholar] [CrossRef] [Green Version]
  50. Raduła, M.W.; Szymura, T.; Szymura, M. Topographic wetness index explains soil moisture better than bioindication with Ellenberg’s indicator values. Ecol. Indic. 2018, 85, 172–179. [Google Scholar] [CrossRef]
  51. Luo, W.; Xu, X.; Liu, W.; Liu, M.; Li, Z.; Peng, T.; Xu, C.; Zhang, Y.; Zhang, R. UAV based soil moisture remote sensing in a karst mountainous catchment. Catena 2019, 174, 478–489. [Google Scholar] [CrossRef]
  52. Grabs, T.; Seibert, J.; Bishop, K.; Laudon, H. Modeling spatial patterns of saturated areas: A comparison of the topographic wetness index and a dynamic distributed model. J. Hydrol. 2009, 373, 15–23. [Google Scholar] [CrossRef] [Green Version]
  53. Alexander, C.; Deak, B.; Heilmeier, H. Micro-topography driven vegetation patterns in open mosaic landscapes. Ecol. Indic. 2016, 60, 906–920. [Google Scholar] [CrossRef]
  54. Savenije, H.H.G. The importance of interception and why we should delete the term evapotranspiration from our vocabulary. Hydrol. Process. 2004, 18, 1507–1511. [Google Scholar] [CrossRef]
  55. Zhou, G.; Sun, G.; Wang, X.; Zhou, C.; McNulty, S.; Vose, J.M.; Amatya, D.M. Estimating forest ecosystem evapotranspiration at multiple temporal scales with a dimension analysis approach. JAWRA J. Am. Water Resour. Assoc. 2008, 44, 208–221. [Google Scholar] [CrossRef]
  56. Polyakov, V.O.; Nichols, M.H.; McClaran, M.P.; Nearing, M.A.; Garbrecht, J.; Shields, F.D.; Tomer, M.; Sadler, E.J.; Bonta, J.; Baffaut, C.; et al. Effect of check dams on runoff, sediment yield, and retention on small semiarid watersheds. J. Soil Water Conserv. 2014, 69, 414–421. [Google Scholar] [CrossRef] [Green Version]
  57. Hood, M.J.; Clausen, J.C.; Warner, G.S. Comparison of stormwater lag times for low impact and traditional residential development. JAWRA J. Am. Water Resour. Assoc. 2007, 43, 1036–1046. [Google Scholar] [CrossRef]
  58. Guyassa, E.; Frankl, A.; Zenebe, A.; Poesen, J.; Nyssen, J. Effects of check dams on runoff characteristics along gully reaches, the case of Northern Ethiopia. J. Hydrol. 2017, 545, 299–309. [Google Scholar] [CrossRef] [Green Version]
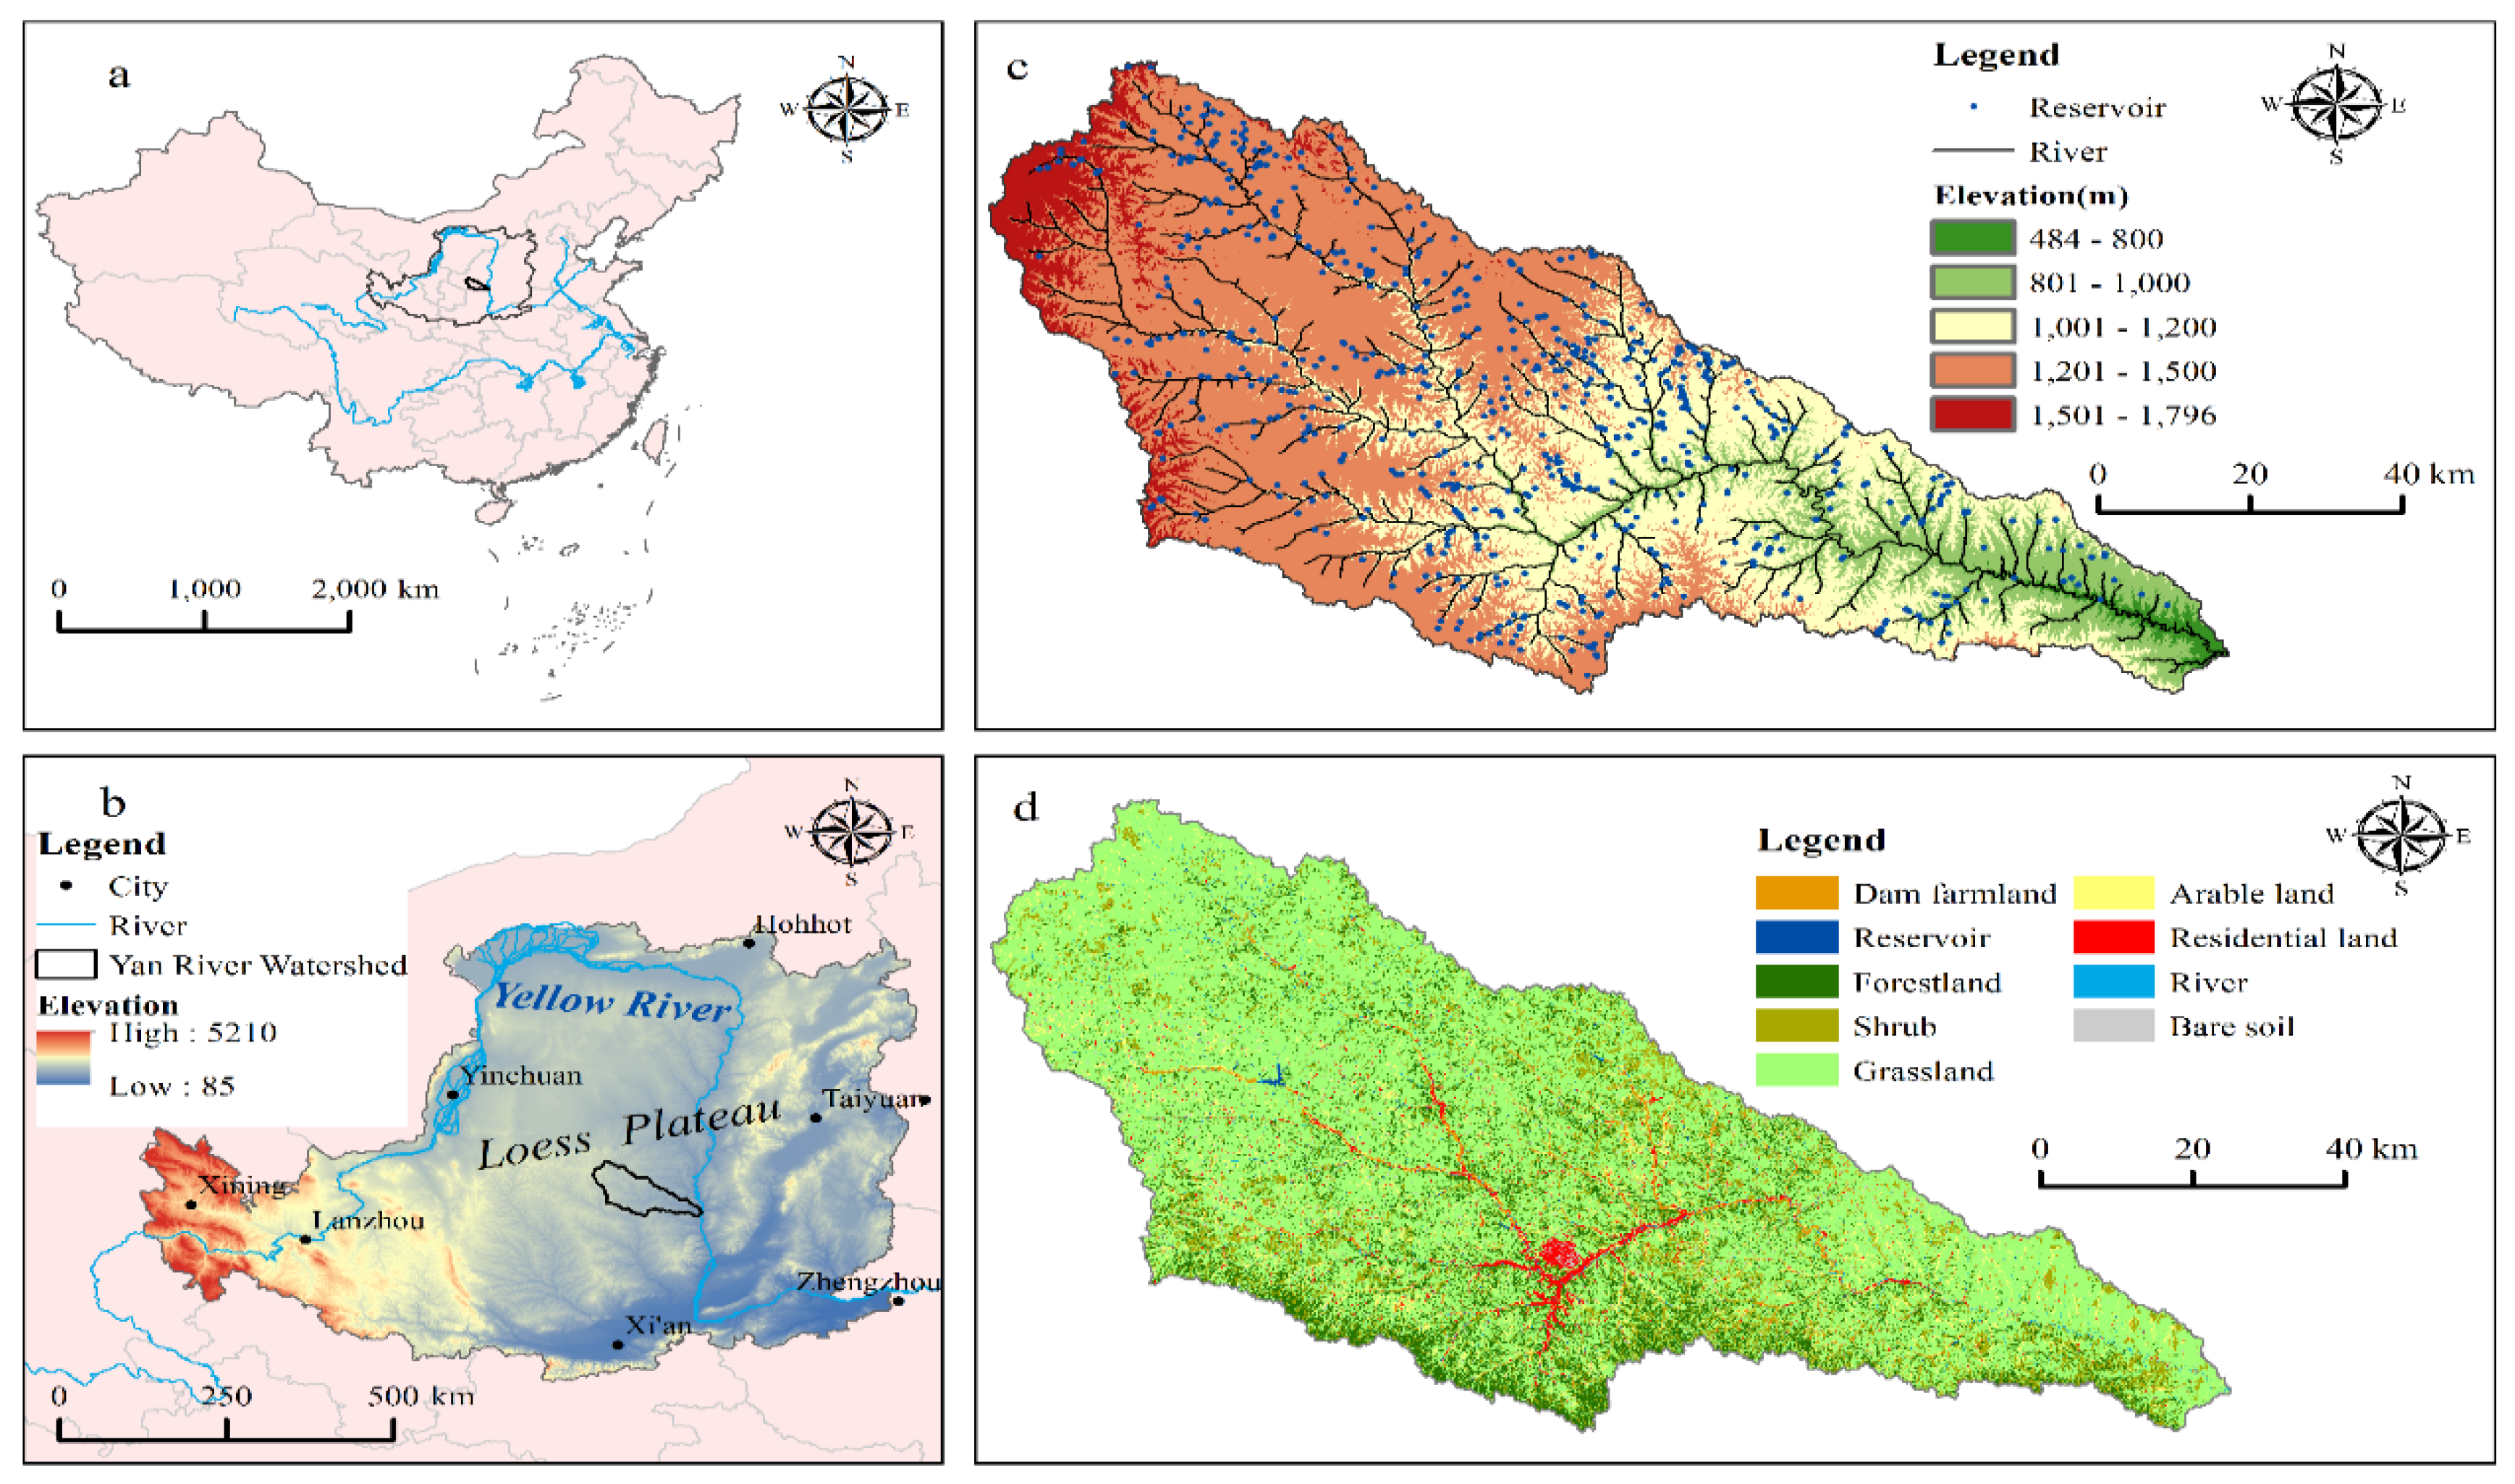
Figure 1. Location and land cover map of the Yan River watershed. (a) The location of the Loess Plateau in China; (b) the location of the Yan River watershed on the Loess Plateau; (c) elevation and locations of the 721 reservoirs in the Yan River watershed; and (d) land cover map of the Yan River watershed in 2015.
Water 12 01742 g001
Figure 2. Schematic diagram of network index (NI) calculation.
Water 12 01742 g002
Figure 3. Spatial pattern of precipitation (a), evapotranspiration (b), and aridity index (AI) (c) in Yan River watershed in 2015.
Water 12 01742 g003
Figure 4. Spatial distribution of normalized wetness index in Yan River watershed: (a) normalized topographical wetness index (TWI), (b) normalized SAGA (System for Automated Geoscientific Analyses) wetness index (WIS) and (c) normalized wetness index (WIPE), and (d) the acreage distribution of the three normalized wetness indices.
Water 12 01742 g004
Figure 5. Spatial pattern of hydrological connectivity HC_TWI (a), HC_WIS (b), HC_WIPE (c), which calculated by TWI, WIS, and WIPE, respectively, and the difference between HC_WIPE and HC_WIS (d) in the Yan River watershed.
Water 12 01742 g005
Figure 6. Acreage distribution of hydrological connectivity (a), the difference between HC_WIPE and HC_WIS (b), and hydrological connectivity variation corresponding to flow length (c).
Water 12 01742 g006
Figure 7. Spatial pattern of HC_TWI (a), HC_WIS (d), and HC_WIPE (g) in the effective catchment area (ECA) of reservoirs; the spatial pattern of HC_TWI (b), HC_WIS (e), and HC_WIPE (h) in the ECA of the river network; and relationships between hydrological connectivity and flow length (c,f,i).
Water 12 01742 g007
Figure 8. Acreage distribution of hydrological connectivity (a,d) HC_TWI, (b,e) HC_WIS, and (c,f) HC_WIPE in the ECA of the river before and after reservoir construction.
Water 12 01742 g008