Article

Retrieval of Soil Moisture by Integrating Sentinel-1A and MODIS Data over Agricultural Fields

School of Hydrology and Water Resources, Nanjing University of Information Science and Technology, Nanjing 210044, China
*
Author to whom correspondence should be addressed.
Water 2020, 12(6), 1726; https://doi.org/10.3390/w12061726
Submission received: 2 May 2020 / Revised: 13 June 2020 / Accepted: 14 June 2020 / Published: 17 June 2020
(This article belongs to the Section Hydrology)

Abstract

:
Soil moisture is an essential variable in the land surface ecosystem, which plays an important role in agricultural drought monitoring, crop status monitoring, and crop yield prediction. High-resolution radar data can be combined with optical remote-sensing data to provide a new approach to estimate high-resolution soil moisture over vegetated areas. In this paper, the Sentinel-1A data and the Moderate Resolution Imaging Spectroradiometer (MODIS) data are combined to retrieve soil moisture over agricultural fields. The advanced integral equation model (AIEM) is utilized to calculate the scattering contribution of the bare soil surface. The water cloud model (WCM) is applied to model the backscattering coefficient of vegetated areas, which use two vegetation parameters to parameterize the scattering and attenuation properties of vegetation. Four different vegetation parameters extracted from MODIS products are combined to predict the scattering contribution of vegetation, including the leaf area index (LAI), the fraction of photosynthetically active radiation (FPAR), normalized difference vegetation index (NDVI), and the enhanced vegetation index (EVI). The effective roughness parameters are chosen to parameterize the AIEM. The Sentinel-1A and MODIS data in 2017 are used to calibrate the coupled model, and the datasets in 2018 are used for soil moisture estimation. The calibration results indicate that the Sentinel-1A backscattering coefficient can be accurately predicted by the coupled model with the Pearson correlation coefficient (R) ranging from 0.58 to 0.81 and a root mean square error (RMSE) ranging from 0.996 to 1.401 dB. The modeled results show that the retrieved soil moisture can capture the seasonal dynamics of soil moisture with R ranging from 0.74 to 0.81. With the different vegetation parameter combinations used for parameterizing the scattering contribution of the canopy, the importance of suitable vegetation parameters for describing the scattering and attenuation properties of vegetation is confirmed. The LAI is recommended to characterize the scattering properties. There is no obvious clue for selecting vegetation descriptors to characterize the attenuation properties of vegetation. These promising results confirm the feasibility and validity of the coupled model for soil moisture retrieval from the Sentinel-1A and MODIS data.

1. Introduction

Soil moisture plays an important role in the water and energy cycles of the land surface ecosystem and is considered as an important variable in Earth Science [1,2]. In agriculture, soil moisture is a critical component, which is essential for many applications, such as crop status monitoring, crop yield prediction, agricultural drought monitoring, and water resource management [3,4]. Due to the dynamic variability of soil moisture in time and space, dense spatial and temporal measurements at a regional and global scale remain difficult. Fortunately, remote sensing provides an operational method for soil moisture monitoring and estimation. Due to the high sensitivity to soil moisture and the ability of all-time and all-weather observation, microwave remote sensing has been widely applied in soil moisture retrieval over the bare or vegetated land surface [5,6]. This includes the synthetic aperture radar (SAR), which, due to its high spatial resolution, can be potentially used for providing soil moisture products with high spatiotemporal resolution.
However, the backscattering coefficient measured by SAR was affected by many factors, such as the sensor parameters (frequency, polarization, and incidence angle), soil parameters (surface roughness, soil dielectric constant, and soil texture), and the vegetation parameters (vegetation water content, vegetation coverage, vegetation structure, and others) [7,8]. For bare soil, some surface scattering models have been proposed to simulate the backscattering coefficient and retrieve soil moisture, such as the Oh model [9], Dubois model [10], Shi model [11], and the advanced integral equation model (AIEM) [12,13]. The common problem faced by these models in practice is how to parameterize the surface roughness parameters. Until now, many methods have been proposed for eliminating the effects of surface roughness parameters. Bai et al. [14] utilized the in-situ surface roughness parameters to parameterize the AIEM. Zribi and Dechambre [15] proposed a combined roughness parameter based on multi-angle Radarsat-1 data for simultaneously retrieving the soil moisture and roughness parameters. Bai and He [16] utilized the VV and HH co-polarization to remove the root mean square (RMS) height based on the Dubois model. Su et al. [17] proposed the effective roughness parameters to reduce the unknowns for soil moisture retrieval. With time-series Sentinel-1A data, Bai et al. [4] used the effective roughness parameters to parameterize the AIEM for soil moisture retrieval. Among these models and methods, the AIEM and effective roughness parameters have been widely used for soil moisture retrieval, which has achieved satisfactory results for bare soil surface.
The above-surface scattering models were proposed based on the interaction between the microwave signal and the bare soil surface, which have good performance for the case of a bare soil surface. In vegetated areas, the canopy will produce complex volume scattering and therefore reduce the sensitivity of the radar signal to the soil moisture [8,18]. It is necessary to eliminate the scattering effect of the vegetation canopy for soil moisture retrieval in vegetated areas. To date, some semi-empirical and theoretical models have been proposed to model the backscatter from the canopy. For example, the water cloud model (WCM) considers the vegetation scattering, interaction between the vegetation and the soil surface, and the direct soil backscatter [19]; the ratio method assumes that the ratio between the bare soil and measured backscattering coefficient is only dependent on the vegetation [20,21]; the Tor Vergata model considers the vegetation as an ensemble of discrete lossy scatterers, whose electromagnetic behaviors can be simulated by simple geometrical shapes [6,22]. The implementation of the aforementioned vegetation-scattering models requires parameterizing the scattering contribution of vegetation. From the perspective of operability and practicality, the WCM has been demonstrated to be suitable for soil moisture estimation over grassland and agricultural areas [5,23,24,25,26,27,28,29].
The WCM needs two vegetation parameters for parameterizing the scattering contribution of vegetation. In practical applications, the descriptors are often parameterized by the optical vegetation parameters, such as the leaf area index (LAI) [5,27], vegetation water content (VWC) [23,24], normalized difference vegetation index (NDVI) [14,25], enhanced vegetation index (EVI) [14,25], fraction of photosynthetically active radiation (FPAR) [26], leaf water area index (LWAI) [27], and fuel moisture content [28]. Bai et al. [14,25] investigated some related works and found that the performance of these optical vegetation parameters for helping soil moisture retrieval is heavily related with the type of study area, such as vegetation type and vegetation growth state (dense or sparse). Qiu et al. [29] examined the impact of vegetation parameters from two different satellites on soil moisture retrieval. In the aforementioned works, the scattering and attenuation of vegetation were parameterized by the same vegetation parameters. He et al. [26] found that the scattering and attenuation properties should better be parameterized by different vegetation parameters. From the perspective of theoretical analysis, Park et al. [30] found that the particle moisture content and the VWC can be the optimal vegetation descriptors. These studies demonstrated that the optical vegetation parameters can accurately estimate the scattering contribution of vegetation. The integration of SAR data and optical remote-sensing data may provide operational methods for soil moisture retrieval in vegetated areas. Multiple studies have focused on soil moisture retrieval by assuming that the scattering and attenuation properties are characterized by the same vegetation indicators [5,23,24]. However, relatively few studies have evaluated the performance of soil moisture retrieval while the vegetation-scattering and attenuation properties are expressed by different vegetation parameters, which may improve the accuracy of soil moisture estimation.
The objective of this paper was to assess the capability of different vegetation parameters for characterizing the scattering and attenuation properties during soil moisture retrieval in agricultural fields by the integration of Sentinel-1A data and the Moderate Resolution Imaging Spectroradiometer (MODIS) data. The physically based AIEM and semi-empirical WCM models are selected to obtain a coupled scattering model. Four vegetation parameters extracted from the MODIS products, namely LAI, FPAR, NDVI, and EVI were chosen as vegetation descriptors to characterize the scattering and attenuation properties of vegetation, respectively. Meanwhile, the whole study period was divided as a period with bare soil surface and a period with vegetation cover by refereeing to the LAI values. The structure of this paper is organized as follows. In Section 2, the study area and remote-sensing data, including Sentinel-1A and MODIS data, are introduced. In Section 3, the scattering models of AIEM and WCM are reviewed, and the calibration for the coupled mode and soil moisture retrieval is presented. The calibration results for the coupled model, soil moisture retrieval results, and error analysis are described in Section 4. Finally, the conclusions are drawn in Section 5.

2. Materials and Methods

2.1. Study Area and In-Situ Measurements

In this paper, the REMEDHUS soil moisture monitoring network (41°8′56″–41°27′21″ N, 5°13′29″–5°35′31″ W) in the central Douro Basin of Spain was selected as the test site (Figure 1) [31], which covers an area of approximately 1300 km2 with flat terrain. The altitude ranges from 700 to 900 m and can be classified as a continental semi-arid Mediterranean climate. The annual precipitation is about 385 mm, and the maximum monthly average precipitation occurs in May, with about 47 mm rainfall. and the minimum case occurs in August, with about 11 mm rainfall. The average temperature is 12 °C and the average potential evaporation is 908 mm. In this area, the main types of vegetation covers include rain-fed cereals in winter and spring (78%), irrigated crops (5%) and vineyards (3%) in summer, and some scattered forest and pastures (13%). The growth cycle of rain-fed cereals includes the sowing period in autumn, the development period in spring, and the maturity period in early summer.
From 1999 to 2009, the REMEDHUS ground monitoring network has set up 23 ground monitoring stations. The distribution of stations in this area is uneven based on the division of regional geomorphic units. The monitoring instrument of soil moisture was the Stevens Hydra probe, with the monitoring depth of 0–5 cm, and the data were automatically collected every hour. The soil moisture data collected by the REMEDHUS ground monitoring network were applied to many research fields, such as the calibration and validation of the Soil Moisture and Ocean Salinity (SMOS) soil moisture products [31], the validation of remote-sensing soil moisture products [32], and the scale transformation of soil moisture products [33]. The in-situ soil moisture data of REMEDHUS were downloaded from the international soil moisture network (station Las Bodegas). From the time series of the daily average soil moisture at Las Bodegas from 01/01/2014 to 28/12/2018 (Appendix A Figure A1), we found that the soil moisture presents periodic seasonal variation and that there is no obvious distinction between dry and wet years. It is deemed that one-year data covered the entire growth cycle of crops and were able to effectively validate the coupled model and retrieve soil moisture. Therefore, in-situ soil moisture data collected from 01/01/2017 to 31/12/2018 were used, which are presented in Figure 2. It is assumed that the measured soil moisture is representative of the fields studied. It can be seen from this figure that the soil moisture content in the coverage area of the station Las Bodegas is relatively low (below 0.25 m3/m3) and there are obvious fluctuations with the seasons. The soil moisture is significantly increased in May due to abundant rainfall and decreased in August due to less rainfall.

2.2. Sentinel-1A Data and Preprocessing

The Sentinel-1 mission, the Earth Radar Observation for the Copernicus joint initiative of the European Commission and the European Space Agency, comprises a constellation of two satellites, operating day and night and performing C-band SAR imagining. The Sentinel-1A is the first satellite of the European Space Agency (ESA)’s Copernicus plans, which was launched in April 2014. In this paper, two years of Sentinel-1A data with descending orbit were downloaded in the study area from 1 January 2017 to 31 December 2018 (see Appendix A Table A1) [34]. The specific parameters for the Sentinel-1A images are listed in Table 1.
The batch pre-processing of the Sentinel-1A data was based on Python coding, which included applying orbit file, thermal noise removal, radiometric calibration, speckle filtering (Lee sigma with window sizes of X and Y were both 7 and the sigma value was 0.9), geometric corrections (Range–Doppler terrain correction), radiometric normalization, resample (1 km with bilinear sampling technique), and re-projection (WGS 1884 Universal Transverse Mercator coordinates).

2.3. MODIS Data and Preprocessing

To characterize the scattering and attenuation properties of vegetation, four different vegetation parameters were extracted from the MODIS products [35], namely the LAI, FPAR, NDVI, and the EVI, which were used to describe the growing status of vegetation.
The LAI is defined as the one-sided green leaf area per unit ground area in broadleaf canopies and as on-half the total needle surface area per unit ground area in coniferous canopies [36,37]. FPAR is defined as the fraction of incident photosynthetically active radiation absorbed by the green elements of a vegetation canopy [37]. The MCD15A3H Collection 6 (DOI: http://doi.org/10.5067/MODIS/MOD15A3H.006) products included LAI and FPAR, which was composited every 4 days at 1 km spatial resolution [38]. A main look-up-table (LUT)-based procedure and a back-up algorithm were used to obtain the LAI/FPAR from the surface reflectance or vegetation indices [37]. Based on ground truth, the LAI products have been assessed over widely distributed fields, and the FPAR products have been estimated using relatively few independent measurements.
The NDVI/EVI is directly computed from surface reflectance, which is developed to provide vegetation conditions. Global MYD13A2 Collection 6 (DOI: http://doi.org/10.5067/MODIS/MYD13A2.006) products included the NDVI and EVI, which was composited every 16 days at 1 km spatial resolution [39]. The vegetation indices products were validated over different study areas and time periods based on ground truth.
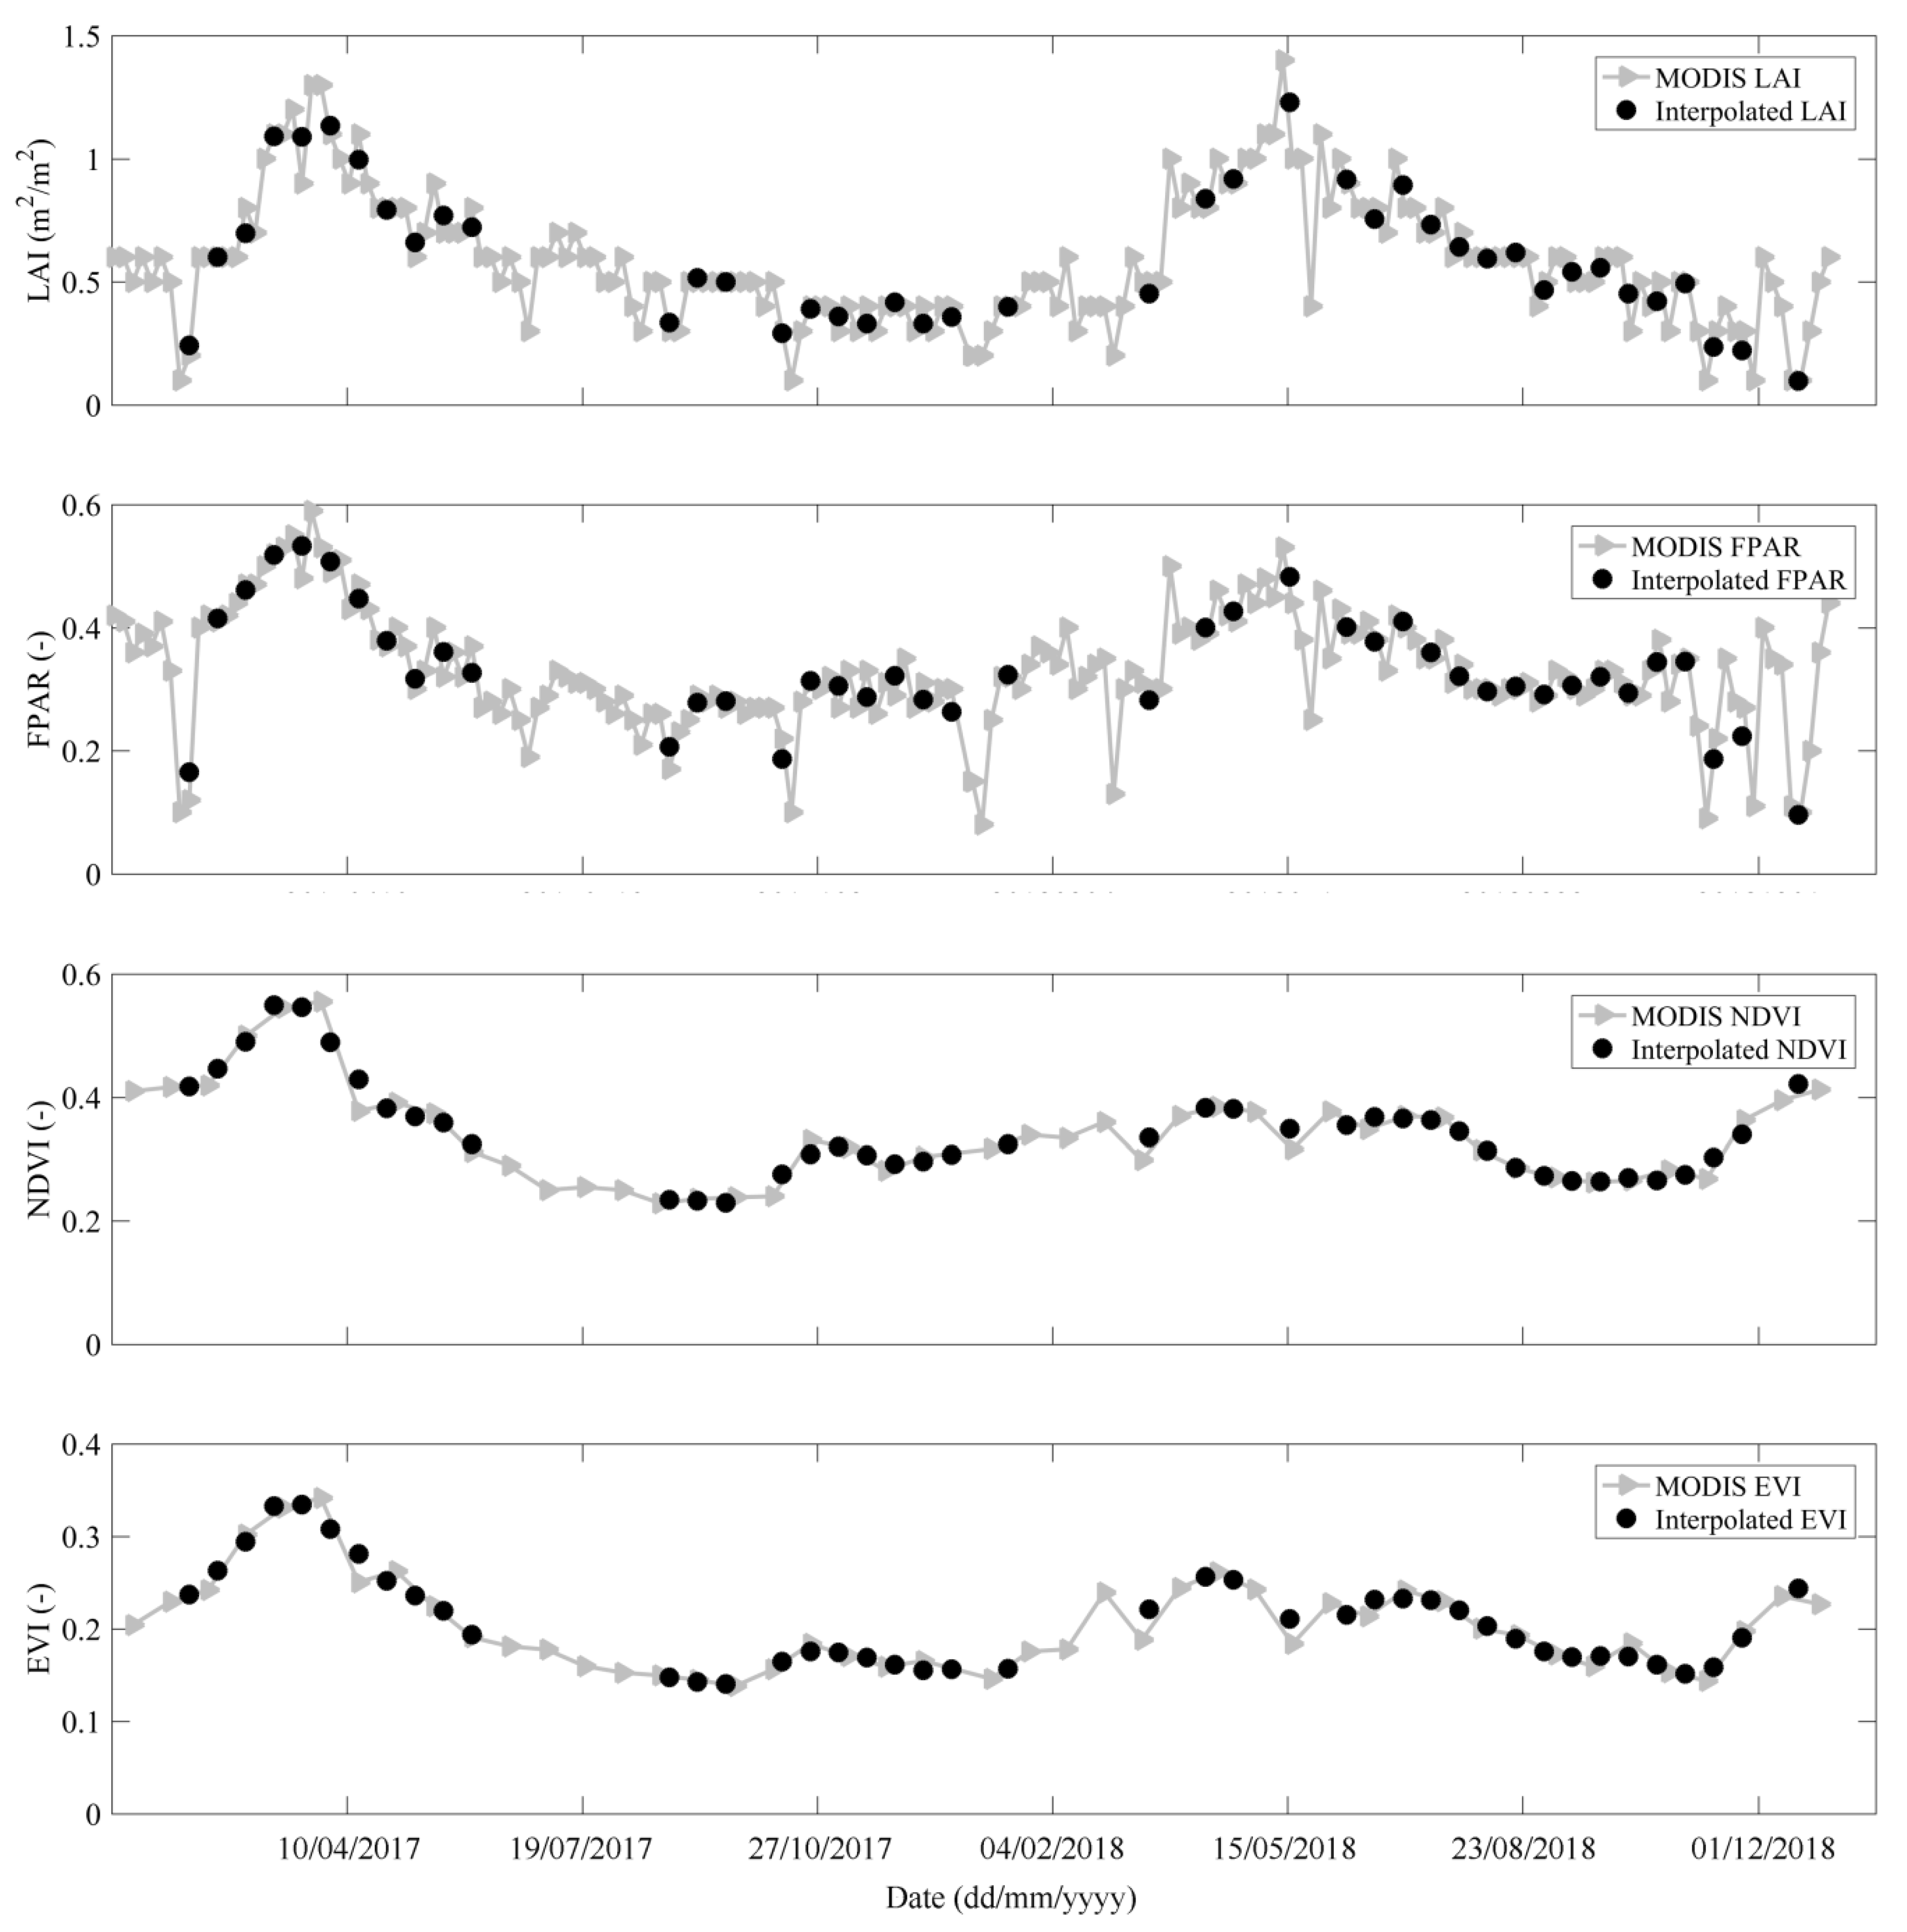
The preprocessing for the MODIS products was conducted with the following procedures. The original 1 km sinusoidal projection grid data were projected onto the WGS 1984 UTM coordinates. A third-order Savitzky–Golay filter was applied to smooth the original MODIS products and only the “good quality” data were used to reduce the influence of cloud on vegetation parameters [40]. The cubic spline interpolation technique was utilized to obtain the vegetation parameters on the Sentinel-1A acquisitions. Figure 3 presents the time series of the MODIS original vegetation parameters and their interpolated values of the station Las Bodegas.

3. Methodology

3.1. AIEM

The AIEM was implemented to calculate the backscattering coefficient of the bare soil surface [12,13], which describes the backscattering behavior of a random rough surface with a very wide range of validity. This model has been applied and validated in many works [5,20,21,24,25,27,29]. The inputs and outputs of AIEM are conceptually described as follows:
σ s o i l o = A I E M ( f , θ , p p , ε , s , l , A C F )
where f is the frequency, θ stands for the incidence angle, pp indicates the polarization mode (VV), ε is the soil dielectric constant, s is the root mean squares (RMS) height, l is the correlation length, ACF represents the auto-correlation function, and σ s o i l o (dB) is the backscattering coefficient of the bare soil surface. The Dobson dielectric mixing model was applied to determine the relationship between the soil moisture and the soil dielectric constant [41]. The texture parameters refer to the harmonized world soil database (HWSD), which was created by the Food and Agricultural Organization (FAO) and an International Institute for Applied System Analysis (IIASA). The topsoil composition for the station Las Bodegas is composed of about 36.0% sand, 21.0% clay, and 1.41 g/cm3 bulk density.

3.2. WCM

The WCM, a semi-empirical backscatter model, was conducted to model the backscatter of vegetated areas [19]. This semi-empirical model has been widely applied for soil moisture retrieval due to its efficient performance. For a given polarization, it divides the whole backscatter into three parts, the vegetation-scattering contribution σ v e g o (dB), double-bounce scattering components between the vegetation and the underlying soil surface σ v e g + s o i l o (dB), and the direct soil backscatter attenuated by the vegetation layer σ s o i l o (dB), which can be written as follows:
σ c a n o = σ v e g o + σ v e g + s o i l o + τ 2 σ s o i l o
σ v e g o = A V 1 cos θ ( 1 τ 2 )
τ 2 = exp ( 2 B V 2 / cos θ )
where τ2 stands for the two-way attenuation through the vegetation, θ is the incidence angle, V1 and V2 are the vegetation descriptors, which represent the scattering and attenuation properties of vegetation, respectively, and A and B are the model coefficients which depend on the vegetation descriptor and sensor configuration.
In this paper, the WCM was simplified by one common assumption that the interaction between the vegetation and the underlying soil can be neglected:
σ c a n o = σ v e g o + τ 2 σ s o i l o
The V1 and V2 are cross-parameterized by the LAI, FPAR, NDVI, and the EVI, respectively. The backscattering coefficient of bare soil in Equation (5) was calculated by the AIEM combined with the Dobson model.

3.3. Model Calibration and Soil Moisture Retrieval

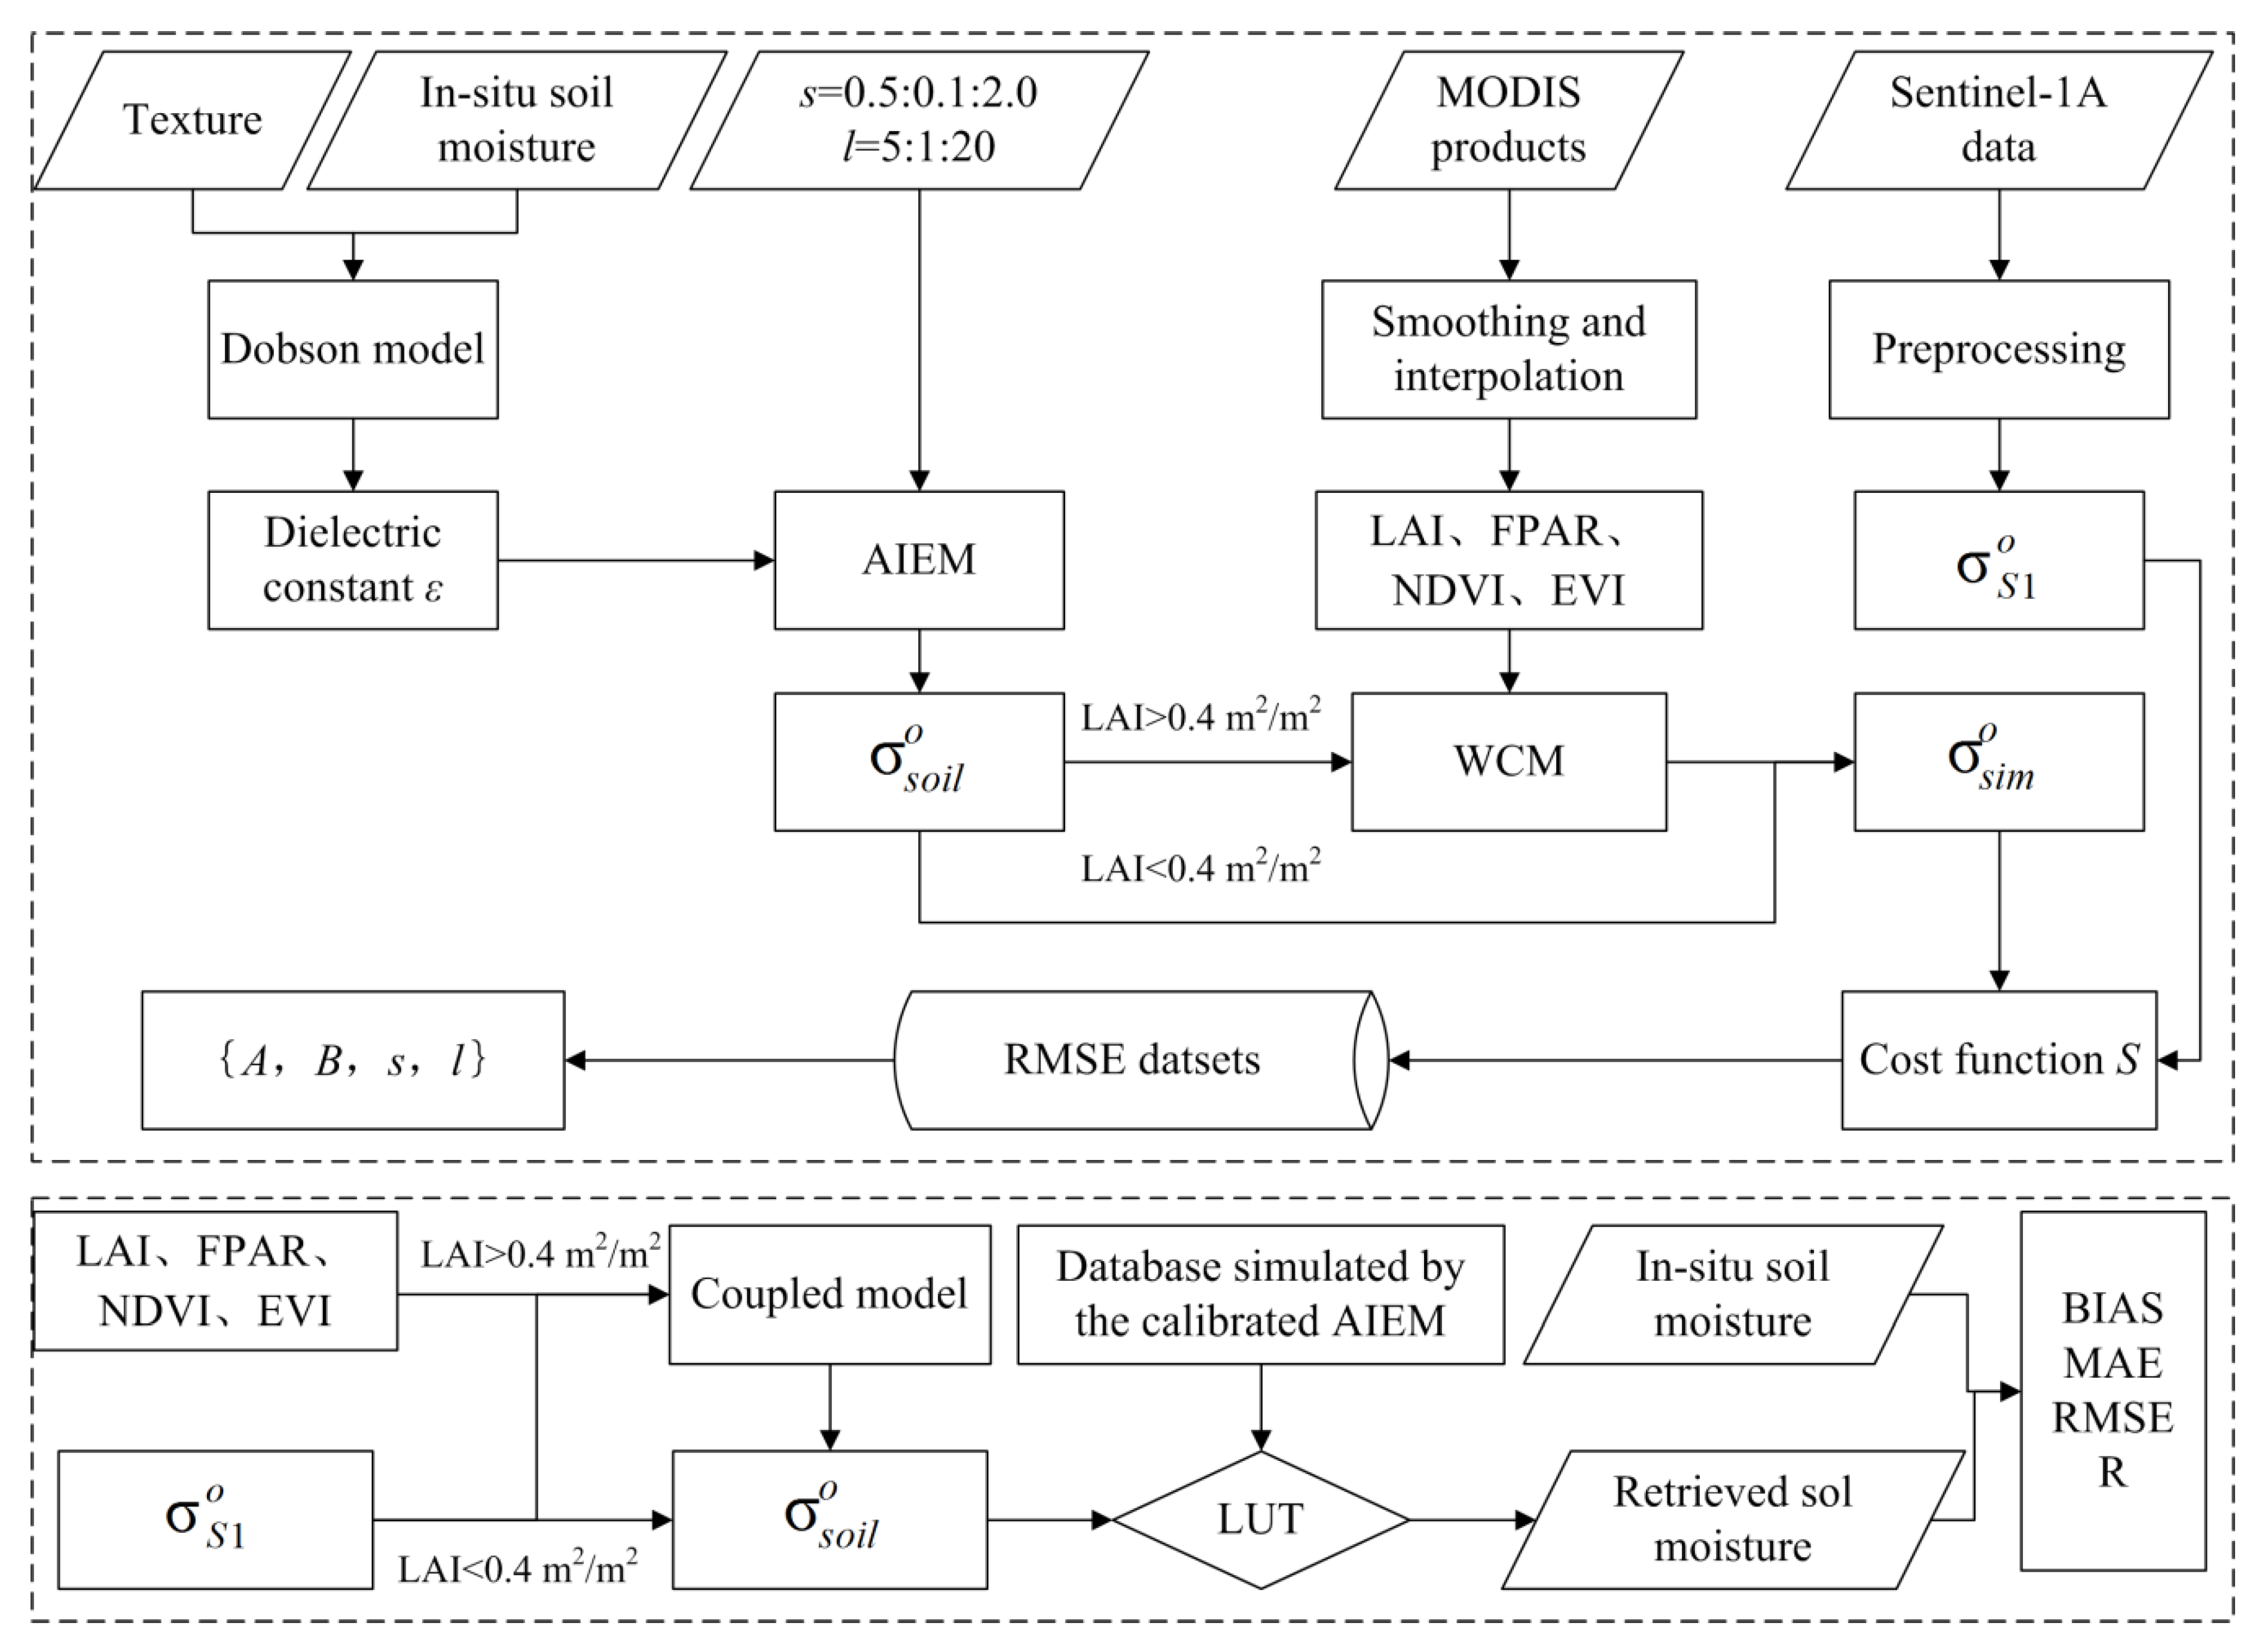
In this paper, the WCM and AIEM were coupled to predict the backscattering coefficient and retrieve the soil moisture from the Sentinel-1A data and MODIS data. The WCM is used for simulating the vegetation backscatter and AIEM is used for simulating the soil backscatter. The coupled model was parameterized by the effective roughness parameters, which have been proved to be effective for parameterizing the surface roughness parameters [5,25]. The coupled model calibration and soil moisture retrieval were implemented by the following steps (Figure 4).
Step 1: The study period was distinguished as a vegetated cover period and bare soil surface period. The LAI was used to separate the whole study period as a vegetation-covered period when the LAI was larger than 0.4 m2/m2, and the bare soil surface period when the LAI is less than 0.4 m2/m2.
Step 2: The backscattering coefficient of the bare soil surface was estimated. The AIEM and Dobson model were implemented to calculate the backscattering coefficient of the bare soil surface with a series of input parameters. The frequency and incidence angle were set as 5.405 GHz and 40°, which are the frequency and incidence angle of Sentinel-1A. The s-values ranged from 0.5 to 2.0 cm with an increment of 0.1 cm. The l-values ranged from 5.0 to 20 cm with an increment of 1 cm. The soil moisture ranged from 0.01 to 0.40 m3/m3 with an interval of 0.01 m3/m3, which was set according to the maximum and minimum values of the soil moisture in the study area. Provided the input parameters were correct, the AIEM could predict the backscattering coefficient for the bare soil surface.
Step 3: The backscattering coefficient of the vegetation was simulated. The WCM was conducted to model the whole backscattering coefficient of the vegetated areas with a simulated backscattering coefficient of the bare soil surface. The WCM was parameterized by the LAI, FPAR, NDVI, and EVI, respectively. The model coefficients A and B were solved using the least square method.
Step 4: Establishment of the cost function S. The Sentinel-1 data and MODIS data acquired in 2017 were used for model calibration. During the period with the bare soil surface, the backscattering coefficient was calculated by the AIEM. During the period with vegetation cover, the backscattering coefficient was simulated by the combination of WCM and AIEM. The following cost function S was defined to minimize the Sentinel-1A observations and simulations with the coupled model, which was used for calibrating the model coefficient (A and B) and the effective roughness parameters (s and l):
S = 1 n i = 1 n ( σ s i m o σ S 1 o ) 2 ,
where σ s i m o and σ S 1 o indicate the simulated backscattering coefficients and the Sentinel-1A observations, and n is the number of the sampling period.
Step 5: The s varied from 0.5 to 2.0 cm, and the l varied from 5.0 to 20 cm. A 16 by 16 matrix was obtained, which was filled with the computed S-values. The index position of the minimum S was searched within this 16 by 16 matrix. The roughness parameters (s and l) corresponding to the searched index position were considered to be the effective roughness parameters. At this moment, the coupled model was calibrated with determined roughness parameters (s and l) and model coefficients (A and B).
Step 6: Soil moisture was retrieved. The soil moisture was retrieved using the calibrated coupled model from the Sentinel-1A data and the MODIS data acquired in 2018. The LUT method was used to retrieve the soil moisture based on the database produced in Step 2.
Step 7: Accuracy evaluation: the accuracy of the coupled model calibration and soil moisture retrieval was evaluated using the following four statistical indicators, namely the mean bias (BIAS), mean absolute error (MAE), root mean square error (RMSE), and the Pearson correlation coefficient (R):
B I A S = 1 n ( i = 1 n V o b s i = 1 n V e s t )
M A E = 1 n i = 1 n | V o b s V e s t |
R M S E = 1 n i = 1 n ( i = 1 n V o b s i = 1 n V e s t ) 2
R = i = 1 n ( V o b s V ¯ o b s ) ( V e s t V ¯ e s t ) i = 1 n ( V o b s V ¯ o b s ) 2 i = 1 n ( V e s t V ¯ e s t ) 2
where V o b s and V e s t stand for the measured backscatter (or soil moisture) and the estimated backscatter (or soil moisture), and n is the number of sampling periods.

4. Results and Discussion

4.1. Calibration Results for the Coupled Model

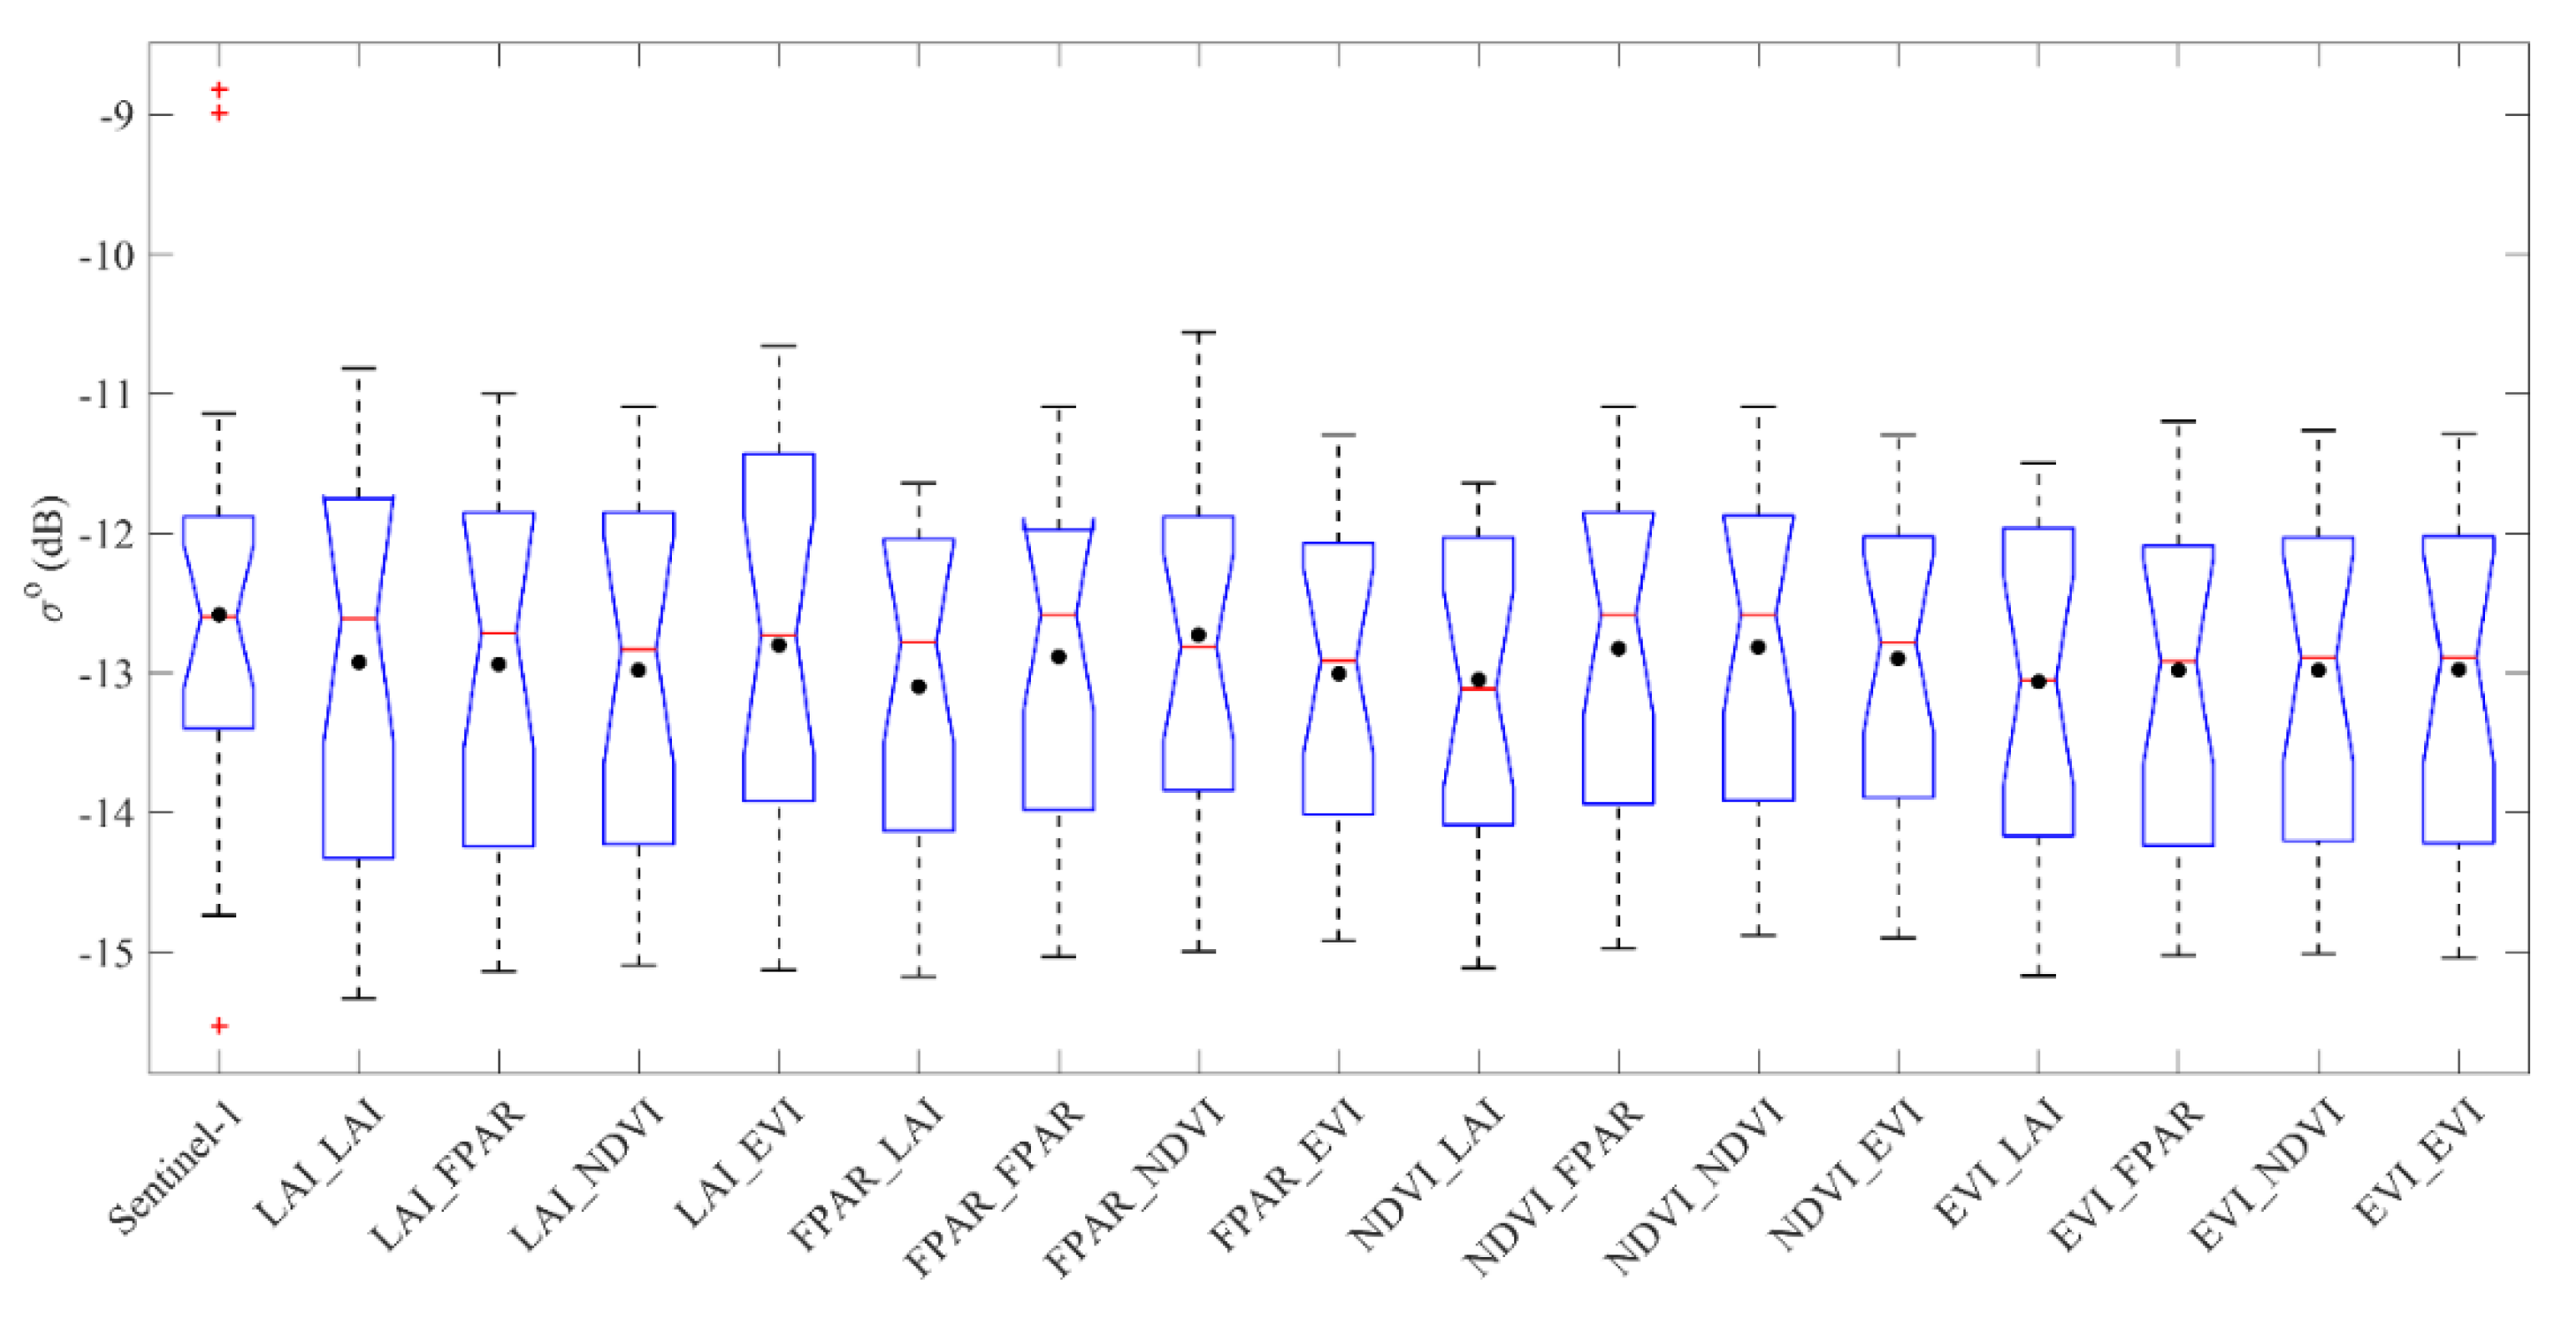
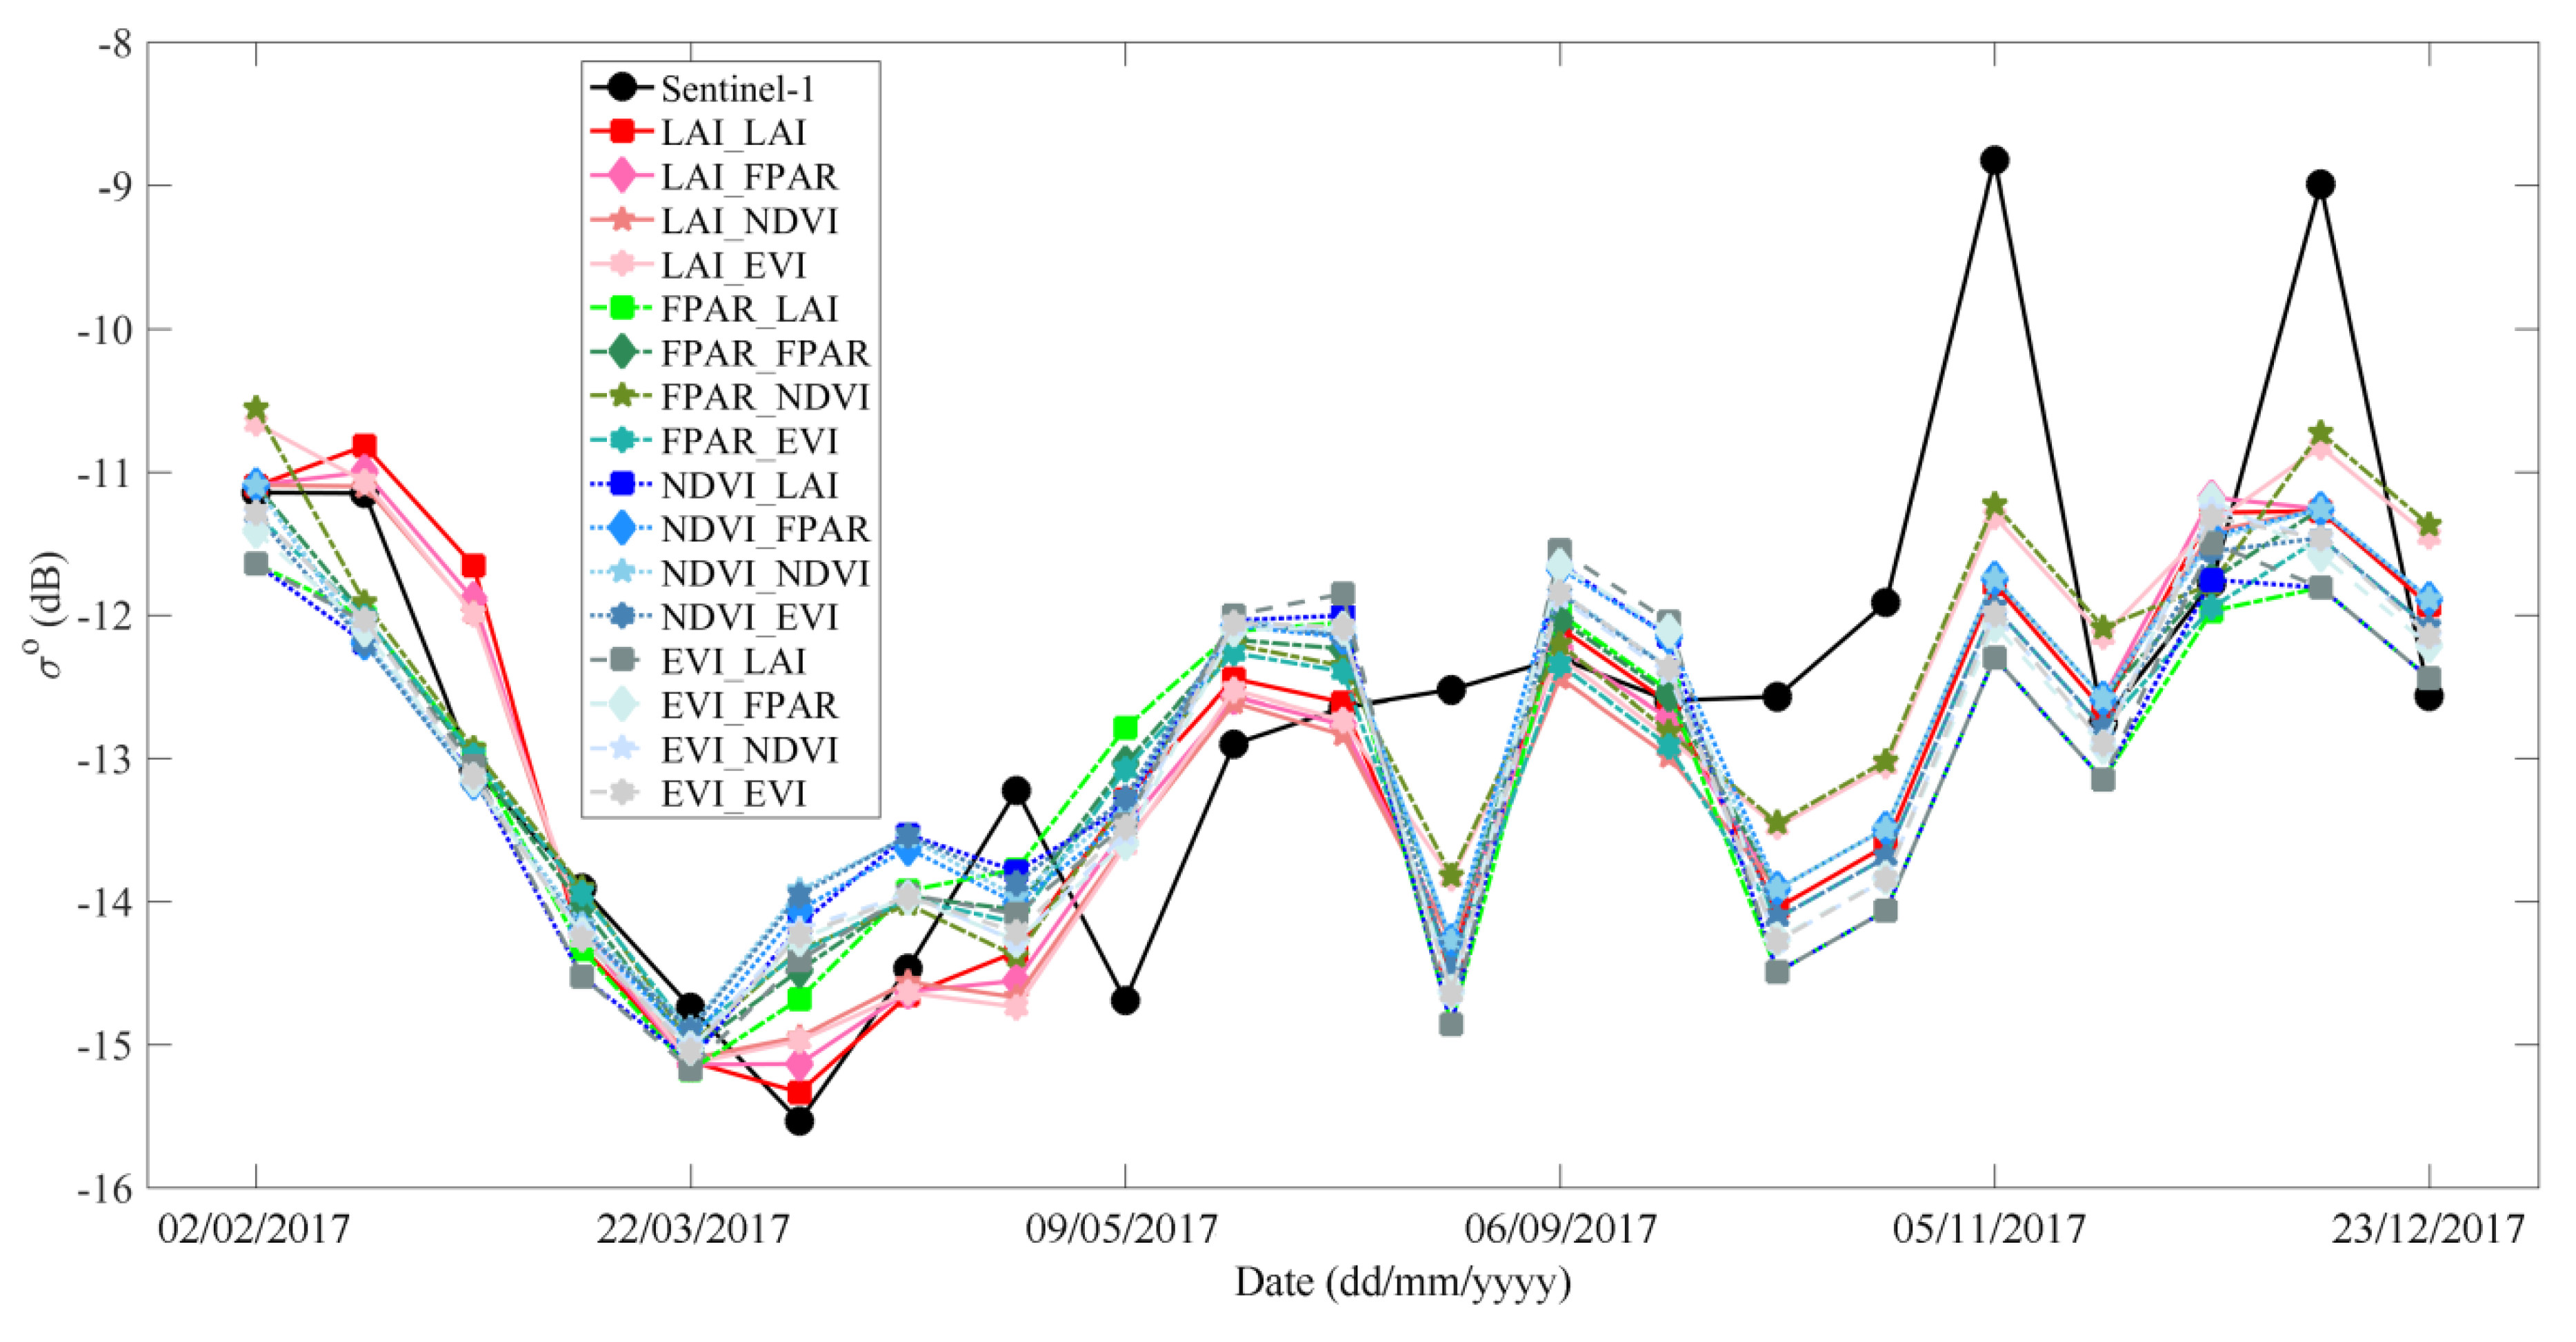
The Sentinel-1A and MODIS datasets acquired in 2017 are used for model calibration, and the datasets collected in 2018 are used for soil moisture retrieval. The calibration of the coupled model (WCM and AIEM) is conducted by following the procedures in Section 3.3. The effective roughness parameters (s and l), WCM coefficients (A and B), and model calibration accuracy are given in Table 2. Figure 5 and Figure 6 present the Sentinel-1A observations and the simulated backscattering coefficients using the coupled model based on the effective roughness parameters.
From Table 2, it can be seen that all the values of BIAS are positive. From Figure 5, it is found that the location of the mean for the Sentinel-1A observations is higher than the values of the backscattering coefficient simulated by the coupled model with different vegetation parameters, which indicates that the simulated backscattering coefficients are slightly underestimated. This phenomenon is very obvious in the periods between 5 November 2017 and 11 December 2017. From Figure 5, it can be seen that the backscattering coefficient observed by Sentinel-1A in these two dates is relatively high compared with other dates, which is seen as outliers. The maximum and minimum values of MAE are 1.081 and 0.769 dB, respectively. The values of RMSE range from 0.996 to 1.401 dB. The Pearson correlation coefficient (R) has a minimum value of 0.58 and a maximum value of 0.81. From Figure 6, it is found that the simulated backscattering coefficient is consistent with Sentinel-1A observations, and the dynamics of backscattering coefficients are captured. From the perspective of statistical metrics, it can be said that the coupled model can predict the backscattering coefficient in the study area.
It is noted that the calibrated results are similar between the different vegetation parameters. This is mainly because there is a certain correlation between the selected vegetation parameters (see Appendix A Table A2). The R between the NDVI and EVI is 0.97 and the value between the LAI and the FPAR is 0.91, which means there is a very strong correlation between them. There is a moderate correlation between the LAI and NDVI (0.59), the LAI and EVI (0.68), the FPAR and NDVI (0.63), and the FPAR and EVI (0.67). Therefore, the optimum parameters, statistical results, and backscattering coefficient dynamics are similar for the coupled model. When the LAI is chosen as V1, the statistical results are improved. The values of R are 0.75, 0.76, and 0.81 when V2 is parameterized by the FPAR, NDVI, and the EVI, respectively. When the LAI is chosen as V2, the statistical results are relatively poor. The values of R are 0.61, 0.58, and 0.60 when V1 is selected as the FPAR, NDVI, and the EVI, respectively. The calibration results for other combinations of the vegetation parameters are atypical. When V1 and V2 are chosen as LAI and EVI, the calibration result is optimized with R equal to 0.81. When V1 and V2 are parameterized by two different vegetation parameters, the statistical results are better than the results obtained from the case with the same vegetation parameters. Based on the above discussion, it can be concluded that the LAI is recommended to parameterize the scattering properties of vegetation, and the optimum combination of vegetation parameters should be considered for parameterizing the coupled model.
It is worth noting that most of the effective roughness parameters selected for the coupled model fall within the ranges of the defined ranges of surface roughness parameters, which also verified the rationality of the defined range. Simultaneously, it was found that the selected effective roughness parameters derived from each vegetation combination exhibited no discernible difference. This phenomenon may ascribe to the strong correlation between the vegetation parameters. The effective roughness parameters selected as inputs for the AIEM has accurately predicted the measured backscattering coefficients, which confirm the validity and effectiveness of this method.

4.2. Soil Moisture Retrieval Results

Based on the calibrated model, the soil moisture is estimated from the Sentinel-1A and MODIS data collected in 2018. The time series of the in-situ and retrieved soil moisture are displayed in Figure 7 and Figure 8, and the statistical indicators are listed in Table 3.
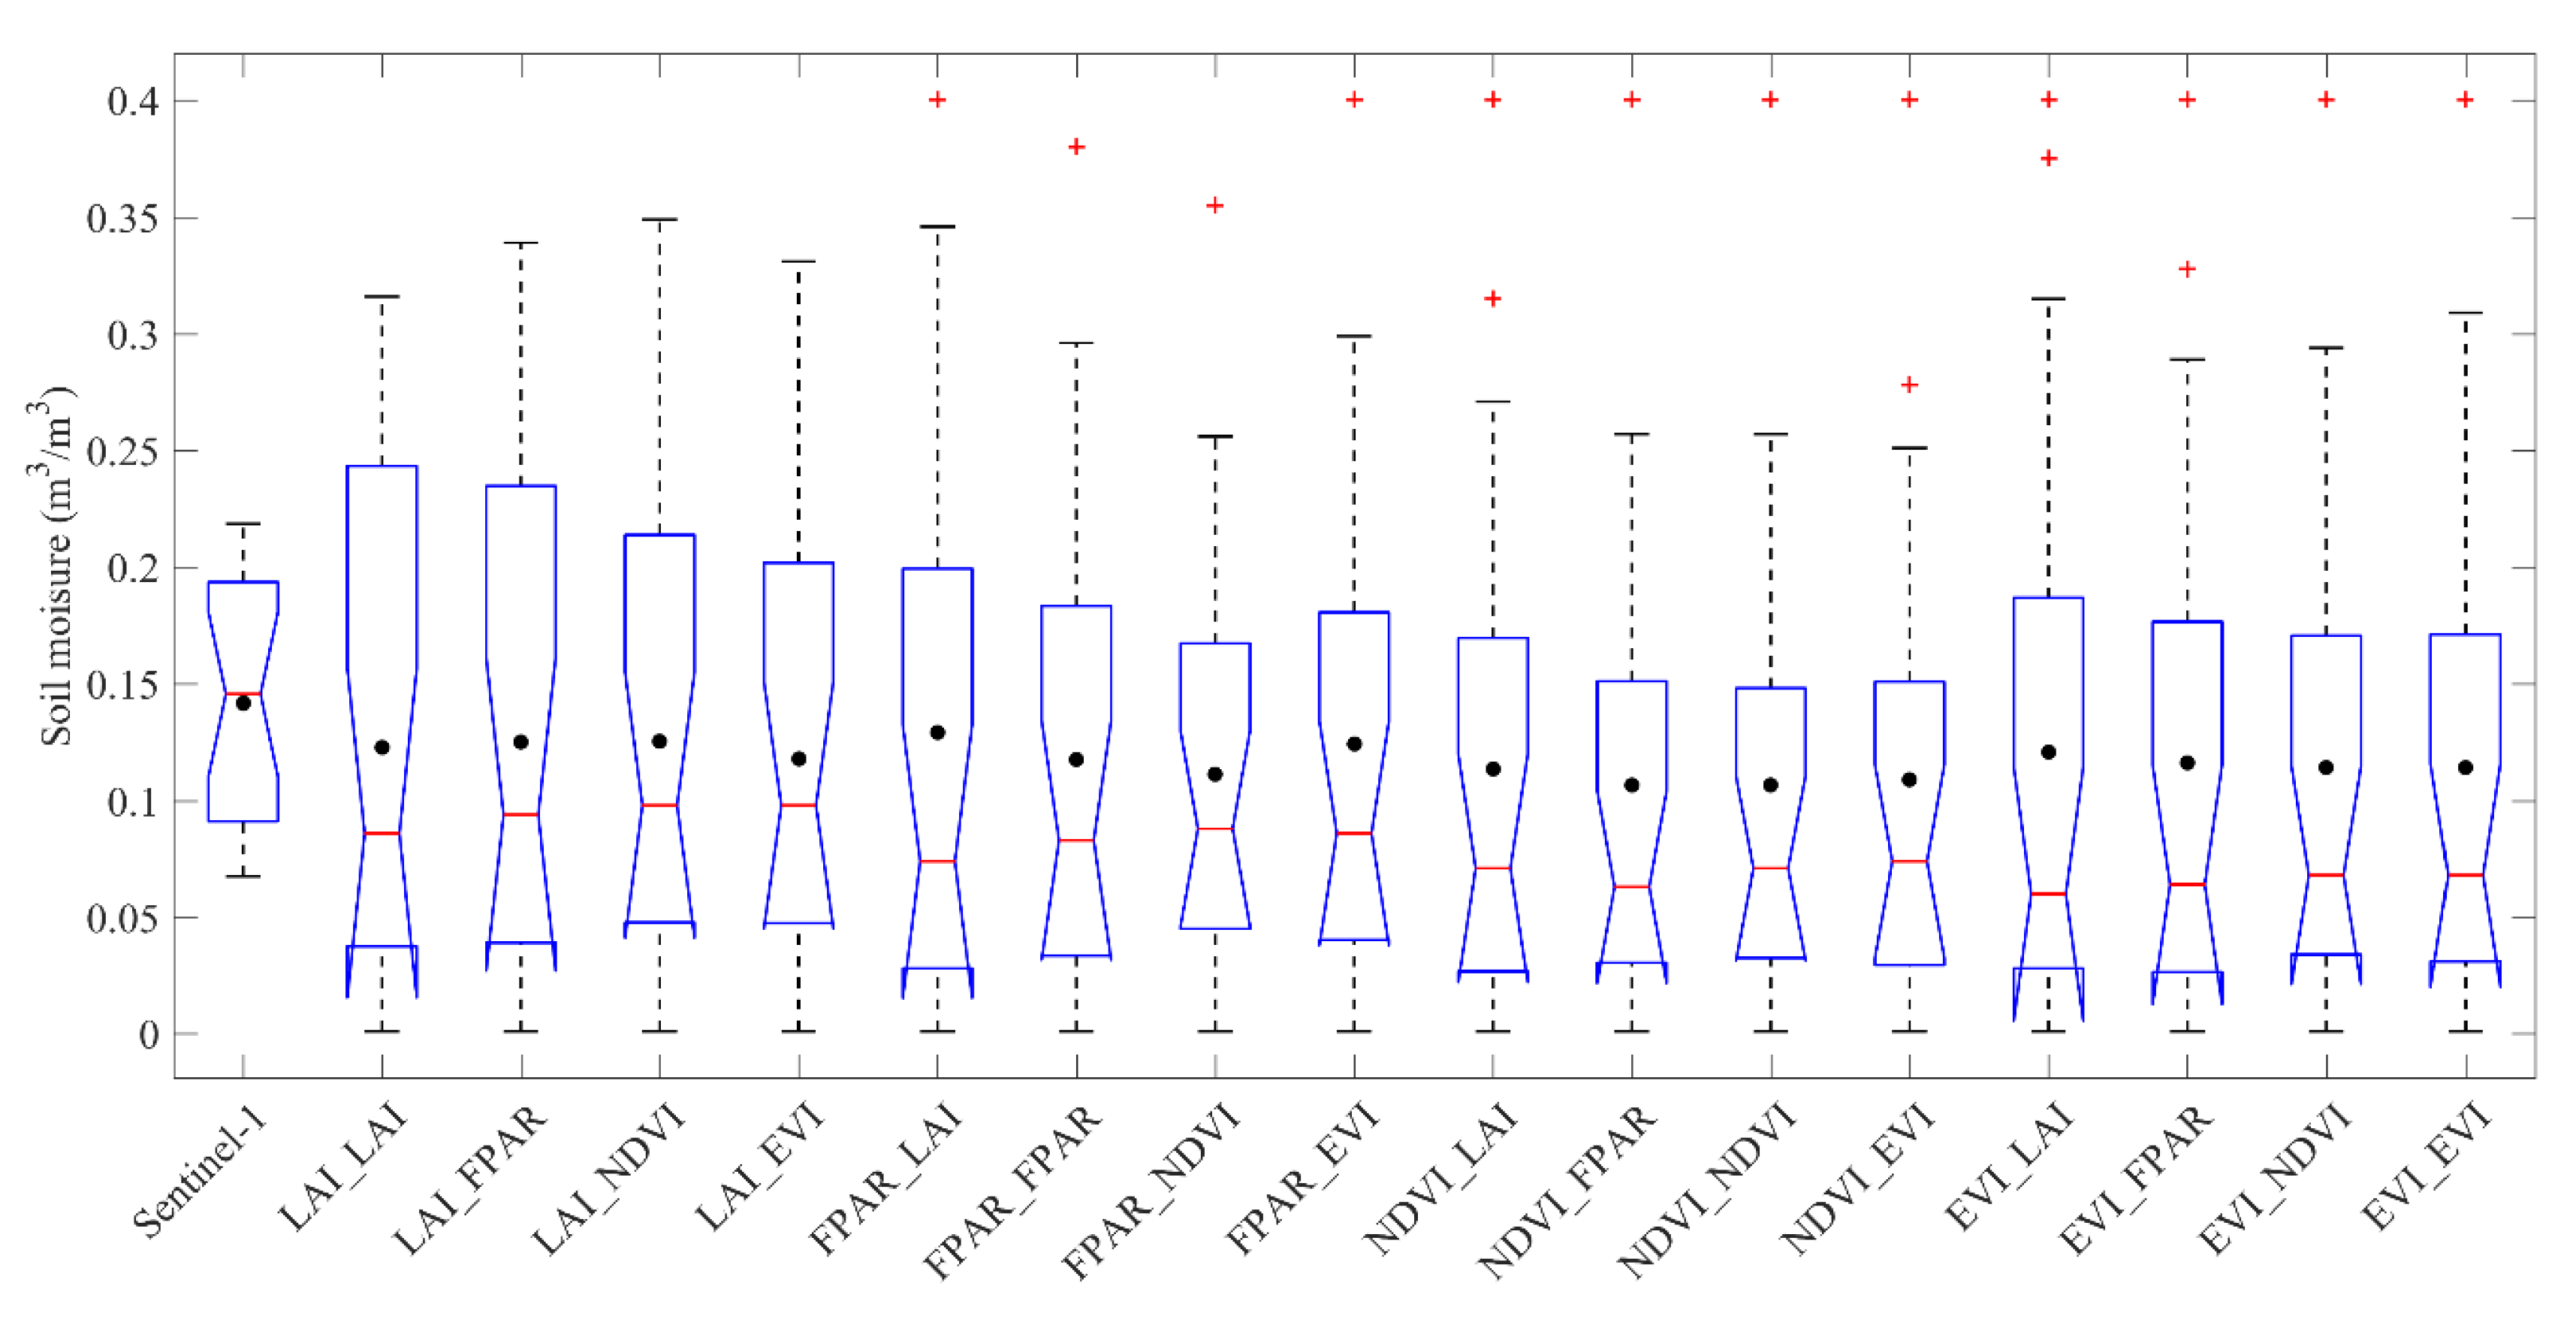
From Table 3, it is found that the accuracy of the soil moisture estimation is nearly the same when the different vegetation parameter combinations are used. The average values of the BIAS, MAE, and the RMSE are 0.018, 0.048, and 0.055 m3/m3. The positive BIAS indicates that the retrieved soil moisture is systematically underestimated compared with observations, which can be easily seen in Figure 7. After 15 July 2018, the retrieved soil moisture is generally underestimated. Before 15 July 2018, the retrieved soil moisture is generally overestimated. This phenomenon may be ascribed to the seasonal rainfall (more rainfall in May and less rainfall in August). On 9 February 2018, the retrieved soil moisture reached the critical value of the database, which is a bit abnormal. The backscattering coefficient on this date is very low compared with other days, which may have been caused by some unknown reason, other than the soil moisture and vegetation. The minimum and maximum values of R are 0.74 and 0.81, respectively. From Figure 8, it can be seen that the trend of retrieved soil moisture is consistent with the in-situ observations. The seasonal dynamics of the soil moisture have been captured and the retrieval results are promising.
Since there is no discernible difference between the effective roughness parameter selected for each combination of vegetation parameters, the soil moisture retrieval accuracies show no noticeable sensitivity to the choice of particular vegetation parameters. Nevertheless, when the LAI and FPAR are selected as V1, the results of the soil moisture retrieval are slightly better. When the NDVI and EVI are selected as V1, the results are slightly poorer. The other combinations of vegetation parameters for the soil moisture retrieval are atypical. From the results of the model calibration and the soil moisture retrieval, it can be concluded that the LAI is suitable for characterizing the scattering properties of vegetation. This finding is in agreement with the results of previous works [14,27]. It is difficult to give a clear answer in which vegetation parameters can effectively characterize the attenuation properties of vegetation. Based on the foregoing discussion, it is concluded that optimum vegetation parameters are needed for the high accuracy retrieval of soil moisture.

4.3. Error Analysis

From Figure 5 and Figure 6, it can be seen that the Sentinel-1A observations on the dates of 5 November 2017 and 11 December 2017 are extremely high compared with other observations. At the same time, it is found that the retrieved soil moisture is generally underestimated after 15 July 2018. These deviations for the model calibration and soil moisture retrieval can be analyzed from the following three aspects.
First, the biggest uncertainty may come from the effective roughness parameters. It is well known that this method can be used for eliminating the effect of soil roughness and achieved good performance in numerous studies, such as in Bai et al. [5,25], who used this method to parameterize the roughness parameters and retrieve the soil moisture. However, the validity of the effective roughness parameter was based on the assumption that the roughness parameters of the soil surface were unchanged during the study period. The study areas in the works of Bai et al. [5,25] are located in the prairie areas, which is less subject to human interference. Moreover, our study area is different. It belongs to the farming land, which is inevitably subject to human interference. Field works, such as sowing, irrigation, cultivation, reward, and others, may change the surface roughness. This may be the biggest problem faced by soil moisture retrieval in crop-covered areas.
Second, partial uncertainty may come from satellite data. On the dates of 5 November 2017 and 11 December 2017, the backscattering coefficients observed by Sentinel-1 are extremely high compared to the values on other dates. These cases are very difficult to simulate based on the coupled model, which only takes into account the effect of soil moisture, vegetation, and surface roughness. It is guessed that the sharp increase in the backscattering coefficient may be caused by other factors, such as field work or precipitation. Furthermore, the MODIS products may also bring some uncertainty, which may cause the bias for the estimation of the vegetation-scattering contribution. This probably could be another explanation for the inconsistency between the model simulations and the satellite observations.
Finally, the possible uncertainty may be caused by the difference of sensing depth between the SAR and in-situ measurements. The SAR signal can perceive the soil information below the surface. However, the perceived depth may change with the growth of vegetation. It can be said that the soil depth observed by the Sentinel-1A SAR is not fixed but changes with vegetation growth. By contrast, the in-situ soil moisture measurement is fixed at the depth of 0–5 cm. The inconsistency of sensing depth may explain the underestimation of soil moisture.
In summary, satellite data, soil-scattering models, vegetation-scattering models, and retrieval methods have to be carefully selected to achieve a high-precision soil moisture retrieval, particularly for developing operational retrieval methods.

5. Conclusions

In this paper, the WCM and AIEM were coupled to retrieve the soil moisture from the time-series Sentinel-1A and MODIS data in agricultural fields. Four different vegetation parameters were combined to characterize the scattering and attenuation properties of vegetation, including the LAI, FPAR, NDVI, and the EVI. The roughness parameters needed by the AIEM are parameterized by the effective roughness parameters. The soil moisture is retrieved based on the calibrated model using a LUT method.
The maximum and minimum values of RMSE are 1.401 dB and 0.996 dB, and the R ranges from 0.58 to 0.81. The statistical metrics indicate that the simulated backscattering coefficient is in good agreement with the Sentinel-1A observations. The calibration results are relatively better when LAI is used to parameterize the scattering properties of vegetation. The RMSE between the retrieved soil moisture and the in-situ measurements ranges from 0.069 to 0.092 m3/m3, and the R ranges from 0.74 to 0.81. These results indicate that the trend of retrieved soil moisture is consistent with the in-situ soil moisture, and the seasonal dynamics of soil moisture was captured. The coupled model calibration and soil moisture retrieval are performed with different combinations of the LAI, FPAR, NDVI, and the EVI as the vegetation descriptors. The LAI is recommended to characterize the scattering properties of vegetation. The vegetation descriptor selected for describing the attenuation properties of vegetation has to be further investigated. It is reasonable to suggest that the scattering and attenuation properties of vegetation are parameterized by two different vegetation parameters.
The results in this study provide a preliminary assessment for estimating the soil moisture from the Sentinel-1A and the MODIS data in agricultural fields. The inconsistencies still exist between the Sentinel-1A observations and the model simulation, and between the in-situ measurement and retrieved soil moisture. The reasons may ascribe to three aspects, including the effective roughness parameters, the satellite data, and the sensing depth. Therefore, more work is needed to perfect the method used in this paper. For this purpose, the applicability of the effective roughness method has to be studied over different agricultural fields. Furthermore, the uncertainty due to the satellite data has to be addressed, and the sensing depth needs to be considered in the coupled model. Further research shall be conducted to address more details on the combination of Sentinel-1A and MODIS for soil moisture retrieval.

Author Contributions

X.B. conceived and designed the experiments; Y.H. and X.B. performed the experiments; X.B., Y.H., W.S., and J.W. analyzed the results and wrote the paper. All of the authors contributed to the editing of the manuscript. All authors have read and agreed to the published version of the manuscript.

Funding

This research was funded by the National Natural Science Foundation of China (Contract #41801248, #41807286), the startup foundation for introducing the talent of NUIST (Contract #2017r087), and the key research and development program of Science and Technology Department of Hebei Province (Contract #19275408D).

Conflicts of Interest

The authors declare no conflict of interest.

Appendix A

Table A1. Acquisition information for the Sentinel-1A image.
No.DateUTC TimeIncidence (°)PolarAbsolute Orbit
109/01/20176:25:36–6:26:0130.53–46.27VV, VH14,751
221/01/20176:25:35–6:26:0030.53–46.27VV, VH14,926
302/02/20176:25:35–6:26:0030.53–46.27VV, VH15,101
414/02/20176:25:35–6:26:0030.53–46.27VV, VH15,276
526/02/20176:25:35–6:26:0030.54–46.28VV, VH15,451
610/03/20176:25:35–6:26:0030.54–46.28VV, VH15,626
722/03/20176:25:35–6:26:0030.54–46.28VV, VH15,801
803/04/20176:25:35–6:26:0030.54–46.28VV, VH15,976
915/04/20176:25:36–6:26:0130.54–46.28VV, VH16,151
1027/04/20176:25:36–6:26:0130.54–46.28VV, VH16,326
1109/05/20176:25:37–6:26:0230.54–46.28VV, VH16,501
1221/05/20176:25:38–6:26:0330.54–46.28VV, VH16,676
1302/06/20176:25:45–6:26:1030.56–46.42VV, VH16,851
1414/06/20176:25:46–6:26:1130.56–46.42VV, VH17,026
1525/08/20176:25:50–6:26:1530.56–46.42VV, VH18,076
1606/09/20176:25:50–6:26:1530.56–46.42VV, VH18,251
1718/09/20176:25:51–6:26:1630.56–46.42VV, VH18,426
1812/10/20176:25:51–6:26:1630.55–46.42VV, VH18,776
1924/10/20176:25:51–6:26:1630.55–46.42VV, VH18,951
2005/11/20176:25:51–6:26:1630.55–46.42VV, VH19,126
2117/11/20176:25:51–6:26:1630.55–46.42VV, VH19,301
2229/11/20176:25:51–6:26:1630.55–46.42VV, VH19,476
2311/12/20176:25:50–6:26:1530.55–46.42VV, VH19,651
2423/12/20176:25:50–6:26:130.55–46.41VV, VH19,826
2504/01/20186:25:49–6:26:1430.55–46.41VV, VH20,001
2616/01/20186:25:49–6:26:1430.55–46.41VV, VH20,176
2728/01/20186:25:48–6:26:1330.55–46.42VV, VH20,351
2809/02/20186:25:48–6:26:1330.55–46.42VV, VH20,526
2921/02/20186:25:48–6:26:1330.55–46.42VV, VH20,701
3005/03/20186:25:48–6:26:1330.56–46.42VV, VH20,876
3117/03/20186:25:48–6:26:1330.56–46.42VV, VH21,051
3210/04/20186:25:49–6:26:1430.56–46.42VV, VH21,401
3322/04/20186:25:49–6:26:1430.56–46.42VV, VH21,576
3416/05/20186:25:50–6:26:1530.56–46.42VV, VH21,926
3509/06/20186:25:52–6:26:1730.56–46.42VV, VH22,276
3621/06/20186:25:53–6:26:1830.56–46.42VV, VH22,451
3703/07/20186:25:53–6:26:1830.56–46.42VV, VH22,626
3815/07/20186:25:54–6:26:1930.56–46.42VV, VH22,801
3927/07/20186:25:55–6:26:2030.56–46.42VV, VH22,976
4008/08/20186:25:55–6:26:2030.56–46.42VV, VH23,151
4120/08/20186:25:56–6:26:2130.56–46.42VV, VH23,326
4201/09/20186:25:57–6:26:2230.56–46.42VV, VH23,501
4313/09/20186:25:57–6:26:2230.56–46.42VV, VH23,676
4425/09/20186:25:57–6:26:2230.56–46.42VV, VH23,851
4507/10/20186:25:58–6:26:2330.55–46.42VV, VH24,026
4619/10/20186:25:58–6:26:2330.55–46.42VV, VH24,201
4731/10/20186:25:58–6:26:2330.55–46.42VV, VH24,376
4812/11/20186:25:58–6:26:2330.55–46.42VV, VH24,551
4924/11/20186:25:57–6:26:2230.55–46.42VV, VH24,726
5018/12/20186:25:56–6:26:2130.55–46.41VV, VH25,076
5130/12/20186:25:56–6:26:2130.55–46.42VV, VH25,251
Table A2. Pearson correlation coefficient between the vegetation parameters.
Vegetation ParametersLAIFPARNDVIEVI
LAI10.910.590.68
FPAR-10.630.67
NDVI--10.97
EVI---1
Figure A1. Time series of the daily average soil moisture from 1 January 2014 to 28 December 2018.
Water 12 01726 g0a1

References

  1. Shellito, P.; Small, E.E.; Livneh, B. Controls on surface soil drying rates observed by SMAP and simulated by the Noah land surface model. Hydrol. Earth Syst. Sci. 2018, 22, 1649–1663. [Google Scholar] [CrossRef] [Green Version]
  2. Pinnington, E.M.; Quaife, T.; Black, E. Impact of remotely sensed soil moisture and precipitation on soil moisture prediction in a data assimilation system with the JULES land surface model. Hydrol. Earth Syst. Sci. 2018, 22, 2575–2588. [Google Scholar] [CrossRef] [Green Version]
  3. Zhu, Q.; Luo, Y.; Xu, Y.P.; Tian, Y.; Yang, T. Satellite soil moisture for agriculturall drought monitoring: Assessment of SMAP derived soil water deficit index in Xiang River Basin, China. Remote Sens. 2019, 11, 362. [Google Scholar] [CrossRef] [Green Version]
  4. Li, Y.; Liu, C.; Yu, W.; Tian, D.; Bai, P. Response of streamflow to environmental changes: A Budyko-type analysis based on 144 river basins over China. Sci. Total Environ. 2019, 664, 824–833. [Google Scholar] [CrossRef] [PubMed]
  5. Bai, X.; He, B.; Li, X.; Zeng, J.; Wang, X.; Wang, Z.; Zeng, Y.; Su, Z. First Assessment of Sentinel-1A Data for Surface Soil Moisture Estimations Using a Coupled Water Cloud Model and Advanced Integral Equation Model over the Tibetan Plateau. Remote Sens. 2017, 9, 714. [Google Scholar] [CrossRef] [Green Version]
  6. Bai, X.; Zeng, J.; Chen, K.-S.; Li, Z.; Zeng, Y.; Wen, J.; Wang, X.; Dong, X.; Su, Z. Parameter Optimization of a Discrete Scattering Model by Integration of Global Sensitivity Analysis Using SMAP Active and Passive Observations. IEEE Trans. Geosci. Remote Sens. 2019, 57, 1084–1099. [Google Scholar] [CrossRef]
  7. Kornelsen, K.; Coulibaly, P. Advances in soil moisture retrieval from synthetic aperture radar and hydrological applications. J. Hydrol. 2013, 476, 460–489. [Google Scholar] [CrossRef]
  8. Barrett, B.W.; Dwyer, E.; Whelan, P. Soil Moisture Retrieval from Active Spaceborne Microwave Observations: An Evaluation of Current Techniques. Remote Sens. 2009, 1, 210–242. [Google Scholar] [CrossRef] [Green Version]
  9. Oh, Y.; Sarabandi, K.; Ulaby, F. An empirical model and an inversion technique for radar scattering from bare soil surfaces. IEEE Trans. Geosci. Remote Sens. 1992, 30, 370–381. [Google Scholar] [CrossRef]
  10. Dubois, P.; Van Zyl, J.; Engman, T.; Engman, E.T. Measuring soil moisture with imaging radars. IEEE Trans. Geosci. Remote Sens. 1995, 33, 915–926. [Google Scholar] [CrossRef] [Green Version]
  11. Shi, J.; Wang, J.; Hsu, A.Y.; O’Neill, P.E.; Engman, E.T. Estimation of bare surface soil moisture and surface roughness parameter using L-band SAR image data. IEEE Trans. Geosci. Remote Sens. 1997, 35, 1254–1266. [Google Scholar] [CrossRef]
  12. Wu, T.-D.; Chen, K.; Shi, J.; Fung, A. A transition model for the reflection coefficient in surface scattering. IEEE Trans. Geosci. Remote Sens. 2001, 39, 2040–2050. [Google Scholar] [CrossRef]
  13. Chen, K.; Wu, T.-D.; Tsang, L.; Li, Q.; Shi, J.; Fung, A. Emission of rough surfaces calculated by the integral equation method with comparison to three-dimensional moment method simulations. IEEE Trans. Geosci. Remote Sens. 2003, 41, 90–101. [Google Scholar] [CrossRef]
  14. Bai, X.; He, B.; Xing, M.; Li, X. Method for soil moisture retrieval in arid prairie using TerraSAR-X data. J. Appl. Remote Sens. 2015, 9, 096062. [Google Scholar] [CrossRef]
  15. Zribi, M.; Dechambre, M. A new empirical model to retrieve soil moisture and roughness from C-band radar data. Remote Sens. Environ. 2003, 84, 42–52. [Google Scholar] [CrossRef]
  16. Bai, X.; He, B. Potential of Dubois model for soil moisture retrieval in prairie areas using SAR and optical data. Int. J. Remote Sens. 2015, 36, 5737–5753. [Google Scholar] [CrossRef]
  17. Su, Z.; Troch, P.A.; De Troch, F.P. Remote sensing of bare surface soil moisture using EMAC/ESAR data. Int. J. Remote Sens. 1997, 18, 2105–2124. [Google Scholar] [CrossRef]
  18. Karthikeyan, L.; Pan, M.; Wanders, N.; Kumar, D.N.; Wood, E.F. Four decades of microwave satellite soil moisture observations: Part A review of retrieval algorithms. Adv. Water Resour. 2017, 109, 106–120. [Google Scholar] [CrossRef]
  19. Attema, E.P.W.; Ulaby, F.T. Vegetation modeled as a water cloud. Radio Sci. 1978, 13, 357–364. [Google Scholar] [CrossRef]
  20. Joseph, A.T.; Van Der Velde, R.; O’Neill, P.E.; Lang, R.H.; Gish, T. Soil Moisture Retrieval During a Corn Growth Cycle Using L-Band (1.6 GHz) Radar Observations. IEEE Trans. Geosci. Remote Sens. 2008, 46, 2365–2374. [Google Scholar] [CrossRef] [Green Version]
  21. Joseph, A.T.; Van Der Velde, R.; O’Neill, P.E.; Lang, R.; Gish, T. Effects of corn on C- and L-band radar backscatter: A correction method for soil moisture retrieval. Remote Sens. Environ. 2010, 114, 2417–2430. [Google Scholar] [CrossRef]
  22. Bracaglia, M.; Ferrazzoli, P.; Guerriero, L. A fully polarimetric multiple scattering model for crops. Remote Sens. Environ. 1995, 54, 170–179. [Google Scholar] [CrossRef]
  23. Bao, Y.; Lin, L.; Wu, S.; Deng, K.A.K.; Petropoulos, G.P. Surface soil moisture retrievals over partially vegetated areas from the synergy of Sentinel-1 and Landsat 8 data using a modified water-cloud model. Int. J. Appl. Earth Obs. Geoinf. 2018, 72, 76–85. [Google Scholar] [CrossRef]
  24. Wang, S.G.; Li, X.; Han, X.J.; Jin, R. Estimation of surface soil moisture and roughness from multi-angular ASAR imagery in the Watershed Allied Telemetry Experimental Research (WATER). Hydrol. Earth Syst. Sci. 2011, 15, 1415–1426. [Google Scholar] [CrossRef] [Green Version]
  25. Bai, X.; He, B.; Li, X. Optimum Surface Roughness to Parameterize Advanced Integral Equation Model for Soil Moisture Retrieval in Prairie Area Using Radarsat-2 Data. IEEE Trans. Geosci. Remote Sens. 2016, 54, 2437–2449. [Google Scholar] [CrossRef]
  26. Wang, L.; He, B.; Bai, X.; Xing, M. Assessment of Different Vegetation Parameters for Parameterizing the Coupled Water Cloud Model and Advanced Integral Equation Model for Soil Moisture Retrieval Using Time Series Sentinel-1A Data. Photogramm. Eng. Remote Sens. 2019, 85, 43–54. [Google Scholar] [CrossRef]
  27. Lievens, H.; Verhoest, N.E.C. On the Retrieval of Soil Moisture in Wheat Fields from L-Band SAR Based on Water Cloud Modeling, the IEM, and Effective Roughness Parameters. IEEE Geosci. Remote Sens. Lett. 2011, 8, 740–744. [Google Scholar] [CrossRef]
  28. Wang, L.; Quan, X.; He, B.; Yebra, M.; Xing, M.; Liu, X. Assessment of the Dual Polarimetric Sentinel-1A Data for Forest Fuel Moisture Content Estimation. Remote Sens. 2019, 11, 1568. [Google Scholar] [CrossRef] [Green Version]
  29. Qiu, J.; Crow, W.T.; Wagner, W.; Zhao, T. Effect of vegetation index choice on soil moisture retrievals via the synergistic use of synthetic aperture radar and optical remote sensing. Int. J. Appl. Earth Obs. Geoinf. 2019, 80, 47–57. [Google Scholar] [CrossRef]
  30. Park, S.-E.; Jung, Y.T.; Cho, J.-H.; Moon, H.; Han, S.-H. Theoretical Evaluation of Water Cloud Model Vegetation Parameters. Remote Sens. 2019, 11, 894. [Google Scholar] [CrossRef] [Green Version]
  31. Sanchez, N.; Perez-Gutierrez, C.; Martinez-Fernandez, J.; Scaini, A. Validation of the SMOS L2 Soil Moisture Data in the REMEDHUS Network (Spain). IEEE Trans. Geosci. Remote Sens. 2012, 50, 1602–1611. [Google Scholar] [CrossRef]
  32. Ma, H.; Zeng, J.; Chen, N.; Zhang, X.; Cosh, M.H.; Wang, W. Satellite surface soil moisture from SMAP, SMOS, AMSR2 and ESA CCI: A comprehensive assessment using global ground-based observations. Remote Sens. Environ. 2019, 231, 111215. [Google Scholar] [CrossRef]
  33. Portal, G.; Vall-Llossera, M.; Piles, M.; Camps, A.; Chaparro, D.; Pablos, M.; Rossato, L. A Spatially Consistent Downscaling Approach for SMOS Using an Adaptive Moving Window. IEEE J. Sel. Top. Appl. Earth Obs. Remote Sens. 2018, 11, 1883–1894. [Google Scholar] [CrossRef]
  34. ASF Distributed Active Archive Center. Available online: https://www.asf.alaska.edu/sar-data-sets/sentinel-1/ (accessed on 26 September 2019).
  35. EARTHDATA. Available online: https://earthdata.nasa.gov (accessed on 6 October 2019).
  36. Chen, J.M.; Black, T.A. Defining leaf area index for non-flat leaves. Plant Cell Environ. 1992, 15, 421–429. [Google Scholar] [CrossRef]
  37. MODIS Collection 6 (C6) LAI/FPAR Product User’s Guide. Updated on 24 February 2015. Available online: https://lpdaac.usgs.gov/documents/2/mod15_user_guide.pdf?_ga=2.209388242.1969437656.1591680165-611859982.1463671458 (accessed on 6 October 2019).
  38. Ranga, M.; Knyazikhin, Y.; Taejin, P. MOD15A3H MODIS/Combined Terra + Aqua Leaf Area Index/FPAR Daily L4 Global 500 m SIN Grid; NASA LP DAAC: Sioux Falls, SD, USA, 2015. [Google Scholar]
  39. Kamel, D.; Alfredo, H. MYD13A2 MODIS/Aqua Vegetation Indices 16-Day L3 Global 1 km SIN Grid; NASA LP DAAC: Sioux Falls, SD, USA, 2015. [Google Scholar]
  40. Savitzky, A.; Golay, M.J.E. Smoothing and Differentiation of Data by Simplified Least Squares Procedures. Anal. Chem. 1964, 36, 1627–1639. [Google Scholar] [CrossRef]
  41. Dobson, M.; Ulaby, F.; Hallikainen, M.; El-Rayes, M. Microwave Dielectric Behavior of Wet Soil-Part II: Dielectric Mixing Models. IEEE Trans. Geosci. Remote Sens. 1985, 23, 35–46. [Google Scholar] [CrossRef]
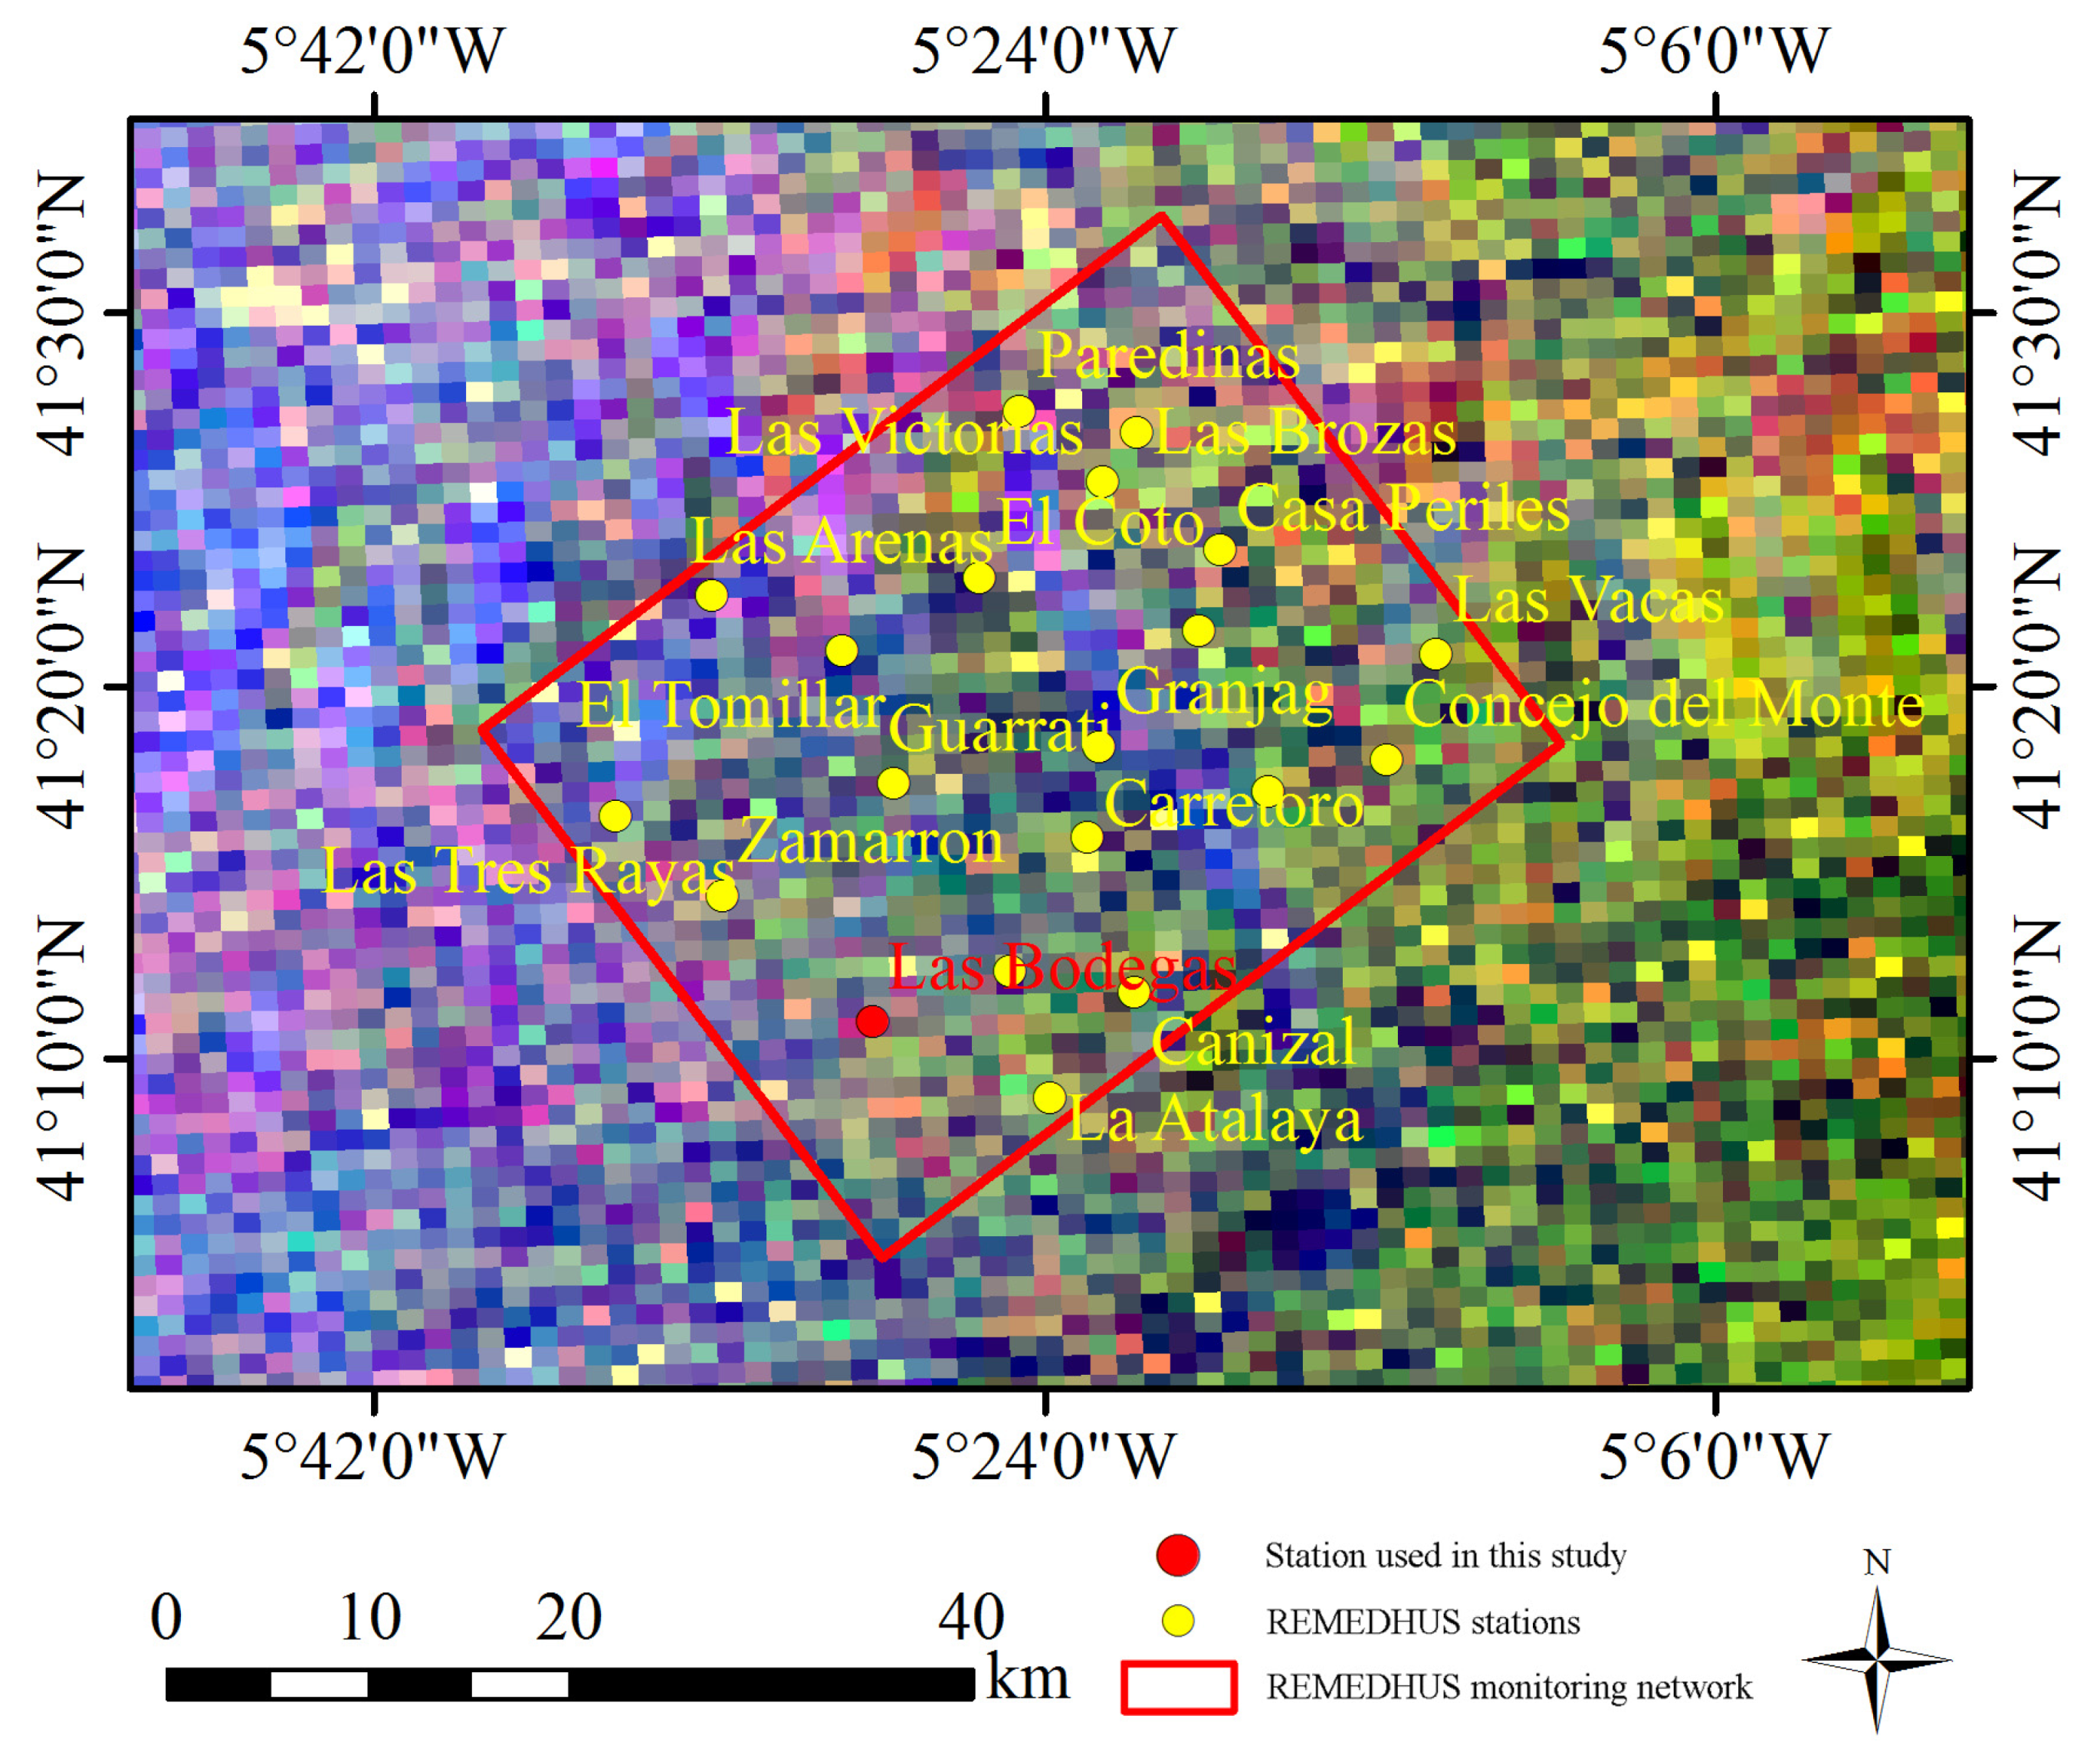
Figure 1. Geographical location of the REMEDHUS monitoring network and the background indicates the Sentinel-1A dual-polarization data (VV, VH, and VV polarizations have been used for red, green, and blue channels, respectively.
Water 12 01726 g001
Figure 2. Time series of in-situ soil moisture in the station Las Bodegas.
Water 12 01726 g002
Figure 3. Time series of the Moderate Resolution Imaging Spectroradiometer (MODIS) original vegetation parameters and their interpolated values from the station Las Bodegas. The LAI, FPAR, NDVI, and EVI stand for the leaf area index, fraction of photosynthetically active radiation, normalized difference vegetation index, and enhanced vegetation index, respectively.
Water 12 01726 g003
Figure 4. Flowchart for the model calibration and the soil moisture retrieval. The AIEM and WCM stand for the advanced integral equation model and the water cloud model, respectively. The LUT is the look-up-table. The BIAS (the mean bias), MAE (mean absolute error), RMSE (root mean square error), R (Pearson correlation coefficient) are statistical indicators.
Water 12 01726 g004
Figure 5. Backscattering coefficient simulated from the coupled model with the different vegetation combinations. The boxplots show the median (red horizontal line), mean (black cycle), 25th and 75th percentiles (top and bottom of the blank box, respectively), and the outlier ranges (edges of the top and bottom whiskers). The “LAI_FPAR” indicates that the V1 and V2 are characterized by the LAI and FPAR, respectively.
Water 12 01726 g005
Figure 6. Time series of the Sentinel-1A and simulated backscattering coefficient with different vegetation combinations used for the coupled model. The “LAI_FPAR” indicates that the V1 and V2 are characterized by the LAI and FPAR, respectively.
Water 12 01726 g006
Figure 7. Soil moisture estimated from the coupled model with the different vegetation combinations. The boxplots show the median (red horizontal line), mean (black cycle), 25th and 75th percentiles (top and bottom of the blank box, respectively), and the outlier ranges (edges of the top and bottom whiskers). The “LAI_FPAR” indicates that the V1 and V2 are characterized by the LAI and FPAR, respectively.
Water 12 01726 g007
Figure 8. Time series of the measured and estimated soil moisture with the different vegetation combinations used for the coupled model. The “LAI_FPAR” indicates that the V1 and V2 are characterized by the LAI and FPAR, respectively.
Water 12 01726 g008
Table 1. Parameters for the Sentinel-1A images.
ParametersDescription
Frequency~5.405 GHz
Processing levelLevel-1
Acquisition modeInterferometric wide swath
Product typeGround range detected
Polarization modeVV and VH
OrbitDescending
Temporal resolution12 days
Temporal range01/01/2017–31/12/2018
Grid spacing for the azimuth and range10 m
Looks for the azimuth and range directions1 and 5
Incidence angles30.56° to 46.42°
Coordinated Universal Time (UTC) times06:25–06:26
Table 2. Selected effective roughness parameters, WCM coefficients, and statistical metrics between the measured and simulated backscattering coefficients.
Vegetation DescriptorsEffective Roughness ParametersModel CoefficientsStatistical Metrics
V1V2s (cm)l (cm)ABBIAS (dB)MAE (dB)RMSE (dB)R (–)
LAILAI0.810.0−22.250.160.3390.8451.1800.73
LAIFPAR1.119.0−24.020.260.3560.8161.1360.75
LAINDVI1.119.0−25.000.220.4000.8171.1330.76
LAIEVI1.117.0−29.470.280.2170.7690.9960.81
FPARLAI1.018.0−40.810.260.5141.0171.4040.61
FPARFPAR1.119.0−44.470.360.3020.8391.1530.73
FPARNDVI0.911.0−53.770.210.1480.7870.9970.80
FPAREVI1.120.0−43.730.530.4230.8721.2340.71
NDVILAI1.018.0−39.920.240.4681.0791.4230.58
NDVIFPAR1.119.0−43.400.350.2430.9291.1850.71
NDVINDVI1.119.0−42.800.340.2340.9171.1930.70
NDVIEVI1.120.0−41.330.610.3180.9501.2680.66
EVILAI1.018.0−65.120.250.4821.0811.4100.60
EVIFPAR1.017.0−67.280.410.4000.9991.3040.66
EVINDVI0.78.0−67.200.400.3970.9631.2810.67
EVIEVI0.78.0−67.100.670.3940.9641.2800.67
Table 3. Statistical metrics between the measured and retrieved soil moisture.
Vegetation DescriptorsStatistical Metrics
V1V2BIAS (m3/m3)MAE (m3/m3)RMSE (m3/m3)R (–)
LAILAI0.0190.0640.0700.81
LAIFPAR0.0170.0650.0740.79
LAINDVI0.0160.0600.0700.78
LAIEVI0.0230.0600.0690.76
FPARLAI0.0130.0730.0850.81
FPARFPAR0.0240.0680.0760.78
FPARNDVI0.0310.0590.0690.75
FPAREVI0.0180.0650.0760.78
NDVILAI0.0280.0730.0850.76
NDVIFPAR0.0350.0720.0810.74
NDVINDVI0.0350.0700.0790.75
NDVIEVI0.0330.0710.0800.76
EVILAI0.0210.0780.0920.75
EVIFPAR0.0260.0750.0870.75
EVINDVI0.0270.0700.0810.76
EVIEVI0.0280.0720.0820.76