Article

Drivers of Benthic Macroinvertebrate Assemblages in Equatorial Alpine Rivers of the Rwenzoris (Uganda)

1
Laboratory of Environmental Toxicology and Aquatic Ecology, Ghent University, Coupure Links 653, B-9000 Ghent, Belgium
2
Provincial Centre of Environmental Research, Godshuizenlaan 95, 9000 Gent, Belgium
*
Author to whom correspondence should be addressed.
Water 2020, 12(6), 1668; https://doi.org/10.3390/w12061668
Submission received: 21 April 2020 / Revised: 30 May 2020 / Accepted: 6 June 2020 / Published: 11 June 2020
(This article belongs to the Special Issue Applied Ecology Research for Water Quality Management)

Abstract

:
The Sub-Saharan alpine freshwater biodiversity is currently impacted by human settlements, climate change, agriculture, and mining activities. Because of the limited biodiversity studies in the region, a better understanding is needed of the important environmental variables affecting macroinvertebrate assemblages. In this paper, macroinvertebrate diversity responses to 18 environmental variables were studied at 30 sites along unique Rwenzori rivers at the equator in Uganda. We hypothesized that anthropogenic disturbance and local environmental variables affect macroinvertebrate diversity, irrespective of altitudinal gradients. Based on altitude and climate, the sites were subdivided into three altitude groups consisting of 10 sites each: upstream (US) 1400–1600 m.a.s.l.; midstream (MS) 1091–1399 m.a.s.l., and downstream (DS) 900–1090 m.a.s.l. A total of 44 macroinvertebrate families and 1623 individuals were identified. The macroinvertebrate diversity patterns were influenced by temperature, altitude, and latitude. Regression analysis revealed that temperature and nickel, were negative predictors of taxa richness. Nickel, which is released by mining activity, is detrimental to aquatic communities in Sub-Saharan alpine ecosystems. Significant longitudinal variation in macroinvertebrate diversity was observed between the sites, which were also affected by mineral and temperature gradients. Our study highlights the need for long-term monitoring in this region to detect and reduce the threats to river biodiversity from anthropogenic activity.

1. Introduction

The global biodiversity is increasingly under threat due to both man-made and natural stressors [1,2,3]. The Sub-Saharan African biomes (grasslands and forests) are greatly affected by biodiversity losses as a result of human development activities (i.e., mining, agriculture, and industry) and climatological changes (i.e., extreme precipitation events and increasing temperature) [4,5]. Sub-Saharan Africa contains many ecoregions, which are considered to be among the richest in global biodiversity [6,7,8]. One of these biodiverse Sub-ecoregions, the western branch of the East African Rift System (EARS), encompasses the central African Albertine Rift region, where the Rwenzori mountains are situated and which are part of the East African plateau mountain ranges [9,10,11]. The Rwenzori region has a national park that is a UNESCO world heritage site and is earmarked as one of the Global 200 freshwater ecoregions [12,13]. Rwenzori rivers and streams are part of the Lake Edward basin [14], which includes rivers of Nyawamba, Nyamugasani, Mubuku, and Mpanga that are mainly fed by both glacial meltwater and rainfall, and are vital headwaters for the White Nile [15]. These rivers and streams are unique, being glacier-fed streams located at the equator, and present a rare opportunity to study the drivers of macroinvertebrate assemblages in these alpine rivers.
Freshwater biodiversity in the Rwenzoris is facing multiple anthropogenic stressors from population increase, dense human settlement, tourism, livestock watering, commercial agriculture, hydropower generation, and mining. These activities have led to an increase in both organic and inorganic pollutants (e.g., nutrients such as nitrates and phosphates, and heavy metals such as copper, cobalt, and nickel) in rivers and streams affecting the water quality and in turn influencing the resilience of the freshwater ecosystem [16,17]. It has been estimated that over 60% of the major freshwater systems in the Albertine Rift Region are currently threatened by water pollution, habitat loss, water extraction, and climate change [18]. As a mineral rich area, the Albertine Rift Rwenzori region has large deposits of copper-nickel ore, oil, and cobalt that are being explored and mined. This has led to the growth of a number of mining industries, urban developments, and water abstraction projects for hydropower generation [19,20,21]. Between 1956 and 1982, the mining processes of the Kilembe mines generated 15 metric tonnes of cupriferous and cobaltiferous pyrite. High concentrations of heavy metals such as cobalt (3.9 μg mL−1), copper (>2 μg mL−1), and nickel (0.61 µg mL−1), have since been found in mine tailings, mine water, and mine leachate significantly contributing to pollution of Rwenzori freshwater systems [17,18,19,20,21,22]. These heavy metal ions eventually leach into the river Nyawamba, negatively affecting water quality by decreasing the pH level. This leads to an increase in the metal solubility and metal bioavailability to aquatic organisms. This in turn can be toxic to the aquatic organisms as these metals are readily absorbed by permeable tissues such as the gills and gut [17,23,24]. Furthermore, indications in aquatic ecosystems of heavy metal toxicity are mouthpart deformities in Chironomidae larvae [25,26]. The Rwenzori mountain ranges are also facing climatological change, having experienced a rapid increase in glacial retreat and snow melt due to a rise in air temperature [27,28,29]. The Rwenzori glaciers are expected to disappear in approximately two decades, altering the physicochemical characteristics of the alpine freshwater ecosystems downstream, mainly the temperature and pH. This will sequentially affect the biological community structure, as certain taxa will probably not thrive above these new temperature thresholds [28,30]. As glaciers retreat, the benthic macroinvertebrate community diversity is expected to increase, due to upstream taxa migration as a consequence of heightened water temperature caused by decreased glacial influence [31]. The decreased glacial runoff arising from glacier retreat, facilitates the displacement of cryophilic (cold-adapted) taxa by the range expansion of less cryophilic taxa towards higher altitudes [32,33,34]. Previous studies on the thermal tolerance limits of macroinvertebrates in Southern Africa [35] and Australia [36] showed that as stream temperature increases, due to climate change and anthropogenic disturbances in the riparian zone, certain macroinvertebrate families tend to disappear as well. Thermally sensitive stenothermic families such as Teloganodidae (Ephemeroptera) and Notonemouridae (Plecoptera) that are capable of existing and thriving in cold small streams within narrow water temperature ranges that influence their longitudinal distribution, egg hatching, and adult emergence periods could be replaced by more tolerant eurythermal families.
In other small and well-known alpine freshwater ecosystems (e.g., New Zealand, Greenland, Tibet, equatorial Andes, and the Italian Alps), the impacts of pollutants on biodiversity have been measured using indicator taxa such as Ephemeroptera, Plecoptera, and Trichoptera (EPT) along with measures of community structure such as species richness and evenness in order to determine the overall biodiversity of rivers and streams [37,38,39,40,41].
Limited monitoring of rivers and streams in the Rwenzoris and similar regions in equatorial Africa has been undertaken. However, monitoring using indicator taxa and diversity metrics could also be applied in the Rwenzoris to ensure that biodiversity change is better monitored. Glacier-fed streams are characterized by harsh environments (i.e., low channel stability, low temperatures, and limited food sources) and generally show a characteristic pattern in their longitudinal distribution of diversity and taxa assemblages [42,43]. Benthic macroinvertebrate biodiversity is typically lowest close to the glacier, but increases, often logarithmically, with increasing distance from the glacier and decreasing glacial contribution to stream flow. Due to the influence of lakes, tributaries, and groundwater upwelling, the glacier influence on macroinvertebrate biodiversity reduces with increasing downstream distance from the ice margin [44]. As groundwater contributions increase, range conditions become more stable, and environmental stress is decreased [45]. In alpine systems [45], along with other mountainous regions [46], groundwater has been identified as a moderator of water temperature. The macroinvertebrate community diversity is expected to increase as glaciers retreat, due to upstream taxa migration as a result of increased water temperature caused by reduced glacial influence. Likewise, this shapes the macroinvertebrate distribution and drives the community structure of these alpine ecosystems. Previous longitudinal studies on glacier-fed streams in the Ecuadorian Andes showed that stream temperature and channel stability explained most of the variability in macroinvertebrate taxa composition and richness [41,42,47,48]. Channel stability systematically increased downstream while temperature did not, and the researchers further observed that macroinvertebrate diversity increased with distance from the glacier.
Rivers and streams are also subject to disturbance which can affect taxa richness. The intermediate disturbance hypothesis stipulates that taxa richness is greatest in communities with disturbances that are moderate in both their frequency and intensity [44,49]. Following this hypothesis, both taxon richness [50] and assemblage evenness [51,52] are expected to peak at intermediate levels of disturbance (or stability). The macroinvertebrate families present in a community depend on the physical characteristics, disturbance levels, and biotic factors of the ecosystem. Global studies have further revealed that physicochemical variables (temperature and channel stability) and geographical variables (altitude and longitude) influence macroinvertebrate community patterns in both tropical and temperate aquatic systems [53,54,55,56,57,58]. These studies revealed that temperature influences macroinvertebrate diversity along an altitudinal gradient. There have only been a few studies undertaken on the diversity of macroinvertebrates, with respect to both geographical and anthropogenic disturbance gradients in the study region and Uganda [59,60,61,62]. This study aims at filling this knowledge gap about the Rwenzori alpine rivers, with regard to the importance of both environmental and geographical variables on the macroinvertebrate community. We aimed to study drivers of macroinvertebrate diversity along sites at different altitude ranges with varying levels of anthropogenic disturbance.
To this aim, we sampled macroinvertebrates along rivers and streams on both the leeward and windward sections of the Rwenzoris. Our main goals were: (i) to determine the variables driving the overall macroinvertebrate community diversity of Rwenzori rivers, (ii) to assess the structural variability in faunal univariate diversity metrics between different altitude classes, and (iii) to determine the importance of the site-specific environmental variables on the macroinvertebrate community composition. We hypothesized that: (a) anthropogenic disturbance and local environmental variables drive community diversity irrespective of the geographical altitudinal and longitudinal gradients, and (b) the differences in macroinvertebrate assemblages between altitude groups are minor and show similar relationships with environmental variables.

2. Materials and Methods
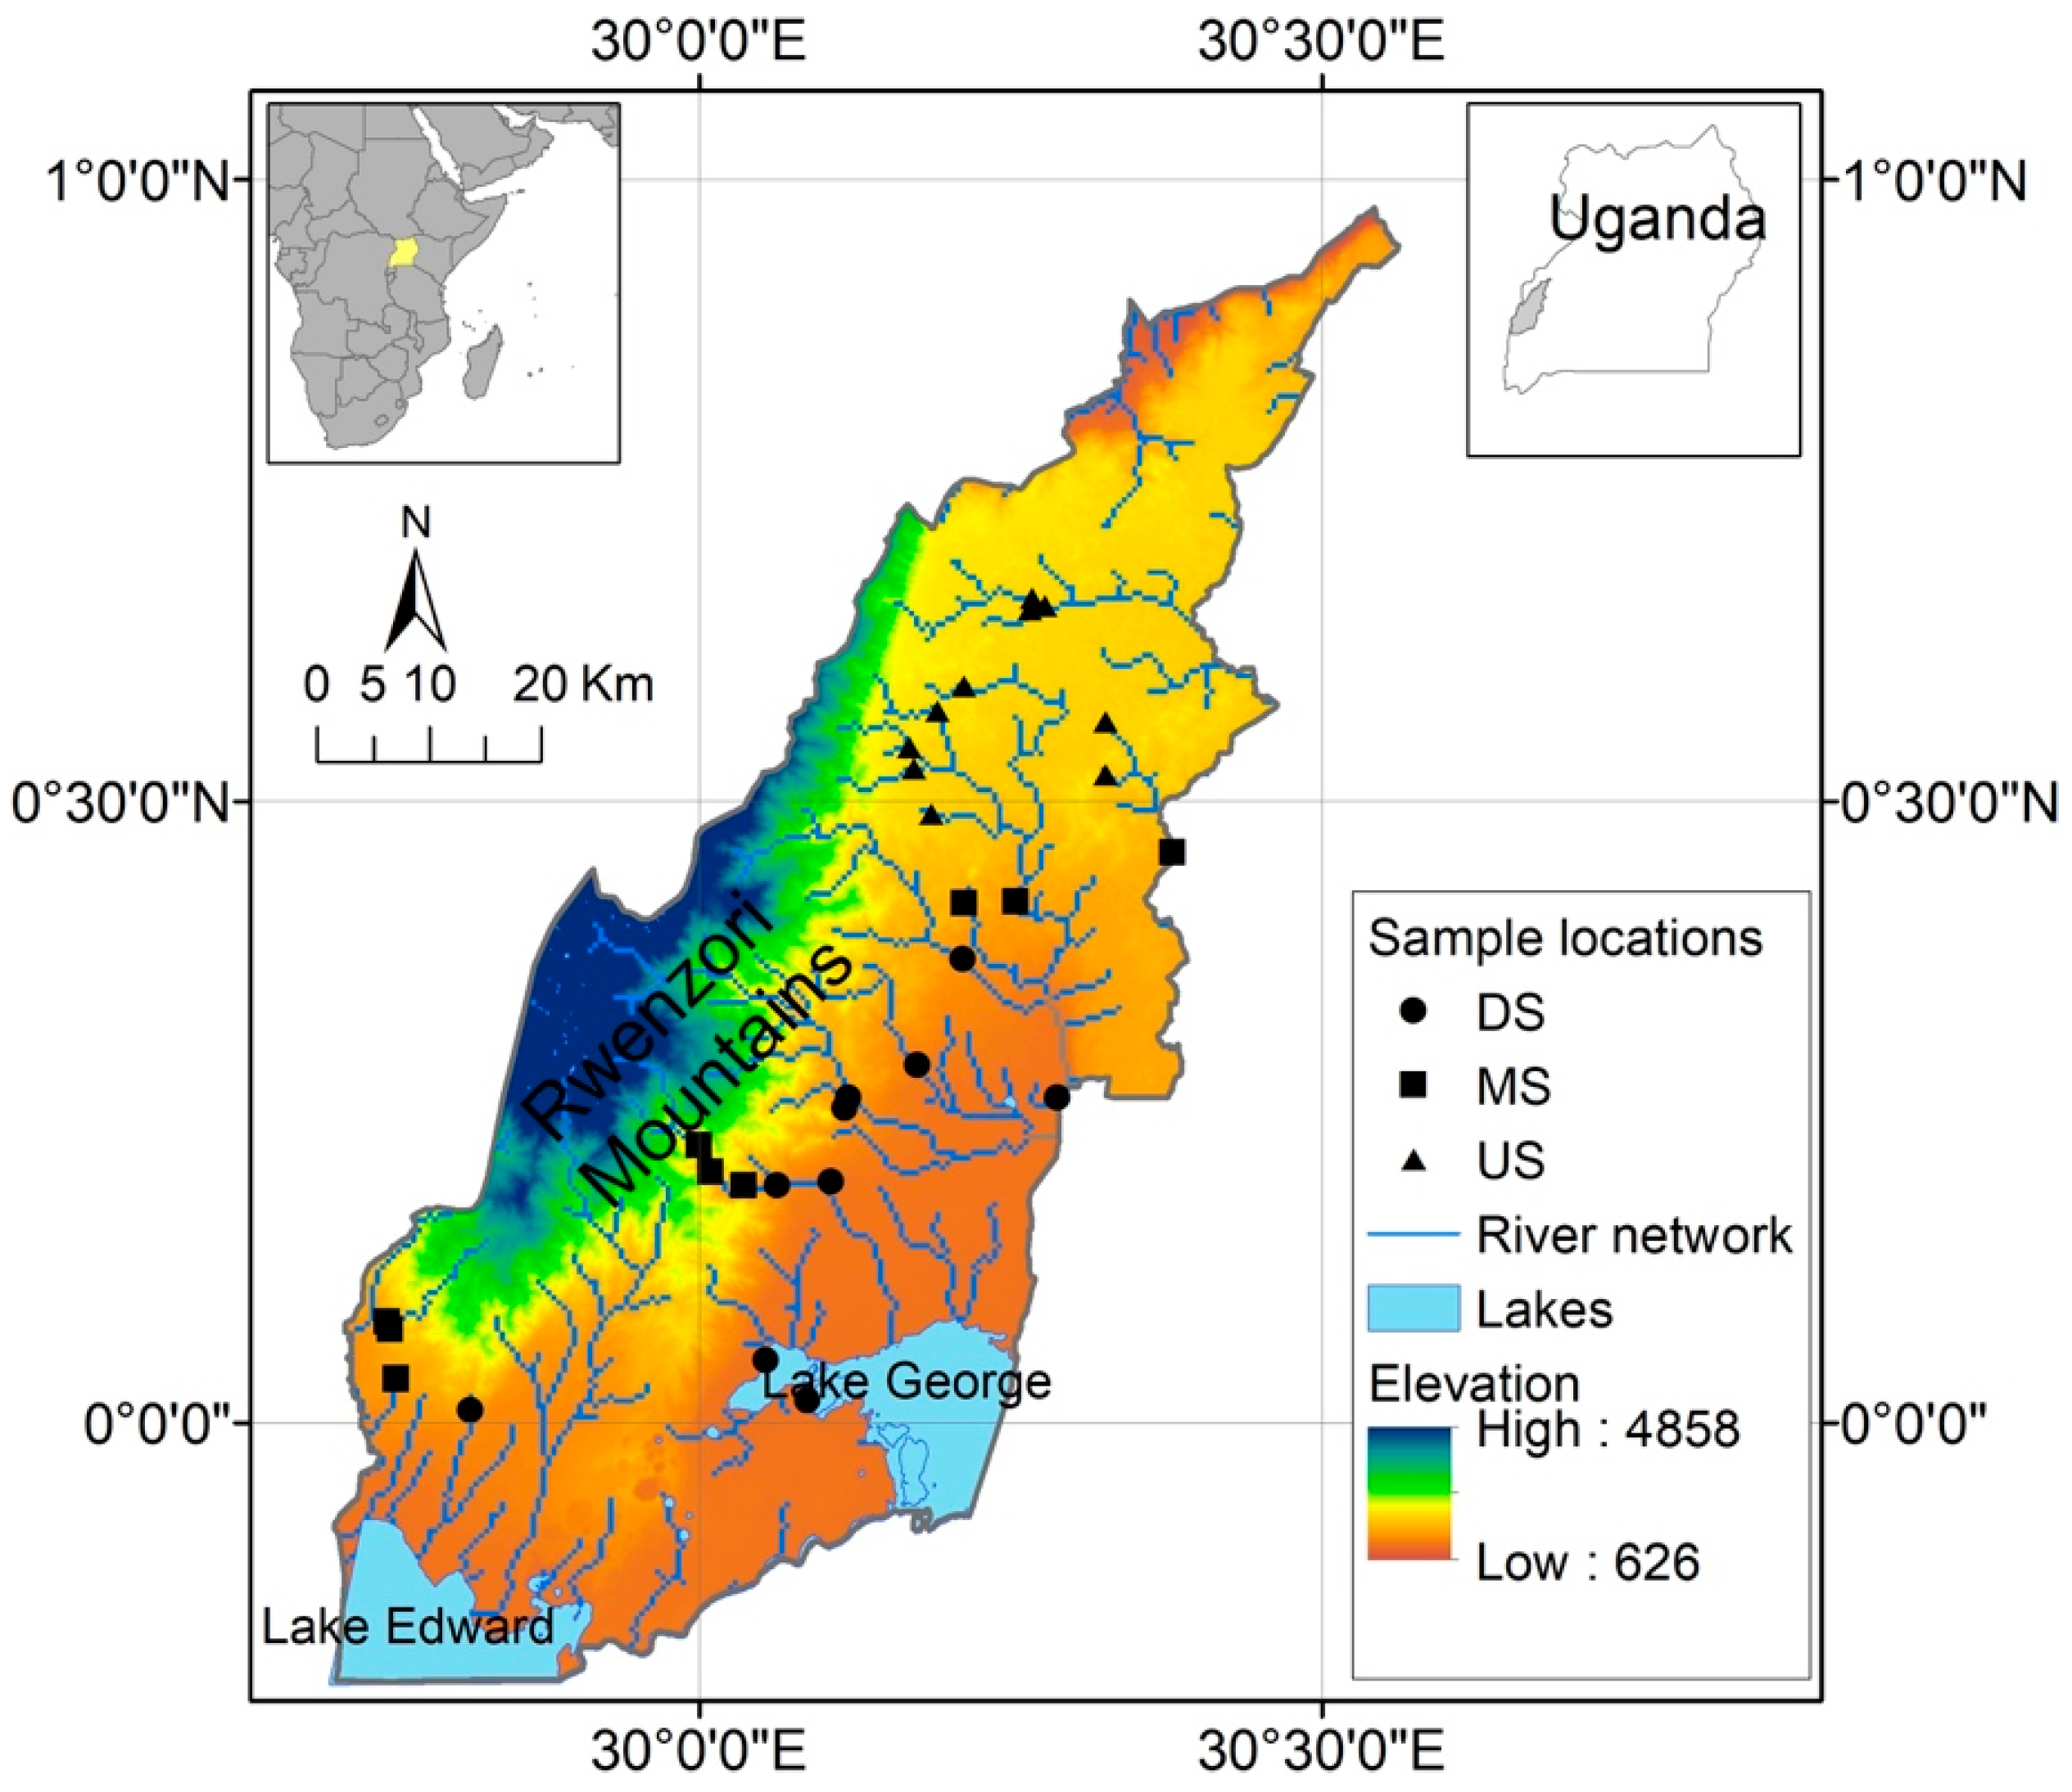
2.1. Study Area

The study rivers and streams are pristine headwaters of the Albert (White) Nile and mainly originate from the glaciers of the Rwenzori Mountain ranges (00° 23′09′′ N 29°52′18′′ E). They traverse the western rift valley lowlands and subsequently drain into the wetlands of Lake Edward and Lake George, the latter being a protected Ramsar site of international importance [63]. These mountain ranges are located in southwestern Uganda, in Bundibugyo, Kasese, and Kabarole districts along the border of Uganda and the Democratic Republic of Congo. The study area bridges the equator in the western branch of the East African Rift System, and is bounded by Rwenzori mountains to the north, Lake Edward to the south, and Lake George to the southeast (Figure 1). The altitude ranges between 900–5109 m above sea level (m.a.s.l.). The main land use activities include tourism, urban settlement, commercial agriculture, mining, and industry, which are conducted between the lowest plateau altitude level of 900 m.a.s.l. to 2000 m.a.s.l. The Rwenzori region is characterized by four climatic types along different altitude ranges (i.e., <1200 m.a.s.l.: Tropical savannah; 1200–2000 m.a.s.l.: equatorial; >2000 m.a.s.l.: temperate) with a snow line at 4500 m.a.s.l. [64]. It has well-defined rainy seasons, with an annual bimodal rainfall regime ranging from 750 mm to 1500 mm occurring from March to June and October to December. However, some highland areas in the region experience heavy rainfall of 1500 mm to 2000 mm all year round [64,65]. The dry seasons are characterized by sporadic rainfall which lasts for a few hours [11].

Site Selection

The 30 sites selected were situated between 900–1600 m.a.s.l. along accessible sections of 20 separate rivers and two Lake George wetland sites. The study area map was created using ArcGIS version 10.0 (ESRI Company, Redlands, CA, USA). The site choice was moderated by accessibility and was distributed across the Rwenzori region (leeward and windward sections) to span the entire altitude range where most anthropogenic activity is conducted (900–2000 m.a.s.l.), in the tropical savannah and equatorial climatic zones. To capture the full range of climatic zone variation using an altitudinal gradient, 10 sites were sampled in the tropical savannah zone (hereafter “downstream sites”), with an additional 10 sites sampled in the transition from tropical savannah to equatorial zones (hereafter “midstream sites”), and lastly 10 sites were sampled from the equatorial zone (hereafter “upstream sites”) (Figure 1).
Additionally, with ground truthing (i.e., direct observation in the field) selected sites had varying anthropogenic disturbance levels. Visible point pollution sources included discharges from municipal wastewater treatment plants, mine leachate from copper mine tailings, and waste from industries, and non-point pollution sources such as runoff from dense urban settlements, agricultural farmlands, and mine drainage. An estimate of the anthropogenic impact based on the land use types (i.e., urban area, mining, roads/paths, residential areas, agriculture, and water abstraction), within 100m of each site, was visually assessed and scaled from 0 to 3 [66,67]. The four ordinal categories were high (3), moderate (2), low (1), and none (0), with higher values indicating high disturbance. The total disturbance was computed and scored on a scale of 0–10 and based on the scores the sites were then categorized into three levels of disturbance (low, medium, and high). These ranged from least disturbed sites (i.e., non-discernible disturbance) with a score between 0–3 to moderately disturbed (i.e., noticeable impact) with a score of 4–6 and lastly, highly disturbed sites (i.e., visible widespread significant disturbance) with a score of 7–10.
Study sites were both environmentally and geographically diverse and subject to different climatic conditions characterized by spatial and temporal variations in weather. The differences in macroinvertebrate assemblages between the sites could thus be attributed to differences in physicochemical and/or geographical variables. We sampled sites as synchronously as possible between January to February 2017 during the dry season when they were most accessible, and ecologically and hydrologically stable.

2.2. Collection of Environmental Data

We measured 15 physicochemical and three geographical variables along each of the 30 sites (see Table S1, in Supplementary Materials). The altitude and exact coordinates were determined using a handheld Global Positioning System (GPS) device (Garmin Legend; Garmin Ltd., Olathe, KS, USA). The physicochemical variables of pH, temperature (Temp), specific conductivity (SpCond), and dissolved oxygen (DO) were measured in the field using a Hydrolab multi-probe meter (H2O Hydrolab multi-probe; Hydrolab Company, Austin, Texas, USA). The current velocity at each site was measured using a handheld Höntzsch probe (HFA-model; Höntzsch, Waiblingen, Germany).
The water samples for chemical analysis were collected using nitric acid pre-washed Wheaton amber glass bottles (1 L). At each site, the sample bottles were washed three times prior to water collection. The glass bottles were carefully filled completely without creating bubbles (zero headspace), which was achieved by filling the bottle until there was a positive meniscus prior to capping and sealing. The bottled water samples were cooled on ice immediately after collection, and then transported in a Coleman cool box (Therapak; Coleman, USA) to the laboratory. The samples were immediately stored at 4 °C until analysis which was carried out within 24 h after collection, according to the World Health Organization (WHO) guidelines [68] and HACH (HACH, 2015) recommendations. These water samples were then analyzed in the laboratory using a HACH Lange DR3500 lab spectrophotometer (HACH Company, Loveland, CO, USA) and matching chemistry test kits to measure, (with their respective minimum to maximum ranges); copper (0.01–1.00 mg L−1), nickel (0.05–1.00 mg L−1), ammonium-nitrogen (0.015–2.0 mg L−1 NH4-N), nitrate-nitrogen (0.23–13.5 mg L−1 NO3-N), nitrite-nitrogen (0.005–0.100 mg L−1 NO2-N), total nitrogen (1–16 mgL−1 TN), (total and ortho) phosphate (0.01–0.50 and 0.05–1.50 mg L−1 PO4), chemical oxygen demand (5–60 mg L−1 COD) and biochemical oxygen demand, 5 days (1.0–12.0 mg L−1 BOD5).

2.3. Aquatic Macroinvertebrate Sampling and Identification

At each site, macroinvertebrates were sampled using standardized multihabitat kick sampling with a dip net (mesh size of 0.5 mm) along all accessible aquatic habitats within a stretch of approximately 30 m [69,70,71]. This included three replicate dip-net samples and visual collections from riverbed substrate (stones, sand, or mud), macrophytes (floating, submerged, or emergent), the immersed roots of overhanging trees, and debris [72]. The sampling effort was evenly distributed across all accessible aquatic habitats. One designated individual sampled each site for 5 min [70,71,73,74]. The three replicate samples per site were combined into one larger sample after collection. A total of 30 macroinvertebrate samples were collected during the daytime, rinsed, sorted, and preserved in 70% ethanol. In the laboratory, the samples were rinsed through a sieve and sorted without magnification. Subsampling was not applied. Using a stereo Olympus SZX10 microscope (Olympus Corporation, Shinjuku, Tokyo, Japan) with LED-light ring at a magnification of 7– 45 ×, Rwenzori fauna were identified and counted in the laboratory to family level using the keys of Gerber and Gabriel [75]. Family level identification was considered to be the most suitable for future replicability and uniformity by water stakeholders in the region with limited resources and taxonomic expertise.

2.4. Data Analysis

All the analyses were performed using R software version 3.4.0 [76]. The patterns in diversity and environmental drivers of benthic macroinvertebrate assemblages were analyzed using non-parametric multivariate methods. Dufrêne’s method was used to identify dominant families from each altitude group, whereby: Yi = Ni × fi/N [77], where Yi is the dominant family, N is the total number of individuals in all sites, Ni is the number of individuals of family i in all sites, and fi is the frequency of family i, which is the relative frequency of occurrence of family i in the sites of each group. We carried out indicator value (IndVal) analysis with the three altitude site group combinations to ascertain the association between taxa and the altitude groups using the indicspecies package [78]. In order to identify the group associations for each family, we set the alpha significance to 1 to display the group to which each taxon is associated with. Furthermore, in order to detect the significant indicator taxa for the altitude group demarcations, the alpha significance level was set to 0.5. The indicator value technique integrates approximates of abundance with the frequency of occurrence within a group [79]. A large value indicates that a taxon is abundant at all sites within a group and not present in other groups. The indicator value has two components A and B. Component A is the specificity or positive predictive value as an indicator of the site group while B is known as the fidelity or sensitivity of species as an indicator of the target site group. Component A is the conditional probability that the sampled site belongs to the target site group, in light of the fact that the species has been found. Component B is the conditional probability of finding the species in sites belonging to the altitudinal site group. A Monte Carlo randomization test with 1000 permutations was carried out to determine the index’s statistical significance [80,81].
Four frequently used univariate diversity metrics, including taxa richness, total abundance, Pielou’s evenness, and Simpson index values, were computed for each of the sites. The differences in diversity indices between the three groups were assessed using the non-parametric Kruskal-Wallis test [82] and Dunn’s post hoc multiple comparison tests were run to assess significant differences in the diversity metric values among the altitude groups (p < 0.05).
Principal component analysis (PCA) was executed using the FactoMineR package [83], to determine the primary gradient of variables (predictors) in the data of study sites. We applied Kaiser-Guttmann’s criterion and retained the factors that had an eigen value greater than 1. The first six factors were used in the regression analysis (see Table S2, in Supplementary Materials). Using both glmnet [84] and plotmo packages, separate regression models using the least absolute shrinkage and selection operator (LASSO) penalty algorithm [85,86], were run for both total taxa abundance and taxa richness with the 18 predictors from first six dimensions for the three altitude groups. As a shrinkage and variable selection technique for linear regression models, the aim of using the LASSO algorithm was to obtain the subset of predictors that minimizes prediction error for the two quantitative response variables (i.e., taxa abundance and taxa richness). The LASSO algorithm did this by imposing a constraint on the model parameters that causes regression coefficients for some variables to shrink towards zero. Predictors with regression coefficients equal to zero after the shrinkage process, were excluded from the model. Significant predictors with non-zero regression coefficients were retained, as they were strongly associated with the two response variables. Where necessary, prior to analysis, environmental variables were standardized to zero mean and unit variance, to remove disparate measurement scales of the variables.

3. Results

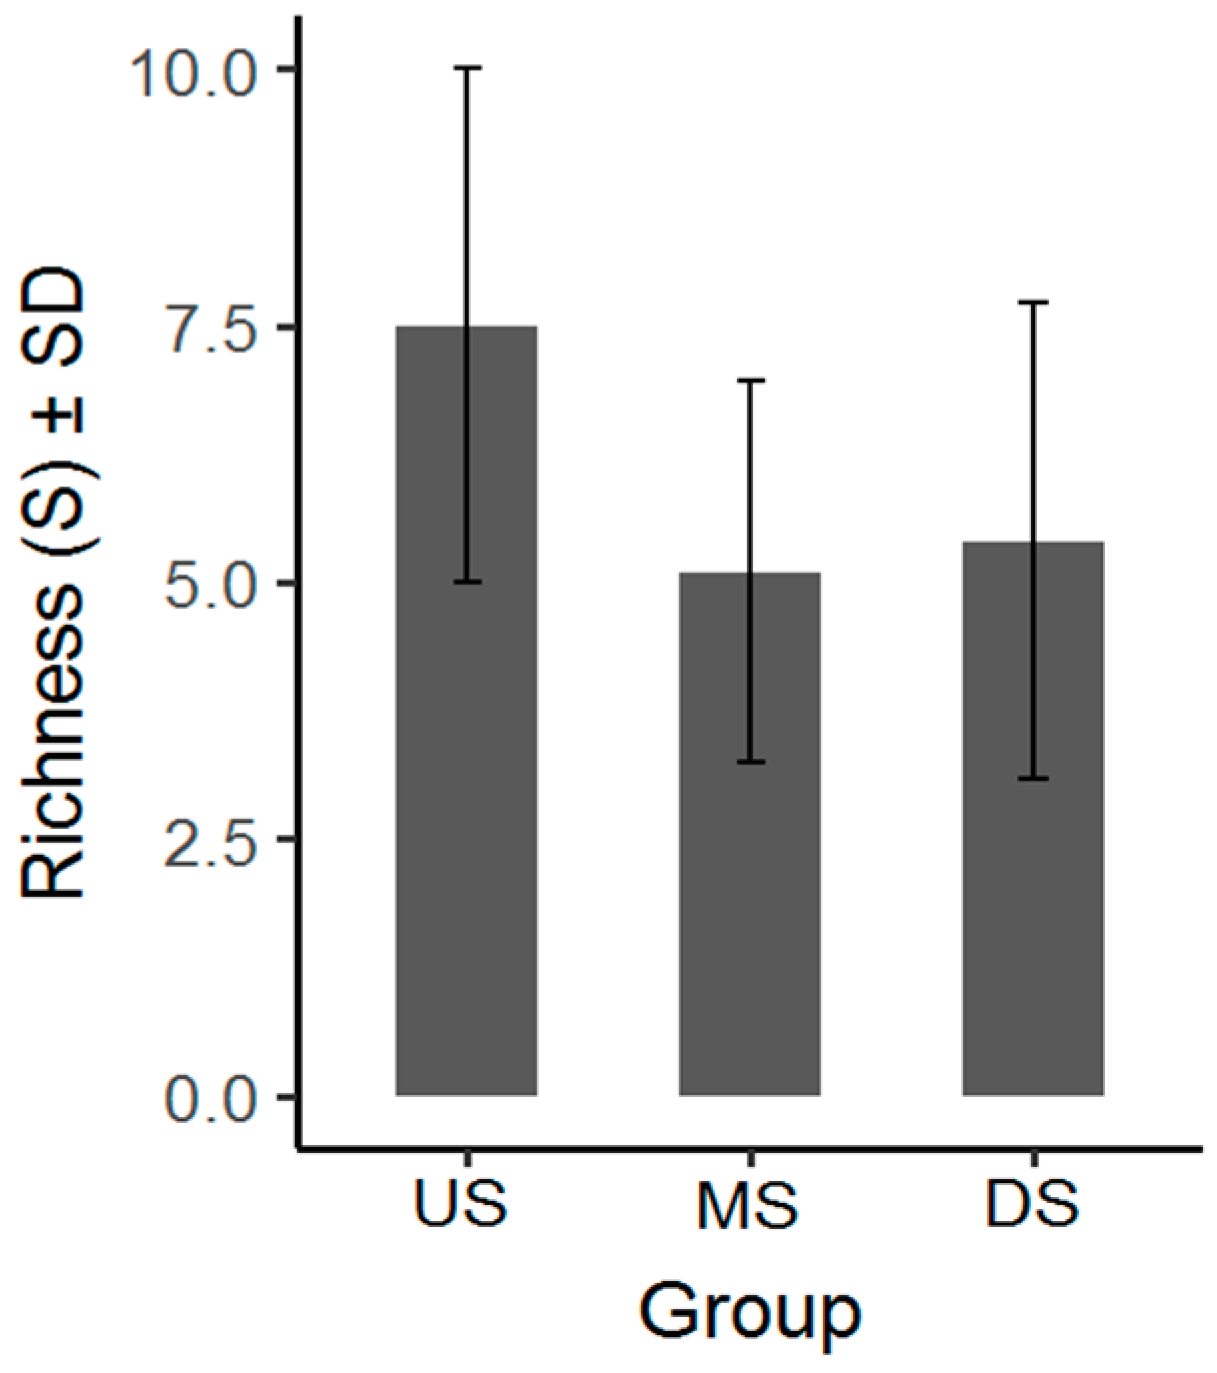
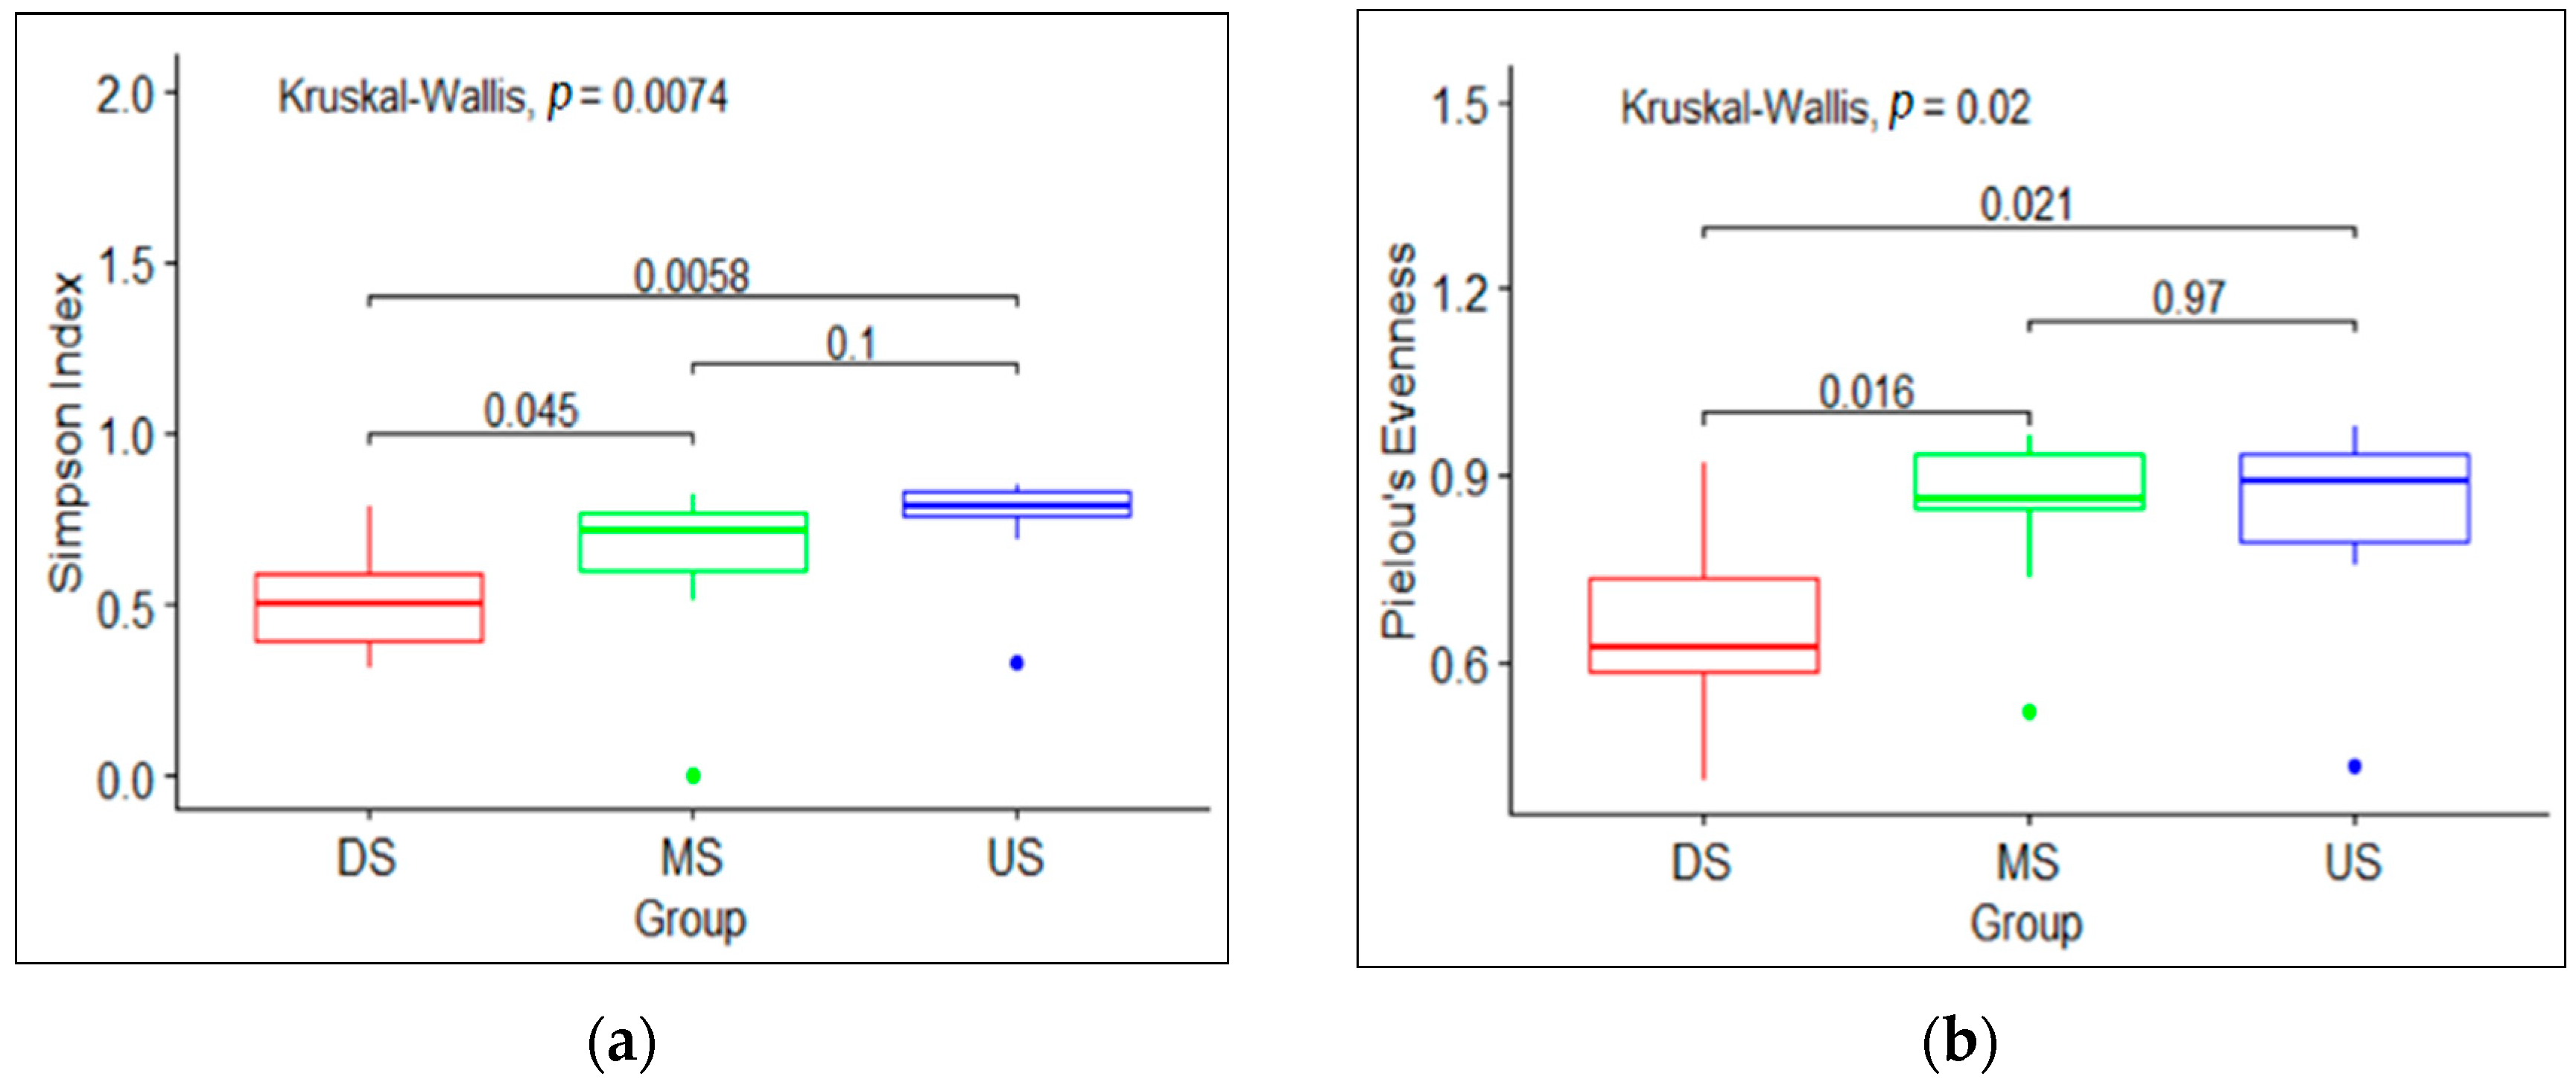
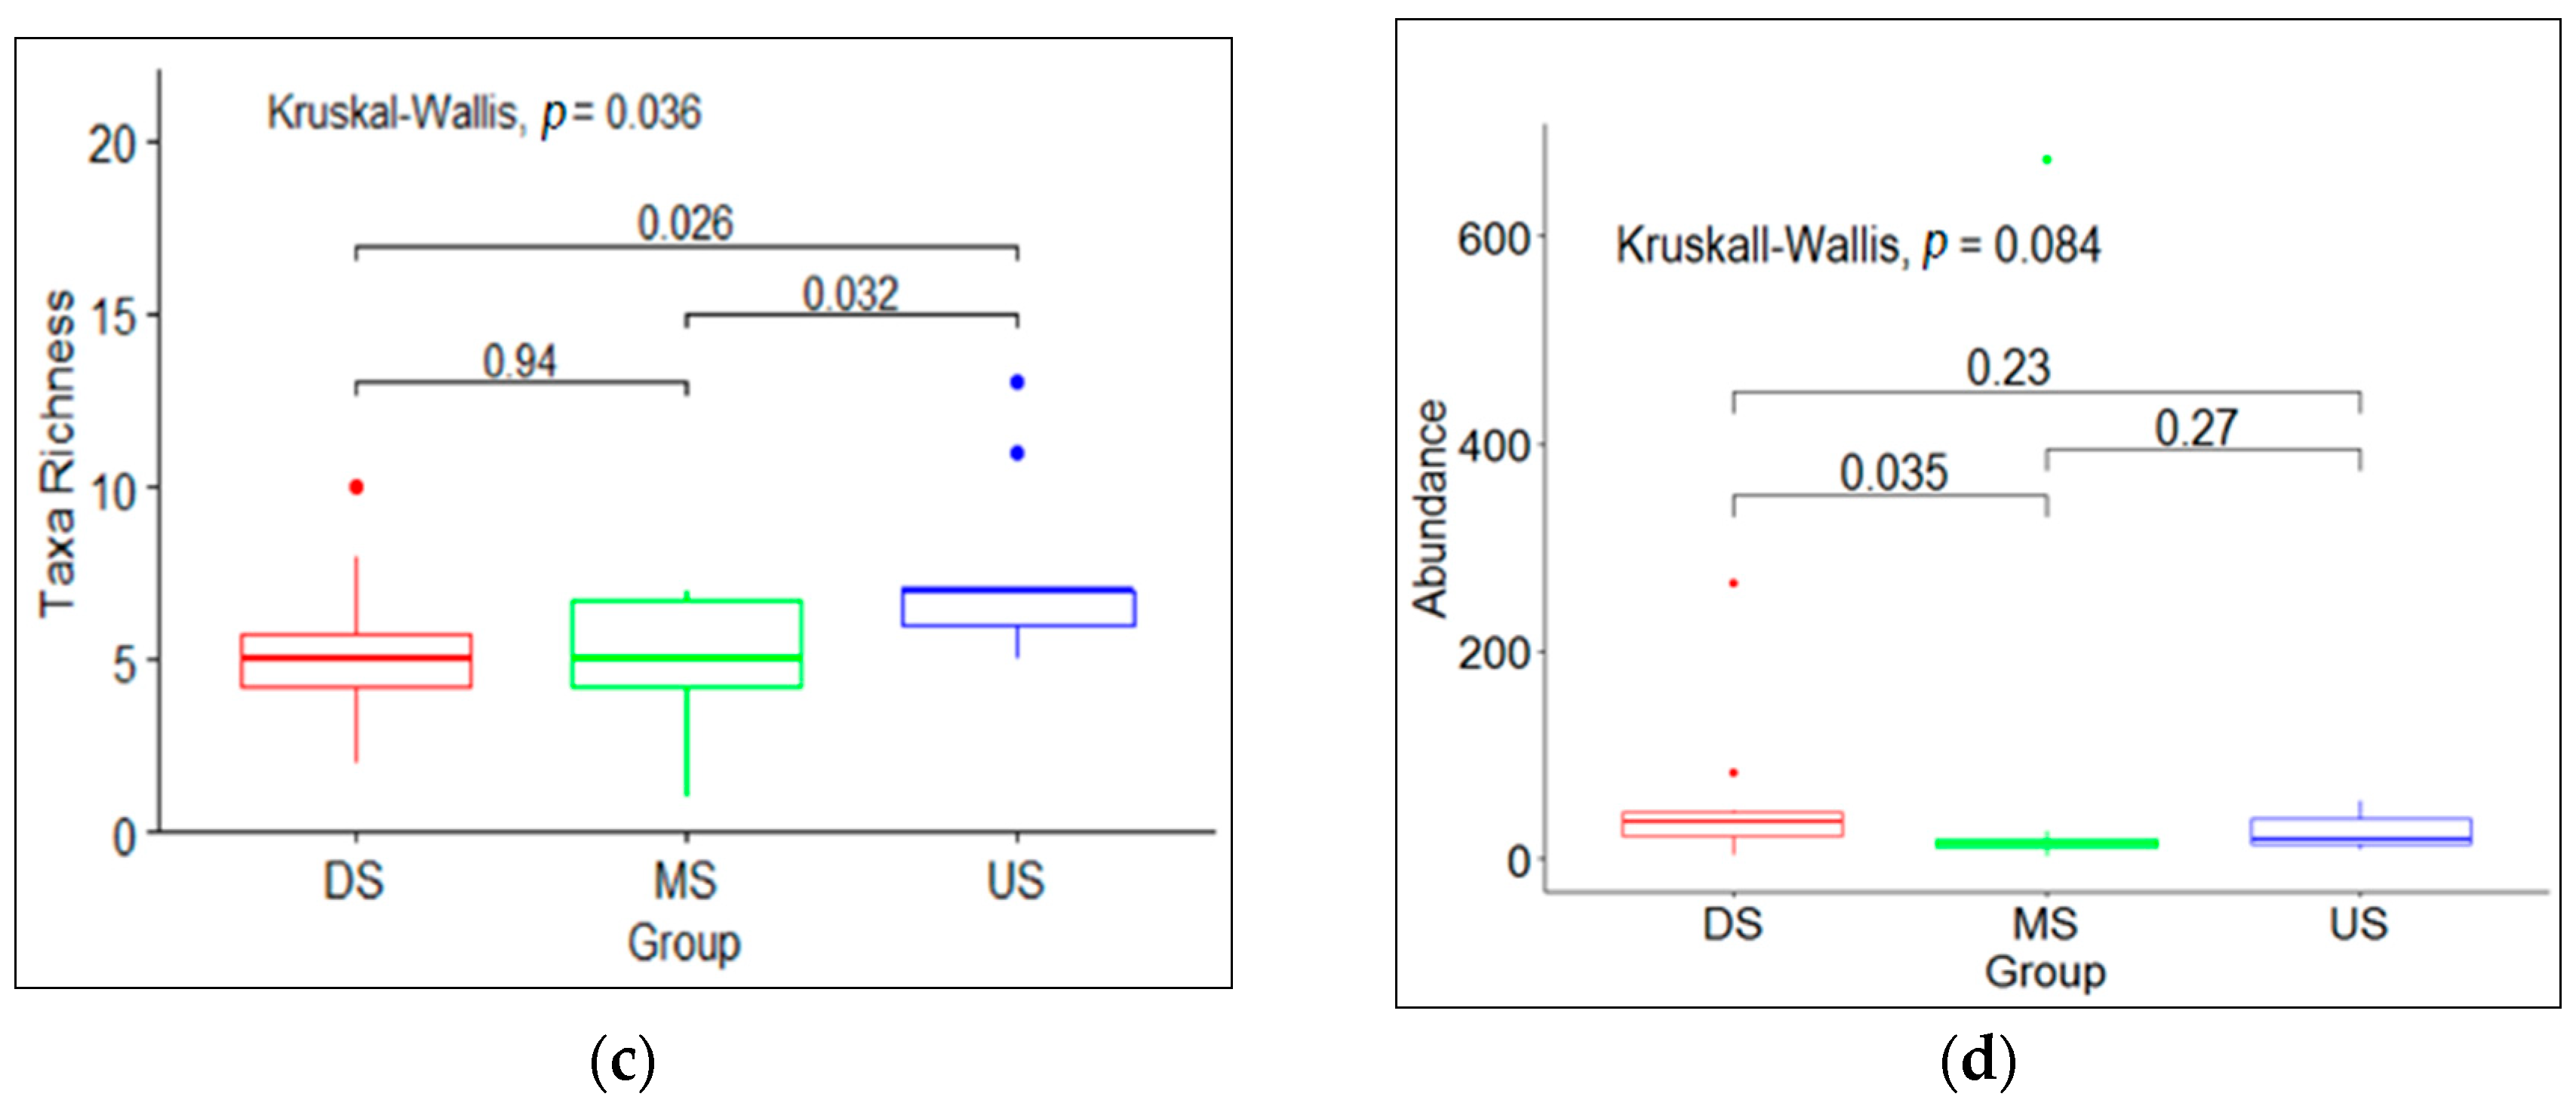
3.1. Macroinvertebrate Community Diversity

A total of 1623 individuals were collected (see Table S3, in Supplementary Materials). We identified 44 macroinvertebrate families, of which Caenidae were the most common family with the taxon recorded at 50% of the sites. The most abundant taxa, constituting 67% of the total individuals identified, were: Simuliidae (26%), Baetidae (14%), Chironomidae (14%), and Caenidae (13%). The midstream (MS) sites had the highest total abundance (793 individuals), with downstream (DS) and upstream (US) sites having lower abundance scores (573 and 257 individuals, respectively). The US sites had the highest mean taxa richness scores (7.5 ± 2.5 SD) with DS and MS sites having lower mean taxa richness scores (5.4 ± 2.3 SD and 5.1 ± 1.9 SD, respectively) (Figure 2).
Taxa richness ranged from 2–10 taxa for DS sites, 1–7 taxa for MS sites and 5–13 taxa for US sites. The total number of families identified in the three altitude groups were 31 (US), 26 (MS), and 27 (DS). Only 14 families (32% of total families) were common among the three groups. Caenidae and Chironomidae were the most common families, while 17 families (39% of total families) were group-specific. The highest number of group-specific families was detected in US sites (9 out of 44 families, 20% of total families). The lowest number of group-specific families was detected in the MS group (4 out of 44 families, 9% of total families), which included Ecnomidae, Gerridae, Lumbricidae, and Perlidae. Taxa richness, the Simpson index, and the Pielou’s evenness diversity index values significantly differed between the three altitude groups and increased along an altitude gradient from DS sites to US sites. The post hoc Dunn’s test identified significant differences between the four diversity metrics across the altitude groups (Figure 3). The DS and US sites differed in taxa richness (p = 0.03), Pielou’s evenness (p = 0.02) (Figure 3b), and Simpson index (p = 0.005) (Figure 3a), while DS and MS sites differed in the diversity indices of the Simpson index (p = 0.045), Abundance (p = 0.035) (Figure 3d), and Pielou’s evenness (p = 0.016). The DS sites had lower scores for both the Simpson and Pielou’s evenness indices. Lastly, MS and US sites differed in taxa richness (p = 0.03) (Figure 3c).

3.2. Indicator Taxa Analysis

Multilevel pattern analysis selected 37 out of 44 families for indicator taxa site group association. As a result, 22 families were associated with only one of the three altitude groups and 15 families were associated with a combination of two altitude groups (Table 1). However, 7 families (Corduliidae, Heptageniidae, Libellulidae, Lymnaeidae, Naucoridae, Nepidae, and Teloganodidae) were not included in the analysis, as these families occurred at sites belonging to all three altitude groups. Corixidae was the only significantly associated indicator family for the DS group (stat = 0.632, p = 0.025). Dytiscidae was the indicator family for the US group (stat = 0.632, p = 0.028) whereby, stat is the association statistic of the permutational test. The specificity (A) and sensitivity (B), values of Corixidae and Dytiscidae as indicators of DS and US groups were the same; A = 1 and B = 0.4.

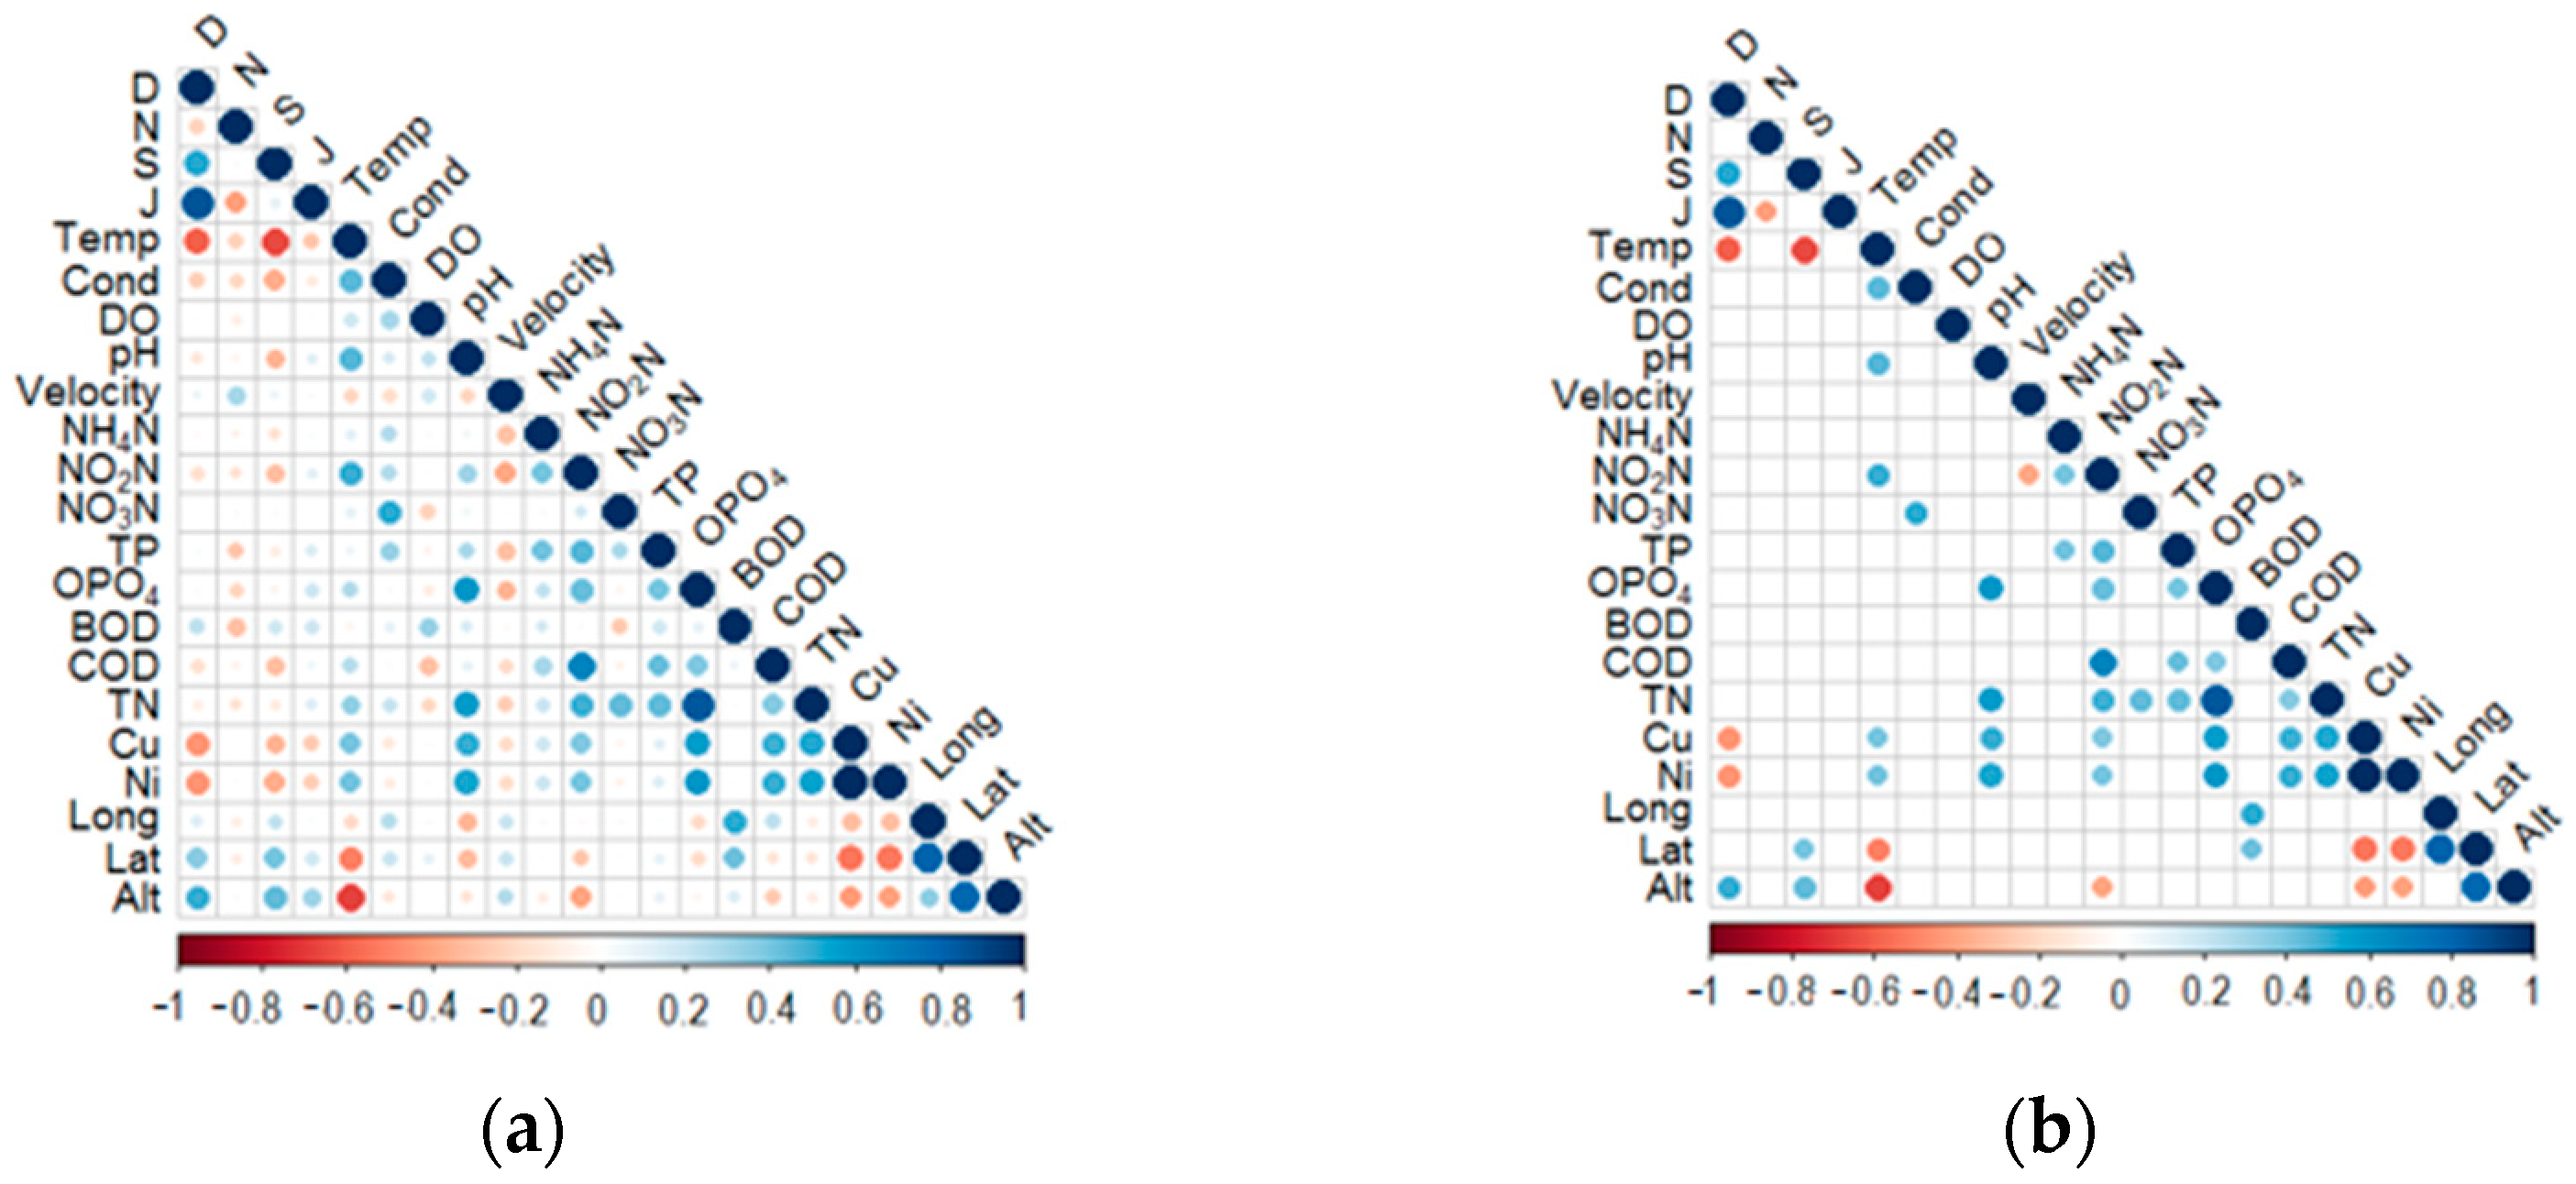
3.3. Relationships between Diversity Metrics and Environmental Variables

The relationships between all the diversity metrics, geographical and physicochemical variables are illustrated in the correlogram (Figure 4a). Significant correlations (p < 0.05) are illustrated in the second correlogram (Figure 4b). Altitude was strongly negatively correlated with temperature and nitrite (r = −0.67, p < 0.01 and r = 0.40, p < 0.05), and positively correlated with latitude (r = 0.79, p < 0.01) and diversity metrics: Simpson index (D) (r = 0.46, p < 0.01); taxa richness (S) (r = 0.44, p < 0.01). Temperature was positively correlated with copper (p < 0.05); nickel (p < 0.01); pH (p < 0.05) and nitrite (p < 0.01). Temperature negatively correlated with latitude and diversity indices of Simpson index (D) and taxa richness (S) (p < 0.01).

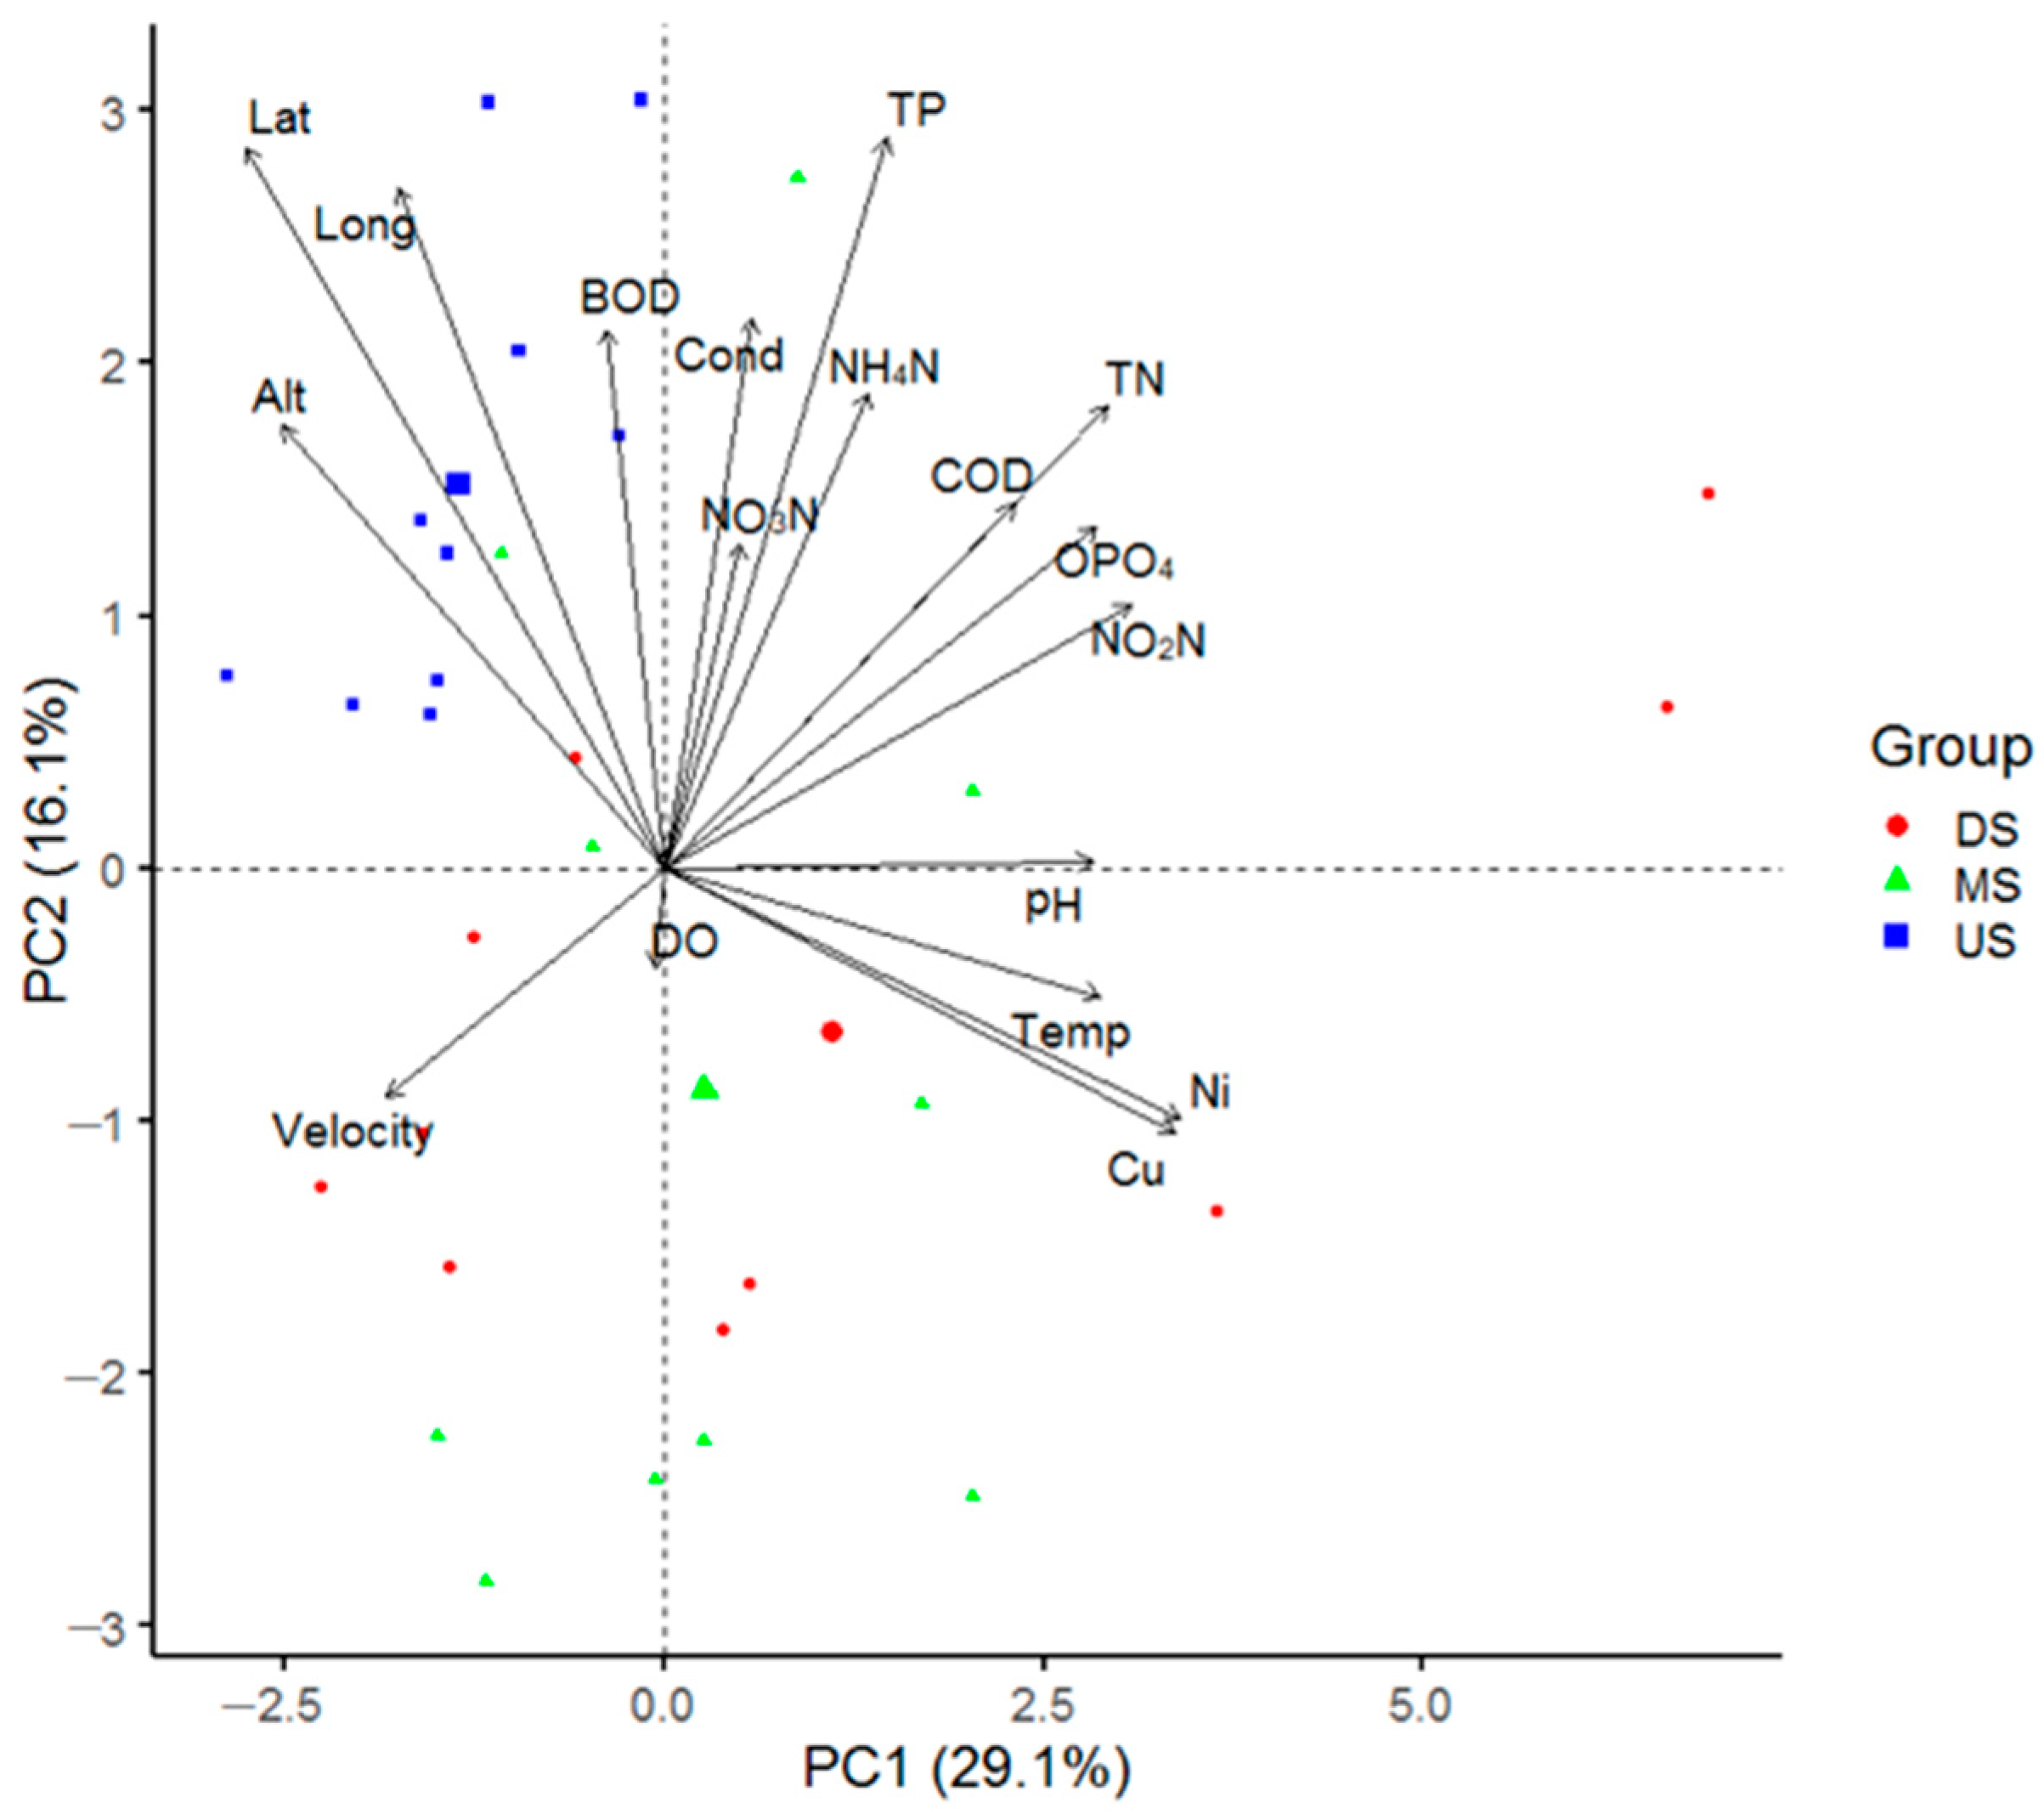
3.4. Principle Component Analysis (PCA) Ordination

The first three principle components explained approximately 55% of the variation (see Table S2, in Supplementary Materials). The physicochemical variables nickel, copper, total nitrogen, temperature, orthophosphate, COD, and pH were positively correlated (r > 0.5) while the geographical variables latitude, altitude, and longitude were negatively correlated on the first principal component dimension (PC 1) (see Table S2, in Supplementary Materials).
The first PCA axis (29.1%) (Figure 5) was mainly associated with the variables nickel, copper, nitrite, orthophosphate, and temperature. The second PCA axis (16.1%) (Figure 5) was mainly associated with two geographical variables (longitude and latitude) and three physicochemical variables (total phosphorus, BOD, and conductivity). Overall, the PCA biplot revealed temperature, nickel and geographical (latitude and longitude) gradients along the sites. The main variables that contributed most to the total variance in the first six principal components were latitude, longitude, total nitrogen, nickel, and conductivity (see Figure S1, in Supplementary Materials).

3.5. Selection of Variables (Predictors) for Macroinvertebrate Community Diversity

The LASSO regression analyses applied on the 18 variables, selected five site-specific environmental variables namely temperature, nickel, conductivity, longitude, and total phosphorus as the strongest predictors for macroinvertebrate community taxa richness. For the total taxa richness in all sites, the two significant (p < 0.05) non-zero coefficient predictors were temperature (−0.269) and nickel (−1.733), while the significant coefficient predictors for taxa richness in the three altitude groups are displayed in Table 2. The taxa abundance had three site-specific environmental predictors in the DS and MS groups. The two predictors for the DS sites were nitrate nitrogen (45) and latitude (2255.65); while temperature (−7.851) was the single predictor of taxa abundance in the MS group.

4. Discussion

4.1. Influence of Geographical Variables on Macroinvertebrate Diversity

In this study, we assessed a selection of physicochemical and geographical variables influencing Rwenzori macroinvertebrate communities at sites that had varying anthropogenic stress levels. Our study findings revealed temperature, latitude, and altitude to be key drivers of macroinvertebrate assemblages and diversity patterns. Our results were consistent with previous studies in the Ecuadorian Andes [42], Brazilian highlands [87], Tibetan highlands [88], and European mountains [89] which also found altitude, latitude, and temperature to influence macroinvertebrate communities and diversity patterns.
We found spatial structuring to be a key driver of macroinvertebrate community assemblages, as highlighted by the ordination analysis. Sites were structured along geographical gradients of altitude and latitude. Macroinvertebrate communities exhibited varying levels of spatial variation among the sites, possibly demonstrating the macroinvertebrate community responses to different proportions of environmental variation in the study area [90,91]. Our results indicated that latitude contributed most to the variability of the sites, and this was further confirmed by the least absolute shrinkage and selection operator (LASSO)regression that found latitude as a positive predictor for taxa abundance in DS sites. Our findings were supported by a prior study in Artic-alpine boreal headwater streams, that showed latitude as the best predictor of variation in macroinvertebrate assemblages [92,93]. The Artic-alpine boreal study also revealed that the distribution of aquatic ectothermic macroinvertebrates is greatly controlled by stream water temperature and that the latitudinal patterns observed in macroinvertebrate assemblages are additionally underscored by geographical gradients of altitude and ecoregion in stream environmental conditions. The LASSO regression revealed that longitude influenced taxa richness in US sites [48].
The environmentally heterogeneous sites were structured and separated along a latitudinal gradient in the Rwenzori region. The pattern of decreasing macroinvertebrate taxa richness along a decreasing latitudinal gradient (0.66 to 0.01 decimal units) was linked to the variation in the Rwenzori climatic conditions. All the DS are characterized by a tropical savannah climate and are located at lower latitudes close to the equator in the leeward section of the Rwenzori mountains and had the lowest taxa richness score. Latitude and topography also affected the temperature in the Rwenzori sites, as regions that were close to the equator and had low altitudes received the most solar radiation. The seasonal movements of the Inter Tropical Convergence Zone influences rainfall by shifting the wind patterns [64,94,95]. As we sampled sites located in both the leeward and windward sides of the Rwenzori mountain ranges, there was spatial variation in macroinvertebrate taxa composition and environmental characteristics among the different site groups.
Zonal studies in the Andes [96] linked to both altitude and latitude, showed that temperature mainly influences the taxa richness and structure of macroinvertebrate communities and further revealed that taxa richness was linearly related to water temperature, with macroinvertebrate diversity increasing with rising temperature as was observed with taxa abundance that increased from 257 individuals in the low temperature US group to 793 individuals in MS group. Increased water temperatures have been associated with changes in macroinvertebrate community structure, generalist shifts along the river continuum, and reduced resilience of community states [97]. In our study, altitude was negatively correlated with temperature and this was in agreement with previous studies in both glacier and non-glacier fed rivers, which indicated that altitude has a negative relationship with stream water temperature and the dissolved oxygen content [98,99,100]. The atmospheric pressure and oxygen partial pressure decrease with increasing altitude eventually leading to a decrease in the dissolved oxygen content [101]. Numerous studies have considered the influence of dissolved oxygen availability on the behavior, growth, energetics, and overall survival of aquatic macroinvertebrates. They revealed a dramatic variation in hypoxia tolerance among taxa and thus demonstrating a close association between dissolved oxygen availability and the presence or absence of particular macroinvertebrate taxa within a community [102]. For example, Simuliidae tend to be present in fast flowing well oxygenated waters [103], and our results were consistent with this general habitat association of the family as Simuliidae were the most abundant taxon. Altitude influenced the macroinvertebrate assemblages as it was significantly positively correlated with the diversity indexes of taxa richness, Pielou’s evenness, and Simpson index. Taxa richness significantly differed between the three site groups, while the taxa abundance significantly differed between the DS and MS site groups. Out of the three altitude groups, US sites had the highest taxa richness score and this contradicted earlier studies in high altitude streams in northern Ecuador [101,104,105] and the Himalayas [106]. Their findings indicated that the decrease in taxa richness with increasing altitude was due to a decrease in the dissolved oxygen saturation and they further concluded that low oxygen availability could limit aquatic biodiversity at high altitudes. The differing findings from our study, could be attributed to the different ecoregions in Himalayan and Ecuadorian montane regions. Furthermore, we studied sites at altitudes less than 2000 m.a.s.l. where the climatic and environmental conditions are less harsh.

4.2. Indicator Families and Macroinvertebrate Diversity

Indicator value analysis ascertained the altitude site group preferences of the macroinvertebrate families. The analysis revealed that Corixidae was the only family that was significantly associated with DS sites which were mainly characterized by low velocity streams. Our findings are supported by previous studies, that indicated low velocity streams are the preferred habitat for Corixidae in Africa and North America [107,108]. Dytiscidae, another taxon found in our study, was significantly associated with US sites which are characterized by high velocity streams and rivers. An earlier study in the Iberian peninsula supported our finding and revealed that certain species of Dytiscidae are confined to mountainous regions and high velocity streams [109]. Dytiscidae are the most diverse water beetle family and are highly adapted for aquatic life [110], by having enlarged prothoracic and elytra edges, an ideal shape for good swimming in high water velocity environments [111,112,113].

4.3. Physicochemical Variables Influence on Macroinvertebrate Diversity

Regression analysis indicated that the two site-specific local environmental variables, temperature and nickel, were key in structuring the overall taxa richness. Nickel was identified as a key variable shaping the macroinvertebrate communities along a mineral gradient, as some of the MS and DS sites were located along the copper belt of western Uganda [114]. The Kilembe mines area has several old copper piles that leach into the water system [23,114,115]. These mines have deposits of copper-nickel ore and the mine drainage water contains copper and nickel ions that leach into the water system and this negatively influences the physiological function of macroinvertebrate taxa and are toxic at high concentrations. The concentrations of copper and nickel were highest at sites from DS and MS groups and this was due to the stream water velocity as well as the weathering action of the copper mine tailings causing increased concentrations of copper and nickel at these sites in comparison to the US sites which recorded extremely low nickel concentrations. The negative impact of heavy metals on macroinvertebrate assemblages was supported by studies performed in high altitude streams revealing the sensitivity of macroinvertebrates to metal concentrations [116,117,118]. Acid mine drainage reduces taxa diversity in aquatic ecosystems through both acute and chronic mechanisms, including the toxicity of metals in stream water and sediment [119,120,121,122]. In the Danube delta, an overload of copper, nickel, and zinc has been shown to have inhibitory effects on the development of molluscs and gastropods [123]. The metallic compounds were found to disrupt the oxygen level, byssus (attachment fibers) formation, reproductive processes, and the overall mollusc development. The lethal effects of these metals in aquatic organisms is related to the inhibition of enzymes involved in cellular respiration [123].
Temperature is of prime importance to the living conditions of aquatic fauna with the thermal tolerance limits playing a vital role in reducing macroinvertebrate community diversity, along with various ecological variables of topography and climate, which may thus explain the temperature dependent patterns of taxa richness in our study [124,125,126]. Water temperature was a strong predictor of macroinvertebrate taxa richness. This was in agreement with earlier studies in high-altitude Ugandan rainforest streams [59] revealing that forested habitats that had low stream temperature, were dominated by pollution sensitive macroinvertebrate families such as Ephemeroptera, Plecoptera, Trichoptera, and Odonata (EPTO). These EPTO families require habitats with higher dissolved oxygen, low levels of turbidity, a neutral pH, and cool water temperature, therefore making them more susceptible to physicochemical changes caused by water pollution. The sites that were characterized by both high stream temperature and human impact were dominated by tolerant taxa such as Hemiptera, Coleoptera, and Diptera.
Previous studies in glacier-fed rivers and streams have revealed that glacial meltwater influences environmental variables of conductivity and temperature [32,127,128]. In our study, the positive correlation between conductivity and temperature can also be attributed to higher glacial contributions to streamflow resulting in lower conductivity levels. The influence of conductivity on macroinvertebrate diversity is in agreement with our previous study in the Rwenzori region [11] as the LASSO regression analysis that revealed conductivity to be a key predictor for taxa richness in the US and DS site groups. Water temperature is lowered with heightened glacial contributions, and varying amounts of glacial melt inputs received by different sites thus cause conductivity and temperature to differ among the sites. The study revealed positive correlations between pH, copper, and temperature, which is supported by other previous studies of copper in water which showed that temperature and pH were the key variables influencing copper concentrations in surface water [129]. Furthermore, this pattern is seemingly driven by the area catchment geology as revealed by the positive correlations between pH, copper, and temperature as previous studies revealed that the catchment geology, anthropogenic activities, and geographic location influence the variability of copper in surface waters [130,131]. In our study, the DS group sites that had high concentrations of copper were also characterized by high anthropogenic disturbance levels and were located downstream of the Kilembe copper mines, however, we did not include catchment geology in our study. Future research should include catchment geology as our study area is located in a mining region with heightened weathering of the Kilembe mine tailings and rocks which contribute to metal concentrations in the surface water [17,114].
Family abundance was highest in MS sites, as the majority of the sites were mainly characterized by moderate and low levels of anthropogenic disturbance as explained by the intermediate disturbance hypothesis. However, the marked decrease in taxa abundance at a few DS sites contrasted with previous studies on alpine aquatic systems, which revealed that taxa abundance increased with distance from the source [132]. A reduction in the abundance could be attributed to the toxicity exerted by total phosphorus [133,134,135], nitrate nitrogen, and nitrite nitrogen on macroinvertebrates [136]. Our observed study pattern is also related to the medium to high levels of anthropogenic disturbance at the majority of the DS sites. This has been demonstrated by earlier studies in Gabonese streams that revealed an inverse relationship between anthropogenic disturbance and arthropod abundance [137]. The low family abundance in US sites was in agreement with earlier tropical alpine studies [138,139] that showed that macroinvertebrate abundance decreased with altitude. However, the low taxa abundance can also be attributed to the high and moderate levels of anthropogenic disturbance from mining, urbanization, and water abstraction at these sites, which were similar to the activities in our study. The majority of US sites are currently facing the anthropogenic pressures of human activities, agriculture, and water abstraction [11], and previous studies have demonstrated linkages to anthropogenic pressures in other tropical high altitude streams contributing to a decreasing macroinvertebrate abundance [99]. In the tropics, human settlements, agriculture, and other anthropogenic activities can extend to relatively high altitudes because of the benign climate, as is the case in our study region whereby the main human activities take place between 900 to 2000 m.a.s.l. In turn, these tropical high-altitude streams can be affected by organic pollution, agrochemicals, sedimentation, and mining wastes. This will eventually have a negative effect on the aquatic ecosystem diversity as sensitive taxa will drastically decrease due to the aforementioned threats.
Macroinvertebrate community diversity is presumed to increase as glaciers retreat, due to upstream taxa migration as a result of increased water temperature and higher channel stability caused by reducing glacial influence [32,34,127,140]. More research is needed to better understand the macroinvertebrate community responses to declining glacial meltwater contributions in the Rwenzori aquatic ecosystems across a wider spatial and temporal scale. In future studies, incorporating the glaciality index (computed as a function of glacier area and distance from the glacier), in addition to the mineral and temperature gradients, is necessary to clarify the relative impact of the factors on macroinvertebrate biodiversity.

4.4. Future Research and Implementation of Insights in Management

Based on our sample size using both categorical and continuous analyses, it was possible to link the macroinvertebrate community diversity to the environmental drivers for the three altitude groups thereby adding to the existing knowledge of the Rwenzori region. Our findings indicate that family-level monitoring of key indicator taxa along with measurements of temperature and copper-nickel concentrations can be effectively used to assess river health in these unique Rwenzori aquatic ecosystems. The categorical analysis provided clear indications as to which variables were important, reduced complexity of the analysis and interpretation of results. Based on our study, biomonitoring and conservation programs would benefit from spatial stratification according to different climatic zones and altitude ranges where land use activities are conducted. This would guarantee that (a) the monitoring and conservation programmes of the Rwenzori aquatic systems are conducted in an ecologically systematic and meaningful way, and that (b) predictive models for river bioassessment are more robust and accurate than those generated from larger and more heterogeneous areas. This could enable cost effective regular monitoring by water resources stakeholders to mitigate water pollution and sustainably manage the aquatic ecosystems in the region. As macroinvertebrate assemblages are strongly driven by both temperature and mineral gradients, these unique equatorial alpine ecosystems can be expected to shift in taxa composition and distributions, as they respond profoundly to climate change induced glacial retreat and other anthropogenic activities [141,142,143].

5. Conclusions

In our study, we investigated the environmental drivers of macroinvertebrate diversity in Rwenzori region. Both geographical and physicochemical variables influenced the overall macroinvertebrate diversity in the Rwenzori region. In spite of the contribution of anthropogenic and natural stressors, the outcomes of this field study highlighted the significance of these stressors in determining macroinvertebrate diversity in the Rwenzori region. Family richness responded to physicochemical variables tested in the study, revealing temperature and nickel as important predictors of macroinvertebrate community diversity. Our findings at family level indicate characteristic patterns of structural variability in faunal univariate diversity metrics between the US, MS, and DS altitude groups, and thus definitive results have been determined in the context of drivers of macroinvertebrate diversity. We determined that in studied sites with similar climate and altitude, the macroinvertebrate community responds differently depending on site-specific environmental characteristics. The study findings indicate that in future biomonitoring programmes, indicator taxa, site-specific environmental variables are important and should be taken into account given the intricacy of generalizing categorical responses, along the altitude site groups. Thus, site-specific environmental variables are integral when carrying out conservation and restoration programmes in these alpine rivers. On a practical level, there are important protocols that can be deduced from this study, which can be immediately applied to assess river health and key drivers of macroinvertebrate community in sub-Saharan equatorial alpine rivers.

Supplementary Materials

The following are available online at https://www.mdpi.com/2073-4441/12/6/1668/s1.

Author Contributions

P.S.L.M. formulated the concept and prepared the original draft. K.L. analysed the biological data. P.B. and P.L.M.G. supervised, edited and reviewed the article. All authors have read and agreed to the published version of the manuscript.

Funding

This research was funded by Schlumberger Foundation, Faculty of Future Fellowship, grant year 2016/2017.

Acknowledgments

This research was undertaken with permission of Uganda National Council of Science and Technology (UNCST permit NS433) and Uganda Wildlife Authority permit (permit UWA/FOD/33/02). We thank the Schlumberger Faculty of Future Fellowship for provision of financial support through 2016/2017 grant. We give special thanks to Makerere University- school of Food technology and Bioengineering (Kampala-Uganda), Uganda National Fisheries Research Institute (Jinja) and Ugandan field staff who provided assistance with the field data collection equipment and Laboratory.

Conflicts of Interest

The authors declare no conflict of interest.

References

  1. Wittebolle, L.; Marzorati, M.; Clement, L.; Balloi, A.; Daffonchio, D.; Heylen, K.; De Vos, P.; Verstraete, W.; Boon, N. Initial community evenness favours functionality under selective stress. Nature 2009, 458, 623. [Google Scholar] [CrossRef] [PubMed]
  2. Vörösmarty, C.J.; McIntyre, P.B.; Gessner, M.O.; Dudgeon, D.; Prusevich, A.; Green, P.; Glidden, S.; Bunn, S.E.; Sullivan, C.A.; Liermann, C.R. Global threats to human water security and river biodiversity. Nature 2010, 467, 555–561. [Google Scholar] [CrossRef] [PubMed]
  3. Collen, B.; Whitton, F.; Dyer, E.E.; Baillie, J.E.M.; Cumberlidge, N.; Darwall, W.R.T.; Pollock, C.; Richman, N.I.; Soulsby, A.M.; Böhm, M. Global patterns of freshwater species diversity, threat and endemism. Glob. Ecol. Biogeogr. 2014, 23, 40–51. [Google Scholar] [CrossRef] [PubMed] [Green Version]
  4. Omann, I.; Stocker, A.; Jäger, J. Climate change as a threat to biodiversity: An application of the dpsir approach. Ecol. Econ. 2009, 69, 24–31. [Google Scholar] [CrossRef]
  5. Midgley, G.; Hannah, L.; Millar, D.; Rutherford, M.; Powrie, L. Assessing the vulnerability of species richness to anthropogenic climate change in a biodiversity hotspot. Glob. Ecol. Biogeogr. 2002, 11, 445–451. [Google Scholar] [CrossRef]
  6. Plumptre, A.J.; Davenport, T.R.; Behangana, M.; Kityo, R.; Eilu, G.; Ssegawa, P.; Ewango, C.; Meirte, D.; Kahindo, C.; Herremans, M. The biodiversity of the albertine rift. Biol. Conserv. 2007, 134, 178–194. [Google Scholar] [CrossRef]
  7. Burgess, N.D.; Balmford, A.; Cordeiro, N.J.; Fjeldså, J.; Küper, W.; Rahbek, C.; Sanderson, E.W.; Scharlemann, J.P.; Sommer, J.H.; Williams, P.H. Correlations among species distributions, human density and human infrastructure across the high biodiversity tropical mountains of africa. Biol. Conserv. 2007, 134, 164–177. [Google Scholar] [CrossRef]
  8. Aynekulu, E.; Aerts, R.; Moonen, P.; Denich, M.; Gebrehiwot, K.; Vågen, T.-G.; Mekuria, W.; Boehmer, H.J. Altitudinal variation and conservation priorities of vegetation along the great rift valley escarpment, northern ethiopia. Biodivers. Conserv. 2012, 21, 2691–2707. [Google Scholar] [CrossRef]
  9. Roller, S.; Hornung, J.; Hinderer, M.; Ssemmanda, I. Middle miocene to pleistocene sedimentary record of rift evolution in the southern albert rift (uganda). Int. J. Earth Sci. 2010, 99, 1643–1661. [Google Scholar] [CrossRef]
  10. Xue, L.; Gani, N.D.; Abdelsalam, M.G. Geomorphologic proxies for bedrock rivers: A case study from the rwenzori mountains, east african rift system. Geomorphology 2017, 285, 374–398. [Google Scholar] [CrossRef]
  11. Musonge, P.S.; Boets, P.; Lock, K.; Ambarita, N.M.D.; Forio, M.A.E.; Verschuren, D.; Goethals, P.L. Baseline assessment of benthic macroinvertebrate community structure and ecological water quality in rwenzori rivers (albertine rift valley, uganda) using biotic-index tools. Limnologica 2019, 75, 1–10. [Google Scholar] [CrossRef]
  12. Orlove, B.; Wiegandt, E.; Luckman, B.H. The Place of Glaciers in Natural and Cultural Landscapes; University of California Press: Berkeley, CA, USA, 2008; pp. 3–19. [Google Scholar]
  13. Olson, D.M.; Dinerstein, E. The global 200: Priority ecoregions for global conservation. Ann. Mo. Bot. Gard. 2002, 89, 199–224. [Google Scholar] [CrossRef]
  14. Russell, J.M.; Johnson, T.C.; Kelts, K.R.; Lærdal, T.; Talbot, M.R. An 11 000-year lithostratigraphic and paleohydrologic record from equatorial africa: Lake edward, uganda–congo. Palaeogeogr. Palaeoclim. Palaeoecol. 2003, 193, 25–49. [Google Scholar] [CrossRef]
  15. Eggermont, H.; Van Damme, K.; Russell, J.M. Rwenzori mountains (mountains of the moon): Headwaters of the white nile. In The Nile; Springer: Berlin/Heidelberg, Germany, 2009; pp. 243–261. [Google Scholar]
  16. Natamba, L.; Weihua, Z.; Sissoko, F. Fertilizer application and non-point source pollution problems between Uganda and China-review. Adv. Soc. Sci. Res. J. 2016, 3, 133–146. [Google Scholar]
  17. Abraham, M.R.; Susan, T.B. Water contamination with heavy metals and trace elements from kilembe copper mine and tailing sites in western uganda; implications for domestic water quality. Chemosphere 2017, 169, 281–287. [Google Scholar] [CrossRef] [PubMed]
  18. Darwall, W.; Smith, K.; Allen, D.; Holland, R.; Harrison, I.; Brooks, E. The Diversity of Life in African Freshwaters: Underwater, Under Threat: An Analysis of the Status and Distribution of Freshwater Species Throughout Mainland Africa; The World Conservation Union (IUCN): Gland, Switzerland, 2011; Available online: http://cmsdata.iucn.org/downloads/iucn_africa_freshwaters_2011.pdf (accessed on 10 June 2020).
  19. Edwards, D.P.; Sloan, S.; Weng, L.; Dirks, P.; Sayer, J.; Laurance, W.F. Mining and the african environment. Conserv. Lett. 2014, 7, 302–311. [Google Scholar] [CrossRef]
  20. Smith, H. The Overlap between Conservation and Development Organisations in the Albertine Rift, Western Uganda; The Poverty and Conservation Learning Group Discussion Paper; International Institute for Environment and Development (IIED): London, UK, 2012. [Google Scholar]
  21. Tumusiime, D.M.; Mawejje, J.; Byakagaba, P. Discovery of oil: Community perceptions and expectations in uganda’s albertine region. J. Sustain. Dev. 2016, 9, 1. [Google Scholar] [CrossRef]
  22. Muwanga, A. Environmental Impacts of Copper Mining at Kilembe, Uganda: A Geochemical Investigation of Heavy Metal Pollution of Drainage Waters, Stream Sediments, and Soils in the Kilembe Valley in Relation to Mine Waste Disposal; Inst. für Geowiss. der Techn. Univ: Braunschweig, Germany, 1997. [Google Scholar]
  23. Denny, P.; Bailey, R.; Tukahirwa, E.; Mafabi, P. Heavy metal contamination of lake george (uganda) and its wetlands. Hydrobiologia 1995, 297, 229–239. [Google Scholar] [CrossRef]
  24. Hare, L. Aquatic insects and trace metals: Bioavailability, bioaccumulation, and toxicity. Crit. Rev. Toxicol. 1992, 22, 327–369. [Google Scholar] [CrossRef] [PubMed]
  25. Goretti, E.; Pallottini, M.; Pagliarini, S.; Catasti, M.; La Porta, G.; Selvaggi, R.; Gaino, E.; Di Giulio, A.M.; Ali, A. Use of larval morphological deformities in chironomus plumosus (chironomidae: Diptera) as an indicator of freshwater environmental contamination (Lake Trasimeno, Italy). Water 2020, 12, 1. [Google Scholar] [CrossRef] [Green Version]
  26. Bozanic, M.; Markovic, Z.; Zivic, M.; Dojčinović, B.; Perić, A.; Stankovic, M.; Zivic, I. Mouthpart deformities of chironomus plumosus larvae caused by increased concentrations of copper in sediment from carp fish pond. Turk. J. Fish. Aquat. Sci. 2019, 19, 251–259. [Google Scholar] [CrossRef]
  27. McClanahan, Y.; McClanahan, S.C.Z.T. East. African Ecosystems and Their Conservation; Oxford University Press: New York, NY, USA, 1996. [Google Scholar]
  28. Taylor, R.G.; Mileham, L.; Tindimugaya, C.; Majugu, A.; Muwanga, A.; Nakileza, B. Recent glacial recession in the rwenzori mountains of east africa due to rising air temperature. Geophys. Res. Lett. 2006, 33. [Google Scholar] [CrossRef] [Green Version]
  29. Mölg, T.; Georges, C.; Kaser, G. The contribution of increased incoming shortwave radiation to the retreat of the rwenzori glaciers, east africa, during the 20th century. Int. J. Clim. 2003, 23, 291–303. [Google Scholar] [CrossRef]
  30. Taylor, R.G.; Mileham, L.; Tindimugaya, C.; Mwebembezi, L. Recent glacial recession and its impact on alpine riverflow in the rwenzori mountains of uganda. J. Afr. Earth Sci. 2009, 55, 205–213. [Google Scholar] [CrossRef]
  31. Maiolini, B.; Lencioni, V. Longitudinal distribution of macroinvertebrate assemblages in a glacially influenced stream system in the italian alps. Freshw. Biol. 2001, 46, 1625–1639. [Google Scholar] [CrossRef]
  32. Brown, L.E.; Hannah, D.M.; Milner, A.M. Vulnerability of alpine stream biodiversity to shrinking glaciers and snowpacks. Glob. Chang. Biol. 2007, 13, 958–966. [Google Scholar] [CrossRef]
  33. Milner, A.M.; Brown, L.E.; Hannah, D.M. Hydroecological response of river systems to shrinking glaciers. Hydrol. Process. 2009, 23, 62–77. [Google Scholar] [CrossRef]
  34. Finn, D.S.; Raesaenen, K.; Robinson, C.T. Physical and biological changes to a lengthening stream gradient following a decade of rapid glacial recession. Glob. Chang. Biol. 2010, 16, 3314–3326. [Google Scholar] [CrossRef]
  35. Dallas, H.F.; Rivers-Moore, N.A. Critical thermal maxima of aquatic macroinvertebrates: Towards identifying bioindicators of thermal alteration. Hydrobiologia 2012, 679, 61–76. [Google Scholar] [CrossRef]
  36. Stewart, B.A.; Close, P.G.; Cook, P.A.; Davies, P.M. Upper thermal tolerances of key taxonomic groups of stream invertebrates. Hydrobiologia 2013, 718, 131–140. [Google Scholar] [CrossRef]
  37. Cadbury, S.; Hannah, D.; Milner, A.; Pearson, C.; Brown, L. Stream temperature dynamics within a new zealand glacierized river basin. River Res. Appl. 2008, 24, 68–89. [Google Scholar] [CrossRef]
  38. Scotti, A.; Jacobsen, D.; Tappeiner, U.; Bottarin, R. Spatial and temporal variation of benthic macroinvertebrate assemblages during the glacial melt season in an italian glacier-fed stream. Hydrobiologia 2019, 827, 123–139. [Google Scholar] [CrossRef] [Green Version]
  39. Docherty, C.; Hannah, D.; Riis, T.; Leth, S.R.; Milner, A.M. Longitudinal distribution of macroinvertebrates in snowmelt streams in northeast greenland: Understanding biophysical controls. Polar Biol. 2018, 41, 1567–1580. [Google Scholar] [CrossRef] [PubMed] [Green Version]
  40. Kock Laursen, S.; Hamerlik, L.; Moltesen, K.; Seestern Christoffersen, K.; Jacobsen, D. Diversity and composition of macroinvertebrate assemblages in high-altitude tibetan streams. Inland Waters 2015, 5, 263–274. [Google Scholar] [CrossRef]
  41. Cauvy-Fraunié, S.; Espinosa, R.; Andino, P.; Jacobsen, D.; Dangles, O. Invertebrate metacommunity structure and dynamics in an andean glacial stream network facing climate change. PLoS ONE 2015, 10, e0136793. [Google Scholar] [CrossRef] [PubMed] [Green Version]
  42. Kuhn, J.; Andino, P.; Calvez, R.; Espinosa, R.; Hamerlik, L.; Vie, S.; Dangles, O.; Jacobsen, D. Spatial variability in macroinvertebrate assemblages along and among neighbouring equatorial glacier-fed streams. Freshw. Biol. 2011, 56, 2226–2244. [Google Scholar] [CrossRef]
  43. Snook, D.L.; Milner, A.M. The influence of glacial runoff on stream macroinvertebrate communities in the taillon catchment, french pyrénées. Freshw. Biol. 2001, 46, 1609–1623. [Google Scholar] [CrossRef]
  44. Milner, A.M.; Brittain, J.E.; Castella, E.; Petts, G.E. Trends of macroinvertebrate community structure in glacier-fed rivers in relation to environmental conditions: A synthesis. Freshw. Biol. 2001, 46, 1833–1847. [Google Scholar] [CrossRef]
  45. Brown, L.E.; Milner, A.M.; Hannah, D.M. Groundwater influence on alpine stream ecosystems. Freshw. Biol. 2007, 52, 878–890. [Google Scholar] [CrossRef]
  46. Fjellheim, A.; Raddum, G.G. Growth and voltinism in the aquatic insects of a regulated river subject to groundwater inflows. River Res. Appl. 2008, 24, 710–719. [Google Scholar] [CrossRef]
  47. Jacobsen, D.; Cauvy-Fraunie, S.; Andino, P.; Espinosa, R.; Cueva, D.; Dangles, O. Runoff and the longitudinal distribution of macroinvertebrates in a glacier-fed stream: Implications for the effects of global warming. Freshw. Biol. 2014, 59, 2038–2050. [Google Scholar] [CrossRef]
  48. Jacobsen, D.; Dangles, O.; Andino, P.; Espinosa, R.; Hamerlik, L.; Cadier, E. Longitudinal zonation of macroinvertebrates in an ecuadorian glacier-fed stream: Do tropical glacial systems fit the temperate model? Freshw. Biol. 2010, 55, 1234–1248. [Google Scholar] [CrossRef]
  49. Fox, J.F. Intermediate-disturbance hypothesis. Science 1979, 204, 1344–1345. [Google Scholar] [CrossRef] [PubMed] [Green Version]
  50. Townsend, C.R.; Scarsbrook, M.R.; Dolédec, S. The intermediate disturbance hypothesis, refugia, and biodiversity in streams. Limnol. Oceanogr. 1997, 42, 938–949. [Google Scholar] [CrossRef] [Green Version]
  51. Death, R. The effect of habitat stability on benthic invertebrate communities: The utility of species abundance distributions. Hydrobiologia 1996, 317, 97–107. [Google Scholar] [CrossRef]
  52. Winterbourn, M. New zealand mountain stream communities: Stable yet disturbed? In Evolutionary Ecology of Freshwater Animals; Springer: Berlin/Heidelberg, Germany, 1997; pp. 31–54. [Google Scholar]
  53. Richards, C.; Johnson, L.B.; Host, G. Landscape Influences on Habitat, Water Chemistry, and Macroinvertebrate Assemblages In Midwestern Stream Ecosystems; University of Minnesota Duluth: Duluth, MN, USA, 1993. [Google Scholar]
  54. Aghaindum, A.G.; Achuo, E.D.; Menbohan, F. Chironomid bio-ecology in an anthropisized aquatic ecosystem in yaounde (cameroon): Community diversity and relationship with the environmental variables of the water system. Entomol. Appl. Sci. Lett. 2016, 3, 196–203. [Google Scholar]
  55. Dalu, T.; Wasserman, R.J.; Tonkin, J.D.; Alexander, M.E.; Dalu, M.T.; Motitsoe, S.N.; Manungo, K.I.; Bepe, O.; Dube, T. Assessing drivers of benthic macroinvertebrate community structure in african highland streams: An exploration using multivariate analysis. Sci. Total Environ. 2017, 601, 1340–1348. [Google Scholar] [CrossRef]
  56. Múrria, C.; Bonada, N.; Vellend, M.; Zamora-Muñoz, C.; Alba-Tercedor, J.; Sainz-Cantero, C.E.; Garrido, J.; Acosta, R.; El Alami, M.; Barquín, J. Local environment rather than past climate determines community composition of mountain stream macroinvertebrates across europe. Mol. Ecol. 2017, 26, 6085–6099. [Google Scholar] [CrossRef]
  57. Nautiyal, P.; Mishra, A.S.; Verma, J.; Agrawal, A. River ecosystems of the central highland ecoregion: Spatial distribution of benthic flora and fauna in the plateau rivers (tributaries of the yamuna and ganga) in central india. Aquat. Ecosyst. Health Manag. 2017, 20, 43–58. [Google Scholar] [CrossRef]
  58. Windsor, F.; Grocott, M.; Milner, A. An inter-catchment assessment of macroinvertebrate communities across groundwater-fed streams within denali national park, interior alaska. Hydrobiologia 2017, 785, 373–384. [Google Scholar] [CrossRef]
  59. Kasangaki, A.; Chapman, L.J.; Balirwa, J. Land use and the ecology of benthic macroinvertebrate assemblages of high-altitude rainforest streams in uganda. Freshw. Biol. 2008, 53, 681–697. [Google Scholar] [CrossRef]
  60. Kasangaki, A.; Babaasa, D.; Efitre, J.; McNeilage, A.; Bitariho, R. Links between anthropogenic perturbations and benthic macroinvertebrate assemblages in afromontane forest streams in Uganda. Hydrobiologia 2006, 563, 231–245. [Google Scholar] [CrossRef]
  61. Pabire Ghandi, W.; Ndawula, L. The Diversity of Macro Invertebrates in the Victoria and Kyoga Lake Basin and Their Relationship to Ecosystem Functioning; National Fisheries Resources Research Institute: Jinja, Uganda, 2000; Available online: http://aquaticcommons.org/id/eprint/20234 (accessed on 10 June 2020).
  62. Salt, G. Insects and other invertebrate animals collected at high altitudes in the ruwenzori and on mount Kenya. Afr. J. Ecol. 1987, 25, 95–106. [Google Scholar] [CrossRef]
  63. Halls, A. Wetlands, Biodiversity and the Ramsar Convention: The Role of the Convention on Wetlands in the Conservation and Wise use of Biodiversity; Ramsar Convention Bureau: Gland, Switzerland, 1997. [Google Scholar]
  64. BakamaNume, B.B. A Contemporary Geography of Uganda. In African Books Collective; Mukuku na Nyota Publishers Ltd.: Dare salaam, Tanzania, 2010. [Google Scholar]
  65. Diem, J.E.; Hartter, J.; Ryan, S.J.; Palace, M.W. Validation of satellite rainfall products for western Uganda. J. Hydrometeorol. 2014, 15, 2030–2038. [Google Scholar] [CrossRef]
  66. Mabidi, A.; Bird, M.S.; Perissinotto, R. Distribution and diversity of aquatic macroinvertebrate assemblages in a semi-arid region earmarked for shale gas exploration (eastern cape karoo, South Africa). PLoS ONE 2017, 12, e0178559. [Google Scholar] [CrossRef] [PubMed]
  67. Lencioni, V.; Marziali, L.; Rossaro, B. Chironomids as bioindicators of environmental quality in mountain springs. Freshw. Sci. 2012, 31, 525–541. [Google Scholar] [CrossRef] [Green Version]
  68. Chapman, D.V. Water Quality Assessments: A Guide to the use of Biota, Sediments, and Water in Environmental Monitoring, 2nd ed.; Published on behalf of UNESCO; WHO and UNEP by Chapman and Hall: London, UK, 1996. [Google Scholar]
  69. Metzeling, L.; Chessman, B.; Hardwick, R.; Wong, V. Rapid assessment of rivers using macroinvertebrates: The role of experience, and comparisons with quantitative methods. Hydrobiologia 2003, 510, 39–52. [Google Scholar] [CrossRef]
  70. Lock, K.; Adriaens, T.; Goethals, P. Effect of water quality on blackflies (diptera: Simuliidae) in flanders (Belgium). Limnol. Ecol. Manag. Inland Waters 2014, 44, 58–65. [Google Scholar] [CrossRef]
  71. Damanik-Ambarita, M.N.; Everaert, G.; Forio, M.A.E.; Nguyen, T.H.T.; Lock, K.; Musonge, P.L.S.; Suhareva, N.; Dominguez-Granda, L.; Bennetsen, E.; Boets, P. Generalized linear models to identify key hydromorphological and chemical variables determining the occurrence of macroinvertebrates in the guayas river basin (Ecuador). Water 2016, 8, 297. [Google Scholar] [CrossRef] [Green Version]
  72. Gabriels, W.; Lock, K.; De Pauw, N.; Goethals, P.L.M. Multimetric macroinvertebrate index flanders (MMIF) for biological assessment of rivers and lakes in flanders (Belgium). Limnol. Ecol. Manag. Inland Waters 2010, 40, 199–207. [Google Scholar] [CrossRef] [Green Version]
  73. Nguyen, H.H.; Everaert, G.; Gabriels, W.; Hoang, T.H.; Goethals, P.L.M. A multimetric macroinvertebrate index for assessing the water quality of the cau river basin in Vietnam. Limnol. Ecol. Manag. Inland Waters 2014, 45, 16–23. [Google Scholar] [CrossRef]
  74. Ambelu, A.; Mekonen, S.; Koch, M.; Addis, T.; Boets, P.; Everaert, G.; Goethals, P. The application of predictive modelling for determining bio-environmental factors affecting the distribution of blackflies (diptera: Simuliidae) in the gilgel gibe watershed in southwest Ethiopia. PLoS ONE 2014, 9, e112221. [Google Scholar] [CrossRef] [PubMed] [Green Version]
  75. Gerber, A.; Gabriel, M.J.M. Aquatic Invertebrates of South African Rivers Field Guide; Resource Water Quality Services, Department of Water Affairs and Forestry: Pretoria, South Africa, 2002. [Google Scholar]
  76. R Core Team. R: A Language and Environment for Statistical Computing; R Foundation for Statistical Computing: Vienna, Austria, 2017; ISBN 3-900051-07-0. Available online: https://www.R-project.org (accessed on 10 June 2020).
  77. Yang, G.; He, D.; Wang, C.; Miao, Y.; Yu, H. Study on the biological oceanography characteristics of planktonic copepods in the waters north of taiwan, ii. Community characteristics. Acta Oceanol. Sin. 1999, 21, 72–80. [Google Scholar]
  78. De Cáceres, M.; Legendre, P.; Moretti, M. Improving indicator species analysis by combining groups of sites. Oikos 2010, 119, 1674–1684. [Google Scholar] [CrossRef]
  79. Hawksworth, D.L.; Bull, A.T. Marine, Freshwater, and Wetlands Biodiversity Conservation; Springer Science & Business Media: Berlin/Heidelberg, Germany, 2007; Volume 4. [Google Scholar]
  80. Dufrêne, M.; Legendre, P. Species assemblages and indicator species: The need for a flexible asymmetrical approach. Ecol. Monogr. 1997, 67, 345–366. [Google Scholar] [CrossRef]
  81. Cáceres, M.D.; Legendre, P. Associations between species and groups of sites: Indices and statistical inference. Ecology 2009, 90, 3566–3574. [Google Scholar] [CrossRef] [PubMed]
  82. Kruskal, W.H.; Wallis, W.A. Use of ranks in one-criterion variance analysis. J. Am. Stat. Assoc. 1952, 47, 583–621. [Google Scholar] [CrossRef]
  83. Husson, F.; Josse, J.; Le, S.; Mazet, J.; Husson, M.F. Package ‘factominer’. Obtenido de Multivariate Exploratory Data Analysis and Data Mining. 2018. Available online: http://cran/.r-project.org/web/packages/FactoMineR/FactoMineR (accessed on 10 June 2020).
  84. Friedman, J.; Hastie, T.; Tibshirani, R. Glmnet: Lasso and Elastic-Net Regularized Generalized Linear Models; R Package Version; Department of Statistics, Stanford University: San Francisco, CA, USA, 2009; Volume 1. [Google Scholar]
  85. Tibshirani, R. Regression shrinkage and selection via the lasso: A retrospective. J. R. Stat. Soc. Ser. B (Stat. Methodol.) 2011, 73, 273–282. [Google Scholar] [CrossRef]
  86. Tibshirani, R. Regression shrinkage and selection via the lasso. J. R. Stat. Soc. Ser. B (Methodol.) 1996, 58, 267–288. [Google Scholar] [CrossRef]
  87. Henriques-Oliveira, A.L.; Nessimian, J.L. Aquatic macroinvertebrate diversity and composition in streams along an altitudinal gradient in southeastern brazil. Biota Neotrop. 2010, 10, 115–128. [Google Scholar] [CrossRef] [Green Version]
  88. Xu, M.; Wang, Z.; Pan, B.; Yu, G. The assemblage characteristics of benthic macroinvertebrates in the yalutsangpo river, the highest major river in the world. Front. Earth Sci. 2014, 8, 351–361. [Google Scholar] [CrossRef]
  89. Fjellheim, A.; Raddum, G.G.; Vandvik, V.; Cogalniceanu, D.; Boggero, A.; Brancelj, A.; Galas, J.; Šporka, F.; Vidinova, Y.; Bitušík, P. Diversity and distribution patterns of benthic invertebrates along alpine gradients. A study of remote european freshwater lakes. Adv. Limnol. 2009, 62, 167–190. [Google Scholar]
  90. Li, J.; Herlihy, A.; Gerth, W.; Kaufmann, P.; Gregory, S.; Urquhart, S.; Larsen, D.P. Variability in stream macroinvertebrates at multiple spatial scales. Freshw. Biol. 2001, 46, 87–97. [Google Scholar] [CrossRef]
  91. Passy, S.I.; Bode, R.W.; Carlson, D.M.; Novak, M.A. Comparative environmental assessment in the studies of benthic diatom, macroinvertebrate, and fish communities. Int. Rev. Hydrobiol. A J. Cover. All Asp. Limnol. Mar. Biol. 2004, 89, 121–138. [Google Scholar] [CrossRef]
  92. Mykrä, H.; Heino, J.; Muotka, T. Scale-related patterns in the spatial and environmental components of stream macroinvertebrate assemblage variation. Glob. Ecol. Biogeogr. 2007, 16, 149–159. [Google Scholar] [CrossRef]
  93. Heino, J.; Muotka, T.; Paavola, R.; Hämäläinen, H.; Koskenniemi, E. Correspondence between regional delineations and spatial patterns in macroinvertebrate assemblages of boreal headwater streams. J. N. Am. Benthol. Soc. 2002, 21, 397–413. [Google Scholar] [CrossRef]
  94. Buytaert, W.; Cuesta-Camacho, F.; Tobón, C. Potential impacts of climate change on the environmental services of humid tropical alpine regions. Glob. Ecol. Biogeogr. 2011, 20, 19–33. [Google Scholar] [CrossRef]
  95. Schneider, S.; Hornung, J.; Hinderer, M.; Garzanti, E. Petrography and geochemistry of modern river sediments in an equatorial environment (rwenzori mountains and albertine rift, Uganda)—Implications for weathering and provenance. Sediment. Geol. 2016, 336, 106–119. [Google Scholar] [CrossRef]
  96. Jacobsen, D.; Schultz, R.; Encalada, A. Structure and diversity of stream invertebrate assemblages: The influence of temperature with altitude and latitude. Freshw. Biol. 1997, 38, 247–261. [Google Scholar] [CrossRef] [Green Version]
  97. Domisch, S.; Jähnig, S.C.; Haase, P. Climate-change winners and losers: Stream macroinvertebrates of a submontane region in central europe. Freshw. Biol. 2011, 56, 2009–2020. [Google Scholar] [CrossRef]
  98. Skoulikidis, N.T.; Amaxidis, Y.; Bertahas, I.; Laschou, S.; Gritzalis, K. Analysis of factors driving stream water composition and synthesis of management tools—A case study on small/medium Greek catchments. Sci. Total Environ. 2006, 362, 205–241. [Google Scholar] [CrossRef] [PubMed]
  99. Jacobsen, D. Tropical high-altitude streams. In Tropical Stream Ecology; Elsevier: Amsterdam, The Netherlands, 2008; pp. 219–256. [Google Scholar]
  100. Tomanova, S.; Tedesco, P.A.; Campero, M.; Van Damme, P.A.; Moya, N.; Oberdorff, T. Longitudinal and altitudinal changes of macroinvertebrate functional feeding groups in neotropical streams: A test of the river continuum concept. Fundam. Appl. Limnol./Arch. Für Hydrobiol. 2007, 170, 233–241. [Google Scholar] [CrossRef]
  101. Jacobsen, D.; Rostgaard, S.; Vásconez, J.J. Are macroinvertebrates in high altitude streams affected by oxygen deficiency? Freshw. Biol. 2003, 48, 2025–2032. [Google Scholar] [CrossRef]
  102. Hoback, W.W.; Stanley, D.W. Insects in hypoxia. J. Insect Physiol. 2001, 47, 533–542. [Google Scholar] [CrossRef]
  103. Chapman, L.J.; Schneider, K.R.; Apodaca, C.; Chapman, C.A. Respiratory ecology of macroinvertebrates in a swamp-river system of east africa. Biotropica 2004, 36, 572–585. [Google Scholar]
  104. Jacobsen, D. Low oxygen pressure as a driving factor for the altitudinal decline in taxon richness of stream macroinvertebrates. Oecologia 2008, 154, 795–807. [Google Scholar] [CrossRef] [PubMed]
  105. Jacobsen, D.; Dangles, O. Ecology of High Altitude Waters; Oxford University Press: New York, NY, USA, 2017. [Google Scholar]
  106. Suren, A.M. Macroinvertebrate communities of streams in western Nepal: Effects of altitude and land use. Freshw. Biol. 1994, 32, 323–336. [Google Scholar] [CrossRef]
  107. Jansson, A.; Reavell, P. North american species of trichocorixa (heteroptera: Corixidae) introduced into Africa. Afr. Entomol. 1999, 7, 295–297. [Google Scholar]
  108. Shull, D.R.; Stewart, R.L., Jr.; Hurd, T.M.; Light, T. A case for unique habitat selection by sigara mathesoni (hemiptera: Corixidae) in south-central pennsylvania. Northeast. Nat. 2016, 23, 174–183. [Google Scholar] [CrossRef]
  109. Ribera, I.; Barraclough, T.; Vogler, A. The effect of habitat type on speciation rates and range movements in aquatic beetles: Inferences from species-level phylogenies. Mol. Ecol. 2001, 10, 721–735. [Google Scholar] [CrossRef] [PubMed] [Green Version]
  110. White, D. Coleoptera (Beetles) in Aquatic Ecosystems; Encyclopedia of Inland Waters; Elsevier: Amsterdam, The Netherlands, 2009; pp. 144–156. [Google Scholar] [CrossRef]
  111. Nachtigall, W. Swimming, lake insects. In Encyclopedia of Insects, 2nd ed.; Elsevier: Amsterdam, The Netherlands, 2009; pp. 972–975. [Google Scholar]
  112. Nilsson, A.N. Dytiscidae (Coleoptera); Apollo Books: Stenstrup, Denmark, 2001; Volume 3. [Google Scholar]
  113. Stoian, L.C.; Gagyi-Palffy, A.; Stan, G. Preliminary aspects regarding the use of some invertebrate bioindicator species in the ecological study of an aquatic lotic ecosystem. Aquac. Aquar. Conserv. Legis. Int. J. Bioflux Soc. (AACL Bioflux) 2009, 2, 331–338. [Google Scholar]
  114. Owor, M.; Hartwig, T.; Muwanga, A.; Zachmann, D.; Pohl, W. Impact of tailings from the kilembe copper mining district on lake george, uganda. Environ. Geol. 2007, 51, 1065–1075. [Google Scholar] [CrossRef]
  115. Lwanga, M.S.; Kansiime, F.; Denny, P.; Scullion, J. Heavy metals in lake george, uganda, with relation to metal concentrations in tissues of common fish species. Hydrobiologia 2003, 499, 83–93. [Google Scholar] [CrossRef]
  116. Kiffney, P.M.; Clements, W.H. Effects of metals on stream macroinvertebrate assemblages from different altitudes. Ecol. Appl. 1996, 6, 472–481. [Google Scholar] [CrossRef]
  117. Malmqvist, B.; Hoffsten, P.-O. Influence of drainage from old mine deposits on benthic macroinvertebrate communities in central swedish streams. Water Res. 1999, 33, 2415–2423. [Google Scholar] [CrossRef]
  118. Loayza-Muro, R.A.; Elías-Letts, R.; Marticorena-Ruíz, J.K.; Palomino, E.J.; Duivenvoorden, J.F.; Kraak, M.H.; Admiraal, W. Metal-induced shifts in benthic macroinvertebrate community composition in andean high altitude streams. Environ. Toxicol. Chem. 2010, 29, 2761–2768. [Google Scholar] [CrossRef] [Green Version]
  119. Hogsden, K.L.; Harding, J.S. Consequences of acid mine drainage for the structure and function of benthic stream communities: A review. Freshw. Sci. 2011, 31, 108–120. [Google Scholar] [CrossRef]
  120. Winner, R.; Boesel, M.; Farrell, M. Insect community structure as an index of heavy-metal pollution in lotic ecosystems. Can. J. Fish. Aquat. Sci. 1980, 37, 647–655. [Google Scholar] [CrossRef]
  121. Archaimbault, V.; Usseglio-Polatera, P.; Garric, J.; Wasson, J.G.; Babut, M. Assessing pollution of toxic sediment in streams using bio-ecological traits of benthic macroinvertebrates. Freshw. Biol. 2010, 55, 1430–1446. [Google Scholar] [CrossRef]
  122. Pallottini, M.; Cappelletti, D.; Fabrizi, A.; Gaino, E.; Goretti, E.; Selvaggi, R.; Céréghino, R. Macroinvertebrate functional trait responses to chemical pollution in agricultural–industrial landscapes. River Res. Appl. 2017, 33, 505–513. [Google Scholar] [CrossRef]
  123. Gheorghe, S.; Stoica, C.; Vasile, G.G.; Nita-Lazar, M.; Stanescu, E.; Lucaciu, I.E. Metals toxic effects in aquatic ecosystems: Modulators of water quality. In Water Quality; IntechOpen: Rijeka, Croatia, 2017. [Google Scholar]
  124. Glazier, D.S. Temperature affects food-chain length and macroinvertebrate species richness in spring ecosystems. Freshw. Sci. 2012, 31, 575–585. [Google Scholar] [CrossRef] [Green Version]
  125. Jyväsjärvi, J.; Marttila, H.; Rossi, P.M.; Ala-Aho, P.; Olofsson, B.; Nisell, J.; Backman, B.; Ilmonen, J.; Virtanen, R.; Paasivirta, L. Climate-induced warming imposes a threat to north european spring ecosystems. Glob. Chang. Biol. 2015, 21, 4561–4569. [Google Scholar] [CrossRef] [PubMed]
  126. Iglesias, C.; Meerhoff, M.; Johansson, L.S.; González-Bergonzoni, I.; Mazzeo, N.; Pacheco, J.P.; Teixeira-de Mello, F.; Goyenola, G.; Lauridsen, T.L.; Søndergaard, M. Stable isotope analysis confirms substantial differences between subtropical and temperate shallow lake food webs. Hydrobiologia 2017, 784, 111–123. [Google Scholar] [CrossRef]
  127. Wilhelm, L.; Singer, G.A.; Fasching, C.; Battin, T.J.; Besemer, K. Microbial biodiversity in glacier-fed streams. ISME J. 2013, 7, 1651. [Google Scholar] [CrossRef] [PubMed] [Green Version]
  128. Slemmons, K.E.; Saros, J.E.; Simon, K. The influence of glacial meltwater on alpine aquatic ecosystems: A review. Environ. Sci. Process. Impacts 2013, 15, 1794–1806. [Google Scholar] [CrossRef] [PubMed]
  129. Flemming, C.; Trevors, J. Copper toxicity and chemistry in the environment: A review. WaterAirSoil Pollut. 1989, 44, 143–158. [Google Scholar] [CrossRef]
  130. Förstner, U.; Wittmann, G.T. Metal Pollution in the Aquatic Environment; Springer Science & Business Media: Berlin, Germany, 2012. [Google Scholar]
  131. Viers, J.; Dupré, B.; Gaillardet, J. Chemical composition of suspended sediments in world rivers: New insights from a new database. Sci. Total Environ. 2009, 407, 853–868. [Google Scholar] [CrossRef] [PubMed]
  132. Gíslason, G.M.; Ad✗alsteinsson, H.; Hansen, I.; Ólafsson, J.S.; Svavarsdóttir, K. Longitudinal changes in macroinvertebrate assemblages along a glacial river system in central iceland. Freshw. Biol. 2001, 46, 1737–1751. [Google Scholar] [CrossRef] [Green Version]
  133. Smith, A.J.; Bode, R.W.; Kleppel, G.S. A nutrient biotic index (nbi) for use with benthic macroinvertebrate communities. Ecol. Indic. 2007, 7, 371–386. [Google Scholar] [CrossRef]
  134. Everall, N.C.; Johnson, M.F.; Wood, P.; Paisley, M.F.; Trigg, D.J.; Farmer, A. Macroinvertebrate community structure as an indicator of phosphorus enrichment in rivers. Ecol. Indic. 2019, 107, 105619. [Google Scholar] [CrossRef]
  135. Peralta, E.M.; Batucan, L.S., Jr.; De Jesus, I.B.B.; Triño, E.M.C.; Uehara, Y.; Ishida, T.; Kobayashi, Y.; Ko, C.-Y.; Iwata, T.; Borja, A.S. Nutrient loadings and deforestation decrease benthic macroinvertebrate diversity in an urbanised tropical stream system. Limnologica 2020, 80, 125744. [Google Scholar] [CrossRef]
  136. Horak, C.N.; Assef, Y.A.; Miserendino, M.L. Assessing effects of confined animal production systems on water quality, ecological integrity, and macroinvertebrates at small piedmont streams (patagonia, argentina). Agric. Water Manag. 2019, 216, 242–253. [Google Scholar] [CrossRef]
  137. Basset, Y.; Missa, O.; Alonso, A.; Miller, S.E.; Curletti, G.; De Meyer, M.; Eardley, C.; Lewis, O.T.; Mansell, M.W.; Novotny, V. Changes in arthropod assemblages along a wide gradient of disturbance in Gabon. Conserv. Biol. 2008, 22, 1552–1563. [Google Scholar] [CrossRef] [PubMed]
  138. Madsen, P.B.; Morabowen, A.; Andino, P.; Espinosa, R.; Cauvy-Fraunié, S.; Dangles, O.; Jacobsen, D. Altitudinal distribution limits of aquatic macroinvertebrates: An experimental test in a tropical alpine stream. Ecol. Entomol. 2015, 40, 629–638. [Google Scholar] [CrossRef]
  139. Loayza-Muro, R.A. Life at the Edge: Benthic Invertebrates in High Altitude Andean Streams. Ph.D. Thesis, Universiteit van Amsterdam, Amsterdam, The Netherlands, 2013. [Google Scholar]
  140. Lencioni, V. Glacial influence and stream macroinvertebrate biodiversity under climate change: Lessons from the southern alps. Sci. Total Environ. 2018, 622, 563–575. [Google Scholar] [CrossRef] [PubMed]
  141. Jacobsen, D.; Milner, A.M.; Brown, L.E.; Dangles, O. Biodiversity under threat in glacier-fed river systems. Nat. Clim. Chang. 2012, 2, 361. [Google Scholar] [CrossRef]
  142. Finn, D.S.; Khamis, K.; Milner, A.M. Loss of small glaciers will diminish beta diversity in pyrenean streams at two levels of biological organization. Glob. Ecol. Biogeogr. 2013, 22, 40–51. [Google Scholar] [CrossRef]
  143. Danladi Bello, A.-A.; Hashim, N.B.; Mohd Haniffah, M.R. Predicting impact of climate change on water temperature and dissolved oxygen in tropical rivers. Climate 2017, 5, 58. [Google Scholar] [CrossRef] [Green Version]
Figure 1. Map of the Rwenzori rivers showing the 30 sampled sites. Inset legend shapes represent the three different sets of samples circles: downstream sites (DS) 900–1090 m; squares: midstream sites (MS) 1091–1399 m and triangles: upstream sites (US) 1400–1600 m.
Water 12 01668 g001
Figure 2. Mean taxa richness scores between the downstream (DS), midstream (MS) and upstream (US) sites. All columns n = 10 and error bars denote mean ± SD of mean taxa richness scores in the three altitude groups. SD = Standard deviation.
Water 12 01668 g002
Figure 3. Macroinvertebrate diversity depicting intergroup comparisons (Kruskal-Wallis) in the three altitude groups: downstream (DS); midstream (MS) and upstream sites (US) sites, showing the Simpson Index (a), Pielou’s Evenness (b), Taxa Richness (c) and the Abundance (d). Boxes, central bars and solid lines depict the interquartile range, the median and the data range. Outliers are represented by circles lying outside the interquartile range.
Water 12 01668 g003aWater 12 01668 g003b
Figure 4. Correlogram of Spearman’s rank correlations, showing all correlations between variables (a) and significant correlations (p < 0.05) between variables (b). Abbreviations: Nitrite-nitrogen (NO2N), ammonium-nitrogen (NH4N), chemical oxygen demand (COD), biochemical oxygen demand (BOD), nickel (Ni), copper (Cu), dissolved oxygen (DO), total nitrogen (TN), orthophosphate (OPO4), total phosphorus (TP), nitrate-nitrogen (NO3N), temperature (Temp), conductivity (Cond), total taxa abundance (N), taxa richness (S), altitude (Alt), longitude (Long), latitude (Lat), Simpson index (D), Pielou’s evenness (J). The variables of stream water velocity and pH are as stated. The X axes indicate the correlation coefficient values ranging between −1 and +1, the blue hue color are positive correlation values, while the red hue color are negative correlation values. The circle size and color hue intensity are proportional to the correlation coefficient values.
Water 12 01668 g004
Figure 5. PCA biplot of variables and the three altitude groups. The inset legend denotes the three altitude groups; red circles: downstream sites (DS); green triangles: midstream sites (MS) and blue squares: upstream sites (US). Abbreviations: Nitrite-nitrogen (NO2N), ammonium-nitrogen (NH4N), chemical oxygen demand (COD), biochemical oxygen demand (BOD), nickel (Ni), copper (Cu), dissolved oxygen (DO), total nitrogen (TN), orthophosphate (OPO4), total phosphorus (TP), nitrate (NO3N), temperature (Temp), conductivity (Cond), altitude (Alt), longitude (Long), latitude (Lat). The variables of stream water velocity and pH are as stated.
Water 12 01668 g005
Table 1. Associations between families and altitude site groups. For each group, statistically significant indicator taxa are denoted by *.
Taxa
DS (n = 5)Corixidae *, Belostomatidae, Leptophlebiidae, Thiaridae, Tricorythidae
MS (n = 6)Chironomidae, Lumbricidae, Ecnomidae, Gerridae, Perlidae, Simuliidae
US (n = 11)Dytiscidae *, Elmidae, Lepidostomatidae, Hydraenidae, Hydrophilidae, Limoniidae, Dugesiidae, Erpobdellidae, Limoniidae, Sphaeriidae, Staphylinidae
DS + MS (n = 5)Baetidae, Hydropsychidae, Physidae, Psychodidae, Atyidae
DS + US (n = 7)Coenagrionidae, Caenidae, Leptoceridae, Planorbidae, Veliidae, Hydracarina, Tubificidae
MS + US (n = 3)Gomphidae, Gyrinidae, Tipulidae
Table 2. Significant coefficient predictors for taxa richness for the three different altitude groups and for all data.
Title  VariableAll Sites (N = 30)US (N = 10)MS (N = 10)DS (N = 10)
(Intercept)11.678651.615.28212.518
Temperature−0.269−0.553 −0.292
Nickel−1.733 −4.012
Conductivity −0.3571 −0.653
Longitude −233.122
Total phosphorus −0.642
Nitrite nitrogen −1.271

