Article

Development of Ceramic Water Filter Clay Selection Criteria

1
Department of Civil & Environmental Engineering, University of Rhode Island, Kingston, RI 02881, USA
2
Massachusetts Department of Environmental Protection, 1 Winter Street, Boston, MA 02108, USA
3
Department of Environmental Engineering & Earth Sciences, Wilkes University, Wilkes-Barre, PA 18766, USA
4
Department of Geosciences, University of Rhode Island, Kingston, RI 02881, USA
*
Author to whom correspondence should be addressed.
Water 2020, 12(6), 1657; https://doi.org/10.3390/w12061657
Submission received: 11 May 2020 / Revised: 1 June 2020 / Accepted: 5 June 2020 / Published: 10 June 2020
(This article belongs to the Special Issue Point-of-Use Water Treatment)

Abstract

:
Ceramic water filters (CWFs) are point-of-use drinking water treatment systems that are manufactured and used in under-served communities around the world. The clayey material (CM) used to manufacture CWFs is a locally sourced mixture of clay, sand, slit and amorphous material (usually dug near the CWF factory). CM varies in composition and purity depending on the geographical location and geological setting. In this study, a set of 13 CM samples collected from around the world were analyzed using grain size analysis, as well as liquid and plastic limit tests. Mineralogical composition was determined using X-ray diffraction. A selection of three CM samples (Guatemala, Canada, and Guinea Bissau) with a range of compositions were used to study biofilm growth on CM before and after firing. Biofilm coverage was studied on CM (before firing) and CWF material (after firing) using Pseudomonas fluorescens Migula. The average biofilm coverages for Guatemala, Canada, and Guinea Bissau CM were 20.03 ± 2.80%, 19.28 ± 0.91%, and 9.88 ± 4.02%, respectively. The average biofilm formation coverages for Guatemala, Canada, and Guinea Bissau CWF were 13.08 ± 1.74%, 10.36 ± 3.41%, and 8.66 ± 0.13%, respectively. The results presented here suggest that CM can be manipulated to manufacture better performing CWFs by engineering the soil characteristics, such as grain size, liquid and plastic limits, and mineralogy. This could improve the durability and biofilm resistance of CWFs.

1. Introduction

An estimated 785 million people worldwide do not have access to an improved source of drinking water and 144 million are dependent on untreated surface water [1]. Contaminated water can lead to many different illnesses, including diarrheal diseases [1]. Ceramic water filters (CWFs) are a type of point-of-use drinking water treatment system used in under-served communities that do not have access to centralized drinking water treatment systems [2,3]. CWFs improve the microbiological quality of drinking water and reduce the burden of diarrheal diseases in under-served communities at the household level [4,5,6,7]. CWFs are also low cost, easy to use, and use local craftsmanship, making them socially acceptable for drinking water treatment [5,8,9,10].
The clay that is usually used in studies about CWF manufacturing is actually clayey material (CM) because the term “clay” refers to soil particles under 2 µm in diameter and these studies usually use soil with a larger particle size [2,8,11,12]. CWFs are made from locally sourced CM and burnout material, which is usually sawdust or rice husks [2,13]. CM utilized in CWF manufacturing is a mixture of clay, sand, silt, and amorphous material that is usually dug locally to the CWF factory. The CM varies in quality and composition depending on its source [8,13]. The maximum grain size for CM utilized in CWF production ranges between 177 and 2000 µm [2]. Soil with grain sizes between 2 and 2000 µm are classified as sand and silt, so the CM utilized in CWF manufacturing is a mixture of clay, silt, sand, and amorphous material [14,15]. After the CM is processed with sieving, the burnout material is added, typically at 5–25% by weight [2,16,17,18]. Water is added to the mixture of CM and burnout material and the resultant paste is pressed up to 1000 PSI using a hydraulic press to give the desired shape to the filter [19]. The molded filter is air dried and fired in a kiln to temperatures between 600 and 1000 °C [2,13,20]. During the firing process, the burnout material is incinerated, leaving pores in the ceramic [2]. These pores, which have a diameter between 1 and 5 µm, filter out microorganisms such as E. coli [17], Cryptosporidium parvum [18], and other water-borne pathogens [13,21]. After the filters are fired, they are coated in silver nanoparticles or silver nitrate [2,17,20]. The silver compounds prevent biofilm growth on the surface of the ceramic, which can interfere with the filtering process by reducing microbial removal [2,17,20,22,23,24]. CWFs manufactured using the described process have been successfully deployed in under-served communities around the world [4,5,25].
CMs are the main raw materials used in the manufacture of CWFs and are obtained from deposits local to CWF factories in order to reduce costs [17]. The physical and mineralogical properties of CM vary between locations, which creates variations in the quality of CWFs [8,26,27,28]. The variability in the physical properties of CM can be quantified using metrics in the Unified Soil Classification System (USCS). These metrics include: the liquid limit, plastic limit, plastic index, coefficient of uniformity (Cu), and coefficient of curvature (Cc). The liquid and plastic limits and the plastic index are related to the amount of moisture a soil sample can absorb [29]. The liquid limit is the smallest amount of moisture that can be added to soil to make it flow [29]. The plastic limit is the smallest amount of moisture that can be added to soil to allow it to be rolled into a tube [29]. The plastic index is the liquid limit minus the plastic limit; this value represents the range of moisture required to make the soil plastic [29]. The Cu and Cc of a soil sample measure the size range and shape of the grain size distribution curve, respectively [30]. The mineral composition of clays is studied using X-ray diffraction (XRD) [8]. XRD measures the angle at which X-rays are scattered by a lattice structure to create a spectrum characteristic of the sample [31]. The spectra are then compared to the reference spectra of known clays to determine the composition [31]. Variations in the mineral composition of the clays used to make CWFs can affect the plasticity of the clay and the strength of the CWFs [8].
The physical and mineralogical properties of clays have been reported to affect the performance and lifespan of CWFs, but this has yet to be systematically evaluated. In this study, we evaluate the properties of CM and discuss how manipulating these properties could improve the LRV of the CWFs. Previous studies have examined the effect of other manufacturing parameters, such as the silver coating or burnout material, on filter performance [2,11,16,32,33].
Our objective is to study the impact of physical and chemical properties of the CM used by CWF manufacturers on the CWF quality. Well-established geosciences, environmental, and geotechnical engineering methodologies were used to evaluate the CM studied. These techniques could eventually be applied by manufacturers to modify or manipulate the CM used in their CWFs production line. Implementing these techniques would be a low-cost approach to increasing the durability and pathogen removal performance of the filters. Biofilm growth on CM before and after firing was also evaluated on selected CMs utilized during this study. CM characterization and biofilm growth data were analyzed for their potential implications in CWF manufacturing.

2. Materials and Methods

CM samples (12) were provided by Potters without Borders (PWB), a Canadian nonprofit that assists in the setup of CWF factories, and 1 sample was obtained from the Ixtatan Foundation, Guatemala. The geographical information for all 13 samples is listed in Table 1. Of these 13 samples, three were used in the manufacture of CWF disks: Guinea Bissau Factory, Canada, and Guatemala. These samples were chosen because they represent a range of different geographies and there was enough sample available for the testing.

3. CM Characterization

The physical properties of the 13 clay samples were determined to understand their potential impact on the manufacturing process and the CWF performance. Grain size distribution analysis and liquid and plastic limit tests of the samples were selected to determine physical characteristics and classify the CM. Grain size distribution analysis quantifies the particles in a given size category and provides the information necessary for classifying the soil in accordance with the USCS (Table S1). This analysis was performed using the Standard Test Method for Particle-Size Analysis of Soils (ASTM D422) and Standard Test Method for Amount of Material in Soils Finer Than the No. 200 (75 µm) Sieve (ASTM D1140) [34]. Cu and Cm were calculated from the grain size distribution data based on Equations (1) and (2), presented below [30]:
C u = D 60 D 10
C C = ( D 30 ) 2 D 60 × D 10
Of the particles in the soil sample of interest, 60%, 30%, and 10% are finer than the particle diameters defined as the D60, D30, and D10 (respectively). The units for these values in Equations (1) and (2) are usually millimeters.
The liquid and plastic limit tests describe the effect of water content on the mechanical properties of soil [29]. These characteristics were measured in accordance with Standard Test Methods for Liquid Limit, Plastic Limit, and Plasticity Index of Soils (ASTM D 4318) [34]. Samples were analyzed in triplicate for the determination of the liquid and plastic limits. The results of the liquid and plastic limit tests are expressed as water content in the CM on a mass percentage basis.
CM from Canada, Guinea Bissau, and Guatemala was used to make ceramic disks. Ceramic disks are commonly used as small-scale CWFs for laboratory scale testing [13,18,19,35]. CWF disks were manufactured with 80% CM (sieved with the 149-µm mesh) and 20% sawdust (retained between the 149-µm and 44-µm sieves). The 149-µm mesh was used to ensure a similar grain size of the CM used for the CWF disks and means that the CM is made of sand, silt, and clay particles [15]. Water was added to the clay/sawdust mixture until it reached the consistency of a stiff dough. The mixture was pressed up to 1000 PSI using a hydraulic press, to mold the clay into disks. The disks were 4.7 cm in diameter and 1.5 cm thick, which matches the thickness of CWFs manufactured in the field [13,17,19]. The disks were dried for 3 days at room temperature, then fired in a kiln. The disks were fired starting from room temperature, ramping 150 °C/h to 600 °C and then ramping 300 °C/h to 900 °C, holding this final temperature for 3 h [13].
X-ray diffraction (XRD) was used to identify the minerals present in the CM and CWF samples. The CWF samples were prepared using the method described above and crushed into a powder. The CM and CWF powders were finely ground, dried at 60 °C overnight, homogenized, sieved through a No. 100 (149 µm) sieve, and analyzed using an Olympus Terra Portable XRD [8], outfitted with a Co x-ray tube. Spectra were compiled from 100 exposures. Peaks were interpreted using XPowder, a peak-matching software [8].
In addition, the sawdust samples were fired to determine their composition. Sawdust that is incinerated during the firing process leaves behind ash containing metals that could have an effect on biofilm growth. Sawdust was fired according to the ceramic water filter firing process. The resultant ashes were suspended at a concentration of 1 g/L in a solution of deionized water and 2% nitric acid. This solution was left to digest overnight then filtered and analyzed by EPA Method 200.7 using a Thermo Fisher Scientific X Series II inductively coupled plasma-mass spectrometer (ICP-MS) [36]. The solution was measured in triplicate by the ICP-MS.

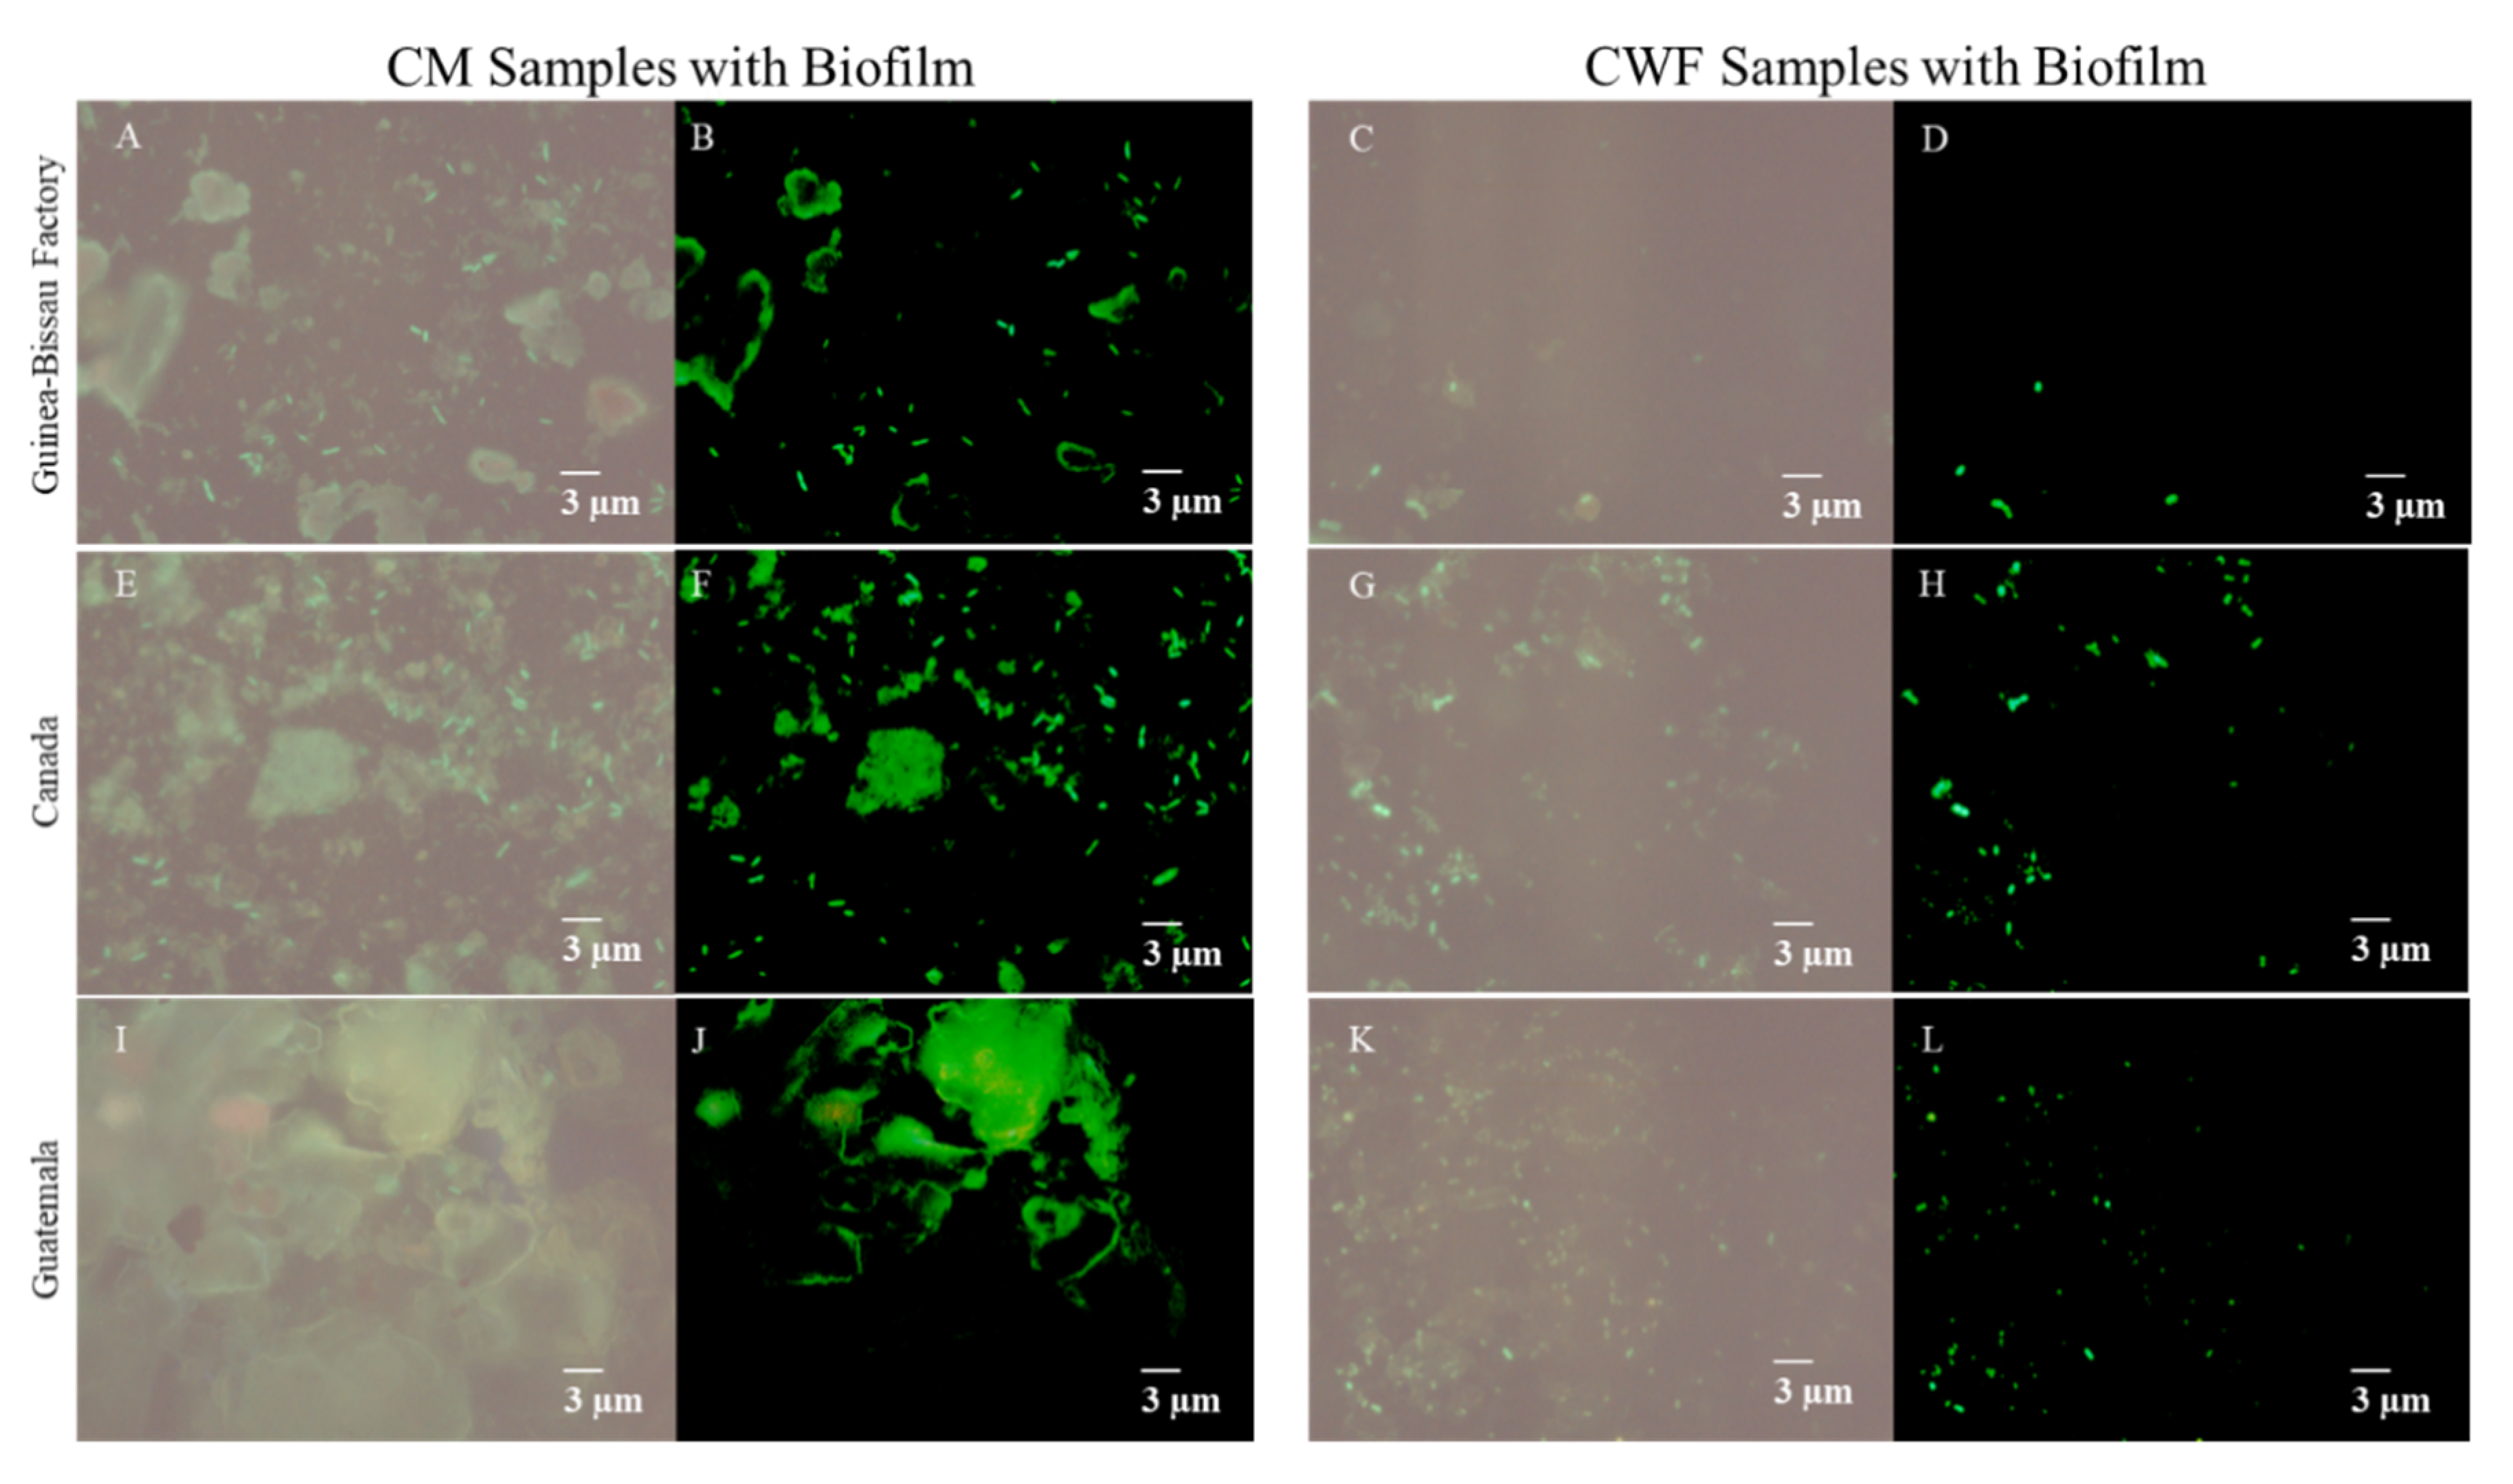
4. Biofilm Formation Analysis

Pseudomonas fluorescens Migula (ATCC 13525, American Type Culture Collection, USA) was selected for this study because it is a model organism commonly used in biofouling studies of membranes and known to form biofilms at the proposed testing conditions [37]. A single colony from a stock culture was inoculated in a 500 mL Erlenmeyer flask containing 100 mL of Lysogeny broth medium (LB medium: tryptone 10 g/L, sodium chloride 10 g/L, and yeast extract 5 g/L) [38]. Microorganisms in the LB medium grew aerobically on a rotary shaker for 16 h at 37 °C at 110 rpm and were harvested at the mid-exponential growth phase. The cells were pelleted by centrifugation for 15 min at 3000 g and 25 °C, and the supernatant was removed. The pellets were rinsed with phosphate-buffered saline solution (PBS; 1.12 g/L potassium phosphate dibasic, 0.48 g/L potassium phosphate monobasic, and 0.002 g/L EDTA) by centrifugation for 15 min at 3000 g and 25 °C three times [39]. The resulting pellets were re-suspended in 20 mL PBS and bacteria cell concentration was observed using optical density at 670 nm (OD670) using a Thermo Scientific Genesys 10S UV-Vis spectrophotometer. The optical density of the resultant solution was fixed to 1.0 absorbance units (AU) at 670 nm.
CM and CWF samples were used in the biofilm growth analysis. Each CM sample was sieved through a 149-µm mesh and suspended in deionized water at a concentration of 100 mg/L. The suspended CM was disaggregated in an ultrasound bath (L&R solid state/ultrasonic T-28B) for 10 min at room temperature. CWF samples were prepared by crushing CWF disks, before sieving and ultrasounds bath.
A modification of a previously published method was used to assess biofilm formation on the CM and CWF samples [40]. Briefly, coverslips (18 mm by 18 mm) were treated with a 7:3 (v/v) H2SO4:H2O2 solution for one hour, then rinsed with deionized water and sonicated for 15 min in a bath sonicator to remove organic contamination on the glass coverslips. The washed and sonicated coverslips were dried at 60 °C and stored in a desiccator. Cover slips were evenly coated with 2.4 mL prepared CM or CWF suspension (100 mg/L) and then transferred to an oven for 20 min at 120 °C. The coverslip with the bound clayey or CWF materials was rinsed with deionized water for 20 s and then dried at 60 °C. The CM- or CWF-coated coverslip was autoclaved at 121 °C for 20 min and placed in a sterile polystyrene 6-well plate with a total well volume of approximately 16 mL (Figure S1). Then, 0.25 mL of bacteria suspended in PBS with an OD 670 of 1.0 AU was added to each well. This solution was allowed to contact the samples for 10 min in the incubator at 37 °C. After that, 4.75 mL LB media was added to each well to completely cover the coverslip and the samples were placed in an incubator for 48 h at 37 °C. After the incubation period, the coverslip was removed and rinsed with deionized water three times, then dried by removing the liquid with a paper towel, which was placed at the edge of the coverslip on clean glass slides for 10 min. This process was performed in triplicate for biofilms grown on clayey and CWF materials.
Each sample-coated coverslip was stained in 10 or 11 spots with 10 µL of a solution with 3:500 (v/v) Invitrogen SYTO 9 green fluorescent nucleic acid stain in deionized water. After five minutes of contact with the dye, coverslips were examined using a Cytoviva Model V10E microscope under two channels analyzed by QCapture Pro 7 Software. The QCapture Pro 7 software was used to observe the Pseudomonas fluorescens biofilm (channel 1) and the mineral attachment on the coverslip (channel 2). Channel 1 captures fluorescence images and channel 2 is a brightfield camera. The percent coverage was calculated by dividing the biofilm area on clayey or CWF material measured with channel 1 by CM or CWF area measured by channel 2. ImageJ software Version 1.51h (National Institutes of Health) was used to quantify biofilm coverage on each coverslip. Statistical significance was determined using a t-test. An alpha value (α) of 0.05 was used to determine statistical difference between samples.

5. Results

Here, Atterberg testing and biofilm formation analysis were used to determine if the properties of CM used at CWF factories around the world significantly differ. These characteristics can have important effects on the performance of CWFs.

5.1. CM Characterization

The USCS soil classification uses grain size analysis, liquid limit, plastic limit, and plastic index to determine soil category [34]. The results for all the parameters and classification of the CM are listed in Table 2. The values for Cu and Cc, as well as the input diameter values, can be found in Table S2.
A summary of mineral compositions for the CMs and CWFs studied in this experiment can be found in Table 3. The raw data for all the XRD spectra acquired are provided in the Supplementary Materials. Both CM and CWF samples from Guinea Bissau, Canada, and Guatemala were analyzed using XRD. CWFs are the fired equivalents of the original CM and have been heated at temperatures of up to 1000 °C. This heat treatment can affect the mineralogical profile of the samples [41]. The CM from Guinea Bissau contained quartz, 7-Å clays (kaolinite and dickite), and montmorillonite (Table 3). After firing, the XRD spectrum of this material changed. Quartz and hematite were present in the spectrum for CWFs made with Guinea Bissau CM. Montmorillonite and 7-Å clays (kaolinite and dickite) were absent from the spectrum after firing (Table 3). Similar phenomena were seen in the XRD spectra for the Canada and Guatemala CM. The CM from Canada was made of quartz, muscovite, and 7-Å clay (kaolinite) (Table 3). Guatemalan CM contained four identifiable minerals: montmorillonite, quartz, muscovite, and albite (Table 2). After firing, the Canadian CWF XRD spectrum was quartz, 10Å clay (likely muscovite), and hematite (Table 2). The 7-Å clay group from the CM disappeared from the XRD spectrum of the Canadian CWF. The Guatemalan CWF had quartz, 10Å clay (likely muscovite), and albite signals. This sample was missing the montmorillonite signal that was present in the CM spectrum.

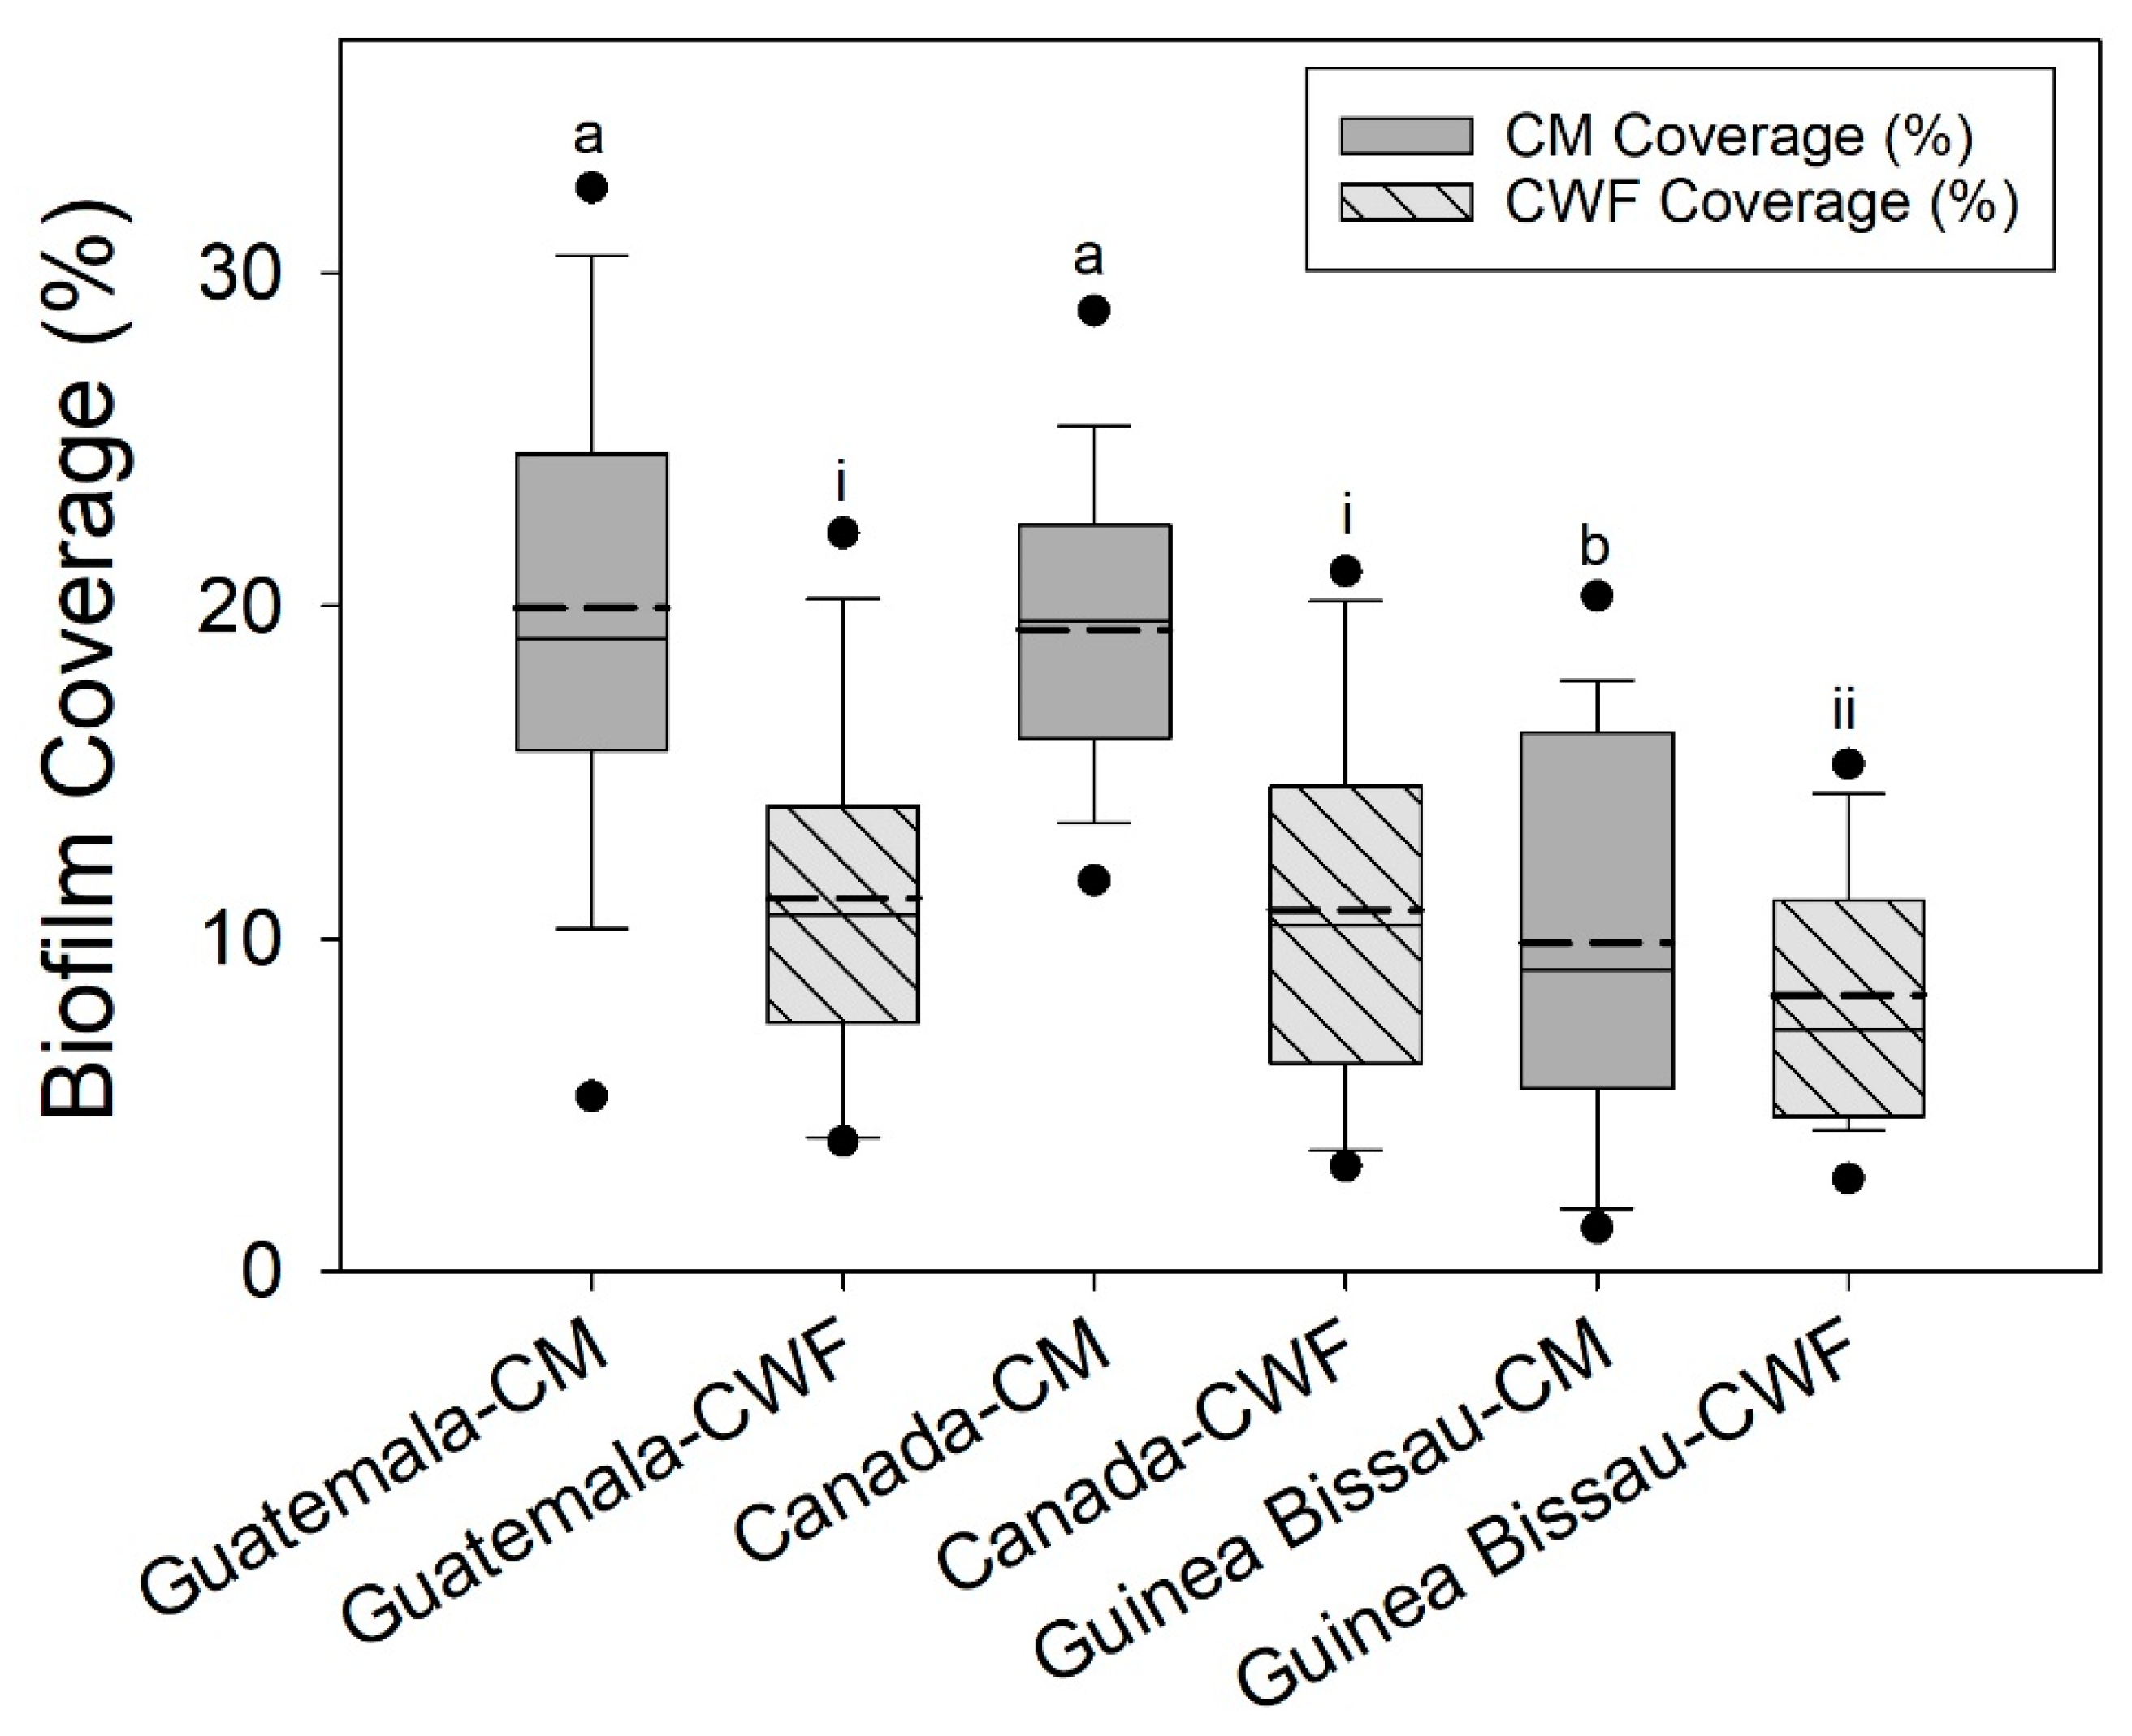
5.2. Biofilm Formation Analysis

Biofilm formation was measured using fluorescence microscopy. The samples were analyzed with two channels on the fluorescence microscope: channel 1 is specific for bacteria stained with SYTO 9 dye and channel 2 was used to detect the surfaces coated with clayey or CWF material. Figure 1 shows a selection of images from the Guinea Bissau Factory (A-D), Canada (E-H), and Guatemala (J-L) samples. Each set of samples (CM or CWF) has two columns that show CM or CWF coating (left) and biofilm growth (right). The green areas in Figure 1 show biofilm formation detected with channel 1. CM and CWF samples presented no fluorescence in channel 1 when stained with SYTO 9 green fluorescent dye without the presence of bacteria (Figure S3A,B). Bacteria without CM or CWF samples presented the expected fluorescence when stained with the SYTO 9 dye (Figure S3C,D).
A summary of the results obtained for all CM and CWF are shown in Figure 2. Every condition was measured with triplicate samples and ten or eleven spots were analyzed for each sample (this is 32 measurements per condition). The full data set used in the analysis can be found in Tables S3–S5. T-tests were used to determine statistical differences and the results are summarized in Table S6 (the α used to calculate the p values was 0.05). No significant differences were shown between the triplicate samples tested for each condition. This indicates that there was little sampling error between the triplicate tests. Guatemalan and Canadian CM had a similar biofilm coverage: 20.03 ± 2.80% and 19.28 ± 0.91%, respectively (p = 0.61). The biofilm coverage for these samples was statistically larger than Guinea Bissau CM, which had a biofilm coverage of 9.88 ± 4.02% (p < 0.05 for both). Similar results were obtained for the CWF materials. The Guatemalan and Canadian CWFs had similar biofilm coverage with 13.08 ± 1.74% and 10.36 ± 3.41% biofilm coverage, respectively, (p = 90). Both of these samples have statistically larger coverage than Guinea-Bissau, which had 8.66 ± 0.13% coverage (p = 0.02 for both comparisons). Biofilm growth on CM samples from Guatemala and Canada was significantly larger than growth on their respective CWF material (p < 0.05 for both). There was no significant difference in biofilm growth for CM and CWF samples produced using material from Guinea-Bissau (p = 0.20). The biofilm growth on the CM samples as a whole was significantly larger compared to biofilm growth on the CWF samples (p < 0.05).
ICP-MS analysis was used to quantify the concentration of metals released from the ashes of fired sawdust. In total, 11 metals were quantified with this analysis, the results of which can be found in Table S7. The major elements released by the sawdust were sodium (226.01 µg/g sawdust), potassium (53.47 µg/g sawdust), and iron (2.71 µg/g sawdust). Low levels of chromium (0.34 µg/g sawdust), zinc (0.31 µg/g sawdust), and copper (0.12 µg/g sawdust) were also detected.

6. Discussion

6.1. CM Characterization

The plasticity of the CM used in the construction of a CWF was the first set of characterization data measured here. CM plasticity can affect the performance of the final product, specifically the flow rate and durability of the final filter [2,20]. Generally, CMs with plasticity indices between 10 and 30% are appropriate for manufacturing CWFs [2]. CM with a plasticity lower than 10% can make the manufacturing process more difficult and the final filter more brittle [2]. Clay samples with a plasticity above the 10–30% range take too long to dry and shrink too much during the firing process [2]. Of the 13 samples characterized in Table 1, only six were within the acceptable range for CWF manufacturing.
The classification system applied to these CM samples has the potential to assist CWF manufacturers in utilizing higher quality CM in their CWFs. Classifying the CM in local mines could be used to identify sources with plasticity values in the acceptable range. If there is no mine with acceptably plastic clay, the CM can be adjusted to fall within the acceptable range by adding small amounts of pure clays [42]. Bentonite and montmorillonite can be added to mined CM to increase plasticity and sand can be added to decrease the plasticity [2]. Engineering the plasticity of the clay in this manner would improve the durability of the filters utilized in the field. Durability has been reported as an issue for CWFs. Previous studies have reported that 15–32% of CWFs in the field have broken within a period of 6 weeks to 6 months [4,9,43]. CWF manufacturers could use the soil classification system to select CM that would improve the durability of their product, which would lead to increased use and improved health in under-served communities. Based on the results obtained in Table 1, Indonesia, Nicaragua, Guayaquil, Biyo Mire (black), Guinea Bissau (red), Canada, and Guatemala CM have plasticity values outside of the recommended range. Factories who supplied these CM samples may wish to change their source of CM or engineer it to improve the properties. This could lead to an improvement in the workability of the clay and the durability of the CWFs produced at these locations.
XRD was used to determine the mineral composition of the CM and CWFs studied here. Minerals such as kaolinite, quartz, pyroxene, albite, illites, hematite, and smectite clays have been reported in CWFs in the literature [8,13,18,42,44,45]. The other minerals found in our CWF samples belong to the silicate and sulfate mineral groups that are commonly found in the Earth’s crust [46]. Quartz, muscovite, albite, montmorillonite, and 7-Å clays, such as chlorite, kaolinite and dickite, are typical minerals in clayey sand and clay [47,48]. The mineral composition of the CM utilized in the construction of CWFs has been shown to affect the performance. CWFs are often coated in silver nanoparticles, which are adsorbed to the ceramic matrix [13]. Smectite clays promote silver sorption, which increases the long-term performance of the CWF [8]. The mineralogy of the ceramic also affects the strength and plasticity of the CWF [8,42,45,49]. Characterizing the CM utilized by CWF manufacturers could be used to select mines that are rich in minerals that will improve the performance of the CWF. Filter factories could partner with local universities, Potters for Peace, or Potters without Borders in order to characterize the CM used in their filters. These organizations have contacts that could assist in the characterization of CM sources. Selecting an improved source of raw materials would improve the quality of the final CWF.
The XRD results also show a difference in the mineral compositions of unfired and fired CM. Clays from Guinea Bissau, Canada, and Guatemala were fired to create CWF disks. After firing, these samples had lost their 7-Å clay (such as kaolinite and dickite) and montmorillonite signals and gained peaks for hematite. The changes experienced by these minerals have been reported in the literature. Kaolinite goes through several changes during the firing process [50]. In this experiment, the maximum firing temperature was 1000 °C. Previous studies have reported that kaolinite fired to this temperature is converted to mullite crystals (which imparts some strength to the ceramic) and amorphous silica material [50,51]. Dickite is also a kaolin group clay (7-Å clay), so it likely undergoes a similar transformation after heating. The interlayer spaces of swelling clays, such as montmorillonite, tend to collapse when heated [52]. Quartz, albite, and (putative) muscovite survived the firing process because of their higher melting points [37,53,54,55]. Iron oxides can be formed from CM fired in an oxidative atmosphere [56]. The presence of iron oxides (hematite) can also promote the removal of viruses from drinking water [44].
The changes that occur during the firing process present a challenge for CWF manufacturers because clay composition before and after firing must be taken into account. Mineralogy can affect the plasticity of the CM, which could change the manufacturing process. After the filter has been fired, the mineral composition changes. The new mineralogy of the CWF must be taken into consideration as this can affect the durability and microbial removal of the filter.

6.2. Biofilm Formation Analysis

CM samples were shown to have statistically significant variations in biofilm growth depending on their origin and whether they had been fired. As mentioned in the results section, Guinea Bissau CM and CWF samples had the smallest amount of biofilm coverage and the CWF samples from Guatemala and Canada had less biofilm growth compared to their CM counterparts. The differences measured in the biofilm formation analysis could have an important impact on the CWF manufacturing process. These results demonstrate that the source of the CM and the firing process can have a statistically significant effect on biofilm formation. This is an important finding for CWF manufacturers. Biofilm growth on CWFs is discouraged because it leads to a reduction in microbial removal [22,23,24]. Our results indicate that biofilm growth on CM and CWF material can be mitigated by manipulating the CM used in filter production. CWF manufacturers may be able to use this to their advantage, selecting a CM source that could reduce biofilm growth on their final product. This would lead to an increase in the removal of microorganisms by the CWFs and an improvement in health in under-served communities.
While we have demonstrated statistically significant differences in biofilm coverage, the analyses performed here were unable to determine the causes of these differences. The measured differences in biofilm coverage have two possible sources: clay mineralogy and metal content from sawdust ash. The variations in mineralogical composition of the samples were not enough to explain the differences in biofilm growth measured here. XRD cannot be used to quantify the mineral composition of the CM or CWF samples, so changes in biofilm growth cannot be quantitatively linked to changes in mineral composition. The CWF samples analyzed were exposed to metals from sawdust ashes, in addition to having different mineral compositions. ICP-MS analysis demonstrated that the main metals in the sawdust were sodium, potassium, and iron. These metals have been shown to support biofilm growth [57,58,59]. Chromium, zinc, and copper, were also found in our analysis. These metals have been shown to be more toxic, reducing biofilm growth [60,61]. Biofilms (including those formed by Pseudomonas species) can develop resistance mechanisms for heavy metals over the long term [62,63]. In this study, the Pseudomonas were not exposed to the metals for long enough to develop resistance. The presence of metals from sawdust does not explain the differences seen between CM and CWF samples. If the metals were the cause of the differences in biofilm growth between CM and CWF samples, then it would be expected that all CWF samples would have a different biofilm coverage compared to the CM. The Guinea Bissau samples did not show the statistically significant difference, which would be expected if the sawdust was causing the differences. Our analysis showed that statistically significant differences in biofilm growth linked to CM origin and processing to make CWFs.
While we have demonstrated differences in biofilm growth on the CM and CWF material, future studies are required to demonstrate the causes of these differences. Elemental analysis using X-ray fluorescence could be used to demonstrate differences in composition related to biofilm growth. The nanotopography of a substrate can also play a role in cellular attachment and biofilm growth [64]. Atomic force microscopy can be applied to measure differences in nanotopography [64]. Future characterization studies are required to determine the origins of the differences in biofilm growth that are demonstrated in this study.

7. Conclusions

The CM utilized in the construction of CWFs varies widely between sources at different filter factories. This study is the first to demonstrate how manipulating the CM has the potential to improve the quality of CWFs. The plasticity of CM samples was analyzed using well-established techniques. The plasticity measurements can assist CWF manufacturers in choosing a source of CM that will lead to longer lasting and better performing filters. XRD spectra acquired before and after firing show the mineral composition of the CM and ceramic. This characterization can be used to select CM that will better adsorb silver nanoparticles or produce more durable CWFs. XRD was also used to demonstrate differences in mineral composition before and after firing. An understanding of the mineral composition before and after firing is crucial to improve the manufacturing process. The final analysis performed here demonstrates how CM can be manipulated to reduce biofilm growth. In order to improve CWF performance and reduce biofilm growth, the incorporation of CM that contains albite and muscovite should be minimized. These minerals can be identified in the CM and are present in the CWF after firing. Our results demonstrate that CWF factories should undertake similar studies to better understand the characteristics of their raw materials. Factories may not be able to choose the source, but they can engineer the CWF design to produce high-quality filters based on the properties of their raw materials.

Supplementary Materials

The following are available online at https://www.mdpi.com/2073-4441/12/6/1657/s1: Table S1: Unified Soil Classification System (USCS), Figure S1: CM coated coverslips in sterile polystyrene 6-well plates, Table S2: Coefficient of uniformity (Cu) and coefficient of curvature values (Cc), Figure S2: Grain size distribution for CM samples, Figure S3: Controls from biofilm analysis, Table S3: Guinea-Bissau data from biofilm analysis, Table S4: Canada data from biofilm analysis, Table S5: Guatemala data from biofilm analysis, Table S6: p values from T test performed on Table S3 data, Table S7: Metal content in fired sawdust. A zip file of the collected XRD spectra, entitled: XRD-Clay selection-water 81583, has also been provided.

Author Contributions

Each of the authors here has made a contribution to the manuscript. Z.J.S. wrote the manuscript and prepared the submission. Y.Z. and N.M.A. performed the experimental work. This manuscript was based on a master’s thesis originally written by Y.Z. D.C. applied her expertise in the field of geosciences to assist in the identification of the clay minerals. V.O.-C. guided the research and supervised the experimental work and the writing of the manuscript. All authors have read and agreed to the published version of the manuscript.

Funding

This research was partially funded by the National Science Foundation, CBET award number 1350789 and the Rhode Island Water Resources Center.

Acknowledgments

Special thanks to Potters without Borders and the Ixtatan Foundation for supplying the clay samples used in this work.

Conflicts of Interest

There are no conflicts of interest to declare.

References

  1. World Health Organization Drinking-Water. Available online: https://www.who.int/news-room/fact-sheets/detail/drinking-water (accessed on 8 April 2020).
  2. The Ceramics Manufacturing Working Group. Best Practice Recommendations for Local Manufacturing of Ceramic Pot Filters for Household Water Treatment; The Ceramics Manufacturing Working Group: Atlanta, GA, USA, 2011. [Google Scholar]
  3. Sobsey, M. Managing Water in the Home: Accelerated Health Gains from Improved Water Supply Water; Sanitation and Health Department of Protection of the Human Environment World Health Organization: Geneva, Switzerland, 2002. [Google Scholar]
  4. Clasen, T.F.; Brown, J.; Collin, S.; Suntura, O.; Cairncross, S. Reducing diarrhea through the use of household-based ceramic water filters: A randomized, controlled trial in rural Bolivia. Am. J. Trop. Med. Hyg. 2004, 70, 651–657. [Google Scholar] [CrossRef] [PubMed] [Green Version]
  5. Abebe, L.S.; Smith, J.A.; Narkiewicz, S.; Oyanedel-Craver, V.; Conaway, M.; Singo, A.; Amidou, S.; Mojapelo, P.; Brant, J.; Dillingham, R. Ceramic water filters impregnated with silver nanoparticles as a point-of-use water-treatment intervention for HIV-positive individuals in Limpopo Province, South Africa: A pilot study of technological performance and human health benefits. J. Water Health 2014, 12, 288–300. [Google Scholar] [CrossRef] [PubMed] [Green Version]
  6. Loomis, D.; Sobsey, M.D.; Brown, J. Local Drinking Water Filters Reduce Diarrheal Disease in Cambodia: A Randomized, Controlled Trial of the Ceramic Water Purifier. Am. J. Trop. Med. Hyg. 2008, 79, 394–400. [Google Scholar] [CrossRef]
  7. du Preez, M.; Conroy, R.M.; Wright, J.A.; Moyo, S.; Potgieter, N.; Gundry, S.W. Short Report: Use of Ceramic Water Filtration in the Prevention of Diarrheal Disease: A Randomized Controlled Trial in Rural South Africa and Zimbabwe. Am. J. Trop. Med. Hyg. 2008, 79, 696–701. [Google Scholar] [CrossRef]
  8. Oyanedel-Craver, V.; Narkiewicz, S.; Genovesi, R.; Bradshaw, A.; Cardace, D. Effect of local materials on the silver sorption and strength of ceramic water filters. J. Environ. Chem. Eng. 2014, 2, 841–848. [Google Scholar] [CrossRef] [Green Version]
  9. Lemons, A.; Branz, A.; Kimirei, M.; Hawkins, T.; Lantagne, D. Assessment of the quality, effectiveness, and acceptability of ceramic water filters in Tanzania. J. Water Sanit. Hyg. Dev. 2016, 6, 195–204. [Google Scholar] [CrossRef]
  10. Salvinelli, C.; Elmore, A.C.; García Hernandez, B.R.; Drake, K.D. Ceramic pot filters lifetime study in coastal Guatemala. J. Water Health 2017, 15, 145–154. [Google Scholar] [CrossRef] [PubMed]
  11. Rayner, J.; Luo, X.; Schubert, J.; Lennon, P.; Jellison, K.; Lantagne, D. The effects of input materials on ceramic water filter efficacy for household drinking water treatment. Water Sci. Technol. Water Supply 2017, 17, 859–869. [Google Scholar] [CrossRef]
  12. Van der Laan, H.; van Halem, D.; Smeets, P.W.M.H.; Soppe, A.I.A.; Kroesbergen, J.; Wubbels, G.; Nederstigt, J.; Gensburger, I.; Heijman, S.G.J. Bacteria and virus removal effectiveness of ceramic pot filters with different silver applications in a long term experiment. Water Res. 2014, 51, 47–54. [Google Scholar] [CrossRef] [PubMed]
  13. Oyanedel-Craver, V.A.; Smith, J.A. Sustainable colloidal-silver-impregnated ceramic filter for point-of-use water treatment. Environ. Sci. Technol. 2008, 42, 927–933. [Google Scholar] [CrossRef]
  14. Konert, M.; Vandenberghe, J. Comparison of laser grain size analysis with pipette and sieve analysis: A solution for the underestimation of the clay fraction. Sedimentology 1997, 44, 523–535. [Google Scholar] [CrossRef] [Green Version]
  15. Williams, S.J.; Arsenault, M.A.; Buczkowski, B.J.; Reid, J.A.; Flocks, J.G.; Kelp, M.A.; Penland, S.; Jenkins, C.J. Surficial Sediment Character of the Louisiana Offshore Continental Shelf Region: A GIS Compilation. Available online: https://pubs.usgs.gov/of/2006/1195/index.htm (accessed on 5 February 2020).
  16. van Halem, D.; van der Laan, H.; Soppe, A.I.A.; Heijman, S.G.J. High flow ceramic pot filters. Water Res. 2017, 124, 398–406. [Google Scholar] [CrossRef] [PubMed]
  17. Rayner, J.; Zhang, H.; Schubert, J.; Lennon, P.; Lantagne, D.; Oyanedel-Craver, V. Laboratory investigation into the effect of silver application on the bacterial removal efficacy of filter material for use on locally produced ceramic water filters for household drinking water treatment. ACS Sustain. Chem. Eng. 2013, 1, 737–745. [Google Scholar] [CrossRef]
  18. Abebe, L.S.; Su, Y.; Guerrant, R.L.; Swami, N.S.; Smith, J.A. Point-of-Use Removal of Cryptosporidium parvum from Water: Independent Effects of Disinfection by Silver Nanoparticles and Silver Ions and by Physical Filtration in Ceramic Porous Media. Environ. Sci. Technol. 2015, 49, 12958–12967. [Google Scholar] [CrossRef] [PubMed]
  19. Sullivan, R.K.; Erickson, M.; Oyanedel-Craver, V.A. Understanding the microbiological, organic and inorganic contaminant removal capacity of ceramic water filters doped with different silver nanoparticles. Environ. Sci. Nano 2017, 4, 2348–2355. [Google Scholar] [CrossRef]
  20. Rayner, J.; Skinner, B.; Lantagne, D. Current practices in manufacturing locally-made ceramic pot filters for water treatment in developing countries. J. Water Sanit. Hyg. Dev. 2013, 3, 252–261. [Google Scholar] [CrossRef]
  21. Shepard, Z.J.; Lux, E.M.; Oyanedel-Craver, V. Performance of silver nanoparticle-impregnated ovoid ceramic water filters. Environ. Sci. Nano 2020. [Google Scholar] [CrossRef]
  22. Bogler, A.; Meierhofer, R. The challenge of producing and marketing colloidal silver water filters in Nepal. Water 2015, 7, 3599–3612. [Google Scholar] [CrossRef] [Green Version]
  23. Mellor, J.; Abebe, L.; Ehdaie, B.; Dillingham, R.; Smith, J. Modeling the sustainability of a ceramic water filter intervention. Water Res. 2014, 49, 286–299. [Google Scholar] [CrossRef] [Green Version]
  24. van Halem, D. Ceramic Silver Impregnated Pot Filters for Household Drinking Water Treatment in Developing Countries; Delft University of Technology: Delft, The Netherlands, 2006. [Google Scholar]
  25. Clasen, T.; Garcia Parra, G.; Boisson, S.; Collin, S. Household-based ceramic water filters for the prevention of diarrhea: A randomized, controlled trial of a pilot program in Colombia. Am. J. Trop. Med. Hyg. 2005, 73, 790–795. [Google Scholar] [CrossRef] [PubMed]
  26. Bauluz, B.; Mayayo, M.J.; Fernandez-Nieto, C.; Cultrone, G.; Lopez, J. Assessment of technological properties of calcareous and non-calcareous clays used for the brick-making industry of Zaragoza (Spain). Appl. Clay Sci. 2003, 24, 121–126. [Google Scholar] [CrossRef]
  27. Velde, B.; Meunier, A. The Origin of Clay Minerals in Soils and Weathered Rocks; Springer: Berlin/Heidelberg, Germany, 2008. [Google Scholar]
  28. Zaied, F.; Abidi, R.; Slim-Shimi, N.; Somarin, A. Potentiality of clay raw materials from Gram area (Northern Tunisia) in the ceramic industry. Appl. Clay Sci. 2015, 112, 1–9. [Google Scholar] [CrossRef]
  29. White, W.A. Atterberg plastic limits of clay minerals. Am. Mineral. 1949, 34, 508–512. [Google Scholar]
  30. USDA. Chapter 3 Engineering Classification of Earth Materials. In National Engineering Handbook; USDA: Washington, DC, USA, 2012; Part 631, p. 35. [Google Scholar]
  31. Chaterjee, A. X-Ray Diffraction. In Handbook of Analytical Techniques in Concrete Science and Technology; Ramachandran, V., Beaudoin, J., Eds.; William Andrew Publishing/Noyes Publications: New York, NY, USA, 2001; pp. 275–332. ISBN 0-8155-1437-9. [Google Scholar]
  32. Jackson, K.N.; Smith, J.A. A New Method for the Deposition of Metallic Silver on Porous Ceramic Water Filters. J. Nanotechnol. 2018, 2018, 2573015. [Google Scholar] [CrossRef] [Green Version]
  33. Mikelonis, A.M.; Lawler, D.F.; Passalacqua, P. Multilevel modeling of retention and disinfection efficacy of silver nanoparticles on ceramic water filters. Sci. Total Environ. 2016, 566, 368–377. [Google Scholar] [CrossRef] [PubMed]
  34. American Society for Testing and Materials. Classification of Soils for Engineering Purposes: Annual Book of ASTM Standards, D 2487-83, 04.08; American Society for Testing and Materials: Philadelphia, PA, USA, 1985. [Google Scholar]
  35. Ren, D.; Smith, J.A. Retention and transport of silver nanoparticles in a ceramic porous medium used for point-of-use water treatment. Environ. Sci. Technol. 2013, 47, 3825–3832. [Google Scholar] [CrossRef] [PubMed]
  36. US Environmental Protection Agency Method 200.7, Revision 4.4: Determination of Metals and Trace Elements in Water and Wastes by Inductively Coupled Plasma-Atomic Emission Spectrometry Standard Operation Procedure. Available online: https://www.epa.gov/esam/method-2007-determination-metals-and-trace-elements-water-and-wastes-inductively-coupled-plasma (accessed on 21 June 2017).
  37. Chede, S.; Anaya, N.; Oyanedel-Craver, V.; Gorgannejad, S.; Harris, T.; Al-Mallahi, J.; Abu-Dalo, M.; Qdais, H.; Escobar, I. Desalination using low biofouling nanocomposite membranes: From batch-scale to continuous-scale membrane fabrication. Desalination 2019, 451, 81–91. [Google Scholar] [CrossRef]
  38. Lennox, E. Transduction of linked genetic characters of the host by bacteriophage P1. Virology 1955, 1, 190–206. [Google Scholar] [CrossRef]
  39. Dulbecco, R.; Vogt, M. Plaque Formation and Isolation of Pure Lines with Polimyelitis Viruses. J. Exp. Med. 1954, 99, 167–182. [Google Scholar] [CrossRef] [PubMed] [Green Version]
  40. Huang, Q.; Wu, H.; Cai, P.; Fein, J.; Chen, W. Atomic force microscopy measurements of bacterial adhesion and biofilm formation onto clay-sized particles. Sci. Rep. 2015, 5, 16857. [Google Scholar] [CrossRef] [PubMed]
  41. Heller-Kallai, L. Thermally Modified Clay Minerals. In Handbook of Clay Science; Newnes: Oxford, UK, 2006; pp. 289–308. [Google Scholar]
  42. Annan, E.; Kan-Dapaah, K.; Azeko, S.T.; Mustapha, K.; Asare, J.; Zebaze Kana, M.G.; Soboyejo, W. Clay Mixtures and the Mechanical Properties of Microporous and Nanoporous Ceramic Water Filters. J. Mater. Civ. Eng. 2016, 28, 04016105. [Google Scholar] [CrossRef]
  43. Murphy, H.M.; Sampson, M.; Farahbakhsh, K.; McBean, E. Microbial and chemical assessment of ceramic and BioSand water filters in rural Cambodia. Water Sci. Technol. Water Supply 2010, 10, 286–295. [Google Scholar] [CrossRef]
  44. Brown, J.; Sobsey, M.D. Ceramic media amended with metal oxide for the capture of viruses in drinking water. Environ. Technol. 2009, 30, 379–391. [Google Scholar] [CrossRef] [PubMed]
  45. Hubbel, L.; Elmore, A.C.; Reidmeyer, M. Comparison of a native clay soil and an engineered clay used in experimental ceramic pot filter fabrication. Water Sci. Technol. Water Supply 2015, 15, 569–577. [Google Scholar] [CrossRef]
  46. Deer, W.; Howie, R.; Zussman, J. An Introduction to the Rock-Forming Minerals, 3rd ed.; Longman: London, UK, 2013; ISBN 9780903056434. [Google Scholar]
  47. Carroll, D.; Geological Society of America. Clay Minerals: A Guide to Their X-ray Identification; Geological Society of America: Boulder, CO, USA, 1970; ISBN 9780813721262. [Google Scholar]
  48. Brindley, G.; Brown, G. Crystal Structures of Clay Minerals and their X-Ray Identification; Mineralogical Society of Great Britain and Ireland: London, UK, 1980; ISBN 9780903056373. [Google Scholar]
  49. Ajibade, F.O.; Akosile, S.I.; Oluwatuyi, O.E.; Ajibade, T.F.; Lasisi, K.H.; Adewumi, J.R.; Babatola, J.O.; Oguntuase, A.M. Bacteria removal efficiency data and properties of Nigerian clay used as a household ceramic water filter. Results Eng. 2019, 2, 100011. [Google Scholar] [CrossRef]
  50. McConville, C.; Lee, W. Microstructural development on firing illite and smectite clays compared with that in kaolinite. J. Am. Ceram. Soc. 2005, 88, 2267–2276. [Google Scholar] [CrossRef]
  51. Xu, H.; Guo, H.; Gong, S. Thermal barrier coatings. Met. Surf. Eng. 2008, 296, 476–491. [Google Scholar] [CrossRef] [Green Version]
  52. Andrini, L.; Moreira Toja, R.; Guana, M.; Conconi, M.; Requejo, F.; Rendtorff, N. Extended and local structural characterizaton of a natural and 800C fired Na-montmorillonite-Patagonian bentonite by XRD and Al/Si XANES. Appl. Clay Sci. 2017, 137, 233–240. [Google Scholar] [CrossRef]
  53. Schomburg, J.; Zwahr, H. Thermal differential diagnosis of mica mineral group. J. Therm. Anal. 1997, 38, 135–139. [Google Scholar] [CrossRef]
  54. Bennour, A.; Mahmoudi, S.; Srasra, E.; Boussen, S.; Htira, N. Composition, firing behavior and ceramic properties of the Sejnène clays (northwest Tunisia). Appl. Clay Sci. 2015, 115, 30–38. [Google Scholar] [CrossRef]
  55. Johnson, L.; McCauley, R. The thermal behavior of albite as observed by DTA. Thermochim. Acta 2005, 437, 134–139. [Google Scholar] [CrossRef]
  56. Guerrero-Latorre, L.; Rusinol, M.; Hundesa, A.; Garcia-Valles, M.; Martinez, S.; Joseph, O. Development of improved low-cost ceramic water filters for viral removal in the Haitian context. J. Water Sanit. Hyg. Dev. 2015, 5, 28–38. [Google Scholar] [CrossRef] [Green Version]
  57. Jiang, D.; Huang, Q.; Cai, P.; Rong, X.; Chen, W. Adsorption of pseudomonas putida on clay minerals and iron oxide. Colloids Surf. B Biointerfaces 2007, 54, 217–221. [Google Scholar] [CrossRef] [PubMed]
  58. Borcherding, J.; Baltrusaitis, J.; Chen, H.; Stebounova, L.; Rubasinghege, G.; Mudunkotuwa, I.A.; Caraballo, J.C.; Abner, J.; Grassian, V.H.; Comellas, A.P. Iron oxide nanoparticles induce Pseudomonas aeruginosa growth, induce biofilm formation, and inhibit antimicrobial peptide function. Environ. Sci. Nano 2014, 1, 123–132. [Google Scholar] [CrossRef] [PubMed] [Green Version]
  59. Binepal, G.; Gill, K.; Crowley, P.; Cordova, M.; Brady, J.; Senadheera, D.B.; Cvitkovitcha, D.G. Trk2 Potassium Transport System in Streptococcus mutans and Its Role in Potassium Homeostasis, Biofilm Formation, and Stress Tolerance. J. Bacteriol. 2016, 198, 1087–1100. [Google Scholar] [CrossRef] [PubMed] [Green Version]
  60. Uddin, M. A review on the adsorption of heavy metals by clay minerals, with special focus on the past decade. Chem. Eng. J. 2017, 308, 438–462. [Google Scholar] [CrossRef]
  61. Chien, C.; Lin, B.; Wu, C. Biofilm formation and heavy metal resistance by an environmental pseudomonas sp. Biochem. Eng. J. 2013, 78, 132–137. [Google Scholar] [CrossRef]
  62. Meliani, A.; Bensoltane, A. Biofilm-mediated heavy metals bioremediation in PGPR Pseudomonas. J. Bioremediation Biodegrad. 2016, 7, 2. [Google Scholar] [CrossRef]
  63. Shukla, S.K.; Mangwani, N.; Karley, D.; Rao, T.S. Bacterial Biofilms and Genetic Regulation for Metal Detoxification. In Handbook of Metal-Microbe Interactions and Bioremediation; CRC Press Inc.: Boca Raton, FL, USA, 2017; pp. 317–328. [Google Scholar]
  64. Mitik-Dineva, N.; Wang, J.; Mocanasu, R.C.; Stoddart, P.R.; Crawford, R.J.; Ivanova1, E.P. Impact of nano-topography on bacterial attachment. Biotechnol. J. 2008, 3, 536–544. [Google Scholar] [CrossRef] [PubMed]
Figure 1. Biofilm growth on CM and CWF samples. CM and CWF samples from Guinea Bissau Factory (AD); Canada (EH); and Guatemala (IL) were analyzed for their effect on biofilm growth. Each set of CM and CWF samples was analyzed with two channels on the microscope: the bacterial-specific channel (channel 1) and clay-specific channel (channel 2). The images in the left-hand columns of the CM and CWF sets were analyzed using channel 2 (Images A,C,E,G,I,K), and the right-hand columns are images from channel 1 (Images B,D,F,H,J,L). The green areas indicate bacterial growth. Positive and negative controls can be found in Figure S3.
Water 12 01657 g001
Figure 2. Biofilm coverage on CM (solid bars) and CWFs (striped bars). Average biofilm coverage was determined by analyzing each condition in triplicate at 10 or 11 different locations on each sample. See Tables S3–S5 for the full data set. In the box and whisker plots, the solid gray boxes are the CM samples and the striped boxes are the CWF samples. The tops and bottoms of the boxes are the 25th percentile with the mean (dashed line) and median (solid line) marked inside the boxes. The whiskers mark the 95th percentile and the dots mark the outliers. Letters (a,b) indicate statistical significance between CM samples, and Roman numerals (i,ii) indicate statistical significance between CWF samples.
Water 12 01657 g002
Table 1. Sources of clayey minerals.
Sample NameSource Country (City)Provider
IndonesiaIndonesiaPotters Without Borders
TanzaniaTanzaniaPotters Without Borders
NicaraguaNicaraguaPotters Without Borders
MozambiqueMozambique (Nampula)Potters Without Borders
GuayaquilEcuador (Guayaquil)Potters Without Borders
Biyo Mire BlackSomalia (Hargeisa)Potters Without Borders
Biyo Mire RedSomalia (Hargeisa)Potters Without Borders
Guinea Bissau BlackGuinea Bissau (Safim)Potters Without Borders
Guinea Bissau RedGuinea Bissau (Safim)Potters Without Borders
Guinea Bissau Factory *Guinea Bissau (Safim)Potters Without Borders
Nova ScotiaCanada (Lantz)Potters Without Borders
Canada *Canada (Bridgetown)Potters Without Borders
Guatemala *Guatemala (San Mateo Ixtatan)Ixtatan Foundation
* Samples used to manufacture CWFs.
Table 2. Liquid limit, plastic limit, plastic index, and classification of clayey material (CM).
Sample NameLiquid Limit (%)Plastic Limit (%)Plastic Index (%)Grain Size Distribution
% Passing No. 4% Passing No. 200Cu ≥ 6 and 1 < Cc < 3PI > 73% (LL-20%)Classification
Indonesia68.8520.9247.93100.0032.34N/ANOSilt sand
Tanzania42.9821.7421.23100.0023.32N/ANOSilt sand
Nicaragua32.690.0032.69100.0025.37NONOSilt sand
Mozambique42.7220.1722.54100.009.80YESNOWell-graded sand with silt
Guayaquil51.0734.9433.68100.002.51NON/APoorly-graded sand
Biyo Mire Black27.8219.538.29100.003.50NON/APoorly-graded sand
Biyo Mire Red49.4730.4918.98100.003.07NON/APoorly-graded sand
Guinea Bissau Black32.8720.9211.95100.005.05NONOPoorly-graded sand with silt
Guinea Bissau Red29.0121.307.71100.0015.34N/ANOSilt sand
Guinea Bissau Factory33.9923.2310.76100.003.37NON/APoorly-graded sand
Nova Scotia *44.6024.4720.138.662.00NO *N/APoorly-graded gravel
Canada28.9119.609.31100.004.92NON/APoorly-graded sand
Guatemala33.9930.793.20100.0010.78NONOPoorly-graded sand with silt
* The Nova Scotia sample was the only one with less than 50% passing the No. 200 sieve, so the Cu and Cc comparisons were as follows: Cu > 4 and 1 < Cc < 3. N/A-not applicable based on the Unified Soil Classification System (USCS) classification scheme presented in Table S1.
Table 3. Summary of X-ray diffraction (XRD) spectra collected for CM and ceramic water filter (CWF) samples *.
Sample NameMinerals
Indonesia7-Å clay (kaolinite or chlorite), quartz, montmorillonite, muscovite
Tanzania7-Å clay (kaolinite or chlorite), quartz, vermiculite
Nicaragua7-Å clay (kaolinite or chlorite), quartz, montmorillonite, muscovite
MozambiquePhlogopite, 7-Å clay (kaolinite or chlorite), biotite, montmorillonite, quartz
GuayaquilQuartz, montmorillonite, illite, albite
Biyo Mire BlackQuartz, montmorillonite, illite, albite, calcite, pyroxene
Biyo Mire RedQuartz, montmorillonite, albite, calcite, 7-Å clay (kaolinite or chlorite), muscovite, vermiculite, palygorskite
Guinea Bissau BlackQuartz, 7-Å clay (kaolinite or chlorite)
Guinea Bissau RedQuartz, 7-Å clay (kaolinite or chlorite)
Nova ScotiaQuartz, montmorillonite, 7-Å clay (kaolinite or chlorite), muscovite
Guinea Bissau FactoryQuartz, 7-Å clay (likely kaolinite, dickite), montmorillonite
Guinea Bissau Factory-CWFQuartz, hematite
CanadaQuartz, muscovite, 7-Å clay (kaolinite or chlorite)
Canada-CWFQuartz, muscovite, hematite
GuatemalaMontmorillonite, quartz, muscovite, and albite
Guatemala-CWFQuartz, muscovite, albite
* Mineral identifications in parentheses were supported by XPowder peak evaluations but cannot be proven without further characterization that was not performed here.

