Biosand Filter as a Point-of-Use Water Treatment Technology: Influence of Turbidity on Microorganism Removal Efficiency

 ,
, 
 and
and
Abstract
1. Introduction
2. Materials and Methods
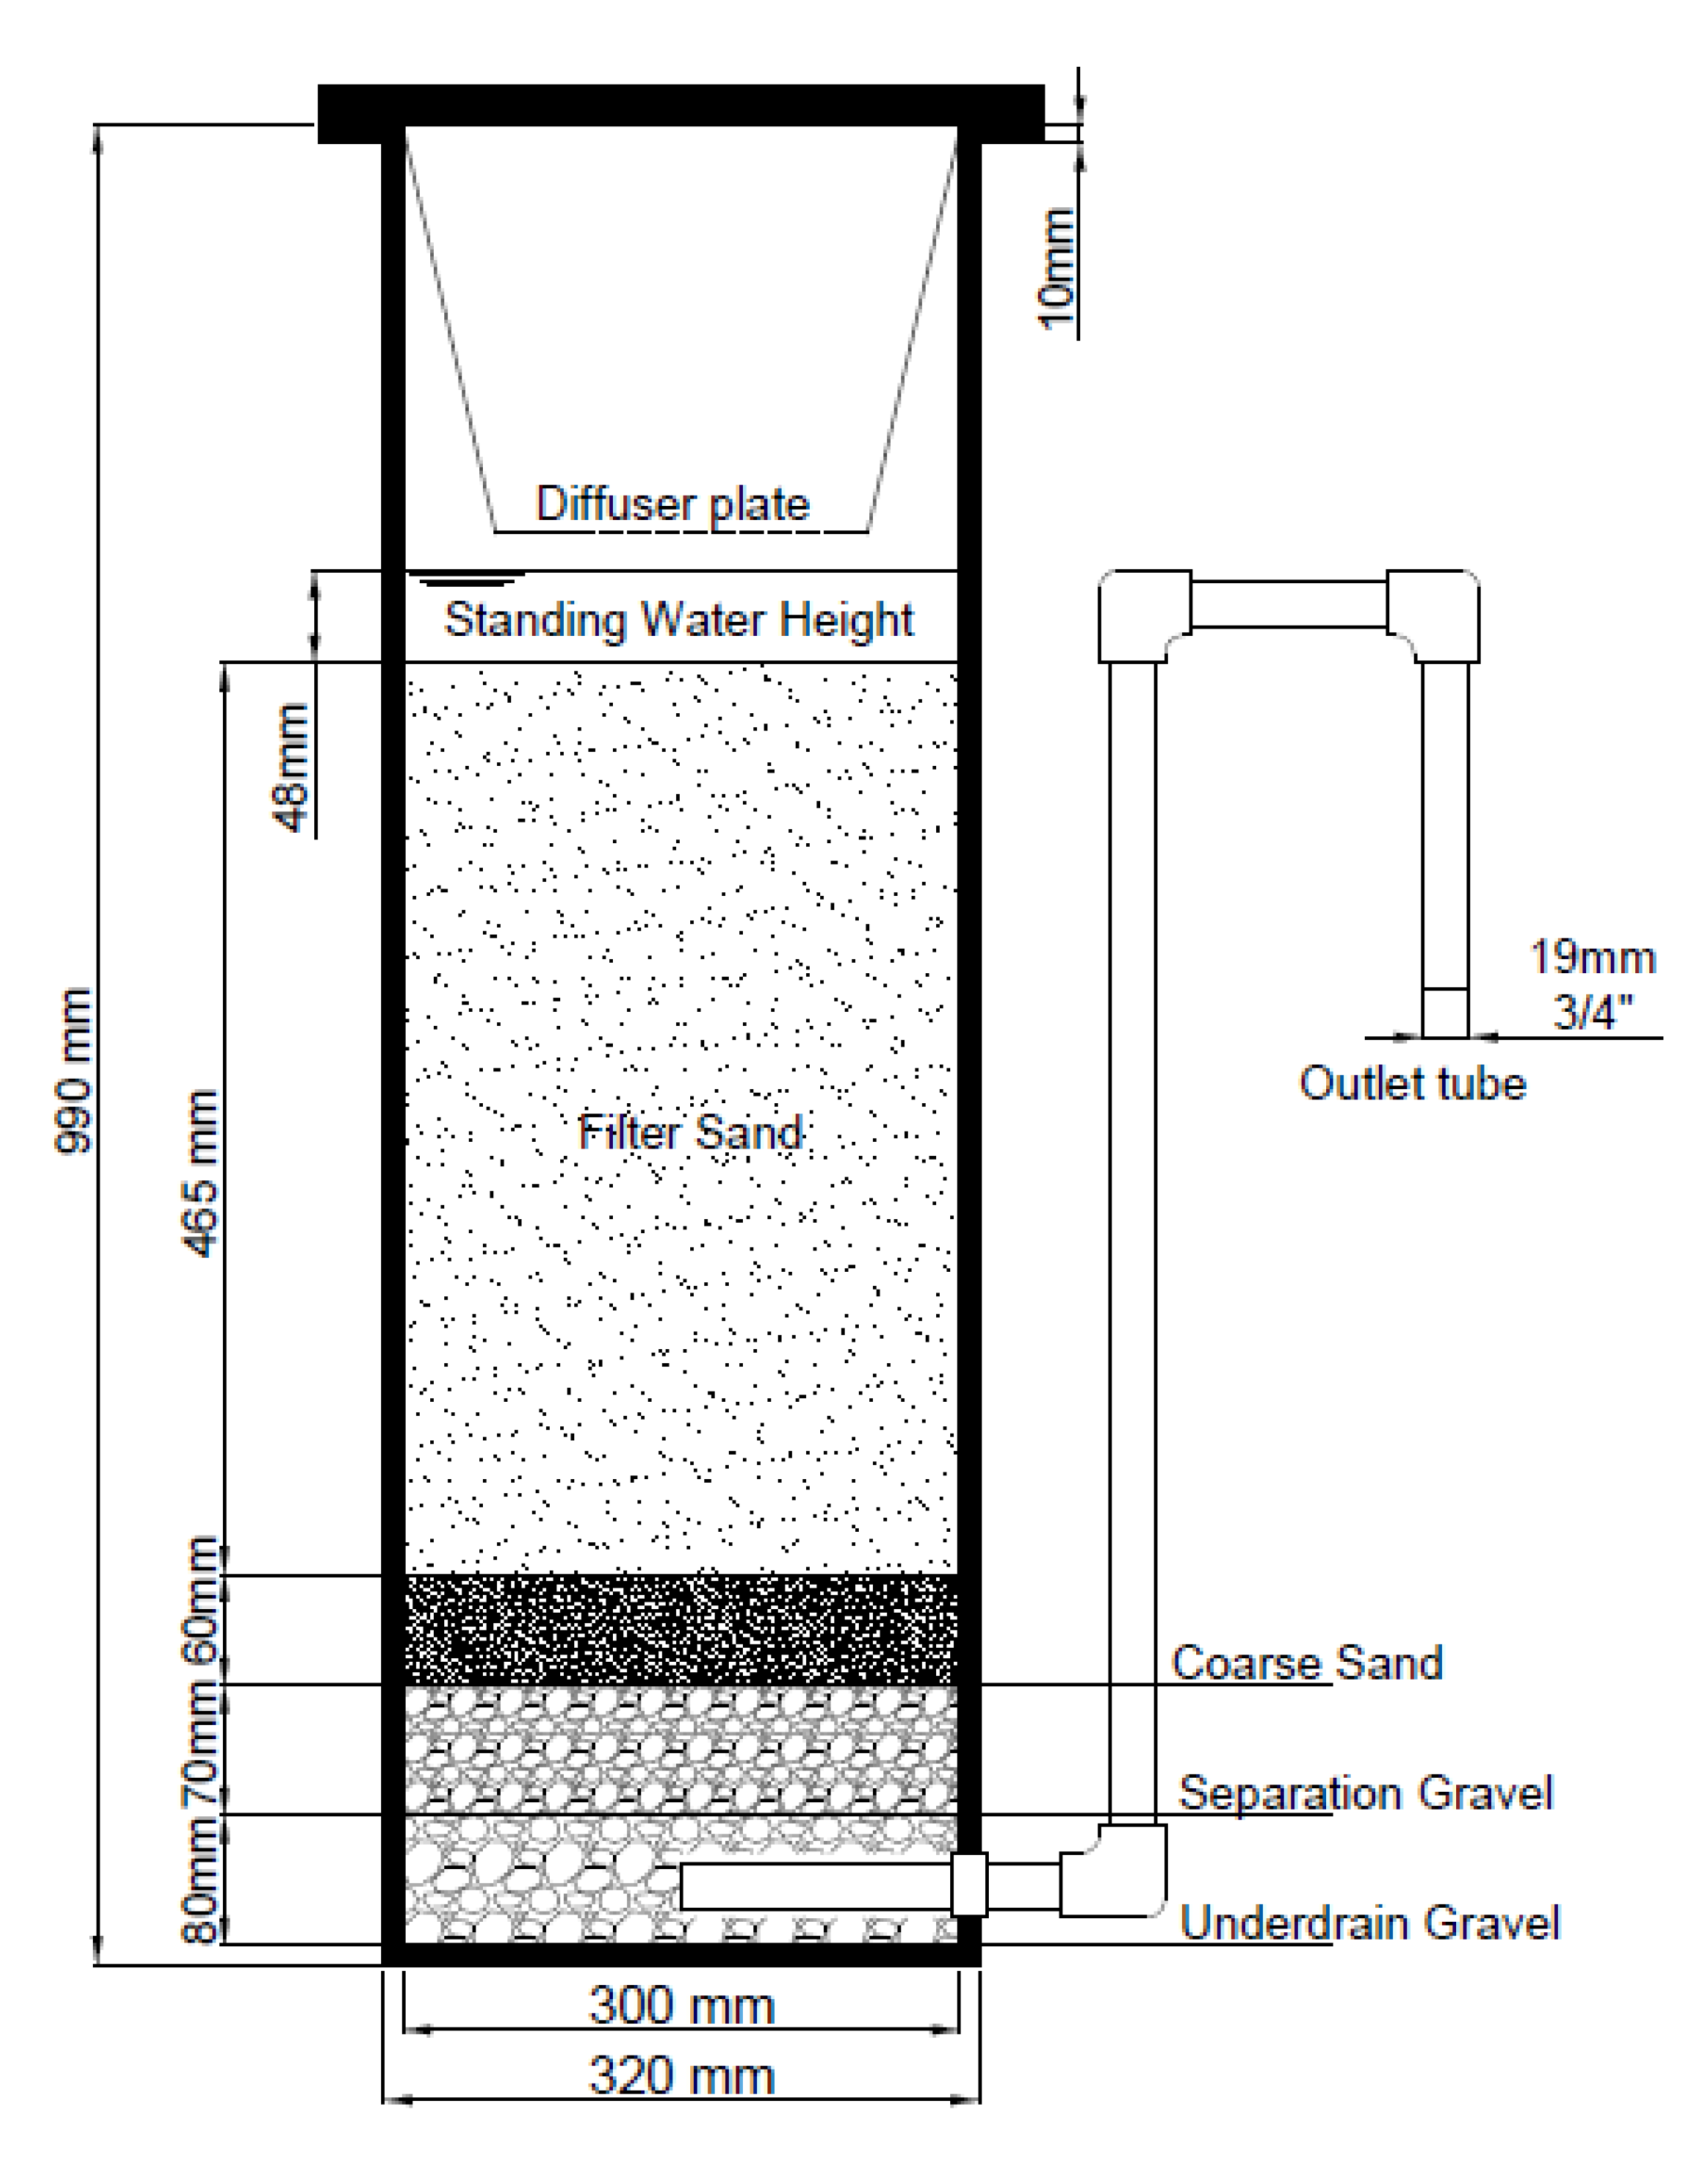
2.1. Filter and Media Preparation
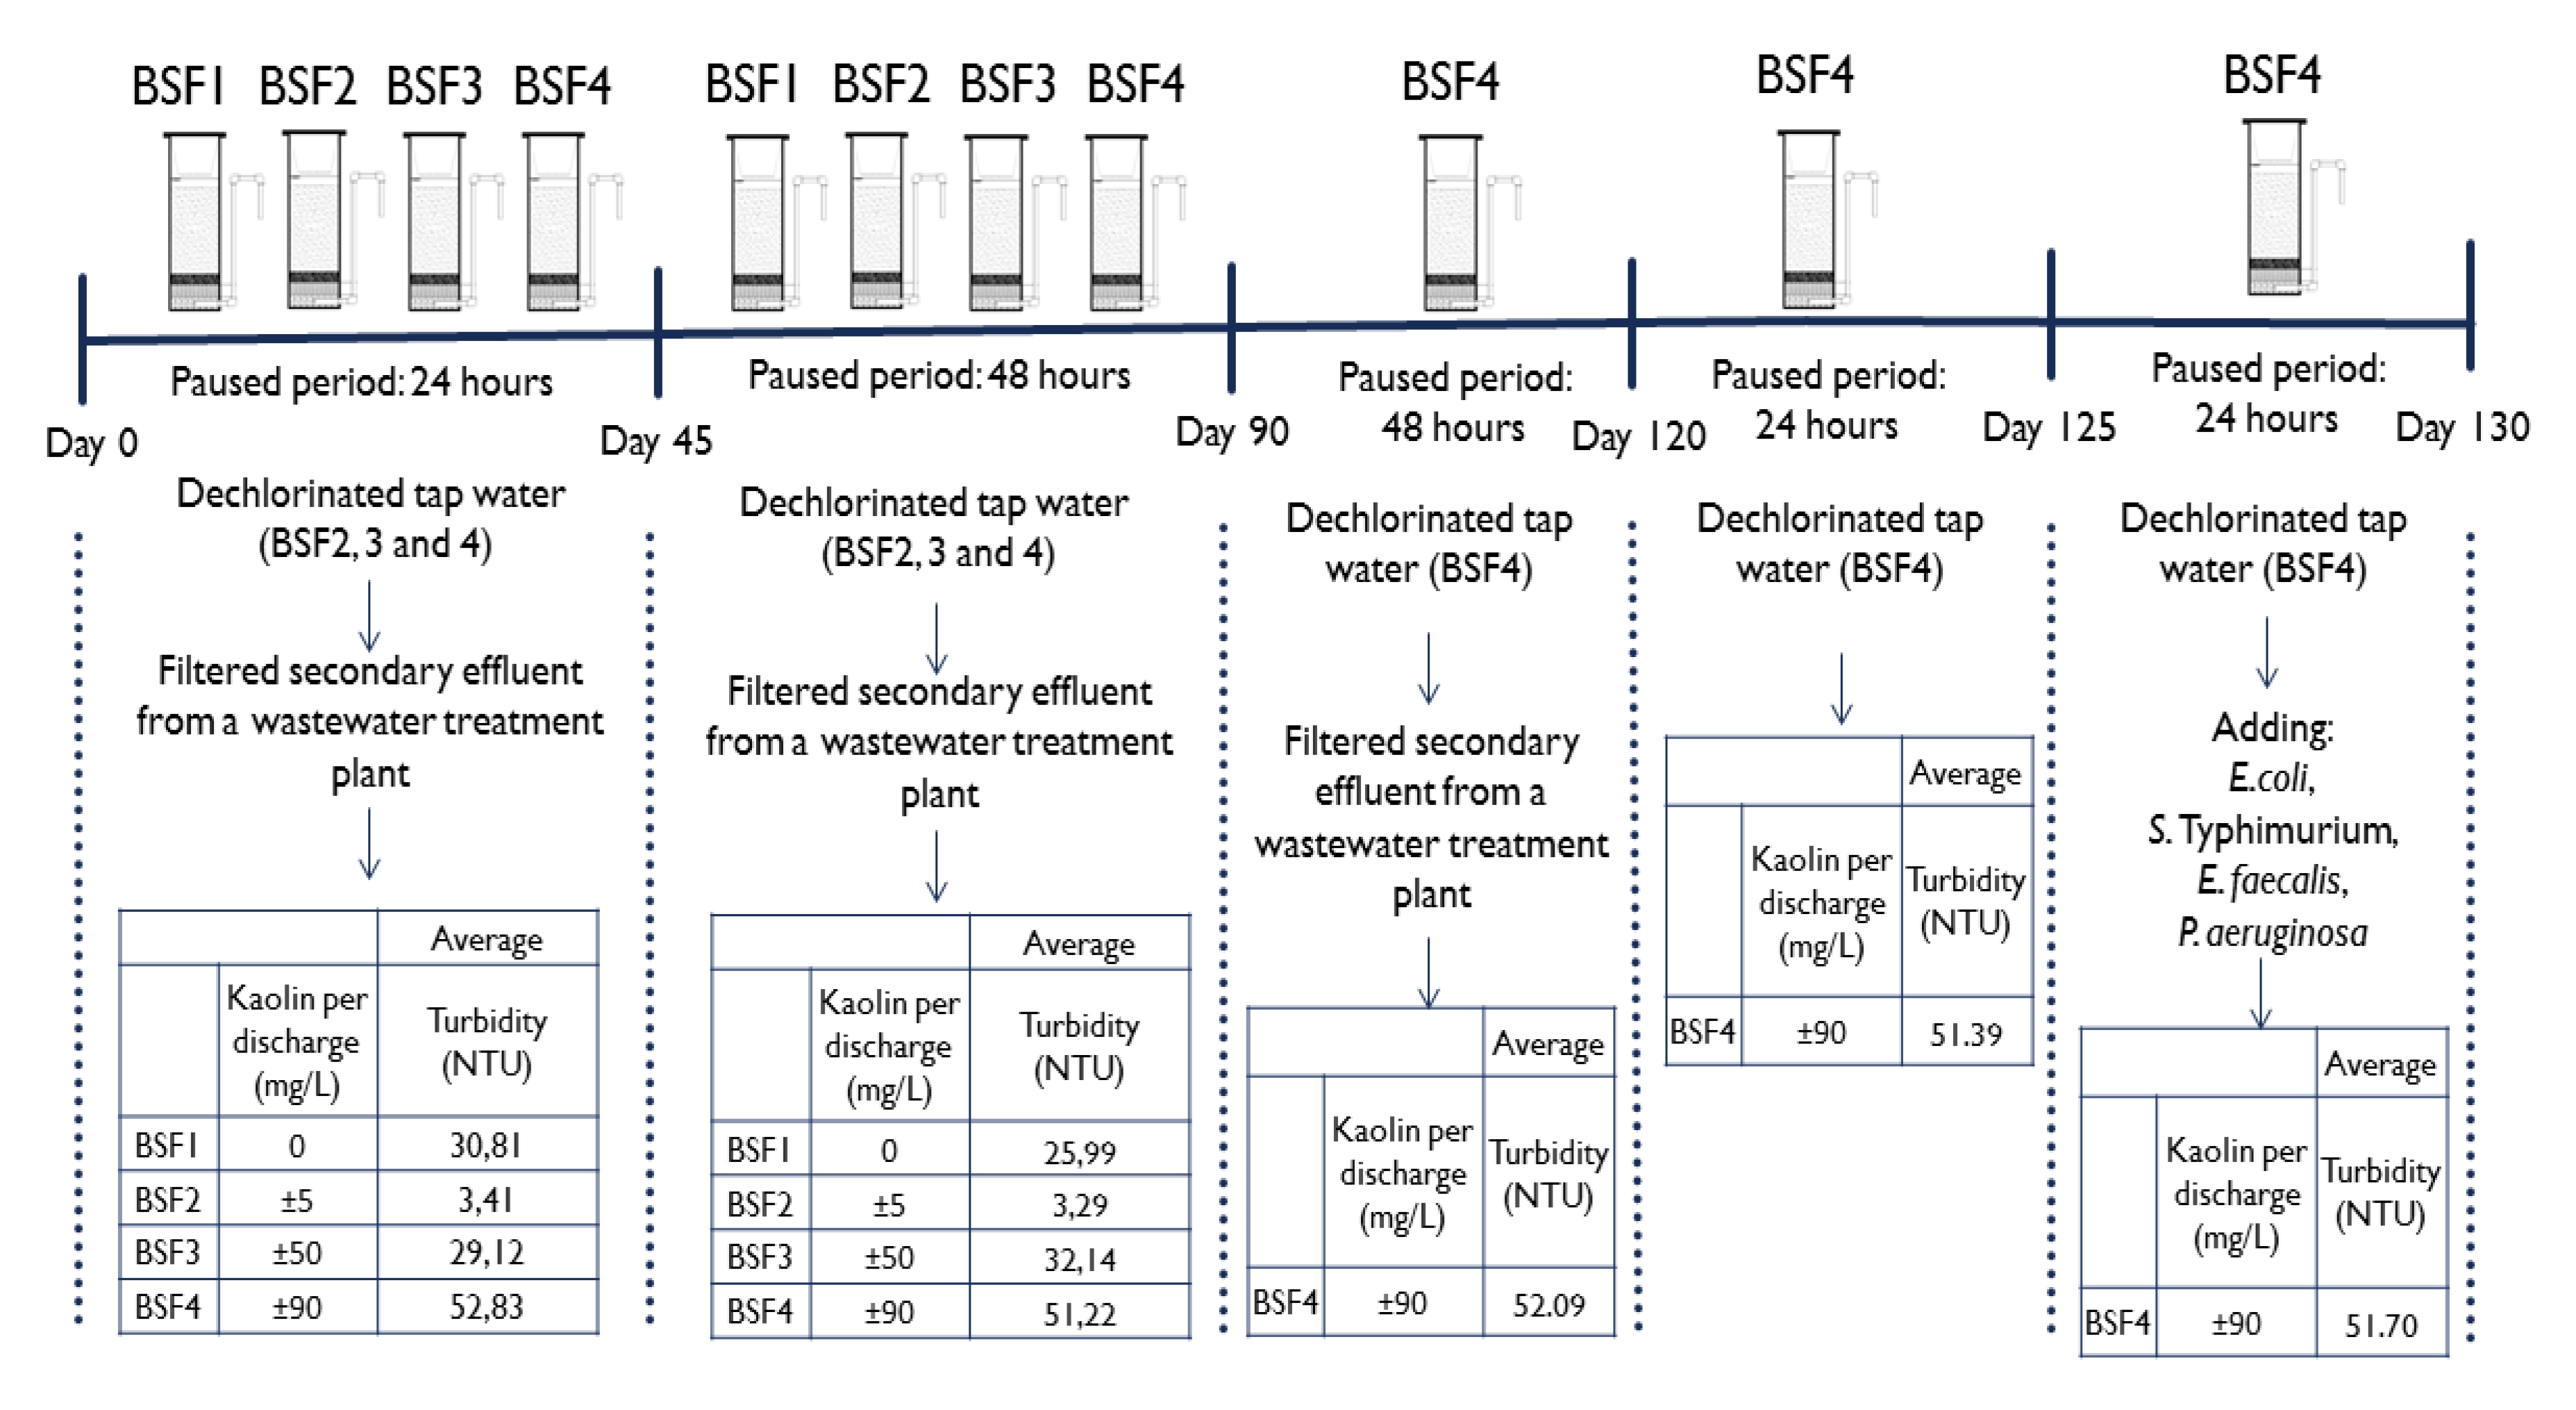
2.2. Feed Water
2.3. Statistical Analysis
2.4. Monitoring
3. Results and Discussion
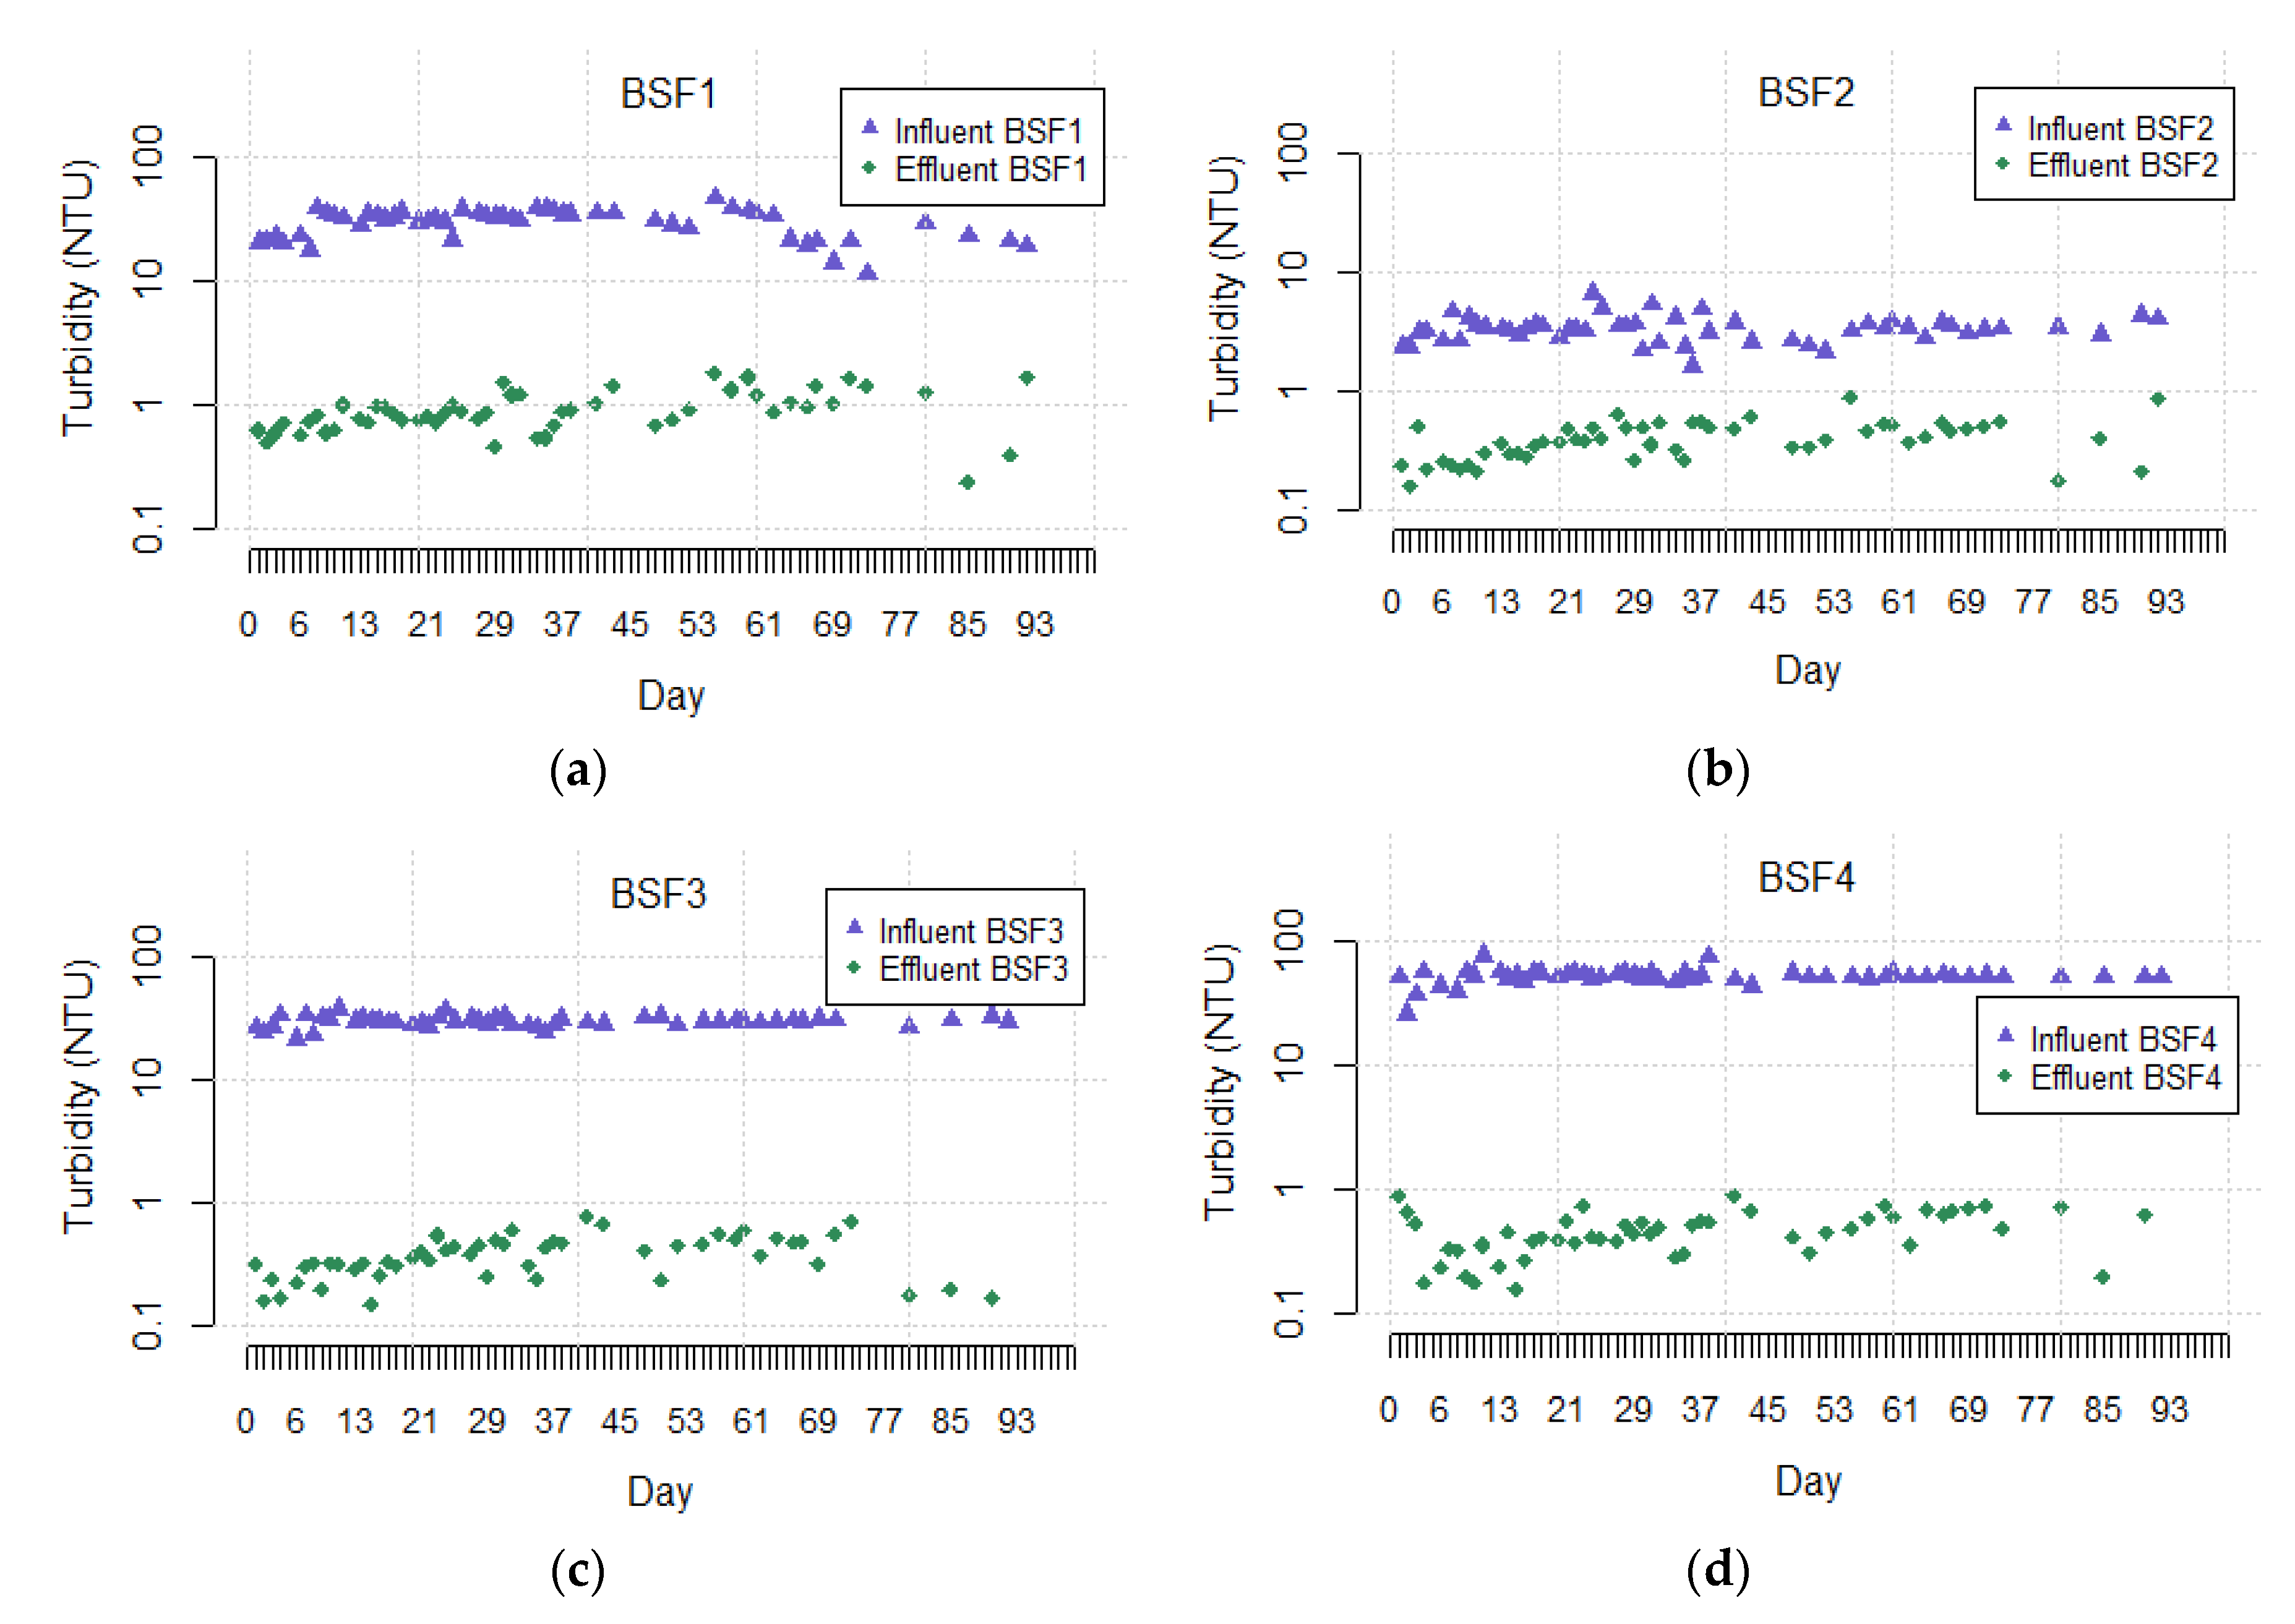
3.1. Turbidity Removal
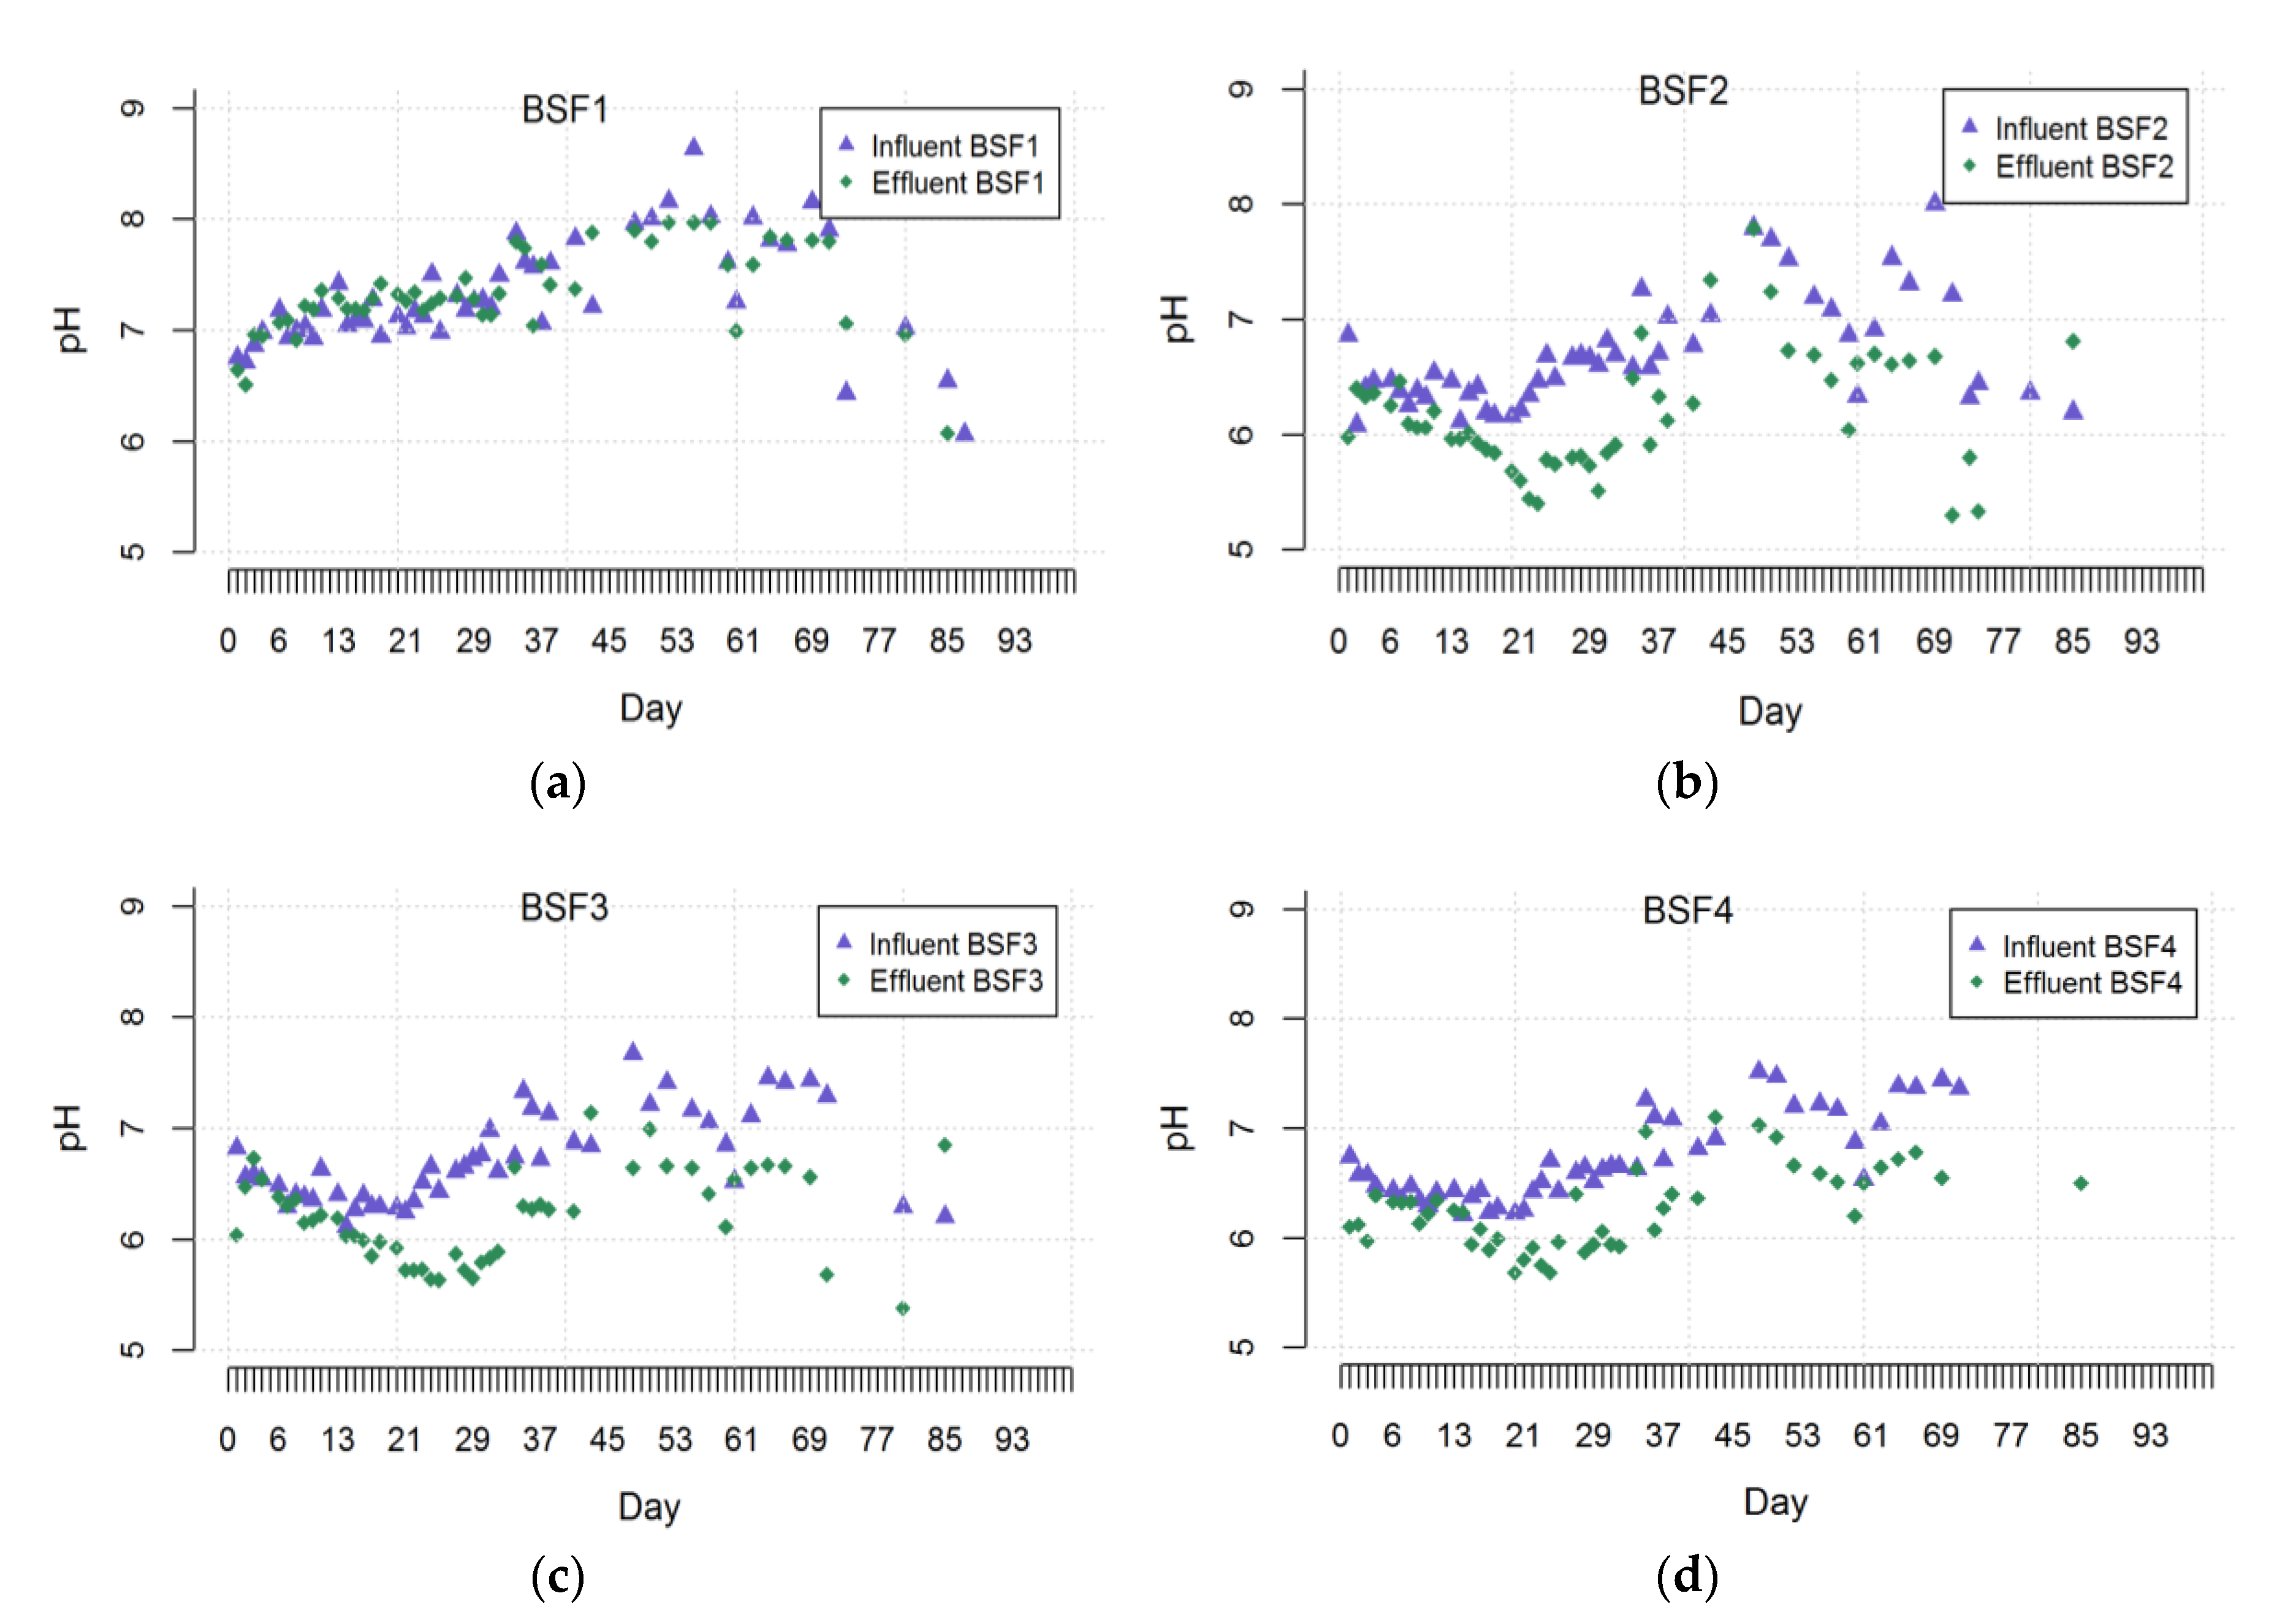
3.2. pH
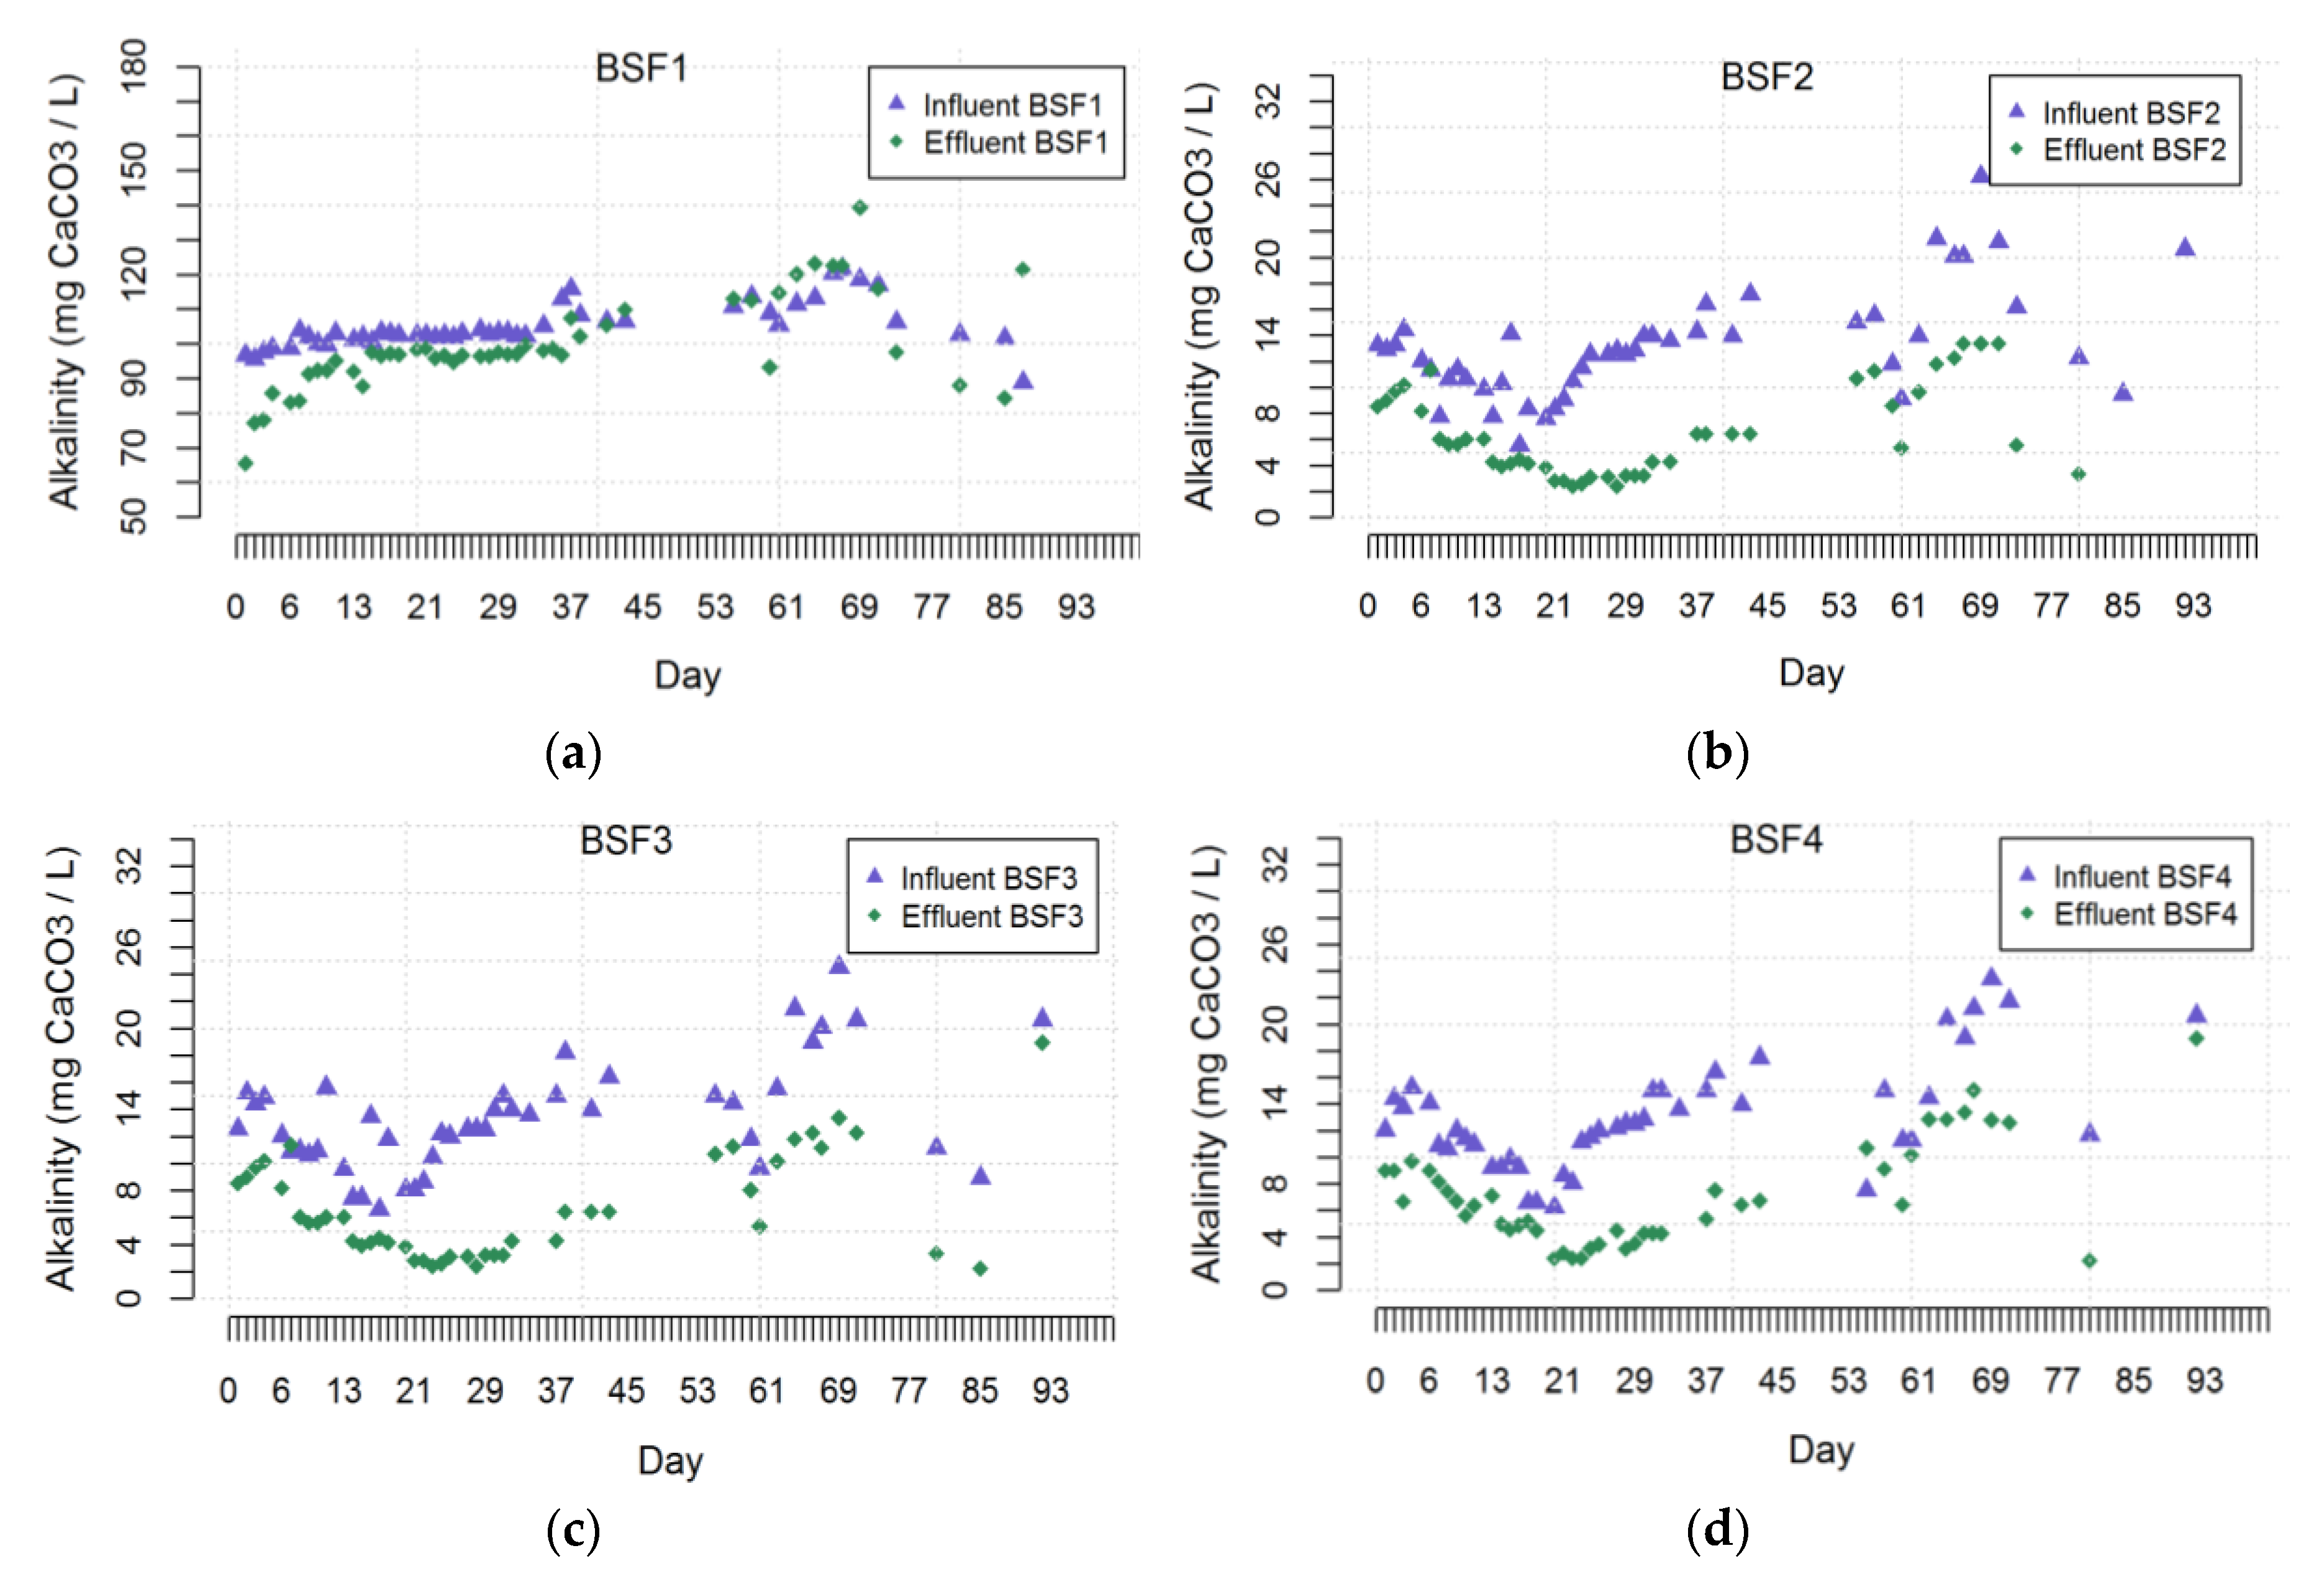
3.3. Alkalinity
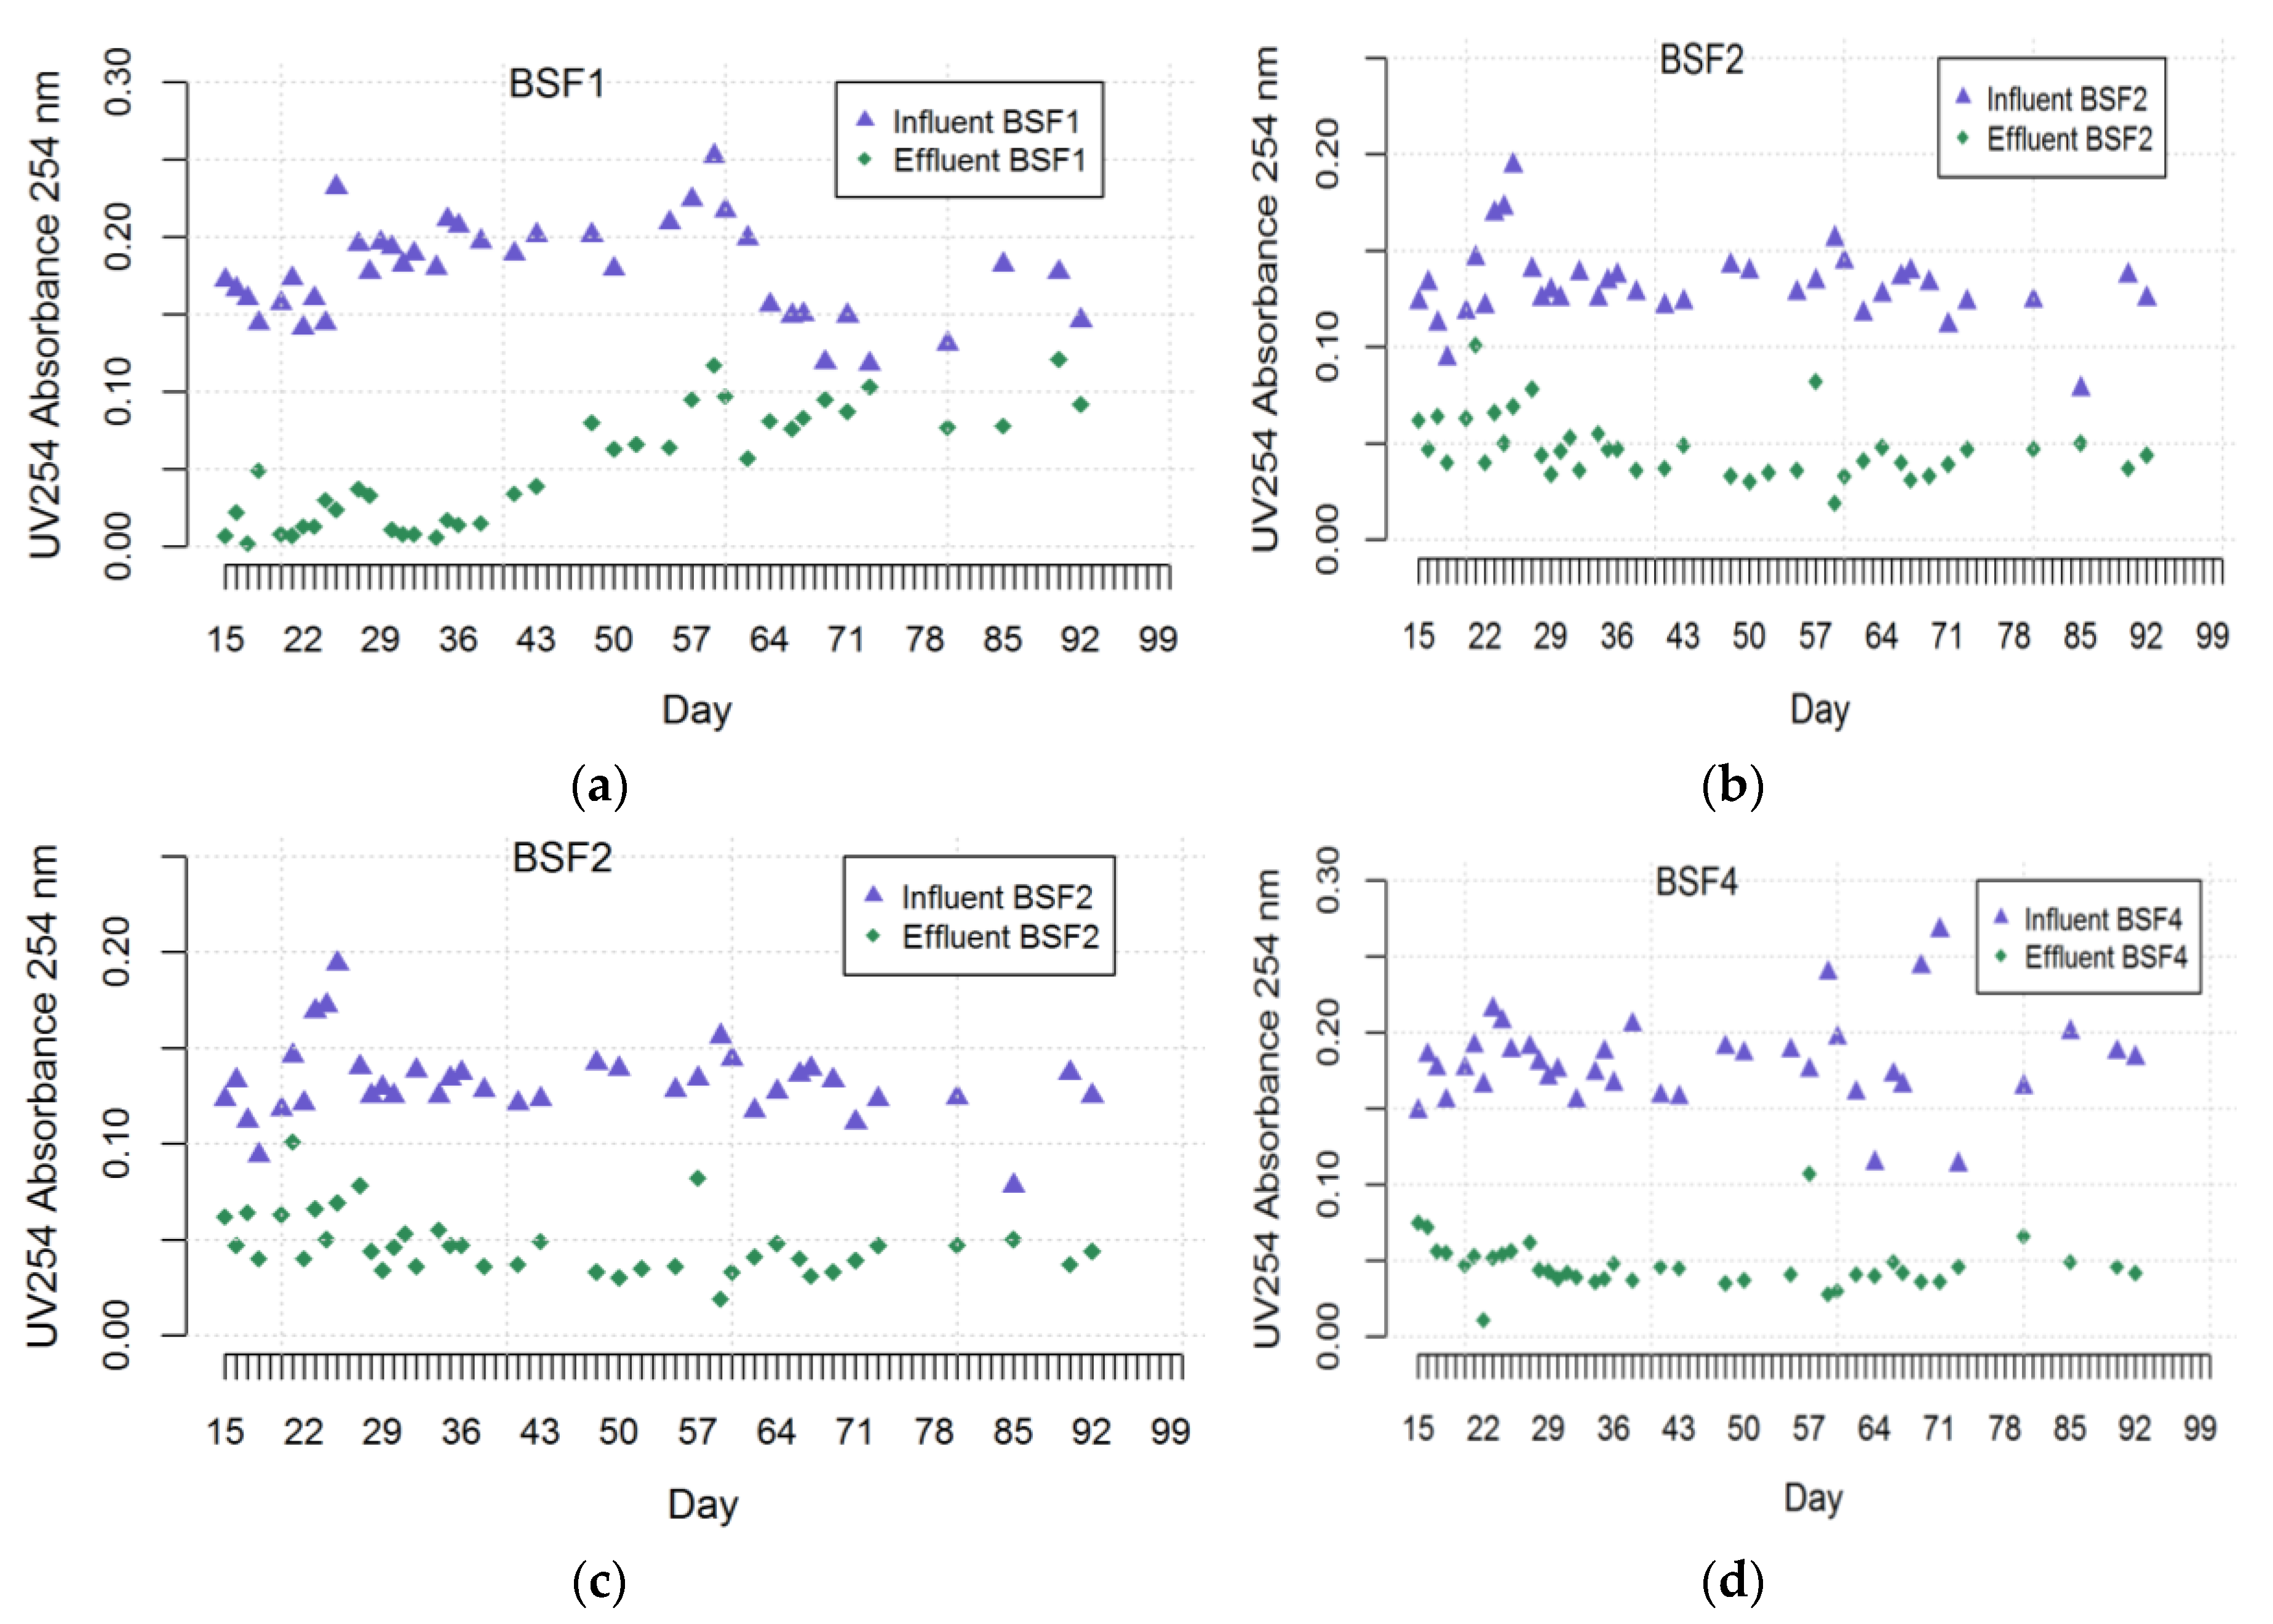
3.4. UV254 Absorbance
3.5. Nitrate
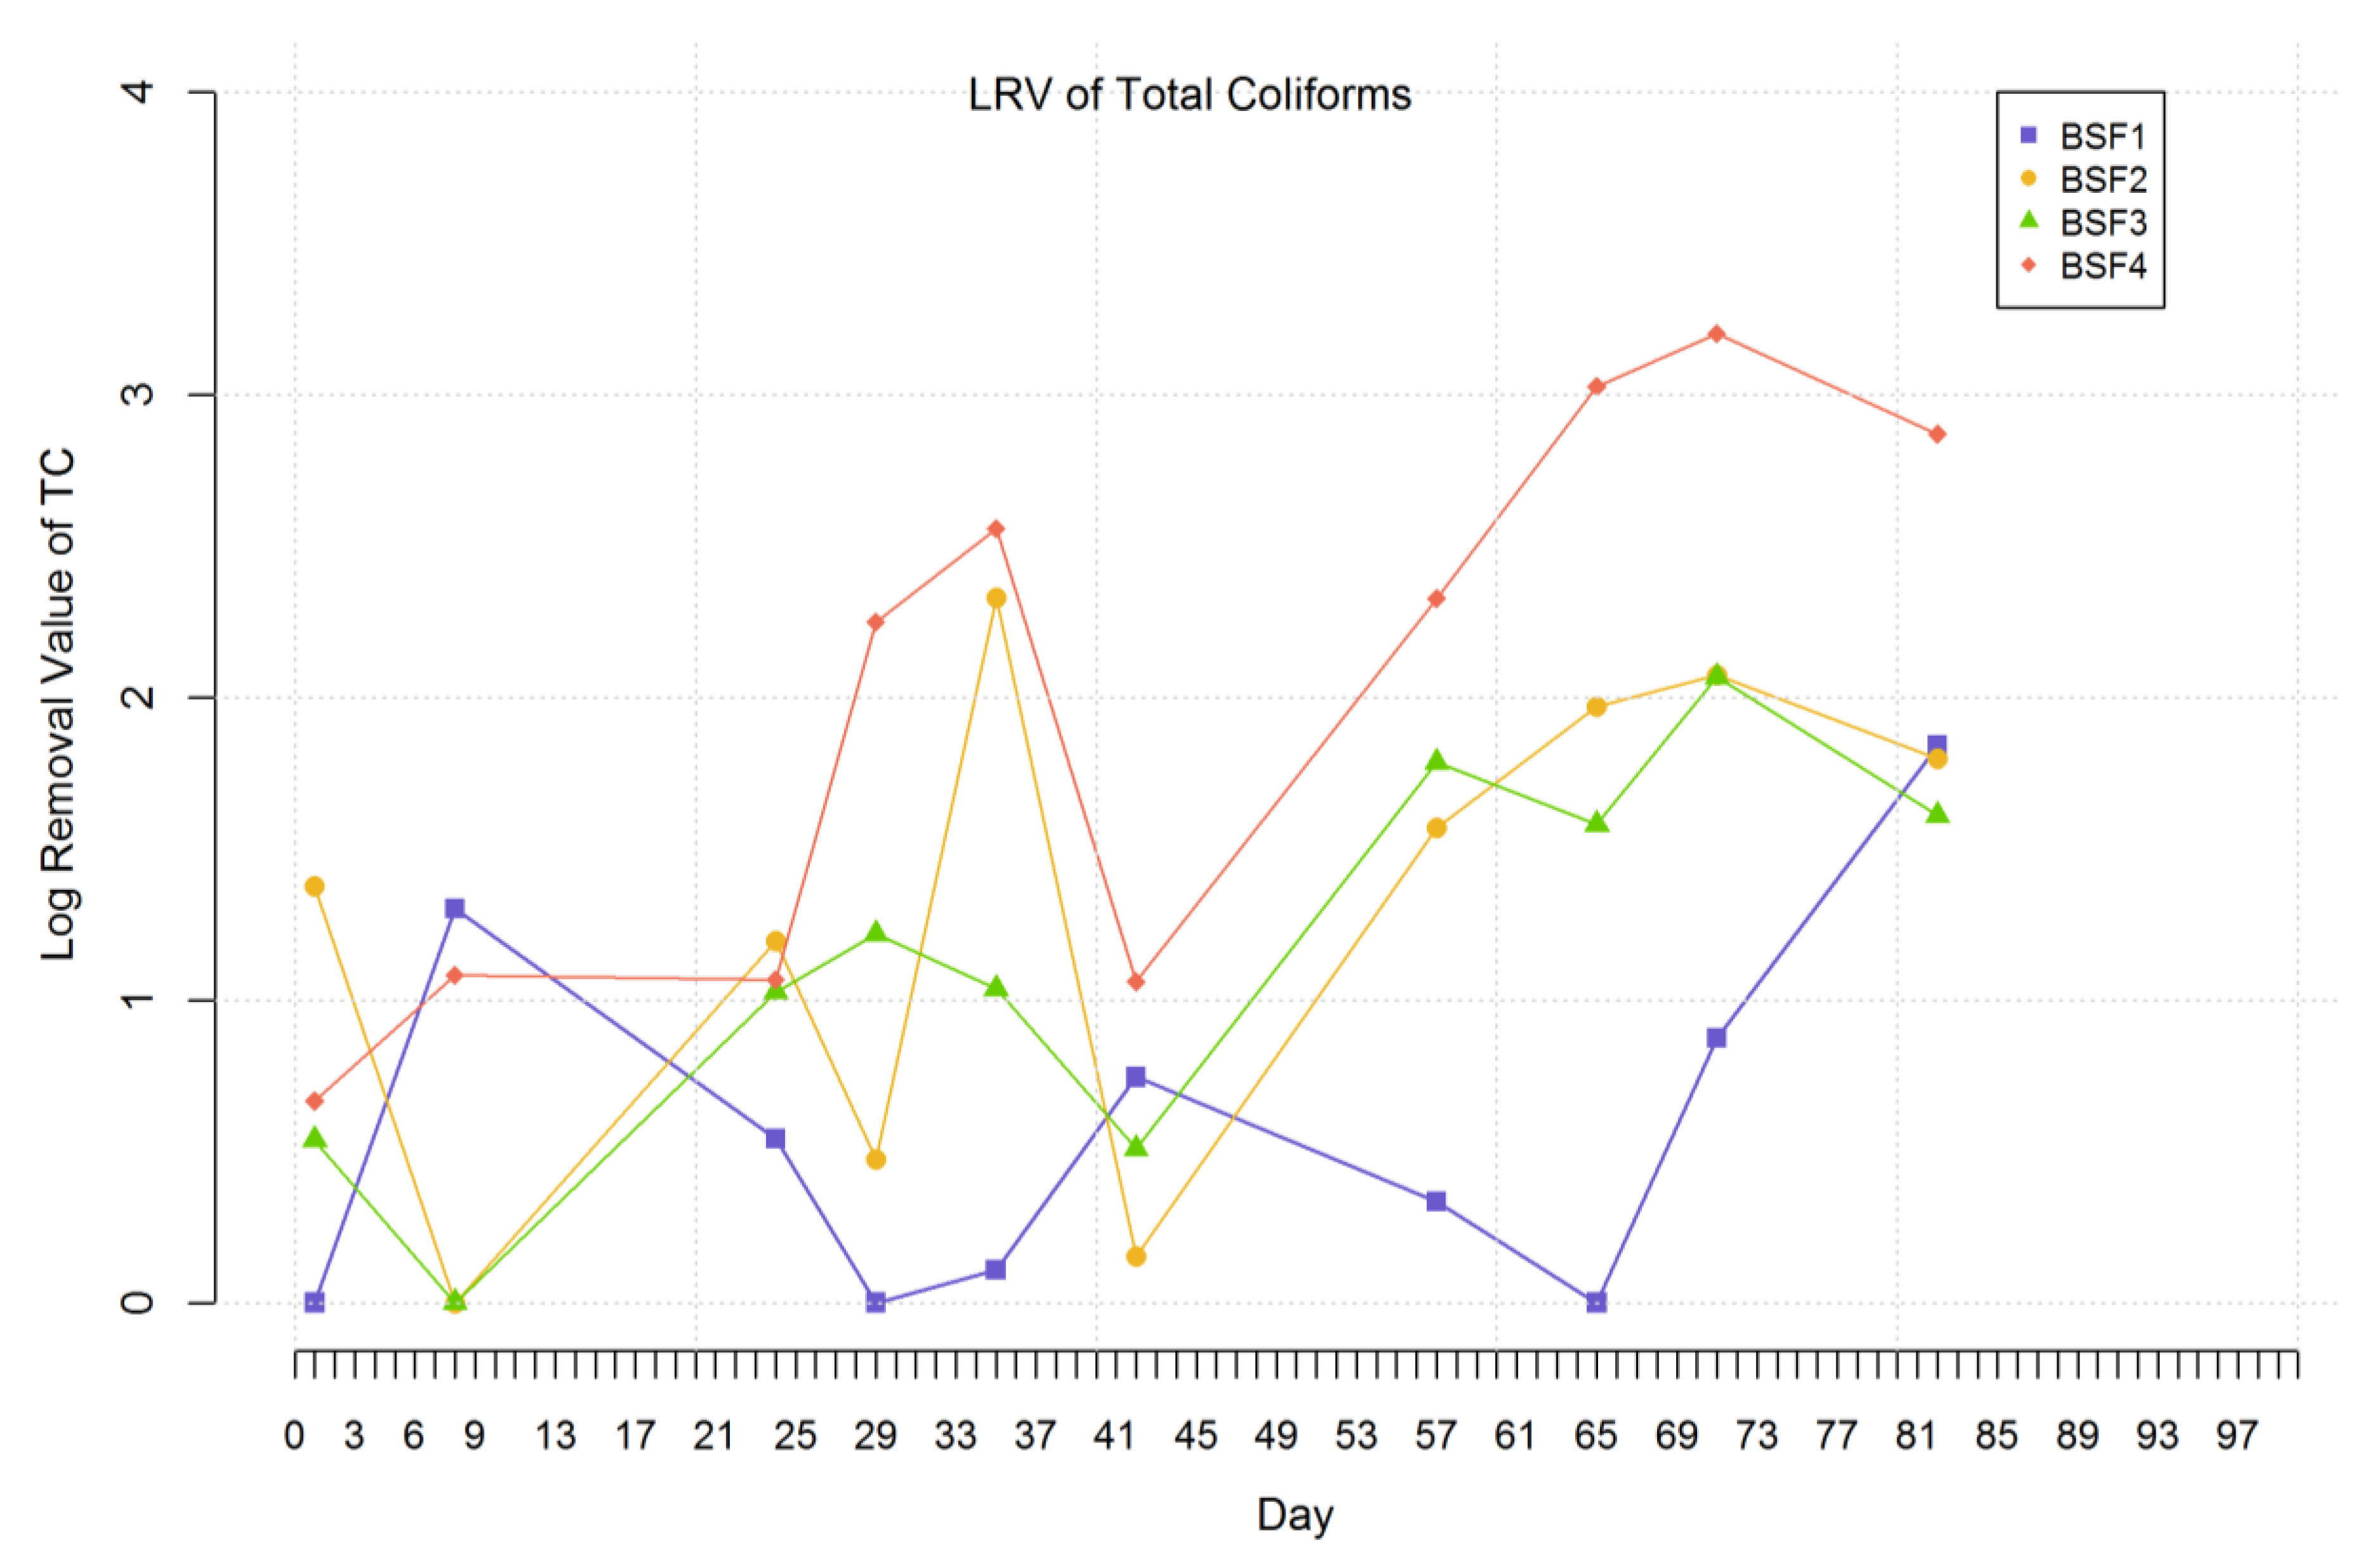
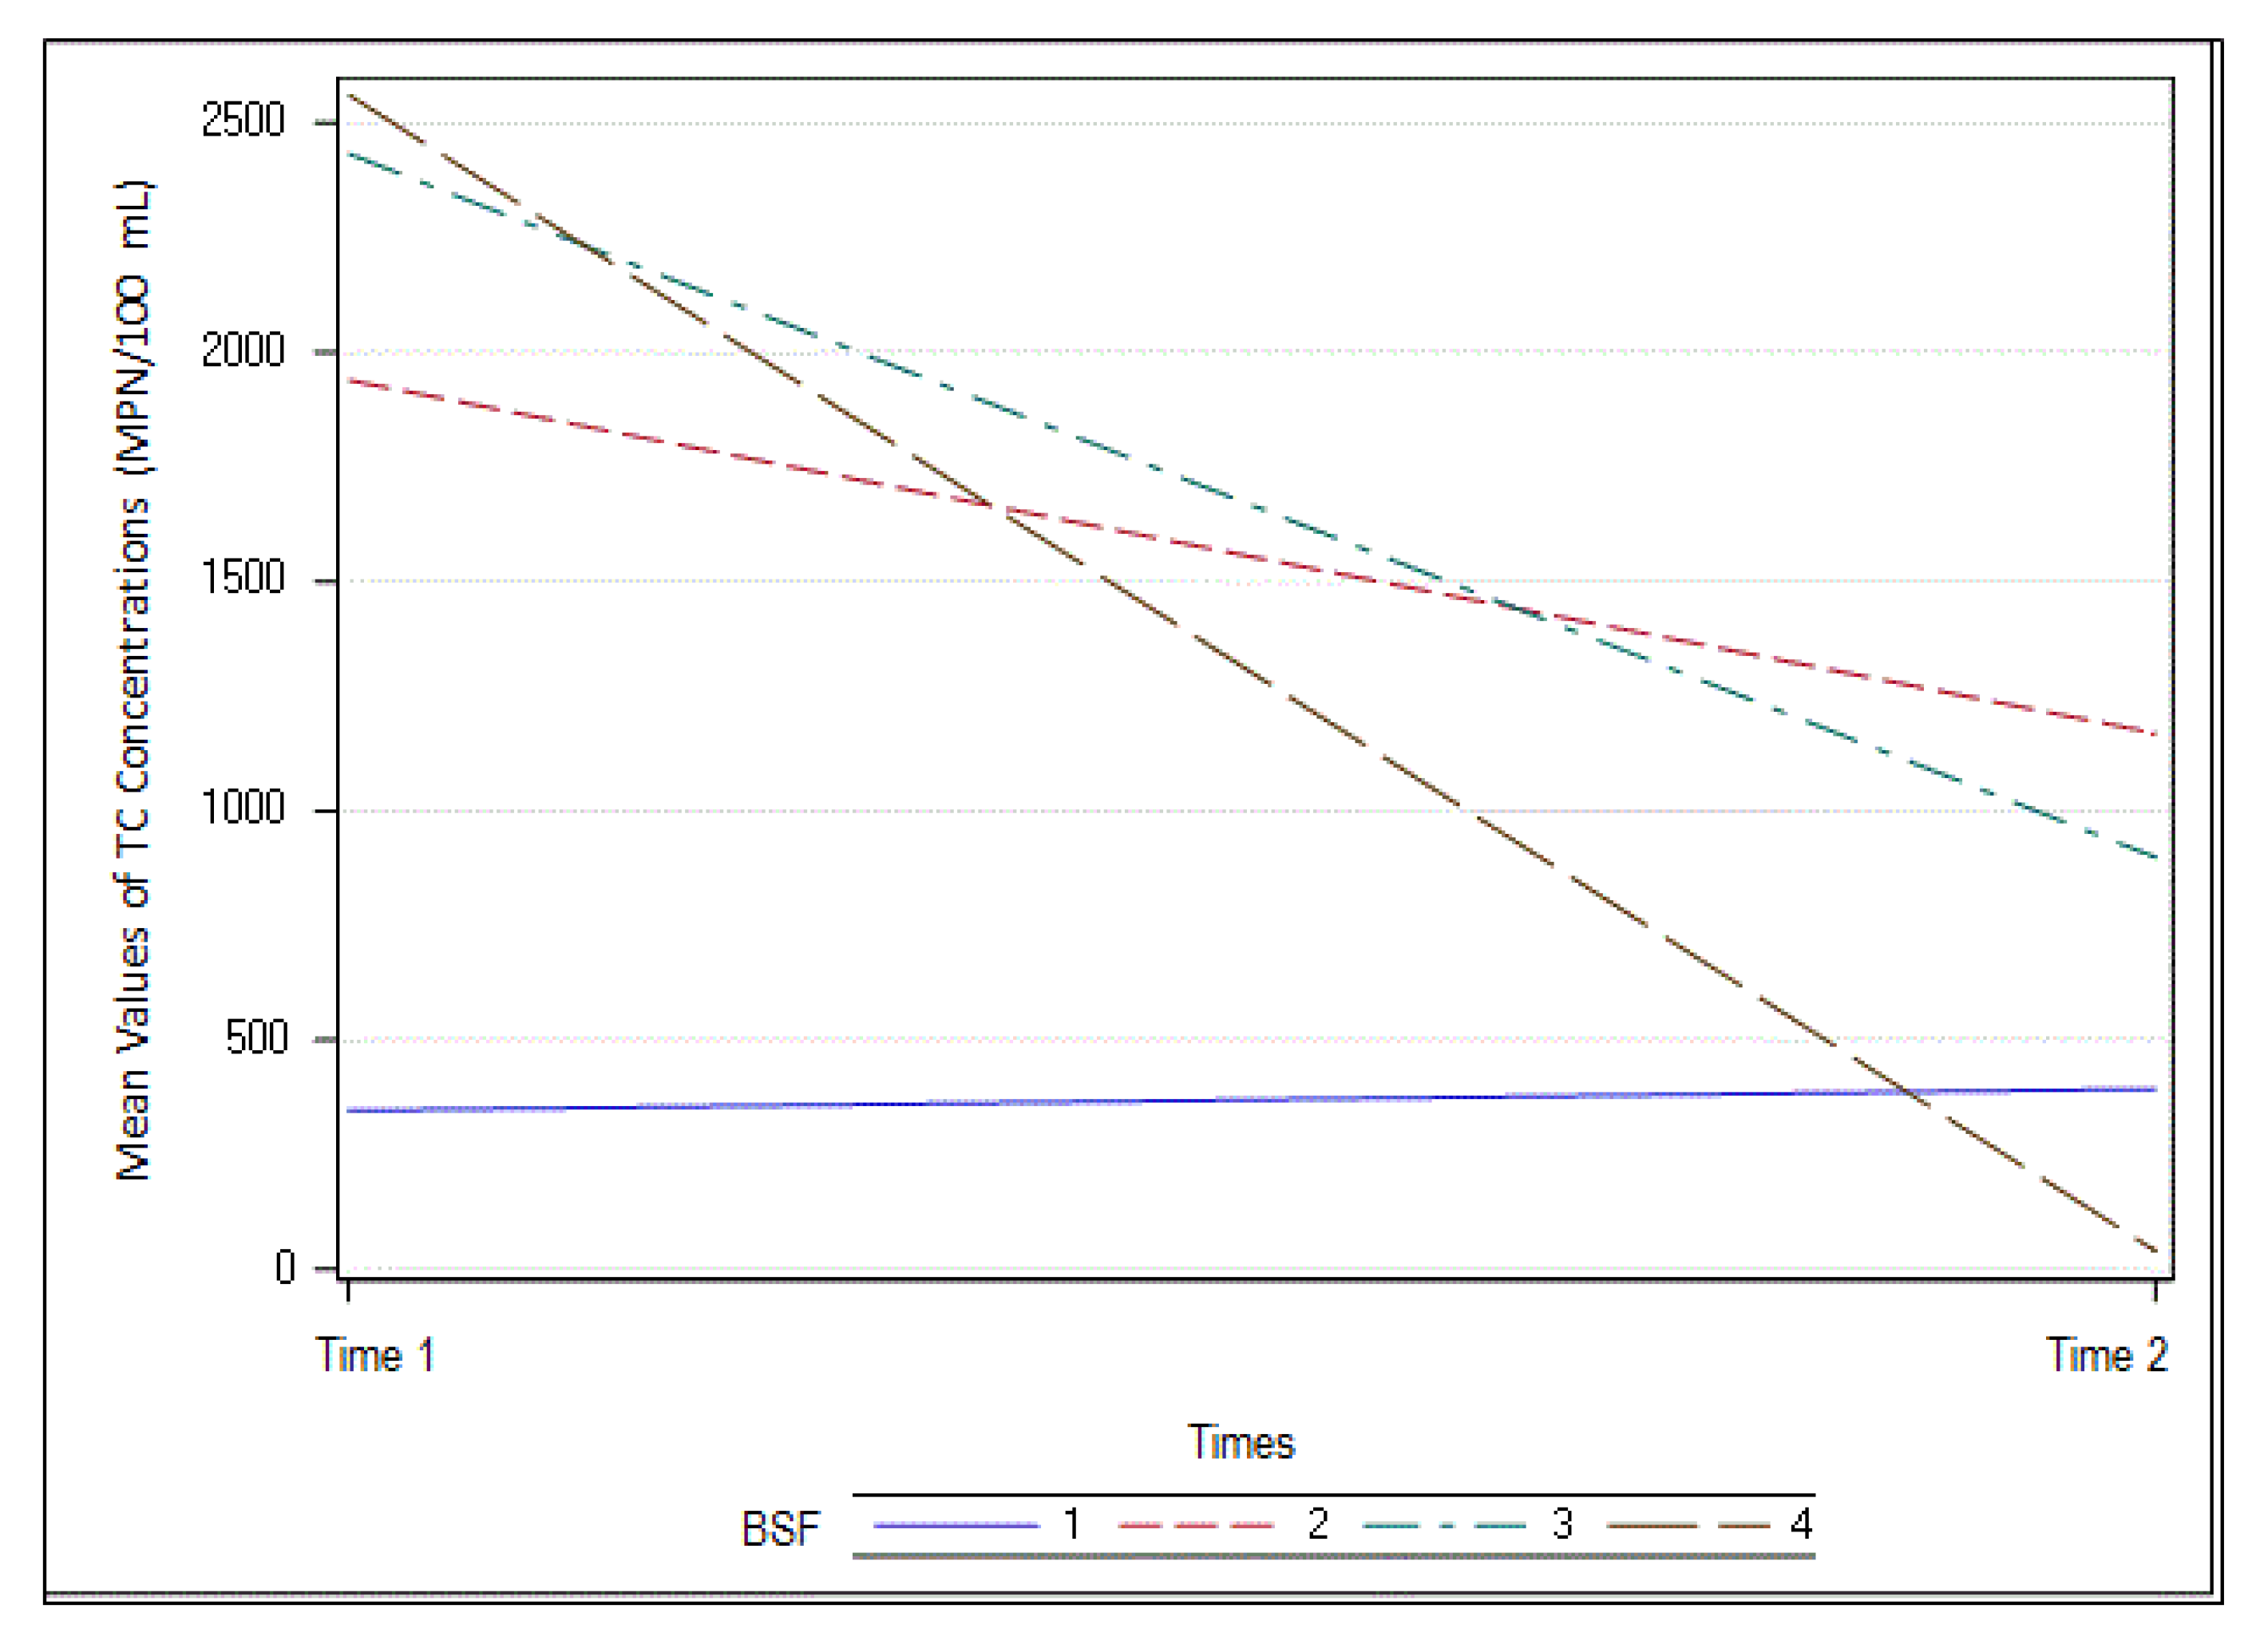
3.6. Total Coliform Reduction
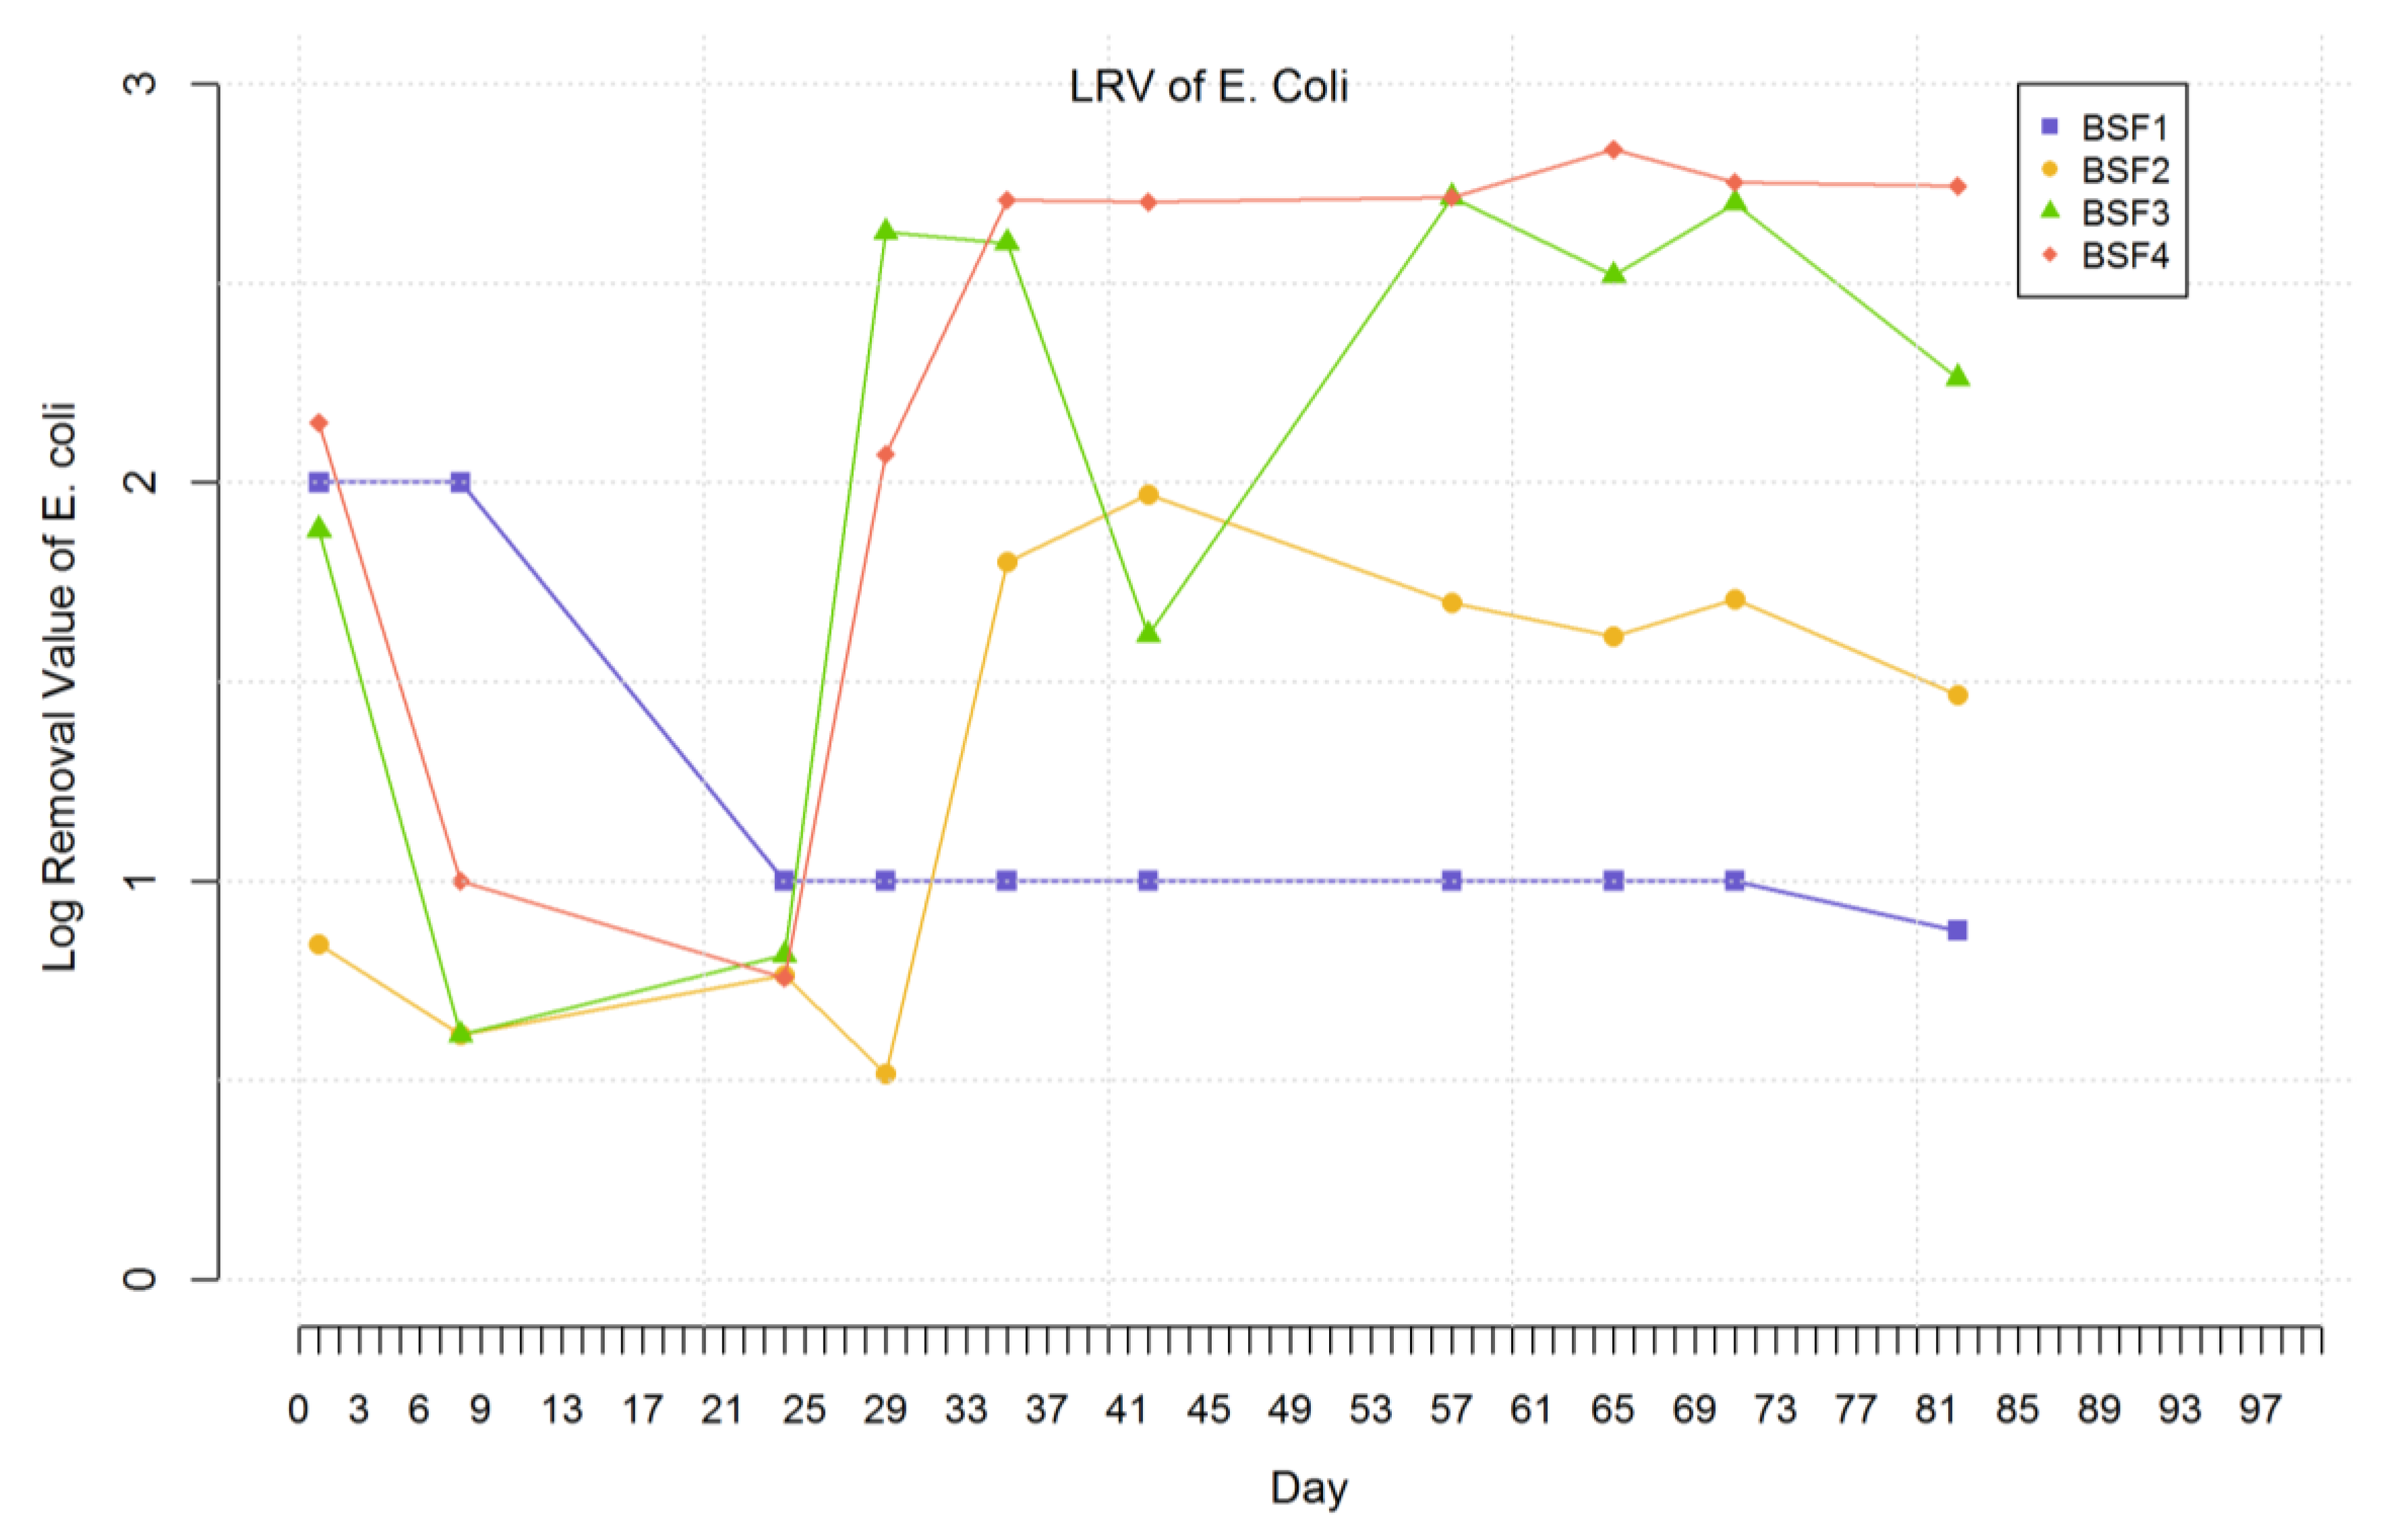
3.7. Escherichia coli
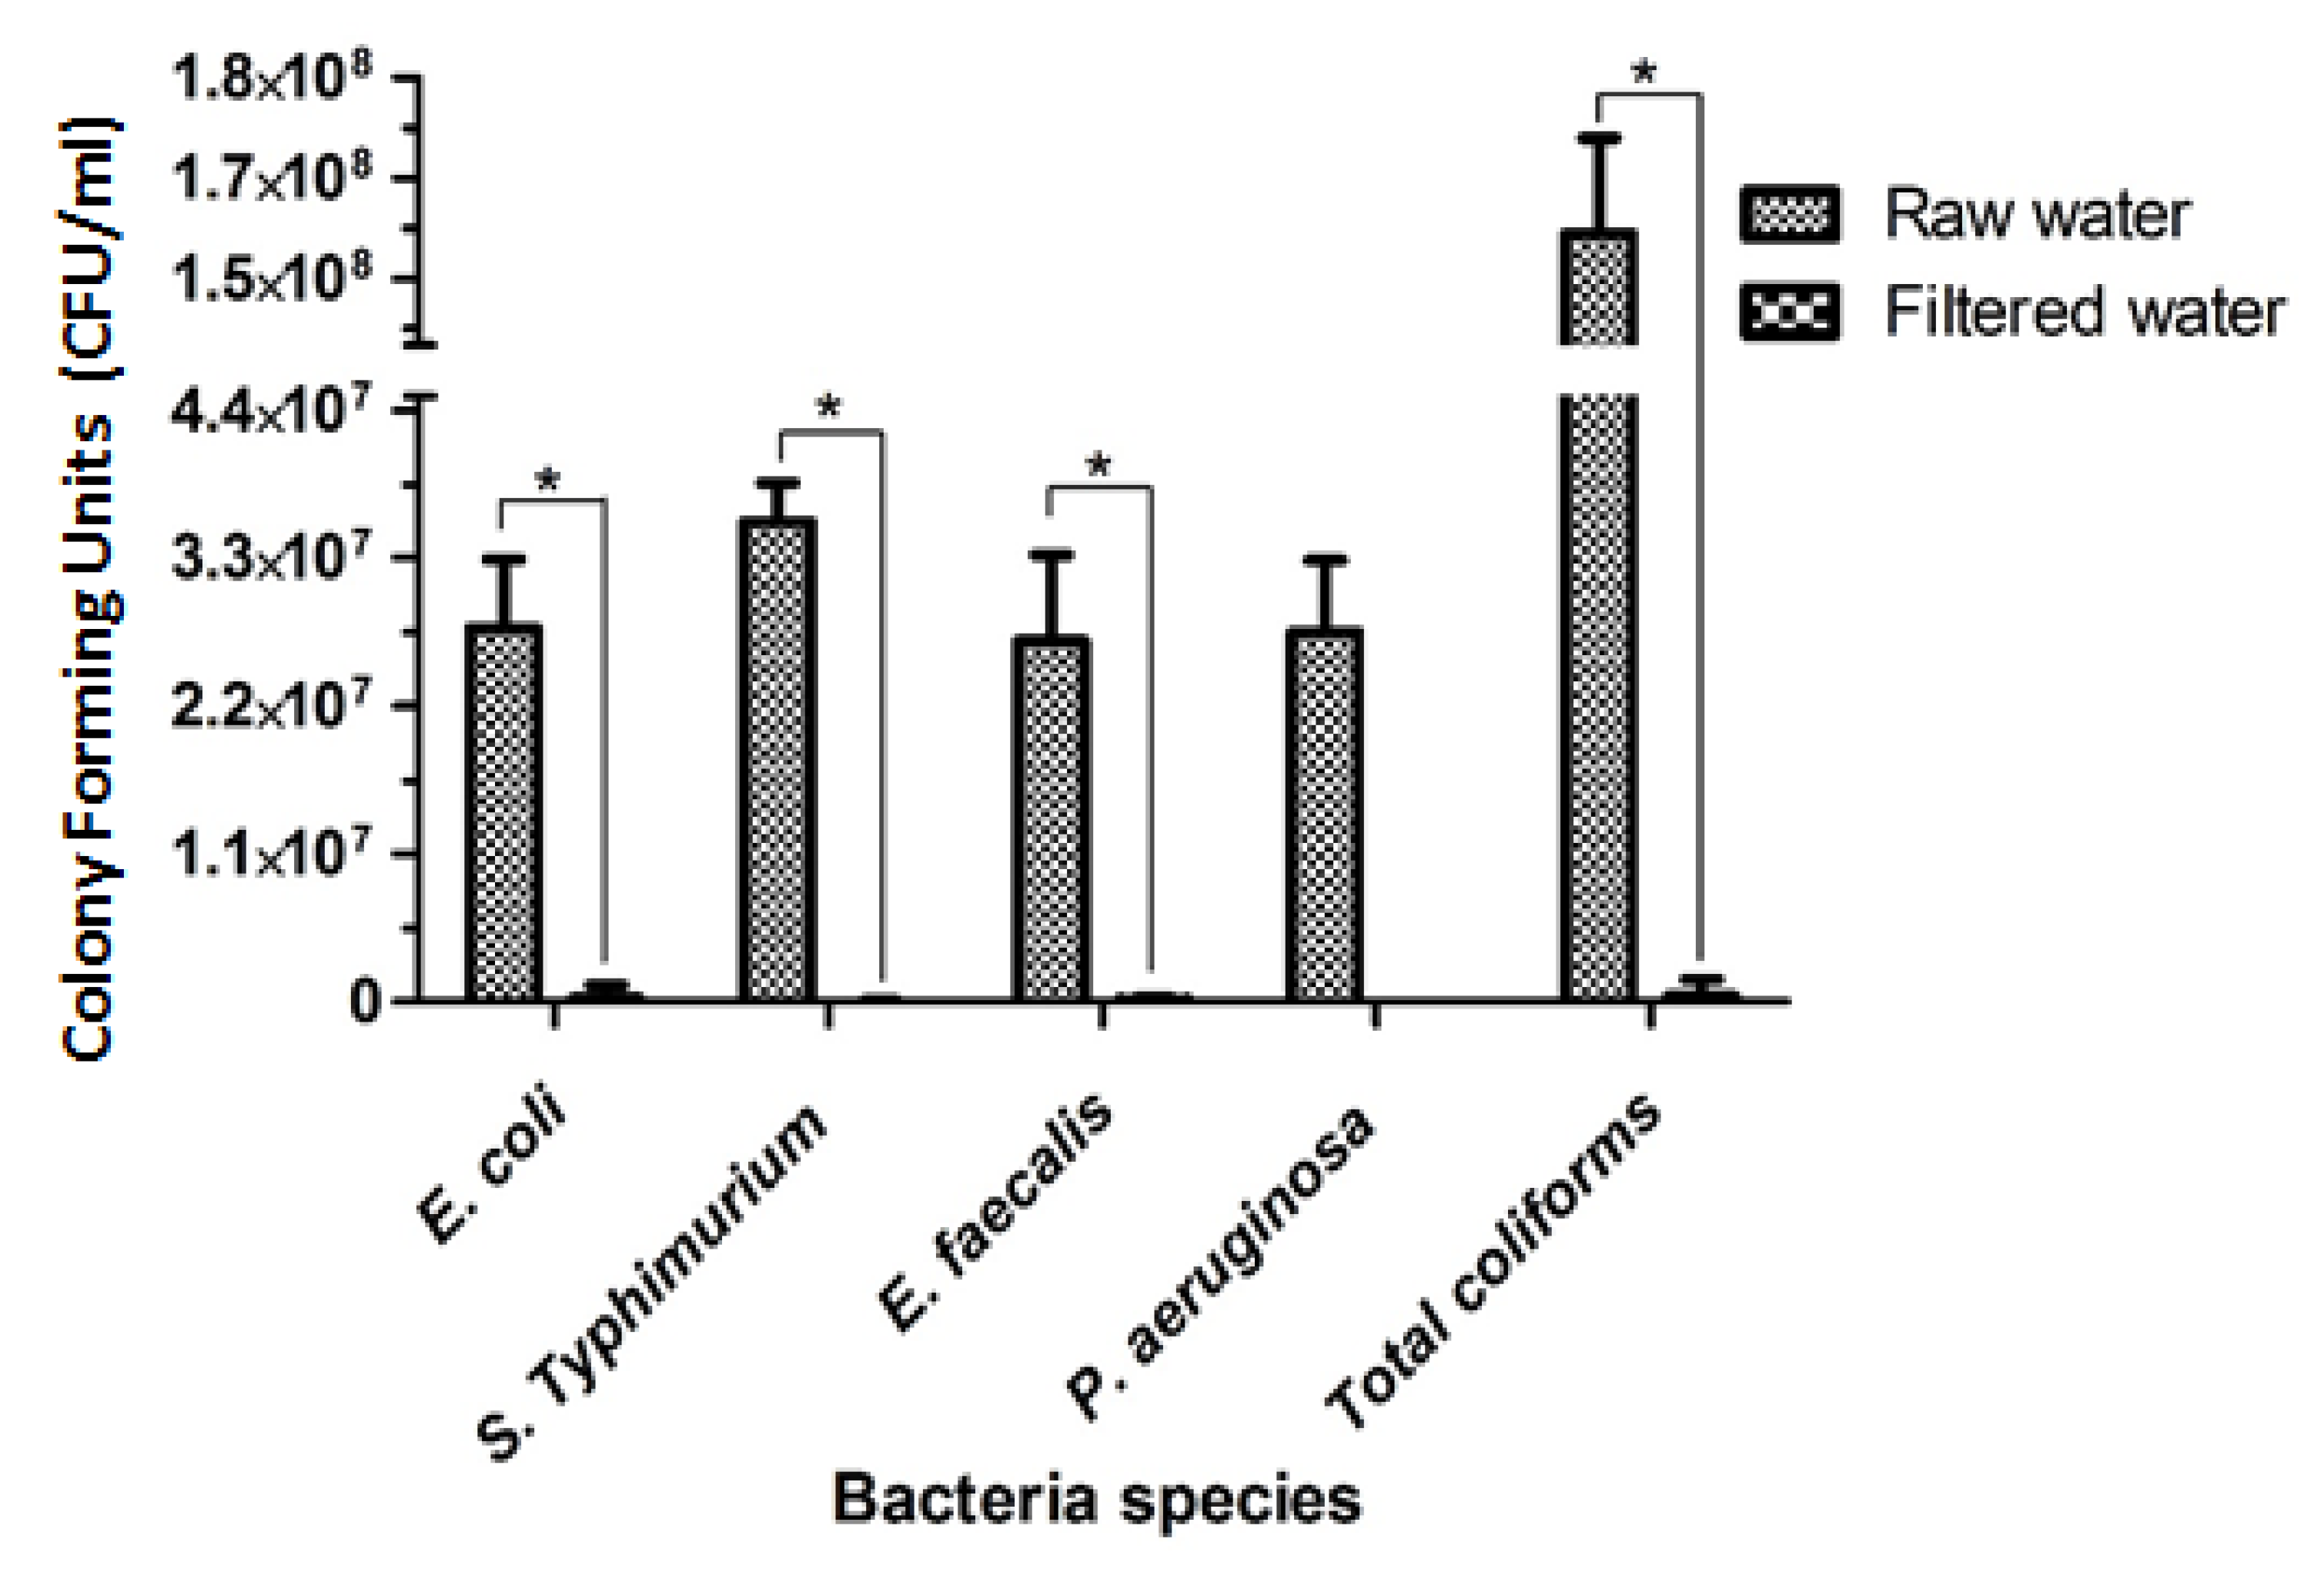
3.8. Reduction in Salmonella Typhimurium DT177, Enterococcus faecalis ATCC® 29212, Pseudomonas aeruginosa ATCC® 27853 and Escherichia coli ATCC® 25922
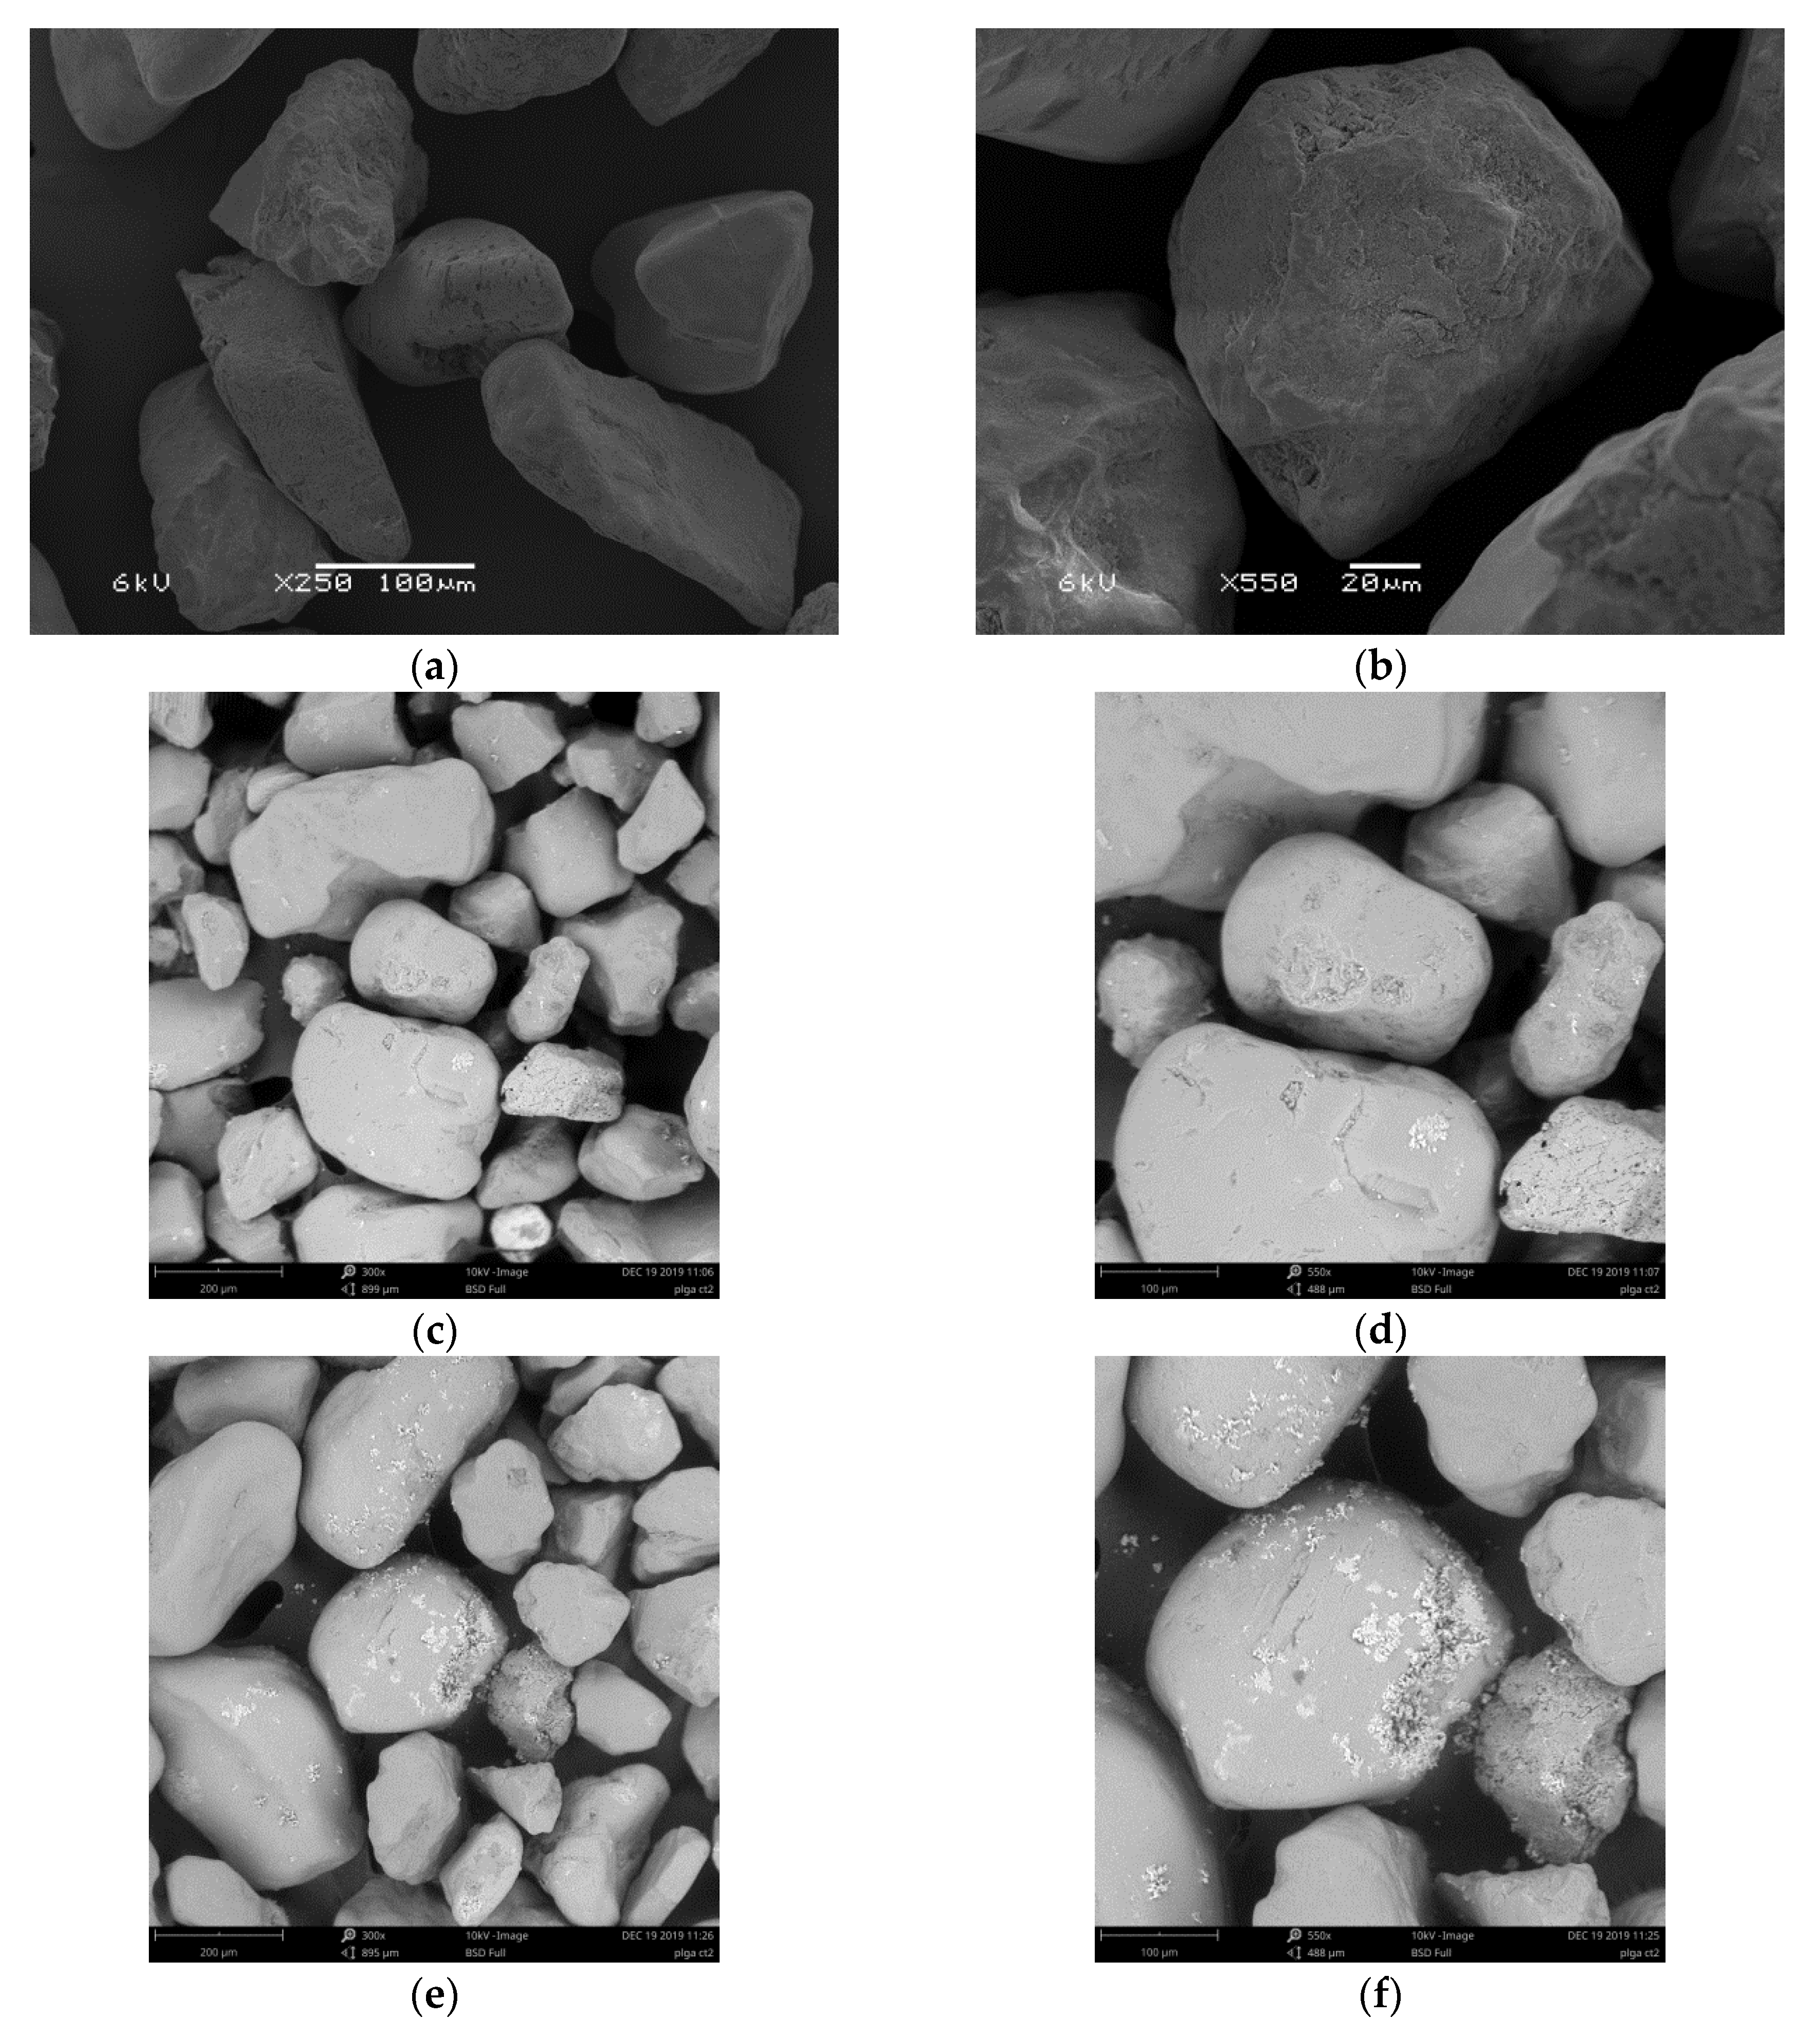
3.9. Scanning Electron Microscopy
4. Conclusions
Author Contributions
Funding
Acknowledgments
Conflicts of Interest
References
- JMP (Joint Monitoring Program). Progress on Drinking Water, Sanitation and Hygiene: 2017 Update and SDG Baselines; Technical Report; WHO/UNICEF Joint Monitoring Program for Water Supply and Sanitation; 2017; Available online: https://apps.who.int/iris/handle/10665/258617 (accessed on 6 August 2020).
- WHO (World Health Organization); UNICEF-United Nations Children’s Fund. Progress on Sanitation and Drinking Water: 2015 Update and MDG Assessment; World Health Organization: Geneva, Switzerland, 2015. Available online: https://www.unicef.org/publications/index_82419.html (accessed on 6 August 2020).
- Efstratiou, A.; Ongerth, J.E.; Karanis, P. Waterborne transmission of protozoan parasites: Review of worldwide outbreaks-an update 2011–2016. Water Res. 2017, 114, 14–22. [Google Scholar] [CrossRef] [PubMed]
- Kulkarni, A.; Kapley, A.; Dhodapkar, R.S.; Nagababu, P.; Rayalu, S. Plasmonics driven engineered pasteurizers for solar water disinfection (SWADIS). J. Hazard. Mater. 2019, 369, 474–482. [Google Scholar] [CrossRef] [PubMed]
- World Health Organization. Scaling up Household Water Treatment among Low-Income Populations (No. WHO/HSE/WSH/09.02). 2009. Available online: https://apps.who.int/iris/handle/10665/70049 (accessed on 6 August 2020).
- World Health Organization. Fact Sheet 391. Drinking Water. 2019. Available online: https://www.who.int/news-room/fact-sheets/detail/drinking-water (accessed on 12 March 2019).
- Sobsey, M.D.; Water, S.; World Health Organization. Managing Water in the Home: Accelerated Health Gains from Improved Water Supply (No. WHO/SDE/WSH/02.07); World Health Organization: Geneva, Switzerland, 2002; Available online: https://apps.who.int/iris/handle/10665/67319 (accessed on 6 August 2020).
- Stauber, C.E.; Elliott, M.A.; Koksal, F.; Ortiz, G.M.; Di Giano, F.A.; Sobsey, M.D. Characterization of the Biosand filter for E. coli reductions from household drinking water under controlled laboratory and field use conditions. Water Sci. Technol. 2006, 54, 1–7. [Google Scholar] [CrossRef]
- Wang, H.; Narihiro, T.; Straub, A.P.; Pugh, C.R.; Tamaki, H.; Moor, J.F.; Bradley, I.M.; Kamagata, Y.; Liu, W.T.; Nguyen, T.H. MS2 bacteriophage reduction and microbial communities in Biosand filters. Environ. Sci. Technol. 2014, 48, 6702–6709. [Google Scholar] [CrossRef] [PubMed]
- Huisman, L.; Wood, W.E. Slow Sand Filtration; World Health Organization: Geneva, Switzerland, 1974; Available online: https://apps.who.int/iris/bitstream/handle/10665/38974/9241540370 (accessed on 6 August 2020).
- Mahmood, Q.; Baig, S.A.; Nawab, B.; Shafqat, M.N.; Pervez, A.; Zeb, B.S. Development of low-cost household drinking water treatment system for the earthquake affected communities in Northern Pakistan. Desalination 2011, 273, 316–320. [Google Scholar] [CrossRef]
- Kennedy, T.J.; Hernandez, E.A.; Morse, A.N.; Anderson, T.A. Hydraulic loading rate effect on removal rates in a Biosand filter: A pilot study of three conditions. Water Air Soil Pollut. 2012, 223, 4527–4537. [Google Scholar] [CrossRef]
- CAWST. Biosand Filter Manual–Design, Construction, Installation, Operation and Maintenance; Center for Affordable Water and Sanitation Technology (CAWST): Alberta, AB, Cananda, 2009; Available online: https://resources.cawst.org/construction-manual/a90b9f50/biosand-filter-construction-manual (accessed on 6 August 2020).
- Souza Freitas, B.L.; Sabogal-Paz, L.P. Pretreatment using Opuntia cochenillifera followed by household slow sand filters: Technological alternatives for supplying isolated communities. Environ. Technol. 2019, 1–12. [Google Scholar] [CrossRef] [PubMed]
- Stauber, C.E.; Ortiz, G.M.; Loomis, D.P.; Sobsey, M.D. A randomized controlled trial of the concrete Biosand filter and its impact on diarrheal disease in Bonao, Dominican Republic. Am. J. Trop. Med. Hyg. 2009, 80, 286–293. [Google Scholar] [CrossRef]
- Tiwari, S.S.K.; Schmidt, W.P.; Darby, J.; Kariuki, Z.G.; Jenkins, M.W. Intermittent slow sand filtration for preventing diarrhea among children in Kenyan households using unimproved water sources: Randomized controlled trial. Trop. Med. Int. Health 2009, 14, 1374–1382. [Google Scholar] [CrossRef] [PubMed]
- Loo, S.L.; Fane, A.G.; Krantz, W.B.; Lim, T.T. Emergency water supply: A review of potential technologies and selection criteria. Water Res. 2012, 46, 3125–3151. [Google Scholar] [CrossRef] [PubMed]
- Di Bernardo, L.; Dantas, A.D.B.; Voltan, P.E.N. Métodos e Técnicas de Tratamento de Água (Water Treatment Methods and Techniques), 3rd ed.; LDiBe: São Paulo, Brazil, 2017. [Google Scholar]
- ABNT (Associação Brasileira de Normas Técnicas). NBR 11799: Material Filtrante—Areia, Antracito e Pedregulho. Especificação (Filter Material-Sand, Anthracite and Gravel. Specification); ABNT: Rio de Janeiro, Brazil, 2016. [Google Scholar]
- Garre, A.; Egea, J.A.; Esnoz, A.; Palop, A.; Fernandez, P.S. Tail or artefact? Illustration of the impact that uncertainty of the serial dilution and cell enumeration methods has on microbial inactivation. Food Res. Int. 2019, 119, 76–83. [Google Scholar] [CrossRef] [PubMed]
- Jiang, J. Linear and Generalized Linear Mixed Models and Their Applications; Springer Science & Business Media: Berlin, Germany, 2007; Available online: https://link.springer.com/content/pdf/bfm%3A978-0-387-47946-0%2F1.pdf (accessed on 6 August 2020). [CrossRef]
- APHA; AWWA; WEF. Standard Methods for the Examination of Water and Wastewater; American Public Health Association: Washington, DC, USA, 2012; p. 541. [Google Scholar]
- Lynn, T.J.; Wanjugi, P.; Harwood, V.J.; Ergas, S.J. Dynamic performance of Biosand filters. J. Am. Water Works Assoc. 2013, 105, E587–E595. [Google Scholar] [CrossRef]
- Ahammed, M.M.; Davra, K. Performance evaluation of Biosand filter modified with iron oxide-coated sand for household treatment of drinking water. Desalination 2002, 276, 287–293. [Google Scholar] [CrossRef]
- Edzwald, J.K.; Tobiason, J.E. Chemical Principles, Source Water Composition, and Watershed Protection. In Water Quality and Treatment: A Handbook on Drinking Water; Edzwald, J.K., Ed.; McGraw Hill: New York, NY, USA, 2011. [Google Scholar]
- Nakhla, G.; Farooq, S. Simultaneous nitrification–denitrification in slow sand filters. J. Hazard. Mater. 2003, 96, 291–303. [Google Scholar] [CrossRef]
- Murphy, H.M.; McBean, E.A.; Farahbakhsh, K. Nitrification, denitrification, and ammonification in point-of-use Biosand filters in rural Cambodia. J. Water Health 2010, 8, 803–817. [Google Scholar] [CrossRef] [PubMed]
- Duke, W.; Nordin, R.; Baker, D.; Mazumder, A. The use and performance of BioSand filters in the Artibonite Valley of Haiti: A field study of 107 households. Rural Remote Health 2006, 6, 570. [Google Scholar] [PubMed]
- Elliott, M.A.; Stauber, C.E.; Koksal, F.; Di Giano, F.A.; Sobsey, M.D. Reductions of E. coli, echovirus type 12 and bacteriophages in an intermittently operated household-scale slow sand filter. Water Res. 2008, 42, 2662–2670. [Google Scholar] [CrossRef] [PubMed]
- Vanderzwaag, J.C.; Atwater, J.W.; Bartlett, K.H.; Baker, D. Field evaluation of long-term performance and use of biosand filters in Posoltega, Nicaragua. Water Qual. Res. J. Can. 2009, 44, 111–121. [Google Scholar] [CrossRef]
- Baig, S.A.; Mahmood, Q.; Nawab, B.; Shafqat, M.N.; Pervez, A. Improvement of drinking water quality by using plant biomass through household biosand filter—A decentralized approach. Ecol. Eng. 2011, 37, 1842–1848. [Google Scholar] [CrossRef]


| Parameter/Analysis | Methodology | Model | Unit |
|---|---|---|---|
| Turbidity | 2130 B—Nephelometric | HACH 2100—Turbidimeter | NTU |
| pH | 4500-H+ B—Electrometric | DIGIMED, DM-22 | - |
| Abs UV 254 nm | 5910 B—UV Absorption | UV 1600 | - |
| Alkalinity | 2320 B—Titrimetric | mg CaCO3/L | |
| Total Coliforms | Colilert® | Colilert® | MPN/100 mL |
| E. Coli | Colilert® | Colilert® | MPN/100 mL |
| Nitrate | Ion chromatography | Metrohm™ 882 | mg/L NO3- |
| SEM | - | MEC JSM 6060 | - |
| E. coli * | Drop plate | BEM agar | CFU/mL |
| S. Typhimurium * | Drop plate | XLD agar | CFU/mL |
| E. Faecalis * | Drop plate | Bili Esculin agar | CFU/mL |
| P. aeruginosa * | Drop plate | Cetrimide agar | CFU/mL |
| BSF1 | BSF2 | BSF3 | BSF4 | |||||
|---|---|---|---|---|---|---|---|---|
| Influent | Effluent | Influent | Effluent | Influent | Effluent | Influent | Effluent | |
| Temperature (°C) | ||||||||
| Mean | 17.7 | 17.8 | 17.4 | 17.7 | 17.7 | 17.5 | 17.8 | 17.9 |
| Std deviation | 3.1 | 3.2 | 3.0 | 3.1 | 3.1 | 3.0 | 3.0 | 3.0 |
| n | 50 | 50 | 50 | 48 | 47 | 48 | 47 | 50 |
| Turbidity (NTU) | ||||||||
| Mean | 29.1 | 0.9 | 3.4 | 0.4 | 30.2 | 0.4 | 52.3 | 0.5 |
| Std. deviation | 7.3 | 0.4 | 0.9 | 0.2 | 6.1 | 0.2 | 10.5 | 0.2 |
| n | 54 | 54 | 53 | 53 | 53 | 52 | 53 | 52 |
| pH | ||||||||
| Mean | 7.3 | 7.4 | 6.7 | 6.2 | 6.5 | 6.1 | 6.2 | 5.9 |
| Std. deviation | 0.5 | 0.4 | 0.5 | 0.5 | 1.4 | 0.9 | 1.8 | 1.5 |
| n | 53 | 52 | 53 | 51 | 53 | 51 | 53 | 51 |
| Alkalinity (mg CaCO3/L) | ||||||||
| Mean | 103 | 99 | 13 | 6 | 13 | 6 | 12 | 6.7 |
| Std. deviation | 16 | 14 | 5 | 4 | 5 | 4 | 5 | 4 |
| n | 50 | 49 | 49 | 47 | 48 | 47 | 48 | 47 |
| UV254 Absorbance | ||||||||
| Mean | 0.169 | 0.047 | 0.119 | 0.045 | 0.151 | 0.049 | 0.172 | 0.046 |
| Std. deviation | 0.048 | 0.037 | 0.043 | 0.018 | 0.032 | 0.017 | 0.049 | 0.017 |
| n | 41 | 42 | 42 | 42 | 39 | 40 | 40 | 40 |
| Nitrate | ||||||||
| Mean | 2.33 | 1.65 | 2.29 | 1.07 | 2.29 | 1.32 | 2.28 | 1.25 |
| Std. Deviation | 2.12 | 0.06 | 0.33 | 0.68 | 0.25 | 0.59 | 0.26 | 0.53 |
| n | 7 | 3 | 10 | 5 | 11 | 5 | 11 | 8 |
| TC (MPN/100 mL) | ||||||||
| Mean | 105 | 30 | 1706 | 99 | 1589 | 123 | 1779 | 17 |
| Std. deviation | 5 | 14 | 17 | 9.3 | 17 | 7 | 19 | 21 |
| n | 10 | 10 | 10 | 10 | 10 | 10 | 10 | 10 |
| E. Coli (MPN/100 mL) | ||||||||
| Mean | 15 | 1 | 447 | 22 | 471 | 4.3 | 506 | 3 |
| Std. deviation | 3 | 15 | 30 | 4 | 32 | 10 | 35 | 9 |
| n | 10 | 10 | 10 | 10 | 10 | 10 | 10 | 10 |
| Effect | Number Degrees of Freedom | F Value | p > F |
|---|---|---|---|
| BSF | 3 | 4.13 | 0.0130 |
| Time | 1 | 95.99 | <0001 |
| BSF*Time | 3 | 6.33 | 0.0015 |
| Simple Effect Level | BSF | BSF | Standard Error | p > |t| |
|---|---|---|---|---|
| Time 1 | 1 | 2 | 0.4693 | <0.0001 |
| Time 1 | 1 | 3 | 0.4693 | <0.0001 |
| Time 1 | 1 | 4 | 0.4693 | <0.0001 |
| Time 1 | 2 | 3 | 0.4693 | 0.8801 |
| Time 1 | 2 | 4 | 0.4693 | 0.9302 |
| Time 1 | 3 | 4 | 0.4693 | 0.8116 |
| Time 2 | 1 | 2 | 1.0199 | 0.2446 |
| Time 2 | 1 | 3 | 1.0199 | 0.1727 |
| Time 2 | 1 | 4 | 1.0376 | 0.4351 |
| Time 2 | 2 | 3 | 1.0199 | 0.8361 |
| Time 2 | 2 | 4 | 1.0376 | 0.0588 |
| Time 2 | 3 | 4 | 1.0376 | 0.0378 |
| Effect | Number Degrees Freedom | F Value | Pr > F |
|---|---|---|---|
| BSF | 3 | 29.07 | <0.0001 |
| Time | 1 | 132.41 | <0.0001 |
| BSF*Time | 3 | 1.19 | 0.3270 |
© 2020 by the authors. Licensee MDPI, Basel, Switzerland. This article is an open access article distributed under the terms and conditions of the Creative Commons Attribution (CC BY) license (http://creativecommons.org/licenses/by/4.0/).
Share and Cite
Duran Romero, D.A.; de Almeida Silva, M.C.; M. Chaúque, B.J.; D. Benetti, A. Biosand Filter as a Point-of-Use Water Treatment Technology: Influence of Turbidity on Microorganism Removal Efficiency. Water 2020, 12, 2302. https://doi.org/10.3390/w12082302
Duran Romero DA, de Almeida Silva MC, M. Chaúque BJ, D. Benetti A. Biosand Filter as a Point-of-Use Water Treatment Technology: Influence of Turbidity on Microorganism Removal Efficiency. Water. 2020; 12(8):2302. https://doi.org/10.3390/w12082302
Chicago/Turabian StyleDuran Romero, Daniela A., Maria Cristina de Almeida Silva, Beni J. M. Chaúque, and Antônio D. Benetti. 2020. "Biosand Filter as a Point-of-Use Water Treatment Technology: Influence of Turbidity on Microorganism Removal Efficiency" Water 12, no. 8: 2302. https://doi.org/10.3390/w12082302
APA StyleDuran Romero, D. A., de Almeida Silva, M. C., M. Chaúque, B. J., & D. Benetti, A. (2020). Biosand Filter as a Point-of-Use Water Treatment Technology: Influence of Turbidity on Microorganism Removal Efficiency. Water, 12(8), 2302. https://doi.org/10.3390/w12082302