Article

Assessment of the Environmental Status of the Mangrove Ecosystem in the United Arab Emirates

1
Department of Biology, Chemistry and Environmental Sciences, American University of Sharjah, Sharjah, UAE
2
General Studies Division, Higher Colleges of Technology, Sharjah, UAE
3
Department of Geography, ECRC, University College London, Gower Street, London WC1E 6BT, UK
4
Environment and Life Sciences Research Center, Kuwait Institute for Scientific Research, Salmiya, Kuwait
*
Author to whom correspondence should be addressed.
Water 2020, 12(6), 1623; https://doi.org/10.3390/w12061623
Submission received: 2 May 2020 / Revised: 23 May 2020 / Accepted: 4 June 2020 / Published: 6 June 2020
(This article belongs to the Section Water Quality and Contamination)

Abstract

:
In the Arabian Gulf, mangroves play a particularly important role in maintaining biodiversity. Water and intertidal sediments were collected from eight sampling locations in April 2017 to assess the environmental status of the mangrove forest in the Khor al Beida, Umm Al Quwain, which is one of the largest natural mangrove forests in the United Arab Emirates (UAE). Khor al Beida is also a breeding ground for the largest Gulf colony of a regionally endemic Socotra cormorant. Total metal concentrations of water and sediments were measured using Inductively Coupled Plasma Optical Emission Spectroscopy (ICP-OES) and ranged between 0.001–2.873 mg/L and 0.08–12683.02 mg/kg, respectively. Most metals were within permissible levels, except for copper, iron, aluminum, zinc, and nickel. Hazard Quotient calculations showed low risk to the ecosystem in relation to the presence of heavy metals, with the exception of zinc. Fifty-three diatom species of pennate benthic forms were identified in the intertidal sediments. For the first time in the UAE, diatom composition and diatom diversity values were quantitatively estimated in the surface sediments and a short sediment core. Overall, the assessment suggests that the mangrove forest is currently undisturbed and shows very little anthropogenic impact; yet, protection and conservation efforts are necessary in order to maintain its current status.

1. Introduction

Mangroves are tropical forest ecosystems that occupy shallow water near the shore and adjacent land. Mangrove forests are highly diverse and productive systems [1,2], and they are especially important in the desert biome of the Arabian Gulf (also known as the Persian Gulf, and referred to hereafter simply as the Gulf) region where they form local biodiversity hotspots [3]. In the context of global climate change, the mangroves play a paramount role in protecting the coast from the effects of rising sea level and increasingly frequent storms [2,4]. Moreover, they act as carbon sinks by burying carbon in sediments at a high rate [5]. The value of mangroves for humans and coastal ecosystems are important in providing food, shelter and breeding grounds for marine and terrestrial animals including many commercial species [1,5,6]. Mangroves also support numerous ecosystem services including flood protection, nutrient and organic matter processing, and sediment control [4].
Globally, mangroves show consistent decline disappearing on average by 1% per year due to various human impacts and global change [3,4,7,8]. In the United Arab Emirates (UAE), the threats to mangroves include coastal reclamation, marine pollution and overexploitation of timber, crustaceans and fish [8,9]. In the future, it is expected that mangrove vulnerability in the Gulf region may be increased by the impacts of global climate change, including increasing salinity and water temperature [10,11]. The harsh environmental conditions (i.e., a combination of high-water temperatures and high salinity) in the Gulf are the likely cause of much lower mangrove species diversity compared to the rest of the Indian Ocean region [6]. Mangrove forests in the UAE (as with the rest of the Gulf) are formed almost exclusively by several subspecies of grey mangrove, Avicennia marina, which survives on the brink of its tolerance levels in one of the driest habitats in the world [12,13]. However, Boer and Lieth [14] reported previous occurrence of Rhizophora mucronata in the region. Heavy metals enter mangrove ecosystems anthropogenically or naturally through either soil erosion or atmospheric deposition. These chemicals are considered to be some of the most harmful contaminants to the ecosystem. A study of the mangroves in two study areas: Tarut Bay; Saudi Arabia and Tubli Bay; Bahrain showed that the level of heavy and trace metals was higher than those of nearby mangroves in the Gulf and above the permissible limits [15].
Despite the high environmental and economic significance of the UAE mangroves and their potential vulnerability, their current ecological status is still virtually unknown. Limited studies have reported on the environmental status of the UAE mangroves, the only available studies have mapped the mangroves and information such as density, mangrove species varieties, salinity and redox potential were reported by Al Habshi et al. [13], Moore et al. [3,8] and Dodd et al. [12]. In addition, a previous study by Shriadah [16], published in 1998, analyzed sediment chemistry and metal pollution of all major areas of mangrove forests, but no further studies have been published assessing the current status of the mangrove ecosystem. The mangrove forest of Khor al Beida in Umm Al Quwain is one of the largest natural mangrove ecosystems in the UAE and it is one of the oldest and most genetically diverse [3,12,13]. Seemingly, the conditions for mangrove trees’ growth are more favorable in Khor al Beida compared to other areas of mangrove forest ecosystems in the UAE [13]. Furthermore, Khor al Beida mangroves surround Al Siniyah Island, which is home to the largest population of the regionally endemic Socotra cormorants in the UAE [17].
In addition to water and sediment chemistry parameters, diatoms can also be used to quantitatively assess the environmental status of mangrove ecosystem in Khor al Beida. Diatoms are unicellular algae, which are widespread in marine and freshwater environments [18,19]. They possess a silica-based cell wall, which remains in the sediment after death and can be used for taxonomic identification. In marine environments, diatoms respond to a range of environmental factors including salinity, and are used to reconstruct past environmental conditions [20]. At present, there is almost no published information about the benthic components of mangrove ecosystems in the UAE [1]. Similarly, there are very few publications on benthic diatoms in the Gulf. Benthic diatoms composition and distribution in Kuwaiti coast were comprehensively covered by [19], and diatom composition and distribution in Shatt al Arab Estuary in Iraq were described by [21].
The aim of this paper is, for the first time in the UAE, to assess the state of the natural mangrove ecosystem by (1) analyzing a range of biogeochemical parameters in water and surface sediments, and (2) quantitatively assessing diversity patterns and composition of diatom assemblages in surface mangrove sediments and a short sediment core. This is the first study in the UAE to quantitatively analyze surface diatom composition from mangrove sediments and a short sediment core for diatom abundance, composition and diversity.

2. Materials and Methods

2.1. Sampling and Storage

Khor al Beida mangrove in Umm Al Quwain is one of the most ecologically diverse in the UAE. It extends to an area of approximately 1877 hectares and is an important spot for wildlife and bird watching. This ecosystem includes examples of fringe, basin, and overwash mangrove habitats. Moreover, it has extensive seagrass beds and coral reefs [3,8]. On-site water quality analysis was conducted using HI 9829 multiparameter (Hanna Instruments, Singapore) to measure temperature, pH, dissolved oxygen (DO), electrical conductivity (EC), total dissolved solids (TDS), oxygen reduction potential (ORP), and salinity at the various locations from where samples were collected. Water and intertidal sediment samples were collected from Umm Al Quwain Mangroves in April 2017 between 10:00 a.m. and 1:00 p.m. The eight sampled locations are shown in Figure 1 and are listed as L1–L8. All sampling was conducted during a period of low tide. All surface water samples were taken in Nalgene or polypropylene bottles appropriate for their analysis. A sediment core collection was conducted during low tide interval using a plastic tube, which was pushed through the sediment surface. Surface sediment and algal samples were placed in plastic bags and kept in the fridge, prior to analysis. Locations L5–L8 were sampled for both algal mats and surface sediments. Two sediment cores were extruded in the field and the sediment core samples were also kept in the fridge. All samples were stored in ice for transport to the laboratory. Water samples for metals analysis were acidified to pH 2 with concentrated nitric acid and stored at 4 °C until analysis.

2.2. Elemental Analysis of the Water and Sediment Samples

Eleven heavy metals were analyzed in the water samples collected during April 2017 using Inductively Coupled Plasma Optical Emission Spectroscopy (ICP-OES) (Varian-Liberty, Melbourne, Australia) including aluminum (Al), barium (Ba), cadmium (Cd), cobalt (Co), chromium (VI) (Cr), copper (Cu), iron (Fe), manganese (Mn), nickel (Ni), lead (Pb), and zinc (Zn). All standards were purchased from Sigma Aldrich. Calibration standards in the range of 0.01–5 mg/L were prepared with 1 M nitric acid for quantification. Blank samples and Quality Control Standards were also included for quality control purposes, with all standards rerun at the end of the analysis.
Approximately 0.5 g of the sediment samples were weighed and oven dried at 105 °C for 24 h prior to the elemental analysis. A 0.5 g sediment sample was acidified by adding 10.0 mL of 15.6 M nitric acid. Prior to the analysis using ICP-OES, samples were digested using a Multiwave 3000 Microwave Digester (Anton Paar, Graz, Austria). Power was set at 1000 W and the samples were held for 15 min using an IR of 180 °C, after which samples were cooled for 15 min. After digestion, samples were filtered using gravity filtration and diluted to 50 mL using Milli-Q water. The diluted samples were analyzed using ICP-OES following the same method applied for water samples. The calibration curves were developed using standard solutions prepared in the concentration range of 0.01–5 mg/L. Blank samples and Quality Control Standards were also included for quality control purposes, with all standards rerun at the end of the analysis.

2.3. Organic Carbon and Organic Matter Analysis

Total organic carbon (TOC) was tested for the water samples using a TOC-V CPN Analyzer (Shimadzu, Kyoto, Japan). The samples were analyzed 24 h after sampling to avoid decomposition of the carbon. Prior to the analysis, samples were filtered using gravity filtration. Calibration standards were prepared in the range of 0.0–50.0 ppm of carbon, using a potassium hydrogen phthalate (KHP) salt stock solution (C8H5KO4). Blank samples and Quality Control Standards were also included for quality control purposes, with all standards rerun at the end of the analysis.
Percentage organic matter content (OM%) of the sediments was measured by loss on ignition (% LOI) at 550 °C. Approximately 3.0 g of muddy surface sediment samples were weighed and oven dried at 105 °C for 24 h. The dry weight of the sediment samples was noted, and the samples were placed in a Furnace 6000 (Barnstead/Thermolyne, Ramsey, MN, USA) at 550 °C for 4 h. The samples were cooled and weighed to determine total organic matter content. Sediment organic matter (OM) and % OM content were calculated using the following equations:
OM ( g ) = Mass   of   Dried   Sediments Mass   of   Ashed   Sediments
OM   ( % ) = SOM Total   mass   of   dried   sediments × 100

2.4. Diatom Analysis

Diatom slide preparation followed standard procedure using peroxide for organic matter digestion [18]. Hydrogen peroxide was added to 0.10 g of the samples collected, following which the samples were digested in a hot water bath, to release all the diatoms from the sediments. Once the process was complete, the samples were washed out with Milli-Q water and centrifuged at 1400 rpm for 5 min. Permanent slides for the samples were prepared, by adding a few drops of the centrifuged solution, which were then left to dry for 24 h. Naphrax resin was added onto the glass slides. A Zeiss microscope was used to examine the slides at a magnification of ×1000 and light micrographs were taken for a qualitative assessment. Identification followed [19].
Identification at species level was attempted, but this was not possible with some of Nitzschia taxa. We separated unidentified Nitzschia taxa into several types and taken light microscope photographs of them, which are shown in Table A1. Amphora coffeaeformis was separated into two groups, according to the length: A. coffeaeformis type large (26–34 µm) and type small (18–24 µm).

2.5. Assessment of Hazard

To assess the safety and health of the mangrove ecosystem with respect to the concentrations of heavy metals found, partitioning coefficient and hazard quotients were calculated. The Partitioning Coefficient (Kd) is used as a quantitative indicator of environmental mobility of the element. Kd is calculated from the ratio between concentration of metals in sediments (CS) and in water (CW).
K d = C s C w
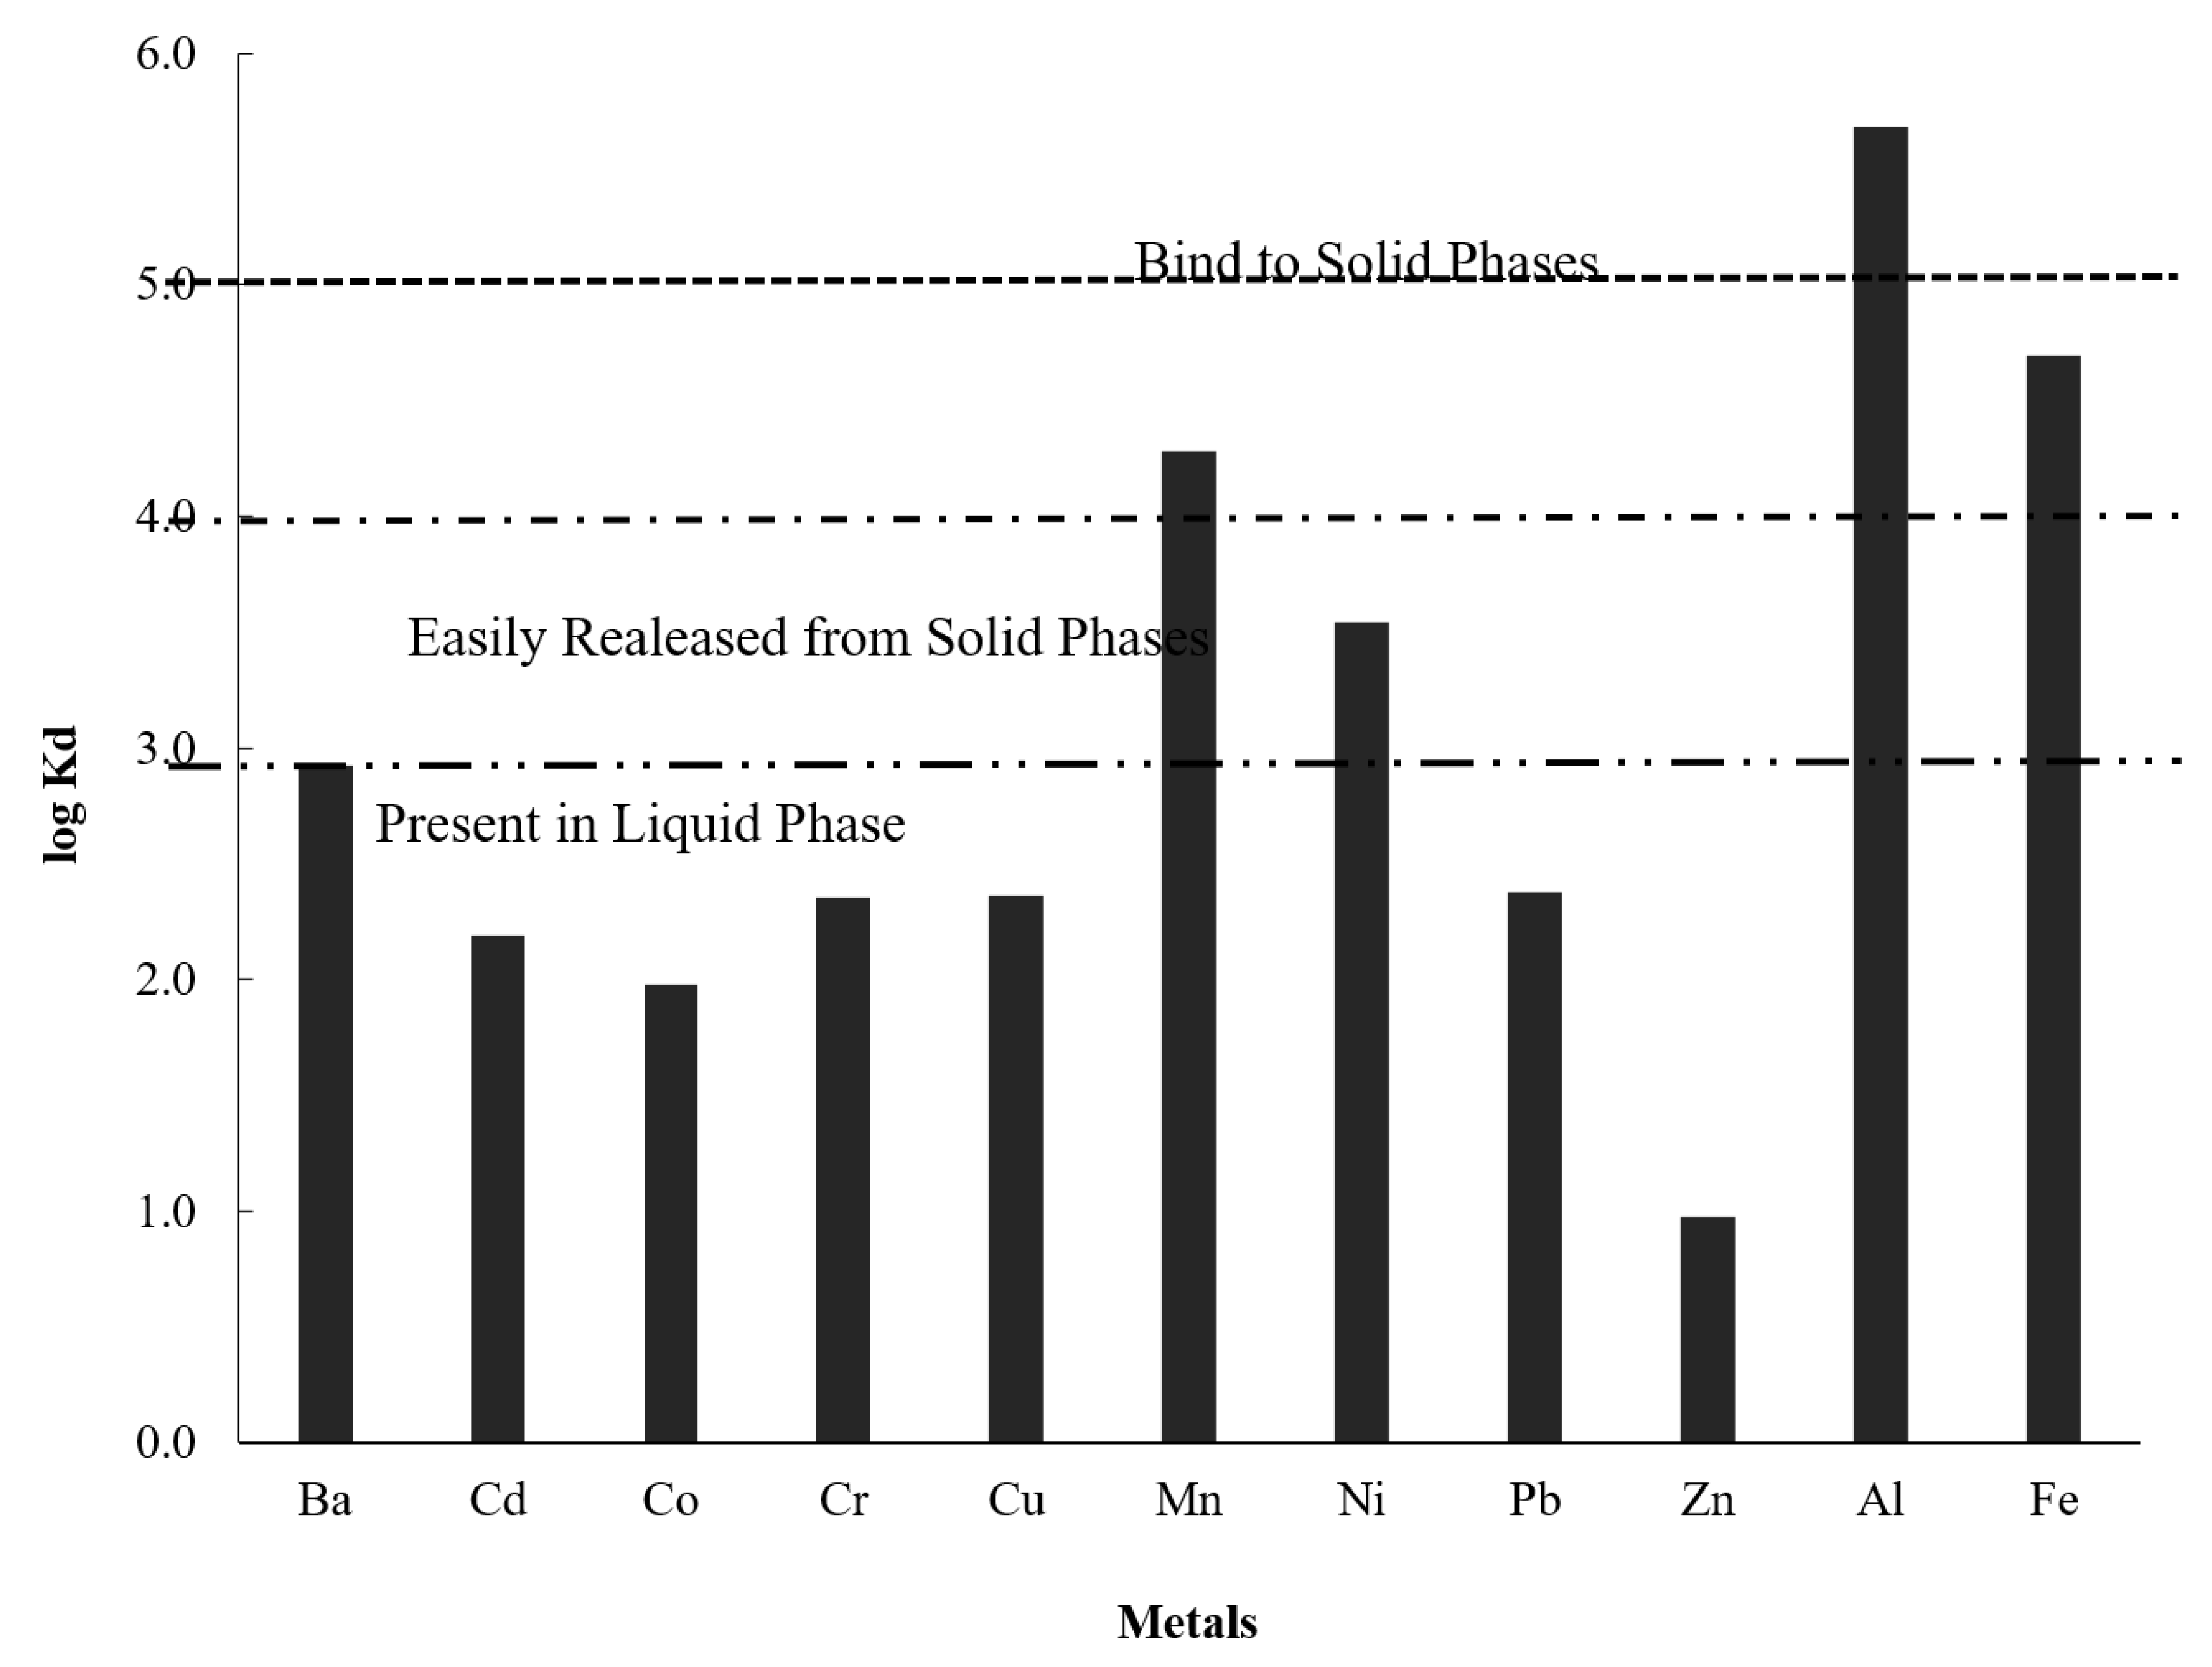
After calculating Kd, this number is converted to the natural logarithm form to report the medium where the metal concentrates the most. As a result, if log Kd > 5 it indicates metal preference towards binding to solid surfaces and only migrate to water in occasions, a value of log Kd < 4 indicates chemicals easily released from solid phases and Kd < 3, refers to metals that prefer the liquid phase [22,23].
The Hazard Quotient (HQ) provides an indication of the danger the pollutant might present to the aquatic environment by comparison with an environmental quality standard (EQS). The hazard quotient is calculated from the concentration of metals in sediments (CS) and in water (CW) using the following equations:
HQ = C s EQS
HQ = C w EQS
In this study, the Dubai Municipality standards were used as the environmental quality standards and when absent the US EPA was used instead. According to previous studies, a value of HQ > 1, indicates an ecological hazard, HQ < 1 refers to unpolluted sites, 1 < HQ < 2 indicates low pollutant load with no acute danger for organisms; 2 < HQ < 10 indicates intermediate pollution that can lead to fatal effects to sensitive organisms and finally HQ > 10 signifies high pollution with effects on the reduction of benthic organism diversity [22,24,25].

2.6. Multivariate Statistical Analysis

All numerical analyses were conducted using CANOCO 5 (ver. 1.2) [26]. Standard CANOCO options were applied in the below analyses. Principal Component Analysis (PCA) was used to analyze the variance in water and surface sediment chemistry data. The linear method was chosen because the gradient in the data as 0.3 SD (standard deviation) units long. Chemistry data were log-transformed, centered and standardized by species scores. The gradient length in the surface diatom data was 1.9 SD units, so Detrended Correspondent Analysis (DCA) with detrending by 4th degree polynomials was applied to estimate overall compositional change. The diatom data were log- transformed and rare species were down-weighted. Diatom diversity was estimated by Hill’s N2 effective number of occurrences [27] in DCA analysis and by Simpsons’ diversity index (D) in MS Excel [28]. Diatom species richness E(S) at a constant sample count was estimated by rarefaction analysis using the program RAREPOLL version 1.0 [29].
Diatom surface sample and core sample diagrams were plotted using the program C2 version 1.4.3. [30]. In order to highlight the changes in diatom assemblages, diatom species were sorted by their weighted averaging (WA) scores from bottom left to upper right in the stratigraphic diagrams (Figure 2 and Figure 3), which were calculated in C2.

3. Results

3.1. Physical Water Quality Analysis and Total Organic Carbon in Water

Parameters measured on site included temperature, pH, dissolved oxygen (DO), electrical conductivity (EC), total dissolved solids (TDS), oxygen reduction potential (ORP), and salinity which are summarized in Table 1. The results indicate that both the average pH and DO of the sites decreased with a decrease in temperature. The average concentration of DO was found to be within the acceptable range for this type of ecosystem during April 2017 (19.33 mg/L). Salinity of Umm Al Quwain mangroves ranged between 34.96 and 40.66 ppt. TOC in the waters of the mangrove forest of the UAE indicated high levels of organic matter and high variability (34.38 ± 10.69 mg C/L. Furthermore, ORP had high variability amongst sites (55.91 ± 15.61) (Table 1).

3.2. Elemental Analysis

Table 2 shows the concentrations of metals determined in water and sediment samples collected from Umm Al Quwain mangroves during April 2017. When comparing the concentrations (mg/L) of heavy metals among all sampled locations, location L8 had the highest amount of total heavy metals concentration in water (3.60) where Zn, reported the highest average concentration (2.873) followed by Cr (0.077) > Fe (0.028) > Al (0.027) > Ba (0.017) > Ni (0.010) > Cu (0.009) > Co (0.008) > Pb (0.007) > Mn (0.005) > Cd (0.001). Most studied metals were present in all water samples except for cadmium, chromium, copper, and lead. On the other hand, all sediment samples contained the metals studied (Table 2). Al was the most abundant heavy metal (12683.02 mg/kg on average), followed by Fe (1365.13), Mn (99.88), Ni (35.62), Zn (26.90), Cr (VI) (17.31), Ba (14.49), Cu (1.99), Pb (1.76), Co (0.72), and Cd (0.08).
Location L4 showed the highest total concentration of metals in sediments (4.47 × 10⁴ mg/kg), whereas the lowest total concentration was found in sediments at location L8 (3.25 × 10³ mg/kg). On the other hand, the water samples obtained at these locations showed the opposite trend, where the total concentration of metals at location L4 was the lowest (2.25 mg/L), and at location L8 was the highest (3.60 mg/L).

3.3. Principal Component Analysis

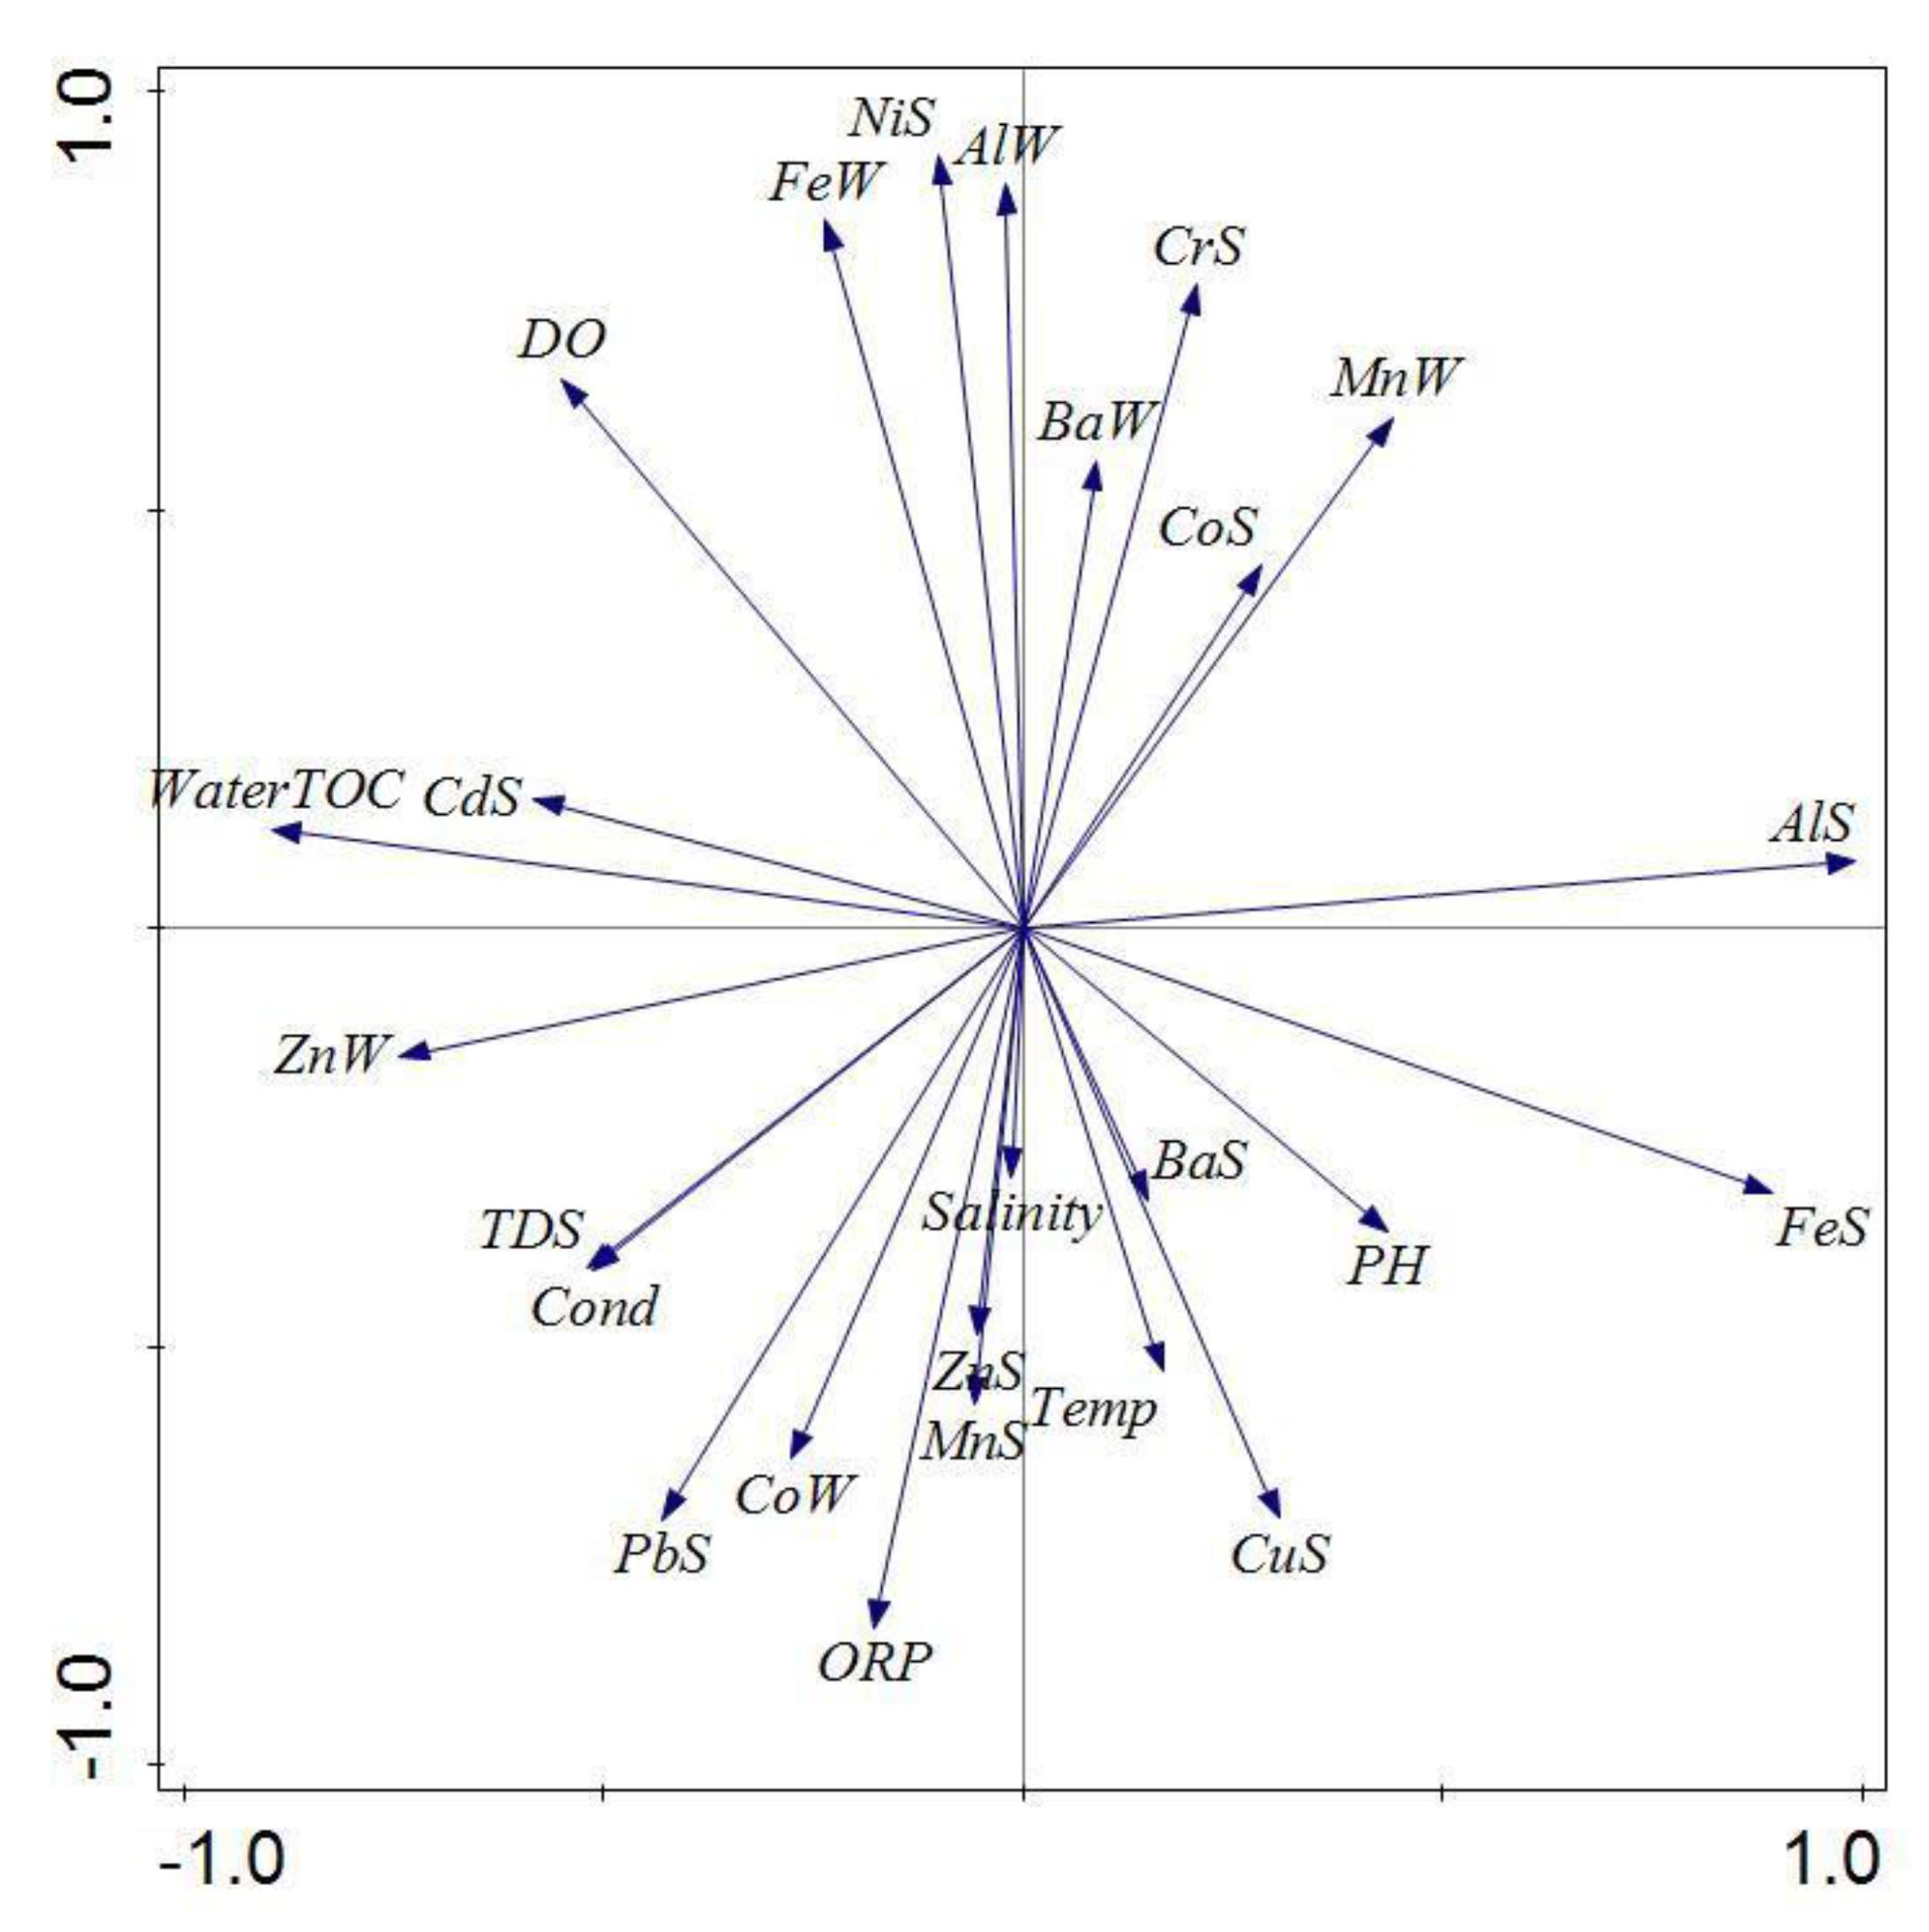
A principal component analysis (PCA) biplot of sediment and water chemistry parameters was generated with vectors representing physical and chemical variables to determine which variables were correlated. The sediment and water samples (W and S) were spread among the variables to which they were related, as shown in Figure 2. The variables included all the measured heavy metals in sediment (MetalS), heavy metals in water (MetalW), surface water salinity, temperature (Temp), dissolved oxygen (DO), total dissolved solids (TDS), conductivity (Cond), total organic carbon (water TOC), and water ORP. Perpendicular vectors show that the variables are uncorrelated, vectors with small angles show high correlation and opposite vectors indicate negatively correlated variables. Moreover, the longer the lengths of the vectors, the higher the variability. According to the PCA biplot, the strongest correlation was observed between salinity and Zn and Mn in sediments. Moreover, those parameters showed a strong correlation to ORP. In addition, high correlations were observed for TDS and conductivity; concentrations of Ba and Cu in sediments and concentrations of Mn in water and Co in sediments. Cadmium in sediment was the only metal that showed a slight correlation to water TOC, suggesting that changes in organic carbon does not necessarily affect the other heavy metals. Al in sediments had the lowest correlation, in fact showing to be uncorrelated to Al in water as well as to all the other parameters, and showed the highest variability (longest vector). On the other hand, the only metal that showed negative correlation between its presence in water and sediment was cobalt, which had opposite vectors. In addition, inverse correlations were observed between DO and pH, ORP and barium in water, and concentrations of iron in water with temperature.

3.4. Diatom Analysis and Sediment Organic Matter (OM)%

In total, 53 diatom species were identified in the intertidal sediments of the Khor al Beida mangrove forest. All of the species were pennate benthic forms (Figure 3). The surface sediment diatom assemblage was dominated by Opephora pacifica, which occurred in all samples, at 40 to 80% relative abundance. Another diatom, which occurred at high abundance (more than 20%) in the surface sediments at location L5, was Cocconeis placentula var. euglipta.
Algal mat in location L6 (6AM, Figure 3) showed the highest values of diversity among all surface sediment samples. Species richness (S) at 6AM was also quite high (16.94). Several epiphytic Mastogloia species (e.g., M. citrus, M. macdonaldii) and Seminavis arranensis occurred at this site at relatively high abundances (7–10%). In Khor al Beida, the sampled algal mats were formed by Chlorophyta (mainly Enteromorpha, and Rhizoclonium) and Cyanophyta (Microcleus) filamentous algae. In addition to a variety of diatom taxa, dinoflagellates and green algae were observed within the masses of macroalgal filaments. Algal mats in locations L5 and L7, however, were less diverse than at 6AM, being dominated by Cocconeis placentula var. euglipta.
Location L8 had the highest species richness value (24.77), and high diversity values S and N2, although diatom diversity here was lower than at 6AM. Several epipelic Amhpora and Navicula taxa occurred at relatively high abundance at L8 (e.g., Amphora coffeaeformis, Amphora cymbaphora, Navicula digitoradiata).
Achnanthidium minutissimum occurred at two locations, L6 and L7, at relatively high abundance of 6.7 and 11.8%. This epipsammic diatom is typically present in freshwater environment.
Surface sediments in Khor al Beida were predominantly sandy with variable organic content, (OM ranging between 2.89 and 16.44%). Algal mats clearly showed considerably higher values of OM compared to surrounding areas (Figure 3).
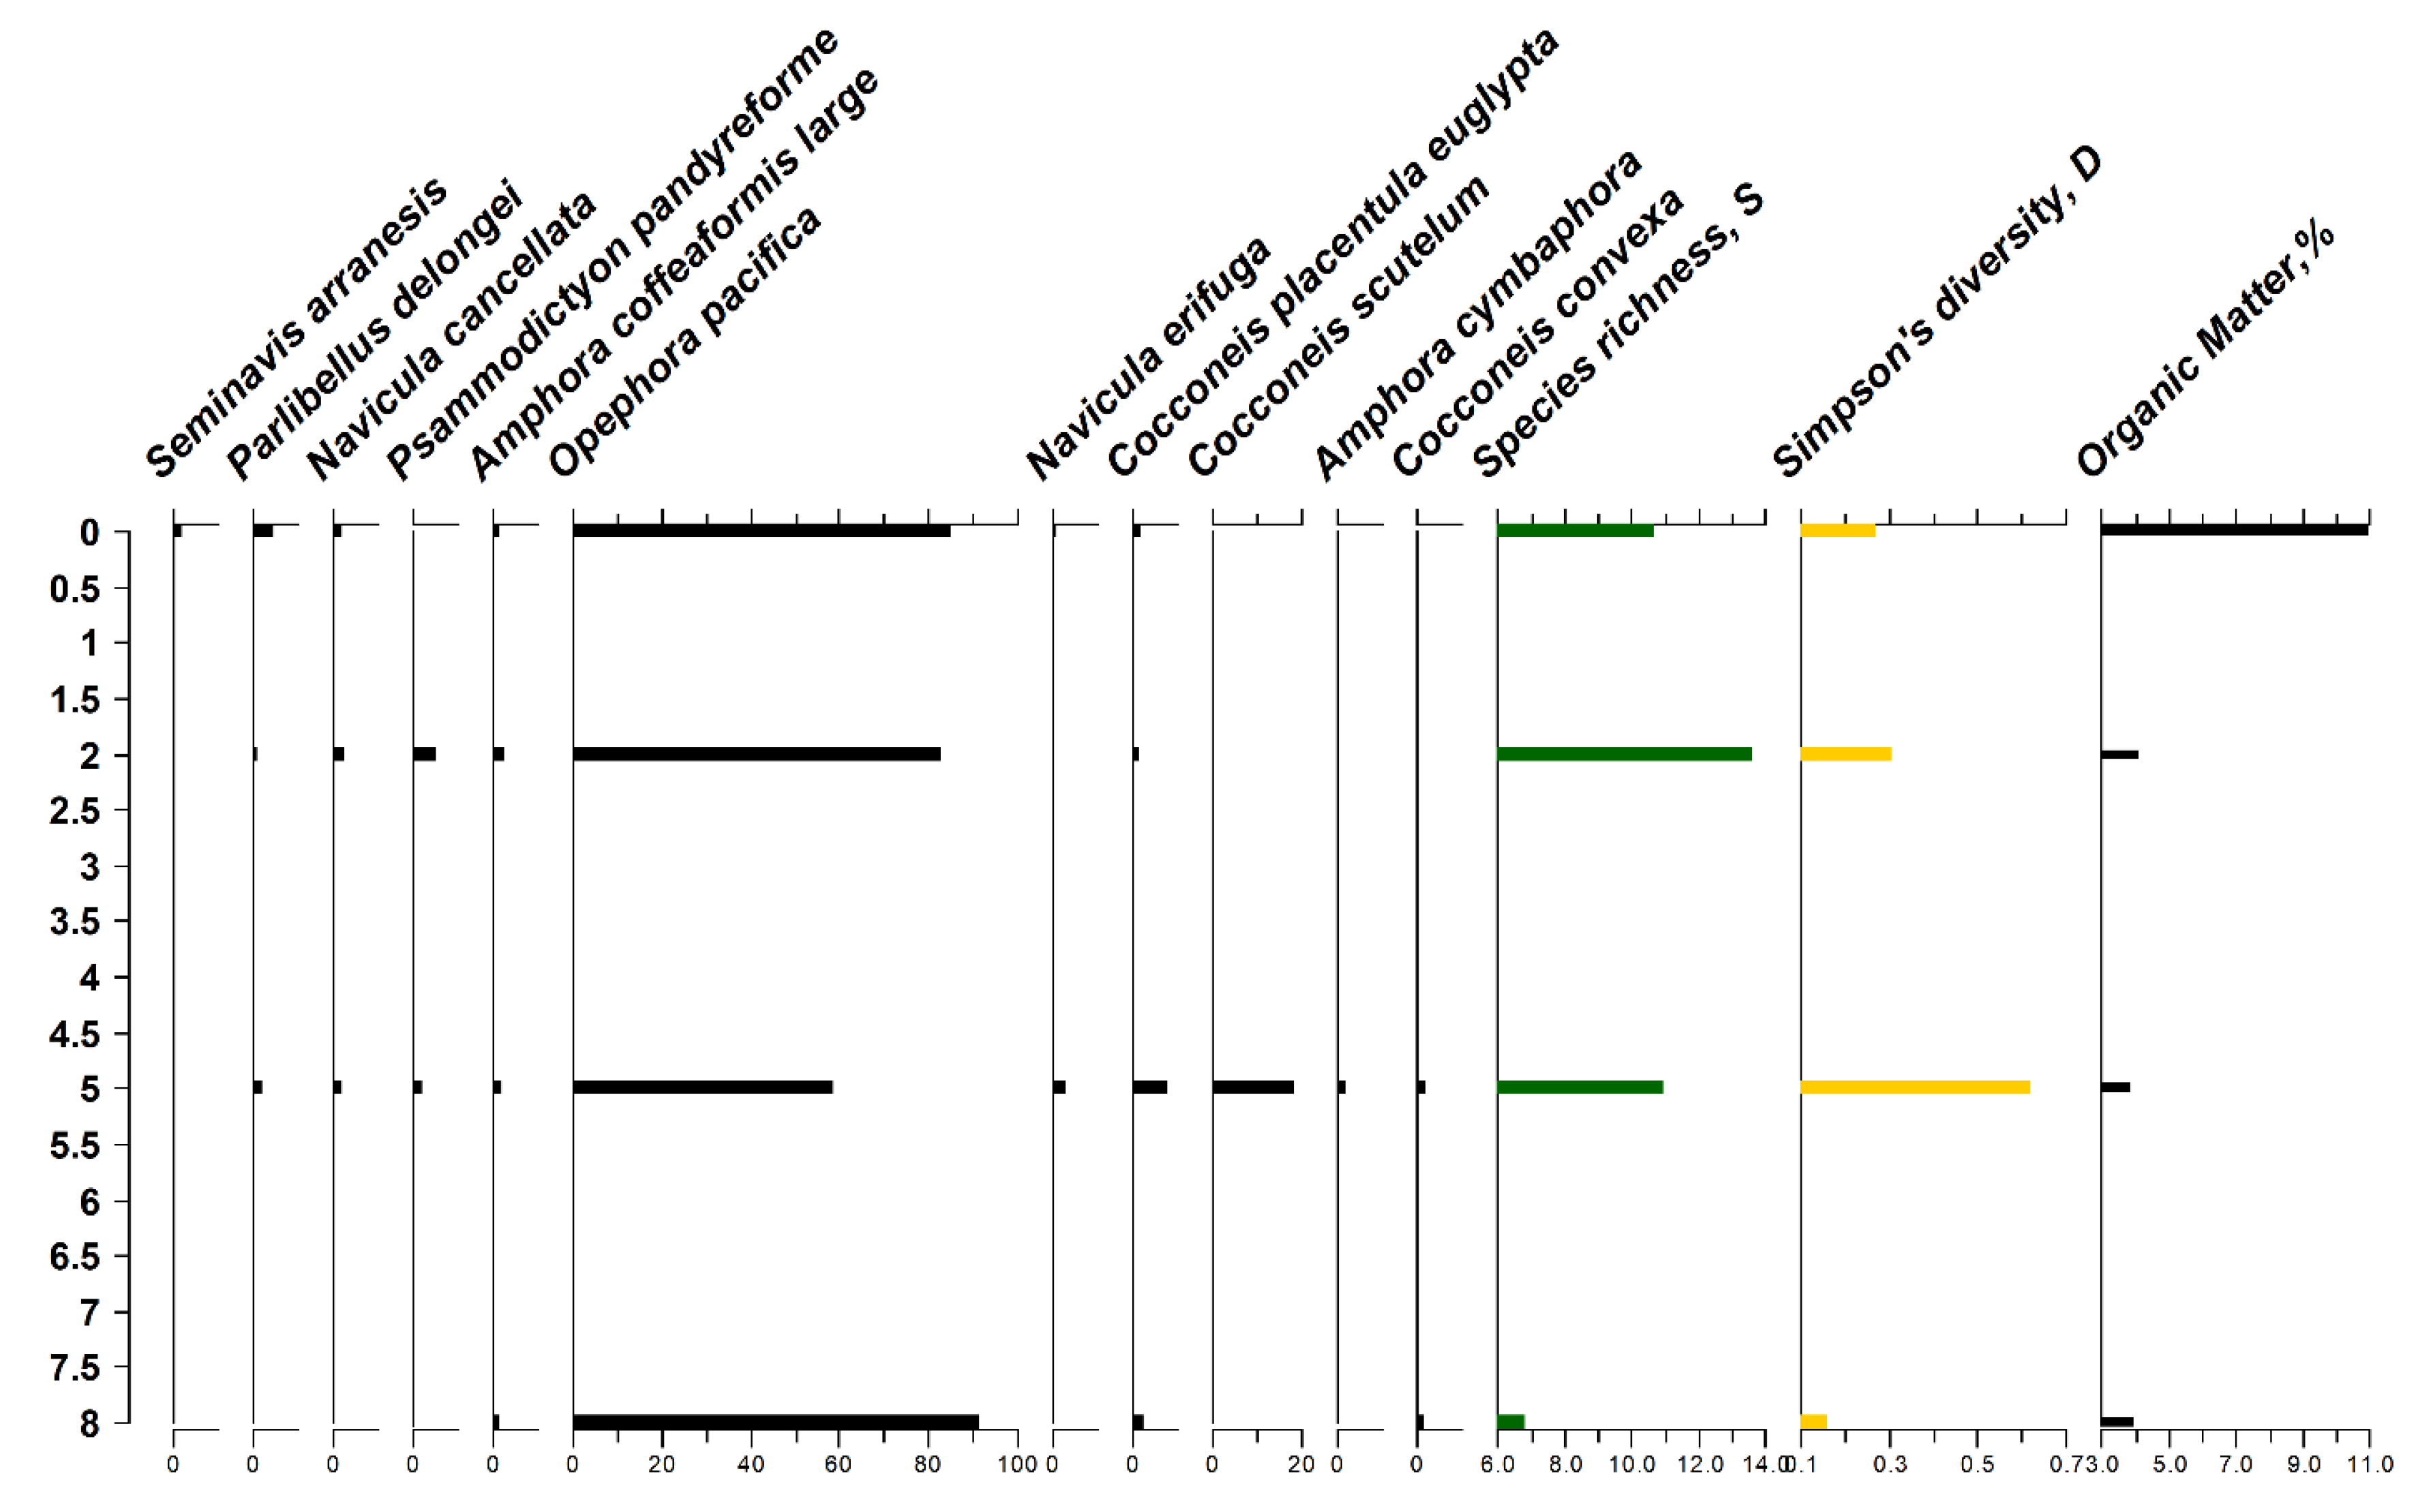
Changes in diatom composition and abundance down a short sediment core from location L5 are shown in Figure 4. The downcore assemblages were floristically close to the surface sample at this location with Opephora pacifica dominating downcore diatom assemblage at abundance ranging between 65 and 85%. The downcore assemblage comprised several epipsammic and epipelic taxa, and showed little change between the surface and 5 cm depth with Cocconeis scutellum values increased at 5 cm. Simpson’s diversity and species richness values decreased sharply at 8 cm, where several taxa disappeared and Opephora pacifica totally prevailed. Diatom frustules from the downcore assemblages showed relatively high degree of preservation despite certain dissolution at 8 cm.
OM decreased sharply down the sediment core from 11% at the surface to 3.85% at the bottom of the core.

4. Discussion

4.1. Physical Water Quality Analysis and Total Organic Carbon in Water

The pH levels obtained in this study in water samples in the mangrove forest at the Khor al Beida were within the acceptable range of 6.5–8.5 and comparable to previous studies reporting pH in the range of 6.95–7.42 [31,32]. DO in this study was found to be higher than previously recorded of 7 mg/L at UAE mangroves [31,32]. Moreover, a slight correlation between DO and temperature was observed, which is expected as the solubility of oxygen decreases as temperature increases. The increasing levels of DO in the mangrove forests can often be attributed to the oxygen exchanging at the root system of Avicennia marina, which is the mono-dominant plant [33].
The values of conductivity provide an indication of the mineral content of water [34,35]. Salinity of Umm Al Quwain mangroves ranged between 34.96 and 40.66%. Generally, the UAE mangroves have no freshwater influx, and therefore the salinity is considerably higher in the UAE mangroves compared to mangrove forests in other parts of the world [36]. Furthermore, experimental studies determined that high salinity levels force mangroves to spend energy on retaining and maintaining water balance, which adversely affects production and growth of the mangrove plants [36]. According to a mapping and site survey by the Ministry of Environment and Water in the UAE between 2011–2013, the average salinity of UAE mangroves was 41.5 ± 1.3 ppt [3], suggesting that the mangroves of the United Arab Emirates exclusively contain the highly salt tolerant grey mangrove Avicennia marina which tolerates salinity twice that of seawater [37]. A direct relationship between TDS and conductivity indicated a high capacity of water to hold an electric current.
The TOC values in the mangrove forest ranged between 19.59 to 52.01 mg C/Lin this study, much higher than reported previously in the UAE (0.8–3.9 mg/L), in Qatar (0.5–3.6 mg/L) [38], in the Kuwaiti waters of the northern Gulf (1.21–3.83 mg/L) [39], in the southern Gulf (1.8–11.8 mg/L) and in the Gulf of Oman (2.1–14.6 mg/L) [40]. The high TOC levels detected by the present study could be attributed to the presence of Exchangeable Dissolved Organic Carbon (EDOC) that consists of volatile and semi volatile organic compounds. EDOC makes up 13% of the TOC pool as reported by Sippo et al. [41], to biological sources and terrestrial activities such as industrial or municipal effluents [42] and/or to total petroleum content which is an indicator of petroleum pollution. In addition, high TOC has been correlated to hot climate, hence supporting our results obtained in hot climatic conditions of the United Arab Emirates [42]. A similar trend between TOC and the total heavy metal concentrations in water was observed, where location L4 showed the lowest TOC level (19.59 mg C/L), whereas location L8 reports the highest TOC level (52.01 mg C/L).

4.2. Elemental Analysis

Considerably lower concentrations of heavy metals in the present study were obtained in comparison to a study of Ennore Mangrove Ecosystem, East Coast India, reporting Pb (18.12 mg/L) > Cr (10.24 mg/L) > Cd (6.28 mg/L) > Cu (2.94 mg/L) > Zn (2.00 mg/L) [43]. To assess the significance of the concentrations obtained in Khor al Beida mangrove, a comparison to the Dubai standard limits, US EPA Standard limits for salt water, and Canadian Fisheries and aquatic life limits was done and shown in Table 3 [44,45,46]. The majority of the metal concentrations are within or below the acceptable standard limits set by authorities except for Cu, Zn and Ni in the water samples which were significantly higher and Cr which was only slightly higher. Heavy metals tend to accumulate in sediments and water, however, due to their persistent nature, sediments may be considered a sink for metals [16,35]. High availability of heavy metals in soil is not only due to anthropogenic sources, but also weathering processes due to their natural presence in the Earth’s core [47]. Although the mineral content in the environment may be sufficient for plants, the presence of excess heavy metals inhibits the plants ability to take up the minerals considering the main source of contact is through the roots [47], which justifies the importance of determining the concentration of heavy metals in mangroves.
The heavy metal concentrations in sediments showed that the majority of the heavy metals were within the acceptable ranges of the Dubai Municipality limits as well as the US EPA standards [44,48] as shown in Table 3. The sediment samples appear to have a very high concentration of Fe (1365.13 mg/kg) than that recommended by US EPA [48], possibly originating from anthropogenic or natural sources, but further studies are required to identify the exact source of the heavy metal pollution to maintain the health of the mangrove forest in UAE.
The variation in the concentration of heavy metals in sediments of Umm Al Quwain mangroves across time as compared to the 1998 study by Shriadah [32] is shown in Table 3.
The results of the current study indicate that there is a notable decrease in the concentration of Cd, Co, Cu and Pb from 1999 until 2017–2018, supposing improvement of mangrove environment. On the other hand, there is an increase in the concentration of Cr, Mn, Ni, and Zn over time, highlighting the need for more monitoring and control of the activities that lead to the release of Cr, Mn, Ni, and Zn into the mangrove environment, assuming that the sources of those metals are due to human activities.

4.3. Distribution of Water and Surface Sediment Chemistry Parameters

PCA biplot of sediment and water chemistry parameters shows that sediments can act as carriers and potential sources for metals in the aquatic environment [49]. Bioavailability of metals in water and sediments can be altered by physicochemical changes and speciation of the metal can also be affected by parameters such as pH, salinity and dissolved oxygen [50]. Hence, a lack in correlation among those factors in not unexpected.
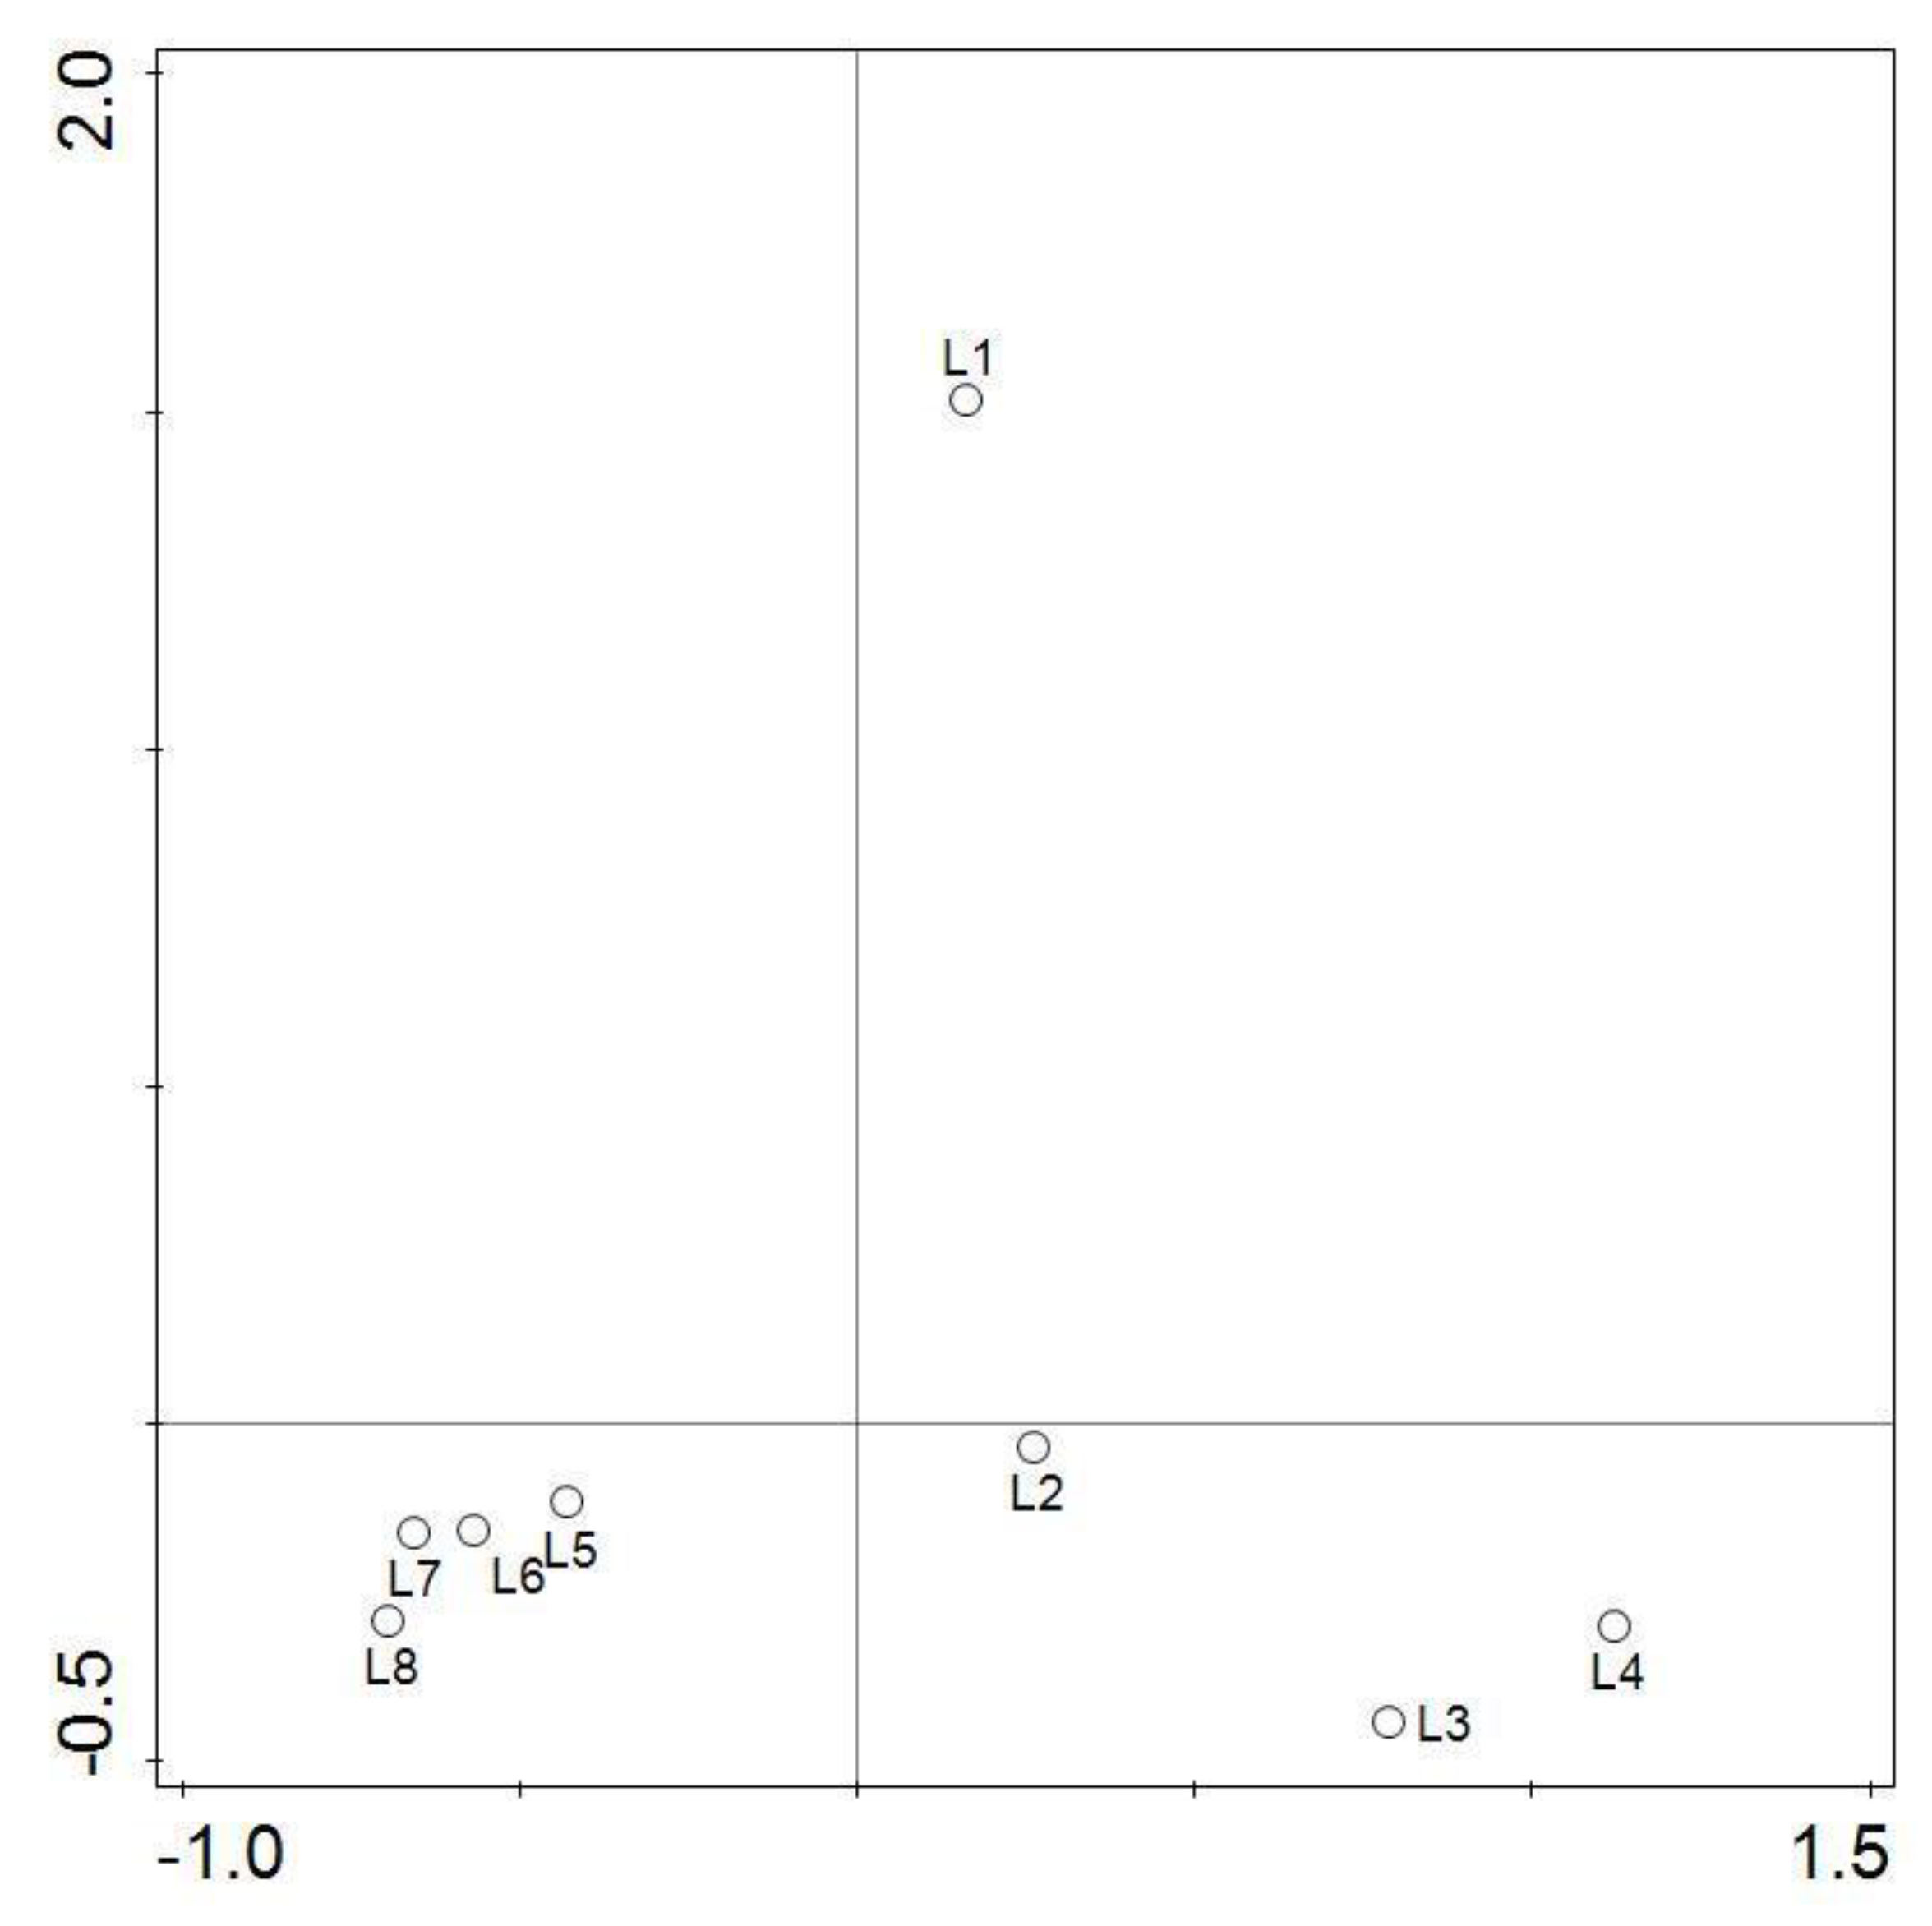
The variability between all the studied parameters among the different sampling sites is shown in the PCA biplot in Figure 5. The larger the distance between the different sampling sites in the plot the higher is the variation amongst sites. The results of the PCA biplot reveal a strong connection between sites L5 to L8 due to their close proximity in the plot. In general, location L1 had the highest variation when correlated to the other sampling sites. Location L1 was the closest to the highway which coincides with the results of the PCA, as it will be associated with interferences from both vehicles and human interactions. Furthermore, variations between sites L2, L3 and L4 are also obvious, and most probably related to their geographic location close to camping and recreational area. In addition, between sites L2 and L3, there is a recreational hotel which can also affect the environment of these sites. The variation amongst sites agrees with the total heavy metal concentration in the sediments: sites L5-L8 had similarly low concentrations, site L1 was in the middle, and the highest content of heavy metals was found in sediments at sites L2-L4. In general, no real trend was observed for all the chemical parameters, which can be influenced by their close proximity to a highway and to human activity. In addition, the presence of large organisms, (i.e., flamingoes were present at some locations) may also influence water and sediment chemistry parameters at different sampling sites.

4.4. Assessment of Hazard

Transport and fate of trace metals in the waters of the mangroves was assessed by metal partitioning between dissolved and solid phases assessment. When calculating the average partition coefficients (log Kd) for the tested heavy metals (as shown in Figure 6), Al, Fe, Mn and Ni in this mangrove ecosystem are most likely to be found bound to solid phases or sediments, as shown by the high concentrations of these metals. Ni had a log Kd value of 3.5, indicating its potential to move easily from solid phases. In contrast, Ba, Cd, Co, Cr, Cu, Pb and Zn, had log Kd values below 3, meaning that they will typically be found in the liquid phase. The results imply that sediments could be a contaminant source to water in relation to metals with log Kd values between 3–4. Furthermore, it has been reported that sediments are not only a compartment where metals and other pollutants can accumulate, but can also be considered as secondary pollution sources. The results of this study are in agreement with those reported in the waters of the Tigris River [23]. Moreover, factors such as pH and ORP, as well as extreme weather events such as rain can influence the metals release and distribution [22].
The results of the hazard quotient (HQ), presented in Table 3, indicate that Cd, Pb, Al and Fe, are present at safe levels in water. In addition, Cu and Ni show low pollution load with no acute danger to organisms, and Cr level is considered intermediate pollution, affecting only sensitive species. On the other hand, Zn presents a potential major problem according to the hazard quotient of 143, possibly endangering the benthic community. Zn could originate from runoff of heavy traffic areas, industrial effluents, textile and other industries. Furthermore, Zn, is an essential metal for growth of marine organisms, particularly plankton algae, and its concentration may be influenced by plankton communities [51]. Generally, Zn concentrations tend to be higher at coastal areas compared to the open ocean [52].
In the case of the sediments, all values reported for the metals are considered safe and low risk to the organisms, with the exception of Fe, with a value of 546.05, which indicates high risk. Due to the nature of iron, it has the ability to precipitate in alkaline and oxidizing conditions, which is why it could potentially vary with seasons; hence, it is expected that most of the iron is present as a precipitate and not bioavailable for uptake [53].

4.5. Diatom Analysis and Organic Matter

Opephora pacifica prevailed in both surface sediments and core samples (Figure 3). This small epipsammic diatom is common in organically-rich sands in the Gulf and widespread species in coastal sediments in Europe and Pacific region [19,54]. Cocconeis placentula var. euglipta also occurred at high abundance (over 20%) in the sediments of Khor al Beida mangroves albeit at only few locations. This is a cosmopolitan epiphytic taxon, which occurred in Kuwaiti coastal sediments [19,54] and in Shatt al-Arab estuary in Iraq [21].
Figure 7 summarizes major patterns of diatom species distribution across surface sediment samples of Khor al Beida mangroves. DCA identified three distinct diatom assemblages.
  • Ubiquitous cosmopolitan epipsammic Achnanthidium minutissimum prevailed in the algal mat in location L6 together with epiphytic Mastogloia macdonaldii and Fragilaria fasciculata. Mastogloia citrus also occurred predominantly in the algal mat in location L6. It was observed as attached to the filaments of Enteromorpha and Rhizoclonium. Achnanthidium minutissimum is a widespread freshwater taxon and its presence at the algal mat may indicate occasional influx of freshwater into the mangrove, although there is no permanent source of freshwater in Khor al Beida. Potentially, it may also occur in the algal mat through air transport from a freshwater source. Nitzschia sp. (type 5) also occurred at high abundance in this location.
  • Surface diatom assemblage in location L5 (both algal mat and surface sediment sample) shows similarities with the assemblages in location 7AM (right hand side bottom part of diagram in Figure 7). This assemblage was dominated by epiphytic Cocconeis placentula var. euglipta and epipelic Amphora coffeaeformis large form. Amphora coffeaeformis commonly occurs in marine and brackish intertidal sediments, it was found in large quantities in Kuwaiti mud flats [19] and in the Shatt Al Arab estuary in Iraq [21].
  • Another large diatom assemblage (Assemblage 3 in Figure 7) comprises mainly epipelic and epipsammic diatoms from locations L6, L7, and L8 (these exclude algal mats). Several epiphytic Cocconies taxa (C. scutellum and C. convexa), which are quite common marine taxa, with C. convexa also found on Kuwaiti macrophytes [19], in the sediments of Shatt Al Arab estuary in Iraq [21] and in the northern coast of Jeddah [55]. Epipelic taxa (e.g., A. coffeaeformis small, A. cymbaphora, Navicula erifuga, N. besarensis and N. digitoradiata) and epiphytic Achnanthes brevipes dominated this diatom assemblage. These species commonly occur in Kuwaiti coastal sediments [19]. Epiphytic Achanthes brevipes was also abundant in Huwaiza marsh in Iraq [56].
Ubiquitous Opephora pacifica, which varies from 30% to nearly 80% abundance (location L5, Figure 3) is present in both assemblages and placed between assemblages 2 and 3 in Figure 7.
Diatom diversity values (D and N2) followed the same trend and ranged widely within the sampled set. Species richness S generally followed the same pattern as diatom diversity indices. In general, algal mats had higher values of D and N2 (see Figure 3). This may be due to the more diverse habitats in algal mats locations, where both epiphytic and epipsammic diatoms occur. However, location L8 with muddy sands and no algal mat also had high values of both diatom diversity and diatom species richness. It is dominated by relatively large epipelic motile Navicula, Amphora and Seminavis taxa. There is no evidence that diatom composition or diatom diversity are influenced by any of the measured chemical parameters except for, possibly, OM. OM values are higher in algal mat locations compared to other sampled sites in Khor al Beida (Figure 3). However, this does not necessarily imply that higher OM values correspond to higher diatom diversity in Khor al Beida, as location L8 has low OM values and high values of diversity and richness. Other factors, like habitat availability, is likely to play a role in determining diatom diversity. Clearly, more research is needed to confirm this.
Generally, mangrove ecosystems tend to be highly productive of OM and hence, act as a sink for organic carbon and as a rich source of organic carbon and nutrients to adjacent coastal systems [52]. However, sometimes, mangroves show high variation in OM and organic carbon content and both parameters may be quite low [57]. This is apparently the case with the Khor al Beida mangrove ecosystem where the low values of OM are possibly due to low plant density, higher tidal flushing, and intense bioturbation that removes OM readily [58]. The mangrove forest in Khor al Beida is likely an overwash system similar to other mangroves in the UAE [8], whereby tides wash away much of the organic matter.
The net decrease in OM content with increasing core depth (as is the case with the short core in location L5, Figure 4) is expected in mangrove ecosystems and consistent with previous studies and literature findings [59]. The decrease in OM content that takes place below the surface sediments is due to the microbial degradation that depletes all the oxygen below the surface, hence, initiating the process of bacterial sulphate reduction that decreases OM content [58].
Overall, the surface diatom assemblages from Khor al Beida mangroves show certain affinity to the coastal assemblages from the Kuwait [19], sediments from Shatt Al-Arab estuary and Huwaiza marsh [21], and epiphytic taxa from Jeddah coast in Saudi Arabia [55]. Diatom diversity and species richness values are generally higher in algal mats and in muddy sands of location L8. Diatom composition and diversity show no correlation with measured sediment and water chemistry parameters and there is only a tentative link to OM%, which requires further research.

5. Conclusions

This is the first interdisciplinary assessment of the current environmental status of a valuable and potentially vulnerable mangrove ecosystem in the United Arab Emirates. The results of this study show that there are slightly elevated levels of certain trace metals such as zinc in water and aluminum and iron in sediments, but the water quality parameters (e.g., DO and salinity) appear to be within the normal ranges for this part of the Gulf. OM content of the surface sediments is variable, but generally has low values, which is likely due to overwash type of mangrove forest and relatively low tree density in Khor al Beida. This is similar to other mangrove systems in the UAE. The surface diatom assemblages from Khor al Beida mangroves show certain affinity to the coastal assemblages from the Kuwait [19], and sediments from Shatt Al-Arab estuary and Huwaiza marsh [21,56], and epiphytic taxa from Jeddah coast in Saudi Arabia [55]. Diatom diversity and species richness values are generally higher in algal mats and in muddy sands. Measured sediment and water chemistry parameters have no discernible impact on diatom diversity and distribution in surface sediments of Khor al Beida. Diatom taxa in the short sediment core show slight dissolution at the lower depth, but there is still potential for further paleolimnological investigation of mangrove sediments.
Overall, the assessment suggests that Khor al Beida mangrove forest is currently undisturbed, and very little anthropogenic impact can be ascertained. This study shows the importance of monitoring mangrove systems that are currently considered undisturbed and raising awareness of stakeholders and the general public about the importance of conservation of mangrove ecosystems in the UAE.

Author Contributions

Conceptualization: F.S. and N.S.; methodology: F.S., Z.A.N., T.G. and N.S.; formal analysis: F.S., Z.A.N., T.G. and N.S.; resources: F.S.; writing—original draft preparation: F.S.; writing—review and editing, F.S., Z.A.N., T.G., M.S. and N.S.; supervision, F.S. and N.S.; project administration, F.S.; funding acquisition, F.S. All authors have read and agreed to the published version of the manuscript.

Funding

This research was funded by American University of Sharjah, grant number FRG17-R-18. The work in this paper was supported, in part, by the Open Access Program from the American University of Sharjah.

Acknowledgments

The authors of this paper would like to thank the American University of Sharjah for supporting this research. Special thanks to the Department of Biology, Chemistry and Environmental Sciences for their support in completing the tasks of this research and to Tarig A. Ali for his help in constructing the sampling location map. Extended acknowledgements to Nedal Abufarha and Ziad Sara for their help during the analysis of the samples and to Sandra Knuteson, Aaron Bartholomew and Paloma Leandro for their assistance during the sampling.

Conflicts of Interest

The authors declare no conflict of interest. This paper represents the opinions of the author(s) and does not mean to represent the position or opinions of the American University of Sharjah. The funders had no role in the design of the study; in the collection, analyses, or interpretation of data; in the writing of the manuscript, or in the decision to publish the results.

Appendix A

Table A1. Full diatom names and abbreviations used in Figure 7.
Full Diatom NameAbbreviation in Figure 7
Achnanthidium minutissimum aggAchnMint
Achnanthes brevipesAchnBrev
Amphora coffeaeformis large formAmpCoffL
Amphora coffeaeformis small formAmpCoffSm
Amphora cymbaphoraAmphCymb
Cocconeis placentula var. eugliptaCoccPlac
CocconeisscutellumCoccScut
Cocconeis convexaCoccConv
Craspedostauros amphoroidesCrasAmph
Fragilaria fasciculataFraFasIc
Mastogloia citrusMastMacd
Mastogloia macdonaldiiMastCitr
Navicula cancellataNavCanc
Navicula erifugaNavcErif
Navicula besarensisNavcBesr
Navicula cancellataNavCanc
Navicula digitoradiataNavcDigt
Navicula erifugaNavcErif
Opephora pacificaOpePac
Opephora mutabilisOpepMut
Parlibellus delongeiParlDeln
SeminavisarranensisSemnArrn
Nitzschia cf. perminuta’NitPerm
Nitzschia sp. type 5NitSp5

References

  1. Carugati, L.; Gatto, B.; Rastelli, E.; Lo Martire, M.; Coral, C.; Greco, S.; Danovaro, R. Impact of Mangrove Forests Degradation on Biodiversity and Ecosystem Functioning. Sci. Rep. 2018, 8, 13298. [Google Scholar] [CrossRef] [PubMed] [Green Version]
  2. Holguin, G.; Vazquez, P.; Bashan, Y. The Role of Sediment Microorganisms in the Productivity, Conservation, and Rehabilitation of Mangrove Ecosystems: An Overview. Biol. Fertil. Soils 2001, 33, 265–278. [Google Scholar] [CrossRef]
  3. United Arab Emirates Ministry of Climate Change and Environment. Available online: https://www.moccae.gov.ae/assets/download/98f3baf3/UAEMangroves-Mooreetal.2013.pdf.aspx?view=true (accessed on 2 October 2019).
  4. Polidoro, B.A.; Carpenter, K.E.; Collins, L.; Duke, N.C.; Ellison, A.M.; Ellison, J.C.; Farnsworth, E.J.; Fernando, E.S.; Kathiresan, K.; Koedam, N.E.; et al. The Loss of Species: Mangrove Extinction Risk and Geographic Areas of Global Concern. PLoS ONE 2010, 5, e10095. [Google Scholar] [CrossRef] [PubMed]
  5. Duarte, C.; Losada, I.J.; Hendriks, I.; Mazarrasa, I.; Marba, N. The Role of Coastal Plant Communities for Climate Change Mitigation and Adaptation. Nat. Clim. Chang. 2013, 3, 961–968. [Google Scholar] [CrossRef] [Green Version]
  6. Kandasamy, K.; Rajendran, N. Mangrove Ecosystems of the Indian Ocean Region. Indian J. Mar. Sci. 2005, 34, 104–113. [Google Scholar]
  7. Spalding, M.; Kainuma, M.; Collins, L. World Atlas of Mangroves, 1st ed.; Earthscan: London, UK, 2010. [Google Scholar]
  8. Moore, G. Distribution, Pore-Water Chemistry, and Stand Characteristics of the Mangroves of the United Arab Emirates. J. Coast. Res. 2015, 31, 957–963. [Google Scholar] [CrossRef]
  9. Loughland, R.A.; Saenger, P.; Luker, G.; Siddiqui, K.; Saji, B.; Belt, M.; Crawford, K. Changes in the Coastal Zone of Abu Dhabi Determined Using Satellite Imagery (1972–2003). Aquat. Ecosyst. Health Manag. 2007, 10, 301–308. [Google Scholar] [CrossRef]
  10. Ward, R.D.; Friess, D.A.; Day, R.H.; MacKenzie, R.A. Impacts of Climate Change on Mangrove Ecosystems: A Region by Region Overview. Ecosyst. Health Sustain. 2016, 2. [Google Scholar] [CrossRef] [Green Version]
  11. Wabnitz, C.C.C.; Lam, V.W.Y.; Reygondeau, G.; Teh, L.C.L.; Al-Abdulrazzak, D.; Khalfallah, M.; Pauly, D.; Palomares, M.L.D.; Zeller, D.; Cheung, W.W.L. Climate Change Impacts on Marine Biodiversity, Fisheries and Society in the Arabian Gulf. PLoS ONE 2018, 13, e0194537. [Google Scholar] [CrossRef] [Green Version]
  12. Dodd, R.S.; Blasco, F.; Rafii, Z.A.; Torquebiau, E. Mangroves of the United Arab Emirates: Ecotypic Diversity in Cuticular Waxes at the Bioclimatic Extreme. Aquat. Bot. 1999, 63, 291–304. [Google Scholar] [CrossRef]
  13. Al Habshi, A.; Youssef, T.; Aizpuru, M.; Blasco, F. New Mangrove Ecosystem Data along the UAE Coast Using Remote Sensing. Aquat. Ecosyst. Health Manag. 2007, 10, 309–319. [Google Scholar] [CrossRef]
  14. Boer, B.; Lieth, H. Halophytes for Seawater Irrigation in the Arabian Peninsula-a Review. In Halophyte Crop Development for Different Climates, Ecological and Eco-Physiological Contributions; Lieth, H., Hamdy, A., Koyro, H.W., Moschenko, M., Eds.; University of Paderborn: Paderborn, Germany, 1999. [Google Scholar]
  15. Almahasheer, H. High Levels of Heavy Metals in Western Arabian Gulf Mangrove Soils. Mol. Biol. Rep. 2019, 46. [Google Scholar] [CrossRef] [PubMed]
  16. Shriadah, M.A. Metals Pollution in Marine Sediments of the United Arab Emirates Creeks along the Arabian Gulf Shoreline. Bull. Environ. Contam. Toxicol. 1998, 60, 417–424. [Google Scholar] [CrossRef] [PubMed]
  17. Muzaffar, S.B.; Whelan, R.; Clarke, C.; Gubiani, R.; Benjamin, S. Breeding Population Biology in Socotra Cormorants (Phalacrocorax Nigrogularis) in the United Arab Emirates. Waterbirds 2017, 40, 1–10. [Google Scholar] [CrossRef] [Green Version]
  18. Battarbee, R.W.; Jones, V.J.; Flower, R.J.; Cameron, N.G.; Bennion, H.; Carvalho, L. Tracking Environmental Change Using Lake Sediments. In Tracking Environmental Change Using Lake Sediments: Volume 3: Terrestrial, Algal and Siliceous Indicators; Smol, J.P., Birks, H.J., Last, W.M., Eds.; Springer: Berlin, Germany, 2001; pp. 155–202. [Google Scholar] [CrossRef]
  19. Al-Yamani, F.; Saburova, M. Illustrated Guide on the Benthic Diatoms of Kuwait’s Marine Environment; Kuwait Institute for Scientific Research: Chestnut Hill, MA, USA, 2011. [Google Scholar]
  20. Desrosiers, C.; Leflaive, J.; Eulin, A.; Ten-Hage, L. Bioindicators in Marine Waters: Benthic Diatoms as a Tool to Assess Water Quality from Eutrophic to Oligotrophic Coastal Ecosystems. Ecol. Indic. 2013, 32, 25–34. [Google Scholar] [CrossRef]
  21. Al-Handal, A.Y. Littoral Diatoms from the Shatt Al-Arab Estuary, North West Arabian Gulf. Cryptogam. Algol. 2009, 30, 153–183. [Google Scholar]
  22. Nabelkova, J.; Komínková, D. Trace Metals in the Bed Sediment of Small Urban Streams. Open Environ. Biol. Monit. J. 2012, 5, 48–55. [Google Scholar] [CrossRef] [Green Version]
  23. Al Obaidy, A.H.; Al-Janabi, Z.; Al-Mashhady, A. Distribution of some heavy metals in sediments and water in Tigris River. J. Glob. Ecol. Environ. 2016, 4, 140–146. [Google Scholar]
  24. Clements, W.; Carlisle, D.; Lazorchak, J.; Johnson, P. Heavy Metals Structure Benthic Communities in Colorado Mountain Streams. Ecol. Appl. 2000, 10. [Google Scholar] [CrossRef]
  25. Barnthouse, L.W.; DeAngelis, D.L.; Gardner, R.H.; Ońeill, R.V.; Suter, G.V.; Vaughan, D.S. Methodology for Environmental Risk Analysis; Oak Ridge National Laboratory: Oak Ridge, TN, USA, 1986.
  26. Šmilauer, P.; Lepš, J. Multivariate Analysis of Ecological Data Using CANOCO 5, 2nd ed.; Cambridge University Press: Cambridge, UK, 2014. [Google Scholar] [CrossRef] [Green Version]
  27. Hill, M. Diversity and Evenness: A Unifying Notation and Its Consequences. Ecology 1973, 54, 427–432. [Google Scholar] [CrossRef] [Green Version]
  28. Simpson, E.H. Measurement of Diversity. Nature 1949, 163, 688. [Google Scholar] [CrossRef]
  29. Birks, H.J.B.; Line, J.M. The Use of Rarefaction Analysis for Estimating Palynological Richness from Quaternary Pollen-Analytical Data. Holocene 1992, 2, 1–10. [Google Scholar] [CrossRef]
  30. Juggins, S. Software for Ecological and Palaeoecological Data Analysis and Visualisation; Newcastle University: Newcastle upon Tyne, UK, 2005. [Google Scholar]
  31. Samara, F.; Ali, T.; Haverila, J.; Knuteson, S. Investigation of Fecal Contamination of Groundwater and Surface Water at Al Wasit Nature Reserve, Sharjah, United Arab Emirates. Asian J. Microbiol. Biotechnol. Environ. Sci. 2016, 18, 35–45. [Google Scholar]
  32. Shriadah, M.M.A. Heavy Metals in Mangrove Sediments of the United ARAB Emirates Shoreline (Arabian Gulf). Water Air Soil Pollut. 1999, 116, 523–534. [Google Scholar] [CrossRef]
  33. Jitthaisong, O.; Dhanmanonda, P.; Chunkao, K.; Teejuntuk, S. Water Quality from Mangrove Forest: The King’s Royally Initiated Laem Phak Bia Environmental Research and Development Project, Phetchaburi Province, Thailand. Mod. Appl. Sci. 2012, 6. [Google Scholar] [CrossRef] [Green Version]
  34. Radojevic, M.; Bashkin, V. Practical Environmental Analysis; The Royal Society of Chemistry: London, UK, 2006. [Google Scholar] [CrossRef]
  35. Samara, F.; Elsayed, Y.; Soghomonian, B.; Knuteson, S. Chemical and Biological Assessment of Sediments and Water of Khalid Khor, Sharjah, United Arab Emirates. Mar. Pollut. Bull. 2016, 111. [Google Scholar] [CrossRef]
  36. Hossain, M.D.; Nuruddin, A.A. Soil and Mangrove: A Review. J. Environ. Sci. Technol. 2016, 9, 198–207. [Google Scholar] [CrossRef] [Green Version]
  37. Ish-Shalom-Gordon, N.; Dubinsky, Z. Diurnal Pattern of Salt Secretion in Leaves of the Black Mangrove, Avicennia Marina, on the Sinai Coast of the Red Sea. Pac. Sci. 1993, 47, 51–58. [Google Scholar]
  38. Emara, H.I. Total Organic Carbon Content in the Waters of the Arabian Gulf. Environ. Int. 1998, 24, 97–103. [Google Scholar] [CrossRef]
  39. Al-Said, T.; Naqvi, S.W.A.; Al-Yamani, F.; Goncharov, A.; Fernandes, L. High Total Organic Carbon in Surface Waters of the Northern Arabian Gulf: Implications for the Oxygen Minimum Zone of the Arabian Sea. Mar. Pollut. Bull. 2018, 129, 35–42. [Google Scholar] [CrossRef]
  40. Emara, H.I. Nutrient Salts, Inorganic and Organic Carbon Contents in the Waters of the Persian Gulf and the Gulf of Oman. J. Persian Gulf 2010, 1, 33–44. [Google Scholar]
  41. Sippo, J.Z.; Maher, D.T.; Tait, D.R.; Ruiz-Halpern, S.; Sanders, C.J.; Santos, I.R. Mangrove Outwelling Is a Significant Source of Oceanic Exchangeable Organic Carbon. Limnol. Oceanogr. Lett. 2017, 2, 1–8. [Google Scholar] [CrossRef]
  42. Zeri, C.; Kontoyiannis, H.; Giannakourou, A. Distribution, Fluxes and Bacterial Consumption of Total Organic Carbon in a Populated Mediterranean Gulf. Cont. Shelf Res. 2009, 29, 886–895. [Google Scholar] [CrossRef]
  43. Rajagopal, K. Analysis of Heavy Metals Accumulation in Mangroves and Associated Mangroves Species of Ennore Mangrove Ecosystem, East Coast India. Indian J. Sci. Technol. 2016, 9, 1–11. [Google Scholar] [CrossRef] [Green Version]
  44. Trakhees. Available online: https://www.trakhees.ae/en/ehs/env/Documents/Regulations/RegulationEN-5.0,WaterEnvironment.pdf (accessed on 20 May 2019).
  45. Chapman, D.V.; World Health Organization; United Nations Environment Programme. Water Quality Assessments: A Guide to the Use of Biota, Sediments and Water in Environmental Monitoring/Edited by Deborah Chapman, 2nd ed.; E & FN Spon: London, UK, 1996. [Google Scholar]
  46. U.S. Environmental Protection Agency (US EPA). National Recommended Water Quality Criteria. US EPA 40 CFR Part 1; U.S. Environmental Protection Agency (US EPA): Washington, DC, USA, 2004.
  47. Sharma, R.; Agrawal, M. Biological Effects of Heavy Metals: An Overview. J. Environ. Biol. 2005, 26, 301–313. [Google Scholar] [PubMed]
  48. U.S. Environmental Protection Agency (US EPA). Guidelines for the Pollution Classification of Great Lakes Harbor Sediments; U.S. Environmental Protection Agency (US EPA): Washington, DC, USA, 1977.
  49. Eggleton, J.; Thomas, K.V. A Review of Factors Affecting the Release and Bioavailability of Contaminants during Sediment Disturbance Events. Environ. Int. 2004, 30, 973–980. [Google Scholar] [CrossRef] [PubMed]
  50. Simpson, S.; Batley, G. Disturbances to Metal Partitioning during Toxicity Testing Fe(II)-Rich Estuarine Porewaters and Whole-Sediments. Environ. Toxicol. Chem. 2003, 22, 424–432. [Google Scholar] [CrossRef]
  51. Masoud, M.; Elewa, A.A.; Ali, A.E.; Mohamed, E. Distribution of Some Metal Concentration in Water and Sediments of Lake Edku, Egypt. Bull. Chem. Technol. Maced. 2005, 24, 21–34. [Google Scholar]
  52. Gonneea, M.E.; Paytan, A.; Herrera-Silveira, J.A. Tracing Organic Matter Sources and Carbon Burial in Mangrove Sediments over the Past 160 Years. Estuar. Coast. Shelf Sci. 2004, 61, 211–227. [Google Scholar] [CrossRef]
  53. Hinokidani, K.; Nakanishi, Y. Dissolved Iron Elution from Mangrove Ecosystem Associated with Polyphenols and a Herbivorous Snail. Ecol. Evol. 2019, 9, 6772–6784. [Google Scholar] [CrossRef] [Green Version]
  54. Al-Yamani, F.Y.; Bishop, J.; Ramandhan, E.; Al-Husaini, M.; Al-Ghadban, A.N. Oceonagraphic Atlas of Kuwait’s Waters; Kuwait Institute for Scientific Research: Kuwait City, Kuwait, 2004. [Google Scholar]
  55. Al-Harbi, S. Epiphytic Microalgal Species Composition and Dynamics on Host Green Seaweeds (Ulvaphyceae) on the Northern Coast of Jeddah, Saudi Arabia. Environ. Ecol. Res. 2017, 5, 212–219. [Google Scholar] [CrossRef]
  56. Al-Handal, A.Y.; Dawood, S.A.; Wulff, A.; Abdulwahab, M.T. Epiphytic Diatoms of the Mesopotamian Wetland: Huwaiza Marsh, South Iraq. Diatom 2014, 30, 164–178. [Google Scholar] [CrossRef]
  57. Bouillon, S.; Dahdouh-Guebas, F.; Rao, A.V.V.S.; Koedam, N.; Dehairs, F. Sources of Organic Carbon in Mangrove Sediments: Variability and Possible Ecological Implications. Hydrobiologia 2003, 495, 33–39. [Google Scholar] [CrossRef]
  58. Sebastian, R.; Chacko, J. Distribution of Organic Carbon in Tropical Mangrove Sediments (Cochin, India). Int. J. Environ. Stud. 2006, 63, 303–311. [Google Scholar] [CrossRef]
  59. Sanders, C.J.; Smoak, J.M.; Waters, M.N.; Sanders, L.M.; Brandini, N.; Patchineelam, S.R. Organic Matter Content and Particle Size Modifications in Mangrove Sediments as Responses to Sea Level Rise. Mar. Environ. Res. 2012, 77, 150–155. [Google Scholar] [CrossRef]
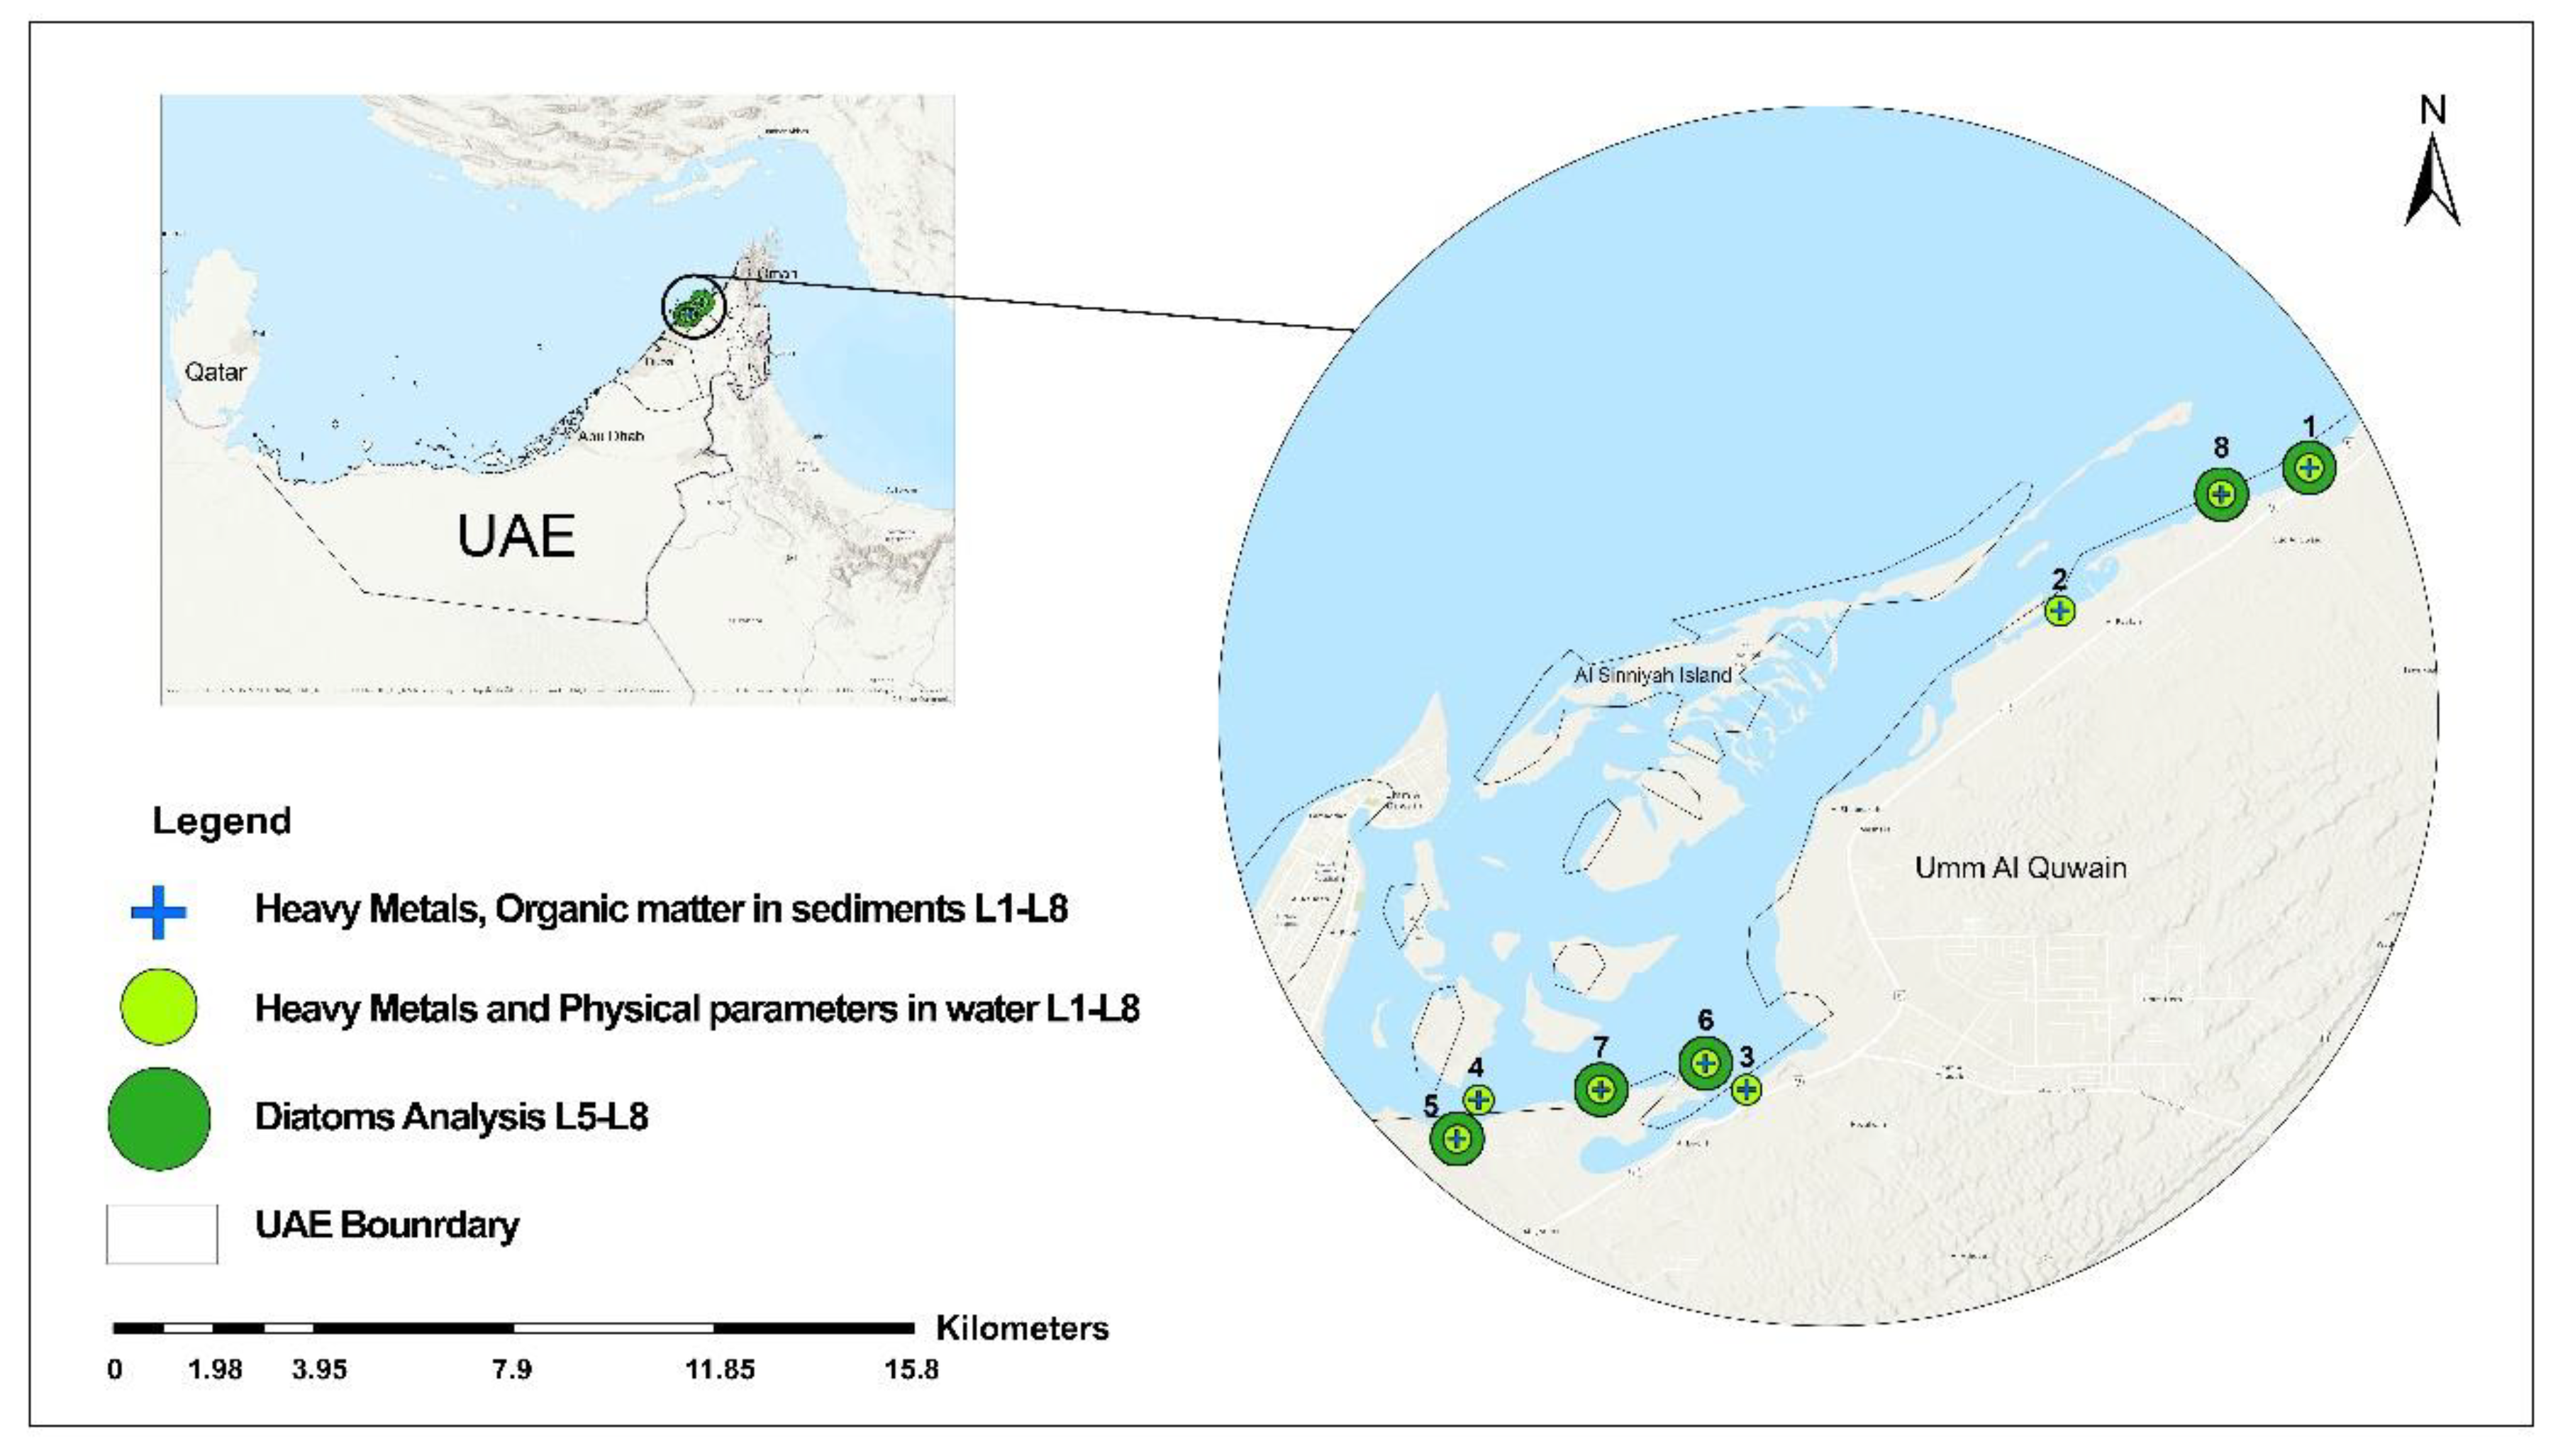
Figure 1. Sampling Locations from Umm Al Quwain Mangroves, United Arab Emirates.
Water 12 01623 g001
Figure 2. Principal component analysis (PCA) biplot of water and surface sediment parameters in the mangrove forest of Khor al Beida.
Water 12 01623 g002
Figure 3. Relative abundance of the diatom species together with diatom species richness (S) and Simpson’s diversity (D), Hills diversity N2 and % Organic Matter (OM) in the surface sediments of the mangrove forest in the Khor al Beida, UAE. Only taxa, occurring at 2% of relative abundance are shown. AM is algal mat. Diatom taxa are ordered by their weighted averaging (WA) scores in C2 [30].
Water 12 01623 g003
Figure 4. Diatom taxa occurring at above 1% at the sediment core from location 5.
Water 12 01623 g004
Figure 5. PCA biplot of sample scores of water and surface sediment chemistry parameters in the mangrove forest of Khor al Beida.
Water 12 01623 g005
Figure 6. Partition Coefficients (log Kd) results for water and sediment samples.
Water 12 01623 g006
Figure 7. Detrended Correspondent Analysis (DCA) species biplot showing major patterns of diatom taxa distribution in the surface sediments of Khor al Beida mangroves. Species are shown as triangles, 3 assemblages are marked as ellipsoids and numbered. Only taxa with abundance above 1% are shown. For full diatom names please see Table A1.
Water 12 01623 g007
Table 1. Surface water quality and descriptive statistics at Umm Al Quwain mangroves, UAE.
LocationTemperature (°C)pHDO (mg/L)Conductivity (mS/cm)TDS (ppt)ORPSalinity (ppt)Water TOC (mg C/L)
L128.257.7224.2755.0827.5826.9036.4433.19
L229.858.0018.2054.5727.3953.7036.1036.71
L334.188.0815.2560.4630.2461.1040.1720.73
L429.758.3315.7155.3627.6653.3036.5019.59
L528.747.3422.8560.7630.3881.8040.6636.26
L629.028.1521.7358.4729.2466.0038.9133.64
L732.757.9717.2765.3132.6548.6034.9642.92
L830.367.9419.3358.5729.3155.9137.6852.01
Max34.188.3324.2765.3132.6581.8040.6652.01
Min28.257.3415.2554.5727.3926.9034.9619.59
Average30.367.9419.3358.5729.3155.9137.6834.38
Range5.930.999.0210.745.2654.905.7032.42
St Dev2.060.303.333.631.8015.612.0510.69
Table 2. Heavy metals concentrations and descriptive statistics in the water and sediments of Umm Al Quwain mangroves.
Water Metal Concentrations (mg/L)
SitesBaCdCoCrCuMnNiPbZnAlFe
L10.024ND0.0000.0770.0010.0110.0140.0112.7290.0800.054
L20.0210.0010.007ND *0.0240.0040.0050.0132.6880.0150.024
L30.016ND0.003NDND0.0090.001ND3.0030.0250.022
L40.016ND0.012NDND0.0040.0080.0032.1870.0080.015
L50.008ND0.007NDND0.0050.019ND2.9050.0370.031
L60.0160.0010.011ND0.0010.0030.009ND2.8870.0100.015
L70.0200.0000.012NDND0.005ND0.0063.0910.0150.031
L80.0180.0000.009NDND0.0010.0160.0043.4950.0230.031
Max0.0240.0010.0120.0770.0240.0110.0190.0133.4950.0800.054
Min0.0080.0000.000 0.0010.0010.0010.0032.1870.0080.015
Average0.0170.0010.008 0.0090.0050.0100.0072.8730.0270.028
Range0.0160.0010.012 0.0230.0100.0180.0101.3080.0720.039
St. Dev0.0050.0010.004 0.0130.0030.0060.0040.3740.0240.012
* ND-non-detectable
Sediment Metal Concentrations (mg/kg)
SitesBaCdCoCrCuMnNiPbZnAlFe
L111.720.081.2544.590.4233.89177.420.4017.2111693.33872.10
L29.640.060.347.201.1824.368.360.7712.1013393.51955.43
L313.320.020.7512.413.7194.959.301.9027.6624970.372223.76
L420.540.020.8620.402.69171.3813.771.4337.2640923.433527.65
L520.610.161.0917.563.11169.8229.602.3636.563236.111018.99
L613.500.110.7513.002.50110.1717.711.3127.792460.24785.63
L712.720.170.0812.051.25112.0117.662.4030.622483.39738.79
L813.880.000.6311.231.0382.4911.163.5326.022303.78798.72
Max20.610.171.2544.593.71171.38177.423.5337.2640923.433527.65
Min9.640.000.087.200.4224.368.360.4012.102303.78738.79
Average14.490.080.7217.311.9999.8835.621.7626.9012683.021365.13
Range10.970.161.1737.393.29147.02169.063.1425.1638619.652788.86
St. Dev3.980.100.4011.701.2054.3057.691.008.7013915.50999.53
Table 3. Comparison of heavy metal concentrations in the waters and sediments of Umm Al Quwain mangroves with standard limits and other similar studies.
Water (mg/L)BaCdCoCr CuMnNiPbZnAlFe
Dubai marine water [44]-0.003-0.0100.005--0.0100.0200.200-
Canada fisheries and aquatic life [45] -0.0002–0.0018-0.002–0.020.002–0.004--0.001–0.0070.0300.005–0.10.300
US EPA salt water [46]-0.04–0.009-0.05–1.10.003–0.005-0.008–0.0070.008–0.20.08–0.09--
India [43]-6.82-10.242.94--18.122.00--
Average this study 0.0170.0010.0080.0770.0090.0050.0100.0072.8730.0270.028
Hazard Quotient (HQ) 0.33 7.701.80 1.430.70143.650.140.09
Sediments (mg/kg)BaCdCoCr CuMnNiPbZnAlFe
Dubai Land [44]-5.00-250.00100.00700.00-200.00500.00--
US EPA Harbor sediments [48]-6.00-25–7525–50300–50020–5040–6090–200-1.7–2.5
UAE mangroves [32]-4.4910.5011.706.3195.2020.4126.1010.10--
Average this study 14.490.080.7217.311.9999.8835.621.7626.9012,683.021365.13
Hazard Quotient (HQ) 0.02 0.070.020.140.710.010.05 546.05