Article

Control of Nuisance Cyanobacteria in Drinking Water Resources Using Alternative Algae-Blocking Mats

1
Department of Environmental Science, Hanyang University, Seoul 04763, Korea
2
ECOSTAR Ltd., 265 Jungdae-ro, Songpa-gu, Seoul 05660, Korea
3
National Institute of Environmental Research, Incheon 22689, Korea
4
Department of Life Science and Research Institute for Natural Sciences, Hanyang University, Seoul 04763, Korea
*
Author to whom correspondence should be addressed.
Water 2020, 12(6), 1576; https://doi.org/10.3390/w12061576
Submission received: 17 March 2020 / Revised: 24 May 2020 / Accepted: 29 May 2020 / Published: 31 May 2020
(This article belongs to the Special Issue Water Microbial Contamination and Bioremediation)

Abstract

:
The water intake facility of Paldangho Lake (PIF), constructed in 1988, supplies drinking water to the Seoul metropolitan area and satellite city (ca. 20 million inhabitants) in South Korea. A nuisance cyanobacterial bloom (CB) has been observed every year in the PIF. Thus, related governments have been funding the control of CBs and algal-originated materials (AOMs). In this study, an algae-blocking mat (ABM) was developed to protect against CBs and AOMs considering temperature and water depth. We evaluated the daily and monthly performance of the ABM on phytoplankton, pH, dissolved oxygen, chlorophyll-a, and light intensity between April and October 2015. Although the average cell abundance of cyanobacteria between July and September approached the warning level of the Korea alert system, the highest algal removal efficiency was recorded as 92% in August when the cyanobacterial cells were over 66,000 cells/mL. On average, the ABM showed a low removal efficiency of 26% on both geosmin and 2-methylisoborneol, whereas total phytoplankton was more than 30%. In conclusion, our results indicate that the ABM may be an economical blocking tool for nuisance cyanobacteria in drinking water resources, considering AOMs and total phytoplankton.

1. Introduction

Cyanobacterial blooms are becoming more globally prevalent due to industrialization, population growth, and global warming [1,2,3,4]. For example, in 2011, a cyanobacteria bloom occurred in Lake Erie, one of the Great Lakes in North America, due to an excessive influx of phosphorous [5], and a massive bloom of the cyanobacterium Microcystis that occurred in Lake Taihu, a large lake in China, leading to the prohibition of the use of lake water as drinking water [3]. In August 2014, tap water supplies was suspended in Toledo, Ohio, USA, due to cyanobacteria poisoning [6].
South Korea has been witnessed a similar situation. Eutrophication is rapidly spreading in many rivers and lakes, of which 72% are mesotrophic and 22% are eutrophic, with cyanobacteria blooms occurring from summer to winter [7]. Paldangho Lake, which is a major raw water source for over 20 million residents in Seoul and Gyeonggi, is also experiencing rapid eutrophication and resulting frequent cyanobacterial blooms due to its large drainage area and a constant inflow of domestic sewage, agricultural effluent, and livestock wastewater [8].
Harmful algal blooms such as cyanobacterium Microcystis in untreated drinking water interfere with the purification process in water treatment plants by producing toxins and algae-related odor, leading to economic loss and adverse health effects [9]. Various methods have been developed to eliminate these algae. The long-term use of algaecide, which is fast-acting over short time periods, risks damaging the entire aquatic ecosystem as it is retained in water and soil [10,11,12]. Among the relatively simple physical methods with few side effects, one key strategy is to install a mat in the water called a water-blocking mat to trap cyanobacterial blooms and contaminants in the stagnant water and preventing them from spreading, directly blocking cyanobacteria and contaminants in the raw water that enter the water treatment plant, and using upstream water to dilute high-density cyanobacteria and contaminants [13].
Asaeda and colleagues [14,15] reported the important effects of using a water-blocking mat. Two vertical water-blocking mats were installed on the surface water layer near the Terauchi dam in Japan to block surface water inflow to the reservoir from upstream, which contained a high nutrient concentration, thereby preventing the formation of cyanobacteria blooms. The water-blocking mats installed at the dam blocked the direct influx of nutrients to the downstream reservoir and created stagnant water in the upstream portion of the reservoir. This led to the consumption of nutrients by a large number of phytoplankton, which blocked nutrient transfer to the downstream reservoir, thereby reducing the occurrence of cyanobacterial blooms.
However, fixed blocking mats have several drawbacks, such as damage and loss caused by storms, heavy rain, and rapid corrosion; decreased flexibility of the metal components supporting the blocking mat; and difficulty in applying a simple or filtering mat due to fouling by algae and contaminants [14,16].
In this study, to effectively block phytoplankton biomass and nuisance cyanobacteria from the reservoir used as a raw resource of drinking water, we installed a multi-functional algae-blocking mat (ABM) considering the appearance and migration characteristics of the cyanobacteria inside the reservoir, and its effects were evaluated. The ABM, which is a combination of a simple blocking mat (SBM) and an algal filtering mat (AFM), was first built and installed in South Korea. An optimal operation strategy for the ABM is presented based on its effectiveness in removing phytoplankton, including cyanobacterial blooms and algae-related odor and taste compounds.

2. Materials and Methods

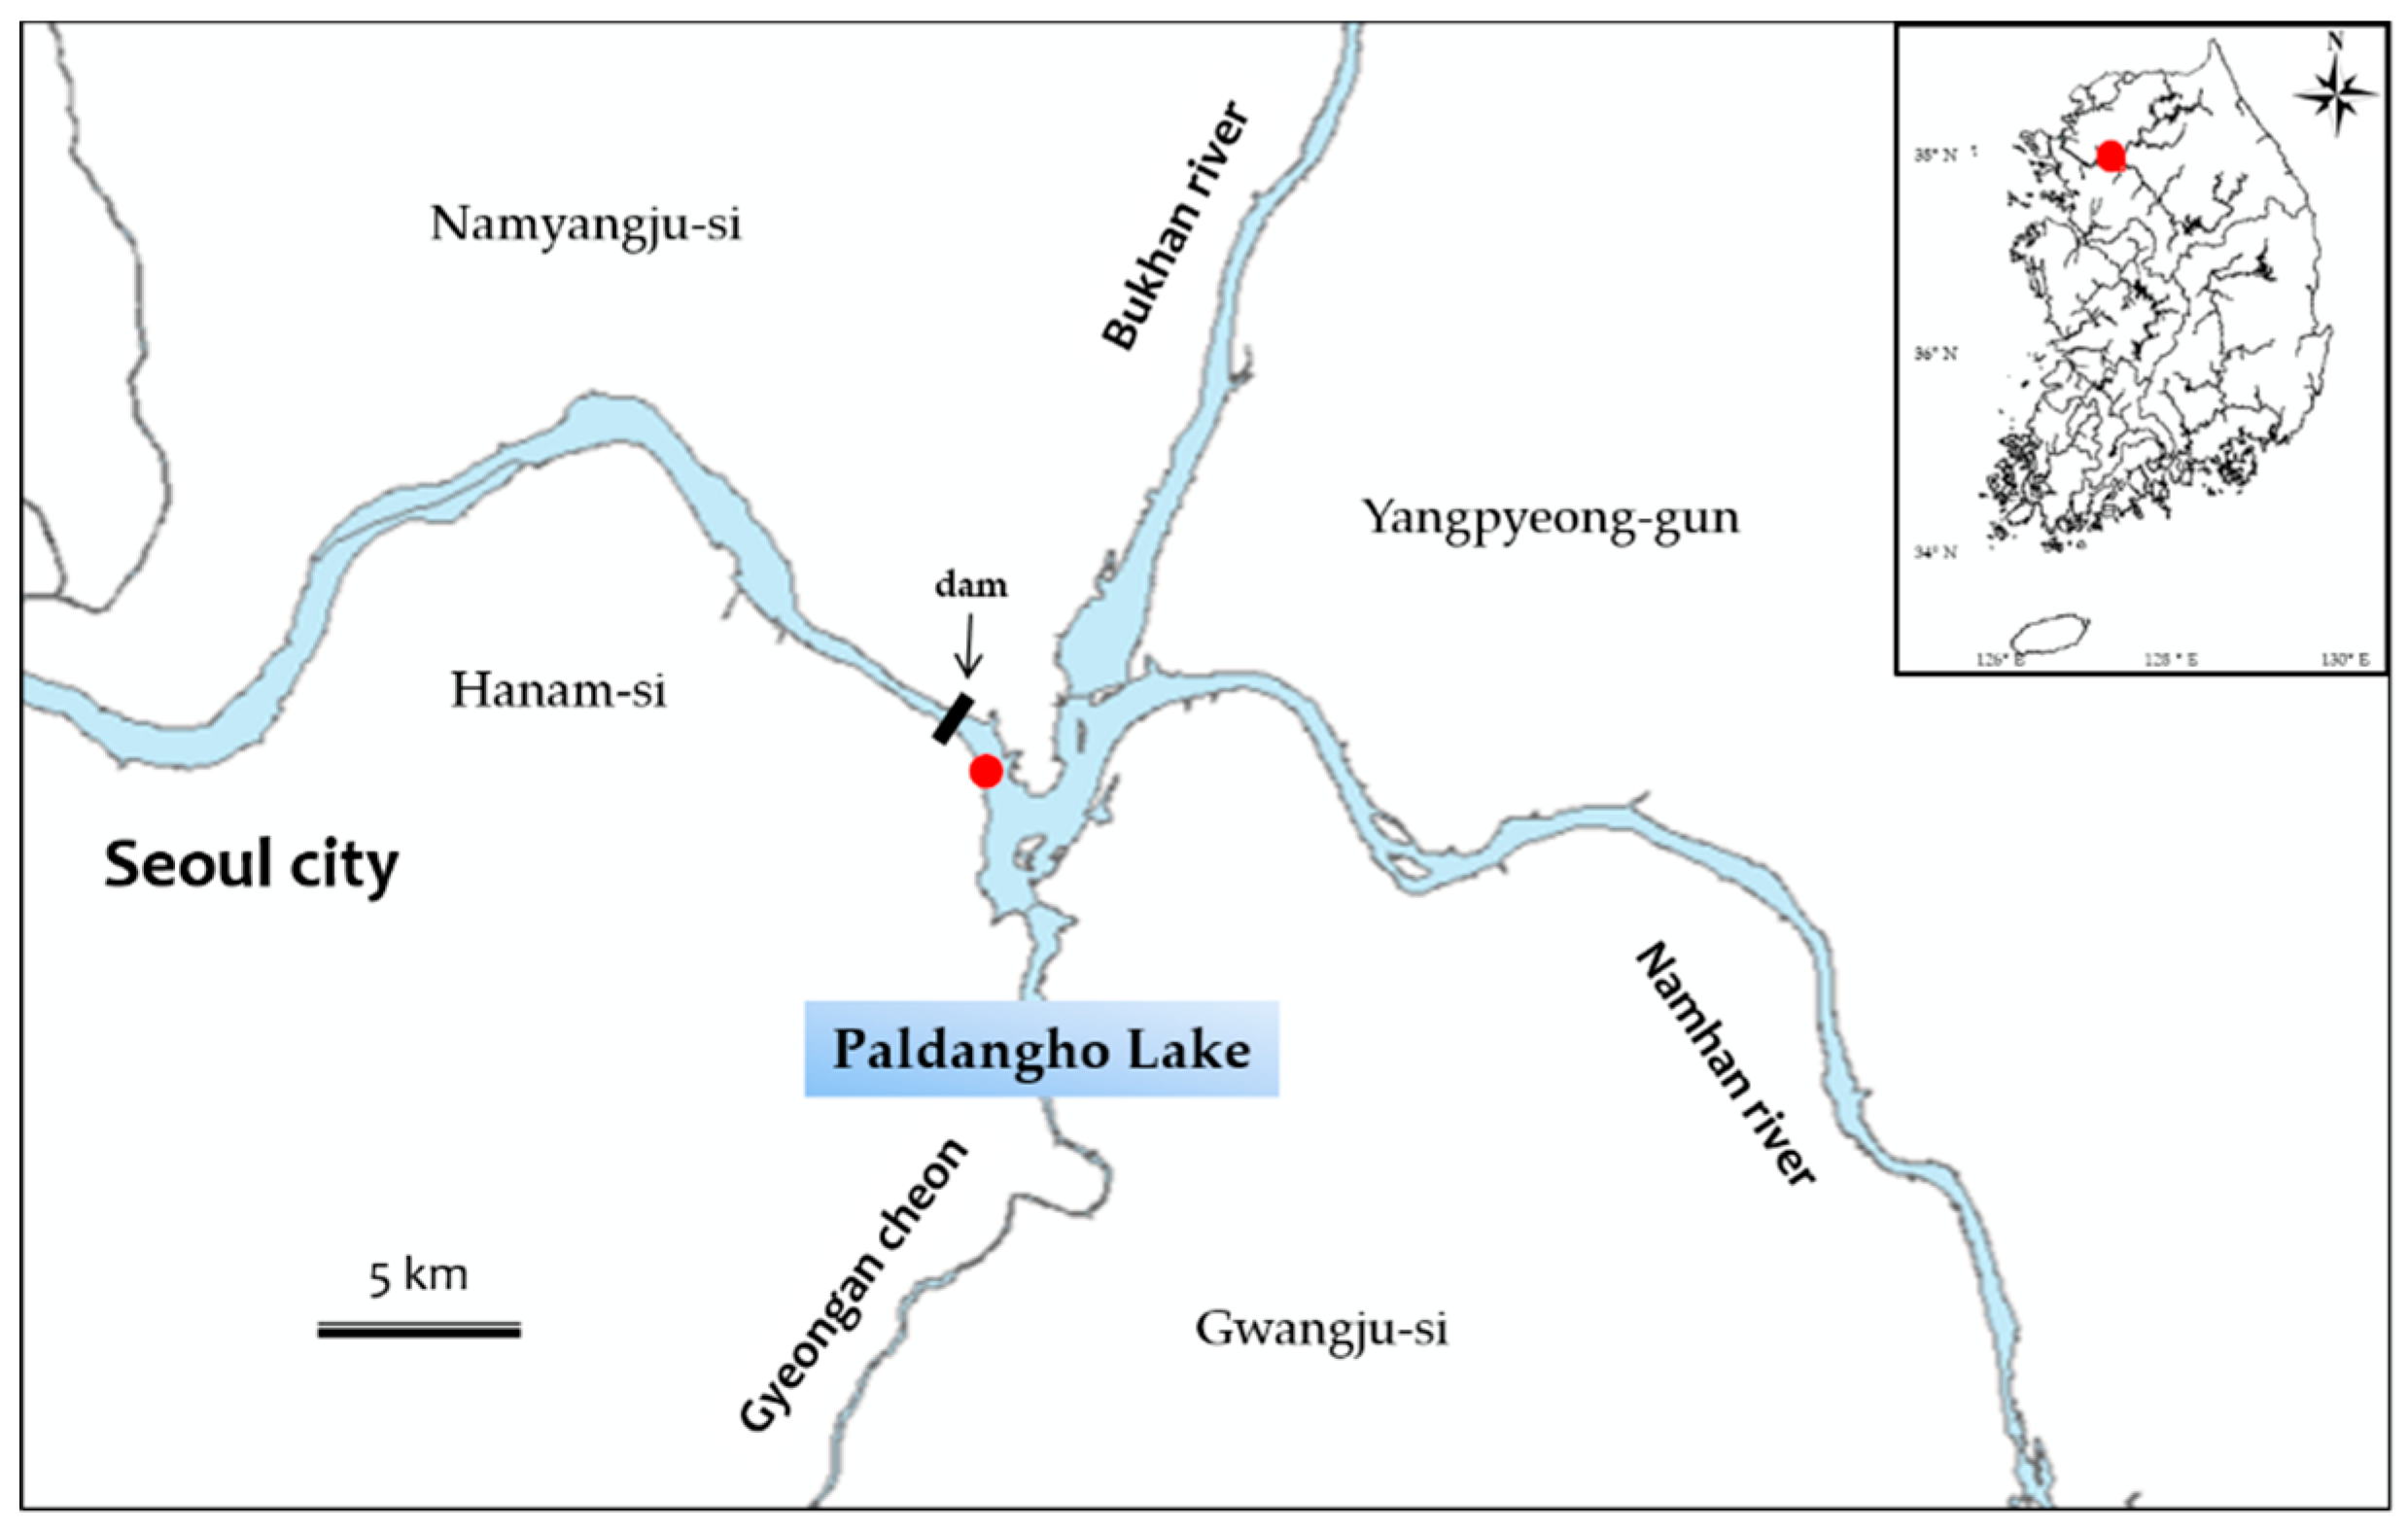
2.1. Description of the Test Site

Paldangho Lake is located on the Han River where the Bukhan River, Namhan River, and Gyeongancheon converge. The lake supplies water to Seoul, Gyeonggi, and Incheon. There are three water intake systems installed in the Paldangho Lake (Figure 1). The one selected for this study was built in 1988 and supplies approximately 1.5 million tons of water daily to 21 water purification plants. A high flow rate occurs near the intake structure due to the short retention time (6.5 days) within Paldangho Lake [17]. Particles concentrate in the area near the intake structure during rainfall events due to the influx of nonpoint pollution sources. Cyanobacterial blooms frequently occur during periods of high water temperatures. A general silt protector was installed at the entrance of the intake structure, which was operated to prevent the access of algae and other particles. However, the alteration of the silt protector caused by the strong backpressure from the water intake and the turbid water generated by the disturbance of the sediment layer complicates the water intake process.

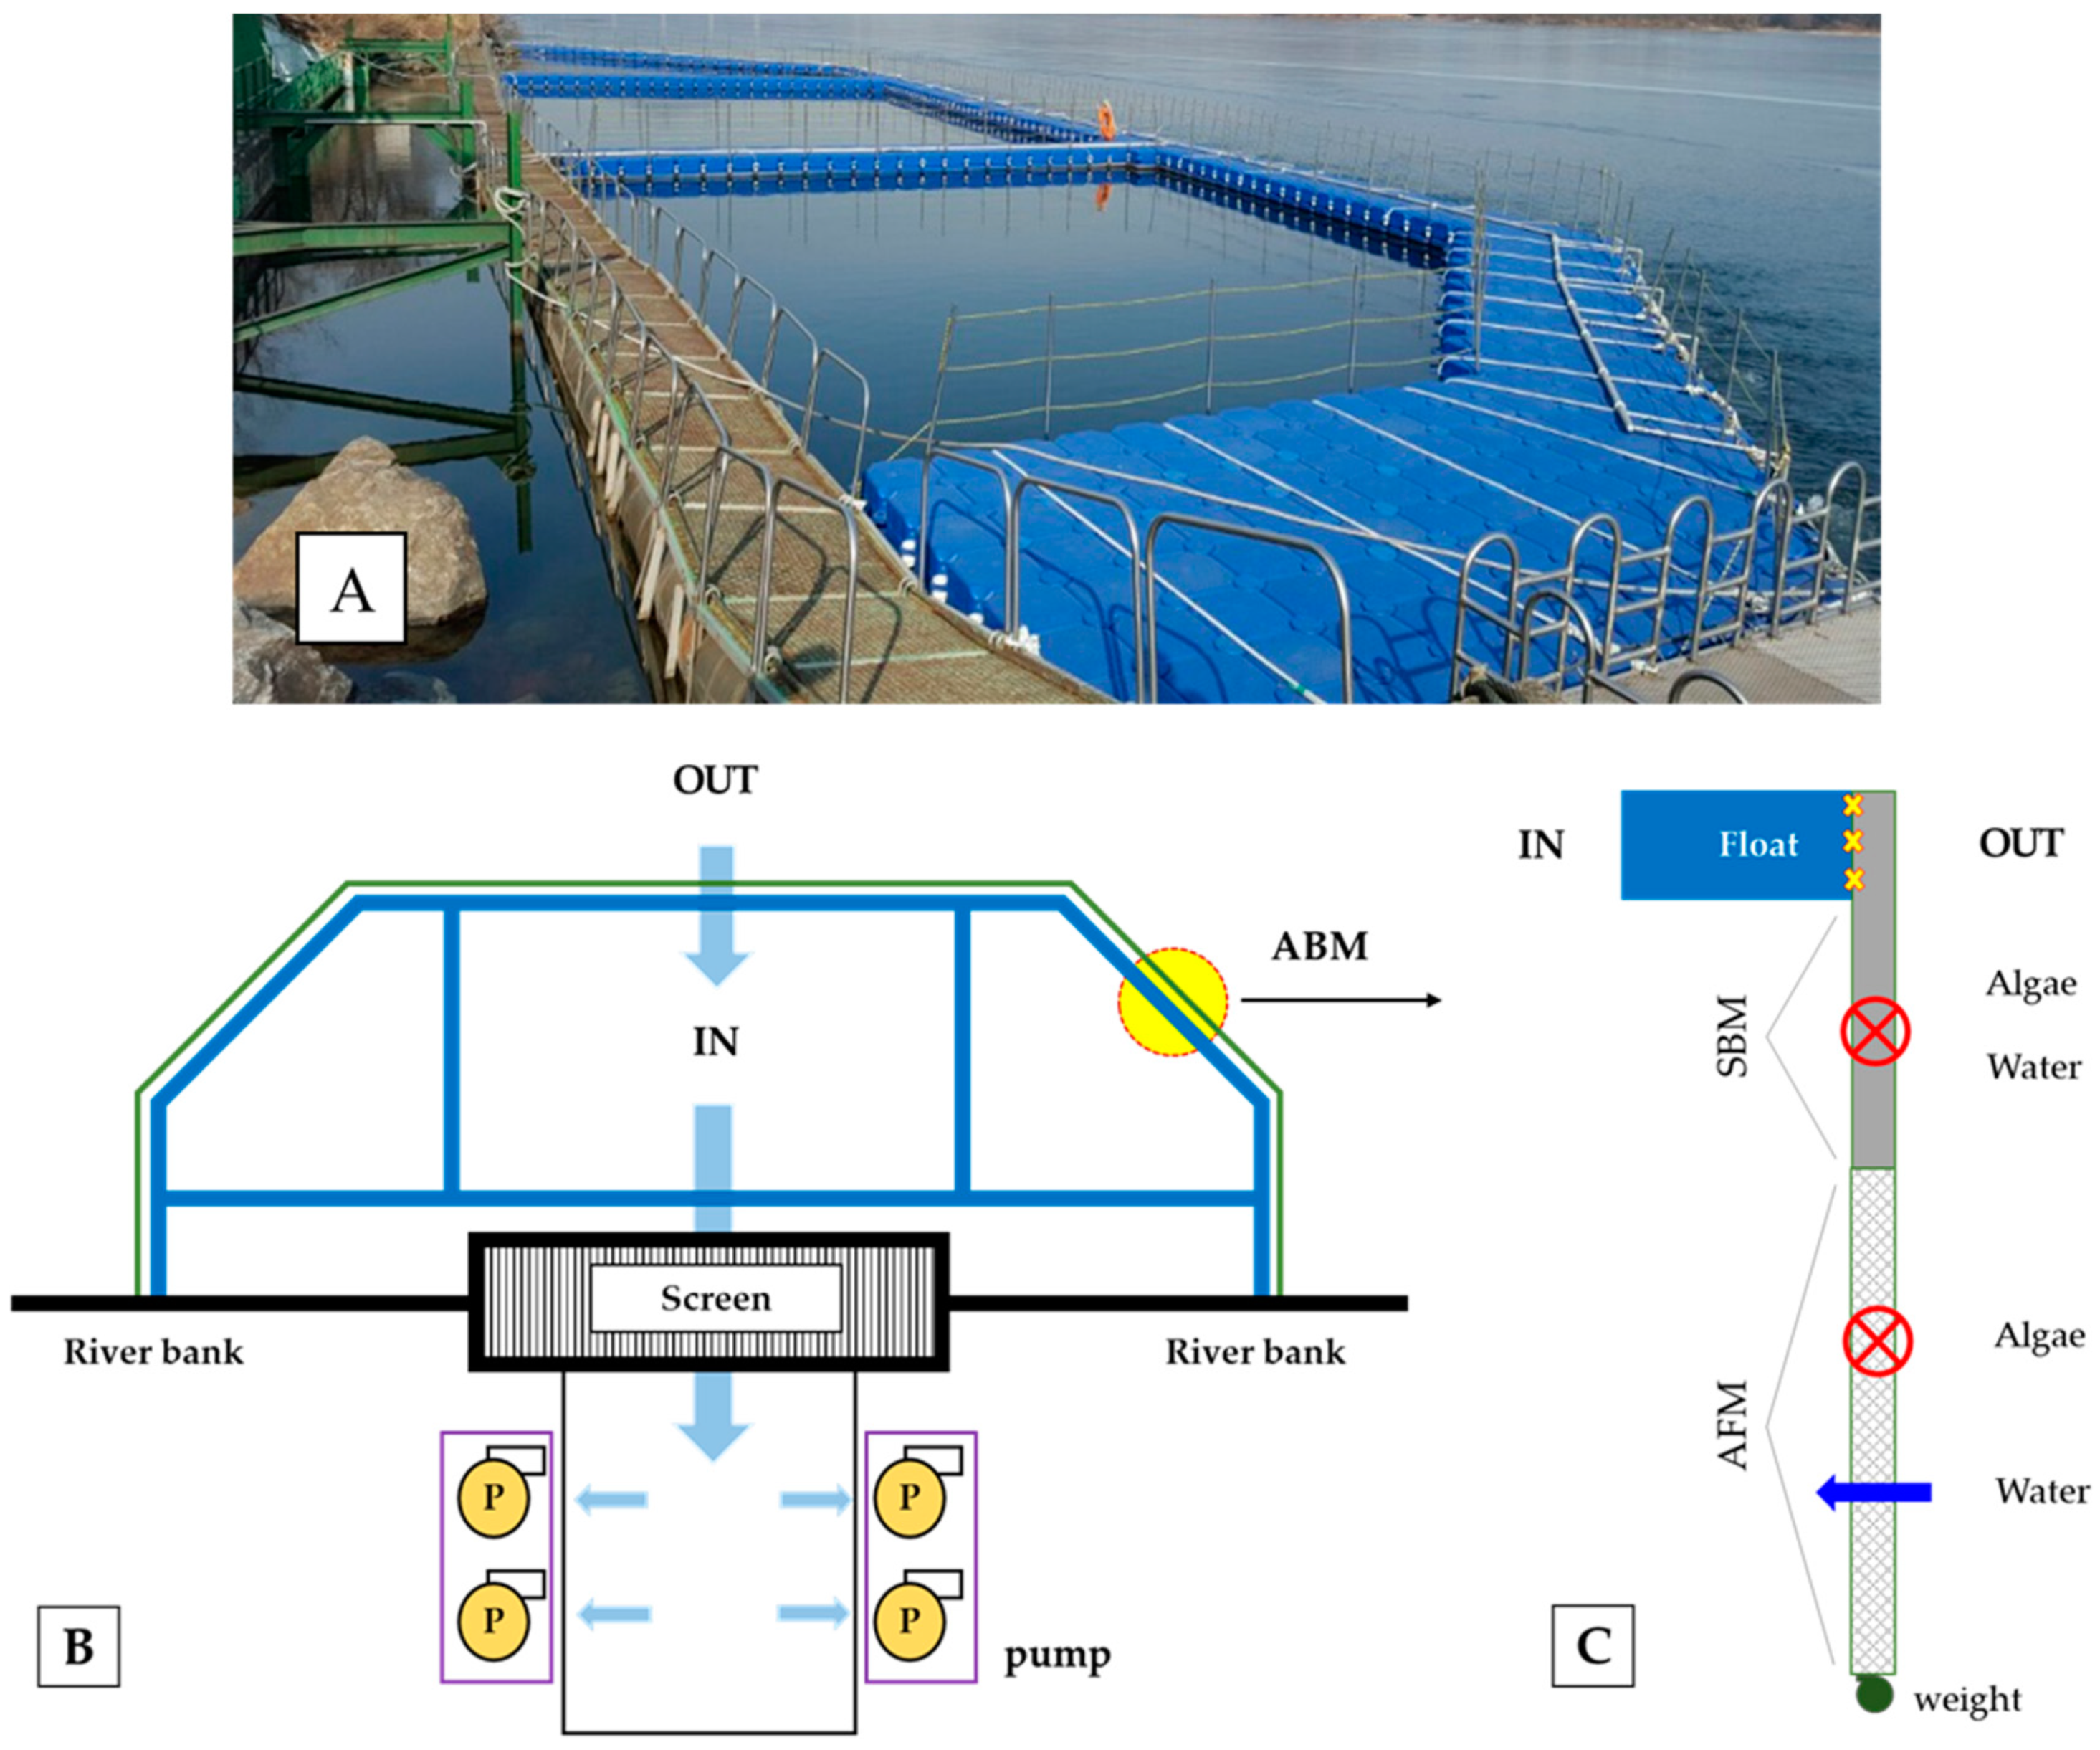
2.2. Experimental Design

The multi-functional ABM is a floating structure with a trapezoidal shape consisting of floats (plastic material, 100 × 100 × 70 cm) and an ABM (total length 100 m, width 1 m). It was installed parallel to the water flow in the reservoir and was fixed with anchors and wire ropes to maintain its shape (Figure 2A,B). A ring-shaped weight was attached to the lowermost side of the ABM to maintain the shape of the blocking mat under backpressure (Figure 2C).
The top side of the ABM (upper ~2 m) that was placed in the layer of water where harmful algal blooms and other particles concentrate during high water temperatures consisted of a simple blocking mat (SBM) that can block small particulate matter (<9 μm). The bottom side of the ABM (lower 3 m) was placed in the layer of water where backpressure is strong during the water intake process. The permeable algal filtering mat (AFM, pores ≤ 100 μm, porosity: 92%, thickness: 2 cm) has a strong resistance to physical deformation. The SBM and AFM were vertically connected (Table 1) and rinsed with strong water pressure using field water to remove suspended solids or periphyton development during the study.
The on-site experiment was conducted in two stages. Daily monitoring included the measuring of the algal removal efficiency (ARE) of the mat according to the dominant species of phytoplankton in each season (water temperature) and analyzing the effects of the mat on the vertical distribution of cyanobacteria at high water temperatures. Bimonthly monitoring was conducted between April and October 2015. Basic environmental factors, such as water temperature, dissolved oxygen, conductivity, turbidity, and pH, were directly measured inside (IN) and outside (OUT) the ABM at each water depth (1, 2, 3, 5, and 7 m) using multiparameter water quality monitoring devices (YSI-6600-V2; YSI Inc., Yellow Springs, OH, USA). Phytoplankton and chlorophyll-a were analyzed in the laboratory after water was collected at each depth using a van Dorn sampler (3-1130-G42, Wildco, Yulee, USA). Daily monitoring was conducted when the cell abundance of cyanobacteria was high (2:00 and 8:00 p.m. on 24 August, and 8:00 a.m. on 25 August) and analyzed in the same way as monthly monitoring.

2.3. Sample Analysis

2.3.1. Phytoplankton Analysis

To measure the phytoplankton density, water samples were collected at each depth, fixed with 1% Lugol’s solution, and transferred to the laboratory. After precipitation of samples in the laboratory, the phytoplankton were identified and their abundance (cells/mL) was enumerated using a Sedgwick–Rafter chamber under an inverted microscope (Olympus CKX41, Olympus, Tokyo, Japan). For determination of the cell density of colonial Microcystis aeruginosa, samples were fixed with Lugol’s solution, dissociated by ultrasonic disintegration (20 kHz, 60 s), and counted directly under an inverted microscope at 400× magnification [18].
To measure the concentration of chlorophyll-a (Chl-a), water samples collected at each depth were transferred to the laboratory under dark and refrigerated conditions. Then, 100–200 mL of the samples was filtered using Glass Microfiber filters (GF/C) (Whatman™, GE Healthcare Life Science, Amersham, UK) and extracted using 90% acetone for 24 h at 4 °C under dark and refrigerated conditions. After 20 min of centrifugation (Labogene 1248R, Hanil SME, Anyang, Korea), the optical density of the supernatant was measured using a spectrophotometer (Optizen POP, Mecasys, Daejeon, Korea) at 750, 663, 645, and 630 nm, and the concentration of Chl-a was calculated [19]. ARE was calculated using Chl-a and the cell abundance of phytoplankton inside (IN) and outside (OUT) the structure:
ARE   ( % ) = ( 1 IN / OUT ) × 100
where IN is the ABM filtrate and OUT is the water outside the ABM.

2.3.2. Algae-Related Odor Analysis

Five milliliters each of dichloromethane, methanol, and distilled water were added to a solid phase extraction (SPE) column. After activating the column with sequential injection and pressurization, 500 mL of the sample was added at a flow rate of 20 mL/min, and water was eliminated using an anhydrous sodium sulfate column. The sample was concentrated down to 500 mL using an organic solvent concentration evaporator (Turbo-Vap II, Biotage, Uppsala, Sweden) and analyzed by GC/MS (experimental procedure for the monitoring of drinking water, No. 2, SPE).

2.3.3. Photometry

To measure the light blocking rate of particles inside and outside the ABM and the amount of light in the surface layer when the cyanobacteria and diatoms were at a high density, the intensity of light was measured in 30 min intervals using a hydrophotometer (HOBO Pendant® Temperature/Light Data Logger, Onset Computer Corporation, Bourne, MA, USA). Due to the interference caused by the ABM structure, the mean value of five measurements obtained when the solar altitude was nearly vertical (11:30 a.m.–1:30 p.m.) was used.

3. Results and Discussion

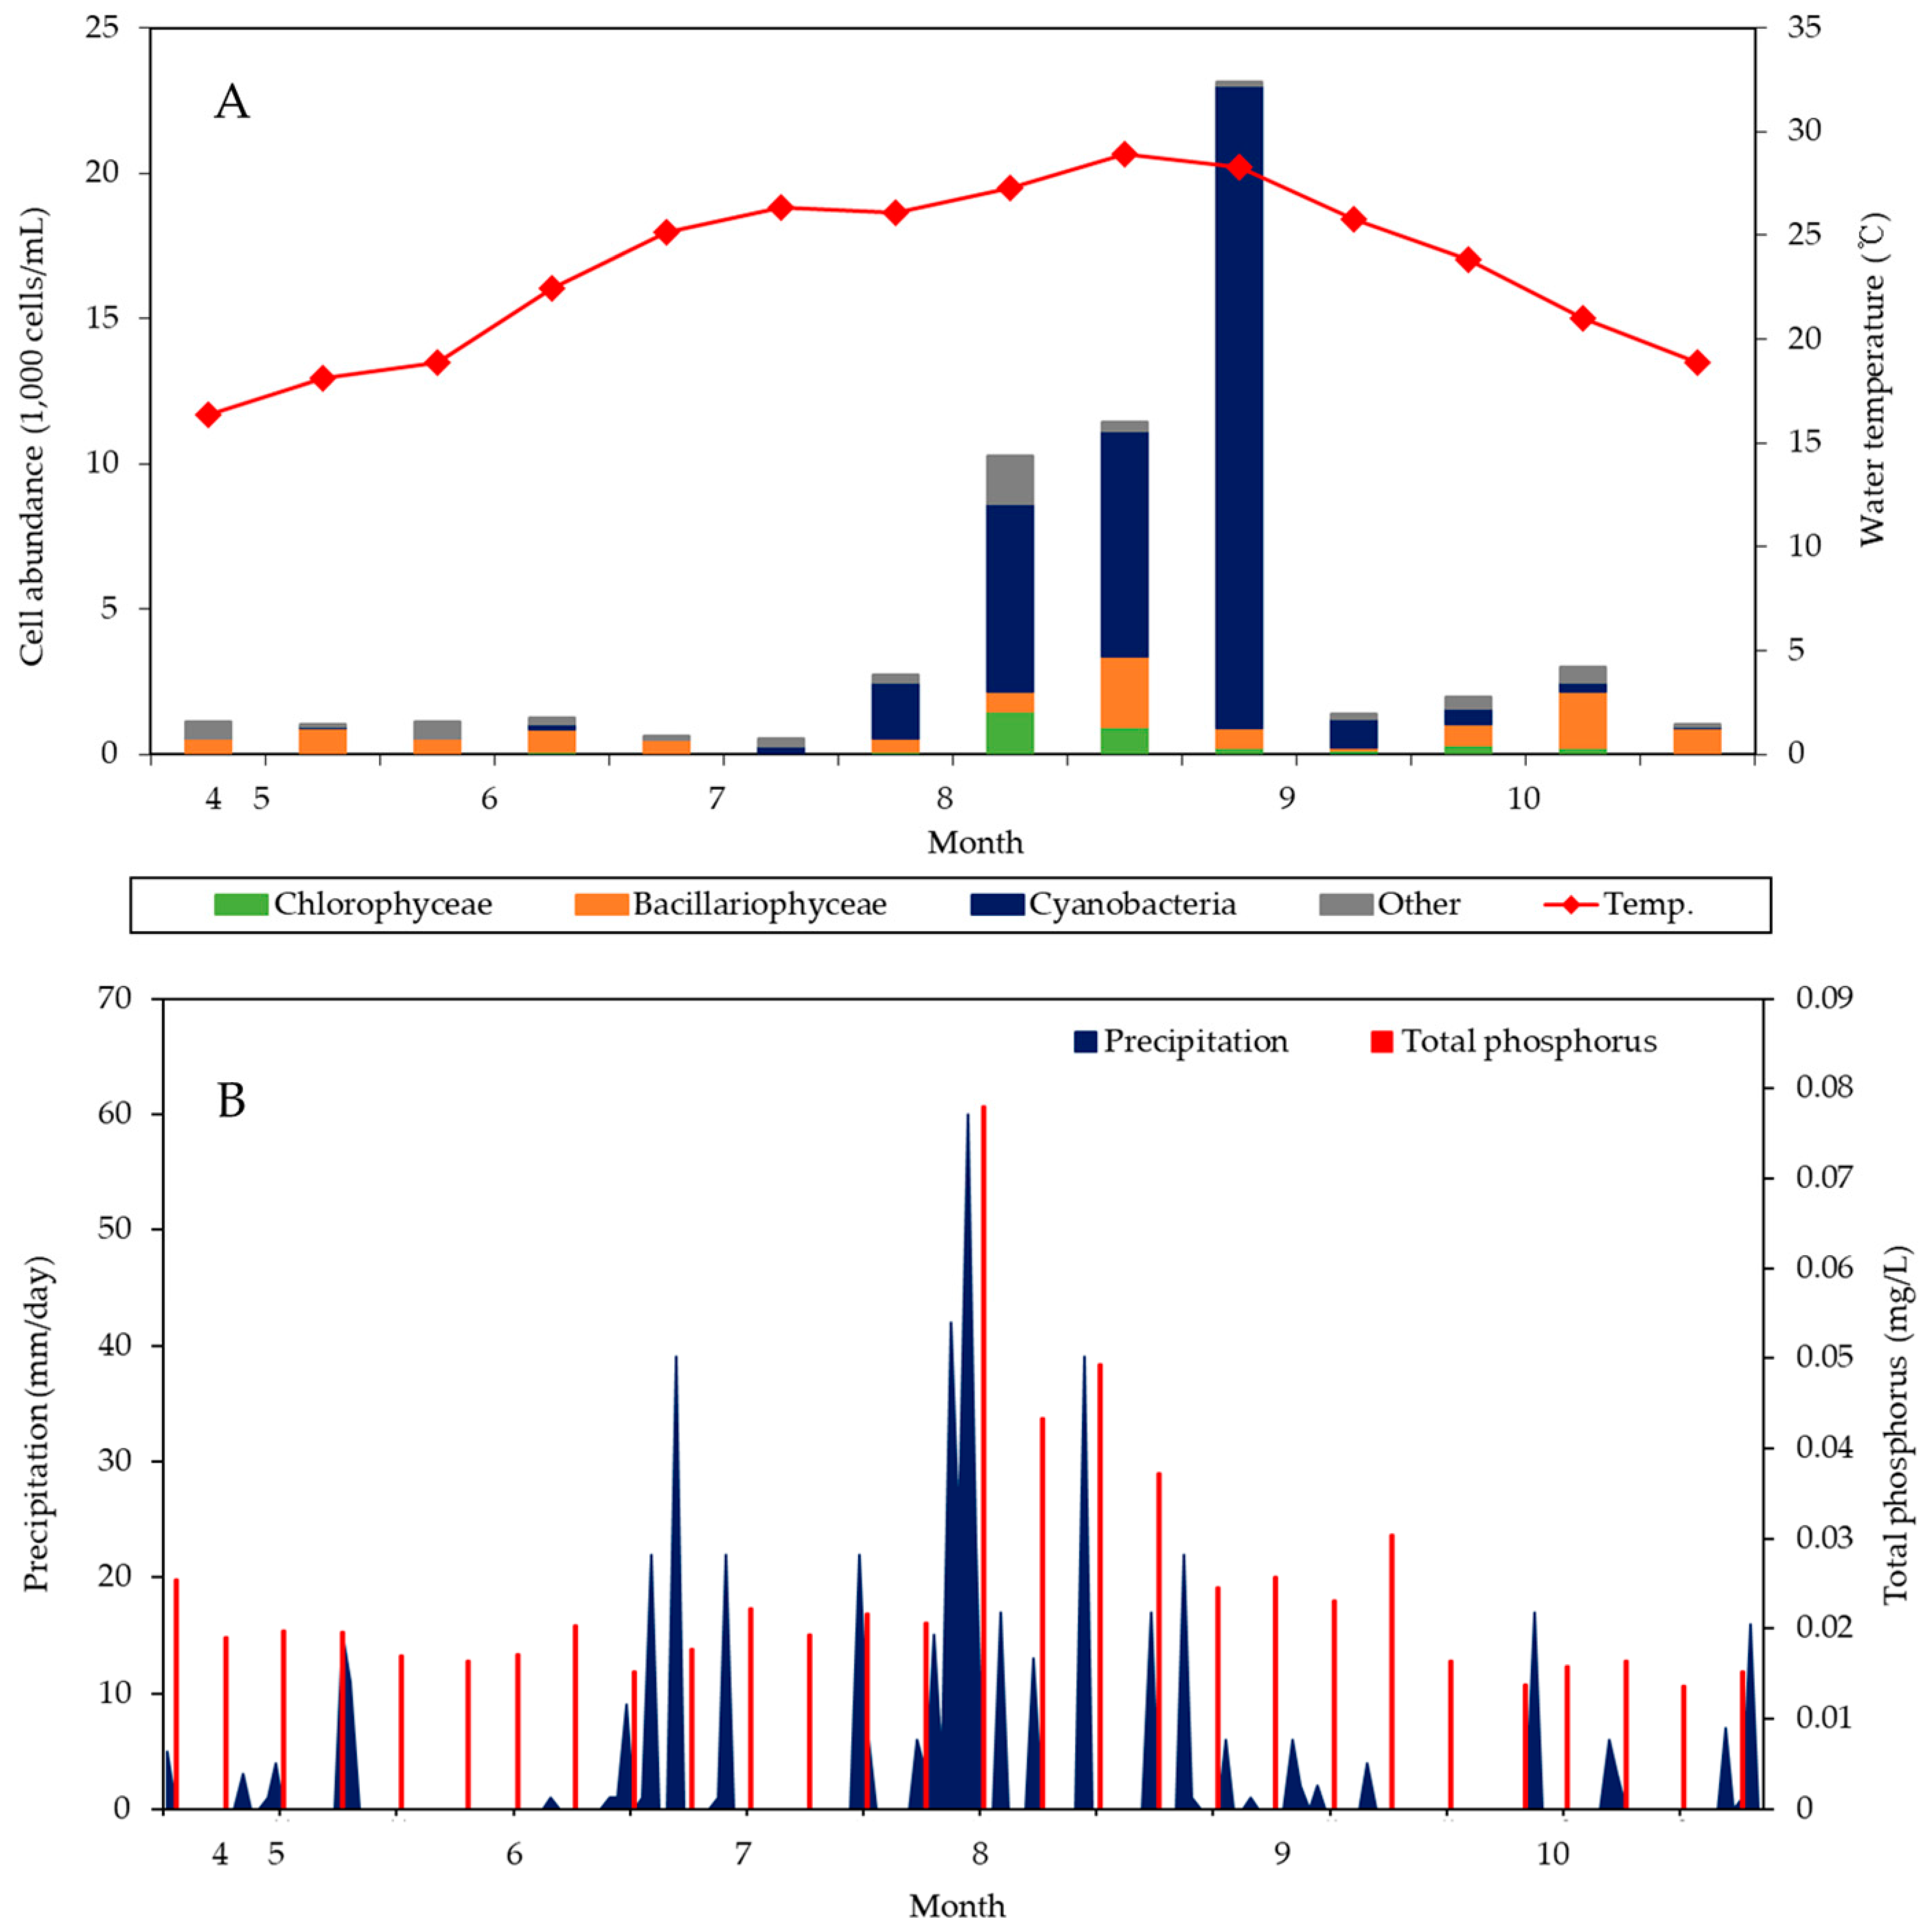
3.1. Fluctuation of Phytoplankton Cell Abundance in the Raw Water Source

The fluctuations in the cell abundance and dominant species of phytoplankton in the second water intake structure of Paldangho Lake (PIF) caused by changes in water temperature and precipitation during the study period are illustrated in Figure 3 and Table 2. The cell abundance of phytoplankton before 7 July was below 1500 cells/mL, and the diatom species Cyclotella meneghiniana, Fragilaria crotonenesis, and Aulacoseira granulata were the most dominant. The cell abundance increased to 23,136 cells/mL between 21 July and 24 August when the water temperature was beyond 25 °C, while three cyanobacteria (Microcystis aeruginosa, Dolichospermum crassum, and Merismopedia tenuissima) became dominant with a relative abundance of over 90%. This increase was due to increased high water temperatures (Figure 3A) and total phosphorus concentration and rainfall in mid-August (Figure 3B). After September, the percentage of diatoms increased to 30%–80%, with a similar species composition as that in April–June, whereas the percentage of green algae and cyanobacteria decreased to below 30%. After September, the dominant species was Aulacoseira granulata, a diatom. Analyzing the fluctuation of phytoplankton in the water intake facility demonstrated that the growth of cyanobacteria increased exponentially in the presence of nutrients and under high water temperature conditions. A previous study showed that nuisance cyanobacteria can grow under high water temperatures [20]. Therefore, the use of a pretreatment system such as ABM during high temperature periods is exclusively required to prevent the inflow of nuisance cyanobacteria into water purification plants through water intake structures.

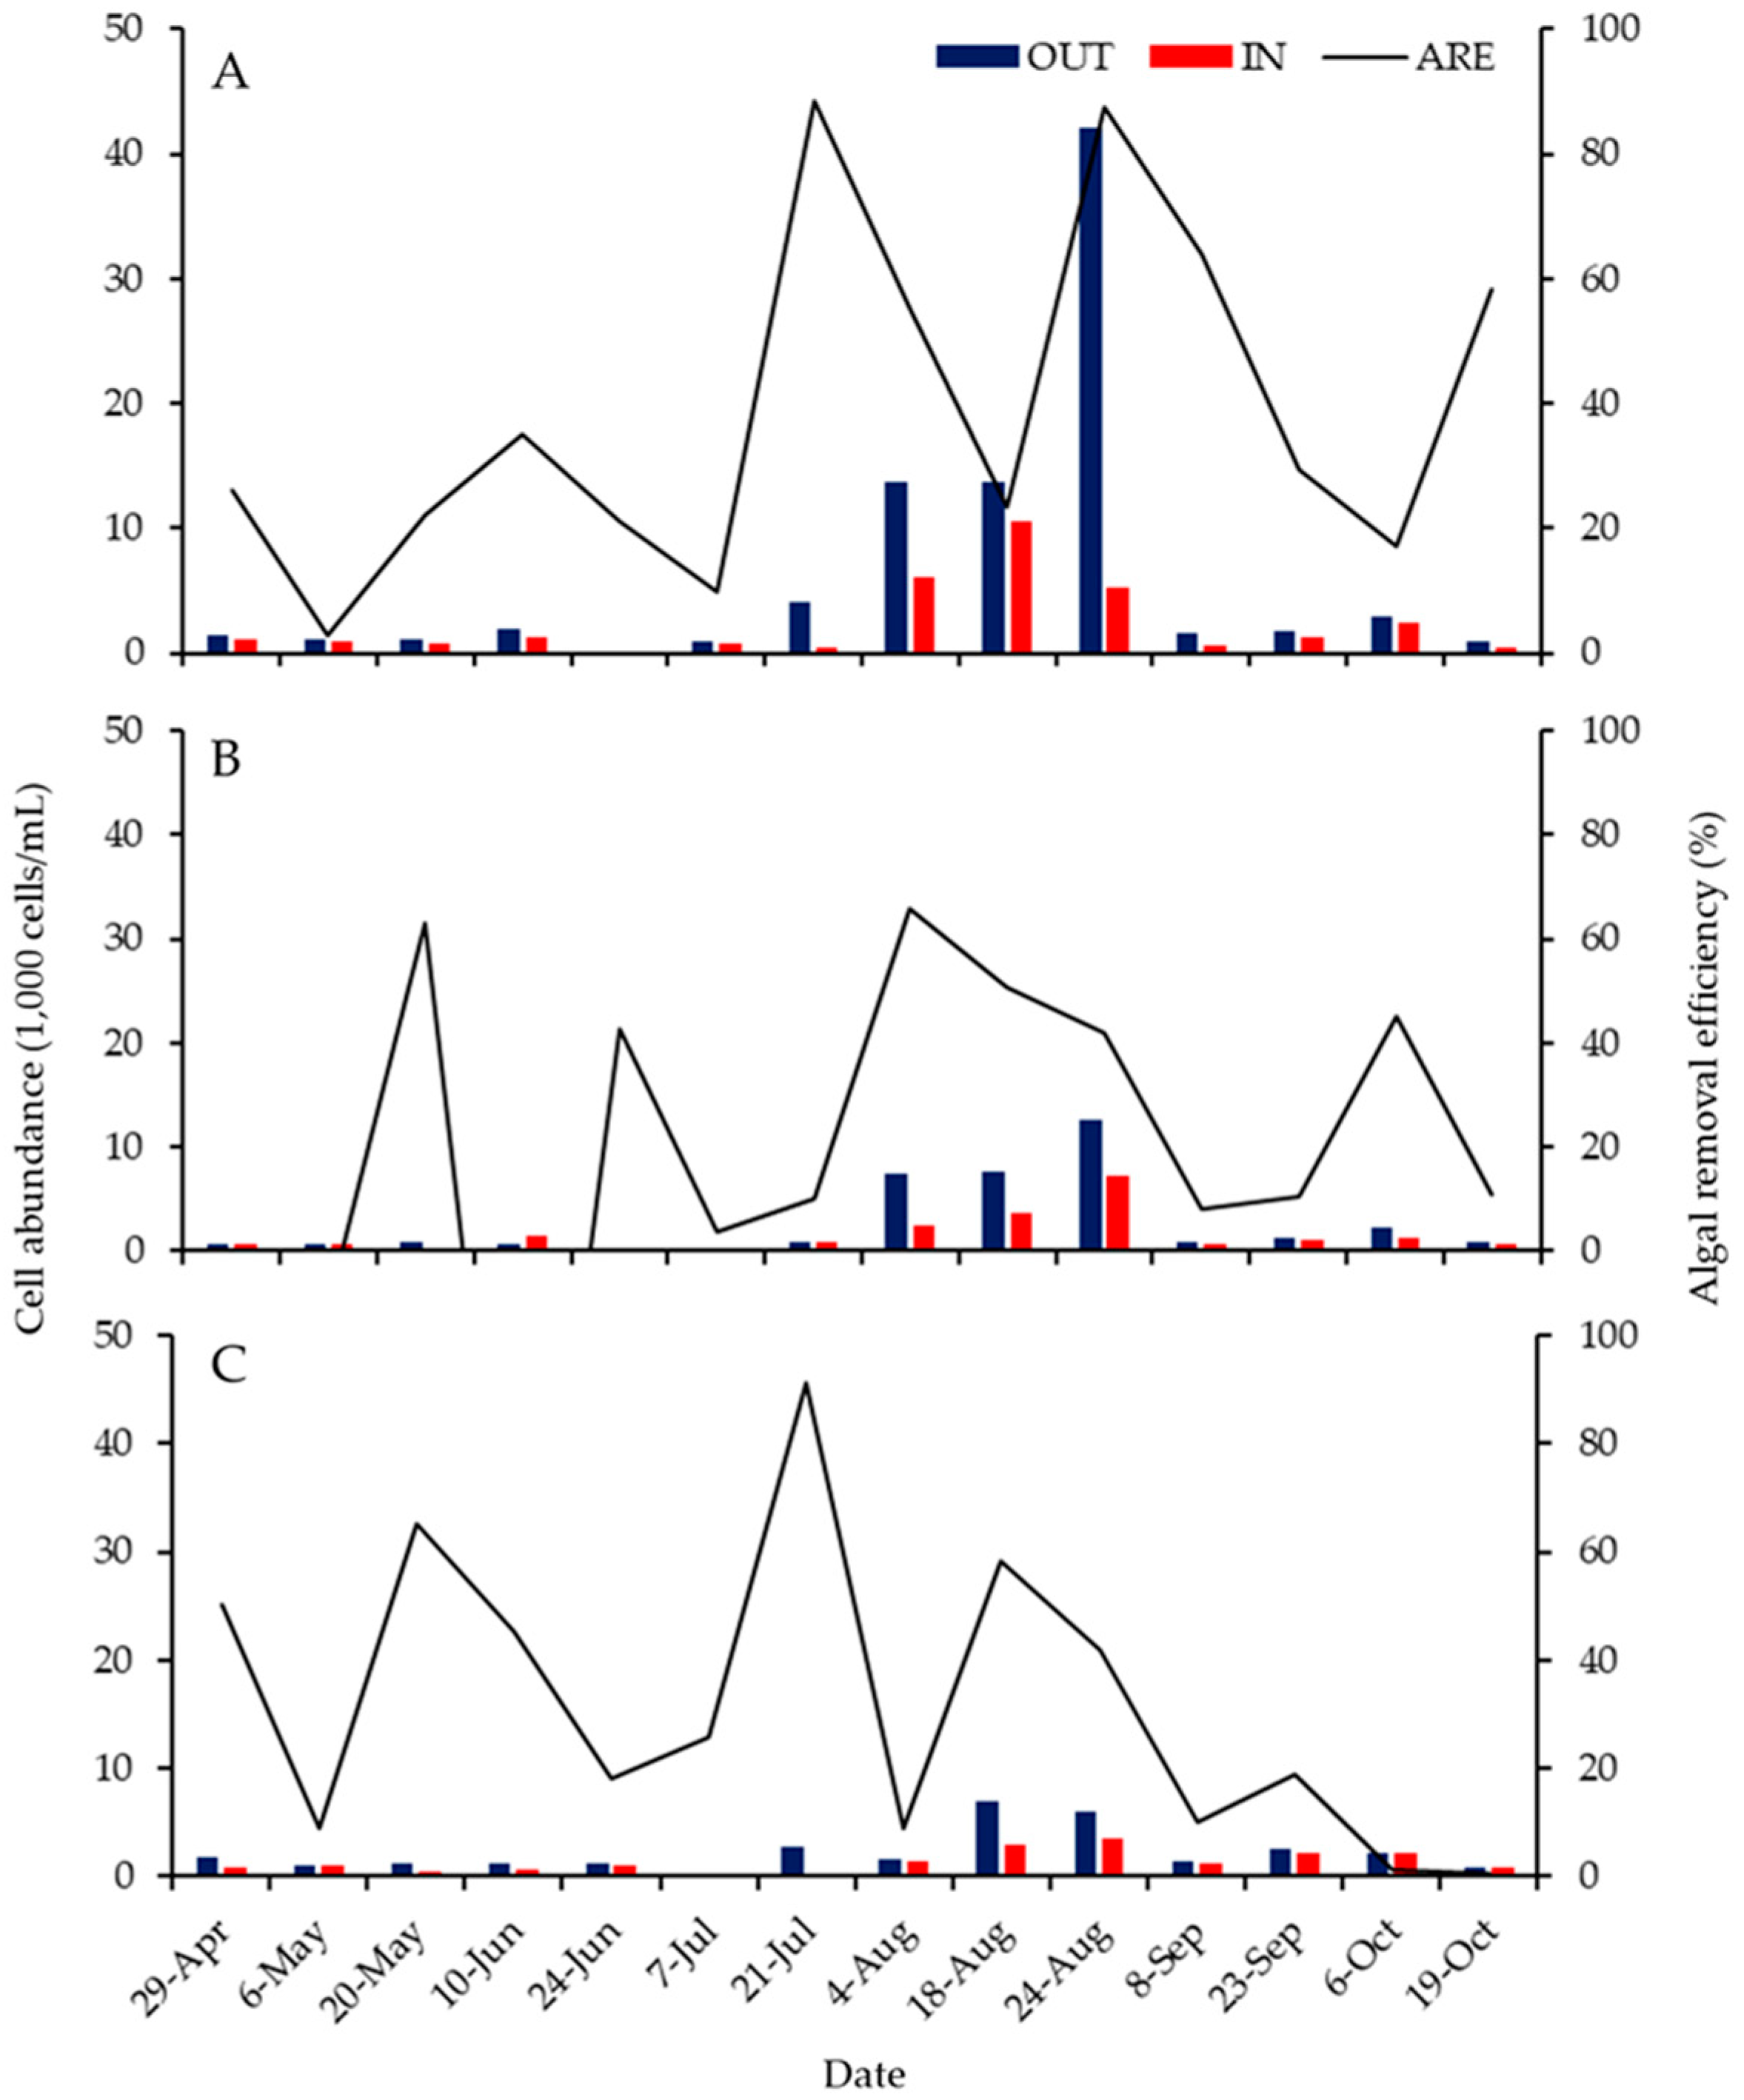
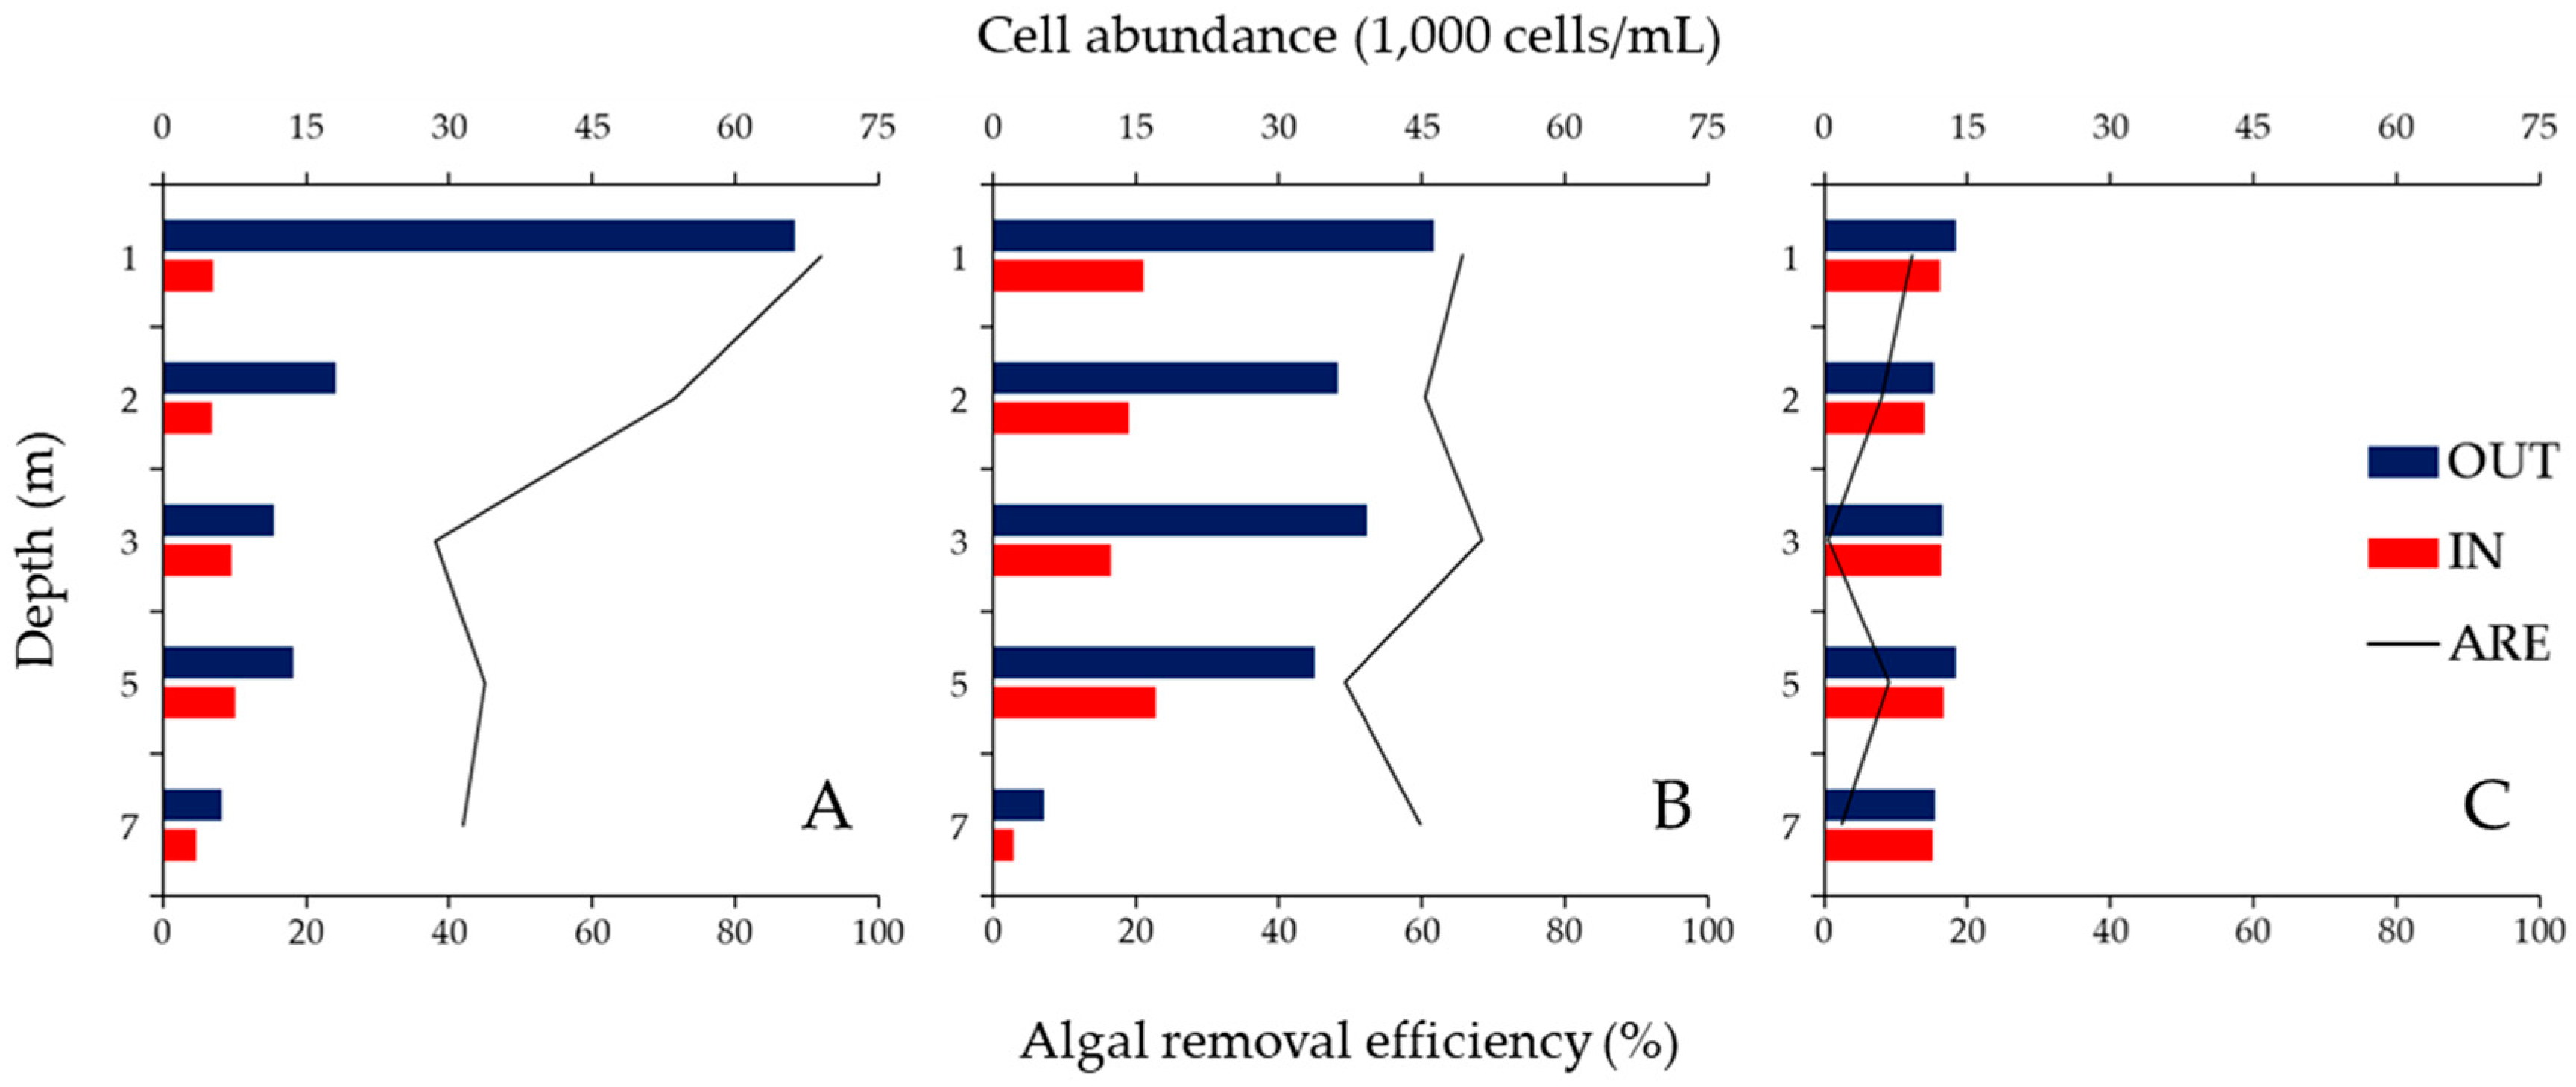
3.2. ARE of the ABM at Each Water Depth

For an in-depth analysis of the algal removal efficiency (ARE) of the ABM during the study period, the water level was divided into three layers: surface layer (0–2 m), middle layer (3–5 m), and deep layer (>5 m).
In the surface or SBM layer, the ABM removed approximately 38.7% of the total phytoplankton. The ARE of the ABM averaged as 63.8% in the high water temperatures over 25 °C when cyanobacteria density was high. As the cyanobacteria under high water temperatures were concentrated in the surface layer, the cell abundance that flows to the inside of the ABM was effectively reduced by the SBM, leading to a high ARE (Figure 4A). In the middle or AFM layer, the mean ARE of the ABM was 15% with a wide range of −98% to 65%. The negative value indicates higher phytoplankton density in the water of IN passing through the ABM compared with the reservoir. The mean ARE was 42.1% during high water temperature periods (Figure 4B). In contrast, in the bottom or no-ABM layer, the ARE averaged 31.7% with a wide range of 0%–91%, with an ARE of approximately 50% during high temperature periods (Figure 4C). As the bottom layer had a low density of total cyanobacteria, even during the high water temperature periods, the ARE was meaningless. These results indicated that the algal removal ability of the ABM is more effective for cyanobacteria concentrated in the surface layer during high temperature periods. In general, the use of algal blocking mats or fences is more effective for dense algal blooms like scum [16] or stagnant water with a long water residence time [21]. In this study, the simple blocking mat, corresponding to the surface layer, showed the highest ARE for high density cyanobacteria such as Microcystis aeruginosa.

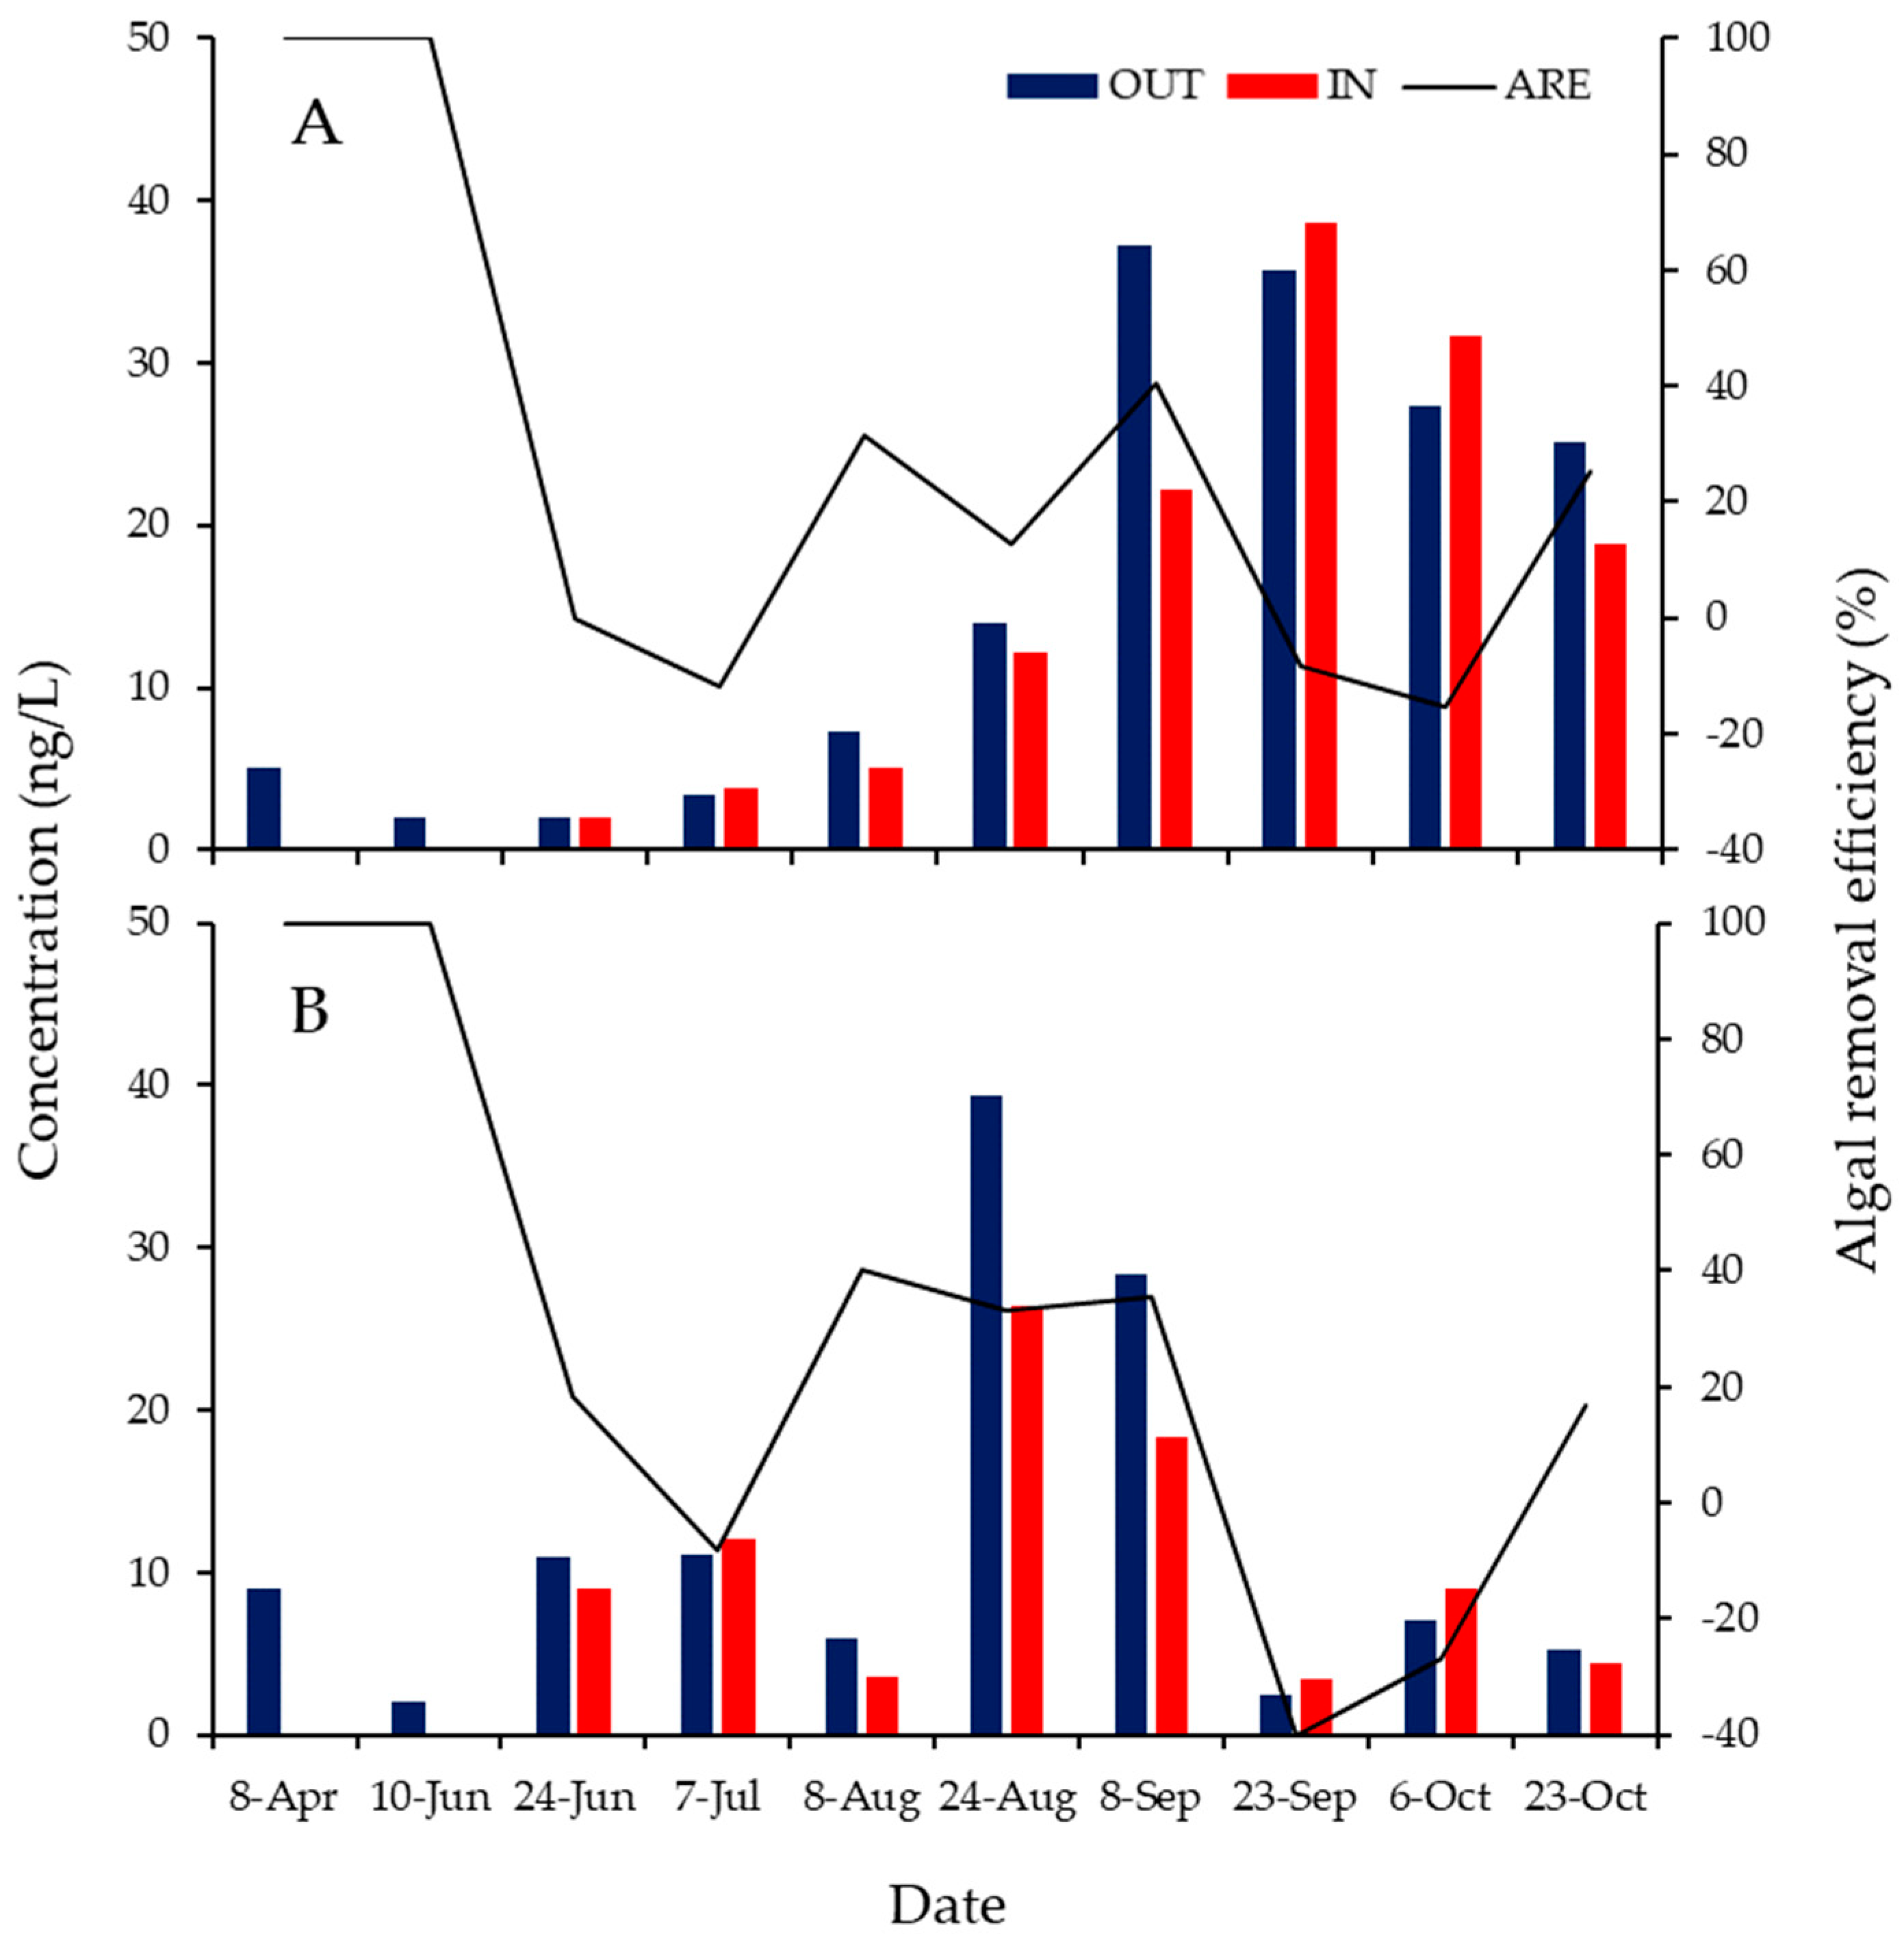
3.3. ABM Effects over Time

To monitor the daily fluctuation of phytoplankton and their removal by the ABM, sampling was conducted three times between 2:00 p.m. on 24 August and 8:00 a.m. on 25 August. In this study, the mean water temperature was 28.3 °C and the cyanobacterial dominance occupied over 90%. Among the phytoplankton in both the PIF and reservoir water during the study, cyanobacterium Microcystis aeruginosa was found to be the dominant species (Figure 5, Table 2).
At 2:00 p.m. on 24 August, the cell abundance of phytoplankton was 66,000 cells/mL in the surface layer, but they sharply decreased as the water deepened. The ARE of the ABM was the highest (92.0%) in the one meter layer, with an average of 57.7%, which gradually decreased with water depth (Figure 5A). At 20:00 on 24 August, the phytoplankton was over 45,000 cells/mL in the surface layer. In the layers below, unlike the results obtained at 2:00 p.m., the phytoplankton was maintained at over 30,000 cells/mL between two and five meters. The ARE was the highest (68.5%) in the three meter layer, with an average of 60.8%, but there were no large differences among water depths (Figure 5B). At 8:00 a.m. on 25 August, the cell abundance of phytoplankton at all water depths was below 15,000 cells/mL. The ARE was the highest (12.3%) in the one meter layer, averaging 6.5% over all depths, showing a lower algal removal efficiency (Figure 5C). Such changes in ARE with daily fluctuations in phytoplankton biomass can be explained by the vertical migration of Microcystis [22]. In particular, cyanobacterium Microcystis aeruginosa can control their buoyancy with light; they rise to the surface layer for photosynthesis during the day and sink to the deeper layers at night due to the carbohydrates produced via photosynthesis [23,24].

3.4. Algae-Related Odor Removal Efficiency of the ABM

Concentration changes in the odor and taste compounds 2-methylisoborneol (2-MIB) and geosmin showed different tendencies over the study period. 2-MIB increased with increasing water temperatures, and was the highest on 8 September, then gradually decreasing after 23 September (Figure 6A). The odor and taste removal activities of the ABM were different from the algal removal efficiency; the 2-MIB concentration at the PIF site on 23 September and 6 October was slightly higher than those of the OUT reservoir. We could not explain why the 2-MIB increased in IN. Of the cyanobacteria, two other genera, Oscillatoria and Pseudanabaena, were more abundant than Microcystis aeruginosa in PIF on the same day. The cellular abundance of Pseudanabaena limnetica showed a similar pattern to the 2-MIB concentrations. Generally, the production of 2-MIB in the freshwater environment is characterized by aquatic organisms such as cyanobacteria and actinomycetes [25,26,27,28]. Further studies are needed to understand the species-specific contribution of cyanobacteria to MIB production.
The concentration of geosmin was highest on 24 August, rapidly decreasing after September (Figure 6B). The geosmin concentration showed a significant correlation (r = 0.70) with the biomasses of Microcystis aeruginosa and Dolichospermum crassum, which are cyanobacteria commonly found in the PIF [4]. The mean removal efficiency of the ABM against odor and taste compounds was 26%, and the highest occurred in September when the cyanobacteria were most prevalent. Although phytoplankton content in the ABM was 38% after September, the concentrations of odor and taste compounds in PIF were high, demonstrating poor removal efficiency. Therefore, both 2-MIB and geosmin need to be controlled between August and September when the water temperature rises and the concentrations of both these odor compounds are high. However, 2-MIB should also be controlled in September when the water temperature drops. To reduce the concentration of odor and taste compounds that are produced inside the structure even when the water temperature drops, ABMs need to be predominantly used when cyanobacteria appear, or a depth adjustment within the ABM is needed to stabilize the water flow inside the structure.

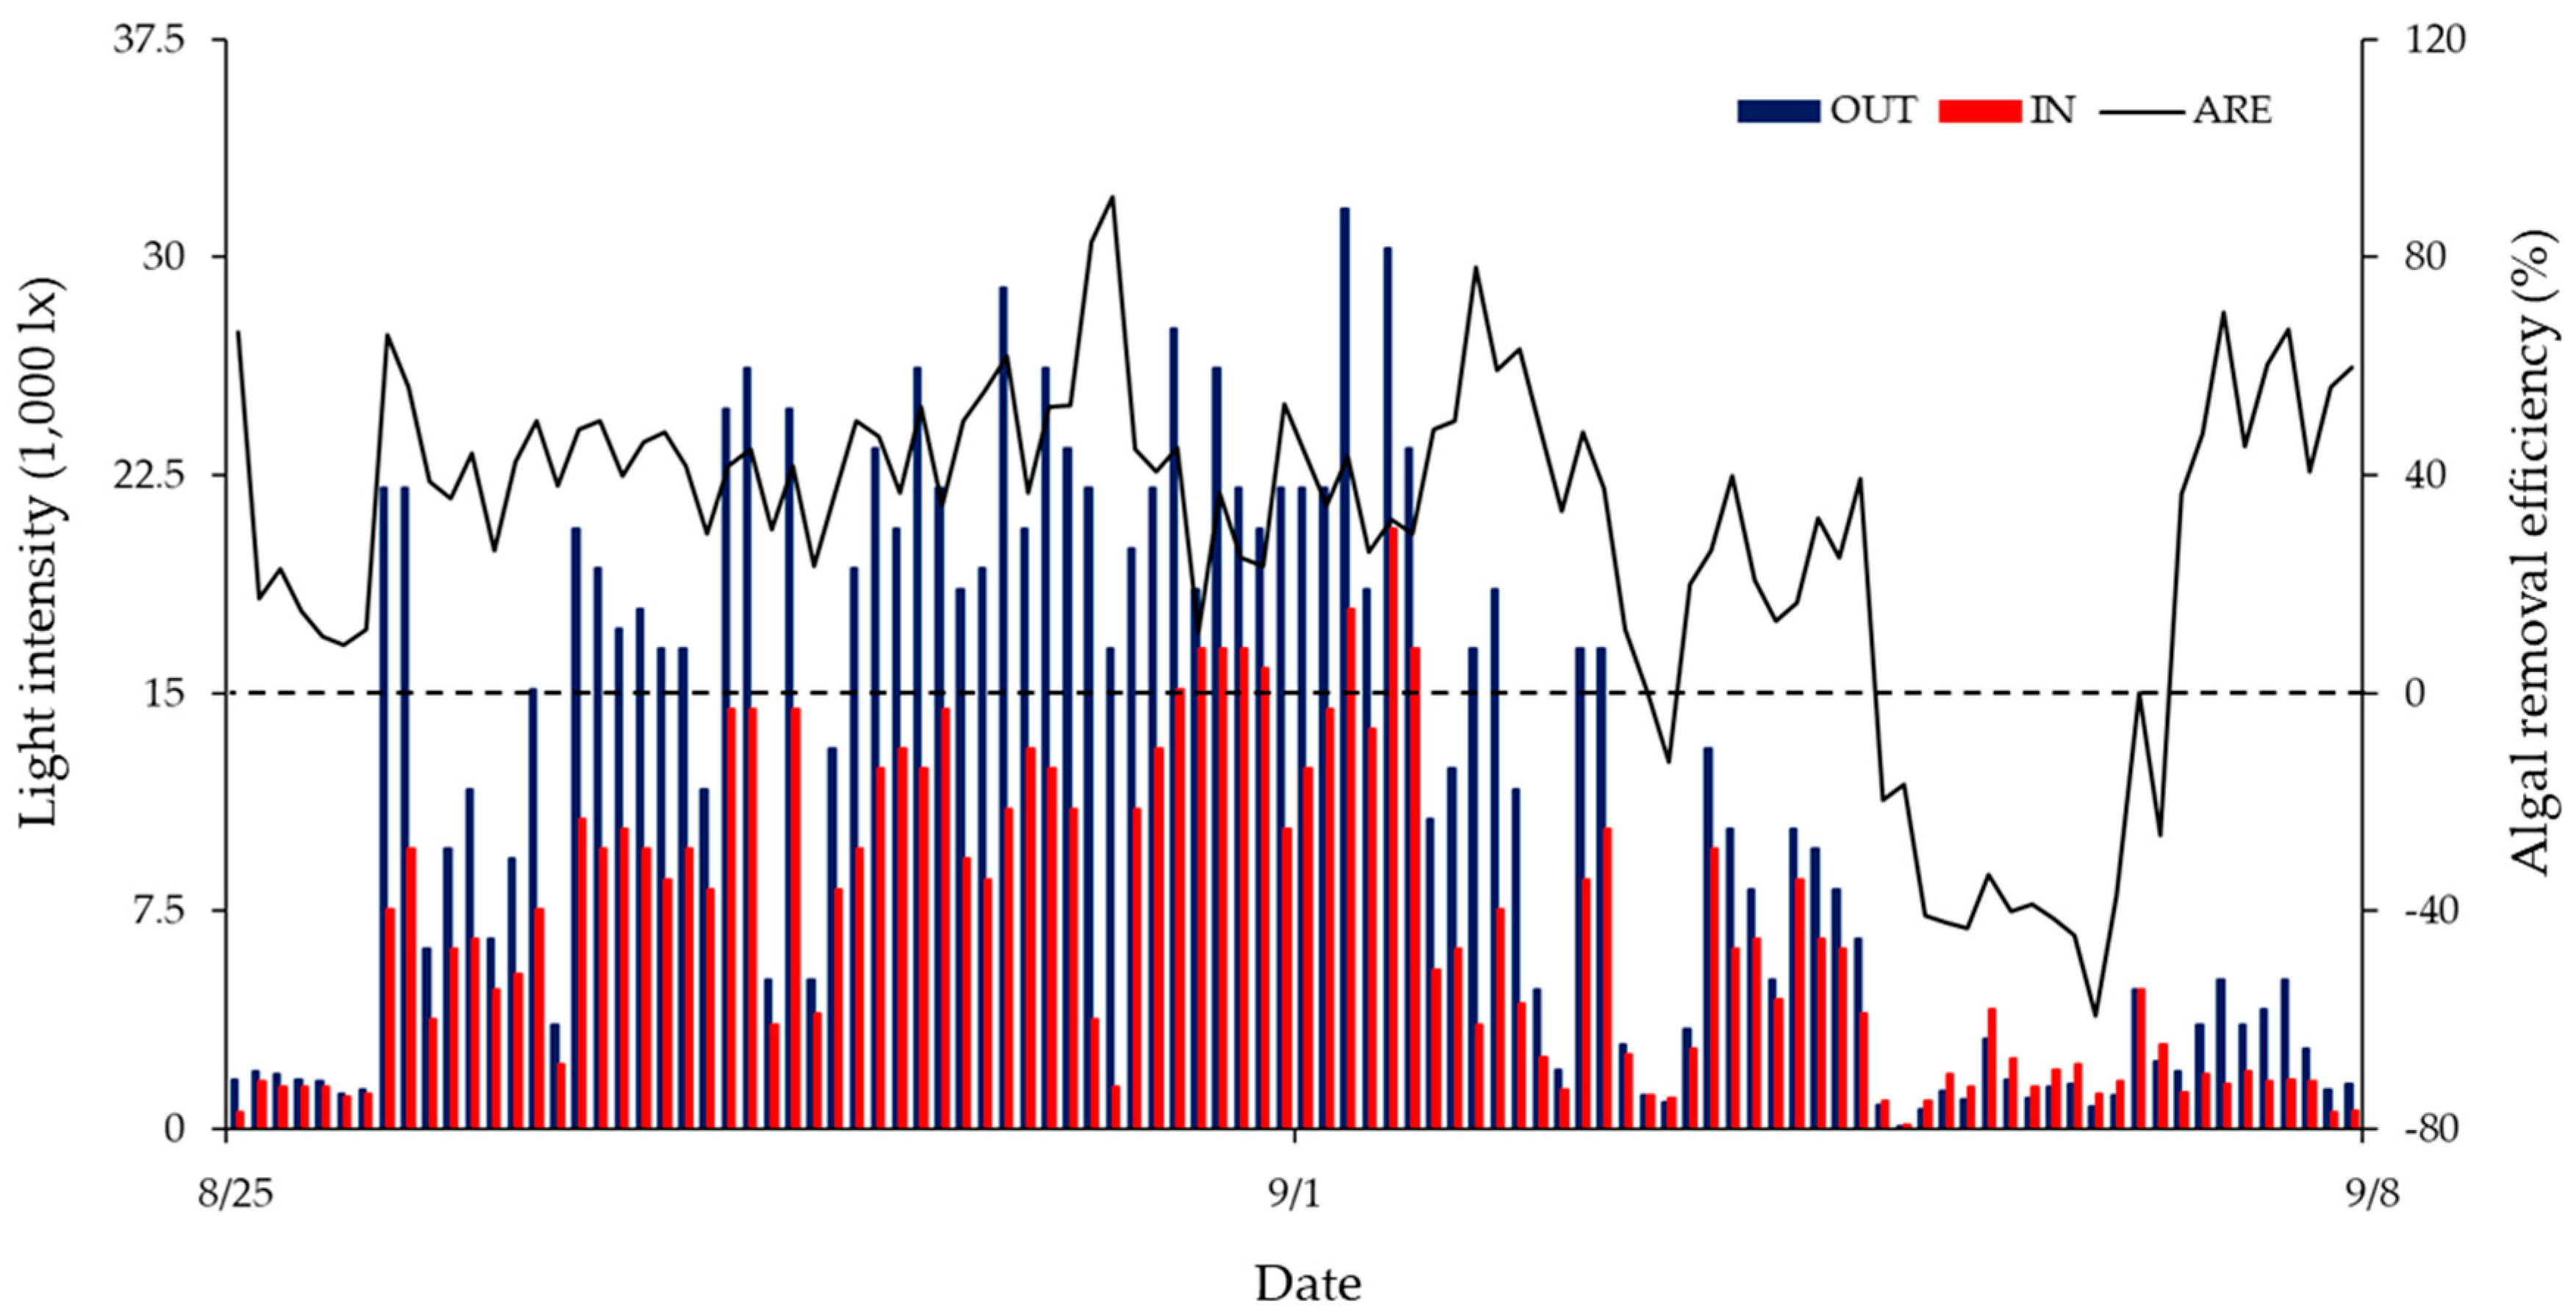
3.5. Effects of the ABM and Its Operation

When the PIF maintains conditions with enough nutrients and solar radiation, it leads to the prevalence of Microcystis species. The light intensity was 3000–30,000 lx inside the ABM and 100–20,000 lx outside. Analyzing the ARE using the difference between the light intensity inside and outside the ABM showed an ARE of over 35% (Figure 7). However, the light intensity measurements gradually decreased 10–14 days after the installation of a photometer, which complicated the analysis. As biofilms grew on the surface of the photometer installed underwater, the measured light intensity declined. Measuring the ARE of the ABM using a photometer is fast, whereas measuring the ARE through biomass measurements takes much longer as the biomass needs to be analyzed under a microscope. Additionally, information on the cycle of biofilm formation obtained due to the decrease in light intensity provided data for determining when the ABM needed to be washed to maintain its efficiency. The data suggested that the ABM should be washed once every other week in midsummer as a baseline when biofilm formation is most active to ensure stable operation of the structure.
The raw water flowing into the PIF changed the phytoplankton community and water quality parameters daily due to the ABM and hydraulic flow. The effects of ABM on pH, electric conductivity, dissolved oxygen (DO), Chl-a, and turbidity related to phytoplankton growth were analyzed during the experimental period (Table 3). The overall water temperature was slightly lower inside the PIF than in the reservoir. This suggested that the low water temperature inside the PIF was due to the pumping of water into the deep portion of the reservoir. The ABM was originally designed to entirely block the inflowing reservoir water of 0–2 m depth, called the SBM layer. Over the study period, the electric conductivity and pH inside the PIF were lower than those of the reservoir, from 25 August to 23 September, inside the PIF the electric conductivity and pH was temporarily higher than in the reservoir, where diatoms flourished with decreasing water temperature. The turbidity was higher inside the PIF than in the reservoir due to the floating of bottom sediment by the pumping of the reservoir water below the two-meter depth, consistent with the water temperature trends. Dissolved oxygen concentration was lower inside the PIF than in the reservoir during the study period, which occurred in the process of accepting the deep layer water of the reservoir, in the case of turbidity and water temperature. Another reason is due to the higher density of phytoplankton outside than PIF rather than inside [29]. Therefore, the lower reservoirs around the PIF are undergoing anaerobic or anaerobic decomposition [30]. As mentioned in the ARE, relative to phytoplankton, Chl-a was lower inside the PIF than in the reservoir when the cyanobacteria dominated, but showed the opposite phenomenon when diatoms dominated. In summary, the ABM we applied and tested can effectively block the inflow of cyanobacteria by blocking the surface water of flowing rivers, as mentioned for phytoplankton. However, when raw water from the reservoir is introduced into the drinking water purification plant using a pump, it less effectively improves the water quality due to the inflow of turbid low temperature water from the SBM to the bottom layer.
In this study, the incidence of destroyed cyanobacterium Microcystis and colonies by ABM was not confirmed. Within the ABM, the SBM layer can effectively block the surface cyanobacteria, but AFM can also destroy Microcystis and colonies and introduce microcystin into the PIF. Therefore, to confirm this, in vitro testing of the destruction of Microcystis and colonies, and the production and penetration of microcystin using AFM is required.
In terms of biological methods [31,32], various physical and chemical treatment methods for blocking cyanobacteria have been reported worldwide, including in Korea [3,11,12,13,14,15,16,33,34,35,36]. Researchers have demonstrated that the dissolved air flotation method (DAF) is one of the most effective physical methods for removing 93%–98% of Chl-a. As a chemical treatment, yellow clay or loess is often used in Korea to control both the cyanobacterial bloom in fresh water and even red tide in seawater. Although these technologies are effective in suppressing cyanobacteria in a small-sized laboratory and on a mesocosm scale, they are difficult to apply to water purification plants that supply a large amount of water resources, generate secondary pollution sources, and are inefficient in terms of processing costs. The ABM method did not generate large amounts of by-products or secondary pollutants such as algal biomass, 2-MIB, geosmin, and toxins like microcystin after treatment. In addition, ABMs can be sufficiently applied to block cyanobacteria in drinking water purification plants that require large amounts of water supply, and to block suspended matter such as high concentration turbid water due to rainfall. However, periodic washing must be performed and physical damage to the ABM device must be avoided during typhoons or abrupt weather changes depending on the season.
In order to block nuisance cyanobacterium Microcystis and its colonies in water purification plants like PIF, the application of the ABM model should be considered based on the following points:
1. Above all, a physically robust structure is required in a location where the residence time is short and the flow rate is high, such as in Paldangho Lake. Although a heavy weight was attached to the bottom of the AFM in this study, warping was observed due to the strong pumping pressure. This may cause turbid water inflow even though the phytoplankton density lowers as water depth increases. In this study, the maximum installation depth of the PIF is 9 m, but since fluctuations occur due to rainfall or Paldangho Lake discharge, when the low water capacity decreases, the inflow of sediments or turbid water from the bottom layer is inevitable. Therefore, a location less influenced by water depth is a prerequisite.
2. During the biofilm formation and cleaning of the AFM film, determining the exact cleaning cycle using factors such as water temperature or phytoplankton succession is difficult. Although the 1 m underwater photometric method attempted in this study is one alternative, the frequent washing required due to rapid biofilm formation is difficult when the density of phytoplankton or attached organisms increases. Therefore, the exact cleaning cycle must be determined and in-field AFM washing technologies must be developed.
3. ABM is more effective than other curtains or simple blocking membranes [14,15,16] and is economical compared to chemical treatment methods [33,34,35,36]. The structure of a simple membrane is difficult to maintain when the flow rate increases due to rainfall or the flow rate is strong due to a strong bending of the structure due to strong pumping pressure. In the case of Paldangho Lake, since cyanobacterial blooms are frequently generated, chemicals such as activated carbon and loess must be used in the water purification process. In addition, various side effects are expected. However, simple comparisons of the short-term ABM model with other technologies is complicated. Thus, long-term field application and technology improvement studies on the ABM model are required for economic evaluation.

4. Conclusions

An alternative algae-blocking mat (ABM), combining a single blocking mat (SBM) and an algal-filtering mat (AFM), was developed to increase algal removal efficiency (ARE) during cyanobacterial blooms (CBs) and of algae-originated materials (AOMs) in the Paldangho water intake facility (PIF). We evaluated the daily and monthly performance of the ABM using water quality parameters such as pH, dissolved oxygen, conductivity, turbidity, Chl-a, and light intensity between April and October 2015.
We demonstrated that the highest ARE of 92% was recorded on cyanobacterium Microcystis aeruginosa during high water temperature periods over 25 °C, whereas the ARE was more effective during the day. However, the mean ARE was below 40% for geosmin and 2-MIB compared to total phytoplankton.
A strong negative ARE on all water quality parameters such as water temperature, turbidity, conductivity, and dissolved oxygen inside the PIF was observed due to the introduction of lower reservoir water below the SBM layer by a strong pumping pressure for water purification.
Although ABM technology seems to be more economic than other physical, chemical, and biological treatments, several requirements should be considered for further application, such as a strong ABM structure, an exact ABM washing cycle, and a cost–benefit analysis of the ABM model.
Finally, ABM field tests have some limitations such as structure maintenance and the ABM washing cycle, but the AMB very effectively blocked CB occurrence and suspended solids exposed to the surface of reservoirs and rivers. In addition, our results facilitate the optimization and improvement of physical treatments and ABM technologies.

Author Contributions

Conceptualization, E.-M.G. and B.-H.K.; methodology, Y.-H.K. and E.-M.G.; validation, B.-H.K.; H.L. and E.-M.G.; investigation and formal analysis, Y.-H.K., E.-M.G., H.-K.K., I.-H.C. and B.-H.K.; data curation, Y.-H.K. and E.-M.G.; original draft preparation, Y.-H.K., H.L. and E.-M.G.; review and editing, E.-M.G. and B.-H.K. All authors have read and agreed to the published version of the manuscript.

Funding

This work was partly supported by the Small and Medium Business Administration in Korea, grant number S2252412.

Acknowledgments

The authors would like to thank all the survey members involved in the project for their help with sampling and analysis. The authors would also like to thank the reviewers for their help in improving the scientific quality of the manuscript, and MDPI for English language editing.

Conflicts of Interest

The authors declare no conflict of interest.

References

  1. Srivastava, A.; Ahn, C.-Y.; Asthana, R.K.; Lee, H.-G.; Oh, H.-M. Status, Alert System, and Prediction of Cyanobacterial Bloom in South Korea. BioMed Res. Int. 2015, 2015, 1–8. [Google Scholar] [CrossRef] [PubMed] [Green Version]
  2. Schindler, D.W. Eutrophication and Recovery in Experimental Lakes: Implications for Lake Management. Science 1974, 184, 897–899. [Google Scholar] [CrossRef] [PubMed] [Green Version]
  3. Paerl, H.W.; Hall, N.S.; Calandrino, E.S. Controlling harmful cyanobacterial blooms in a world experiencing anthropogenic and climatic-induced change. Sci. Total. Environ. 2011, 409, 1739–1745. [Google Scholar] [CrossRef] [PubMed]
  4. Byun, J.-H.; Hwang, S.-J.; Kim, B.-H.; Park, J.-R.; Lee, J.-K.; Lim, B.-J. Relationship between a Dense Population of Cyanobacteria and Odorous Compounds in the North Han River System in 2014 and 2015. Korean J. Ecol. Environ. 2015, 48, 263–271. [Google Scholar] [CrossRef]
  5. Michalak, A.M.; Anderson, E.J.; Beletsky, D.; Boland, S.; Bosch, N.S.; Bridgeman, T.B.; Chaffin, J.D.; Cho, K.; Confesor, R.; Daloglu, I.; et al. Record-setting algal bloom in Lake Erie caused by agricultural and meteorological trends consistent with expected future conditions. Proc. Natl. Acad. Sci. USA 2013, 110, 6448–6452. [Google Scholar] [CrossRef] [Green Version]
  6. Wines, M. Behind Toledo’s water crisis, a long-troubled Lake Erie. New York Times, 5 August 2014. [Google Scholar]
  7. Park, C.H.; Park, M.H.; Choi, D.H.; Lee, J.H.; Lee, M.H.; Hwang, S.J. The removal of algae and phosphorus in eutrophic waters using various filter media. Korean J. Ecol. Environ. 2012, 45, 102–109. [Google Scholar]
  8. Yoo, H.; Lee, B.; Rhee, S.W. Correlation between Paldang reservoir discharge and causes of algal blooming. J. Korean Organic Resour. Recyc. Assoc. 2013, 21, 93–98. [Google Scholar]
  9. Srinivasan, R.; Sorial, G.A. Treatment of taste and odor causing compounds 2-methyl isoborneol and geosmin in drinking water: A critical review. J. Environ. Sci. 2011, 23, 1–13. [Google Scholar] [CrossRef]
  10. Jahn, S.A.A. Using Moringa Seeds as Coagulants in Developing Countries. J. Am. Water Work. Assoc. 1988, 80, 43–50. [Google Scholar] [CrossRef]
  11. Sigee, D.C.; Glenn, R.; Andrews, M.J.; Bellinger, E.G.; Butler, R.D.; Epton, H.A.S.; Hendry, R.D. Biological control of cyanobacteria: Principles and possibilities. In The Ecological Bases for Lake and Reservoir Management; Springer: Amsterdam, The Netherlands, 1999; pp. 161–172. [Google Scholar]
  12. Kim, N.-Y.; Park, M.-H.; Hwang, S.-O.; Kim, B.-H.; Hwang, S.-J. Combined Effects of Filter-feeding Bivalve and Zooplankton on the Growth Inhibition of Cyanobacterium Microcystis aeruginosa. Korean J. Ecol. Environ. 2015, 48, 108–114. [Google Scholar] [CrossRef]
  13. Hong, N.S. Investigation of reducing characteristics for the spreading of dredging soil and the diffusion of contaminant by silt protector curtain through three dimensional numerical model experiment. J. Ocean Eng. Technol. 2010, 24, 78–85. [Google Scholar]
  14. Asaeda, T.; Pham, H.; Priyantha, D.N.; Manatunge, J.; Hocking, G. Control of algal blooms in reservoirs with a curtain: A numerical analysis. Ecol. Eng. 2001, 16, 395–404. [Google Scholar] [CrossRef]
  15. Asaeda, T.; Priyantha, D.; Saitoh, S.; Gotoh, K. A new technique for controlling algal blooms in the withdrawal zone of reservoirs using vertical curtains. Ecol. Eng. 1996, 7, 95–104. [Google Scholar] [CrossRef]
  16. Joo, G.J.; Jang, M.H.; Park, S.B.; Jung, J.M.; Roh, J.S.; Jeong, G.S. The application of an algal fence for the reduction of algal intake into the water intake facility. Korean J. Limnol. 2003, 36, 467–472. [Google Scholar]
  17. Kong, D.S. Limnological and ecological characteristics of a river-reservoir (Paldang), Korea. Korean J. Limnol. 1997, 30, 524–535. [Google Scholar]
  18. Kim, B.-H.; Hwang, S.-J.; Han, M.-S. Bacterium and Fish-Mediated Morphological Changes of the Toxic Cyanobacterium Microcystis aeruginosa. J. Freshw. Ecol. 2008, 23, 613–622. [Google Scholar] [CrossRef] [Green Version]
  19. American Public Health Association (APHA); American Water Works Association (AWWA); Water Environment Federation (WEF). Standard Methods for the Examination of Water and Wastewater, 21st ed.; APHA-AWWA-WEF: Washington, DC, USA, 2005. [Google Scholar]
  20. Watanabe, M.F.; Oishi, S. Effects of Environmental Factors on Toxicity of a Cyanobacterium (Microcystis aeruginosa) under Culture Conditions. Appl. Environ. Microbiol. 1985, 49, 1342–1344. [Google Scholar] [CrossRef] [Green Version]
  21. Ha, K.; Kim, H.-W.; Jeong, K.-S.; Joo, G.-J. Vertical distribution of Microcystis population in the regulated Nakdong River, Korea. Limnology 2000, 1, 225–230. [Google Scholar] [CrossRef]
  22. Chien, Y.C.; Wu, S.C.; Chen, W.C.; Chou, C.C. Model Simulation of Diurnal Vertical Migration Patterns of Different-Sized Colonies of Microcystis Employing a Particle Trajectory Approach. Environ. Eng. Sci. 2013, 30, 179–186. [Google Scholar] [CrossRef] [Green Version]
  23. Wallace, B.B.; Bailey, M.C.; Hamilton, D.P. Simulation of vertical position of buoyancy regulating Microcystis aeruginosa in a shallow eutrophic lake. Aquat. Sci. 2000, 62, 320–333. [Google Scholar] [CrossRef]
  24. Hunter, P.; Tyler, A.; Willby, N.J.; Gilvear, D. The spatial dynamics of vertical migration by Microcystis aeruginosa in a eutrophic shallow lake: A case study using high spatial resolution time-series airborne remote sensing. Limnol. Oceanogr. 2008, 53, 2391–2406. [Google Scholar] [CrossRef]
  25. Sugiura, N.; Yagi, O.; Sudo, R. Musty odor from blue-green alga, Phormidium tenue in Lake Kasumigaura. Environ. Technol. Lett. 1986, 7, 77–86. [Google Scholar] [CrossRef]
  26. Sugiura, N.; Nakano, K. Causative microorganisms for musty odor occurrence in the eutrophic Lake Kasumigaura. Hydrobiology 2000, 434, 145–150. [Google Scholar] [CrossRef]
  27. Xu, L.; Xiong, B.; Pan, Y.; Wang, J.; Cao, H.; Zhao, W. Relationship between concentrations of odorous compounds and biomass of phytoplankton and actinomycetes in freshwater ponds of Beijing, China. Aquac. Int. 2009, 18, 245–254. [Google Scholar] [CrossRef]
  28. Parinet, J.; Rodriguez, M.J.; Sérodes, J. Influence of water quality on the presence of off-flavor compounds (geosmin and 2-methylisoborneol). Water Res. 2010, 44, 5847–5856. [Google Scholar] [CrossRef] [PubMed]
  29. Smith, D.W.; Piedrahita, R.H. The relation between phytoplankton and dissolved oxygen in fish ponds. Aquaculture 1988, 68, 249–265. [Google Scholar] [CrossRef]
  30. Lee, K.; Choi, M.J.; Park, H.K.; Lee, J.H. Characteristics of Release Rate of Nutrients from Sediment in Lake Paldang and Lake Cheongpyeong. J. Korean Soc. Water Qual. 2009, 25, 742–749. [Google Scholar]
  31. Kim, B.-H.; Lee, J.-H.; Hwang, S.-J. Inter- and intra-specific differences in filtering activities between two unionids, Anodonta woodiana and Unio douglasiae, in ambient eutrophic lake waters. Ecol. Eng. 2011, 37, 1957–1967. [Google Scholar] [CrossRef]
  32. Kim, B.-H.; Hwang, S.-J.; Han, M.-S.; Sang, M. In situ bacterial mitigation of the toxic cyanobacterium Microcystis aeruginosa: Implications for biological bloom control. Limnol. Oceanogr. Methods 2008, 6, 513–522. [Google Scholar] [CrossRef]
  33. Teixeira, M.R.; Rosa, M.J. Comparing dissolved air flotation and conventional sedimentation to remove cyanobacterial cells of Microcystis aeruginosa. Sep. Purif. Technol. 2006, 52, 84–94. [Google Scholar] [CrossRef]
  34. Na, G.H.; Nam, J.B.; Park, K.D.; Lee, J.A. Experimental elimination of cyanobacteria Microcystis sp. by loess suspension in column test. J. Korean Soc. Water Qual. 1998, 14, 399–404. [Google Scholar]
  35. Park, M.-H.; Chung, I.-M.; Ahmad, A.; Kim, B.-H.; Hwang, S.-J. Growth inhibition of unicellular and colonial Microcystis strains (Cyanophyceae) by compounds isolated from rice (Oryza sativa) hulls. Aquat. Bot. 2009, 90, 309–314. [Google Scholar] [CrossRef]
  36. Kim, S.; Jeon, M.S.; Kim, J.Y.; Sim, S.J.; Choi, J.-S.; Kwon, J.; Choi, Y.-E. Adsorptive removal of harmful algal species Microcystis aeruginosa directly from aqueous solution using polyethylenimine coated polysulfone-biomass composite fiber. Biodegradation 2018, 29, 349–358. [Google Scholar] [CrossRef]
Figure 1. A map of the reservoir with the test site (red dot). Paldangho Lake was a dam that collects three rivers: the Bukhan River, the Namhan River, and the Gyeongan cheon River.
Water 12 01576 g001
Figure 2. (A) Paldangho intake facility (PIF) with (B) alternative algae-blocking mat (ABM) installed for drinking water supply. The ABM includes 2 m of simple blocking mat (SBM) and 3 m of algal filtering mat (AFM) composed of (C) polypropylene fiber (ABM). OUT; reservoir water, IN; ABM-passed water. Both SBM and AFM are described in Table 1.
Water 12 01576 g002
Figure 3. (A) Seasonal variation of total phytoplankton cell abundance and water temperature, and (B) precipitation and total phosphorus at the Paldangho intake facility from 29 April to 19 October 2015.
Water 12 01576 g003
Figure 4. Blocking efficiency of phytoplankton class by study period. Average blocking efficiency of phytoplankton by the alternative algae-blocking mat (ABM). OUT, reservoir water; IN, ABM-passed water. (A) Surface layer (0–2 m), (B) middle layer (3–5 m), and (C) bottom layer (>5 m).
Water 12 01576 g004
Figure 5. Daily variation in total phytoplankton and algal removal efficiency at different depths on both sides (outside and inside the alternative algae-blocking mat (ABM)) of the Paldangho intake facility. OUT, reservoir water; IN, ABM-passed water. (A) 24 August at 2:00 p.m., (B) 24 August at 8:00 p.m., and (C) 25 August at 8:00 a.m.
Water 12 01576 g005
Figure 6. Variation in 2-methylisoborneol (A) and geosmin (B) concentration (ng/L) and algal removal efficiency (%) by an alternative algae-blocking mat from 8 April to 23 October 2015. Measurements were recorded using integrated water samples collected at different depths.
Water 12 01576 g006
Figure 7. Daily variation in light intensity at a 1 m depth on both sides (IN and OUT) of the alternative algae-blocking mat (ABM) from 25 August to 8 September 2015. Biofilm formation was detected by light intensity. The single dotted line indicates a reference point (0%) of the algal removal efficiency.
Water 12 01576 g007
Table 1. Characteristics of the alternative algae-blocking mat (ABM) comprising a simple blocking mat (SBM) and an algal-filtering mat (AFM) that were used in this study. The dotted blue line indicates where both SBM and AFM are connected, whereas B is the surface structure of AFM fiber.
SpecificationSBMAFM
MaterialPolypropylenePolypropylene fiber
Water intake volume (Q, m3/day)1,500,0001,500,000
Thickness (cm)22
Vertical length (m)23
Pore size (μm)<9<100
TargetsWater and most suspended solidsPhytoplankton
Mat surface structure of ABM and AFM fiber Water 12 01576 i001
Table 2. Dominant phytoplankton species on an alternative algae-blocking mat (ABM) during daily (24–25 August) and monthly monitoring between 29 April and 19 October 2015. OUT; reservoir water, IN; ABM-passed water.
Sampling Time *
(YYYY/MM/DD)
Dominant Species
OUTIN
2015/04/29Rhodomonas lacustrisRhodomonas lacustris
2015/05/06Cyclotella meneghinianaPediastrum boryanum
2015/0/520Fragilaria crotonensisAsterionella formosa
2015/06/10Microcystis flos-aquaeFragilaria crotonensis
2015/06/24Aulacoseira granulataFragilaria crotonensis
2015/07/07Dolichospermum crassumDolichospermum crassum
2015/07/21Dolichospermum crassumFragilaria crotonensis
2015/08/04Merismopedia tenuissimaMerismopedia tenuissima
2015/08/18Microcystis aeruginosaMicrocystis aeruginosa
2015/08/24 (2:00 p.m.) **Microcystis aeruginosaMicrocystis aeruginosa
2015/08/24 (8:00 p.m.)Microcystis aeruginosaMicrocystis aeruginosa
2015/08/25 (8:00 a.m.)Microcystis aeruginosaMicrocystis aeruginosa
2015/09/08Microcystis wesenbergiiMicrocystis aeruginosa
2015/09/23Aulacoseira granulataAulacoseira granulata
2015/10/06Aulacoseira granulataAulacoseira granulata
2015/10/19Aulacoseira granulataDictyosphaerium pulchellum
* Timely sampling was conducted at the interval hours between 24 and 25 August 2015. ** These data were applied as representatives for monthly sampling. Environmental variables were not measured on 6 October 2015.
Table 3. Effects of an alternative algae-blocking mat (ABM) on temperature (Temp), conductivity (Cond), pH, turbidity (Turb), dissolved oxygen (DO), and chlorophyll-a (Chl-a) over daily (24–25 August) and monthly monitoring between 29 April and 19 October 2015. OUT, reservoir water; IN, ABM-passed water; ND, no data. NTU: nephelometric turbidity units.
Date (YYYY/MM/DD)Temp (°C)Cond (μS/cm)pHTurb (NTU)DO (mg/L)Chl-a (μg/L)
OUTINOUTINOUTINOUTINOUTINOUTIN
2015/04/2916.38 ± 1.1415.14 ± 0.65219.76 ± 17.46202.33 ± 7.308.95 ± 0.128.83 ± 0.322.14 ± 0.271.57 ± 1.2913.33 ± 0.6912.36 ± 1.437.41 ± 2.106.35 ± 2.11
2015/05/0618.11 ± 1.0516.92 ± 1.21218.33 ± 24.78196.13 ± 24.228.71 ± 0.178.43 ± 0.341.71 ± 0.562.71 ± 1.2111.39 ± 0.5410.82 ± 0.834.36 ± 1.336.88 ± 3.43
2015/05/2018.89 ± 0.0818.58 ± 0.48244.60 ± 2.33215.66 ± 28.388.19 ± 0.118.25 ± 0.141.42 ± 0.042.05 ± 0.7510.22 ± 0.049.679 ± 0.636.70 ± 0.366.89 ± 1.30
2015/06/1022.43 ± 1.1021.26 ± 0.99191.93 ± 47.57145.90 ± 22.208.34 ± 0.078.05 ± 0.100.62 ± 0.331.14 ± 0.389.796 ± 0.209.476 ± 0.534.43 ± 1.263.83 ± 2.30
2015/06/2425.12 ± 1.2623.46 ± 1.42212.40 ± 42.68170.60 ± 39.508.11 ± 0.088.06 ± 0.150.54 ± 0.861.60 ± 1.288.873 ± 0.258.297 ± 0.57NDND
2015/07/0726.36 ± 0.3425.71 ± 0.66259.10 ± 1.35234.20 ± 39.168.00 ± 0.087.86 ± 0.040.67 ± 0.551.17 ± 0.468.021 ± 0.707.179 ± 0.624.00 ± 0.183.71 ± 0.35
2015/07/2126.09 ± 0.4125.63 ± 0.53228.10 ± 10.90219.50 ± 34.158.12 ± 0.088.02 ± 0.091.98 ± 0.811.34 ± 0.648.333 ± 0.837.525 ± 0.5714.10 ± 7.356.94 ± 1.29
2015/08/0427.31 ± 1.3325.89 ± 0.95178.9 ± 20.05156.50 ± 14.268.57 ± 0.158.02 ± 0.143.31 ± 0.313.38 ± 0.8110.09 ± 1.287.816 ± 0.7629.00 ± 10.7021.3 ± 5.66
2015/08/1828.89 ± 0.5428.01 ± 0.78216.36 ± 16.57230.80 ± 15.439.18 ± 0.198.77 ± 0.235.09 ± 1.067.15 ± 4.3811.21 ± 1.358.49 ± 1.2734.80 ± 7.1428.3 ± 3.29
2015/08/24 (2:00 p.m.)28.31 ± 0.4227.69 ± 0.34204.80 ± 6.01207.93 ± 9.609.41 ± 0.168.92 ± 0.188.48 ± 2.404.72 ± 0.5813.04 ± 1.379.394 ± 0.9655.30 ± 20.1036.0 ± 8.36
2015/08/24 (8:00 p.m.)28.53 ± 0.3627.67 ± 0.51208.25 ± 3.90204.56 ± 2.349.47 ± 0.109.05 ± 0.249.62 ± 2.105.30 ± 0.4513.56 ± 0.7810.12 ± 1.6955.00 ± 15.4045.3 ± 14.9
2015/08/25 (8:00 a.m.)27.67 ± 0.0127.68 ± 0.00217.00 ± 0.00217.00 ± 0.009.00 ± 0.009.01 ± 0.005.73 ± 0.456.02 ± 0.2110.02 ± 0.029.967 ± 0.0153.30 ± 1.6153.3 ± 0.66
2015/09/0825.75 ± 0.1125.61 ± 0.10222.40 ± 3.87227.73 ± 1.377.68 ± 0.047.77 ± 0.013.28 ± 0.183.15 ± 0.237.91 ± 0.317.200 ± 0.4510.9 ± 1.6813.2 ± 0.44
2015/09/2323.85 ± 0.0923.75 ± 0.05204.80 ± 5.11204.80 ± 5.117.56 ± 0.228.10 ± 0.011.51 ± 0.311.47 ± 0.119.41 ± 0.389.076 ± 0.077.94 ± 3.129.95 ± 0.90
2015/10/1918.84 ± 0.0518.73 ± 0.00183.20 ± 1.60181.10 ± 0.207.65 ± 0.007.49 ± 0.021.31 ± 0.051.86 ± 0.228.993 ± 0.048.842 ± 0.027.18 ± 1.017.53 ± 0.95

