Article

Flood Flow Frequency Analysis to Estimate Potential Floodplain Nitrogen Treatment during Overbank Flow Events in Urban Stream Restoration Projects

by
Barbara A. Doll
1,*,
J. Jack Kurki-Fox
2,
Jonathan L. Page
2,
Natalie G. Nelson
2 and
Jeffrey P. Johnson
2
1
Department of Biological and Agricultural Engineering, North Carolina State University and North Carolina Sea Grant, Raleigh, NC 27695, USA
2
Department of Biological and Agricultural Engineering, North Carolina State University, Raleigh, NC 27695, USA
*
Author to whom correspondence should be addressed.
Water 2020, 12(6), 1568; https://doi.org/10.3390/w12061568
Submission received: 5 May 2020 / Revised: 27 May 2020 / Accepted: 28 May 2020 / Published: 30 May 2020
(This article belongs to the Section Water Quality and Contamination)

Abstract

:
Stream restoration for mitigation purposes has grown rapidly since the 1980s. As the science advances, some organizations (Chesapeake Bay Program, North Carolina Department of Environmental Quality) have approved or are considering providing nutrient credits for stream restoration projects. Nutrient treatment on floodplains during overbank events is one of the least understood processes that have been considered as part of the Chesapeake Bay Program’s Stream Restoration Nutrient Crediting program. This study analyzed ten years of streamflow and water quality data from five stations in the Piedmont of North Carolina to evaluate proposed procedures for estimating nitrogen removal on the floodplain during overbank flow events. The volume of floodplain flow, the volume of floodplain flow potentially treated, and the nitrogen load retained on the floodplain were calculated for each overbank event, and a sensitivity analysis was completed. On average, 9% to 15% of the total annual streamflow volume accessed the floodplain. The percentage of the average annual volume of streamflow potentially treated ranged from 1.0% to 5.1%. Annually, this equates to 0.2% to 1.0% of the total N load retained/removed on the floodplain following restoration. The relatively low nitrogen retention/removal rates were due to a majority of floodplain flow occurring during a few large events each year that exceeded the treatment capacity of the floodplain. On an annual basis, 90% of total floodplain flow occurred during half of all overbank events and 50% of total floodplain flow occurred during two to three events each year. Findings suggest that evaluating only overbank events may lead to undervaluing stream restoration because treatment is limited by hydrologic controls that restrict floodplain retention time. Treatment is further governed by floodplain and channel size.

1. Introduction

Stream restoration has expanded rapidly over the last four decades into a billion-dollar industry, with thousands of streams restored annually in the U.S. [1]. The increase in restoration projects is primarily driven by the regulatory requirements of Section 404 of the Clean Water Act. Section 404 requires compensatory restoration for construction or development projects that impact perennial and intermittent stream ecosystems. Beyond federal regulatory requirements, stream restoration is also viewed as a tool to reduce nutrient and sediment loading, improve water quality [2,3], reduce flooding and enhance habitat [1]. Because of the potential water quality benefits, some organizations have adopted or are developing nutrient credits for stream restoration to help meet watershed nutrient reduction goals (e.g., the Chesapeake Bay Program (CBP) and the North Carolina Department of Environmental Quality). Nutrient credit programs provide a mechanism for municipal or industrial entities to achieve their individual nutrient load limits [4] or new development projects to mitigate for not meeting the nutrient load limits set by regulatory agencies [5]. Nutrient credit programs are diverse across states with regard to trading or purchase options and allowing for credit through restoration activities (e.g., riparian buffers, wetlands or streams). For example, the CBP considers three components that contribute to nutrient reduction/removal credits for stream restoration: (Protocol 1) a reduction in sediment loads as a result of bank stabilization, (Protocol 2) treatment in the stream hyporheic zone during baseflow and (Protocol 3) treatment on the floodplain during overbank events resulting from floodplain reconnection. While the benefits of a reduction in sediment loading due to bank stabilization and treatment in the hyporheic zone are well-studied and relatively quantifiable, there is a lack of information on the capacity of stream restoration projects to treat nitrogen on the floodplain during overbank flow events.
Previous research provides strong evidence that stream restoration can improve nitrogen removal. Kaushal et al. [6] reported significantly greater mean denitrification rates in a restored reach compared to an unrestored reach. Based on a review of over 50 studies, Lammers and Bledsoe [7] reported that floodplain reconnection provides an additional pathway for nitrogen removal in restored streams. Floodplain treatment primarily occurs through wetland-related functions including (1) deposition of particulate organic nitrogen, (2) denitrification and plant uptake from floodwater retained in depressional wetland areas on the floodplain following storm events, and (3) deposition of sediment-bound nitrogen [8]. While it is well established that floodplain wetland features have the potential to improve water quality [9,10], caution should be employed when extrapolating areal nutrient retention/transformation potential or treatment efficiency rates to include all overbank flow that makes contact with the floodplain.
Because of short retention times—measured in minutes or hours—during overbank events, not all floodplain flow is treated. Floodplains act as supplemental conduits with minimal contact time during high-intensity events [11,12,13]. In contrast, stormwater wetlands are sized to capture and retain influent loads for two to five days. For urban floodplains to achieve retention times similar to those of stormwater wetlands, and in turn provide the increased treatment of storm flows, a substantial floodplain area would be required. Nonetheless, some degree of nitrogen treatment will occur in riparian zones adjacent to streams during overbank events.
For Protocol 3 of the CBP methodology, hydrologic modeling is used to estimate the rainfall depth that would trigger overbank flow to the floodplain. Recognizing that not all flow on the floodplain will be treated, a treatment volume is then calculated by assuming a maximum 30-cm water storage depth. Treatment efficiency is conservatively set at 20% based on research by Jordan [11]. Total nitrogen (TN) removal versus rainfall curves were then developed based on historical rainfall data to estimate average annual TN removal efficiency. This method, which assumes a great deal of uncertainty, is meant as a tool to estimate potential removal; consequently, there are no documented cases of credit being awarded for the CBP Protocol 3 as of February 2020 [14].
Because of the uncertainty associated with floodplain-based nitrogen treatment, and proposed methodologies for quantifying this removal, an analysis of high frequency streamflow data was performed to evaluate (1) the occurrence of overbank flow events and (2) the associated proportion of flow exposed to floodplains in order to better estimate nitrogen treatment potential. The results of this analysis were then used to evaluate the premise of CBP Protocol 3 and help guide future development of stream restoration related nutrient credits.

2. Materials and Methods
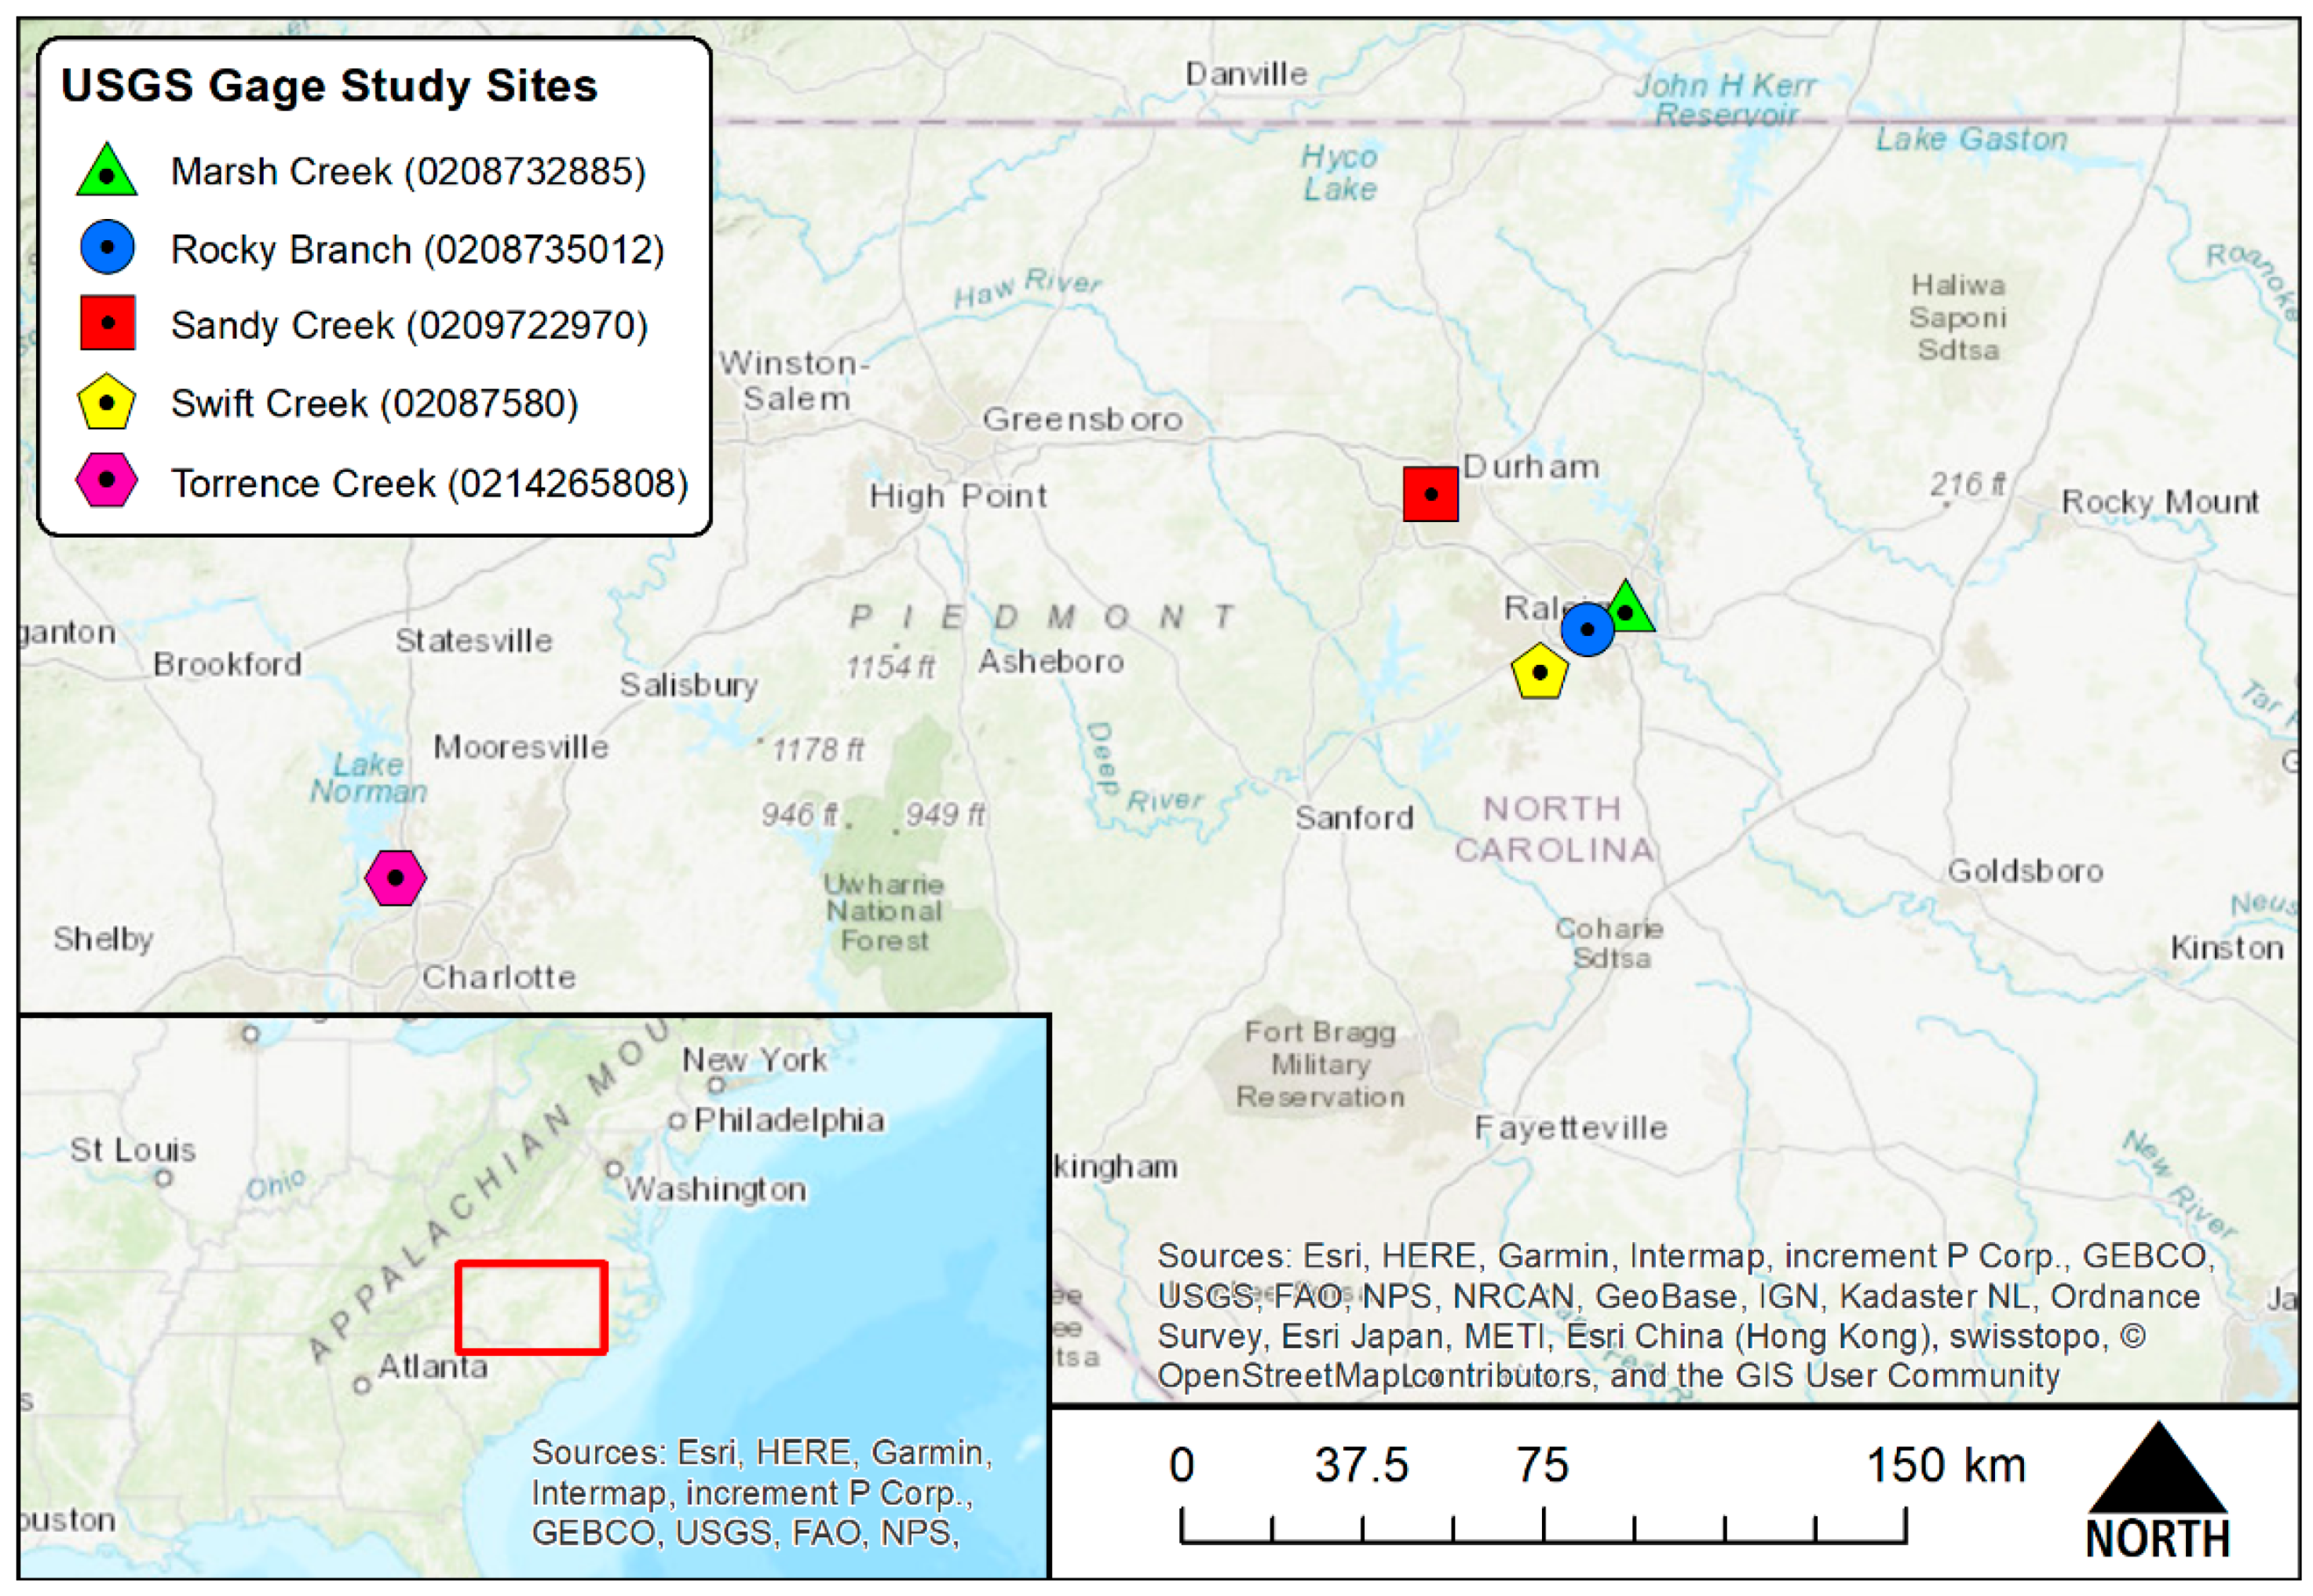
2.1. Site Selection

Five U.S. Geological Survey (USGS) gage stations were selected to evaluate the frequency and volume of flow that inundates a floodplain (Table 1, Figure 1). Ten years of discharge data (January 2008–December 2017) were evaluated for each station. Three of the gage sites, Rocky Branch, Sandy Creek and Torrence Creek, were located downstream of previously restored stream reaches. For these sites, both pre- and post-restoration conditions were analyzed to assess change in overbank flow frequency and volume resulting from restoration efforts. Marsh Creek and Swift Creek gage stations were located on un-restored streams. These sites were selected as each included the presence of a wide forested floodplain adjacent to the stream and a moderate degree of incision, which was similar to the pre-restoration condition of the other three study sites. Floodplain inundation frequency and the volume of flow at these un-restored sites were evaluated using a theoretical stream restoration approach of reconfiguring the channel and excavating a new floodplain at a lower elevation to improve floodplain connection. All five study sites were evaluated to determine the changes in the frequency of floodplain flow, floodplain flow volume and associated nitrogen treatment that could be realized through floodplain reconnection via stream restoration.

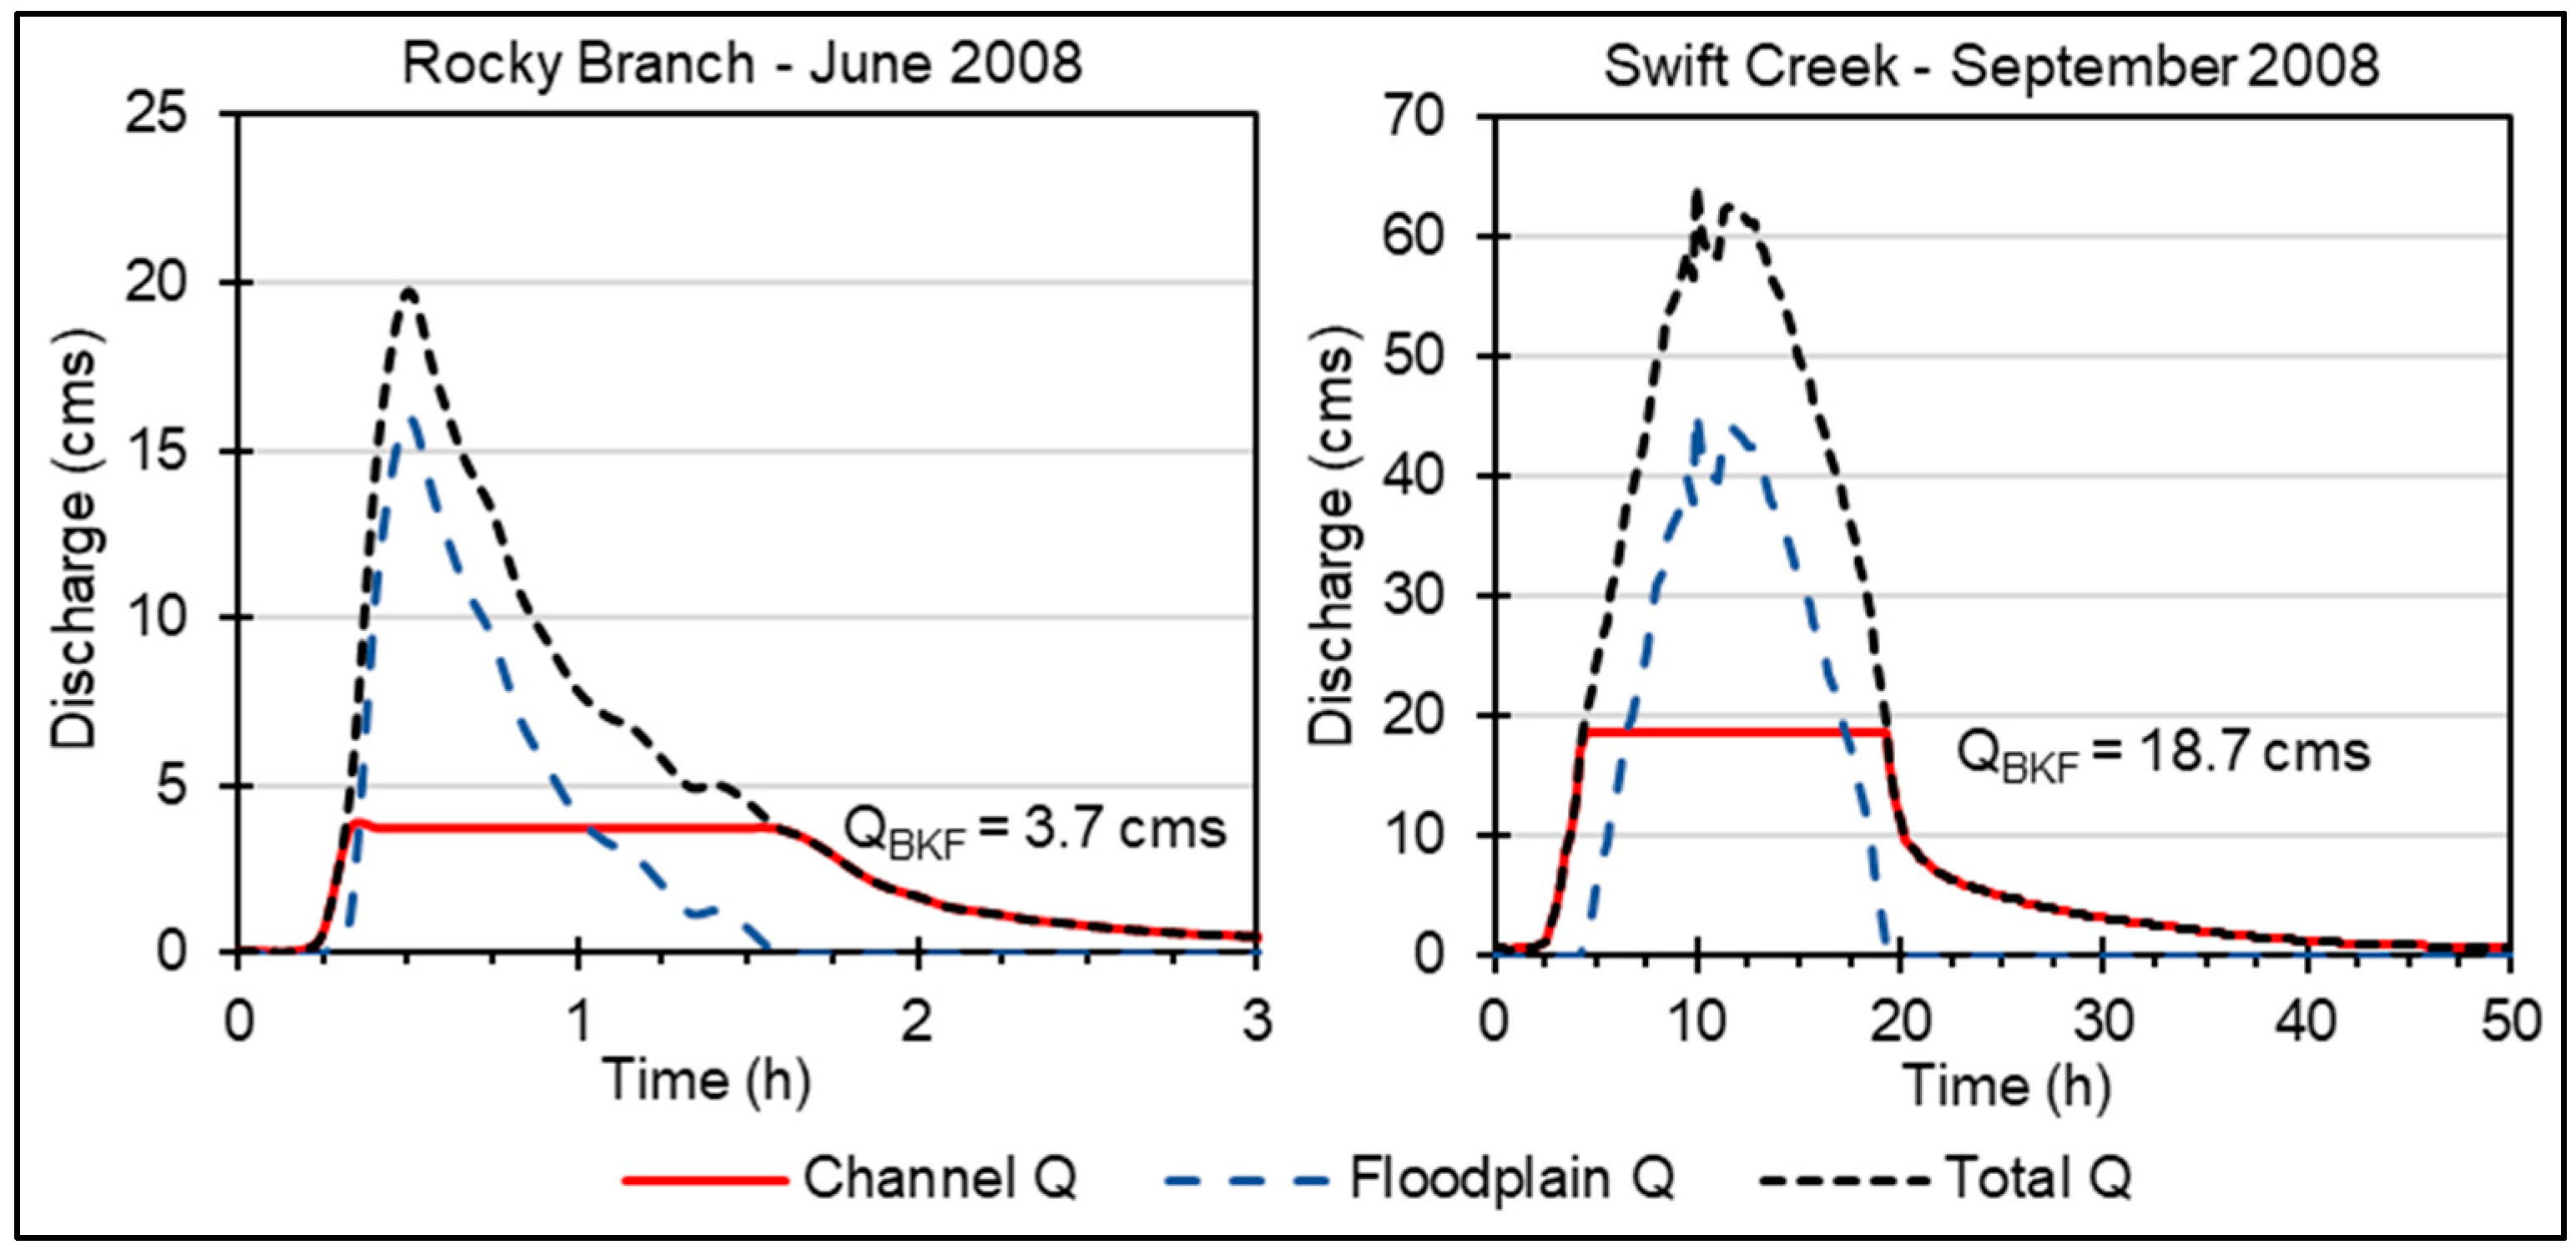
2.2. Bankfull and Top of Bank Discharge Determinations

The top of bank discharge (QTOB) and bankfull discharge (QBKF) were used to compare floodplain flow frequency and flow volume from pre- to post-restoration conditions. In the case of the un-restored streams—Marsh and Swift creeks—field-identified bankfull stage, published hydraulic geometry regional curves [15], flood frequency analysis of USGS reported annual peak flows, and hydraulic modeling were conducted to select a design QBKF. Marsh Creek and Swift Creek gage sites were visited and the top of bank and bankfull stage were identified in the field. A riffle cross-section was measured to determine the top of bank (ATOB) and bankfull (ABKF) channel cross-sectional areas and the streambed longitudinal profile was surveyed to determine the channel slope. Manning’s equation was then used to calculate top of bank (QTOB) and bankfull (QBKF) discharges. Annual peak discharges for the entire gage record were downloaded and used to analyze the flood frequency. QBKF was compared to published bankfull discharge values and to the one-year return interval discharge estimated from the flood frequency analysis. For Sandy and Torrence Creeks, QBKF and QTOB were obtained from restoration design documents. Finally, for Rocky Branch, annual mitigation monitoring reports, including field measured cross-sectional area and channel slope, were used to calculate QBKF using Manning’s equation.
To further evaluate bankfull and top of bank discharge at each stream reach, the effective Hydrologic Engineering Center-River Analysis System (HEC-RAS) hydraulic model was obtained from the NC Flood Risk Information System [16] for Swift, Marsh, Torrence and Sandy creeks. An effective model was not available for Rocky Branch. Using HEC-RAS 5.0 [17], each hydraulic model was executed at various discharges to identify the flow that would fill the existing channel without overtopping its banks. This discharge was set as the top of bank discharge. The pre-restoration QTOB for Sandy Creek and Rocky Branch was calculated using Manning’s equation based on cross-section and longitudinal surveys of the creeks conducted prior to restoration by North Carolina State University and by engineering consultants contracted by Duke University, respectively.
Because the gage is located a considerable distance downstream of the restoration projects at Sandy and Torrence creeks, (approximately 2.1 and 1.3 km, respectively), hydraulic models were used to determine the discharge at the gage location that corresponds to the bankfull channel of the upstream restored reach when flowing full.

2.3. Annual Flow Volume Interacting with the Floodplain

Total volume of flow that passed the gage and the volume of flow during each time increment when total discharge exceeded either QBKF (post-restoration) or QTOB (pre-restoration) were calculated to determine the fraction of flow volume that contacted the floodplain annually. To calculate the floodplain flow volumes, high frequency flow data (5-min or 15-min, depending on the site) were downloaded for each USGS gage. Flow data were filtered to only include flows exceeding QBKF and QTOB, as floodplain flow was calculated as any discharge in excess of QBKF and QTOB. For example, if the QBKF was 10 cm for the restored stream, any Q greater than 10 cm (e.g., 11 cm) was considered to have a flow that was in contact with the floodplain. Figure 2 illustrates the flow partitioning approach for storm events at Rocky Branch and Swift Creek.
Next, the cumulative volume of floodplain flow (VFLOODi) for each storm event (i) that exceeded QBKF or QTOB was calculated. The annual flow volume on the floodplain (VFLOOD) was calculated by summing the flow volumes (VFLOODi) for each storm event. Because of occasional gaps in the high frequency flow data, the total annual flow volume (VTOTAL) at each USGS gage was calculated from the daily mean flow measurements. The percentage of flow volume on the floodplain on an annual basis was then calculated as the ratio of VFLOOD to VTOTAL. For Rocky Branch, some of the high-frequency observations were missing during bankfull events so the event flow volume could not be calculated. The missing flow volumes were infilled by fitting a quadratic regression of daily maximum floodplain flow versus total floodplain flow volume for all storm events recorded at this gage (r2 = 0.74).

2.4. Nutrient Processing and Retention on the Floodplain

Mean total nitrogen (TN) concentrations (NMEAN) were calculated using measured water quality data to estimate TN loads delivered to each study reach. Water quality data were obtained from the City of Raleigh for Marsh Creek and Rocky Branch, from the City of Charlotte for Torrence Creek, from USGS for Swift Creek and from Duke University [18] for Sandy Creek. Overall site mean concentrations were used because infrequent data collection did not allow for the separation of baseflow and stormflow. However, this is a reasonable approach as previous research has shown similar TN concentration in baseflow and stormflow in urban areas of Maryland [19] and in Minnesota [20]. Overall site mean concentrations were multiplied by VTOTAL to obtain annual N loads (LTOTAL) delivered in kilograms (Equation (1)).
LTOTAL = VTOTAL × NMEAN
Not all flows exceeding QBKF will be treated by floodplain functions, as high flow events can overwhelm floodplain treatment zones, leading to minimal hydraulic retention times and treatment [12,21]. For this study, a floodplain treatment depth of 30 cm was used to estimate a treatment flow volume (VTREAT) (see Figure 3). The area of the available floodplain (FA) for the restored stream or for the stream reach at the USGS gage was measured using ArcGIS Desktop 10.5 software [22]. To calculate the available VTREAT, the assumed 30 cm treatment depth was multiplied by the FA (Equation (2)). Overbank flows with depths exceeding 30 cm on the floodplain were not included in the calculation of VTREAT. This treatment depth limitation follows the general methodology used to calculate nutrient removal for the CBP Protocol [23]. Thirty cm is the assumed maximum depth of water that could be retained in floodplain depressions and microtopographic storage and treated during overbank events. While this assumption may oversimplify the hydrologic and biogeochemical processes that occur during overbank flows and inter-event low flows, using 30 cm is conservative (with regard to treatment potential) as it is likely on the high end of the potential storage depth.
VTREAT = FA × 30 cm
The load of suspended and dissolved N in the water column that could be potentially treated (LTREAT) was calculated by multiplying the total annual nitrogen load by the percentage of flow volume that could potentially be treated on the floodplain (Equation (3)). The potential retention of total nitrogen (LRETAIN) on the floodplain was then calculated by multiplying the load subject to treatment by a treatment efficiency (EF) (Equation (4)). Twenty percent was used by Schueler and Stack [23] for the CBP Protocol and was implemented for this analysis for comparison purposes.
LTREAT = LTOTAL × VTREAT/VTOTAL
LRETAIN = LTREAT × EF

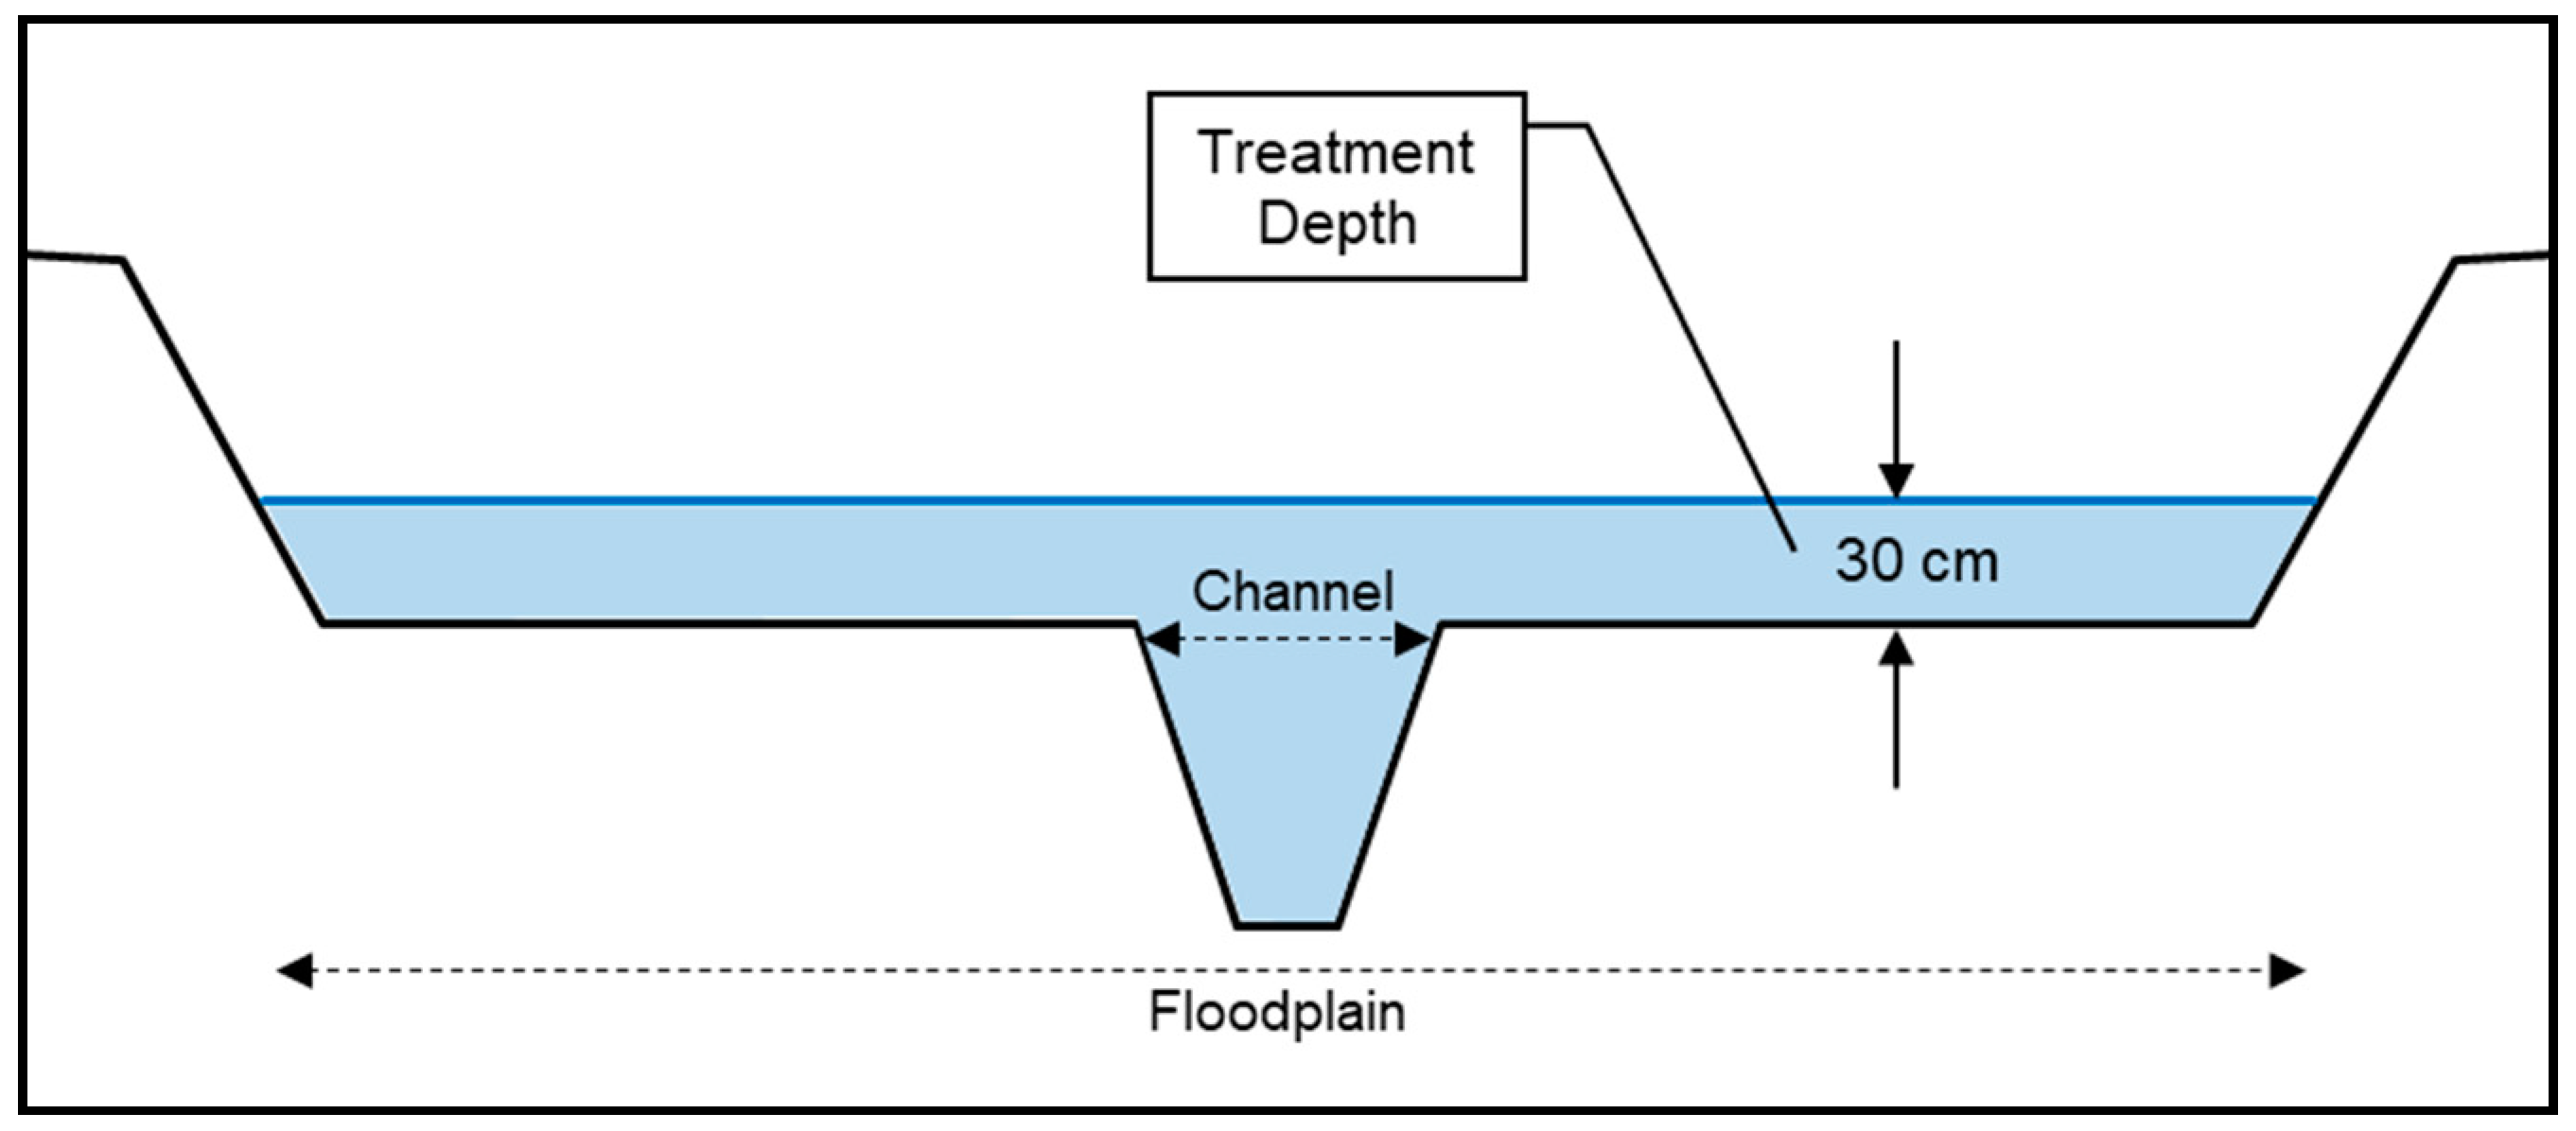
2.5. Treatment Depth and Treatment Sensitivity Analysis

The calculation of floodplain nitrogen treatment is dependent on the assumed 20% treatment efficiency and the floodplain treatment depth of 30 cm recommend in the CBP protocols. To better quantify the uncertainty associated with these parameters, a sensitivity analysis was conducted on nitrogen treatment efficiency and floodplain treatment depth. Overall nitrogen retention/removal was calculated for treatment efficiencies of 10 to 100% and treatment depth of 15 cm to 60 cm. In addition, the impact of reducing channel size (1/4 to 1/2 QBKF) to increase the frequency of overbank flow events on the floodplain was also evaluated.

3. Results and Discussion

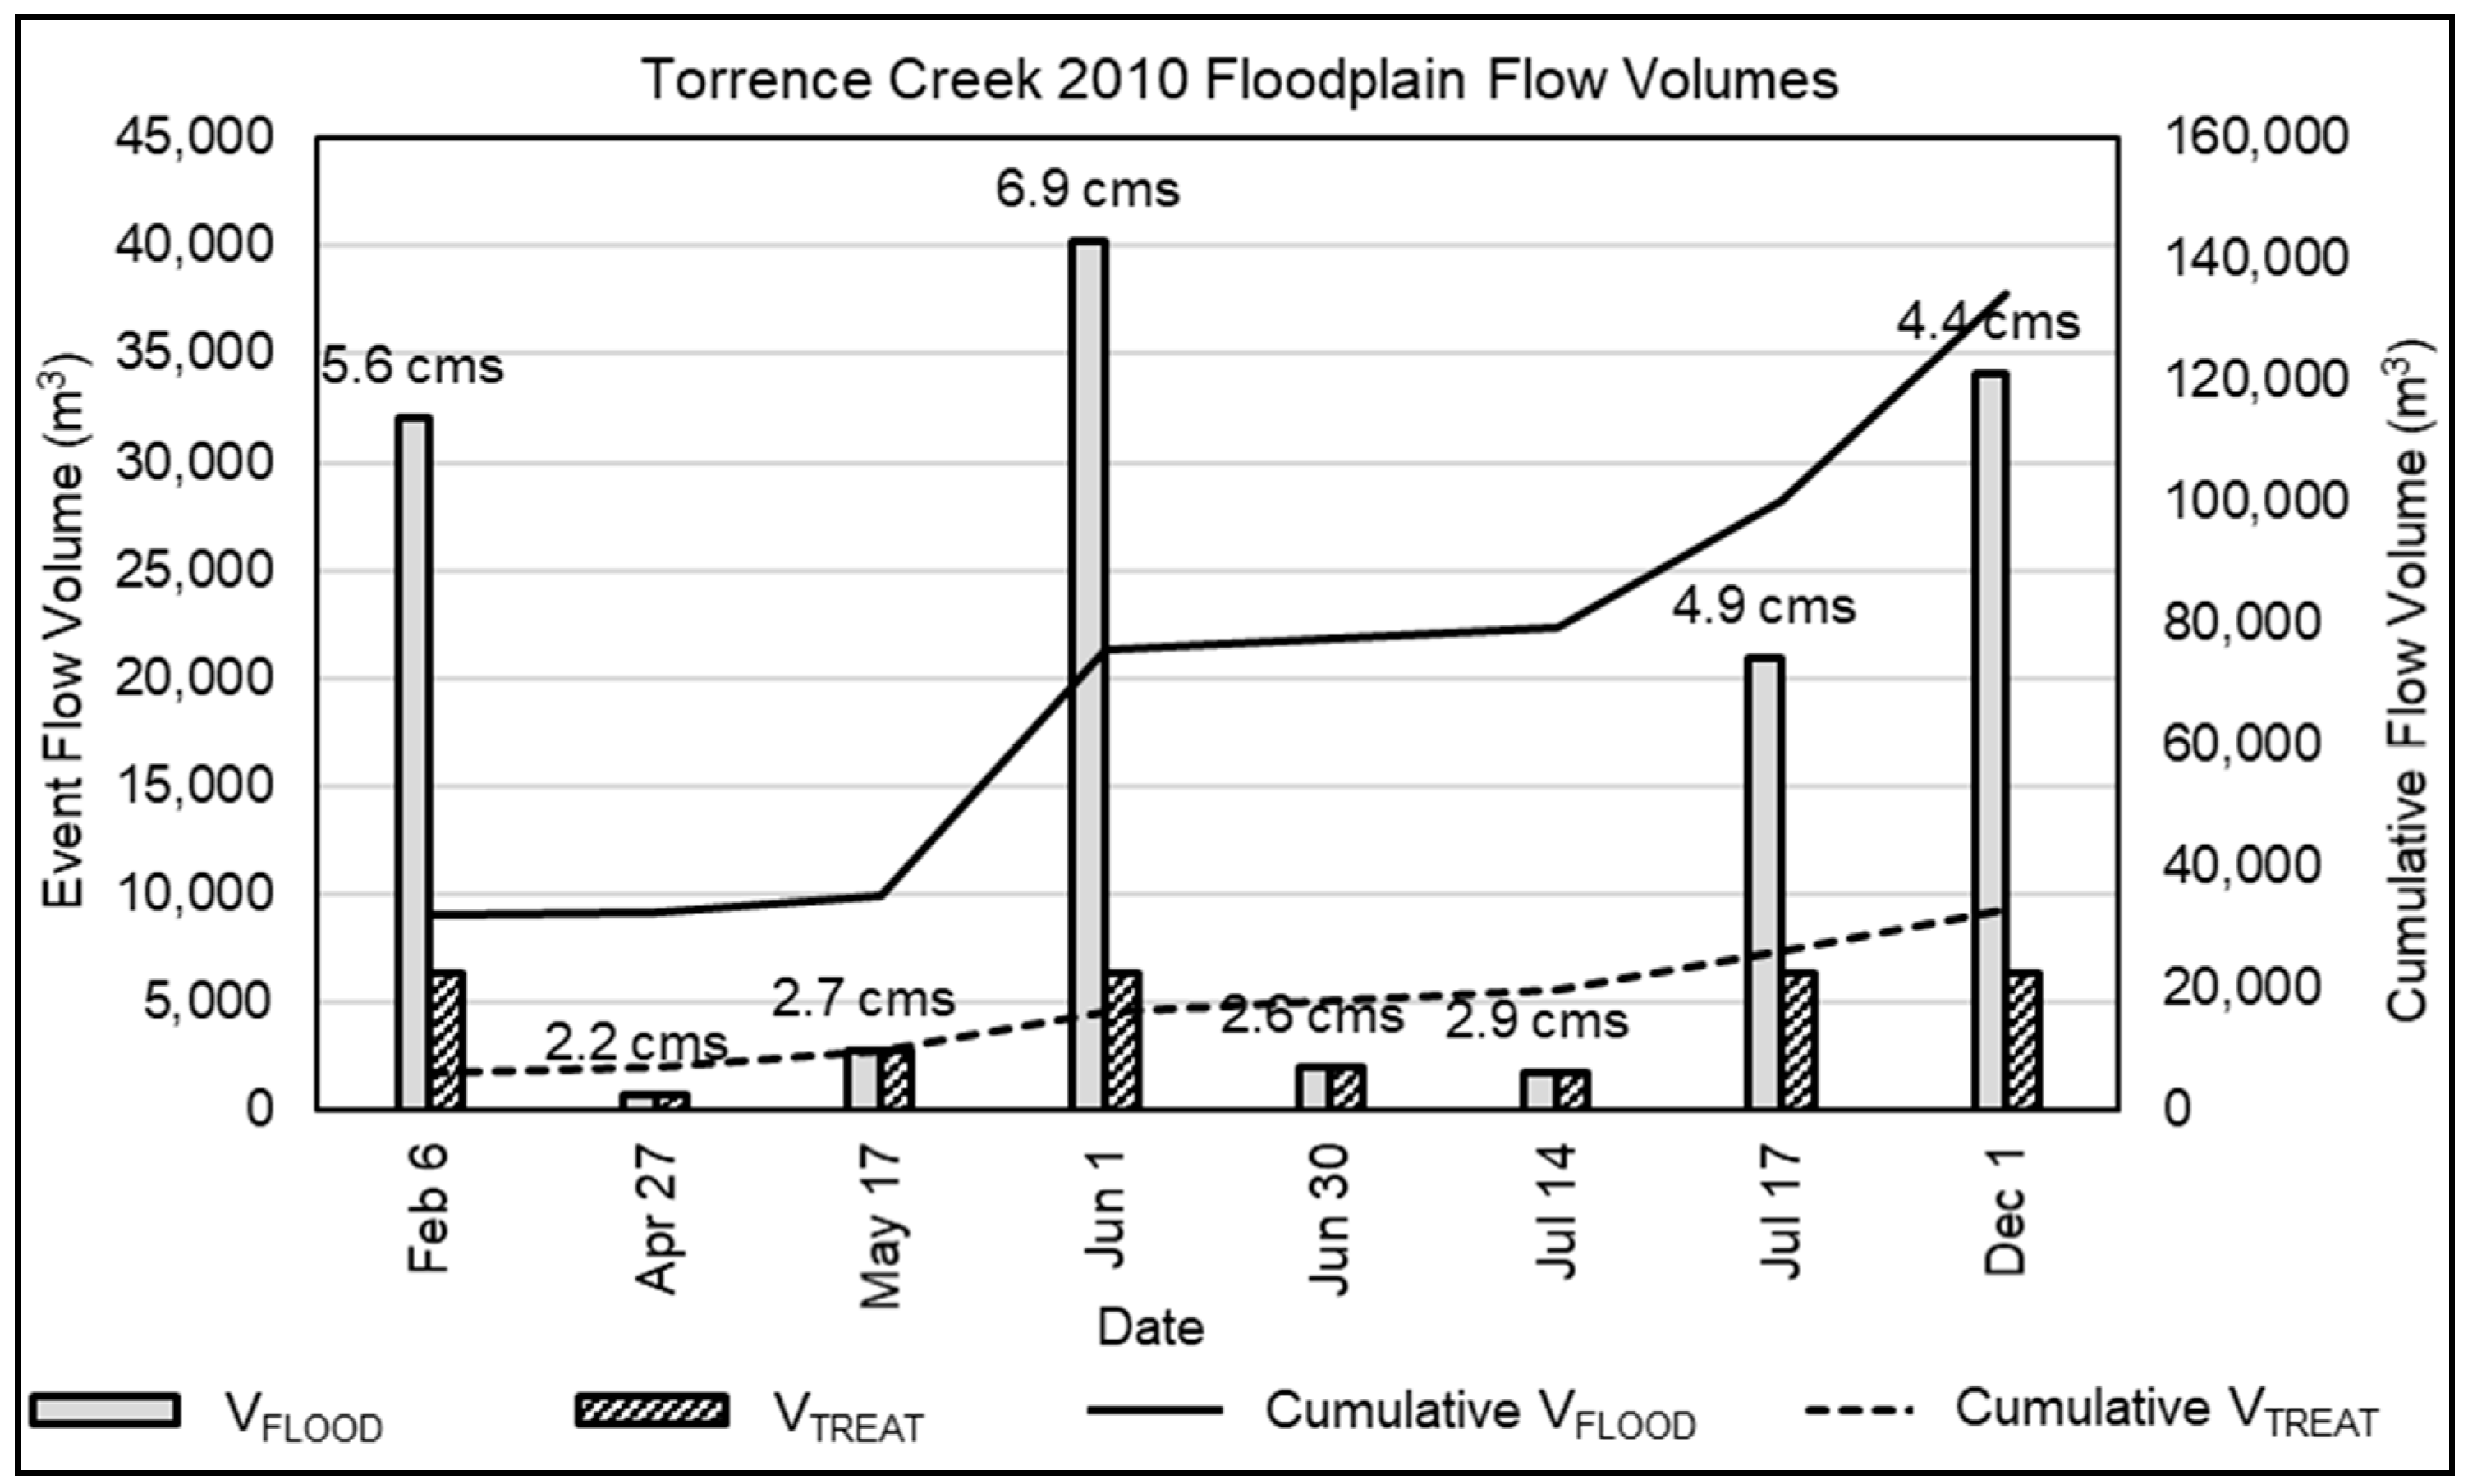
3.1. Annual Flow Volume

Watershed areas (WA), floodplain areas, floodplain to watershed ratios and available treatment volumes for each site are summarized in Table 2. Overall, the ratios of FA to WA were low, with only one site exceeding 1%; however, this was not correlated with the available VTREAT.
QBKF, QTOB, %VFLOOD, %VTREAT and the number of events inundating the floodplain annually are presented in Table 3. For the pre-restoration scenario, only Swift Creek experienced flood events exceeding QTOB during the ten-year period from 2008 to 2017. Post-restoration, the mean number of storm events that inundated the floodplain ranged from 4.6 at Swift Creek to 18.7 at Rocky Branch with an average of 12.1 events per year exceeding QBKF across all sites. These QBKF or greater events resulted in a mean of 11% of total annual flow being exposed to the floodplain with a range of 9.0% at Torrence Creek to 14.6% at Rocky Branch. These results were similar to an analysis of 5800 streamflow gages across the U.S. that noted floodplain flow volume ranged from 4% to 12.3% of overall annual flow volumes [24]. The range of annual %VTREAT was 1.0% at Swift Creek to 5.1% at Rocky Branch with a mean of 2.3%, which was a substantial decline from VFLOOD (11%). Overall, the average percentage of floodplain volume likely to receive treatment in a given year (VTREAT/VFLOOD) ranged from 13% at Swift Creek to 41% at Rocky Branch.
The relatively low VTREAT (1.0% to 5.1%) for these study sites is due to the majority of VFLOOD exceeding the floodplain treatment depth (30 cm); on average, only 25% of VFLOOD is potentially treated annually (Figure 4). This is the result of the majority of VFLOOD occurring during a few large overbank events each year as shown in Figure 4. On average, 90% of the VFLOOD occurred during about half the overbank events and 50% of VFLOOD occurred during two to three large events each year that far exceed the treatment capacity of the floodplain. Figure 5 illustrates an example of this for Torrence Creek in 2010. The majority of VFLOOD (95%) occurred in just four overbank events that all substantially exceeded VTREAT.
These results support previous research [12,13,21] showing that a few large flood events deliver the majority of the annual floodplain flow volume and N load, during which the retention/removal capacity of the floodplain is overwhelmed, and the floodplain acts primarily as a conveyance system. In the future, a trend towards even more overbank flow occurring during only a few storms is likely as intense rainfall events are projected to increase in the southeastern U.S. due to climate change [25].

3.2. N Retention on the Floodplain

The mean TN concentration for each site is included in Table 4. Nitrogen loads delivered to each site in VTREAT ranged from 50 to 180 kg/year (see Table 4); however, with the 20% treatment efficiency applied, the resulting N load retained (LRETAINED) ranged from 10 to 36 kg/year with an average of 22 kg/year for all five streams. This equates to a TN retention/removal rate of 0.2–0.4% at each site except Rocky Branch, which retained 1.0%. For most of the sites, this is equivalent to the change in the reduction from pre- to post-restoration conditions, as no overbank flow (thus no N load on the floodplain) was observed for four of the five sites for the pre-restoration scenario.
While hydrology was the primary driver of treatment potential, there was some uncertainty associated with other assumptions that impacted the N retention/removal estimates. The 20% treatment efficiency used in this study was based on the CBP Protocol [11,23] and is believed to be a conservative approach. However, a TN treatment efficiency of 20% for the floodplain may overestimate actual treatment of overbank flow on the floodplain because stormwater inflow from adjacent culverts may fill up any floodplain wetlands and depressional storage prior to overbank flow occurring, thus reducing the capacity of the floodplain to provide treatment during large flow events. In contrast, during lower volume, less intense overbank events the floodplain could potentially treat the majority of the floodplain flow.
There is a wide range of reported TN removal rates for wetlands. For example, the U.S. Environmental Protection Agency (US EPA) reported 28% removal efficiency for stormwater wetlands [26], while Lee et al. [27] documented 45% removal of TN. Most stream restoration projects do incorporate pocket wetlands on the floodplain; however, the entire floodplain does not function like a wetland. Therefore, reported higher treatment rates are not likely to be achieved.

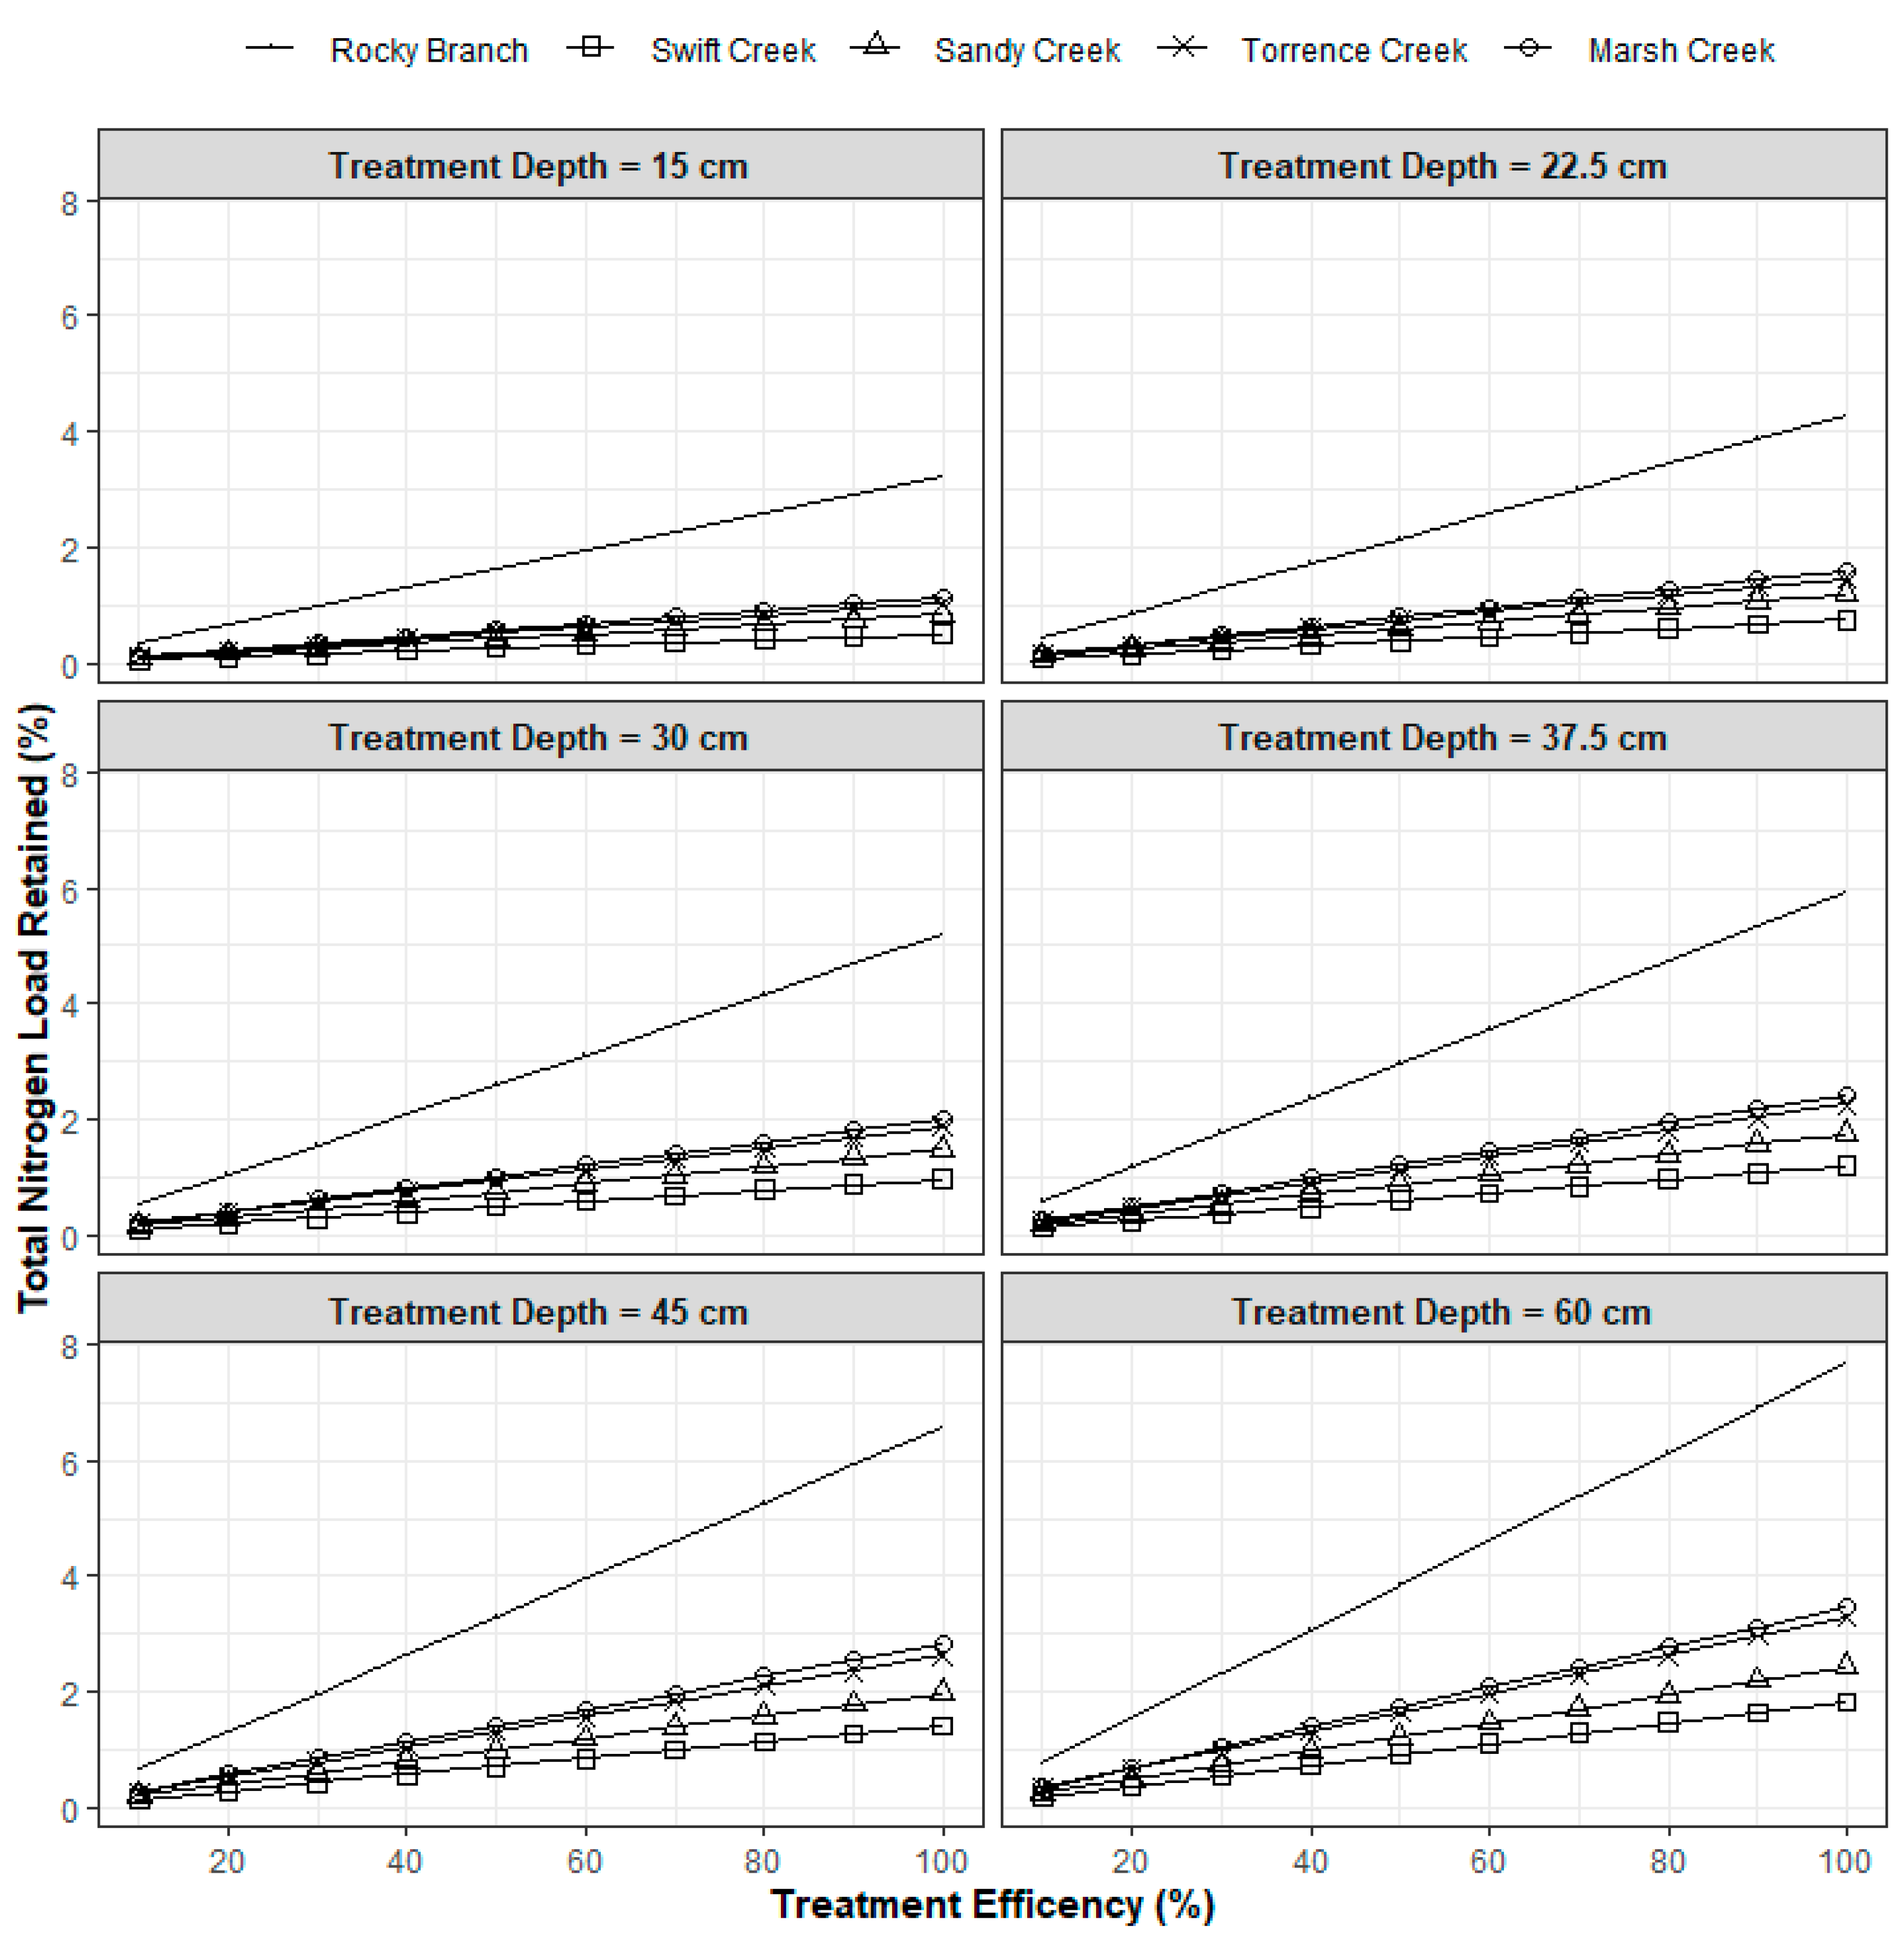
3.3. Sensitivity Analysis

The results of the sensitivity analysis for each stream are provided in Figure 6. These results clearly illustrate the importance of the hydrologic and hydraulic controls on floodplain treatment potential, as substantially increasing the treatment efficiency and treatment depth provides only a marginal increase in TN retention/removal. For example, doubling the treatment depth to 60 cm and assuming 100% treatment efficiency (both unlikely), would result in 2–3% TN retention/removal for four of the five sites.
The Rocky Branch floodplain produced the highest potential TN retention/removal rates (>7%) due to a small watershed size combined with high percent impervious cover (40%), which produces the highest annual rate of flows exceeding the QBKF. However, there is reason to doubt whether this level of treatment could be achieved given that the floodplain at Rocky Branch is fairly confined with limited storage volume. In reality, treatment depths may be lower than 30 cm, which would generally limit TN treatment to less than 1.5% (3–4% for Rocky Branch), even for a very high treatment efficiency (e.g., 80–90%). For more reasonable treatment efficiencies (e.g., <40%) and lower treatment depth (<30 cm), overall TN treatment would be less than 1% (<~1.5% for Rocky Branch).
Even if higher retention/removal rates are assumed, the sensitivity analysis shows that only a marginal increase in overall TN load could be achieved due to a majority of the flow occurring during baseflow and moderate discharge events (<QBKF). Therefore, the uncertainty associated with treatment efficiency has minimal impact on the low N retention/removal on the floodplain, which was similar to a recent study that reported TN retention/removal of 0.7% to 2.7% on floodplains [28]. Similarly, Craig et al. [29] reported that the greatest potential for nitrogen removal in restored streams occurs during low to moderate discharge, reinforcing the hypothesis that floodplain treatment through overbank flow is not a major contributor to overall TN removal.
Overall, this sensitivity analysis shows that even if a larger portion of the overbank flow is treated and a higher treatment efficiency is assumed, TN retention/removal on the floodplain is limited by hydrology and hydraulics because only a small fraction of the overall flow volume (and TN load) accessed the floodplain on an annual basis.
In addition to treatment depth and efficiency, channel size has an impact on the frequency of overbank flow events [30] and thereby the potential nitrogen treatment. If the five stream channels were 1/2 to 1/4 of the size of the QBKF, then nitrogen removal would increase by 37% to 275%, assuming a 20% treatment efficiency and a 30 cm treatment depth. However, this would still equate to less than 1% of the total N load retained/removed for three of the five streams. Total N retention/removal would be 1.2% for Marsh Creek and 2.3% Rocky Branch (see Figure 7). Despite a substantial increase in the number of overbank events, the treatment potential for these five streams is still limited by floodplain size since FA/WA is less than 1% for all except Rocky Branch. Filoso and Palmer [31] found that lowland streams that were converted to stream–wetland complexes that facilitate spillover of stream flow onto adjacent floodplains and wetlands were most effective, removing about 5% of the nitrogen inputs to the watershed. Targeting a smaller channel size combined with maximizing floodplain area and incorporating wetlands will help to enhance treatment.

3.4. Comparison to CBP Protocol and Limitations

For comparison to the CBP protocols for estimating nitrogen removal resulting from floodplain reconnection, Doll et al. [32] reported similar TN removal rates of 0.2% (versus 0.3% to 0.4% in this study) for both Sandy and Torrence Creeks using CBP Protocol 3 guidance [23]. The CBP protocols were also applied to a proposed stream restoration in northern Virginia with a similar FA/WA ratio (0.38). This analysis yielded an even lower removal rate of 0.04% [33]. These results indicate that no matter the protocol applied, using flood flows to quantify water quality benefits of stream restoration projects will indicate only marginal treatment value.
While beyond the scope of this study, there are other important factors that affect the treatment provided by floodplains during overbank events such as the nitrogen speciation in the stream. For example, if nitrate accounts for a majority of the overall TN, there may be a greater potential for removal via denitrification, but this will be limited by retention time. Alternatively, if organic nitrogen (ON) makes up most if the TN, then the potential for retention may be limited to particulate ON that accumulates in sediments on the floodplain. Van der Lee et al. [28] attributed the low removal rate they observed (0.7% to 2.7%) to N speciation; over 90% of the TN was in the form of dissolved nitrate. Floodplain denitrification was limited due to a short duration of floodplain inundation and low hydraulic retention time. In addition, some N removal may only be temporary; herbaceous plant uptake will only sequester N during the growing season [8] and some of the retained N could remobilize during subsequent events. Another consideration for potential floodplain treatment is the ambient TN concentration in the stream. The observed site mean TN concentrations in this study ranged from 0.56 to 1.83 mg/L (mean TN concentrations were less than 0.85 mg/L at four of five sites). With the exception of Rocky Branch, these values are near background concentrations for reference streams [34,35]. While there is temporal variation in concentration, mean TN concentrations near typical background levels may indicate these concentrations are approaching irreducible levels and there is limited potential for TN retention/removal [12]. Nutrient crediting protocols for restoration should consider ambient conditions where possible, and reduce the credit if there is limited potential for further nutrient removal.

4. Conclusions

Overall, the results of this study indicate that the potential for nitrogen treatment on the floodplain during overbank flow events, as the result of stream restoration, is limited in the urban environment because of hydrologic regimes that limit retention time and route flow though the floodplain with minimal contact time. Some of the main findings include:
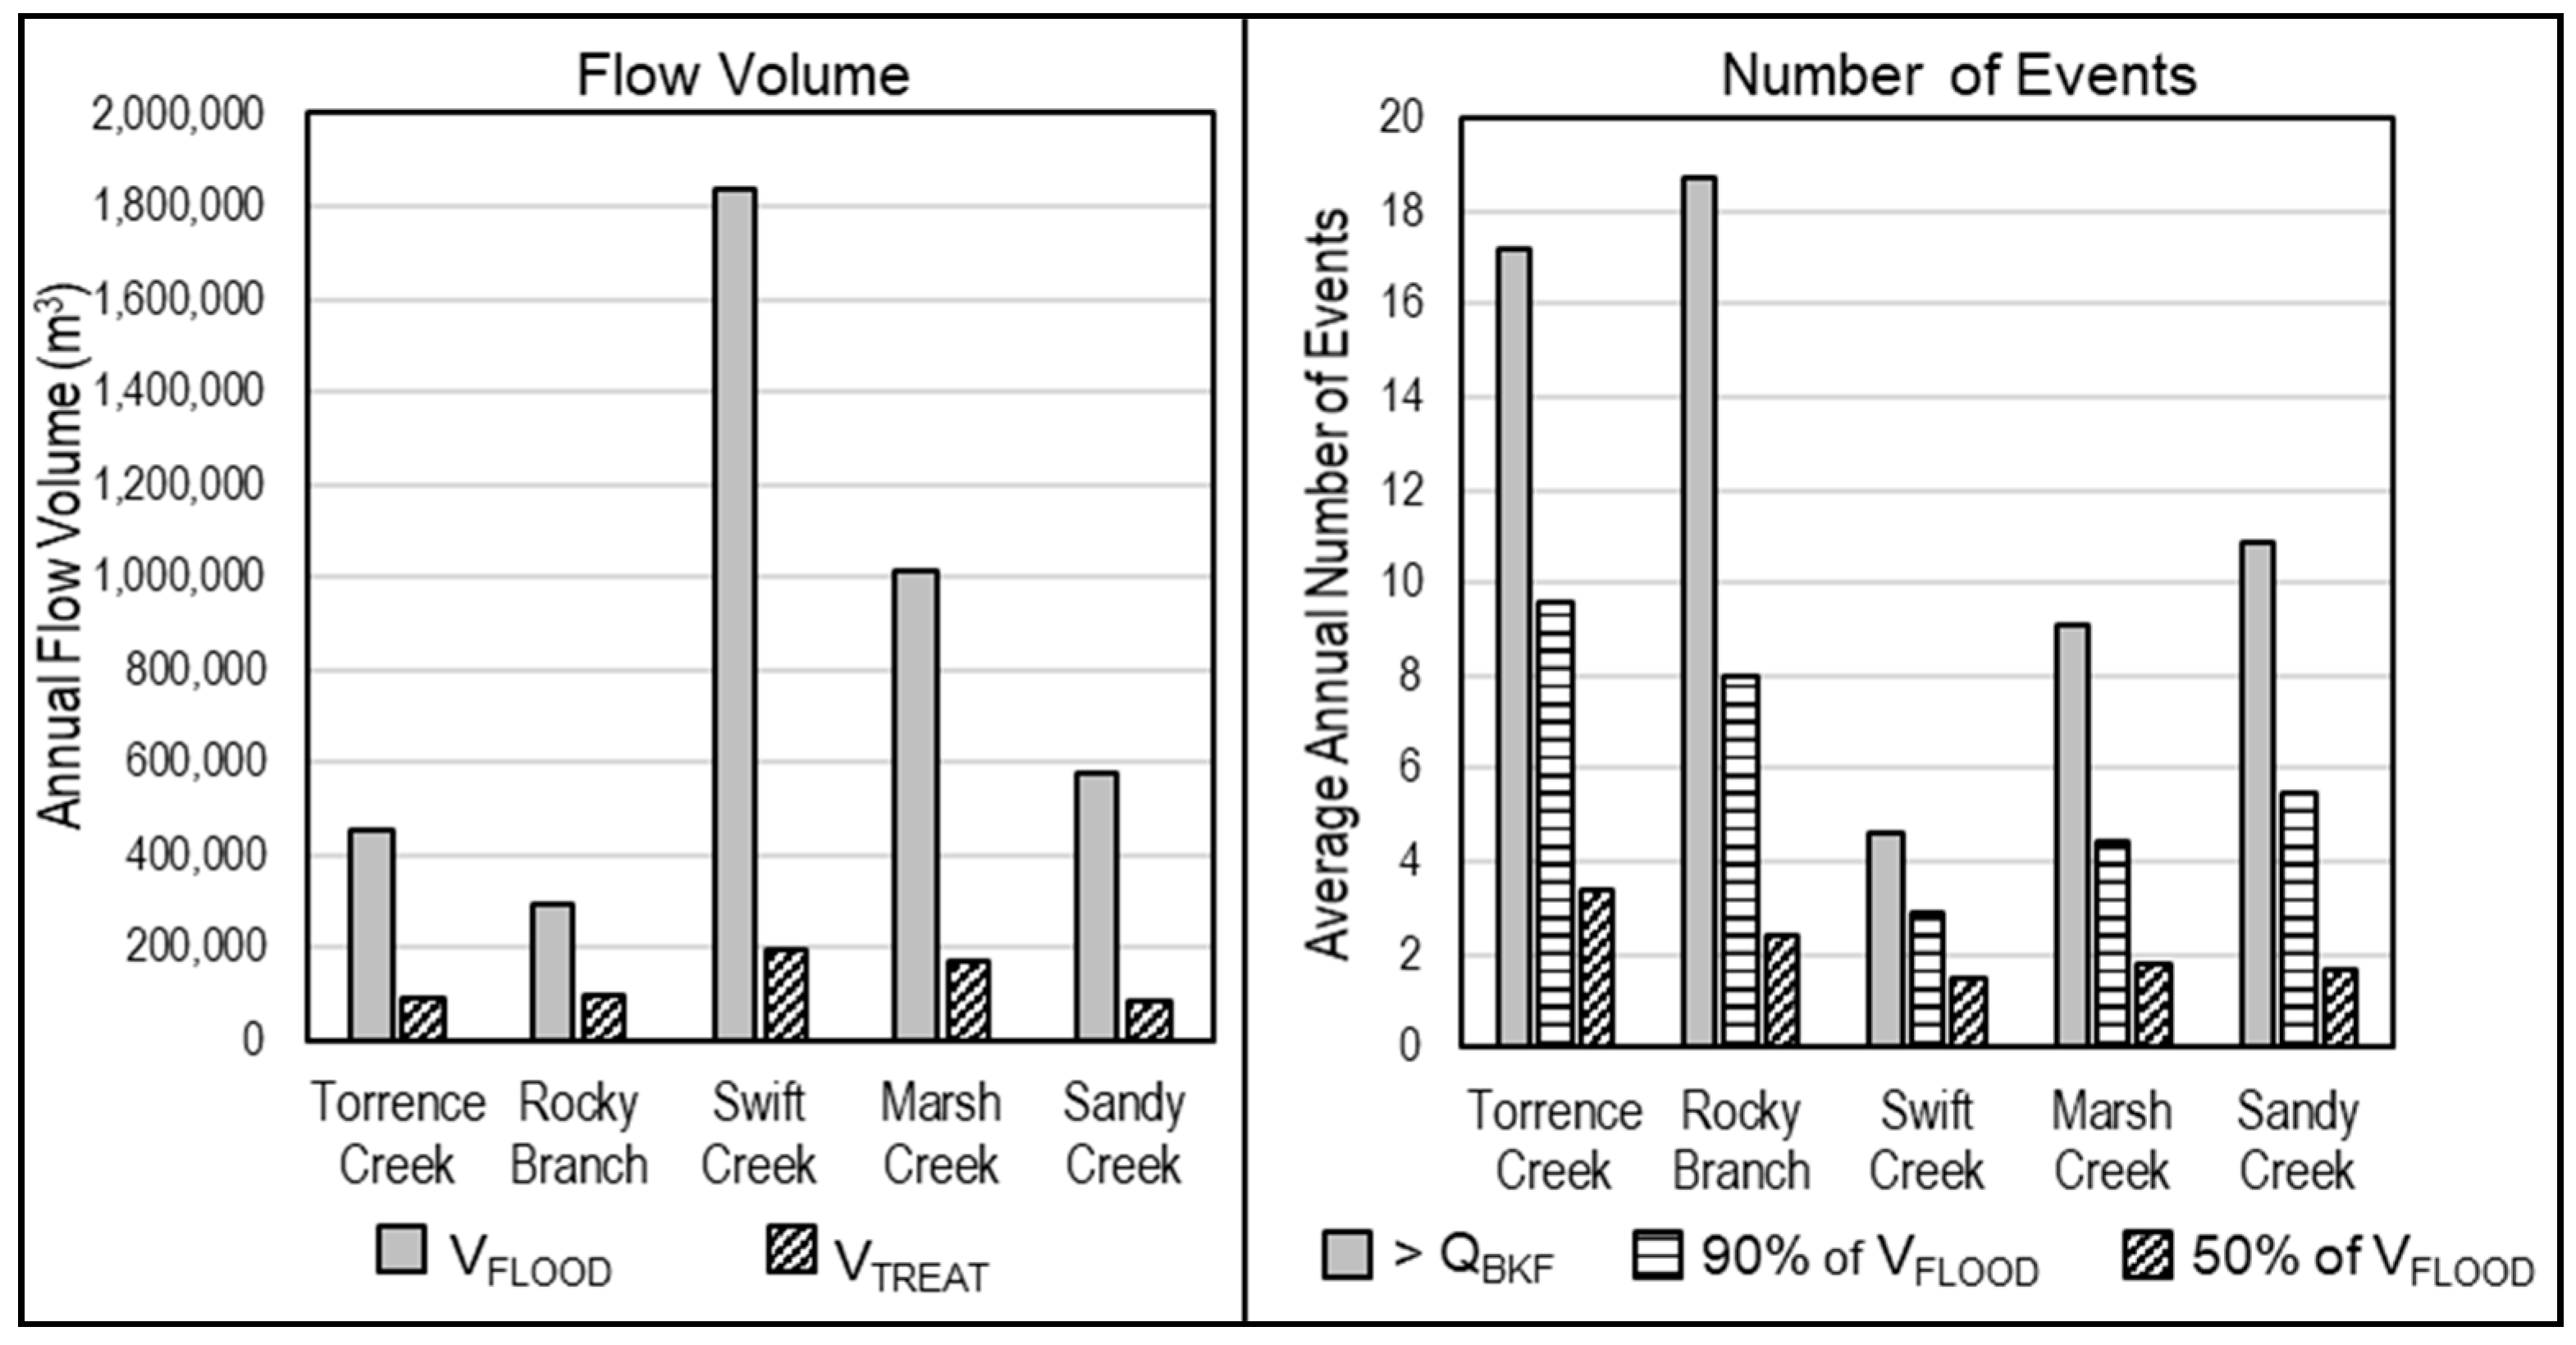
  • On average, 11% of the total flow volume accessed the floodplain;
  • A large majority of this volume occurred during only a few large events, which largely overwhelm the treatment potential of the floodplain. In total, 90% of the floodplain flow occurred during half of all overbank events, while 50% of overbank flow occurred in only two to three events each year;
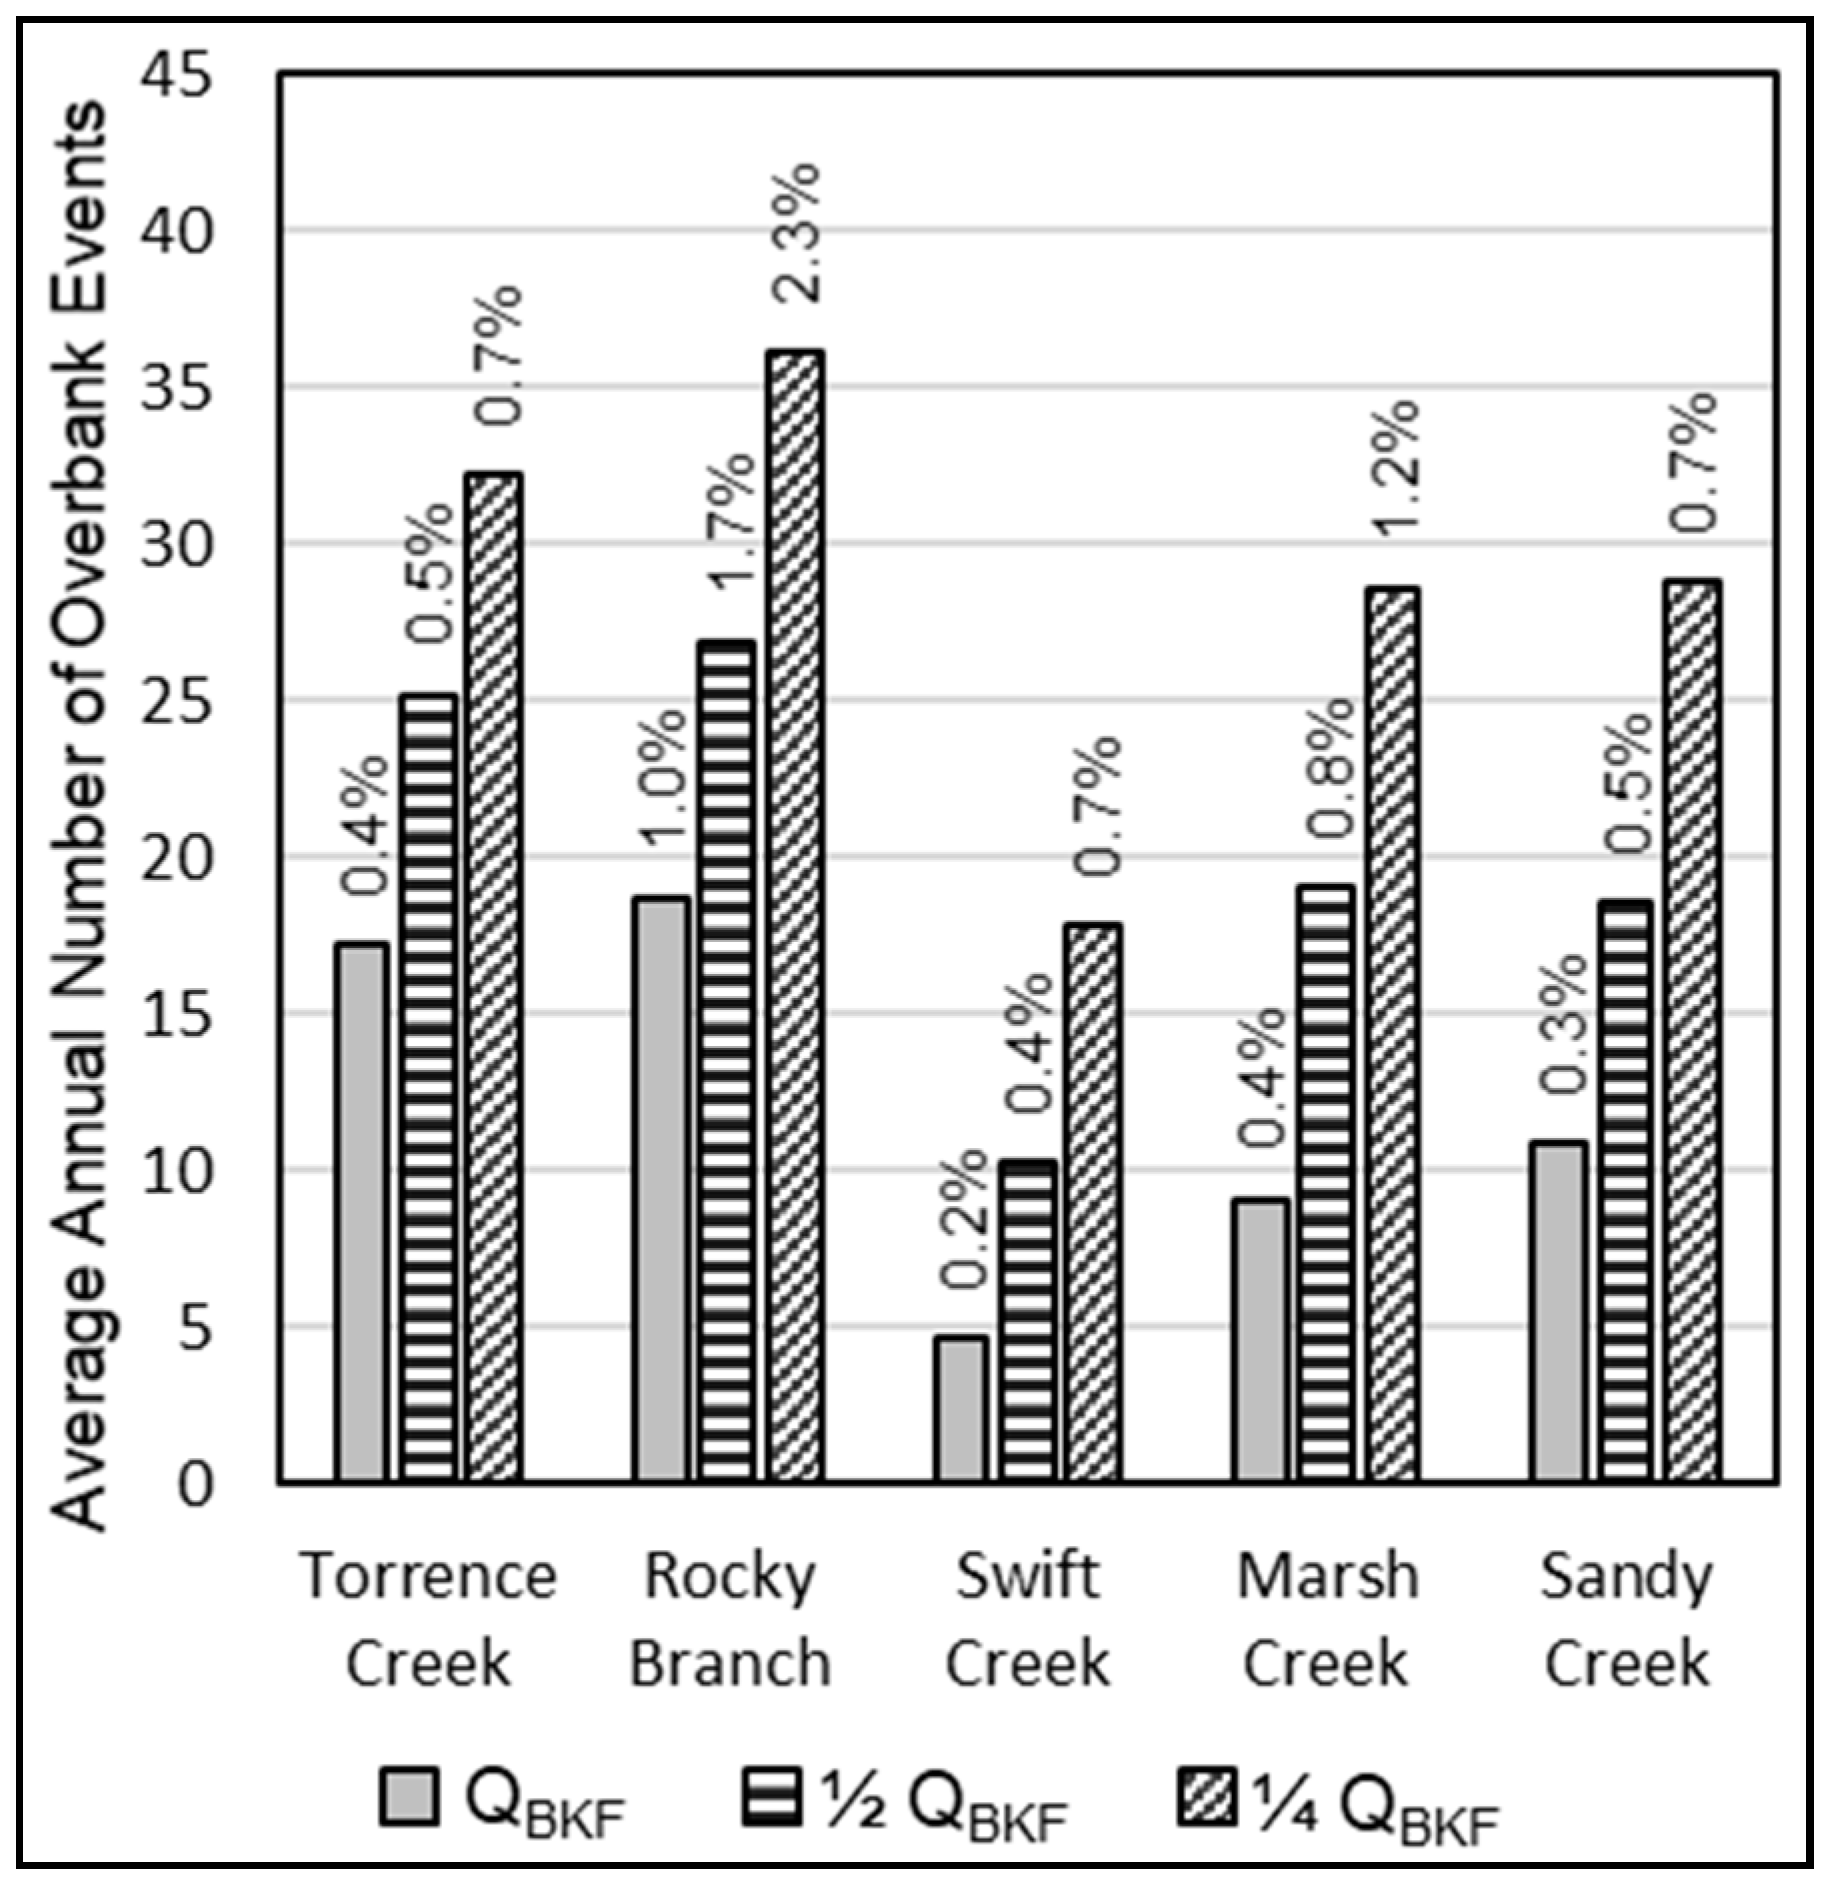
  • Using flow separation analysis, TN retention/removal ranged from 0.2% to 1.0% across these five sites;
  • Sensitivity analysis showed that, even if treatment efficiency was high (90%) and treatment depth was doubled to 60 cm, TN retention/removal would still be less than 3% for all but one site.
Rather than focusing on N retention/removal on the floodplain, more substantial benefits gained from floodplain reconnection are likely related to floodplain treatment of surface flow from upland or stormwater outflows during smaller storm events (<QBKF), decreased streambank erosion, deposition of sediment and sediment-bound nutrients (N and P) on the floodplain and other important ecosystem services such wildlife habitat and flood attenuation [36]. Recent research indicates the deposition and retention of sediment-bound nutrients during overbank events can lead to substantial nutrient retention on the floodplain (20–30% of the floodplain sediment load) [37]. In addition, floodplain reconnection raises groundwater levels in riparian areas, which creates favorable conditions for denitrification [29]. Therefore, the CBP and other crediting entities should focus their efforts on assigning credit to reducing streambank and streambed erosion, N treatment in the hyporheic zone and sediment deposition on the floodplain. In addition, stream restoration efforts that apply floodplain reconnection should maximize the floodplain area, include floodplain depressions and establish dense vegetation. Targeting a smaller channel size (<QBKF) to ensure frequent floodplain inundation during small to moderate flows can also enhance the treatment potential [29]. Overall, while the literature indicates that restored floodplains can treat nitrogen, evaluating only overbank events may lead to undervaluing stream restoration, meaning that this is not an appropriate method for gauging overall treatment potential.

Author Contributions

Conceptualization, B.A.D.; methodology, B.A.D., J.J.K.-F., J.L.P., and J.P.J. and N.G.N.; validation and formal analysis, B.A.D., N.G.N. J.J.K.-F. and J.L.P.; data curation, B.A.D.; writing—original draft preparation, B.A.D., J.J.K.-F, and J.L.P.; writing—review and editing, B.A.D., J.J.K.-F., J.L.P., J.P.J., and N.G.N.; supervision, project administration and funding acquisition, B.A.D. All authors have read and agreed to the published version of the manuscript.

Funding

This research was funded by a U.S. Environmental Protection Agency Section 319 Non-Point Source Pollution Control Grant administered by the North Carolina Department of Environmental Quality, Division of Water Resources, contract number 7380. Any opinions, findings, and conclusions or recommendations expressed in this publication are those of the author(s) and do not necessarily reflect the views of the US EPA.

Acknowledgments

The authors acknowledge Curt Richardson and Neal Flanagan from Duke University for providing permit documents, design plans, reports and water quality and flow data for Sandy Creek; the City of Raleigh for providing water quality data for Marsh Creek and Rocky Branch; and the City of Charlotte for providing pre-restoration data, design plans and water quality data for Torrence Creek.

Conflicts of Interest

The authors declare no conflict of interest. The funders had no role in the design of the study; in the collection, analyses, or interpretation of data; in the writing of the manuscript, or in the decision to publish the results.

References

  1. Bernhardt, E.S.; Palmer, M.A.; Allan, J.D.; Alexander, G.; Barnas, K.; Brooks, S.; Carr, J.; Clayton, S.; Dahm, C.; Follstad-Shah, J.; et al. Synthesizing U.S. River Restoration Efforts. Science (80-) 2005, 308, 636–637. [Google Scholar] [CrossRef] [PubMed]
  2. Thompson, J.; Pelc, C.E.; Brogan, W.R.; Jordan, T.E. The multiscale effects of stream restoration on water quality. Ecol. Eng. 2018, 124, 7–18. [Google Scholar] [CrossRef]
  3. McMillan, S.K.; Noe, G.B. Increasing floodplain connectivity through urban stream restoration increases nutrient and sediment retention. Ecol. Eng. 2017, 108, 284–295. [Google Scholar] [CrossRef]
  4. Van Houtven, G.; Loomis, R.; Casey, S.; Beach, R.H.; Baker, J.S. Nutrient Credit Trading for the Chesapeake Bay: An Economic Study; Chesepeake Bay Commision, RTI International: Research Triange Park, NC, USA, 2012. [Google Scholar]
  5. NC DEQ NC DEQ: Tar-Pamlico Nutrient Strategy. North Carolina Department of Environmental Quality. Available online: https://deq.nc.gov/about/divisions/water-resources/planning/nonpoint-source-management/nutrient-strategies/tar-pamlico#stormwater-and-nutrient-offsets (accessed on 23 April 2020).
  6. Kaushal, S.S.; Groffman, P.M.; Mayer, P.M.; Striz, E.; Gold, A.J. Effects of stream restoration on denitrification in an urbanizing watershed. Ecol. Appl. 2008, 18, 789–804. [Google Scholar] [CrossRef] [PubMed] [Green Version]
  7. Lammers, R.W.; Bledsoe, B.P. What role does stream restoration play in nutrient management? Crit. Rev. Environ. Sci. Technol. 2017, 47, 335–371. [Google Scholar] [CrossRef]
  8. Reddy, K.R.; DeLaune, R.D. Biogeochemistry of Wetlands: Science and Applications; CRC Press: Boca Raton, FL, USA, 2008; ISBN 0203491459. [Google Scholar]
  9. Mitsch, W.J.; Gosselink, J.G. Wetlands, 5th ed.; John Wiley & Sons: Hoboken, NJ, USA, 2015; ISBN 1118676823. [Google Scholar]
  10. Verhoeven, J.T.A.; Arheimer, B.; Yin, C.; Hefting, M.M. Regional and global concerns over wetlands and water quality. Trends Ecol. Evol. 2006, 21, 96–103. [Google Scholar] [CrossRef] [PubMed]
  11. Jordan, T.E. Wetland Restoration and Creation Best Management Practice (Agricultural). In Definition of Nutrient and Sediment Reduction Efficiencies for Use in Calibration of the Phase 5.0 Chesapeake Bay Program Watershed Model; Smithsonian Environmental Research Center: Edgewater, MD, USA, 2007. [Google Scholar]
  12. Kadlec, R.H.; Wallace, S.D. Treatment Wetlands, 2nd ed.; CRC Press: Boca Raton, FL, USA, 2009; ISBN 9781566705264. [Google Scholar]
  13. Kovacic, D.A.; David, M.B.; Gentry, L.E.; Starks, K.M.; Cooke, R.A. Effectiveness of Constructed Wetlands in Reducing Nitrogen and Phosphorus Export from Agricultural Tile Drainage. J. Environ. Qual. 2000, 29, 1262–1274. [Google Scholar] [CrossRef] [Green Version]
  14. Stack, B. Email message to first author. 5 February 2020. [Google Scholar]
  15. Doll, B.A.; Wise-Frederick, D.E.; Buckner, C.M.; Wilkerson, S.D.; Harman, W.A.; Smith, R.E.; Spooner, J. Hydraulic geometry relationships for urban streams throughout the Piedmont of North Carolina. J. Am. Water Resour. Assoc. 2002, 38, 641–651. [Google Scholar] [CrossRef]
  16. NCFMP. North Carolina Flood Risk Information System. North Carolina Floodplain Mapping Program. Available online: https://fris.nc.gov/fris/Home.aspx?ST=NC (accessed on 1 July 2018).
  17. USACE. HEC-RAS 5.0; USACE Institute for Water Resources Hydrologic Engineering Center: Davis, CA, USA, 2016. [Google Scholar]
  18. Richardson, C.J.; Flanagan, N.E.; Ho, M.; Pahl, J.W. Integrated stream and wetland restoration: A watershed approach to improved water quality on the landscape. Ecol. Eng. 2011, 37, 25–39. [Google Scholar] [CrossRef]
  19. Belt, K.T.; Stack, B.; Pouyat, R.; Burgess, K.; Groffman, P.M.; Frost, W.; Kaushal, S.; Hager, G. Ultra-urban Baseflow and Stormflow Concentrations and Fluxes in a Watershed Undergoing Restoration. In Proceedings of the Water Environment Federation 2012 (WEFTEC), New Orleans, LA, USA, 29 September–3 October 2012. [Google Scholar]
  20. Janke, B.D.; Finlay, J.C.; Hobbie, S.E.; Baker, L.A.; Sterner, R.W.; Nidzgorski, D.; Wilson, B.N. Contrasting influences of stormflow and baseflow pathways on nitrogen and phosphorus export from an urban watershed. Biogeochemistry 2014, 121, 209–228. [Google Scholar] [CrossRef]
  21. Jordan, T.E.; Whigham, D.F.; Hofmockel, K.H.; Pittek, M.A. Nutrient and sediment removal by a restored wetland receiving agricultural runoff. J. Environ. Qual. 2003, 32, 1534–1547. [Google Scholar] [CrossRef] [PubMed]
  22. ArcGIS Desktop: Release 10; Environmental Systems Research Institute: Redlands, CA, USA, 2016.
  23. Schueler, T.; Stack, B. Recommendations of the Expert Panel to Define Removal Rates for Individual Stream Restoration Projects; Chesapeake Bay Program: Annapolis, MD, USA, 2013. [Google Scholar]
  24. Scott, D.T.; Gomez-Velez, J.D.; Jones, C.N.; Harvey, J.W. Floodplain inundation spectrum across the United States. Nat. Commun. 2019, 10, 5194. [Google Scholar] [CrossRef] [PubMed]
  25. Walsh, J.; Wuebbles, D.; Hayhoe, K.; Kossin, J.; Kunkel, K.; Stephens, G.; Thorne, P.; Vose, R.; Wehner, M.; Willis, J.; et al. Our Changing Climate. Climate Change Impacts in the United States: The Third National Climate Assessment; PDF Revised: Washington, DC, USA, 2014. [Google Scholar]
  26. US EPA. Stormwater Technology Fact Sheet: Stormwater Wetlands; EPA: Washington, DC, USA, 1999. [Google Scholar]
  27. Lee, C.G.; Fletcher, T.D.; Sun, G. Nitrogen removal in constructed wetland systems. Eng. Life Sci. 2009, 9, 11–22. [Google Scholar] [CrossRef]
  28. Van der Lee, G.E.M.; Olde Venterink, H.; Asselman, N.E.M. Nutrient retention in floodplains of the Rhine distributaries in The Netherlands. River Res. Appl. 2004, 20, 315–325. [Google Scholar] [CrossRef]
  29. Craig, L.S.; Palmer, M.A.; Richardson, D.C.; Filoso, S.; Bernhardt, E.S.; Bledsoe, B.P.; Doyle, M.W.; Groffman, P.M.; Hassett, B.A.; Kaushal, S.S.; et al. Stream restoration strategies for reducing river nitrogen loads. Front. Ecol. Environ. 2008, 6, 529–538. [Google Scholar] [CrossRef] [Green Version]
  30. Hammersmark, C.T.; Rains, M.C.; Mount, J.F. Quantifying the hydrological effects of stream restoration in a montane meadow, northern California, USA. River Res. Appl. 2008, 24, 735–753. [Google Scholar] [CrossRef]
  31. Filoso, S.; Palmer, M.A. Assessing stream restoration effectiveness at reducing nitrogen export to downstream waters. Ecol. Appl. 2011, 21, 1989–2006. [Google Scholar] [CrossRef] [PubMed]
  32. Doll, B.A.; Johnson, J.P.; Page, J.; Line, D.E. Evaluation of Nutrient Reduction Crediting Strategies for Stream Restoration; NC State University, Bio & Ag Engineering Dept.: Raleigh, NC, USA, 2018. [Google Scholar]
  33. Beisch, B.; Forasté, A. CBP Protocols to Define Removal Rates for Individual Stream Restoration Projects; Williamsburg Environmental Group: Richmond, VA, USA, 2013. [Google Scholar]
  34. USGS. The Quality of Our Nation’s Waters; Nutrients and Pesticides; U.S. Geological Survey: Reston, VA, USA, 1999.
  35. USGS. The Quality of Our Nation’s Waters—Nutrients in the Nation’s Streams and Groundwater; U.S. Geological Survey: Reston, VA, USA, 2010.
  36. Opperman, J.J.; Moyle, P.B.; Larsen, E.W.; Florsheim, J.L.; Manfree, A.D. Floodplains: Processes and Management for Ecosystem Services; University of California Press: Berkeley, CA, USA, 2017; ISBN 9780520294103. [Google Scholar]
  37. Ahilan, S.; Guan, M.; Sleigh, A.; Wright, N.; Chang, H. The influence of floodplain restoration on flow and sediment dynamics in an urban river. J. Flood Risk Manag. 2018, 11, S986–S1001. [Google Scholar] [CrossRef]
Figure 1. USGS gage study site locations.
Water 12 01568 g001
Figure 2. Hydrographs illustrating the flow partitioning approach for storm events at Rocky Branch in June of 2008 and Swift Creek in September 2008.
Water 12 01568 g002
Figure 3. Conceptualized floodplain treatment volume with 30 cm of flow depth.
Water 12 01568 g003
Figure 4. Comparison of the average annual floodplain flow volume (VFLOOD) to the average annual floodplain volume that could potentially be treated (VTREAT) (left) and a comparison of the number of bankfull events to the number of events in which 50% and 90% of the total VFLOOD occurs (right).
Water 12 01568 g004
Figure 5. Cumulative and event volume for Torrence Creek in 2010. The maximum discharge for each event is also shown.
Water 12 01568 g005
Figure 6. Comparison of percent total nitrogen (TN) retention/removal estimates based on a range of treatment efficiencies and treatment depths.
Water 12 01568 g006
Figure 7. Average annual number of overbank events as a function of channel size. The percentages shown correspond to the total N retention/removal based on 20% treatment efficiency and 30 cm treatment depth.
Water 12 01568 g007
Table 1. Basic watershed and channel characteristics for five U.S. Geological Survey (USGS) stream gages analyzed for floodplain flow frequency and potential nutrient treatment.
StreamLocationWatershed Area (km2)Percent ImperviousChannel Width (m) *Pre-Restoration BHR **USGS Station Number
Marsh CreekRaleigh, NC, USA17.725%13.12.00208732885
Rocky BranchRaleigh, NC, USA2.540%7.13.00208735012
Sandy CreekDurham, NC, USA4.517%7.33.20209722970
Swift CreekApex, NC, USA54.416%19.11.602087580
Torrence CreekCharlotte, NC, USA9.316%8.11.90214265808
* Top of bank channel width prior to restoration, ** bank height ratio (BHR) = low bank height/max bankfull depth. Post-restoration BHR is equal to one for all sites.
Table 2. Post-restoration floodplain area, floodplain area/watershed area ratio, and VTREAT summary.
StreamWatershed Area (km2)Floodplain Area (km2)Floodplain Area/Watershed AreaAvailable VTREAT (m3)
Marsh Creek17.70.070.4%20,969
Rocky Branch2.50.031.3%10,361
Sandy Creek4.50.030.7%9990
Swift Creek54.40.170.3%50,942
Torrence Creek9.30.020.2%6414
Mean17.70.060.6%19,735
Table 3. Summary of the average annual number of storm events resulting in floodplain flow and the percent of the average annual total flow volume that is exposed to and potentially treated by the floodplain from 2008–2017. Bracketed numbers are the ranges of annual values.
StreamQTOB 1 (cm)Events > QTOBQBKF 2 (cm)Events > QBKF% VFLOOD (%)% VTREAT (%)VTREAT/VFLOOD (%)
Marsh Creek65.108.59.111.92.022
(5–15)(3.1–25)(1.2–3.0)(7–38)
Rocky Branch9.503.718.714.65.141
(14–23)(6.6–25)(3.3–7.0)(18–72)
Sandy Creek3204.210.910.11.527
(6–16)(1.1–21)(0.7–2.2)(9–69)
Swift Creek42.52.318.74.69.01.013
(2–8)(4.4–14)(0.6–1.4)(4.3–23)
Torrence Creek10.602.017.29.41.923
(8–23)(5.2–23)(1.0–2.8)(12–44)
Mean31.90.57.412.111%2.3%25%
1QTOB represents flows that overtopped the channel prior to restoration, 2 QBKF represents flows that overtop the bankfull channel post restoration.
Table 4. Summary of average annual floodplain nitrogen retention by site. Bracketed numbers are the range in annual values.
StreamMean TN (mg/L)LTOTAL (kg/year)LFLOOD (kg/year)LTREAT (kg/year)LRETAIN (kg/year)% N Retained (%)
Marsh Creek0.786680791135270.4
(5132–8486)(227–1602)(87–231)(17–46)(0.2–0.6)
Rocky Branch1.833516531180361.0
(2820–4525)(198–1121)(100–232)(20–46)(0.7–1.4)
Sandy Creek0.84458148368140.3
(2691–7440)(35–1039)(23–114)(5–23)(0.1–0.4)
Swift Creek0.6211,7201102118240.2
(6976–16,960)(348–2123)(61–214)(12–43)(0.1–0.3)
Torrence Creek0.56261225550100.4
(1892–3417)(101–623)(20–74)(3.9–15)(0.2–0.6)
Mean0.925822632110220.5%

