Estimation of Flood Travel Time in River Network of the Middle Yellow River, China


Abstract
1. Introduction
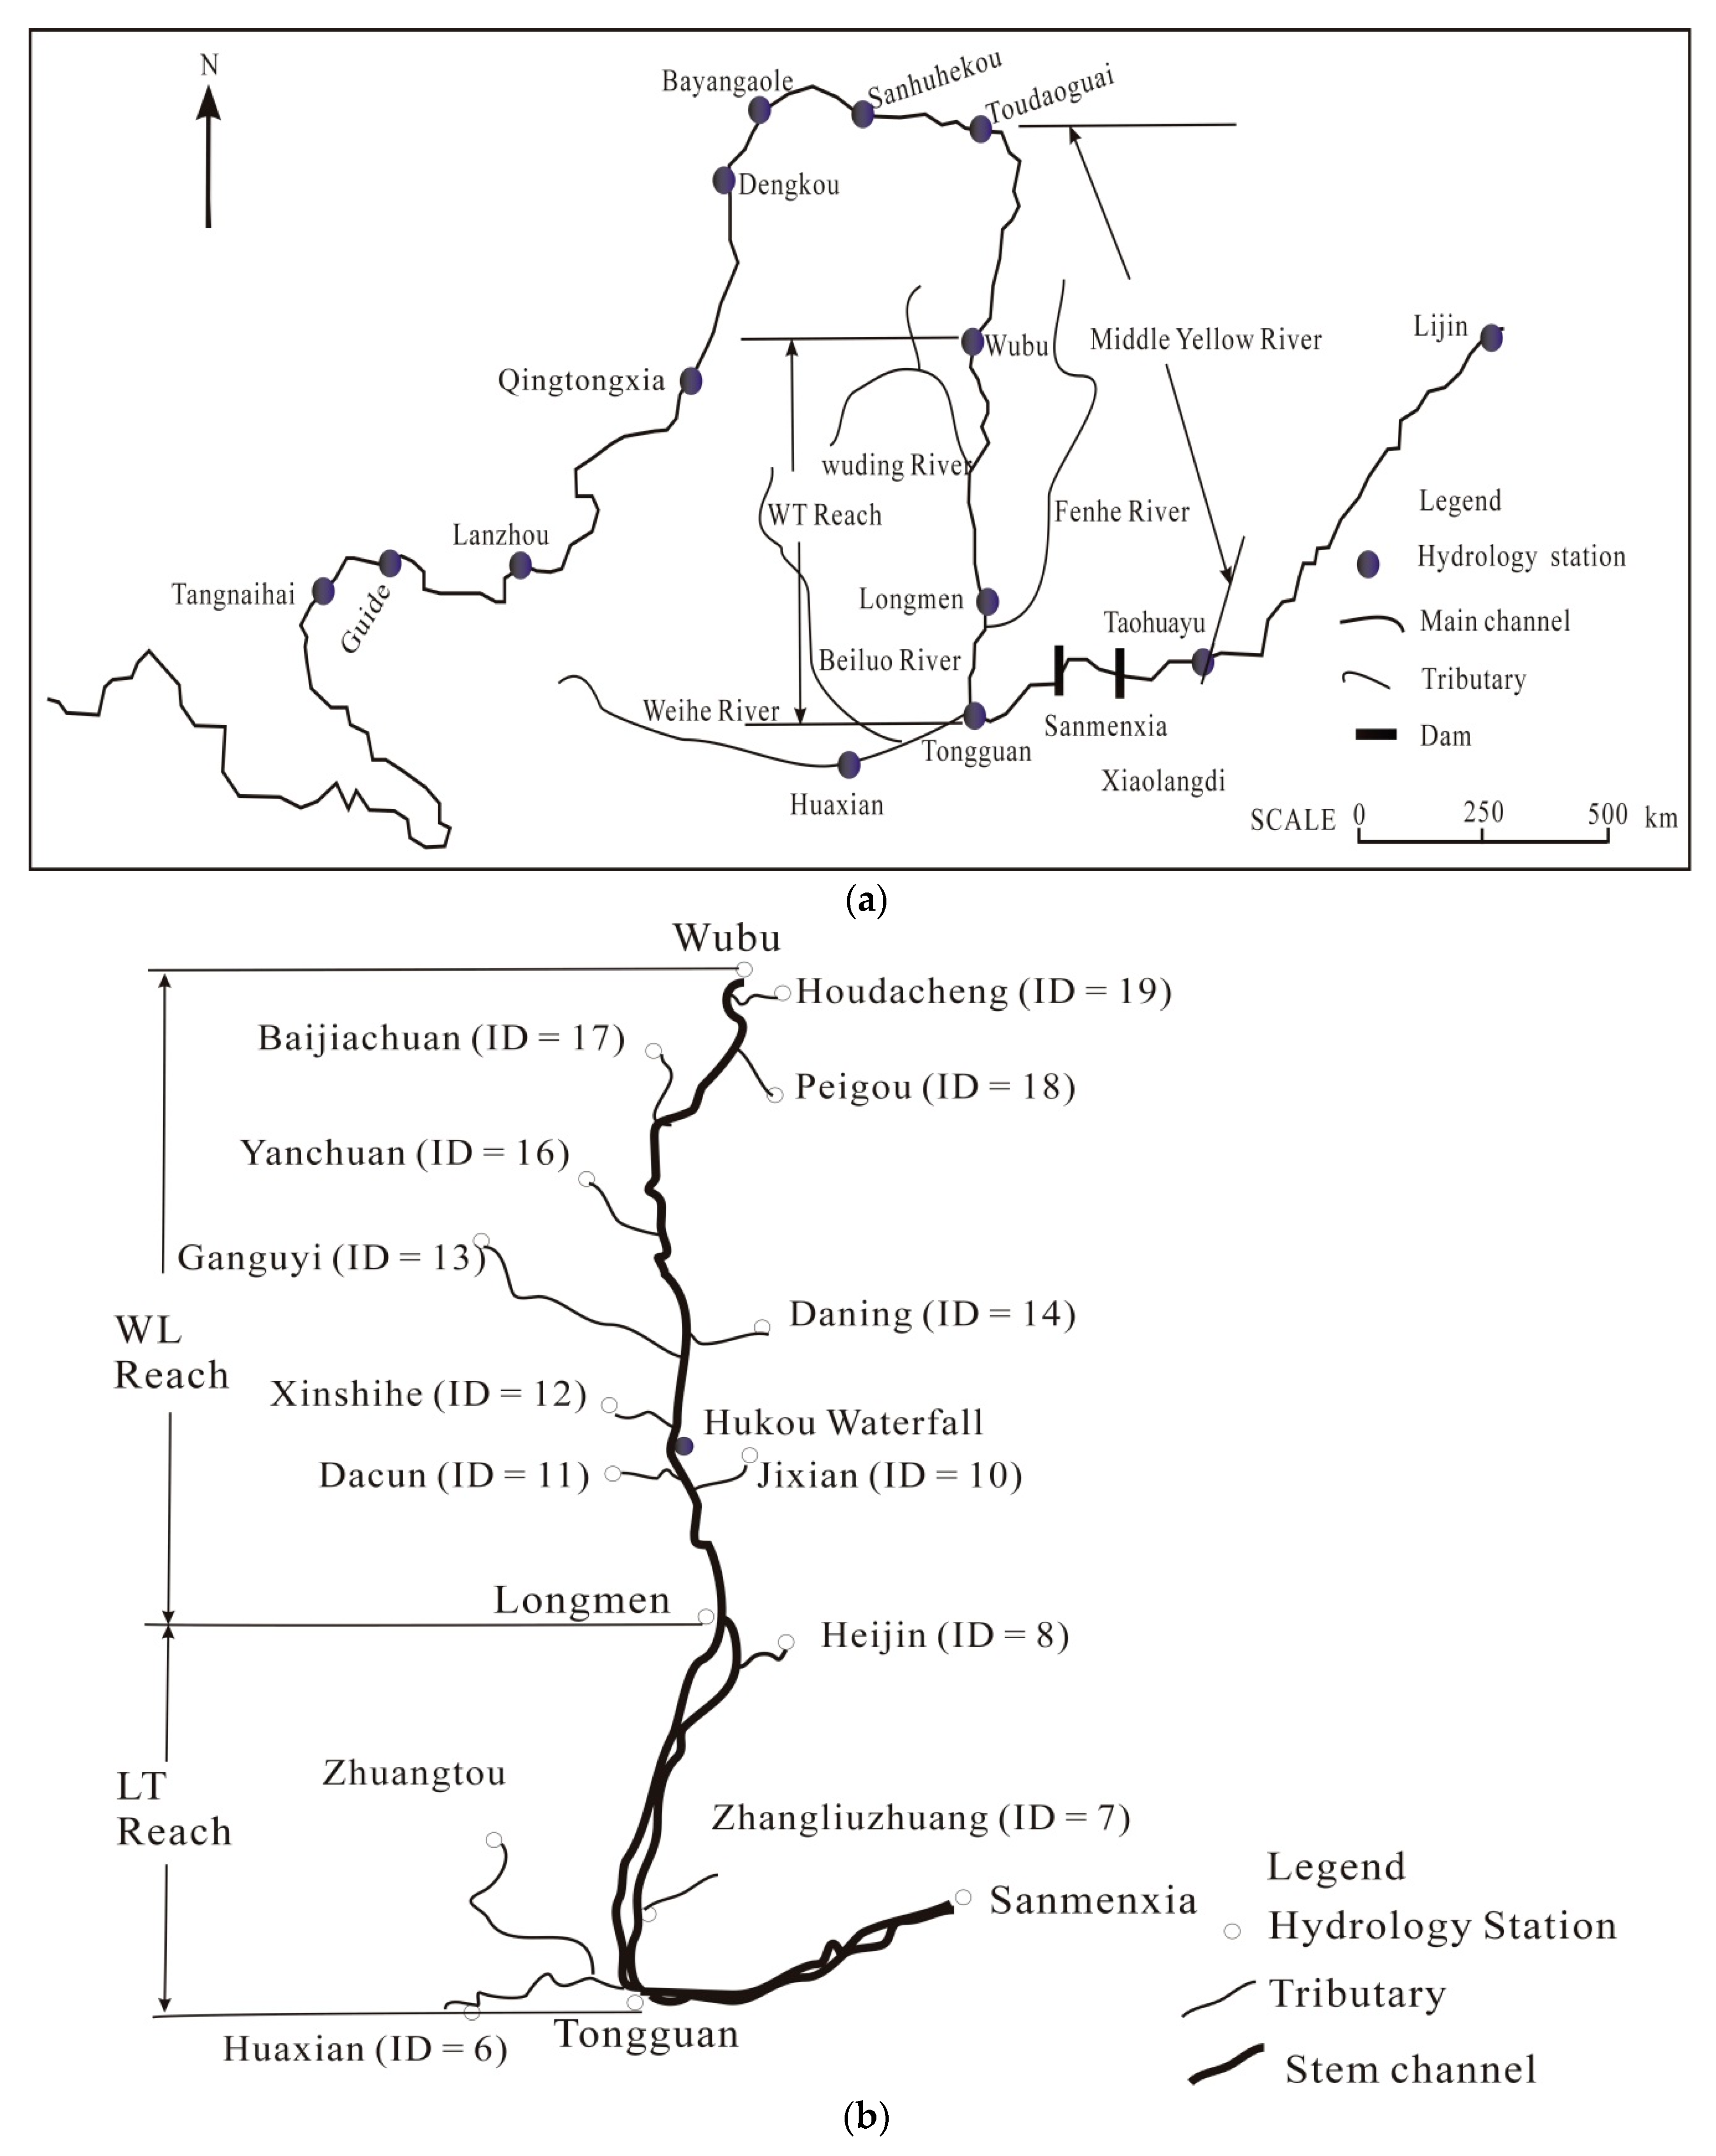
2. Drainage Area
3. Methodology and Data
3.1. Hydraulic Models
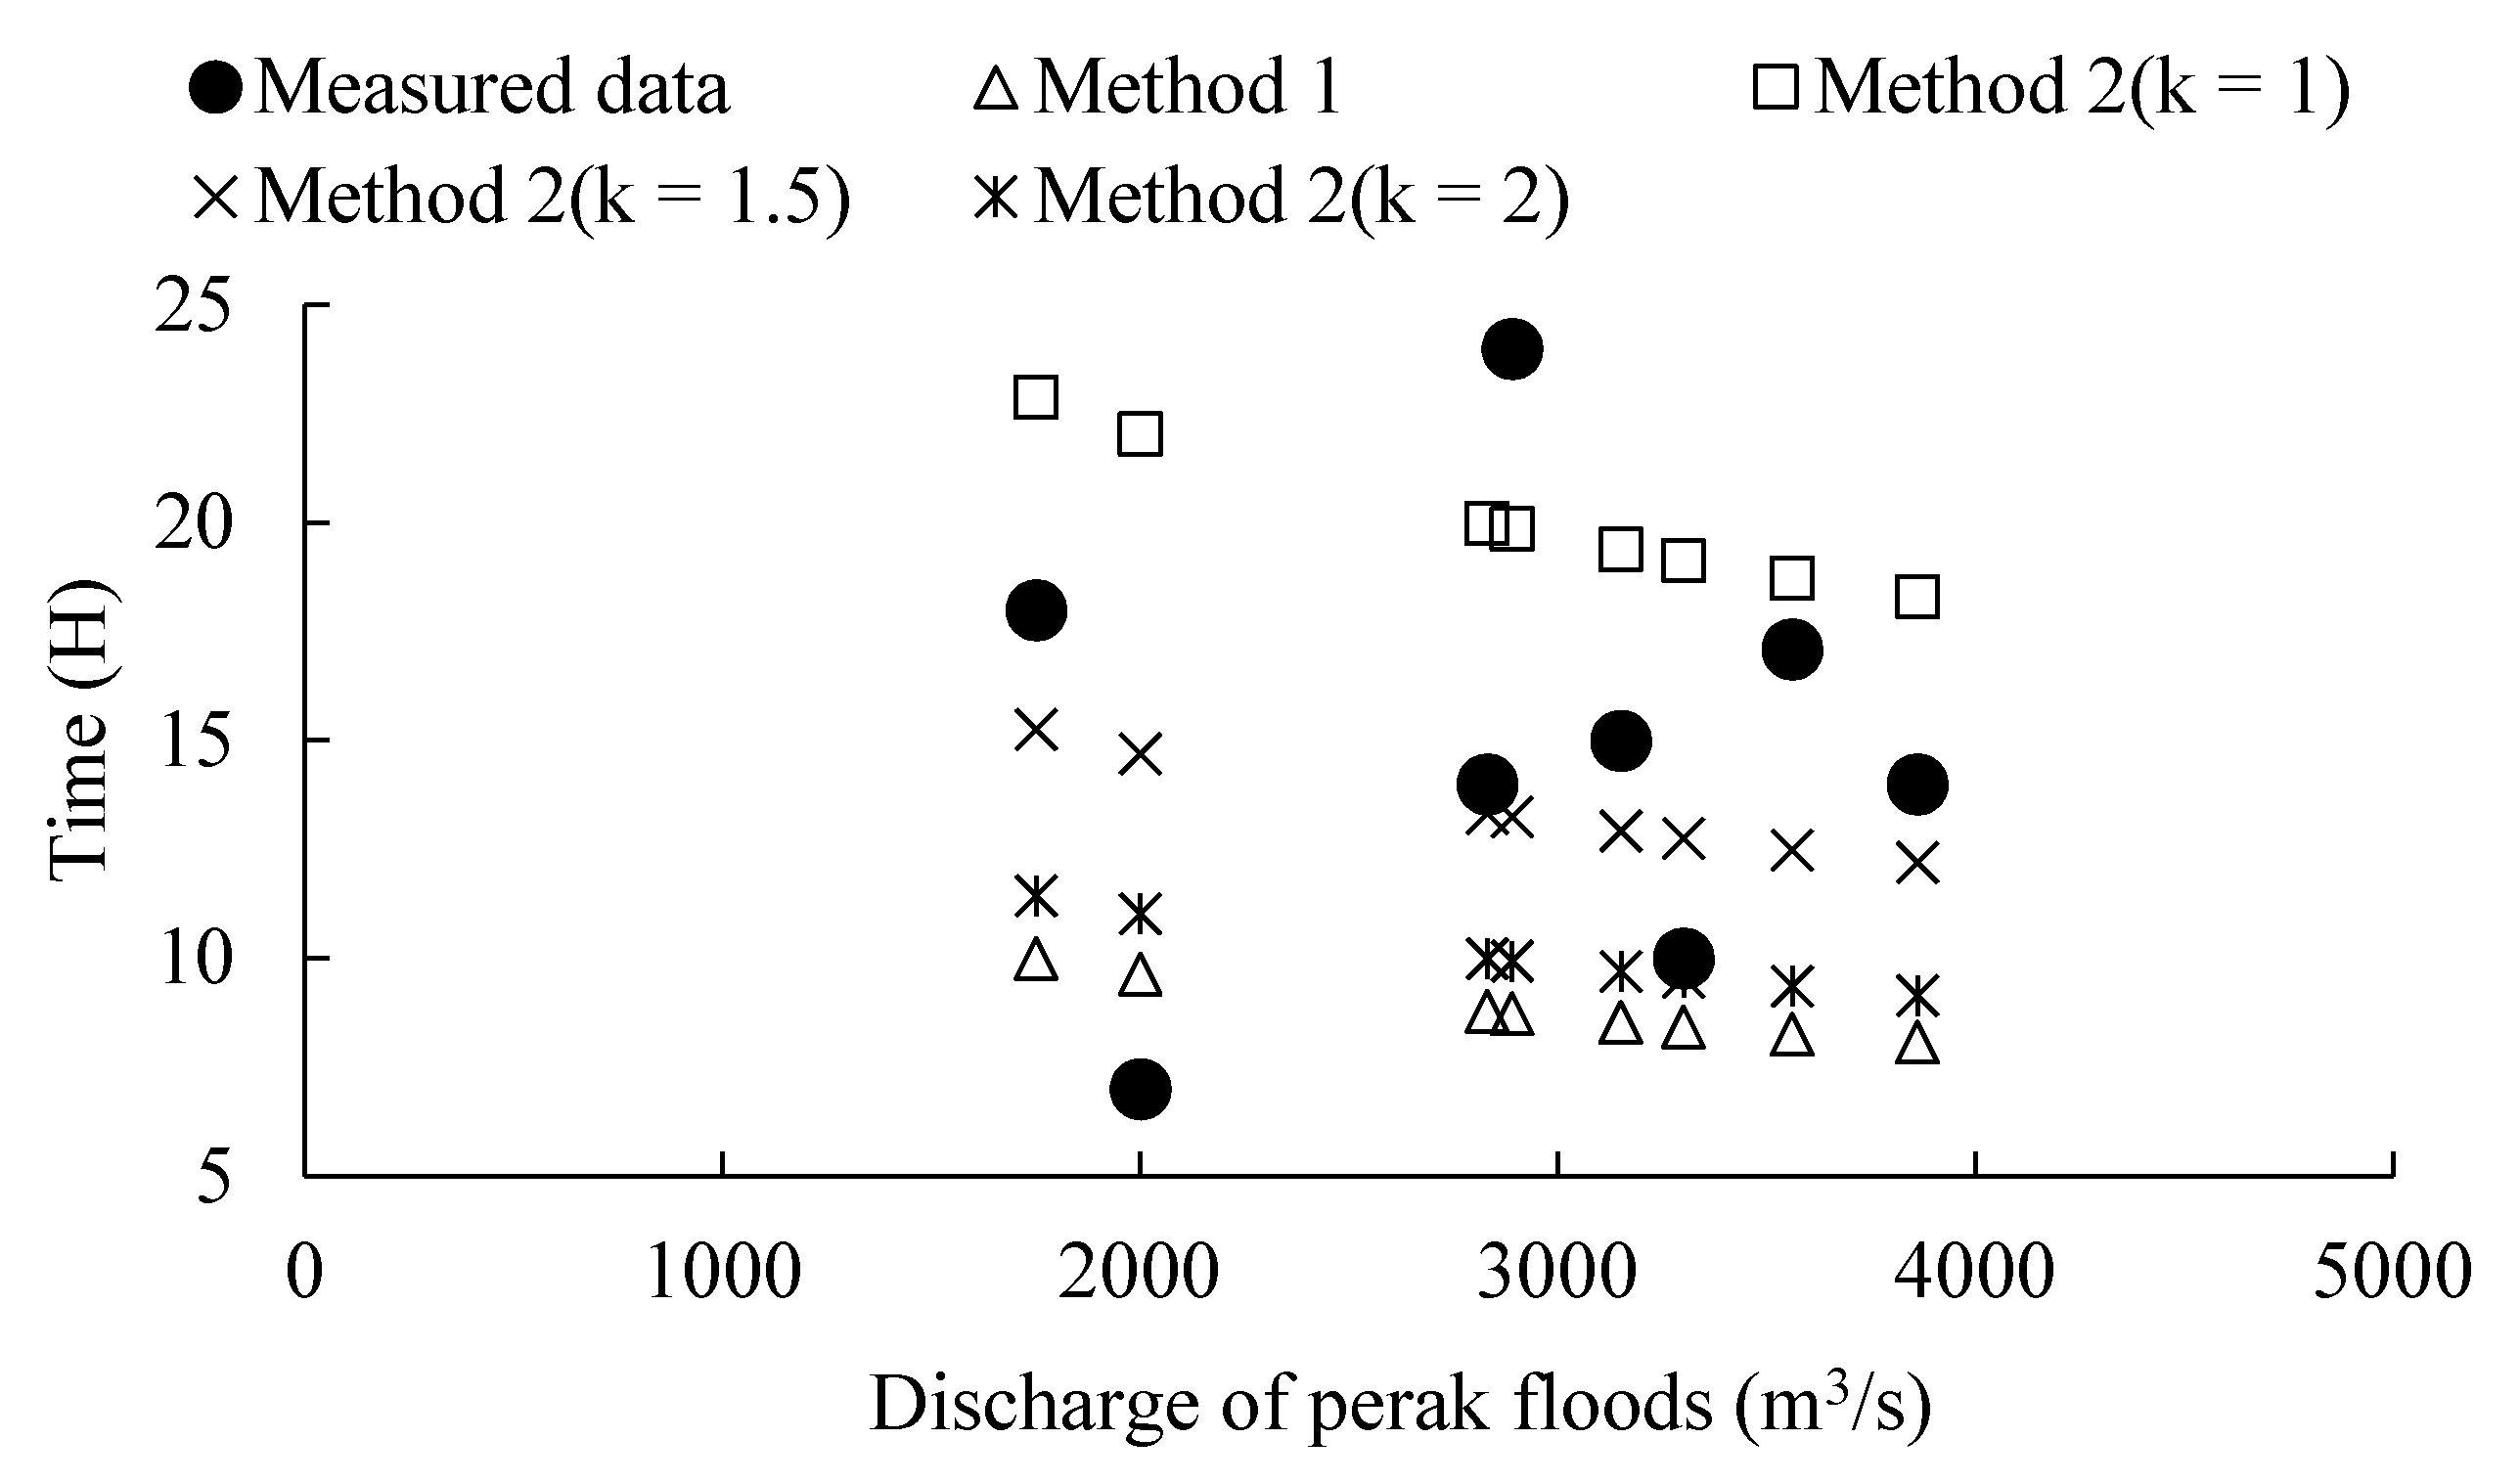
3.2. FTT of Floods with Different Peak Discharges
3.3. Data
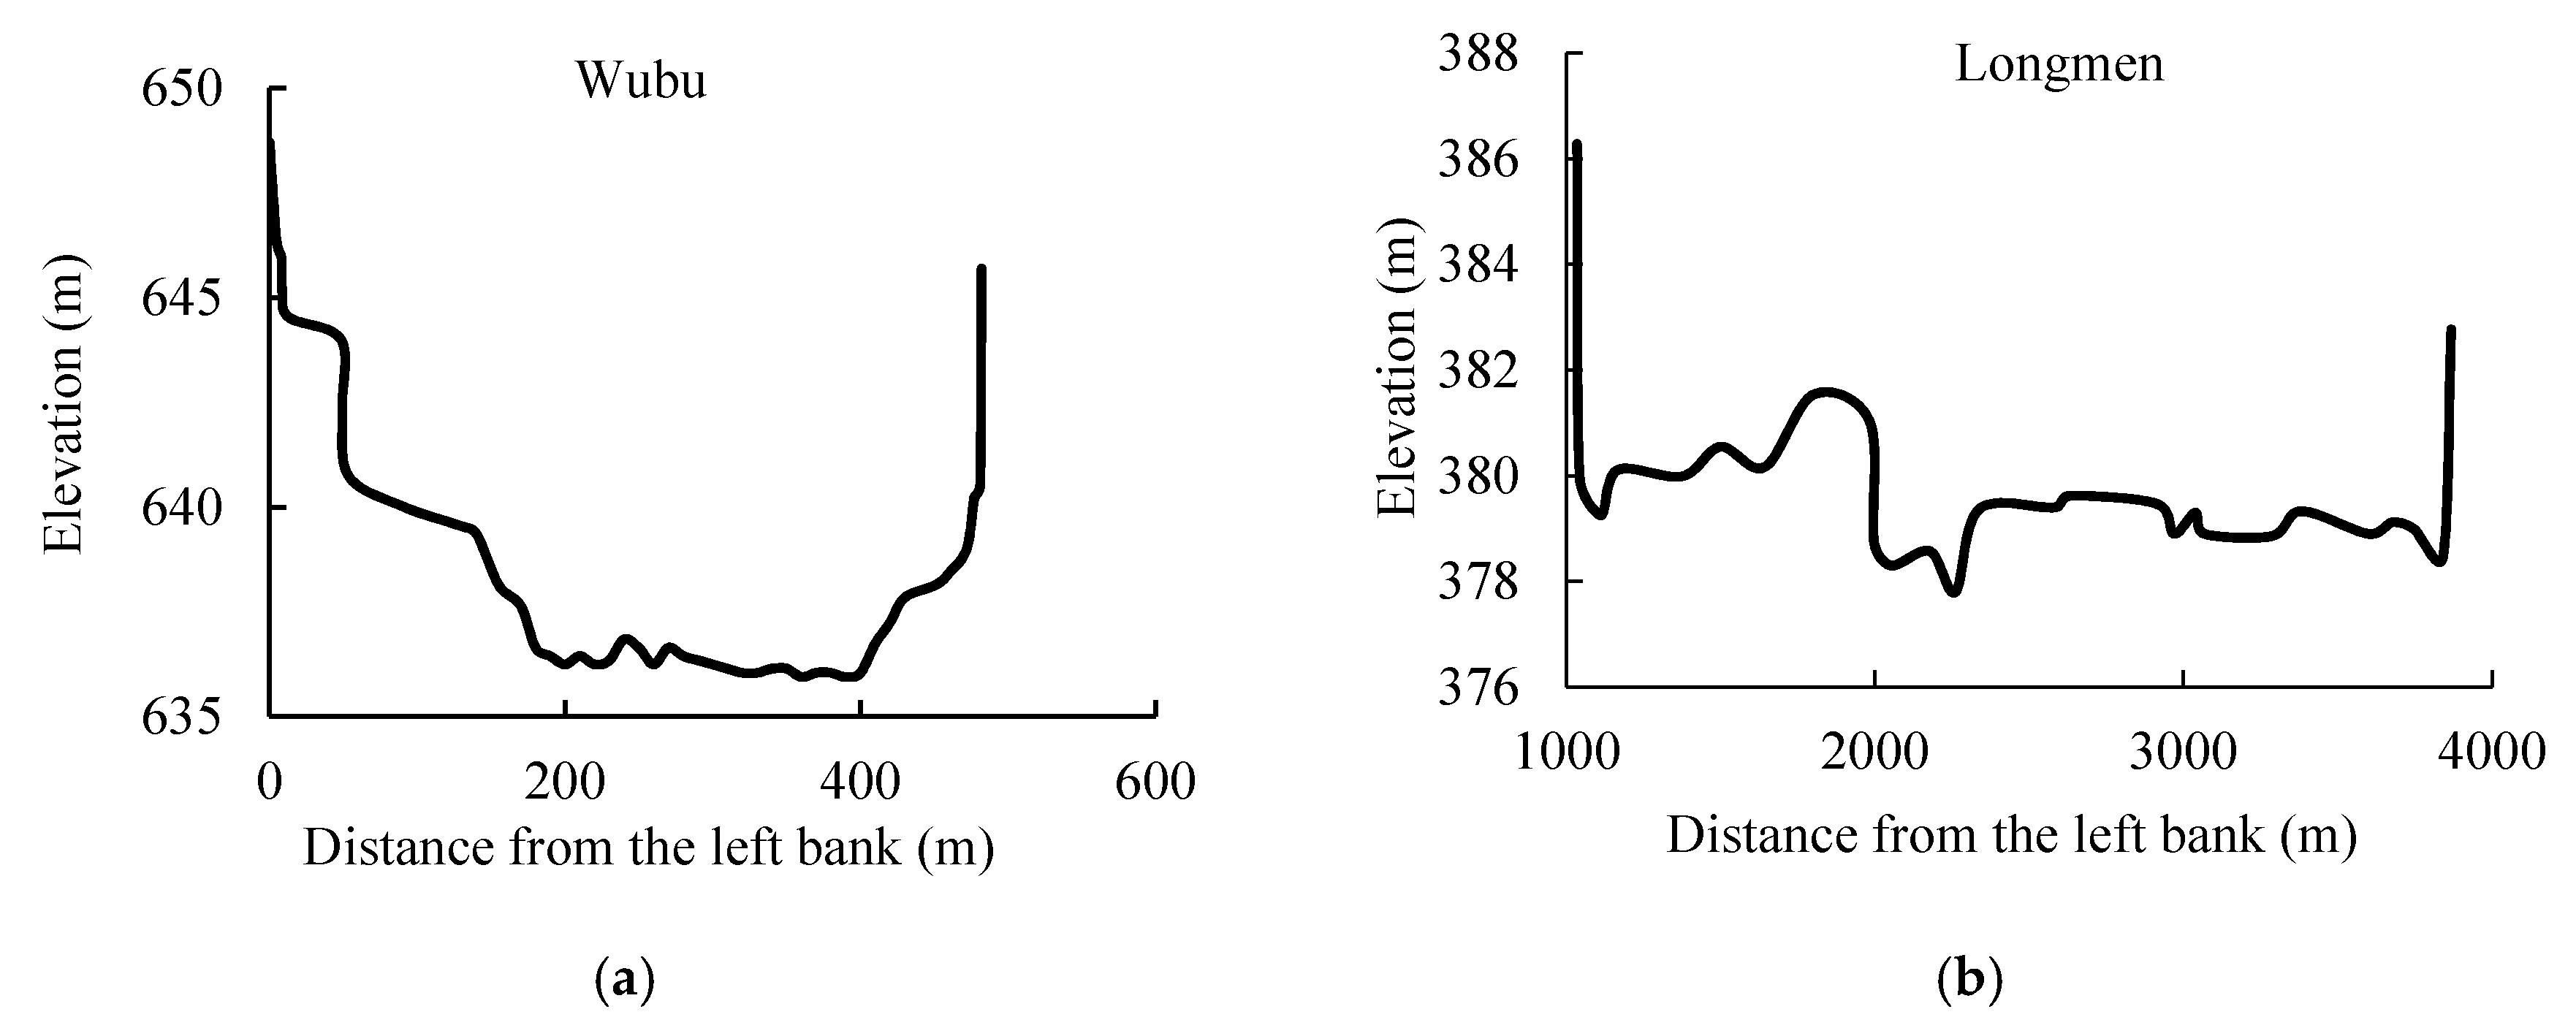
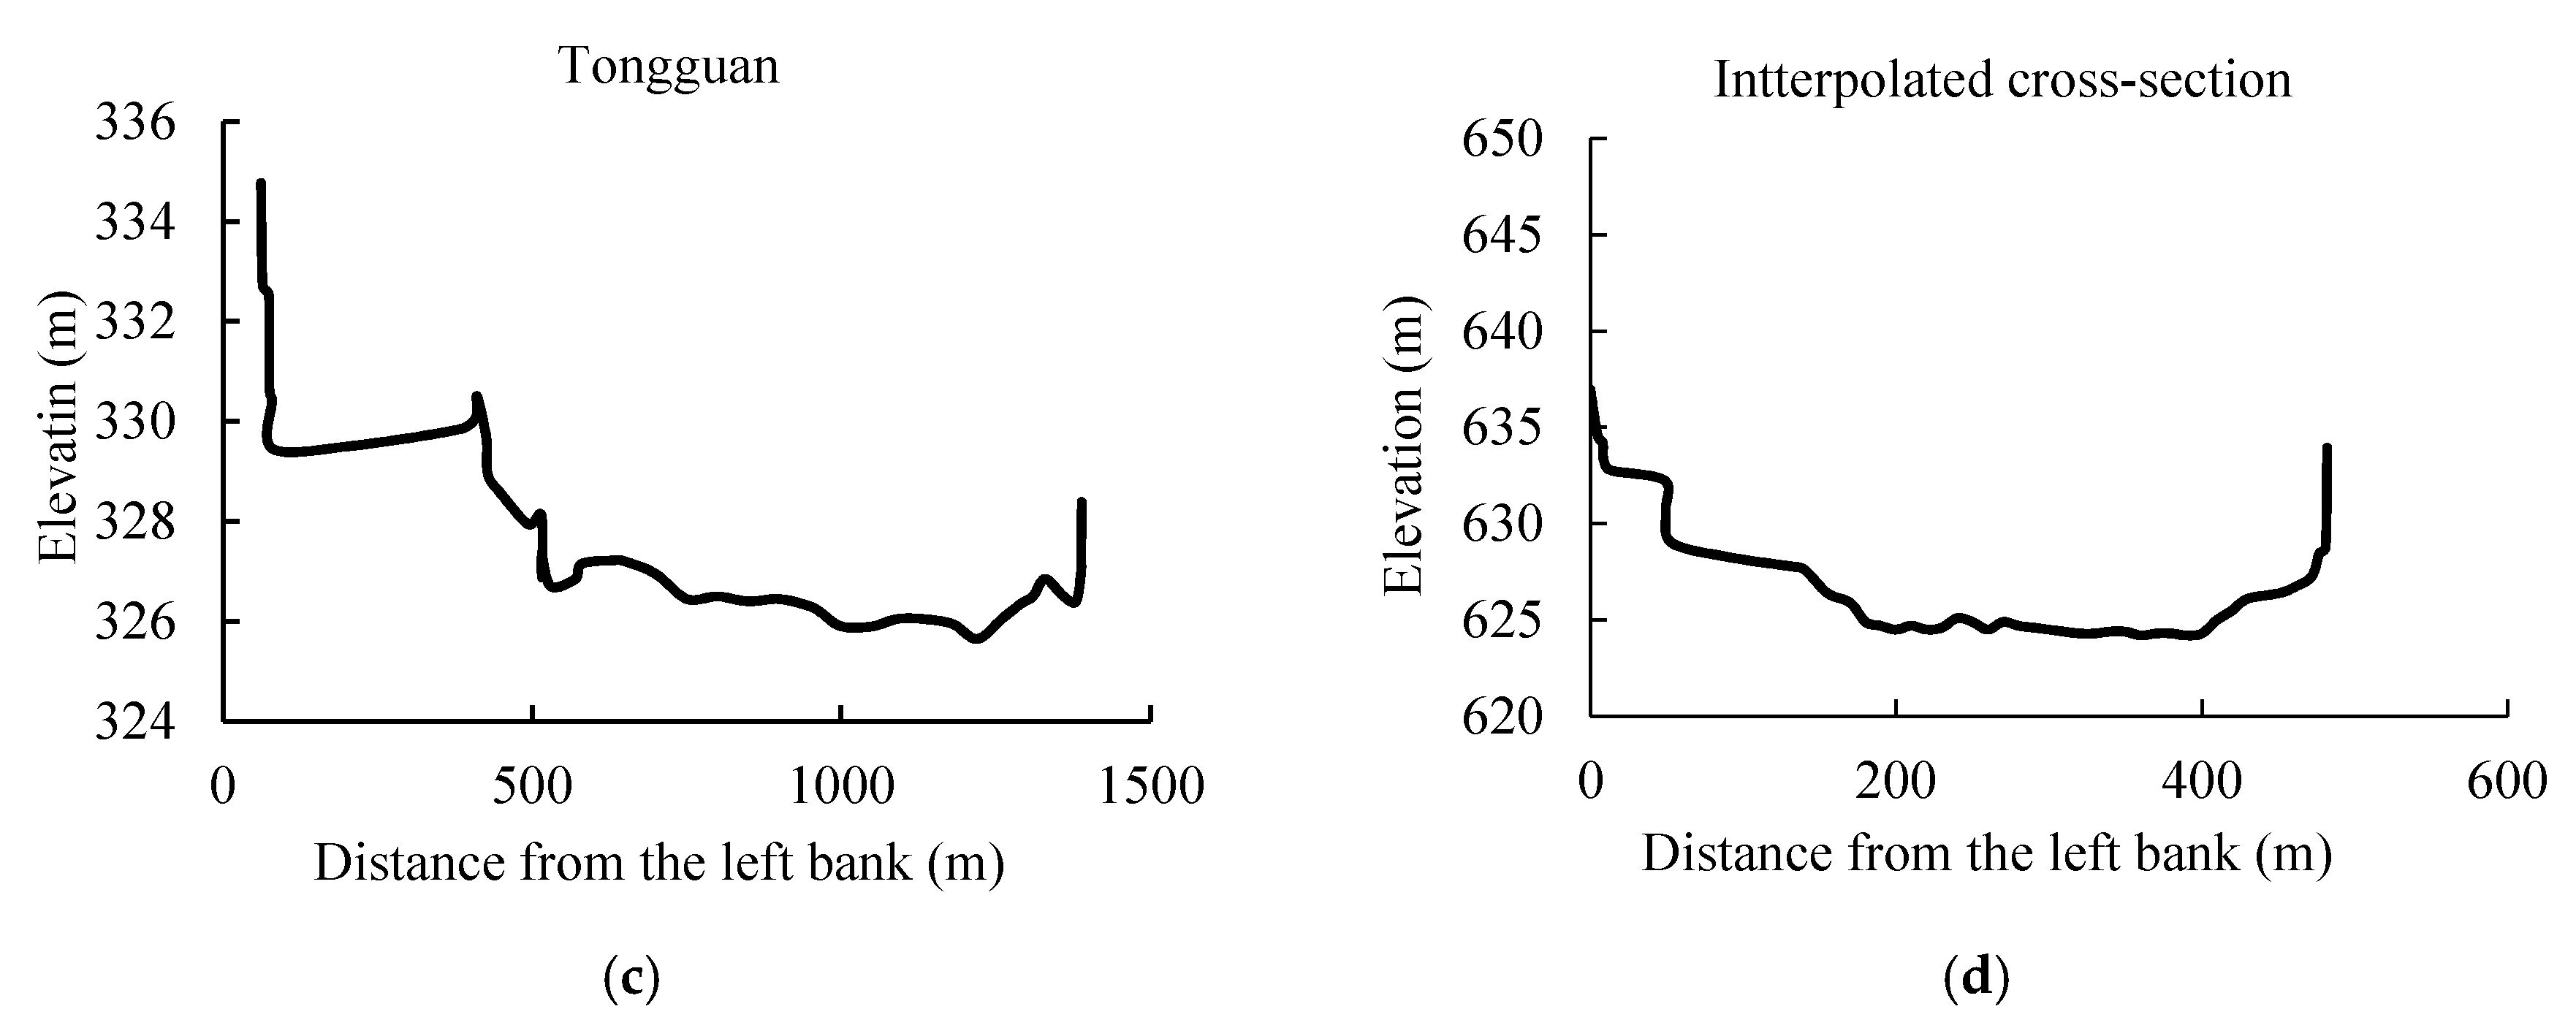
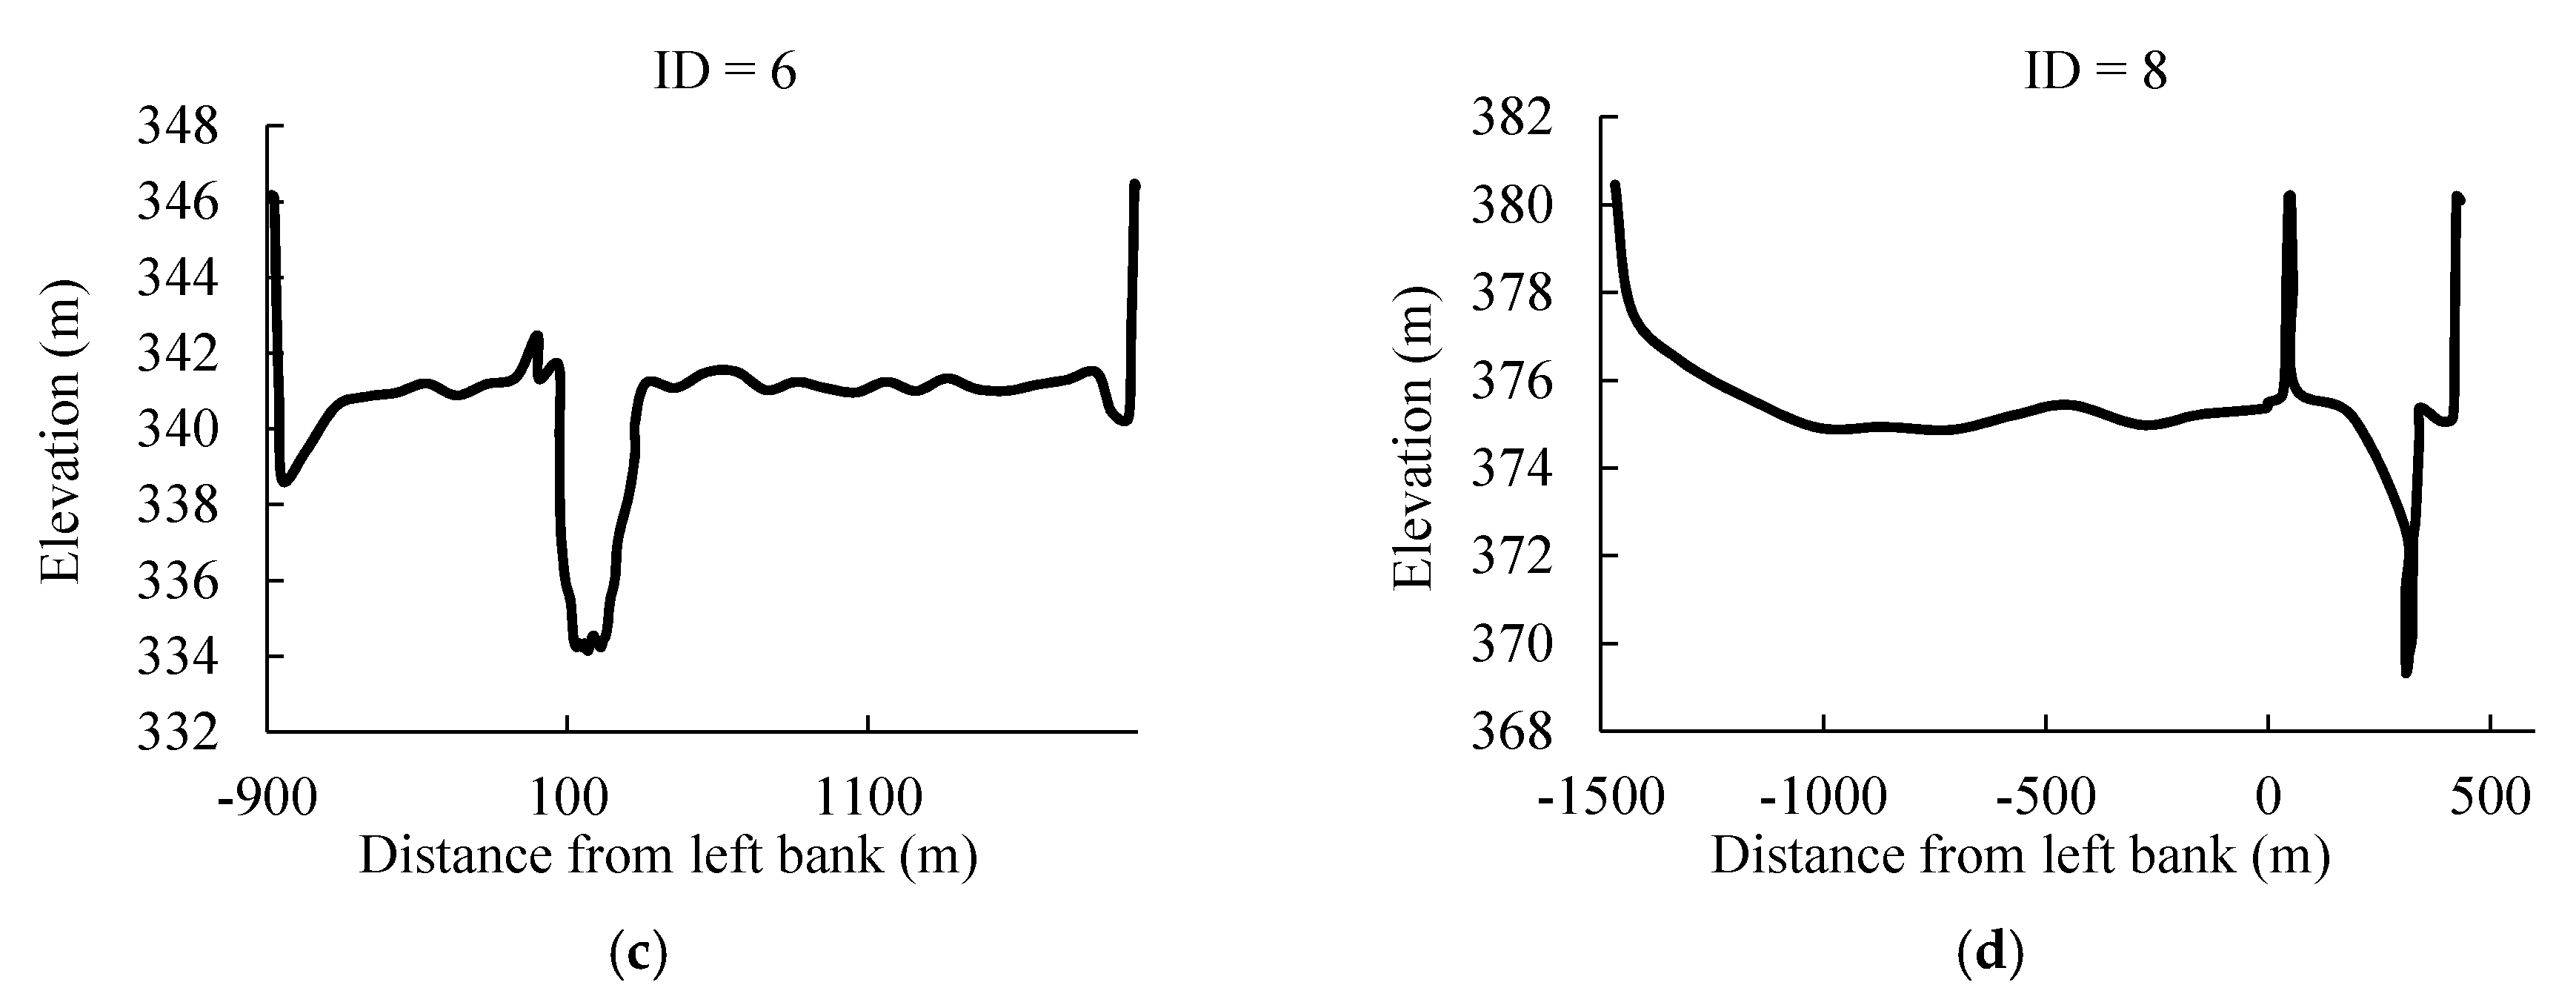
3.3.1. Geometry Data of the Main Channel
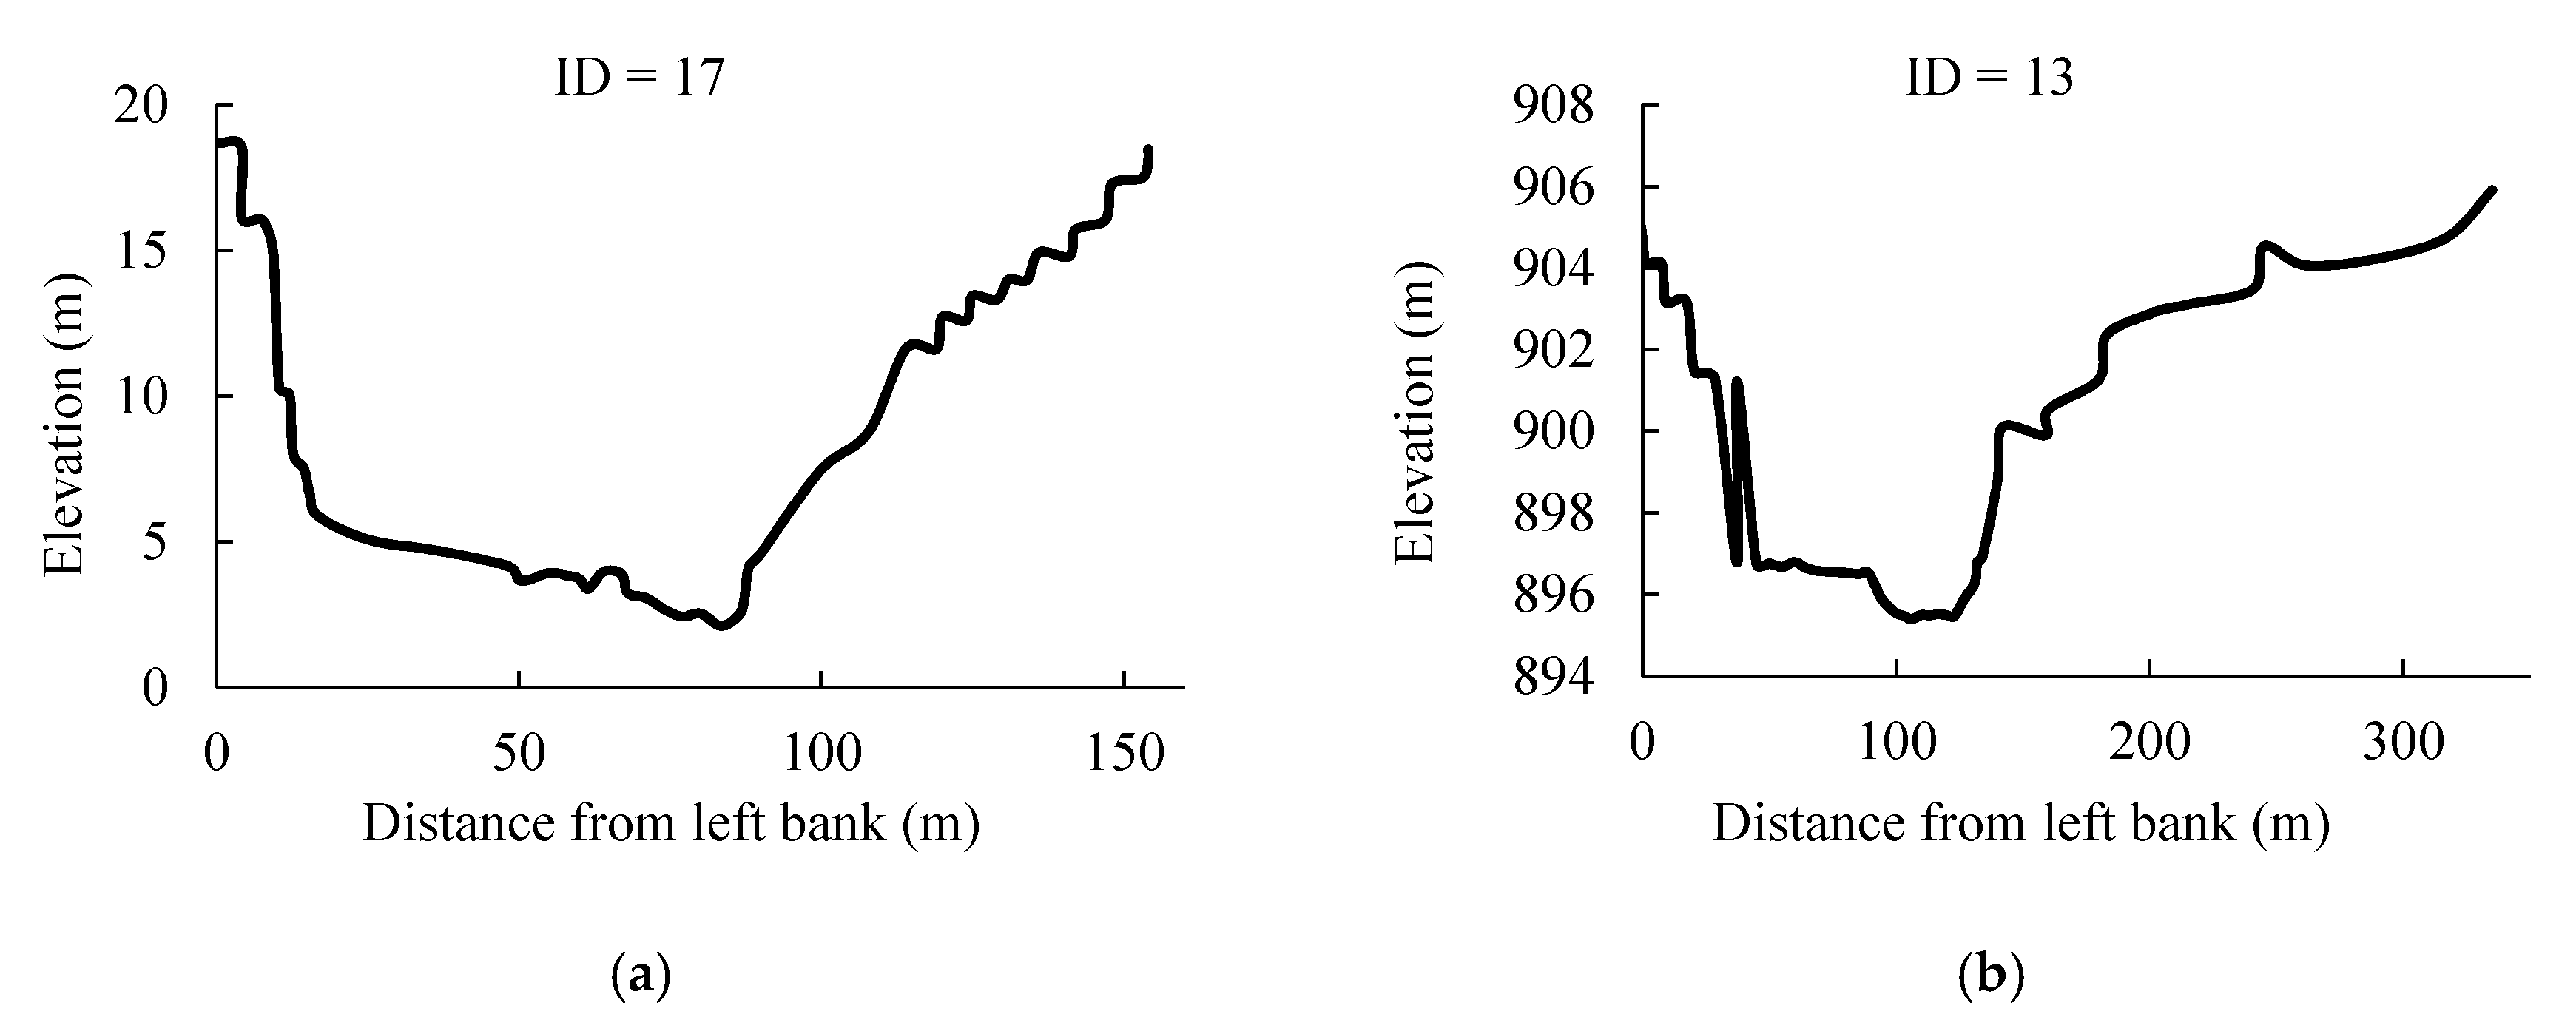
3.3.2. Geometry Data of Tributaries
3.3.3. Boundary Condition
4. Results and Discussion
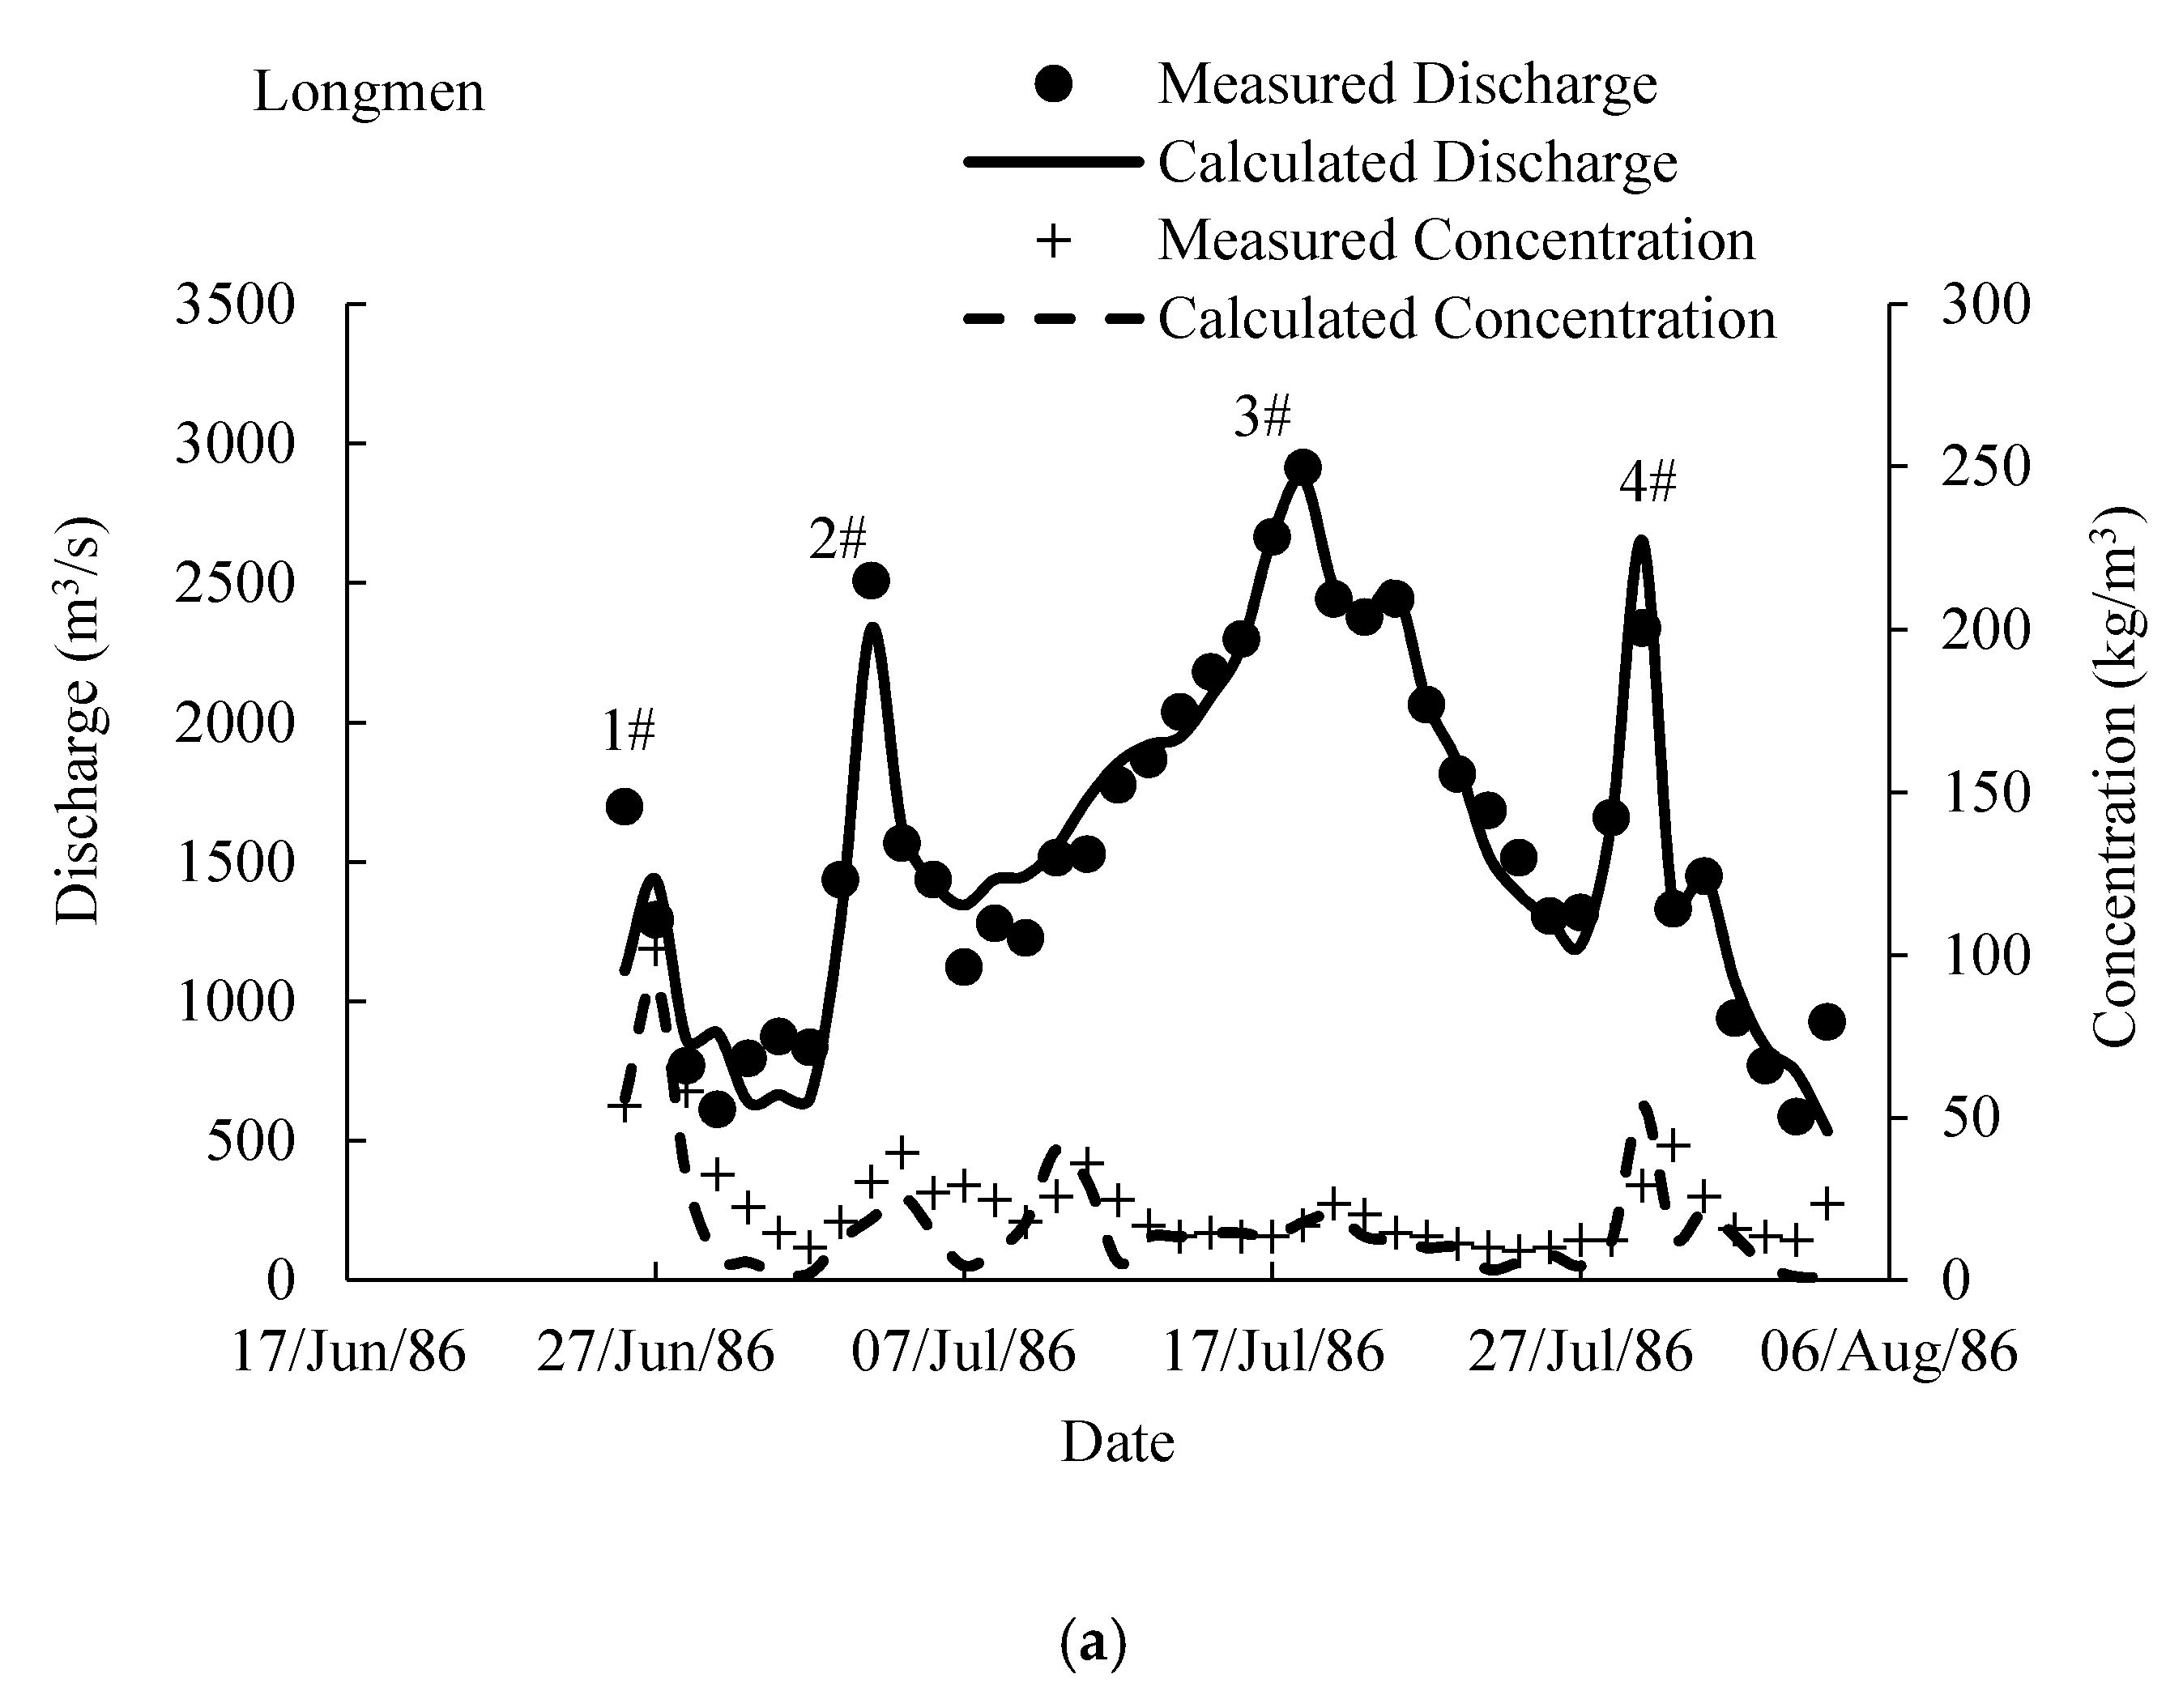
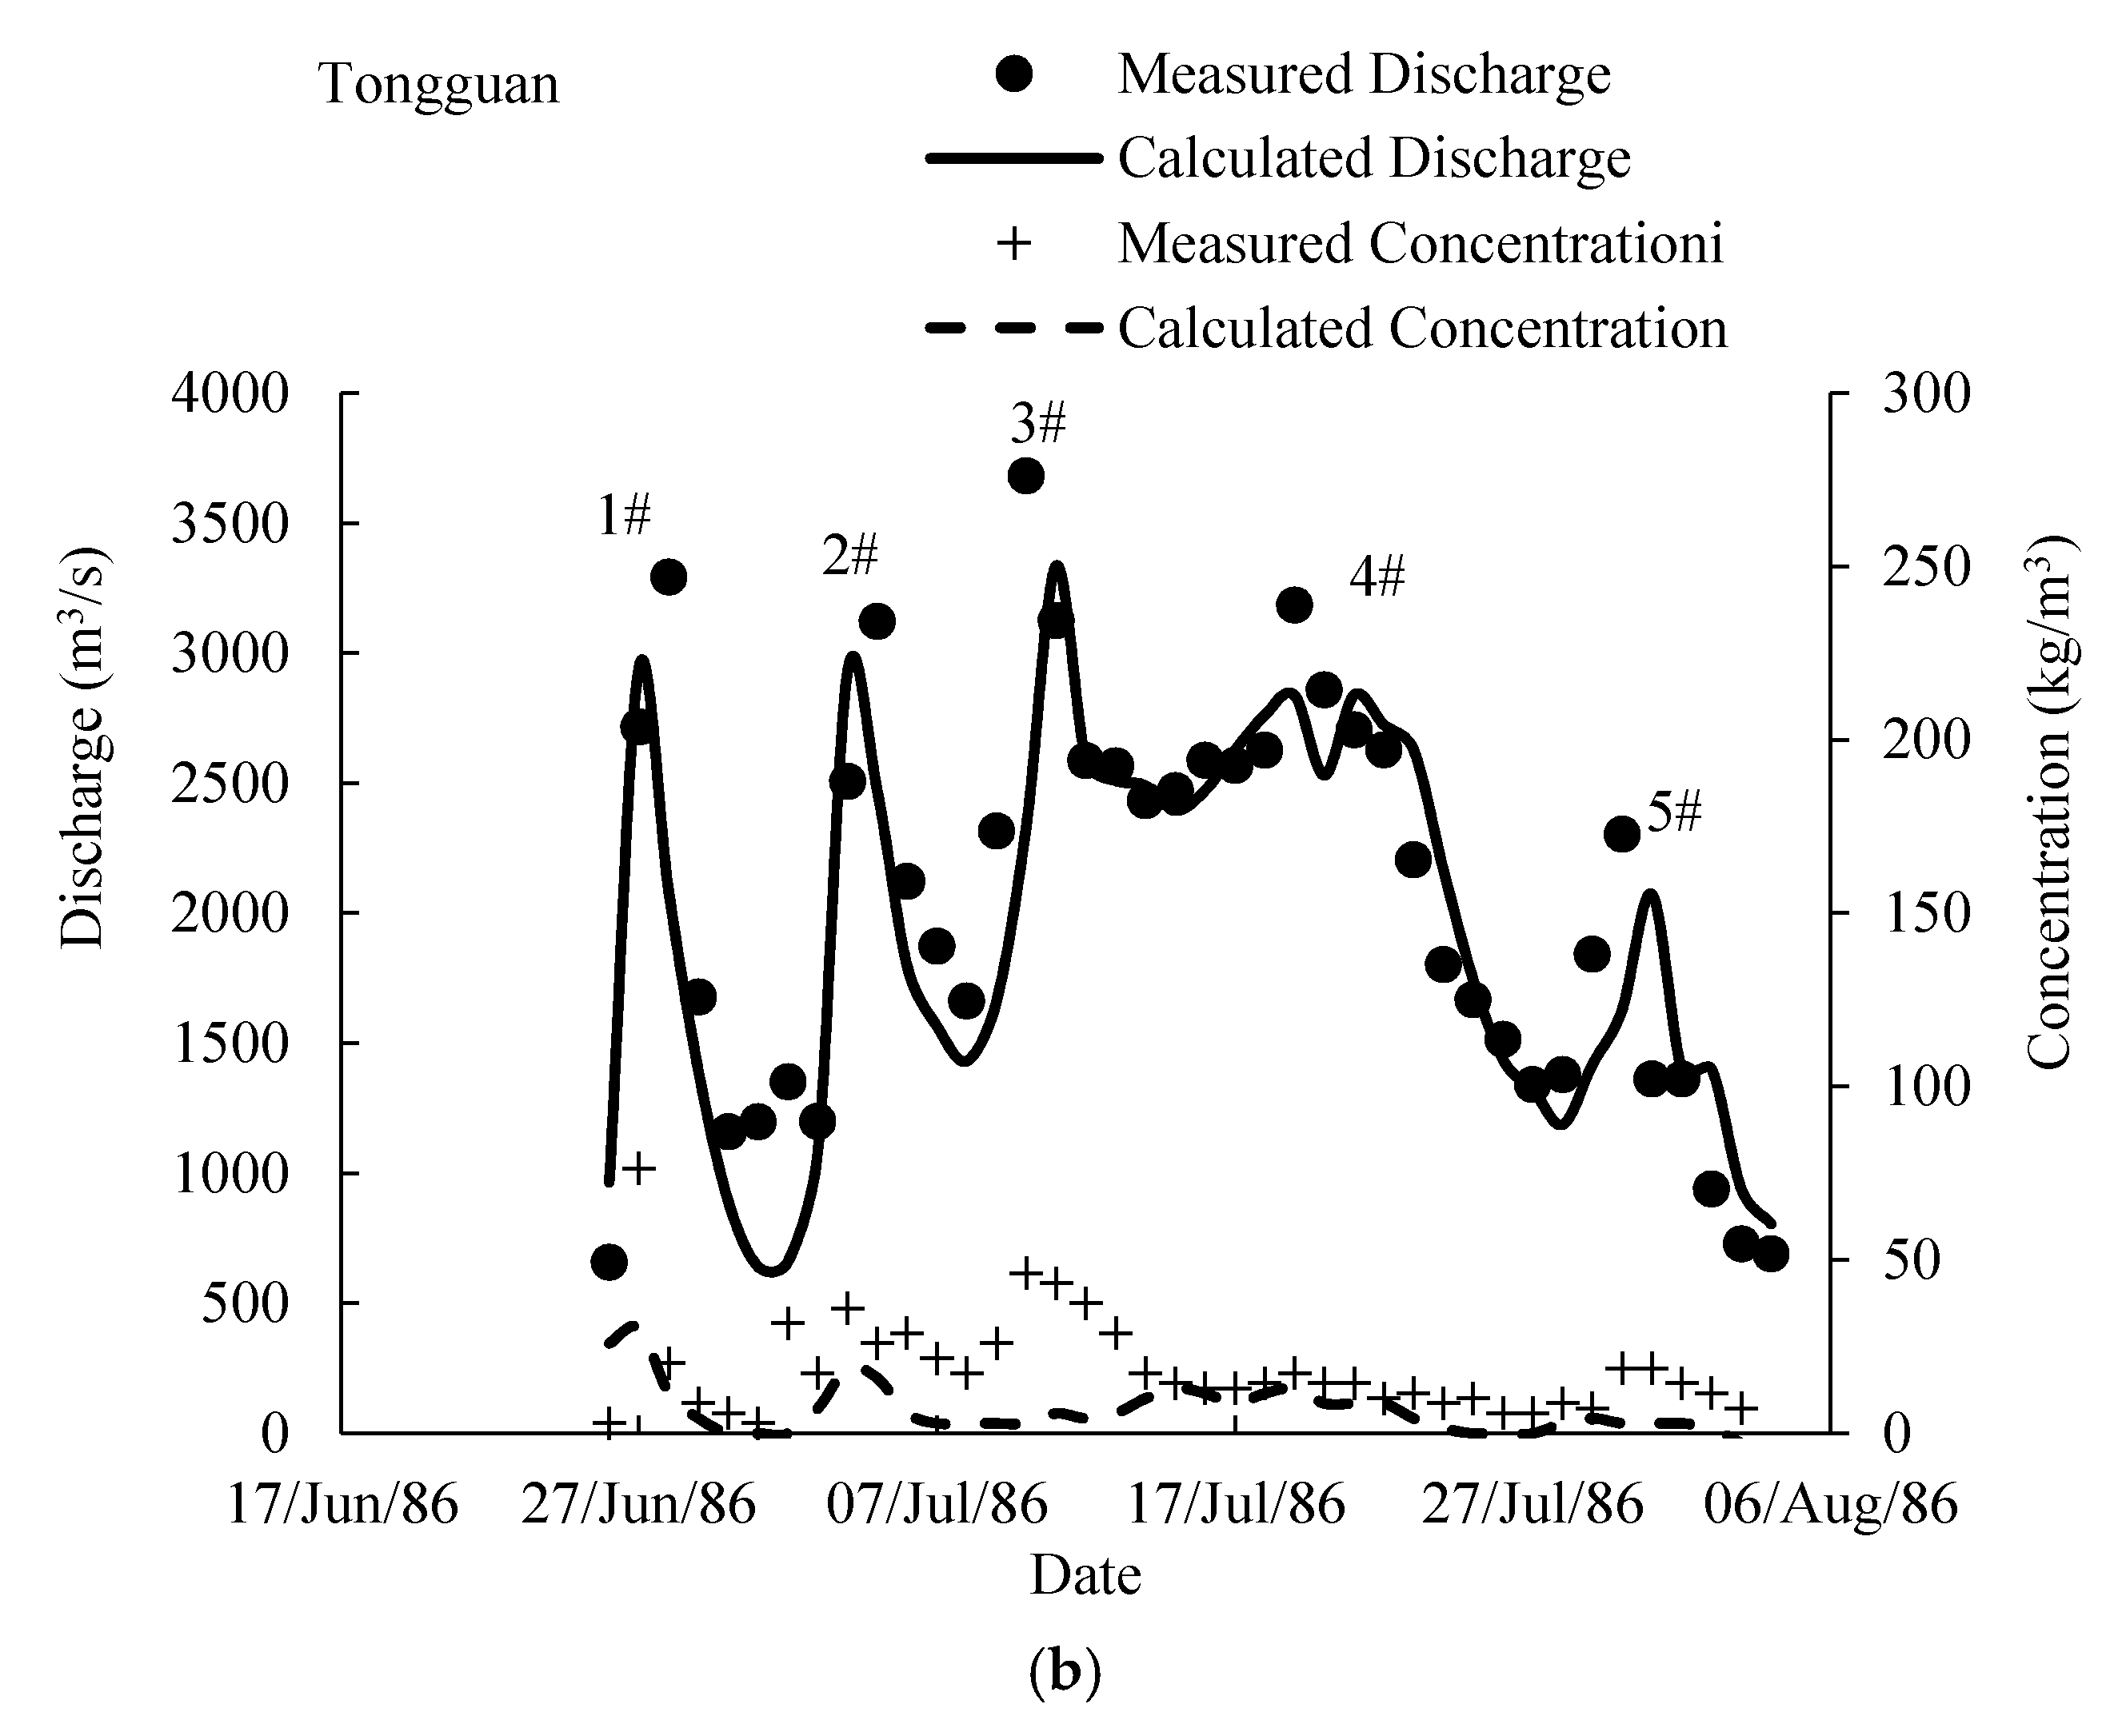
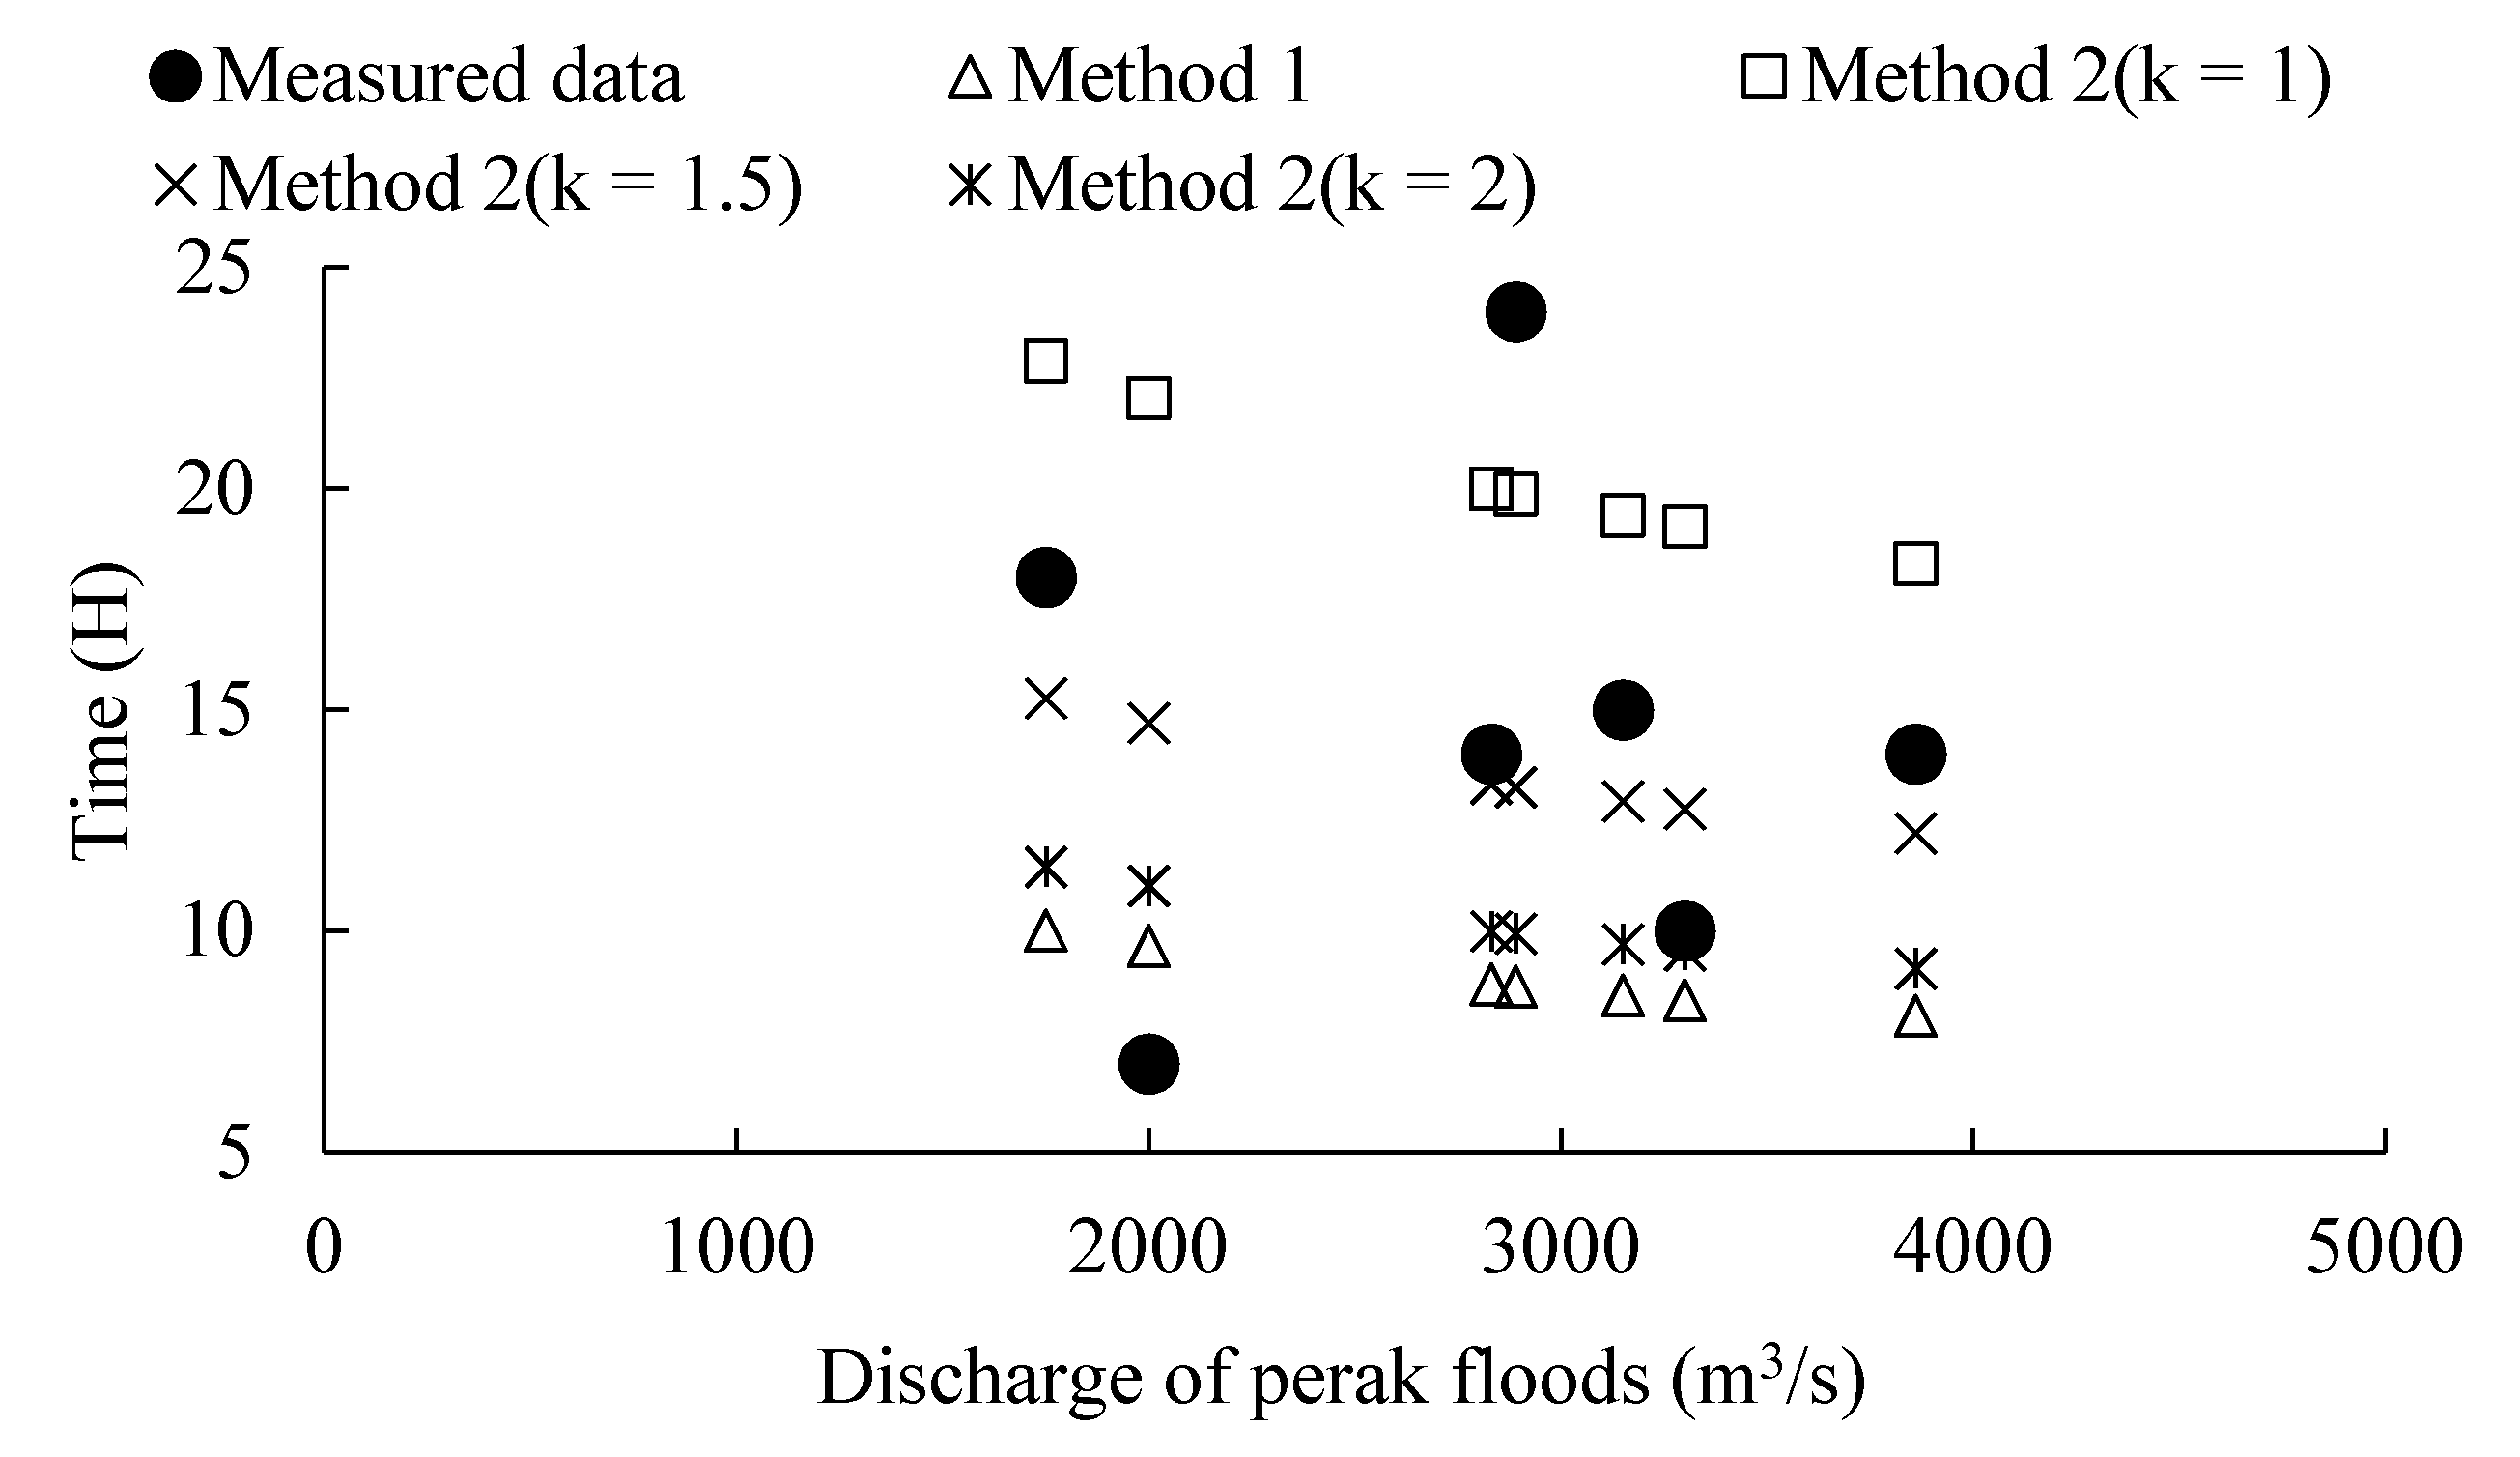
4.1. Calibration of Physical Parameters by Selected Flood Event
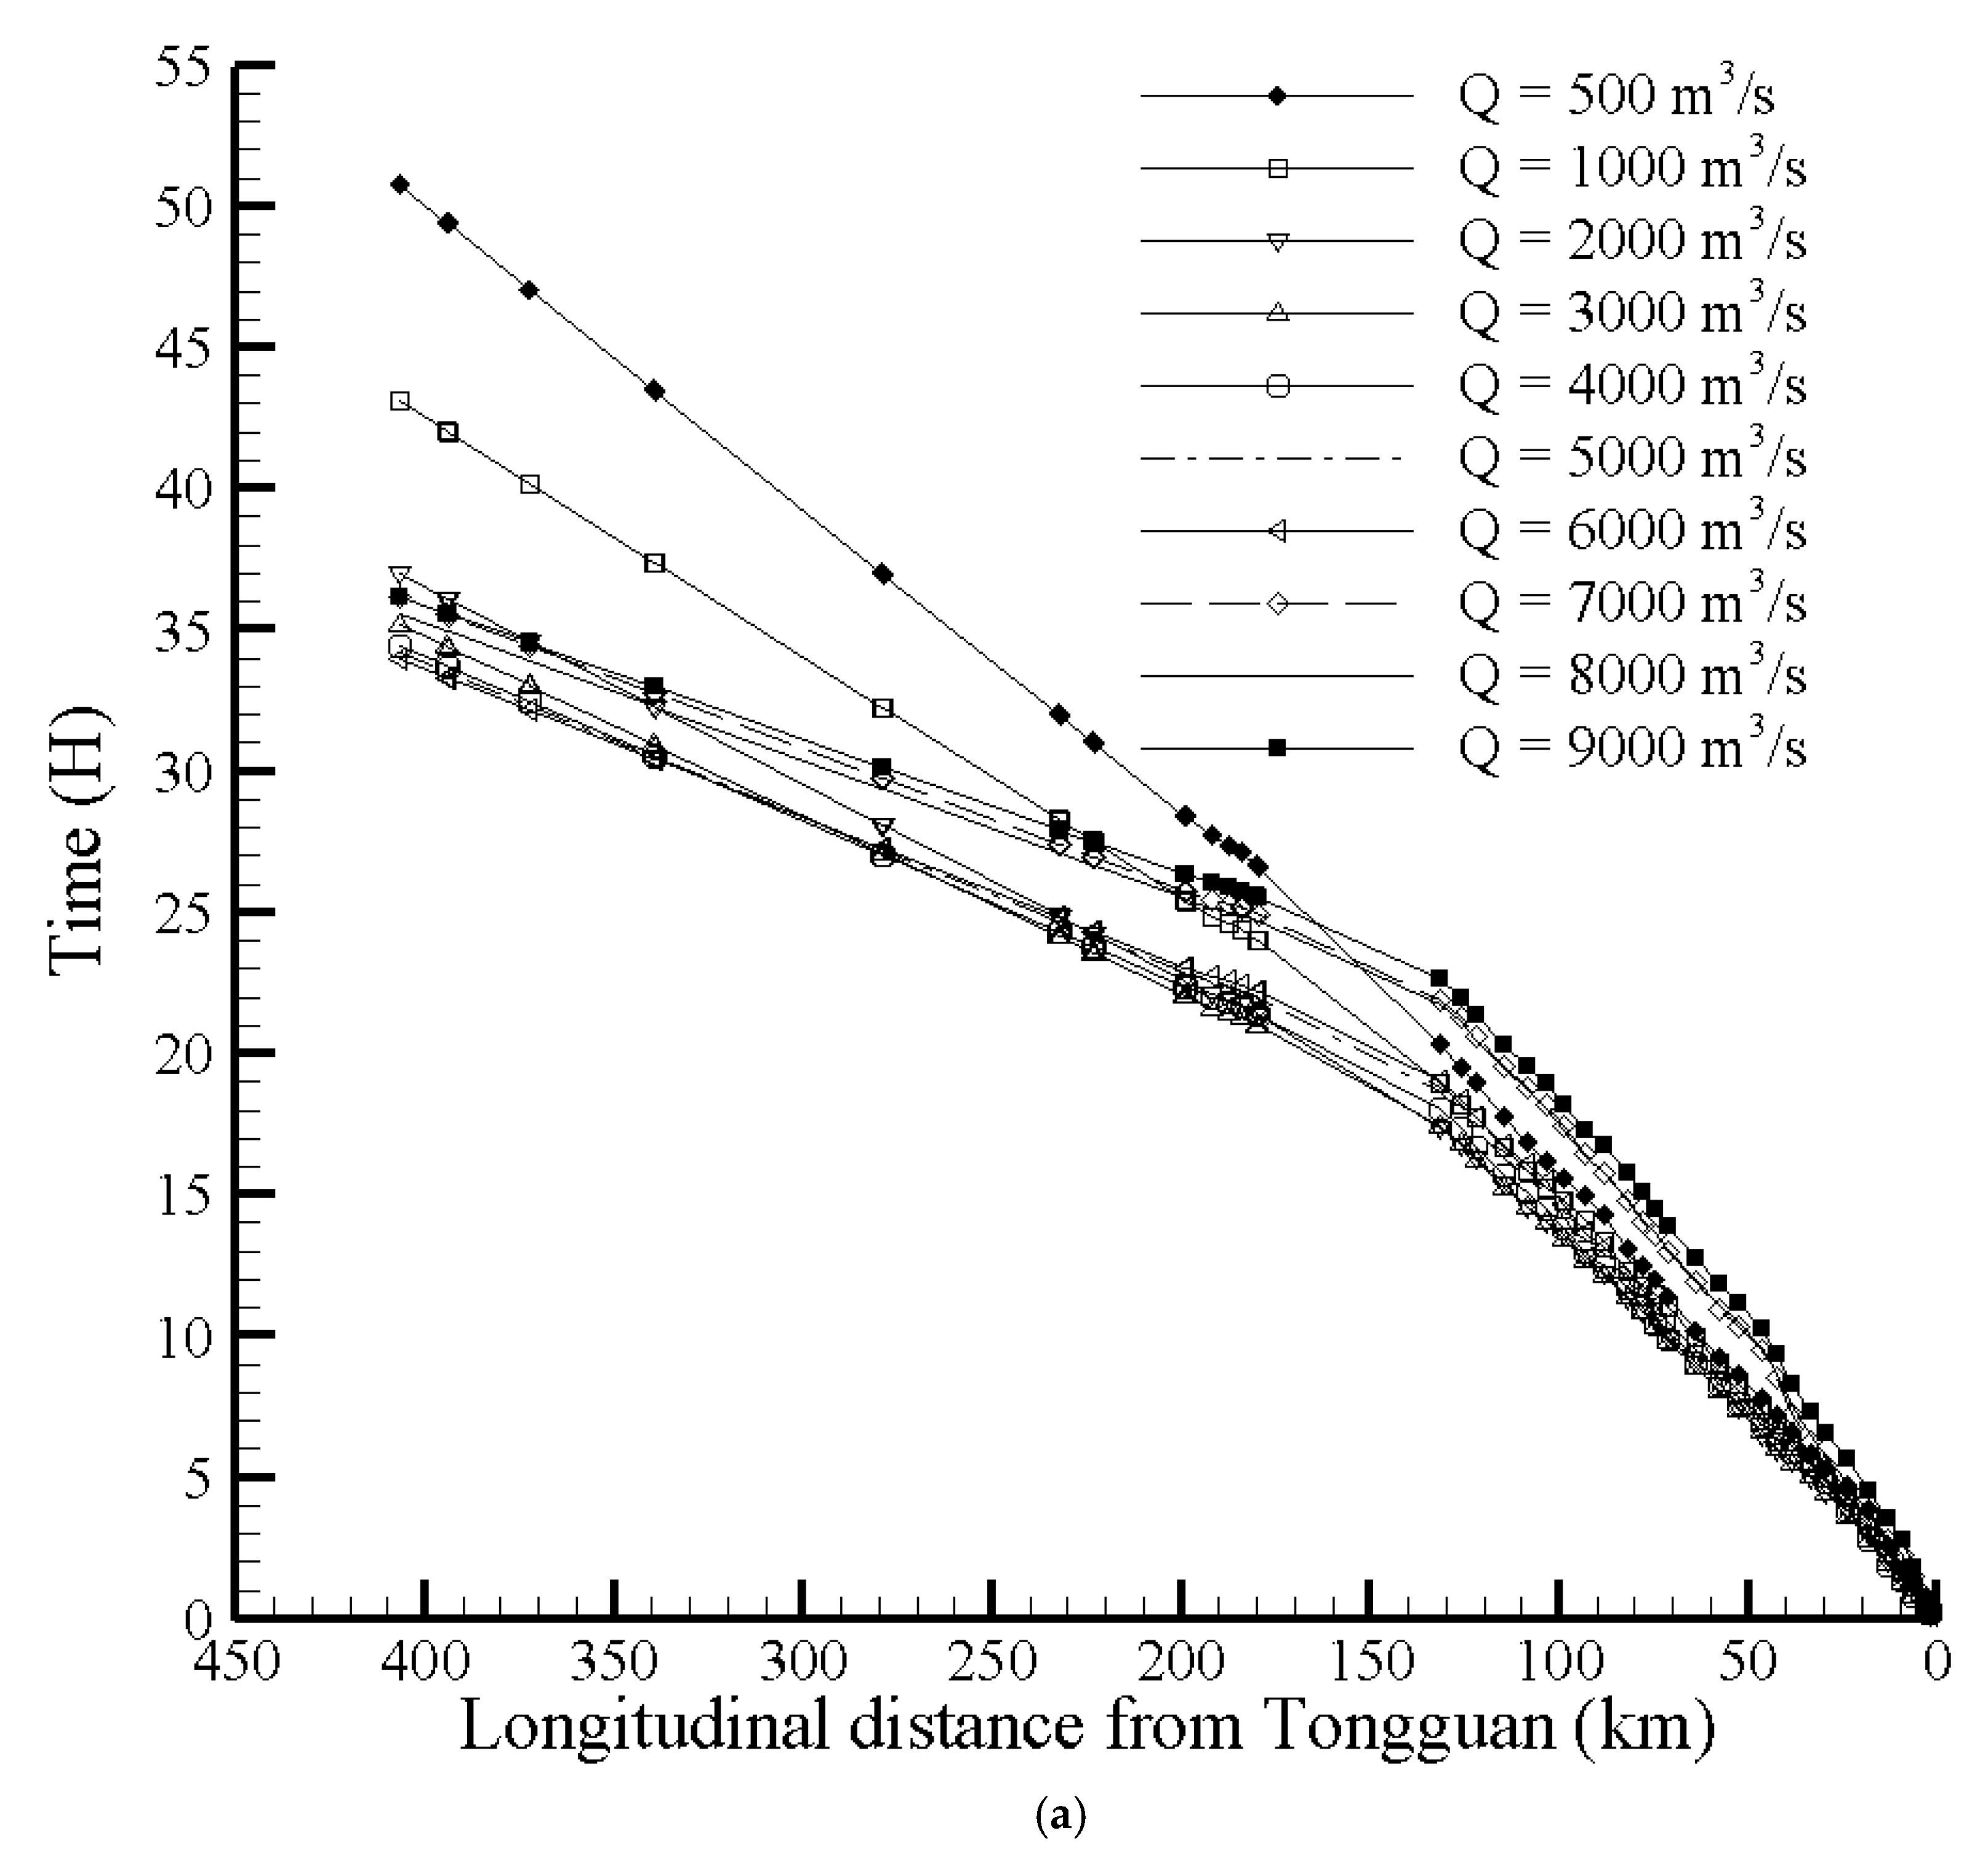
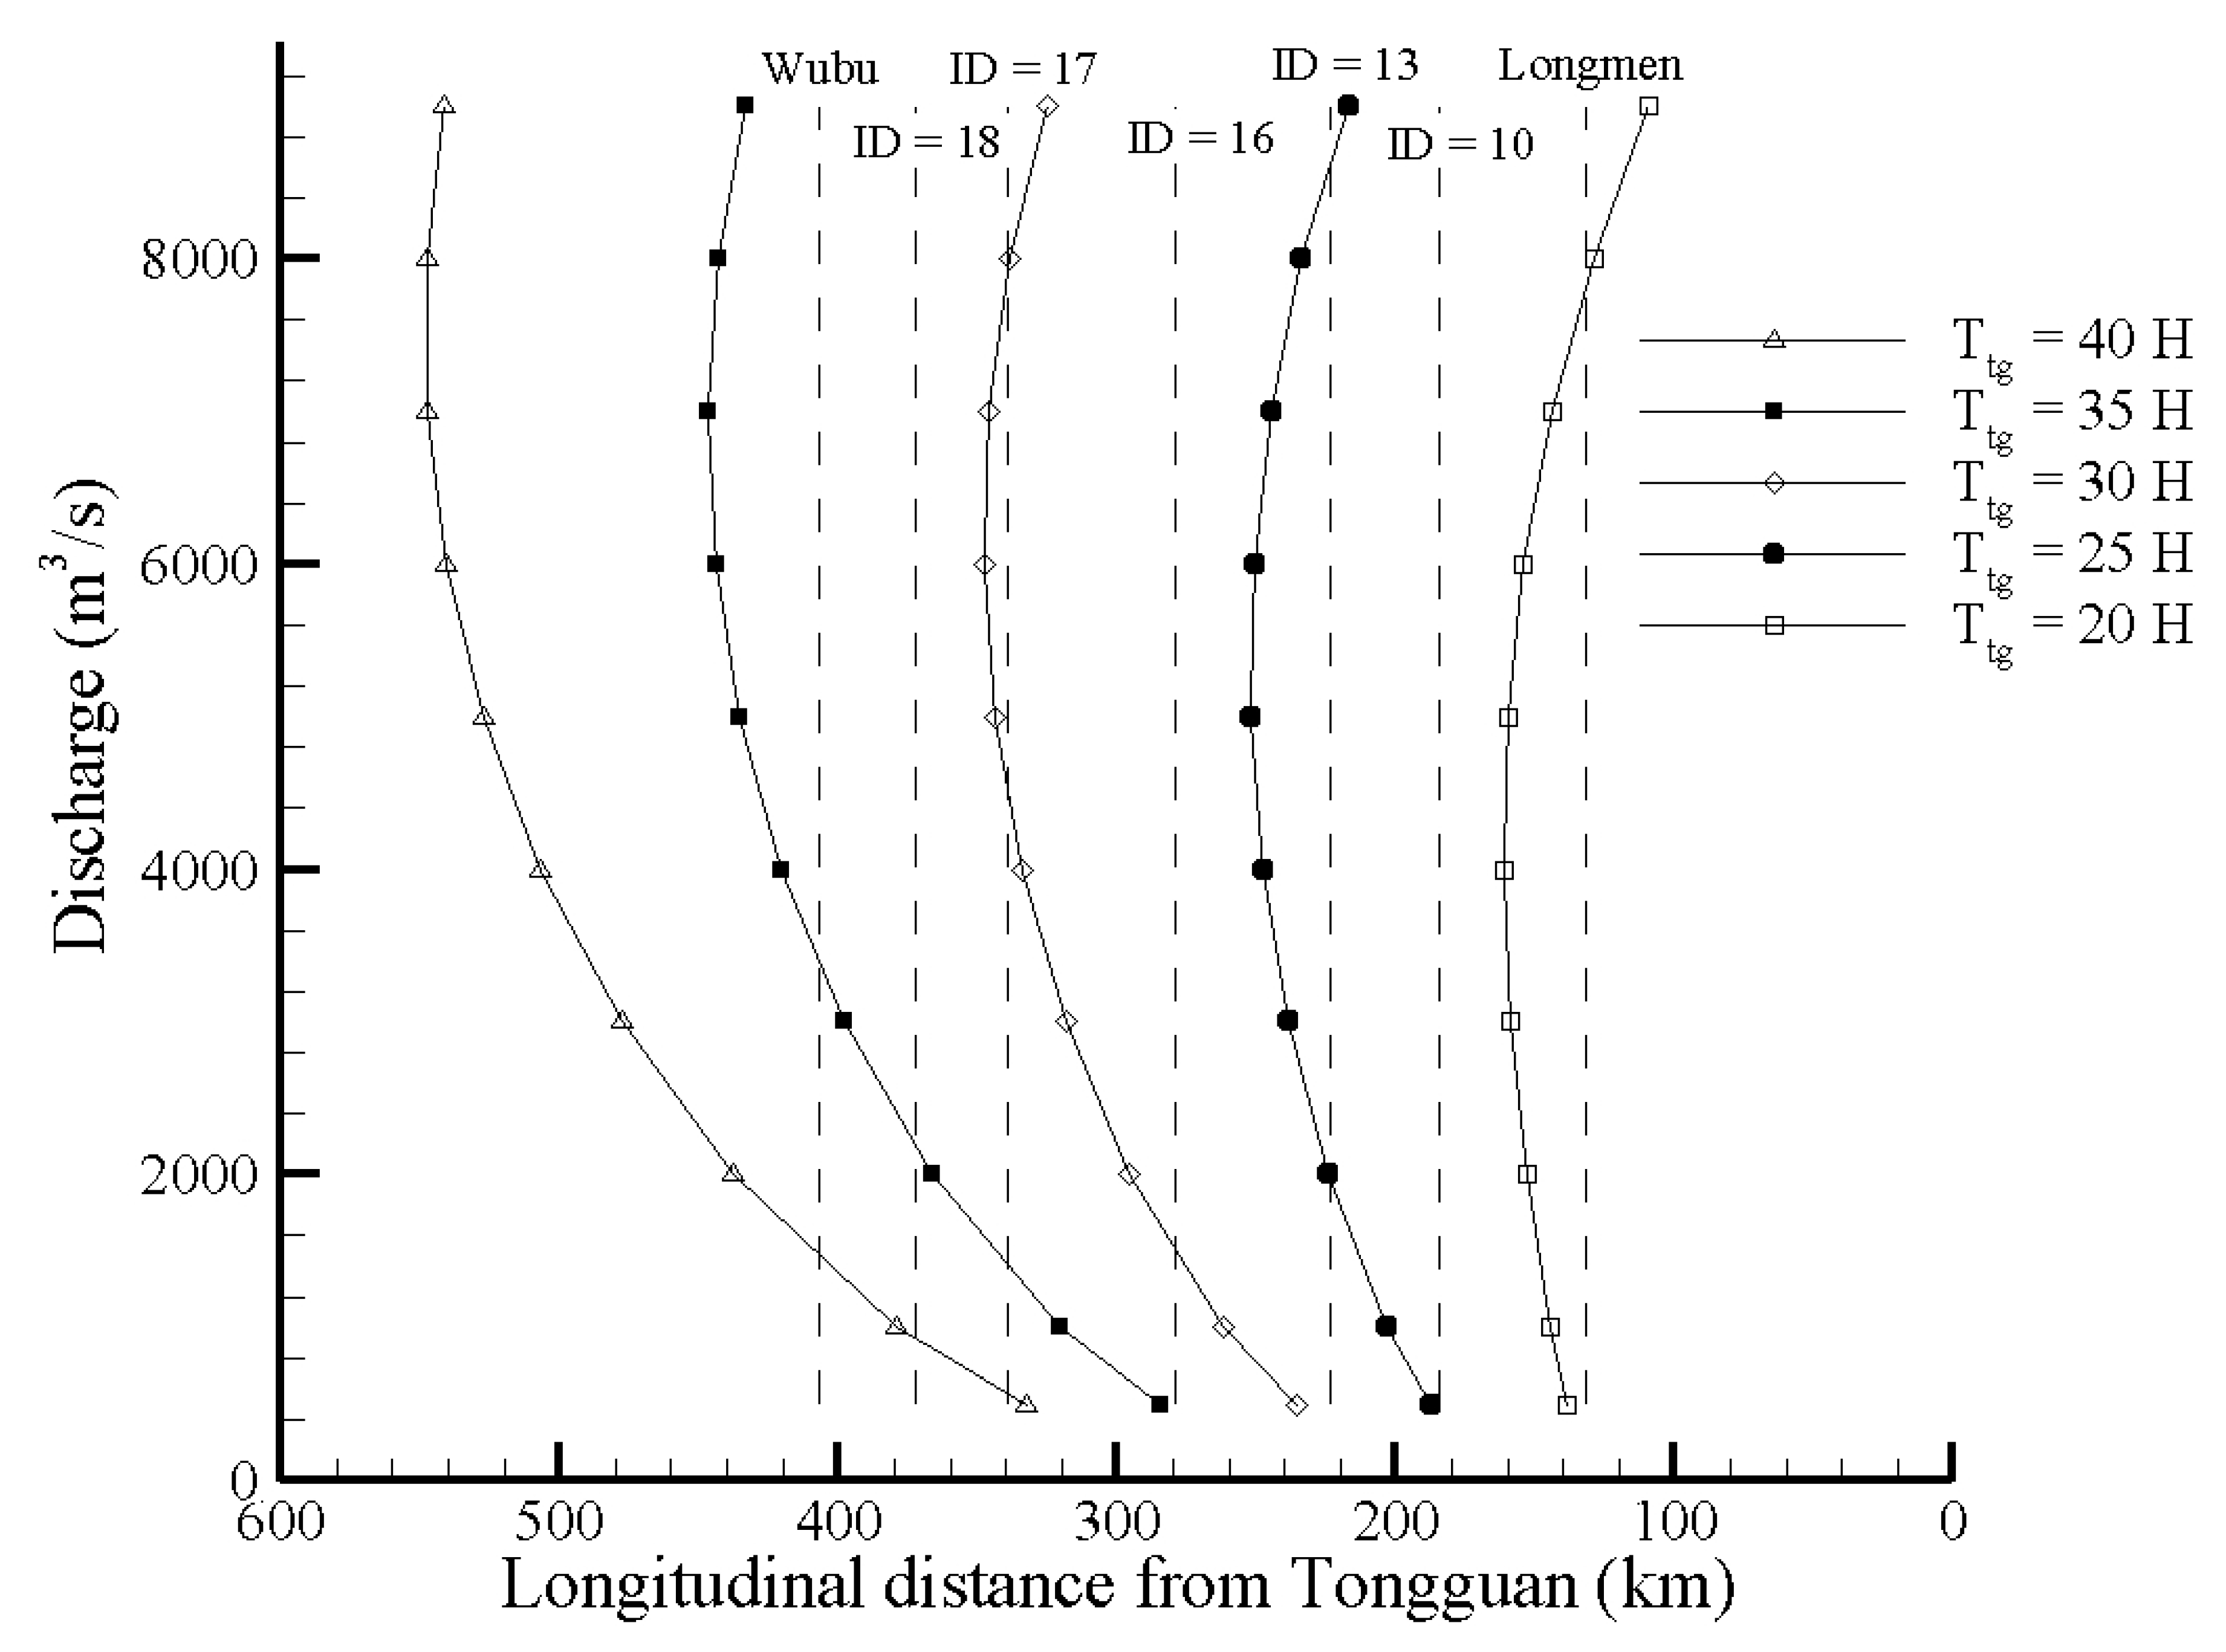
4.2. FTT of Floods with Different Discharges
4.3. Fitted Formula for FTT
4.4. Sensitivity Analysis of Model Parameters
5. Conclusions
- (1)
- The selected dynamic model can be used to simulate the traveling of flood along the Wubu-Tongguan (WT) Reach. This dynamic model could also be used to simulate the flood propagation and estimate the FTT in other drainage areas.
- (2)
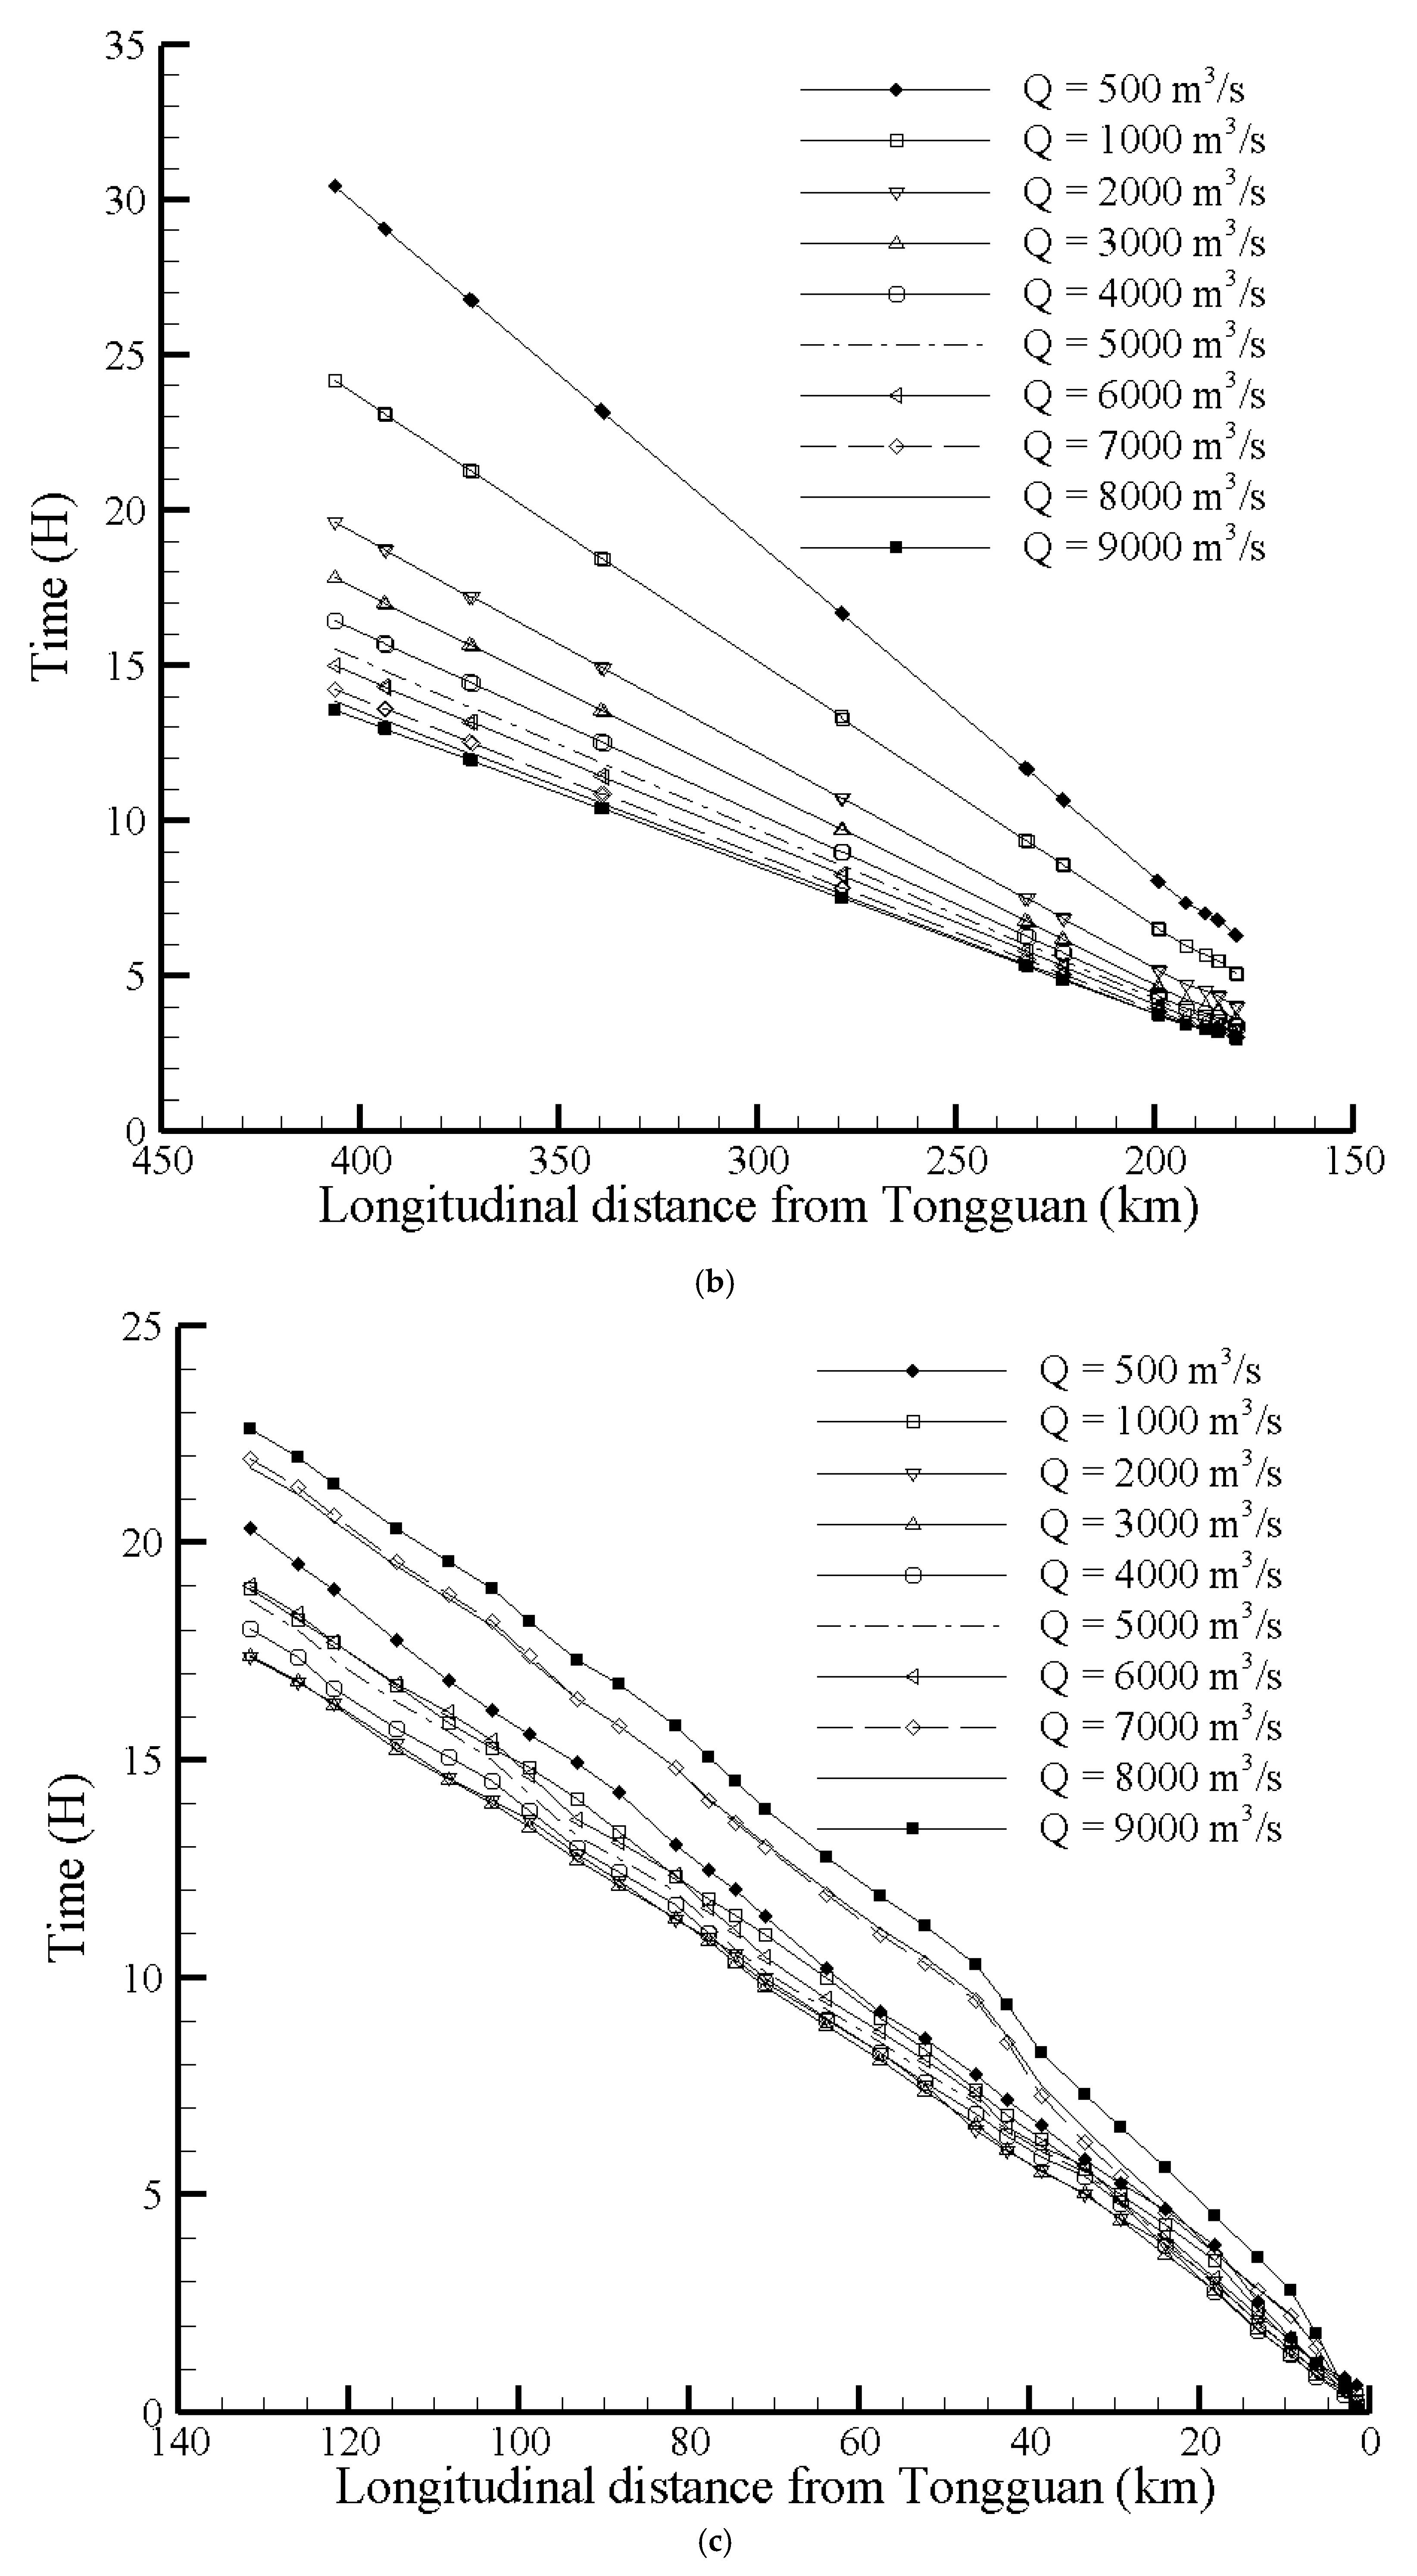
- For different river reaches, discharges with minimum FTT are different. For the river reach between Wubu and tributary 17 (Wuding River), the discharge with minimum FTT was approximately 6000 m3/s, and the corresponding FTT was approximately 30.4–34 h. For the river reach between tributaries 10 (Zhouchuan River) and 16 (Qingjian River), the discharge with minimum FTT and the corresponding FTT were 3000–3500 m3/s and 21–26.8 h, respectively. For the Longmen-Tongguan (LT) Reach, the discharge with minimum FTT and the corresponding FTT were 3000 m3/s and 17.4 h, respectively.
- (3)
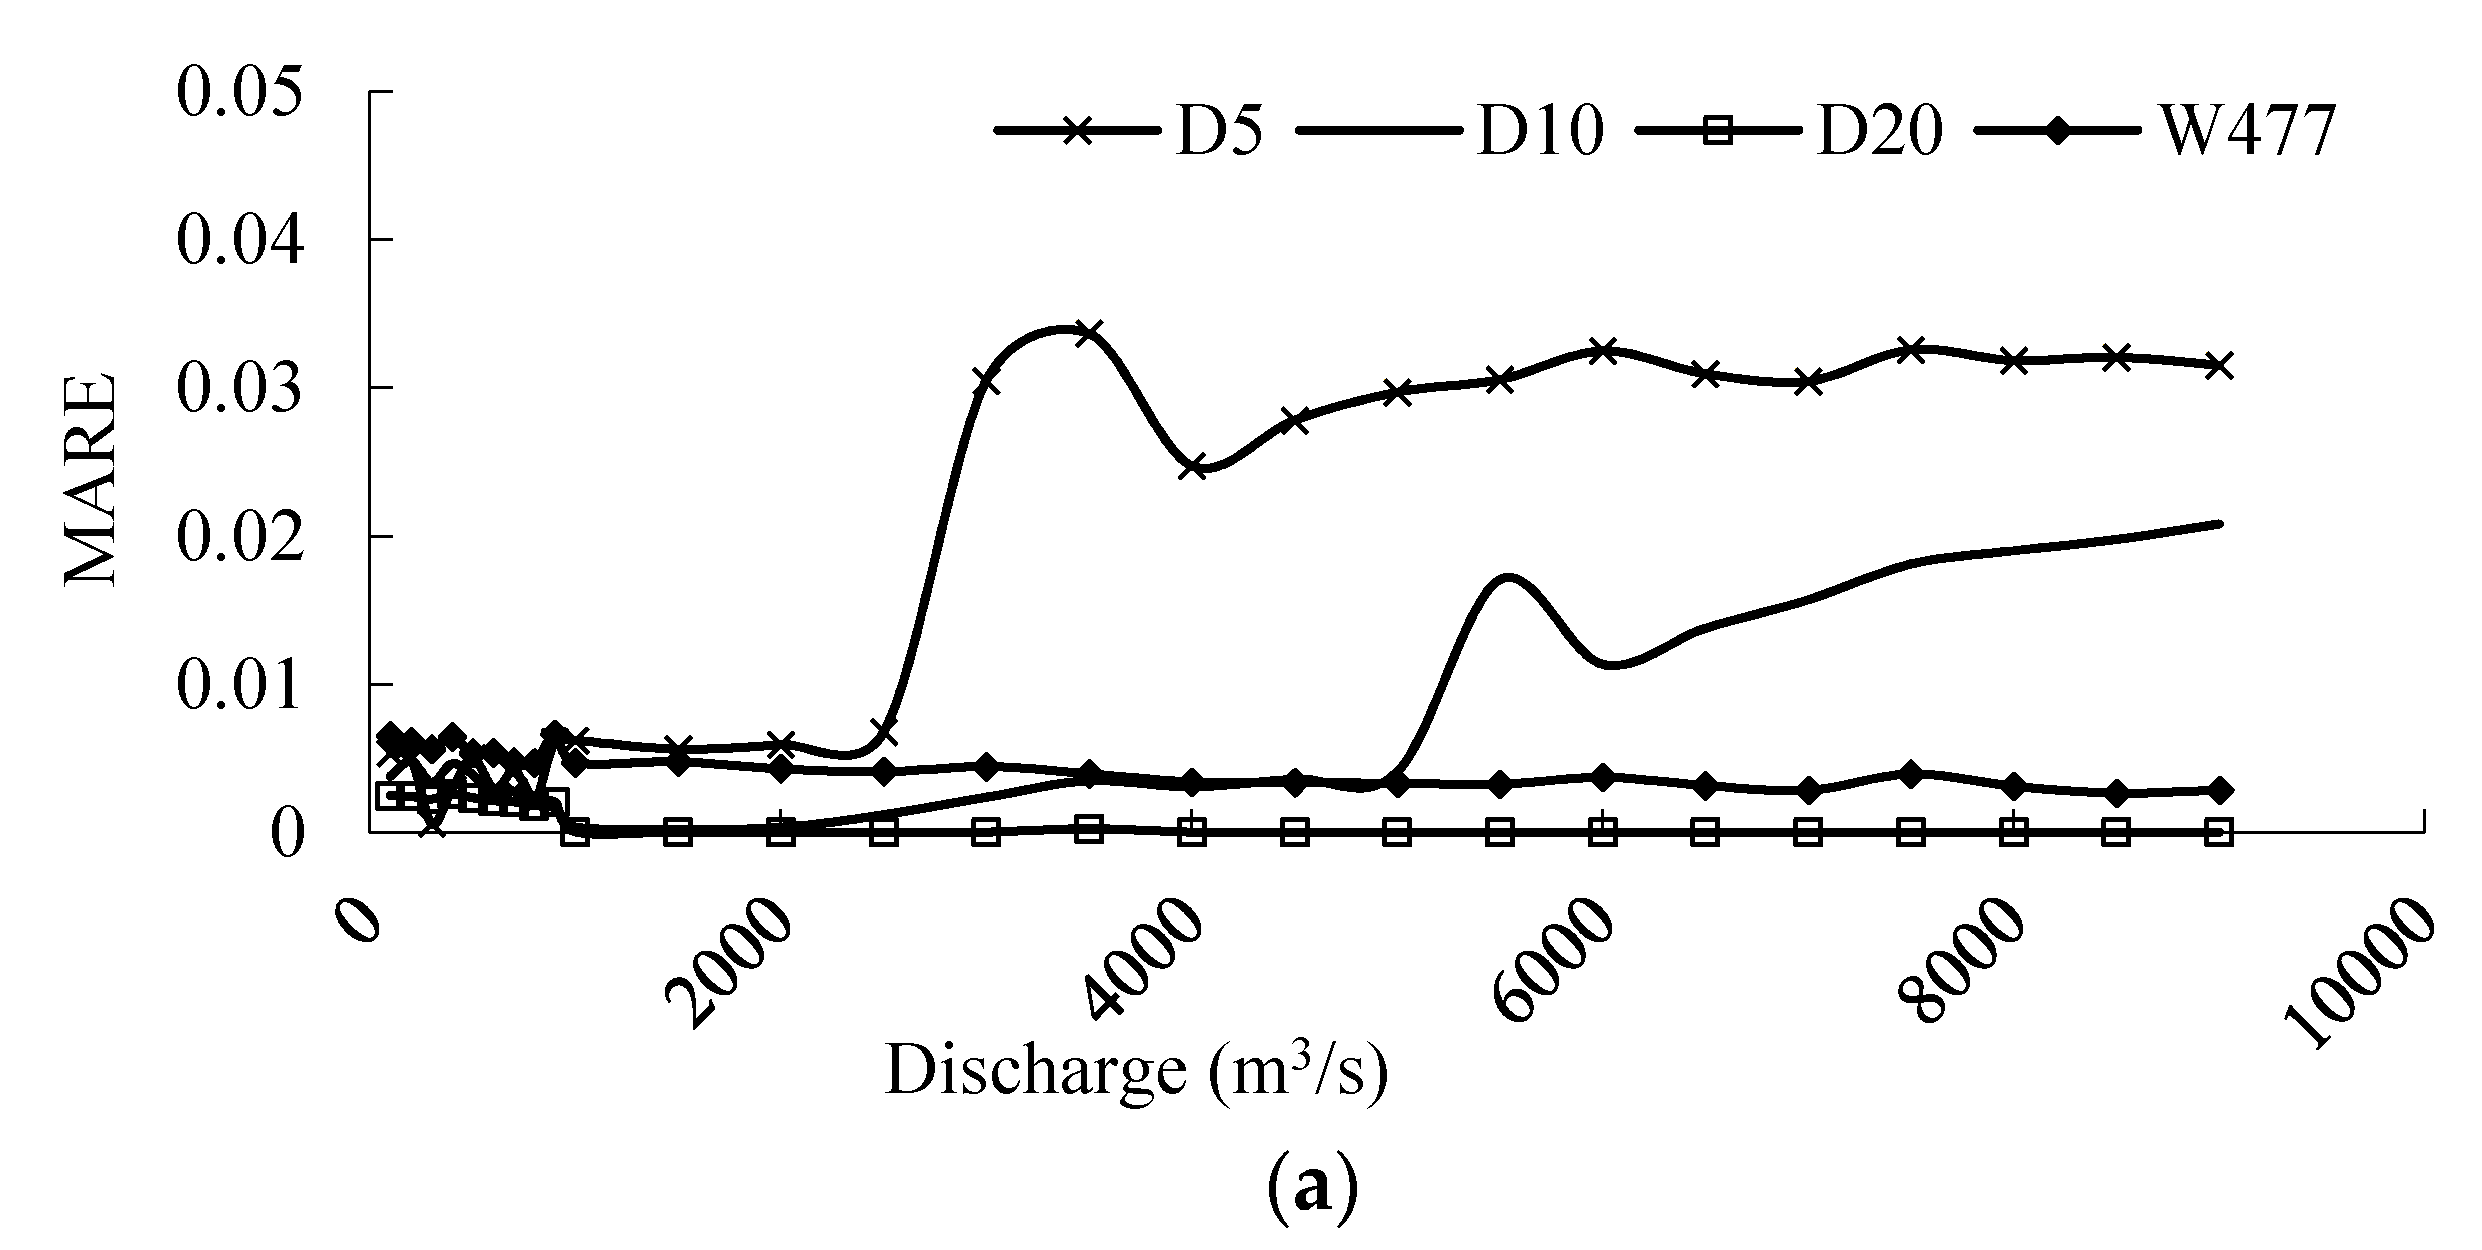
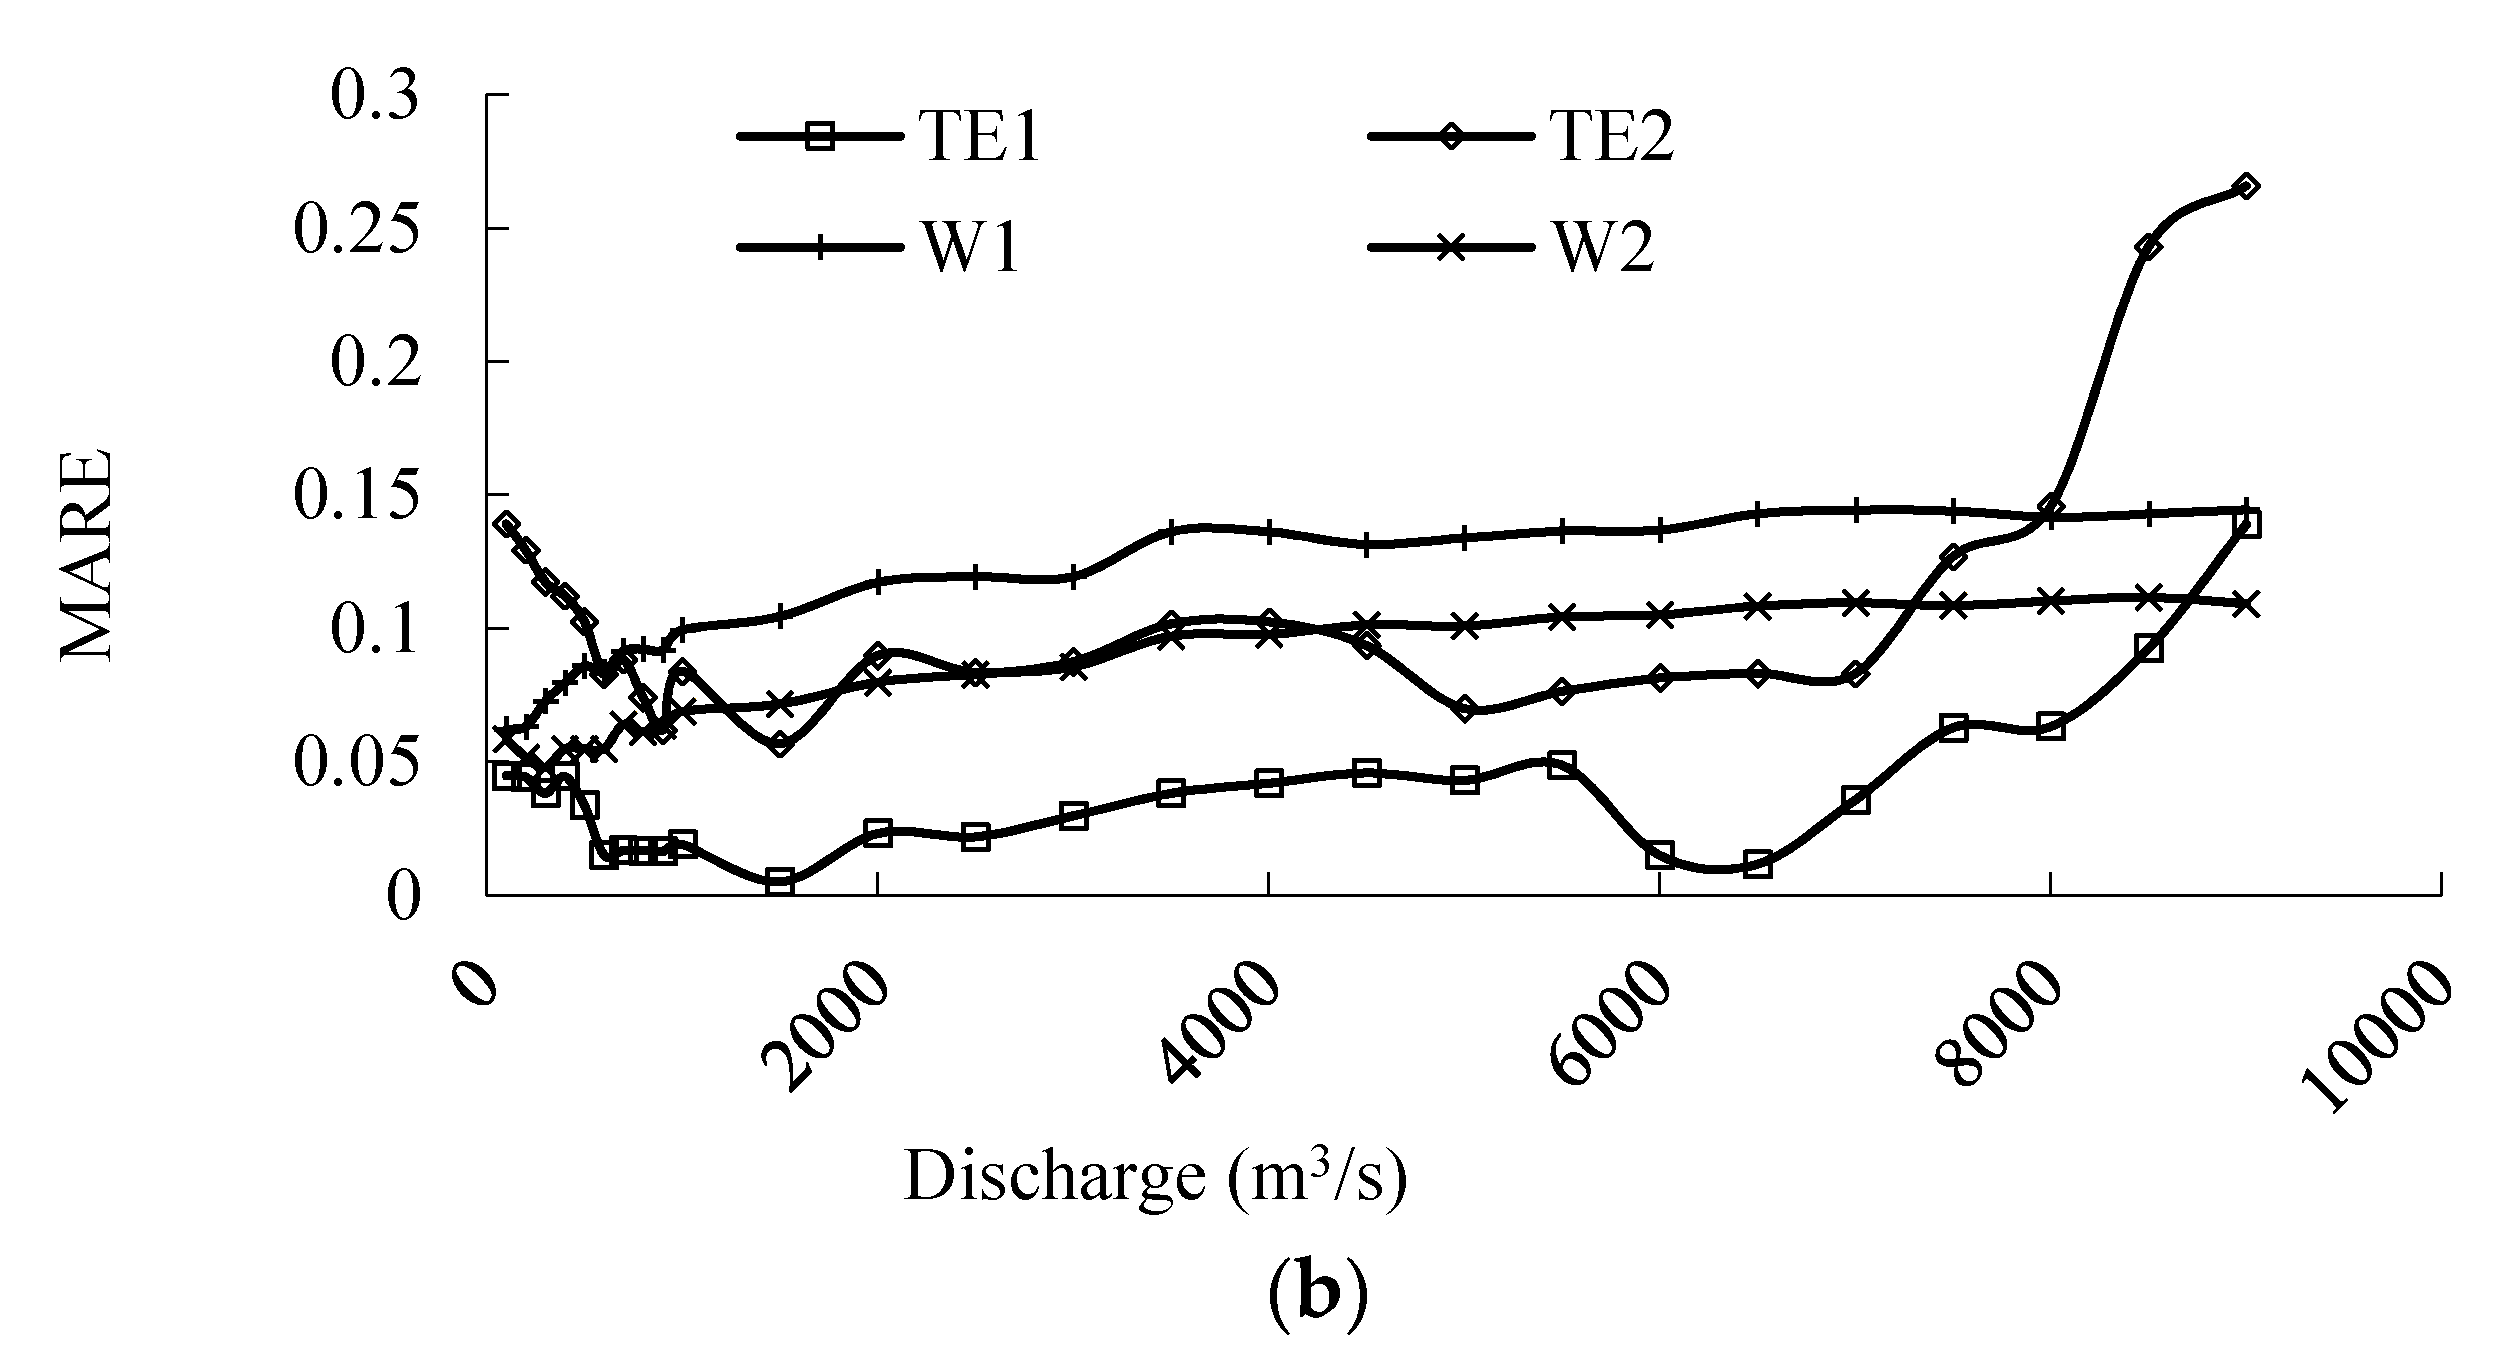
- The sensitivity analyses indicate that the FTT simulated by the numerical model are sensitive to the Tongguan elevation, roughness in the main channel, and the Weihe River.
Funding
Conflicts of Interest
References
- Wang, Y.J.; Dong, Q.H.; Zhou, H.Y. Analysis and numerical simulation of flood routing of upper reaches of the mainstream of Tarim River. Arid Land Geogr. 2018, 41, 1143–1150, (In Chinese with English abstract). [Google Scholar]
- Yan, B.W.; Huo, L.; Liang, J.; Yang, W.F. Discretization of the generalized Nash Model for flood routing. J. Hydrol. Eng. 2019, 24. [Google Scholar] [CrossRef]
- Hernandez-Andrade, J.A.; Martinez-Martinez, S.I. Flood routing on a reservoir: Hydrologic or hydraulic? Tecnol. Y Cienc. Del Agua 2019, 10, 147–177. [Google Scholar] [CrossRef]
- Qiao, X.; Nelson, E.J.; Ames, D.P.; Li, Z.; David, C.H.; Williams, G.P.; Roberts, W.; Lozano, J.L.S.; Edwards, C.; Souffront, M.; et al. A systems approach to routing global gridded runoff through local high-resolution stream networks for flood early warning systems. Environ. Model. Softw. 2019, 120. [Google Scholar] [CrossRef]
- Bozog-Haddad, O.; Abdi-Dehkordi, M.; Hamedi, F.; Pazoki, M.; Loaiciga, H.A. Generalized storage equations for flood routing with nonlinear Muskingum models. Water Resour. Manag. 2019, 33, 2677–2691. [Google Scholar] [CrossRef]
- Yang, W.L.; Wang, J.; Sui, J.Y.; Zhang, F.X.; Zhang, B.S. A modified Muskingum flow routing model for flood wave propagation during river ice thawing-breakup period. Water Resour. Manag. 2019, 33, 4865–4878. [Google Scholar] [CrossRef]
- Lee, E.H.; Lee, H.M.; Kim, J.H. Development and application of advanced Muskingum flood routing model considering continuous flow. Water 2018, 10, 760. [Google Scholar] [CrossRef]
- Hu, P.; Chen, B.; Shi, P.J.; Chen, X.H. A method of calculating travel time based on county center. J. Beijing Norm. Univ. (Nat. Sci.) 2018, 54, 781–789, (In Chinese with English abstract). [Google Scholar]
- Rong, Y.T.; Zhang, T.; Peng, L.; Feng, P. Three-dimensional numerical simulation of dam discharge and flood routing in Wudu Reservoir. Water 2019, 11, 2157. [Google Scholar] [CrossRef]
- Cheng, H.Y.; Chen, L.; Xu, Y.S. Surge wave and its propagation in upper Jingjiang Reach. Yangtze River 2016, 47, 30–47, (In Chinese with English abstract). [Google Scholar]
- Li, W.Y.; Yang, J.; Meng, X.L.; He, B.L. Characteristics of flood routing in the narrow reaches of the Lower Yellow River. Yellow River 2018, 40, 27–39, (In Chinese with English abstract). [Google Scholar]
- Yang, R.H. Prediction method of river course flood propagation time. Water Sci. Eng. Technol. 2012, 6, 16–19, (In Chinese with English abstract). [Google Scholar]
- Liu, C.J.; Liu, J. Application of modified method to estimate flood propagation time in the Middle Liaoning. Water Conserv. Tech. Superv. 2016, 24, 58. (In Chinese) [Google Scholar]
- Li, Q.; Shang, Z.R.; Guo, H.C. Propagation time of flood wave. Water Conserv. Hydropower Northeast China 2003, 21, 41. (In Chinese) [Google Scholar]
- Li, B.G.; Cui, Z.H. Variations in flood routing rules in Xiaobeiganliu Reach of the Yellow River. Yellow River 2018, 40, 12–16, (In Chinese with English abstract). [Google Scholar]
- He, L.; Wang, Y.B.; Fu, X.D.; Ji, Y.Q. Unsteady flow and sediment transport model in the Wubu-Tongguan reach of Yellow River. South North Water Divers. Water Sci. Technol. 2012, 10, 27–31, (In Chinese with English abstract). [Google Scholar] [CrossRef]
- He, L.; Wang, G.Q.; Zhang, C. Application of loosely coupled watershed model and channel model in Yellow River. J. Environ. Inf. 2012, 19, 30–37. [Google Scholar] [CrossRef]
- Ma, W.J.; Cai, W.Y.; Cao, S.L.; Bai, Y.H.; Rui, J.F. Analysis on discharge and sediment laden in the Middle Yellow River. In Proceedings of the 7th Symposium Proceedings of the Professional Committee of China Hydropower Engineering Society Hydrology and Sediment, Hangzhou, China, 1 October 2007; pp. 54–58. (In Chinese). [Google Scholar]
- Liu, D.X.; Zhao, J.Y.; Cui, D.H.; Ma, W.J. Analysis on discharge and sediment laden in the Middle Yellow River. Water Resour. Hydropower Northeast China 2011, 6, 40–41, (In Chinese with English abstract). [Google Scholar] [CrossRef]
- He, L.; Wang, G.Q.; Li, T.J. Catchment division of the water and sediment yield system and drainage network codification of the key region in the middle Yellow River basin. J. Sediment Res. 2009, 2, 39–45, (In Chinese with English abstract). [Google Scholar] [CrossRef]
- He, L.; Fu, X.D. Distribution of flood travel time along the Wubu-Tongguan Reach of Yellow River. South North Water Divers. Water Sci. Technol. 2012, 10, 18–21; 26, (In Chinese with English abstract). [Google Scholar] [CrossRef]
- Fan, L.J.; Huang, C.C.; Pan, J.L.; Zha, X.C.; Zhou, Y.L.; Li, X.G.; Liu, T. Sedimentary records of palaeofloods in the Wubu Reach along the Jin-Shaan gorges of the Middle Yellow River, China. Quat. Int. 2015, 380–381, 368–376. [Google Scholar] [CrossRef]
- Cimorelli, L.; Cozzolino, L.; Morte, R.D.; Poanese, D.; Singh, V.P. A new frequency domain analytical solution of a cascade of diffusive channels for flood routing. Water Resour. Res. 2015, 51, 2393. [Google Scholar] [CrossRef]
- Serrano, S.E. Propagation of nonlinear flood waves in rivers. J. Hydrol. Eng. 2016, 21, 04015053. [Google Scholar] [CrossRef]
- Rak, G.; Kozelj, D.; Steinman, F. The impact of floodplain land use on flood wave propagation. Nat. Hazards 2016, 83, 425–443. [Google Scholar] [CrossRef]
- Hoch, J.M.; Haag, A.V.; Dam, A.V.; Winsemius, H.C.; Van Beek, L.P.H.; Bierkens, M.F.P. Assessing the impact of hydrodynamics on larger-scale flood wave propagation–a case study for the Amazon Basin. Hydrol. Earth Syst. Sci. 2017, 21, 117–132. [Google Scholar] [CrossRef]
- He, L.; Duan, J.; Wang, G.Q.; Fu, X.D. Case study: Numerical simulation of unsteady hyper-concentrated sediment-laden flow in the Lower Yellow River. J. Hydraul. Eng. 2012, 138, 958–969. [Google Scholar] [CrossRef]
- He, L. Application of 1D Finite Volume Model of Unsteady Flow in Wubu-Tongguan Reach, Middle Yellow River; CRC Press: Tokyo, Japan, 2013; ISSI2013. [Google Scholar]
- Liu, L.Q.; Jiang, X.H.; Tao, X.; Sun, W.J. Analysis of “03.7” flood characteristics in the middle reach of Yellow River. J. Water Resour. Water Eng. 2004, 15, 63–66, (In Chinese with English abstract). [Google Scholar]
- Cheng, W.; Cao, R.X.; Qian, Q.S.; Wang, X.H. A mathematical model for silt discharge of unconstant and unbalance about Xiaobeigan River. J. Hydrodyn Ser. A 1999, 14, 395–400, (In Chinese with English abstract). [Google Scholar] [CrossRef]
- Liang, G.T.; Gao, Y.T.; Liang, Y.P.; Gong, J. Establishing of unsteady simulation model and its application. J. Sediment Res. 1999, 4, 24–29, (In Chinese with English abstract). [Google Scholar] [CrossRef]
- He, L.; Xia, J.Q.; Wang, G.Q. Estimating methods and application of flood propagation time and channel storage capacity in the Lower Yellow River. In Proceedings of the 6th National Symposium on Basic Theory of Sediment (V ii), Zhengzhou, China, 22–25 November 2005; pp. 744–749. (In Chinese). [Google Scholar]
- Cheng, L.Y.; Guo, X.Q.; Zhang, S.L.; Zheng, Y.F.; Liu, Y.E.; Ma, X.M. Effect of flood synthesis at Tongguan Station on the Weihe River and the Beiluohe River. J. Sediment Res. 2004, 6, 31–35, (In Chinese with English abstract). [Google Scholar] [CrossRef]
- Jiao, E.Z.; Zhang, C.P. Sediment transportation and deposit in North Main Reaches of Yellow River. Yellow River 1995, 11, 1–5. (In Chinese) [Google Scholar]
- Liu, Z.H. Paleohydrologic analysis of the Yellow River Hukou Waterfall and reconstructing the runoff rime series. Adv. Water Sci. 1995, 6, 218–223. (In Chinese) [Google Scholar]
- Zhang, H.W.; Huang, Y.D.; Zhao, L.J. A mathematical model for unsteady sediment transport in the lower Yellow River. Int. J. Sediment Res. 2001, 16, 150–158. [Google Scholar]
- Zhang, X.J.; Liu, P.; Cheng, L.; Liu, Z.J.; Zhao, Y. A back-fitting algorithm to improve real-time flood forecasting. J. Hydrol. 2018, 562, 140–150. [Google Scholar] [CrossRef]
- Nash, J.E.; Sutcliffe, J.V. River flow forecasting through conceptual models part I—A discussion of principles. J. Hydrol. 1970, 10, 282–290. [Google Scholar] [CrossRef]
- Khalil, M.; Panu, U.S.; Lennox, W.C. Groups and neural networks based streamflow data infilling procedures. J. Hydrol. 2001, 241, 153–176. [Google Scholar] [CrossRef]
- Green, I.R.A.; Stephenson, D. Criteria for comparison of single event models. Hydrol. Sci. J. Des Sci. Hydrol. 1986, 31, 395–411. [Google Scholar] [CrossRef]
- Lin, G.F.; Chen, L.H. A non-linear rainfall-runoff model using radial basis function network. J. Hydrol. 2014, 289, 1–8. [Google Scholar]
- Zheng, Y.F.; Shi, Y.M.; Ding, X.B.; Li, G.Y.; Wen, J.; Zhang, Y.H.; Liu, H.X. Shrinkage by sedimentation in the Longmen-Tongguan Reach and the lower Weihe River. Water Resour. Hydropower Northeast 2008, 26, 45–47. (In Chinese) [Google Scholar] [CrossRef]
- Wu, B.S.; Wang, G.Q.; Wang, Z.Y.; Xia, J.Q. Effect of changes in flow runoff on the elevation of Tongguan in Sanmenxia Reservoir. Chin. Sci. Bull. 2004, 49, 1658–1664. [Google Scholar] [CrossRef]
- Zhang, L.H. Analysis of the present situation of open channels roughness. Shuili Xuebao 2012, 43, 1154–1162, (In Chinese with English abstract). [Google Scholar] [CrossRef]


| Tributary | ID | Drainage Area (km2) | Hydrology Station | |||
|---|---|---|---|---|---|---|
| Area a | Area b | Name | Distance c (km) | Distance d (km) | ||
| Sanchuan River | 19 | 4161 | 4075 | Houdacheng | 24.5 | 1528.9 |
| Quchan River | 18 | 1220 | 1023 | Peigou | 17.7 | 1509.7 |
| Wuding River | 17 | 30,261 | 29,662 | Baijiachuan | 58.5 | 1476.5 |
| Qingjian River | 16 | 4080 | 3468 | Yanchuan | 37.9 | 1415.7 |
| Zhi River | 15 | - | - | - | - | - |
| Xinshui River | 14 | 4326 | 3992 | Daning | 36.6 | 1368.7 |
| Yanshui River | 13 | 7687 | 5891 | Ganguyi | 112 | 1360 |
| Fenchuang River | 12 | 1785 | 1720 | Xinshihe | 23.4 | 1335.8 |
| Shiwangchuang River | 11 | 2356 | 2141 | Dacun | 28.7 | 1320.7 |
| Zhouchuang River | 10 | 647 | 436 | Jixian | 22.8 | 1314.1 |
| Indicator | Longmen | Tongguan | Note | ||
|---|---|---|---|---|---|
| Discharge | Concentration | Discharge | Concentration | ||
| NSE Equation(8) | 0.92 | 0.45 | 0.68 | −0.56 | Daily |
| MARE Equation (9) | 0.10 | 0.4 | 0.18 | 0.86 | Daily |
| PEP Equation (10) | 0.09 | 0.22 | 0.09 | 0.55 | Flood event |
| (H) Equation (11) | 3.0 | 3.0 | 7.5 | 3.0 | Flood event |
| - | - | |||||
| Equation (12) | 0.5945 | 0.2804 | 76.872 | 0.2883 | - | - |
| Equation (13) | 1 × 10⁻⁹ | −8 × 10⁻⁶ | 0.1484 | −4 × 10⁻⁸ | 3 × 10⁻⁴ | −0.8285 |
| Randomly Selected Parameters | Calibrated Parameters | |||
|---|---|---|---|---|
| Case | Scenario | Physical Variable | Mean | |
| 1 | D5 | Drop of the Hukou Waterfall | 5 m | 30 m |
| 2 | D10 | 10 m | ||
| 3 | D20 | 20 m | ||
| 4 | W477 | Width of cross-sections upstream and downstream the Hukou Waterfall are the same as that of Wubu Station | 477 m | With of cross-sections upstream and downstream the Hukou Waterfall are 300 m and 50 m, respectively |
| 5 | TE1 | Tongguan elevation | Increased by 0.86 m | Tongguan Elevation estimated by stage-versus-discharge rating curve at Tongguan (2010) |
| 6 | TE2 | Increased by 1.72 m | ||
| 7 | W1 | Roughness of the main channel of the LT reach | 0.014 | Back-calculated using the measured stage-versus-discharge rating curve at reach hydrology station |
| 8 | W2 | 0.018 | ||
© 2020 by the author. Licensee MDPI, Basel, Switzerland. This article is an open access article distributed under the terms and conditions of the Creative Commons Attribution (CC BY) license (http://creativecommons.org/licenses/by/4.0/).
Share and Cite
He, L. Estimation of Flood Travel Time in River Network of the Middle Yellow River, China. Water 2020, 12, 1550. https://doi.org/10.3390/w12061550
He L. Estimation of Flood Travel Time in River Network of the Middle Yellow River, China. Water. 2020; 12(6):1550. https://doi.org/10.3390/w12061550
Chicago/Turabian StyleHe, Li. 2020. "Estimation of Flood Travel Time in River Network of the Middle Yellow River, China" Water 12, no. 6: 1550. https://doi.org/10.3390/w12061550
APA StyleHe, L. (2020). Estimation of Flood Travel Time in River Network of the Middle Yellow River, China. Water, 12(6), 1550. https://doi.org/10.3390/w12061550