Concept Paper

An Integrative Information Aqueduct to Close the Gaps between Satellite Observation of Water Cycle and Local Sustainable Management of Water Resources

by
Zhongbo Su
1,*,
Yijian Zeng
1,*,
Nunzio Romano
2,3,
Salvatore Manfreda
4,
Félix Francés
5,
Eyal Ben Dor
6,
Brigitta Szabó
7,
Giulia Vico
8,
Paolo Nasta
2,
Ruodan Zhuang
9,
Nicolas Francos
6,
János Mészáros
7,
Silvano Fortunato Dal Sasso
9,
Maoya Bassiouni
8,
Lijie Zhang
1,
Donald Tendayi Rwasoka
1,
Bas Retsios
1,
Lianyu Yu
1,
Megan Leigh Blatchford
1 and
Chris Mannaerts
1
1
Faculty of Geo-Information Science and Earth Observation, University of Twente, Hengelosestraat 99, 7514 AE Enschede, The Netherlands
2
Department of Agricultural Sciences, AFBE Division, University of Napoli Federico II, 80055 Napoli, Italy
3
Interdepartmental Center for Environmental Research, Univ. of Napoli Federico II, Via Università 100, 80055 Napoli, Italy
4
Department of Civil, Architectural and Environmental Engineering, University of Naples Federico II, via Claudio 21, 80125 Napoli, Italy
5
Research Institute of Water and Environmental Engineering, Universitat Politècnica de València, 46022 València, Spain
6
Department of Geography and Human Environment, Tel Aviv University, Tel Aviv 6997801, Israel
7
Institute for Soil Sciences and Agricultural Chemistry, Centre for Agricultural Research, H-1022 Budapest, Hungary
8
Department of Crop Production Ecology, Swedish University of Agricultural Sciences, 750 07 Uppsala, Sweden
9
Department of European and Mediterranean Cultures, Architecture, Environment, Cultural Heritage, University of Basilicata, 75100 Matera, Italy
*
Authors to whom correspondence should be addressed.
Water 2020, 12(5), 1495; https://doi.org/10.3390/w12051495
Submission received: 29 February 2020 / Revised: 15 May 2020 / Accepted: 17 May 2020 / Published: 23 May 2020

Abstract

:
The past decades have seen rapid advancements in space-based monitoring of essential water cycle variables, providing products related to precipitation, evapotranspiration, and soil moisture, often at tens of kilometer scales. Whilst these data effectively characterize water cycle variability at regional to global scales, they are less suitable for sustainable management of local water resources, which needs detailed information to represent the spatial heterogeneity of soil and vegetation. The following questions are critical to effectively exploit information from remotely sensed and in situ Earth observations (EOs): How to downscale the global water cycle products to the local scale using multiple sources and scales of EO data? How to explore and apply the downscaled information at the management level for a better understanding of soil-water-vegetation-energy processes? How can such fine-scale information be used to improve the management of soil and water resources? An integrative information flow (i.e., iAqueduct theoretical framework) is developed to close the gaps between satellite water cycle products and local information necessary for sustainable management of water resources. The integrated iAqueduct framework aims to address the abovementioned scientific questions by combining medium-resolution (10 m–1 km) Copernicus satellite data with high-resolution (cm) unmanned aerial system (UAS) data, in situ observations, analytical- and physical-based models, as well as big-data analytics with machine learning algorithms. This paper provides a general overview of the iAqueduct theoretical framework and introduces some preliminary results.

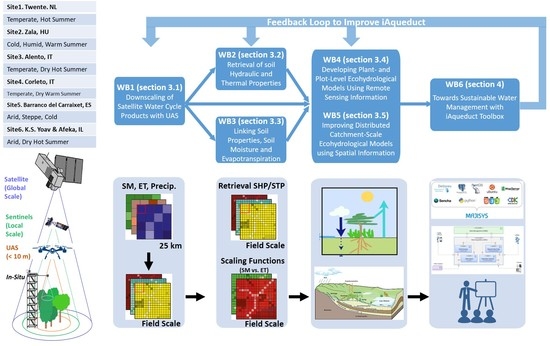
Graphical Abstract

1. Introduction

1.1. Background

Water resources in many regions, including Europe, are under increasing pressure, due to population growth, economic development, and climate change [1,2]. The main water challenge for Europe is to develop appropriate skills, knowledge, and tools to offer solutions that guarantee sustainable use of resources in natural and agricultural ecosystems while maintaining their economic prosperity [3]. Addressing such a challenge requires, among others, developing tools for sustainable integrative management of water resources, establishing networks and information sharing among existing research facilities/field labs and disciplines, and connecting science to society [3].
Water resources management requires new monitoring tools and strategies to better understand hydrological processes. This is crucial to analyze and forecast the effectiveness of water management options, in particular in adaptation to climate changes. Observation of hydrological cycle components can be obtained from different sources [4,5,6,7,8]. While in situ observations provide the most reliable data for the relevant observation scale (e.g., at the centimeter scale for typical soil moisture sensors), such observations are in general inadequate in addressing water management problems, which require continuous space–time information from the local to field scale [4,5,9]. At low spatial scales, various satellite missions monitor the global water cycle, especially for the variables related to precipitation, evapotranspiration, and soil moisture but often at (tens of) kilometer scales [5]. Whilst these data are highly effective to characterize water cycle variation at the regional to global scale, they are less suitable for the management of water resources at field and catchment scales [10,11,12]. While there are sensors in orbits that provide high-spatial resolution observations (15–40 m) of certain water cycle components (e.g., with ASTER [13], LANDSAT 7/8 [14], ECOSTRESS [15]), they lack daily data to satisfy the information needs for operational water management.
Water resource management needs to consider a wide range of spatial scales and addresses a variety of problems linked to droughts and water availability [16], requiring the measurement of water cycle variables (e.g., root zone soil moisture, evapotranspiration, precipitation, stream discharge as well as groundwater levels, etc.). Next, we focus primarily on the current state-of-the-art in precipitation, evapotranspiration, and soil moisture that can be routinely provided by global satellites at low to medium spatial (e.g., 25 km to 1 km) and daily temporal resolutions:
Precipitation: Numerous evaluations of available satellite precipitation products have been conducted [17] for different climates, and several data sets, for example, CMORPH, CHIRPS, and TRMM (and by extension GPM [18]), showed consistently high performance [19]. Nevertheless, there remains the necessity for downscaling these global products to local estimates, while accounting for their spatiotemporal error characteristics and the relation of such errors to rain rates [20].
Evapotranspiration (ET): In the past years, several satellite evapotranspiration products have been generated, among which, the MOD16 (MODIS, Moderate Resolution Imaging Spectroradiometer) -ET [21] at a 1-km and daily interval, PM (Penman-Monteith) -ET [22] at an 8-km and monthly interval, GLEAM (Global Land Evaporation Amsterdam Model)-ET [23] at a 25-km and daily interval, ALEXI (Atmosphere-Land Exchange Inverse)-ET [24] at various spatial and temporal scales, and SEBS (Surface Energy Balance System)-ET [25,26,27] at a 5-km and monthly and daily scale. Evaluations of these and other global evapotranspiration products (e.g., [28,29,30]) concluded that all have different uncertainties for local scale studies. It was found that ET differences between the models are mainly due to the difference in aerodynamic conductance and associated roughness length estimation uncertainties, which are intrinsically connected to uncertainties of the radiometric surface temperature, vapor pressure deficit, and vegetation cover [31].
Soil moisture: Satellite observation of soil moisture has significantly advanced in the last decade as demonstrated by two dedicated missions (the Soil Moisture Ocean Salinity—SMOS [32], and the Soil Moisture Active and Passive—SMAP [33]. Most recently, the terrestrial water storage anomaly data acquired from the Gravity Recovery and Climate Experiment (GRACE) satellite has also been used to derive soil moisture and found to be highly correlated with the SMAP and SMOS soil moisture products [34]. These efforts provide soil moisture products at nearly daily temporal resolution (but monthly for GRACE soil moisture) and low spatial resolution (e.g., 35–50 km for SMOS, 36 km for SMAP, and 300 km for GRACE).
The spatial scale of the abovementioned products is, however, too coarse for a large variety of applications. Therefore, there is a growing need to develop a downscaling procedure in order to reach a reference scale comparable with the emerging hyper-resolution modelling trend [35] and much finer resolution for water resources management. The spatial and temporal variability of the soil moisture process has been investigated by several authors that provided a clear path for the description of its dynamics [9,36,37,38,39,40]. In this context, Qu et al. (2015) [41] developed a method to predict the sub-grid variability of soil moisture based on basic soil data.
To estimate soil moisture at higher resolution, active microwave synthetic aperture radars (SARs) have been employed (such as Sentinel-1), which are capable of providing 1-km daily soil moisture products [42,43]. Other methods exploit optical and thermal images to downscale low-resolution products to 1 km (e.g., [44]) often in combination with modelling approaches [45]. Optical remote sensing methods can be used to assess the surface soil moisture from airborne hyperspectral sensors [46,47]. Broadband thermal imaging is a potential mean to measure soil moisture via the water stress of the leaves [48]. Estimation of soil water evaporation using broad-band thermal imagery acquired from the ground was also possible [49,50].
Soil moisture monitoring is also limited because satellite sensors only provide surface measurements (up to 5 cm in the soil). Therefore, methods able to infer root-zone soil moisture (RZSM) from surface measurements are highly desirable [51,52]. To do so, Wagner et al. [53] suggested the use of an exponential filter, and recently, a new simplified formal mathematical description was proposed [16]. The SMAR (soil moisture analytical relationship) model has been coupled with ensemble Kalman filter (EnKF) to reduce bias [54] and predict RZSM over broad spatial extents.

1.2. Motivation

Other than Earth observations, models provide an alternative way to link different scales and different processes, but the reliability of model output strongly depends on the physical processes considered, which in turn requires detailed information on the state of the soil and vegetation systems and relevant forcing at the scale of interest. Therefore, there is a pressing need to harmonize the available information on the soil/vegetation system to develop a feasible approach for actual water management. Furthermore, such detailed information needs to be communicated to the stakeholders (in particular citizens) so as to support them towards desirable behavior in water management. The recent example is the 2018 summer drought, which posed challenges for water availability in vast regions in Europe, including some ill prepared to cope with water scarcity [55]. Climate change presents additional challenges regarding the preparedness and adaptation to future extremes, because similar or worse future events to that in 2018 may be expected more frequently [56].
In order to address these challenges/needs, new strategies and methods must be developed to further exploit satellite water cycle observation (at low resolution), the Copernicus satellite data, and future missions (with medium spatial resolutions (10 m–1 km) and high spectral resolutions), enabling the end-user-oriented description of agricultural and natural ecosystems. Those ecosystems, especially in Europe and the Mediterranean basin, are characterized by high spatial heterogeneity in physical characteristics and as a consequence in soil moisture and evapotranspiration patterns. Such heterogeneity can be measured only via in situ observations or by airborne sensors and UAS (unmanned aerial system) with high resolutions (spatially in centimeters and spectrally in tens of bands). This last technology may open a new potential strategy in the study of soil properties, soil moisture, and vegetation coverage and states, given its ability to provide observations with a level of detail comparable with field observations but over much larger areas than the latter can achieve [4].
Although there is a wealth of studies deploying in situ, UAS, airborne, satellite sensors, and relevant models for sustainable water resource management [9,57,58,59], the fully integrated use of different monitoring technologies and modelling approaches is rarely reported to discover physical connections between soil properties, soil moisture, and evapotranspiration from the point scale to regional scales. With multiple sources/scales of Earth observation (EO) data and models, an integrative information flow (i.e., the iAqueduct theoretical framework) can be realized to close the gaps between satellite water cycle products and local information needs for sustainable management of water resources. In what follows, we will address the stakeholder requirements, knowledge gaps, and theoretical framework of iAqueduct (in Section 2); the detailed working blocks of the iAqueduct framework and some preliminary results for the “proof of concepts” (in Section 3); and a perspective toward sustainable water management (in Section 4).

2. Connecting Science to Society: iAqueduct Framework

2.1. Stakeholder Requirements and Potential Knowledge Gaps

To address the panoply of scaling issues described above and the multitude of user requirements (see Appendix A), iAqueduct will deploy six field observatories (five across Europe and one in Israel) for intensive studies: (i) The Twente site in the Netherlands, which serves as a core international site for SMOS/SMAP cal/val activities; (ii) the Zala catchment in Hungary, which has served as a study site for analyzing the performance of the European pedotransfer functions in deriving soil hydraulic maps; (iii) the Sde Yoav field in Israel, which is a well-documented site for soil investigation in Israel; (iv) the Alento River Hydrological Observatory in Italy, where intensive soil moisture and hydrological observations and modelling have been conducted; (v) the Corleto area in Italy, which has been used for detailed UAS research; and (vi) the Barranco del Carraixet area in Spain, a study site for dry land water management and interaction with stakeholders. The detailed description of each observatory and associated stakeholder requirements are given in Appendix A.
The analysis of stakeholder requirement identifies the need to support and facilitate the establishment of water management policies; addressing rapid climatic changes by involving researchers, water management authorities, companies, and farmers; and strongly supporting progress based on previous findings in each site/catchment and by dealing with local needs. In other words, the stakeholder calls for the translation of science and knowledge (about the response of hydrological cycle and water resources to climate change), into marketable tools, services, and/or products for the sustainable management of water resources. This is actually demanding the establishment of a science–policy–business–society interface to allow for continuous dialogues and interactions across different scales and levels, influencing stakeholders towards desirable behaviors [3].
To address the aforementioned stakeholder requirements, it requires the development of beyond the state-of-the-art approaches to derive local field-scale soil, vegetation, and water states and information (e.g., mainly precipitation, evapotranspiration, and profile soil moisture), using satellite, UAS, in situ observations, as well as modelling and big data analytics tools for water management under climate change. It is well-known that space-based EOs are highly effective to characterize water cycle variation at the regional to global scale (see Section 1.1) but are less so at the local and field scale to provide more detailed information for the sustainable management of water resources. To this aspect, it is important to consider the heterogeneous characteristics of the soil and vegetation at these finer scales and to effectively bridge existing knowledge at different scales. We thus need to answer the following questions:
-
How to downscale the global water cycle products to the local scale using multiple sources and scales of EO data?
-
How to explore and apply the downscaled information at the management level for a better understanding of water–energy–soil–vegetation processes?
-
How can such fine-scaled information be used to improve the management of soil and water resources?
In the next section, we present the iAqueduct theoretical framework to address the above questions.

2.2. iAqueduct Framework

Figure 1 describes the iAqueduct framework of methodologies and approaches. It includes six closely connected working blocks (WBs). WB1 deals with the scaling from global satellite water cycle products to field-scale water states, which includes both the surface and profile information on soil water states. Specifically, WB1 will advance the space-time characterization of soil moisture and evapotranspiration processes through the combined use of field, UAS, and satellite observations. In particular, the combined use of high-resolution soil characteristics and satellite data will increase our capabilities to describe soil moisture and evapotranspiration processes with high-level detail.
It has been demonstrated that soil hydraulic and thermal properties (SHP/STP) play a critical role in determining soil water and heat flow at field/plot scales, while such information is rarely available at such detailed scales [60,61]. WB2 will apply pedotransfer functions to derive local field specific SHP/STP properties for the modelling of soil water and heat dynamics at field-scale precision. It will bridge soil spectral information that can be obtained at a high resolution by satellites and UAS and the needed soil properties that are traditionally obtained at limited locations by in situ sample collections.
Using the information obtained from the two previous WBs, WB3 attempts to retrieve field- and grid-specific relationship functions between soil properties, soil moisture, and evapotranspiration. Such a relationship function is expected to advance the current hydrological modelling concepts, in which the actual evapotranspiration is parameterized on the availability of soil moisture using untested (linear) assumptions. Field-specific functions will be developed on the basis of downscaled satellite observation of soil moisture and evapotranspiration, and their combined analysis with in situ measurements and UAS observations.
WB4 is expected to advance ecohydrological modelling by intercomparing models with different levels of complexity, in terms of the soil–water–vegetation–atmosphere transfer processes involved. It sets to explore the advantages and disadvantages of these different models, while aiming at reducing the reliance on in situ observations for model parameterization and taking full advantage of UAS, airborne, and satellite observations. It focuses on the parameterization of the minimalist soil moisture models, coupled soil and plant models, and crop growth models.
WB5 will then demonstrate the benefits in closing water cycle gaps from the global to local scale, in terms of how to effectively handle spatiotemporal data (from in situ, UAS, and satellites), regarding ecohydrological model calibrations and accuracy evaluations of simulated spatial patterns of ecohydrological variables. Particularly, numerical experiments will be conducted for the calibration of a parsimonious-distributed ecohydrological daily model in ungauged basins using exclusively spatiotemporal information obtained from WB1, WB2, and WB3, to link the scales from plant to plot, sub-catchment, and catchment/basin.
WB6 is about disseminating and communicating generated knowledge, data, and tools to water managers, companies, and farmers for actual sustainable water management of their responsible domains. Particularly, to address stakeholders’ requirements, iAqueduct will develop an integrative information system (an open source iAqueduct toolbox), which will integrate models, soil parameters, forcing and field-scale observation, and gridded water states and fluxes to support the translation of science knowledge into water productivity information for the smart management of water resources. The goal is to develop potentially effective approaches connecting science to the society, thus influencing citizens towards desirable behavior in water management.
To address iAqueduct challenges, Table 1 lists the essential ecohydrological variables and parameters to be obtained or measured directly by means of various techniques from in situ, UAS, airborne, to satellite.

3. iAqueduct Technological Platform

3.1. Downscaling of Satellite Water Cycle Products (WB1)

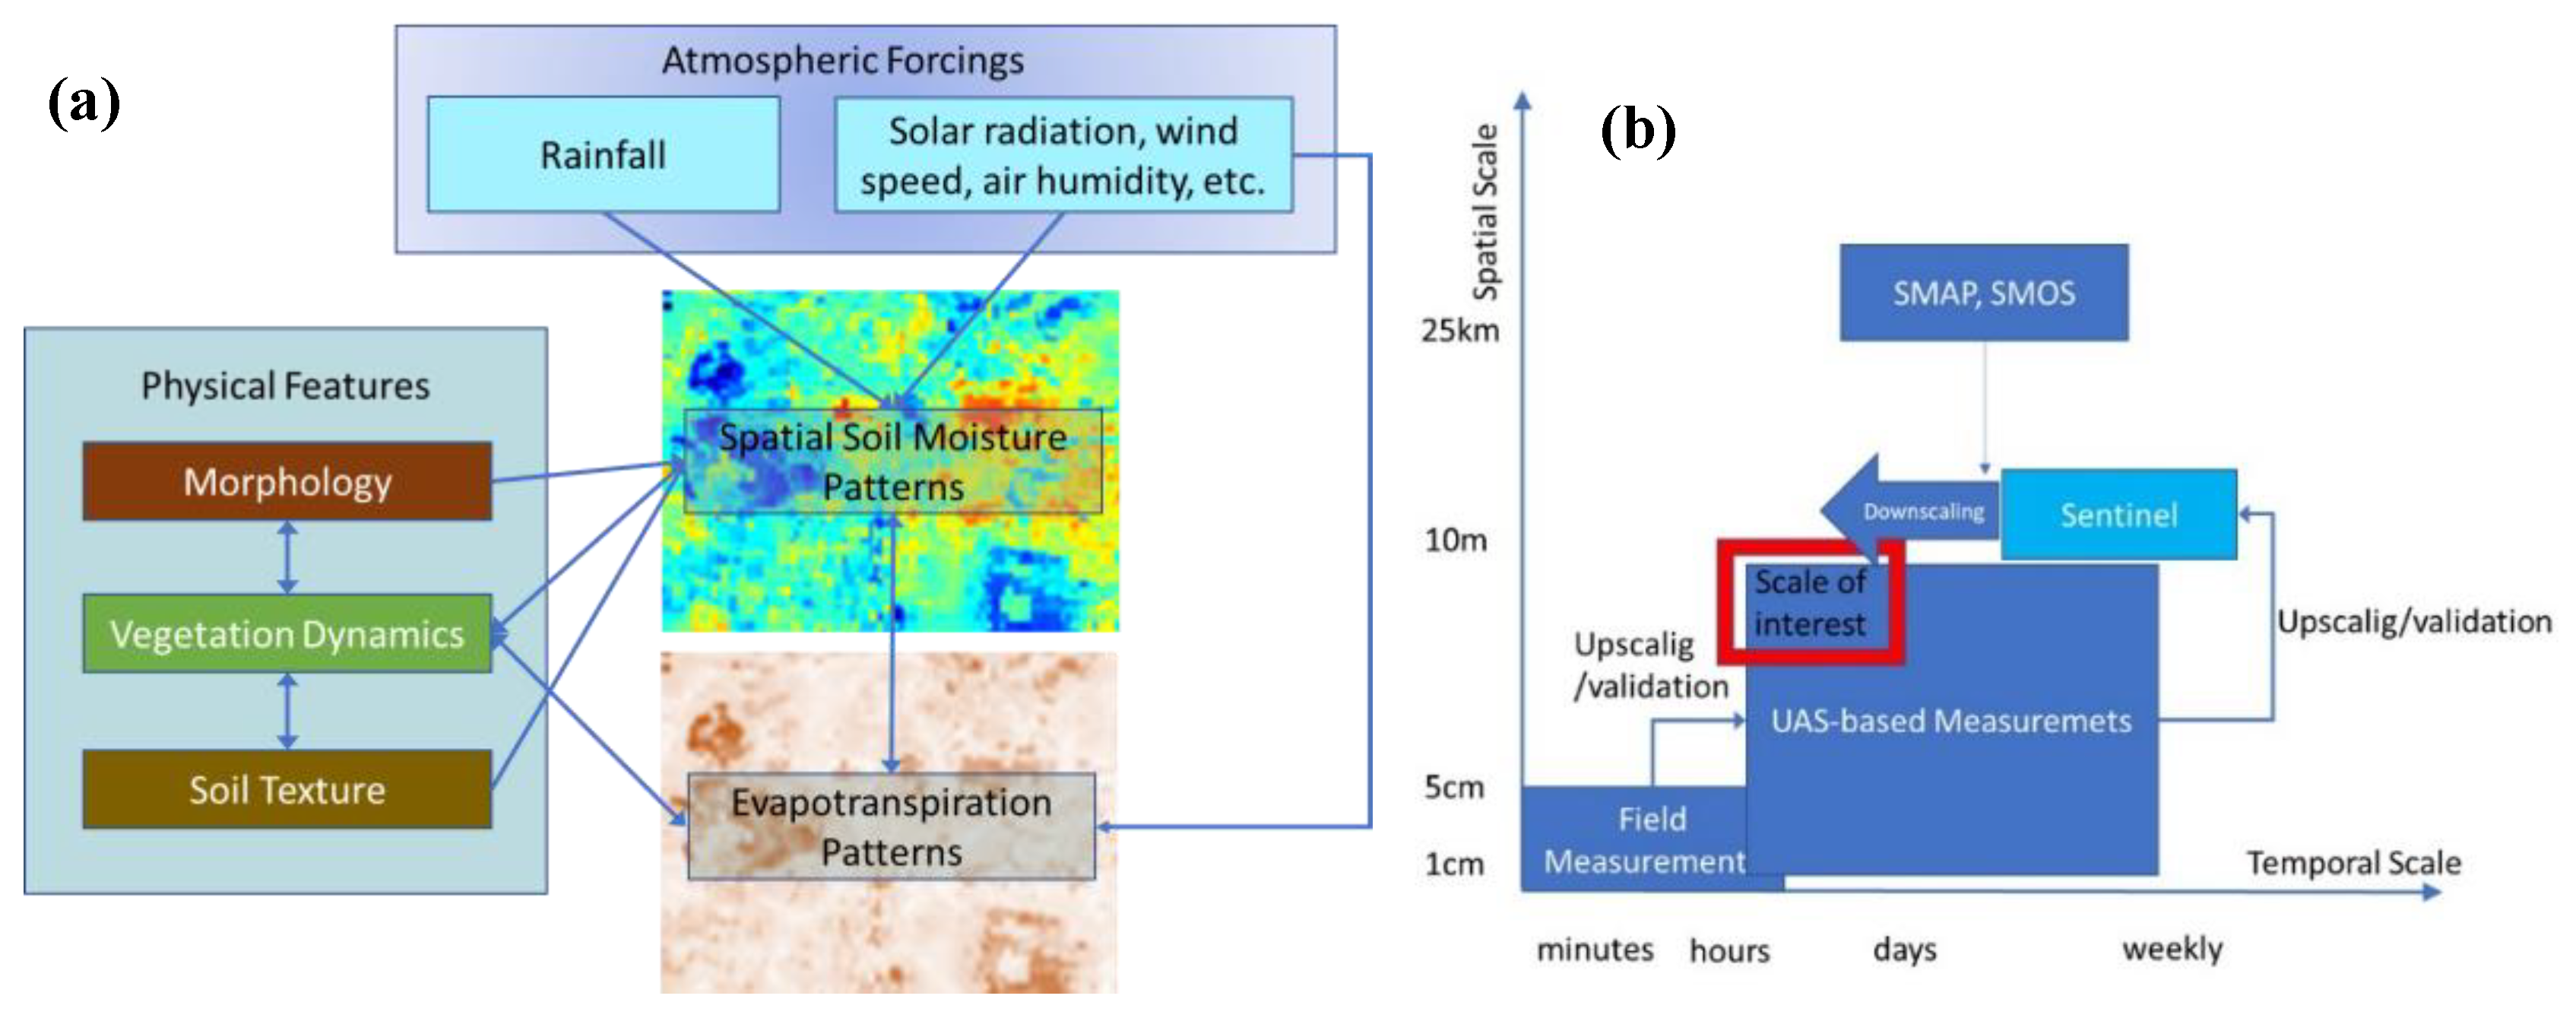
This WB will focus on the monitoring and downscaling of soil moisture data based on remotely sensed data. The aim is to enhance the level of accuracy and knowledge about soil moisture, in terms of its spatial distribution at surface layers and its vertical distribution at soil profiles (e.g., moving from the skin surface to root depth). Specifically, we aim at the spatial description of soil moisture and the prediction of soil moisture in the root zone. Soil moisture forms a natural link between precipitation, evapotranspiration, and runoff at different spatiotemporal scales. Its spatial and temporal patterns are influenced by several physical features that influence the structure of this pattern (Figure 2a). Moreover, soil moisture is measured through different systems and methodologies, but each of them provides information at specific temporal and spatial scales. In this context, the use of UAS may help to fill the existing gap between field observations and satellite data.

3.1.1. Spatial Downscaling Procedures

Before describing a number of procedures to downscale remotely sensed water cycle products to scales suitable for water management purposes, we first present a general framework for water budget closure for a basin by means of the mass conservation equation in the form of [6]:
S t = P G P C P E S E B S Q o · f ( P i , j , E i , j ) ,
where S is the amount of water stored at the surface and subsurface, P G P C P is the GPCP (Global Precipitation Climatology Project) precipitation data; E S E B S is the SEBS-derived land evapotranspiration (ET); Q O is the (in situ) observed river discharge; f ( P i , j , E i , j ) = ( P i , j E i , j ) / ( P E ) is a scaling factor to distribute the observed discharge to each pixel; P i , j , E i , j are GPCP precipitation and SEBS ET for pixel (i, j); and P, E are the mean GPCP precipitation and SEBS ET for the catchment area of interest, all expressed in water depth. It is understood that P G P C P , E S E B S can be replaced by any other remotely sensed similar data. In this mathematical form, Equation (1) can be applied for any catchment after integration.
From a remote sensing point of view, S / t can be obtained from the GRACE satellite observation of the change in terrestrial water storage (TWS) [62,63]. However, due to the rather coarse spatial resolution (e.g., 300 km), the GRACE TWS is of main utility for large river basins [64]. It is to note that, with earlier versions of GRACE data, the comparison of GRACE TWS with satellite/surface observation-based TWS shows the underestimation of seasonal cycles of TWS [62]. On the other hand, with the new development of local mascon solutions, GRACE data are no longer limited to large-basin hydrology, and are useful for groundwater monitoring [65,66,67]. For a much smaller catchment, we propose to utilize the generalized TOPMODEL concept [68,69] as follows to derive the total drainage:
Q o = Q s · ( 1 δ ¯ n ) n ,
Q s = A γ n ,
γ = 1 A A ξ n ,
ξ = a T 0 · t a n β ,
  δ = D / m ,
where Q s is the drainage at saturation, A   is the area of the catchment, and γ is the spatial average of the soil topographic index; δ ¯ is the average of δ with D as the local soil moisture storage deficit (i.e., the difference between the maximum and the actual soil moisture storage), and m a scaling parameter describing the decrease of the subsurface transmissivity T with depth; n is a nondimensional scale parameter of the catchment; a ,   T 0 ,   β are the drainage area per unit contour for a specific location within the catchment, the subsurface transmissivity at saturation, and the local slope of the terrain, respectively.
Similarly, the local subsurface transmissivity can be written as:
T = T 0 · ( 1 δ n ) n ,
and be related to the effective local recharge ( P i , j E i , j ) in the form of:
T · t a n β = a · ( P i , j E i , j ) ,
or by inserting Equation (3):
T 0 · t a n β · ( 1 δ n ) n = a · ( P i , j E i , j ) .
Equations (8) and (9) are derived by assuming that the local water table is parallel to the local topography and that the steady state assumption for downslope discharge can be assumed as a power function. Equations (1)–(9) can then be used to link the forcing ( P i , j E i , j ) and drainage Q o to the storage change S t . The obvious challenge in applying such a framework is to quantify the scaling parameters f ( ) ,   m ,   n   from the observation scale (e.g., pixel scale) to the scale of management interest (i.e., field or a basin scale). Each of the scaling parameters mainly represents the land-atmospheric processes (e.g., f), the vertical soil properties (e.g., m), and the lateral hydrological processes (e.g., n), and can be derived from satellite observations of precipitation, evapotranspiration, and soil moisture. Next, we present a number of procedures for downscaling individual variables:
(1)
Bayesian statistical bias correction of satellite data based on in situ observation. The calibration and validation of coarse-resolution satellite water cycle products at selected field sites with in situ observation is an integral part of this procedure (at the kilometer scale but corrected for spatio-temporal error, e.g., due to topography, soil texture, and climate, cf. those by [19] for precipitation; [26] for evapotranspiration; and [8] for soil moisture);
(2)
Development of downscaling methods based on Copernicus Sentinel data (from kilometer to hectometer scale). This procedure concerns evapotranspiration and soil moisture (by assuming the precipitation is homogeneous at the kilometer scale). Downscaling will be achieved by the combined use of optical, thermal, and radar data from Sentinel-1, 2, and 3;
(3)
Generation of high-resolution water cycle products of soil moisture, vegetation patterns, and vegetation stress (sub-meter spatial scale and daily interval). High-resolution maps will be provided with UAS equipped with thermal cameras, multispectral, and hyperspectral cameras. Such data will support the development of downscaling procedures, linking satellite to point measurements for calibration and validation at the selected field sites;
(4)
Characterization of the spatiotemporal distribution of soil moisture and evapotranspiration processes will be conducted after validation of the high-resolution imagery from UAS with outcomes of field measurements and outputs from ecohydrological models. The proper description of the controlling factors for the spatial variability of soil moisture is crucial to further advance the potential of downscaling methodologies;
(5)
Downscaling of the remote sensing data to the field scale (from the hectometer to plot scale) can be achieved by using a Bayesian approach exploiting the predicted variance and spatial correlation of the soil moisture process along with the ancillary data derived from UAS and WB2 activities on the physical characteristics of soil and vegetation. In particular, WB2 will support the development of new strategies aimed at the mapping of soil hydraulic and physical characteristics that will enhance the capabilities of soil moisture downscaling procedures (see, e.g., [11,42,43]).

3.1.2. Preliminary Results of Downscaling Surface Soil Moisture

This subsection will focus on surface soil moisture and present the preliminary results of downscaling satellite data with UAS measurements. Because soil moisture is determined by several physical features characterized by strong spatial gradients (e.g., terrain morphology and soil texture) and also temporal variability (e.g., vegetation patterns), these dynamics and features have to be taken into consideration in order to reach a reliable estimate of soil moisture using EO (Figure 2a). As such, the use of combined technologies may help in describing the spatial patterns of land surface features closely related to soil moisture (or directly soil moisture itself), providing measurements over a range of scales moving from centimeters up to several meters, and thus enabling links to EO data from tens of meters to kilometers (Figure 2b and Figure 3). It is to note from Figure 2b that it is not only about downscaling to the scale of interest but also upscaling. Thus, an evaluation of the physical consistency between different scales and corresponding used downscaling approaches and strategies is always needed [7,70].
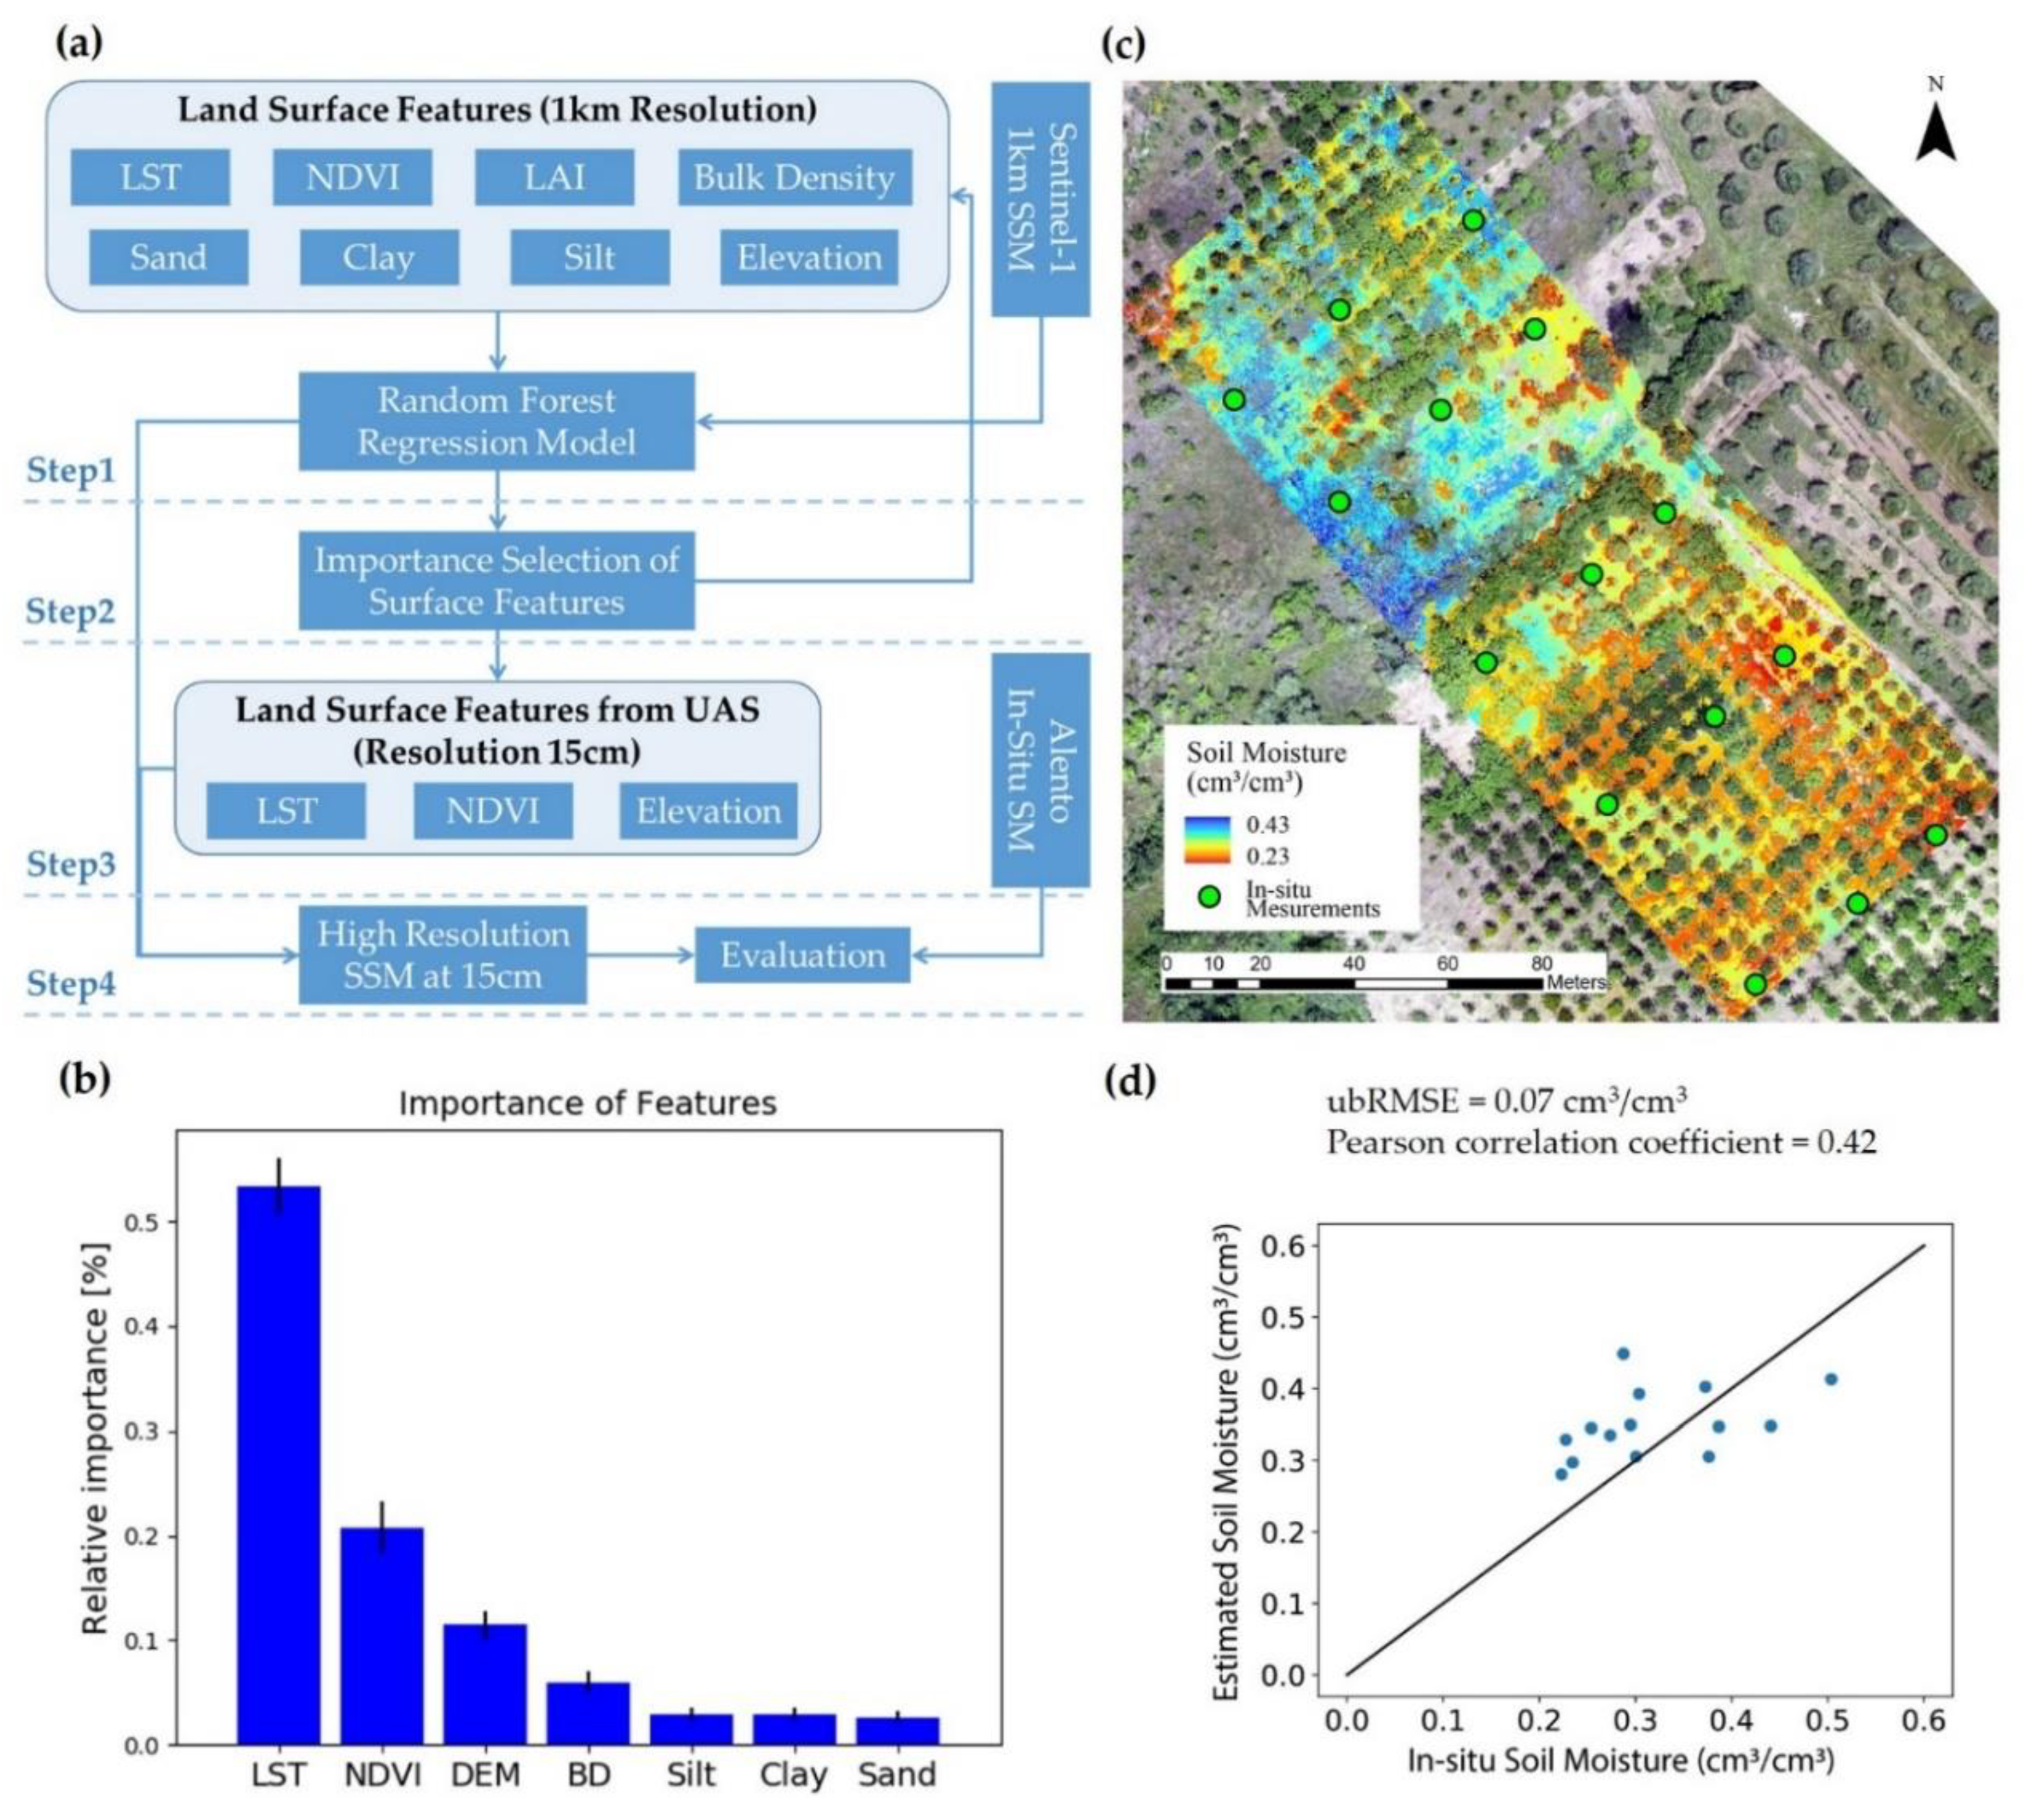
Furthermore, ecohydrological model-based simulations at hyper-resolutions can reproduce the scale invariance property of soil moisture, which can be used to link scales from hundreds of meters in the field to tens of kilometers of satellite observations [59]. Big data analytics with machine learning (e.g., random forest, RF) can also effectively downscale satellite observations to UAS/in situ scales [58]. In the following, the RF-based soil moisture downscaling was demonstrated with preliminary results (Figure 3). The RF-based downscaling workflow is depicted in Figure 3a with four steps:
Step 1 is to train and test the RF model with both predictors (i.e., land surface features) and soil moisture datasets (Sentinel-1) at a 1-km resolution. The relative importance of predictors (Figure 3b) shows that the LST (land surface temperature), NDVI (normalized difference vegetation index), and DEM (digital elevation model) are the top three predictors;
Step 2 is to train and test the RF model with only the three top predictors as identified in step 1;
Step 3 is to apply the trained RF model (from step 2) with the UAS-derived surface features at 15 cm to predict high-resolution soil moisture at 15 cm;
Step 4 is to compare the predicted high-resolution soil moisture with in situ measurements.
Figure 3c shows the preliminary result of RF-based downscaling of Sentinel-1 soil moisture products at 1 km to 15 cm, taking land surface features derived from UAS (e.g., LST, NDVI and DEM) as predictors over the MFC2 sub-catchment of Alento catchment (hereafter as MFC2-Alento) (see Appendix A.3). Figure 3d shows the comparison between the downscaled soil moisture and in situ measurements. The downscaled soil moisture had 0.07 cm3/cm3 unbiased root mean square error, and its Pearson correlation was 0.42 with the in situ measurements.

3.1.3. From Surface Moisture Information to Profile Soil Moisture

While downscaling coarse-resolution remotely sensed water cycle products to a fine spatial resolution is achievable as described in the previous section, the remote sensing products typically refer to surface information that needs to be transferred to the depth, at least to the root zone, and be linked up with a physically consistent manner. We next describe how to derive profile soil moisture from surface soil moisture information:
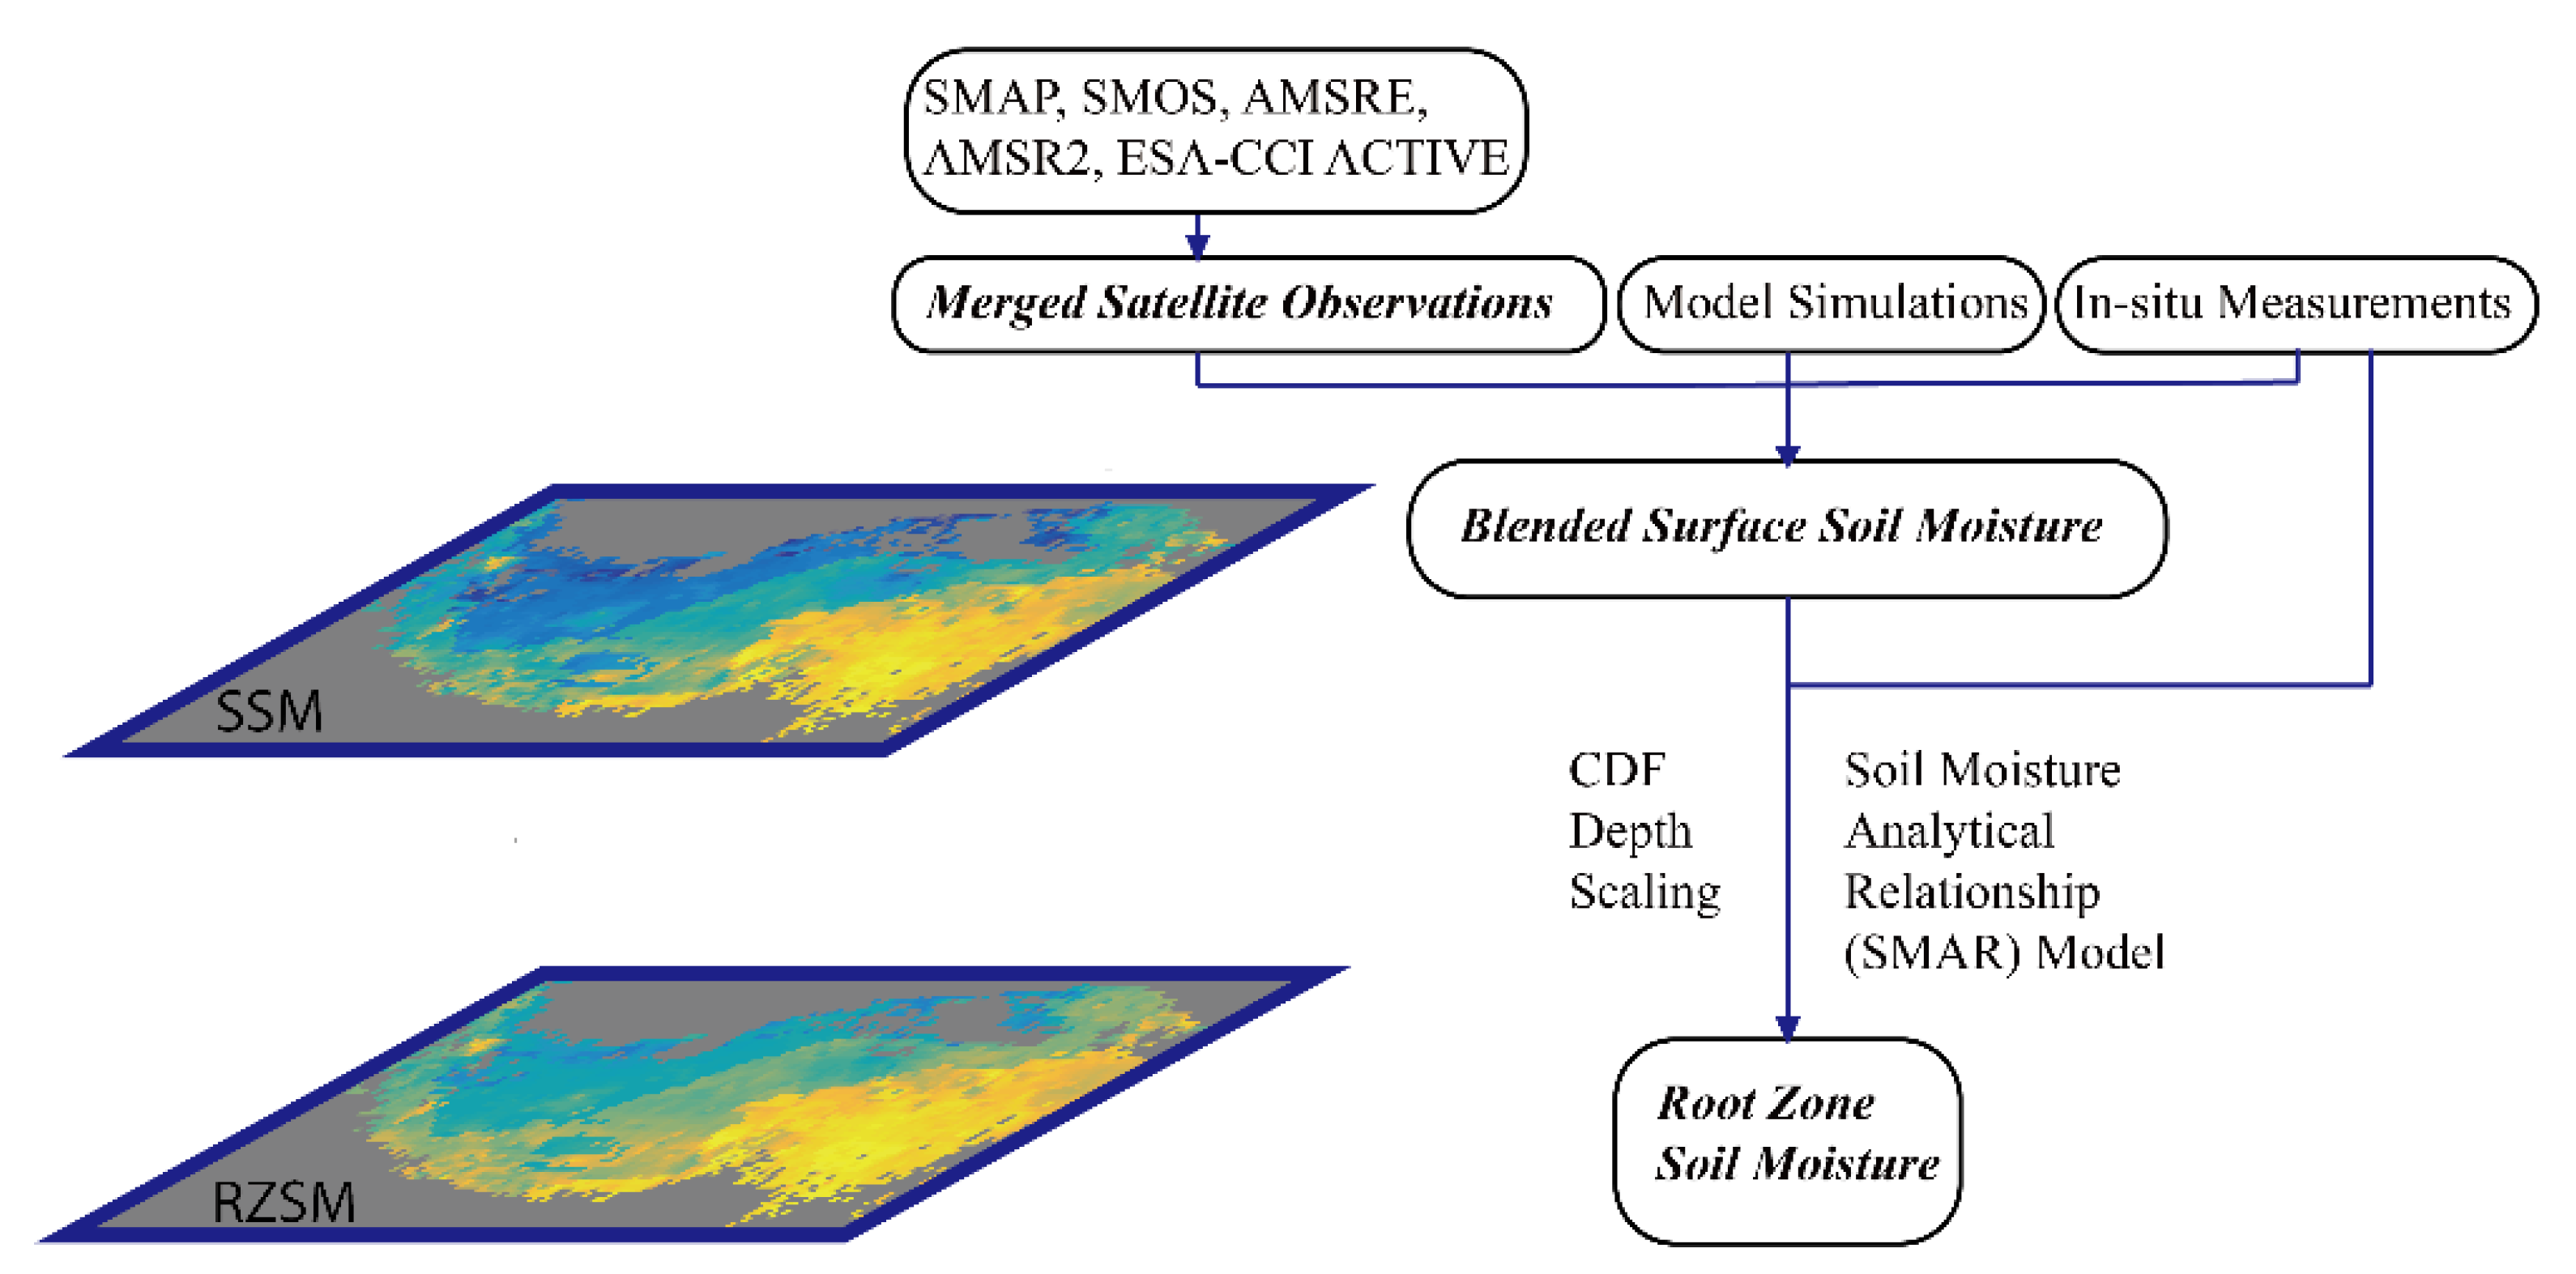
(1) Prediction of root-zone soil moisture (RZSM) with the SMAR-EnKF (soil moisture analytical relationship-ensemble Kalman filter) [16,54]. Such an approach derives RZSM based on the relative fluctuations of surface soil moisture (SSM) retrieved from the satellite or UAS. Figure 4 shows the workflow for this procedure with satellite data [71], while the same can be applied to UAS and/or downscaled data. Furthermore, given the physically based nature of the model, it will benefit from the information collected on the hydraulic characteristics of the soil (see WB2). Furthermore, the CDF (cumulative distribution function) depth scaling can be also used to derive RZSM from SSM [71]. The prediction of RZSM will help to derive useful information on dynamics of vegetation (e.g., via evapotranspiration). It is to note that both SSM and RZSM can be applied to determine the local soil moisture storage deficit, which is needed for estimating the total discharge (see Equation (6) in Section 3.1.1).
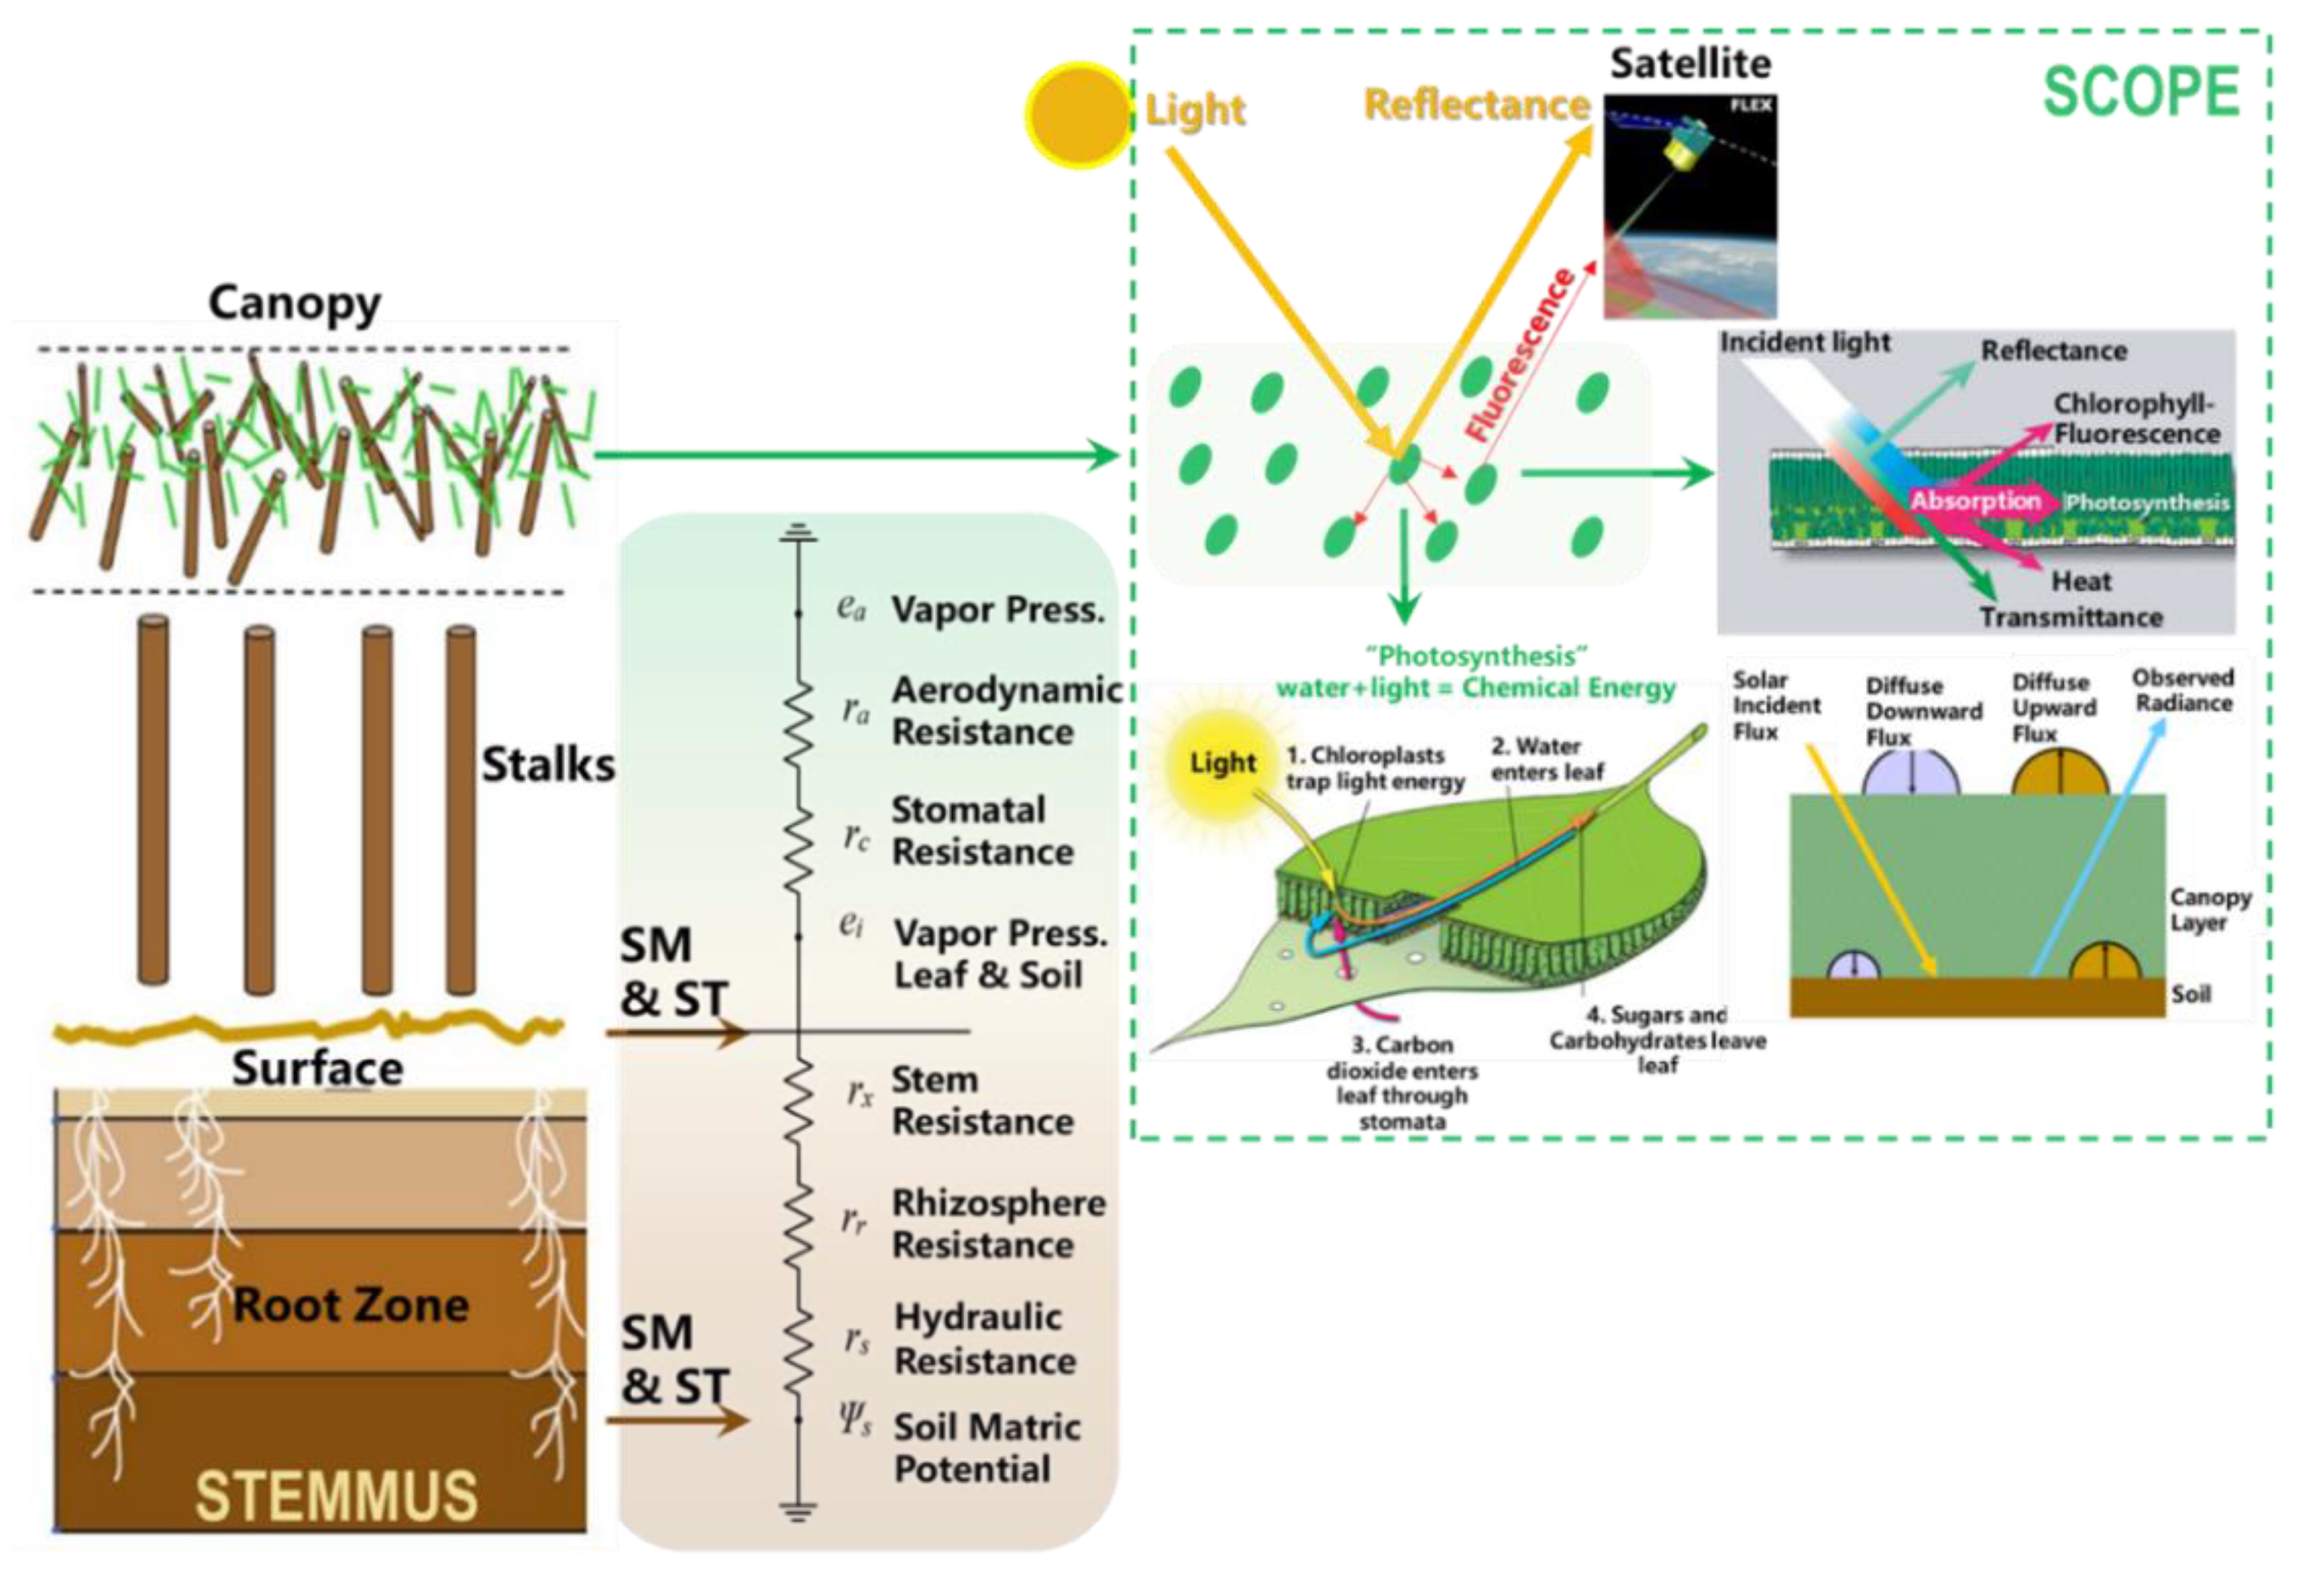
(2) Other than the above approach, the physical process-based model can be used to simulate SSM and RZSM, and to understand the mechanism behind the relationship of soil property, soil moisture, and evapotranspiration. The STEMMUS (Simultaneous Transfer of Energy, Momentum and Mass in Unsaturated Soil) – SCOPE (Soil Canopy Observation, Photochemistry, and Energy fluxes) numerical soil-water-atmosphere continuum model [72,73,74,75] can be applied to analyze the sensitivities of the predicted RZSM at sites with detailed observation of the soil hydro-thermal properties (soil hydraulic and thermal parameters) and states (profiles of soil moisture and soil temperature and surface radiation, sensible, and latent heat flux, precipitation and other meteorological forcing) [72,76,77,78,79]. Figure 5 shows the physical processes considered in STEMMUS-SCOPE [80]. This modelling approach will provide high-resolution spatiotemporal patterns of RZSM that can be linked to the spatial distribution patterns of soil properties (see WB2) and evapotranspiration (see WB3) in different catchments.

3.2. Retrieval of Soil Hydraulic and Thermal Properties (WB2)

3.2.1. Towards a Protocol for Field-Scale Data Collection

To establish the prediction model (or spectral transfer function) of soil properties, it needs to collect information on soil physical and hydraulic properties, terrain and environmental attributes (topographical, geological, pedological, and land-use/land-cover information together with hydro-meteorological datasets and soil physical and hydraulic properties), and topsoil spectral data [81].
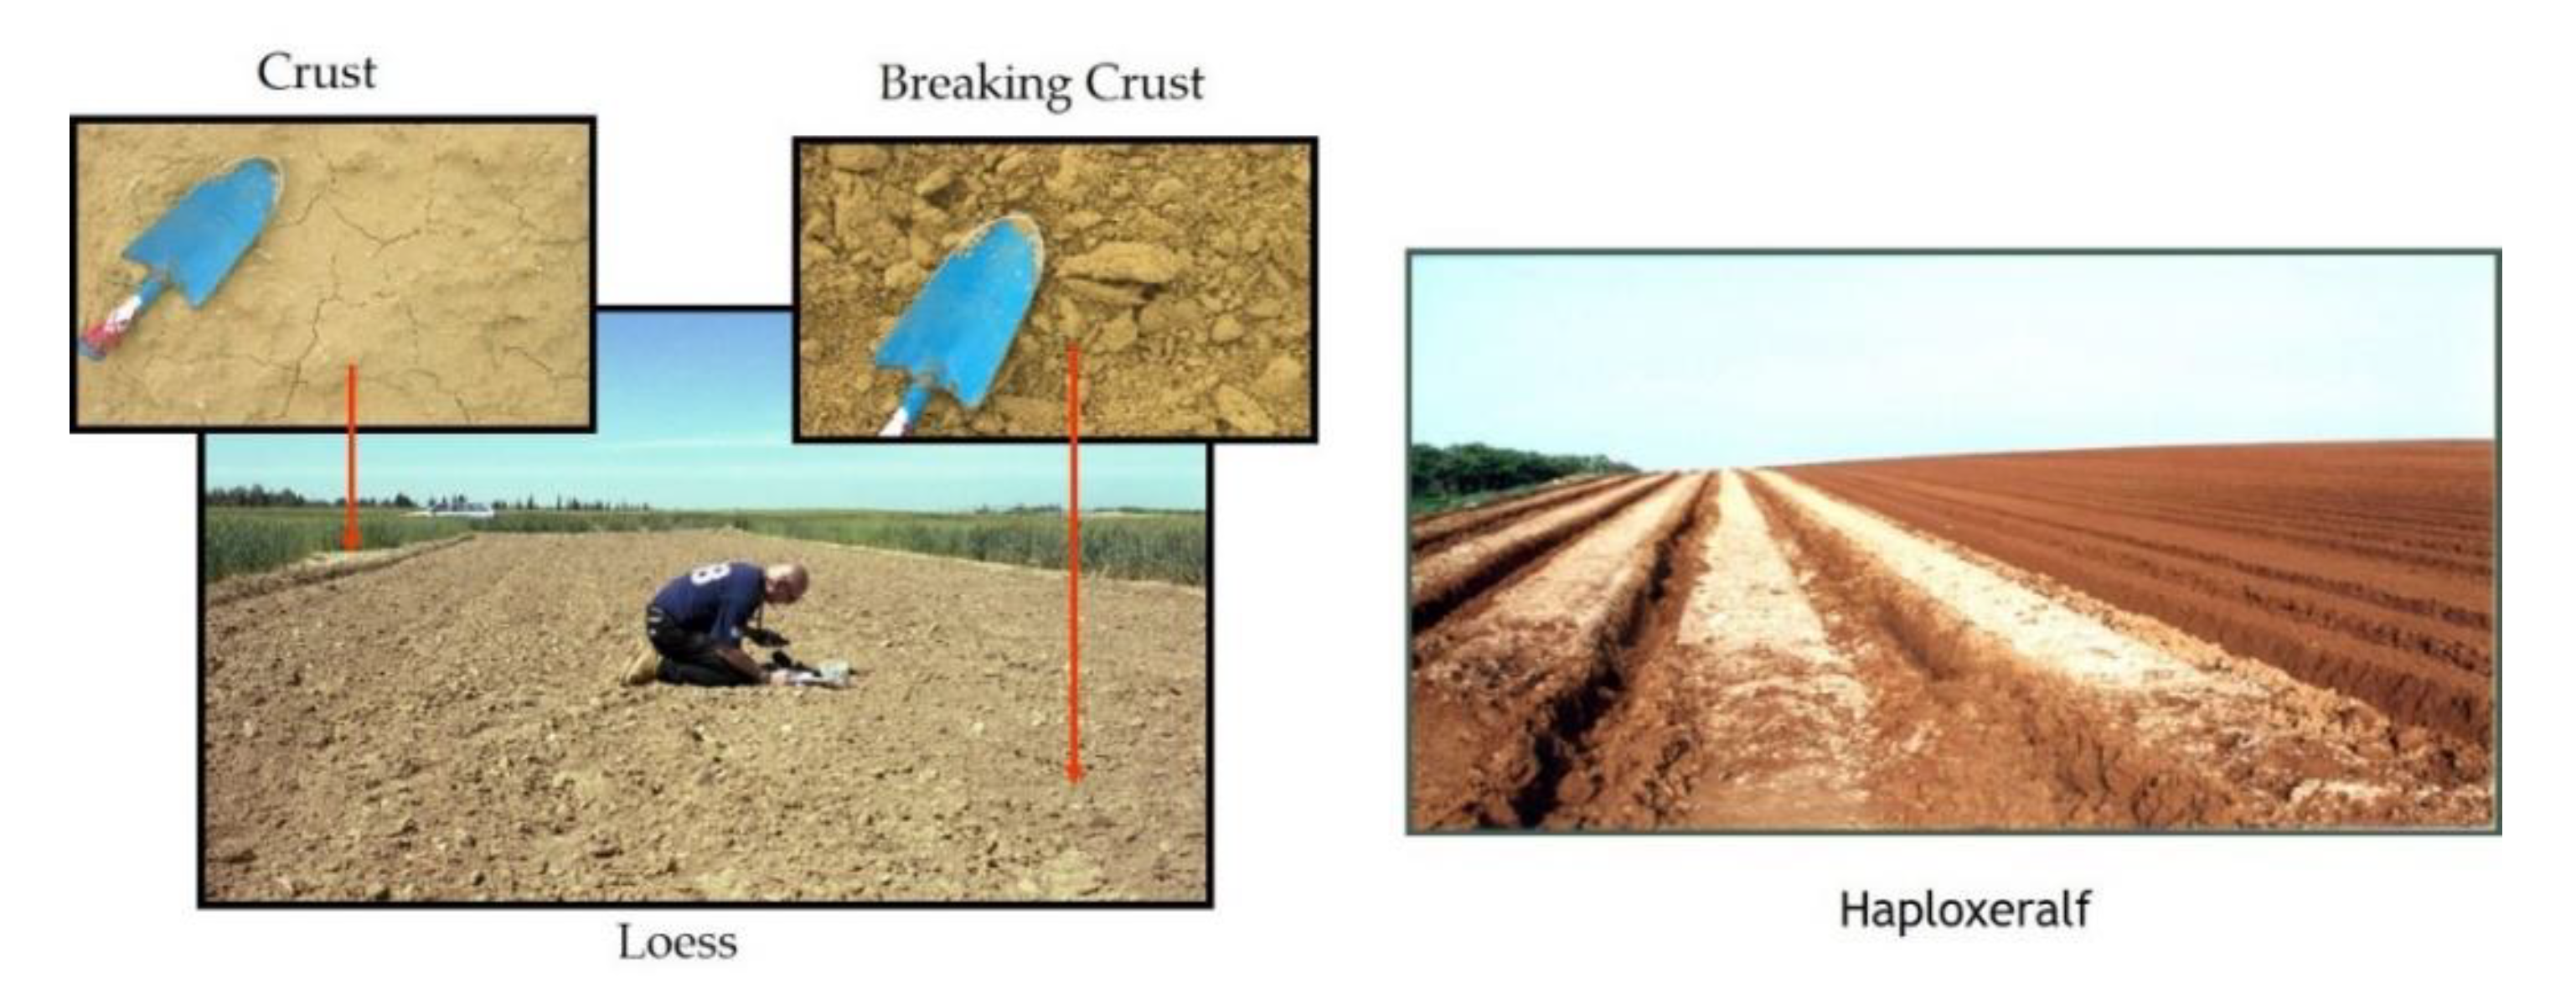
In order to collect accurate and reliable spectral information from the field with physical meanings, the development of a protocol for field spectral measurements under a non-destructive scope is needed. Such a protocol will minimize soil disturbance, which will enhance the characterization of the soil surface hydraulic properties based on spectral data, because sampling soil to the laboratory may disturb the soil surface and hence its hydraulic properties may be compromised. In addition, the protocol to calibrate the field and airborne data and to measure soil temperature and emissivity should be developed as well [81]. Figure 6 shows the appearance of the disturbed and undisturbed soil surfaces at Afeka site, Israel.

3.2.2. Preliminary Results of Soil Spectroscopy and Hyperspectral Remote Sensing

The prediction model established from the field soil spectral library (SSL) can be upscaled to hyperspectral remote sensing. To achieve this, the soil spectral measurement performed in the field will be compared with the one acquired in the laboratory and from the remote sensing sensors (i.e., both airborne and spaceborne). We will focus on the spectral signature related to (a) soil properties, which are routinely measured and influence the soil hydrological processes, such as soil texture and organic matter content, and also (b) directly the soil hydraulic properties, such as soil water retention, hydraulic conductivity, and water infiltration in soil. In addition, the spectral signature in hyperspectral remote sensing (e.g., visible to near infrared) is expected to be extended to the thermal region.
As the first step, this WB has analyzed the relationship between the spectral information of the undisturbed soil surface and water infiltration into the soil. This soil hydraulic property is highly correlated with water runoff and soil erosion and therefore is important for the description of soil hydrological processes. This is done with a dataset containing 69 soil samples taken from the study areas of MFC2-Alento, Sde Yoav, and from an urban area with exposed soil in the neighborhood of Afeka in the city of Tel Aviv, Israel (see Appendix A.6).
This dataset contains infiltration rate measurements, laboratory spectral measurements, and field spectral measurements of undisturbed soil surfaces. For the measurements of the infiltration rate, we used the MiniDisk Infiltrometer (METER Group Inc., Pullman, WA, USA [83]), and for the reflectance measurements, we used an ASD Spectrometer.
For the field reflectance measurements, we connected the ASD spectrometer to SoilPRO® [82], in order to obtain optimal spectral measurements in the field, and to neutralize atmospheric attenuation. SoilPRO® (US patent number 10,473,580 B2) is an apparatus that can be connected to any portable spectrometer in order to extract the un-disturbed reflectance properties of soil field condition with a near laboratory quality. It consists of a large and lightweight closed chamber covering a wide surface area with a controllable illumination and a constant geometry [82]. The partial least squares regression (PLSR) models using the Scikitlearn package in Python [84] was then used to estimate the infiltration rate from the spectral measurements.
For every model, we adopted 5 components for estimation of the soil infiltration rate using soil reflectance in the 450–2400 nm spectral range. This analysis was applied to laboratory spectral measurements as well as to field spectral measurements to explore field sampling issues. Before the application of PLSR, the spectral data was pre-processed using the Savitsky–Golay derivative [85]. The Savitsky–Golay first derivative is a pre-processing method to calculate the variation of the measured reflectance in a given wavelength in relation to its neighbor bands. This pre-processing is a good alternative to enhance spectral properties/signals and reduces physical effects [85,86,87].
In Figure 7a, the result using the field-based model is presented, Figure 7b presents the result using the lab-based model, and Figure 7c presents a histogram of frequencies with the measured infiltration rate (cm/sec) in the different study areas. The PLSR model that was generated using the non-disturbed samples (at field) demonstrated that it is possible to use different soil types and still develop excellent models. The field-based model predicted the infiltration rate much better than the lab-based model. This is because with the application of laboratory protocols, we lost important information of the soil crust for the estimation of soil infiltration rate (see Figure 6).
Given that the soil types in the study areas in question are very diverse, the nature of the samples varies. This implicates that field-spectral data has the potential to predict the infiltration rate using a generic approach for different soils using field-based spectral models (e.g., with SoilPRO®). Based on the current results, the next step will be to examine the adaptation of field-based spectral models to UAS and satellite platforms specifically in the study area of MFC2-Alento (see Appendix A.3).

3.2.3. Basic and Advanced Pedotransfer Functions

With the collected data in MFC2-Alento, the application and evaluation of already established pedotransfer functions (PTFs) [88,89,90] will be carried out to calculate soil hydraulic parameters. The 3-D Soil Hydraulic Database of Europe at a 250-m resolution [91] will be used as a baseline dataset. As such, this task will explore if and to what extent the predictive capability of these basic PTFs can be suitably improved, through in situ and remote measurements of spatial patterns of land cover, for the mapping of soil hydraulic and thermal properties [60].
Basic and advanced PTFs will enable soil hydraulic and thermal parameters (SHP/STP) to be estimated from spectral signatures and the knowledge of near-surface soil moisture dynamics. The world Soil Spectral Library [92], European Spectral Soil Library (LUCAS) [93], and some local SSL (e.g., the GEO-CRADLE Mediterranean Balkan SSL) will be used to generate global to local spectral-based models to assess soil properties. Spectral transfer functions (STFs) [94] will be derived to predict soil properties (SHP/STP) from high spatial-resolution EO data.
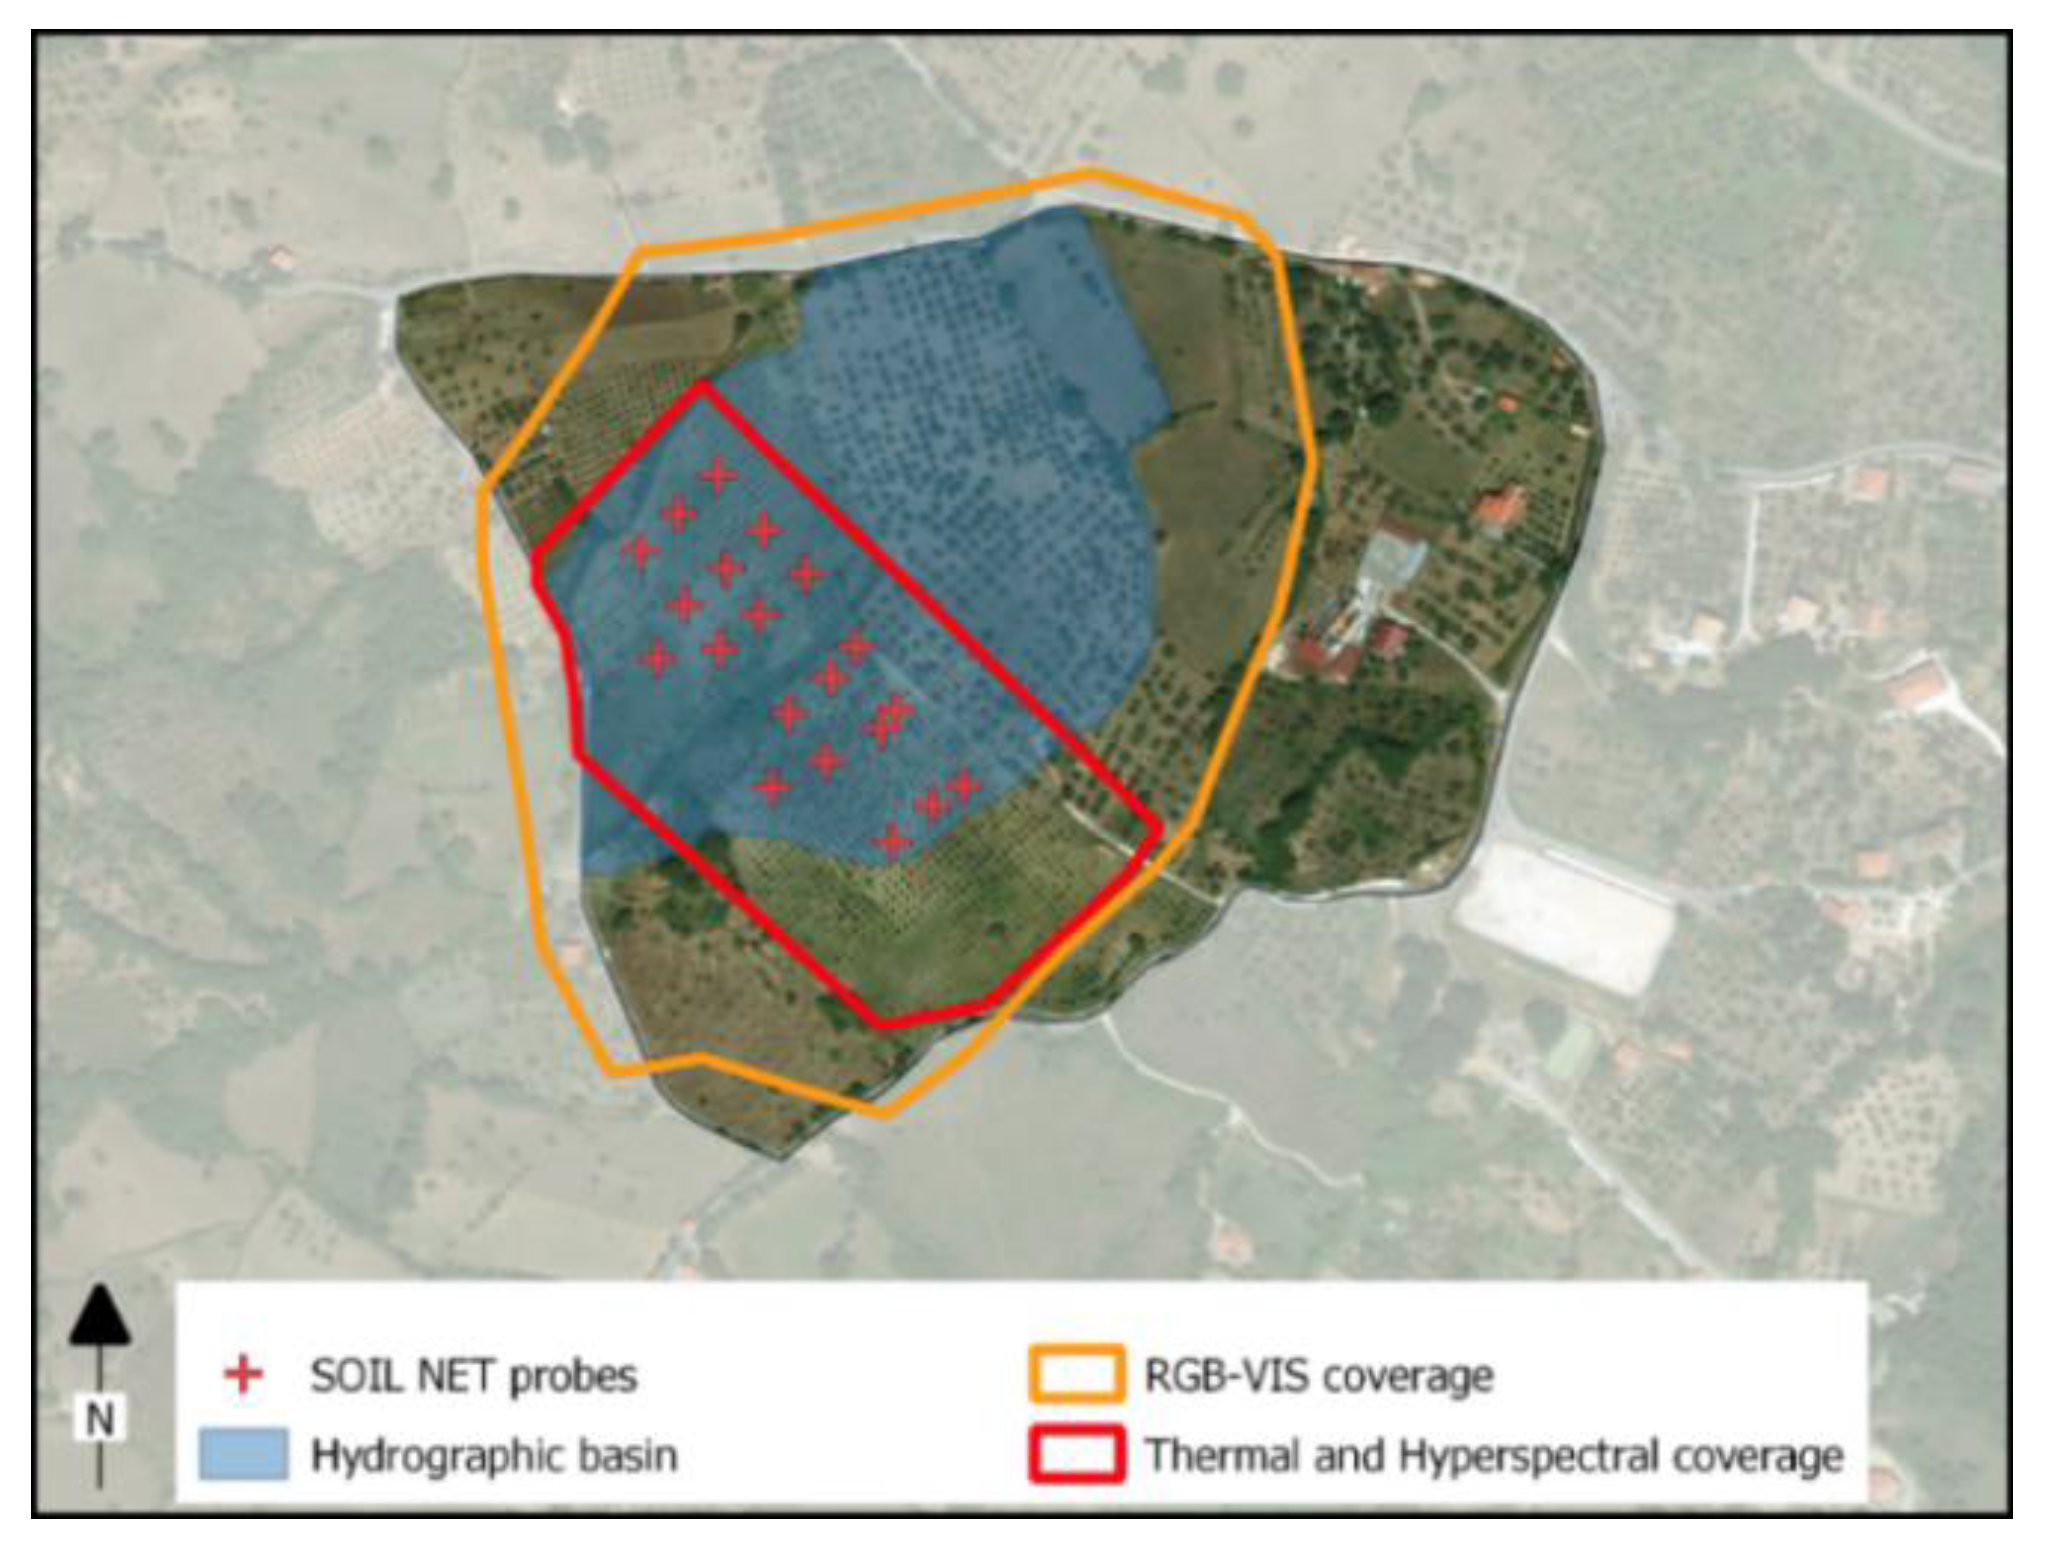
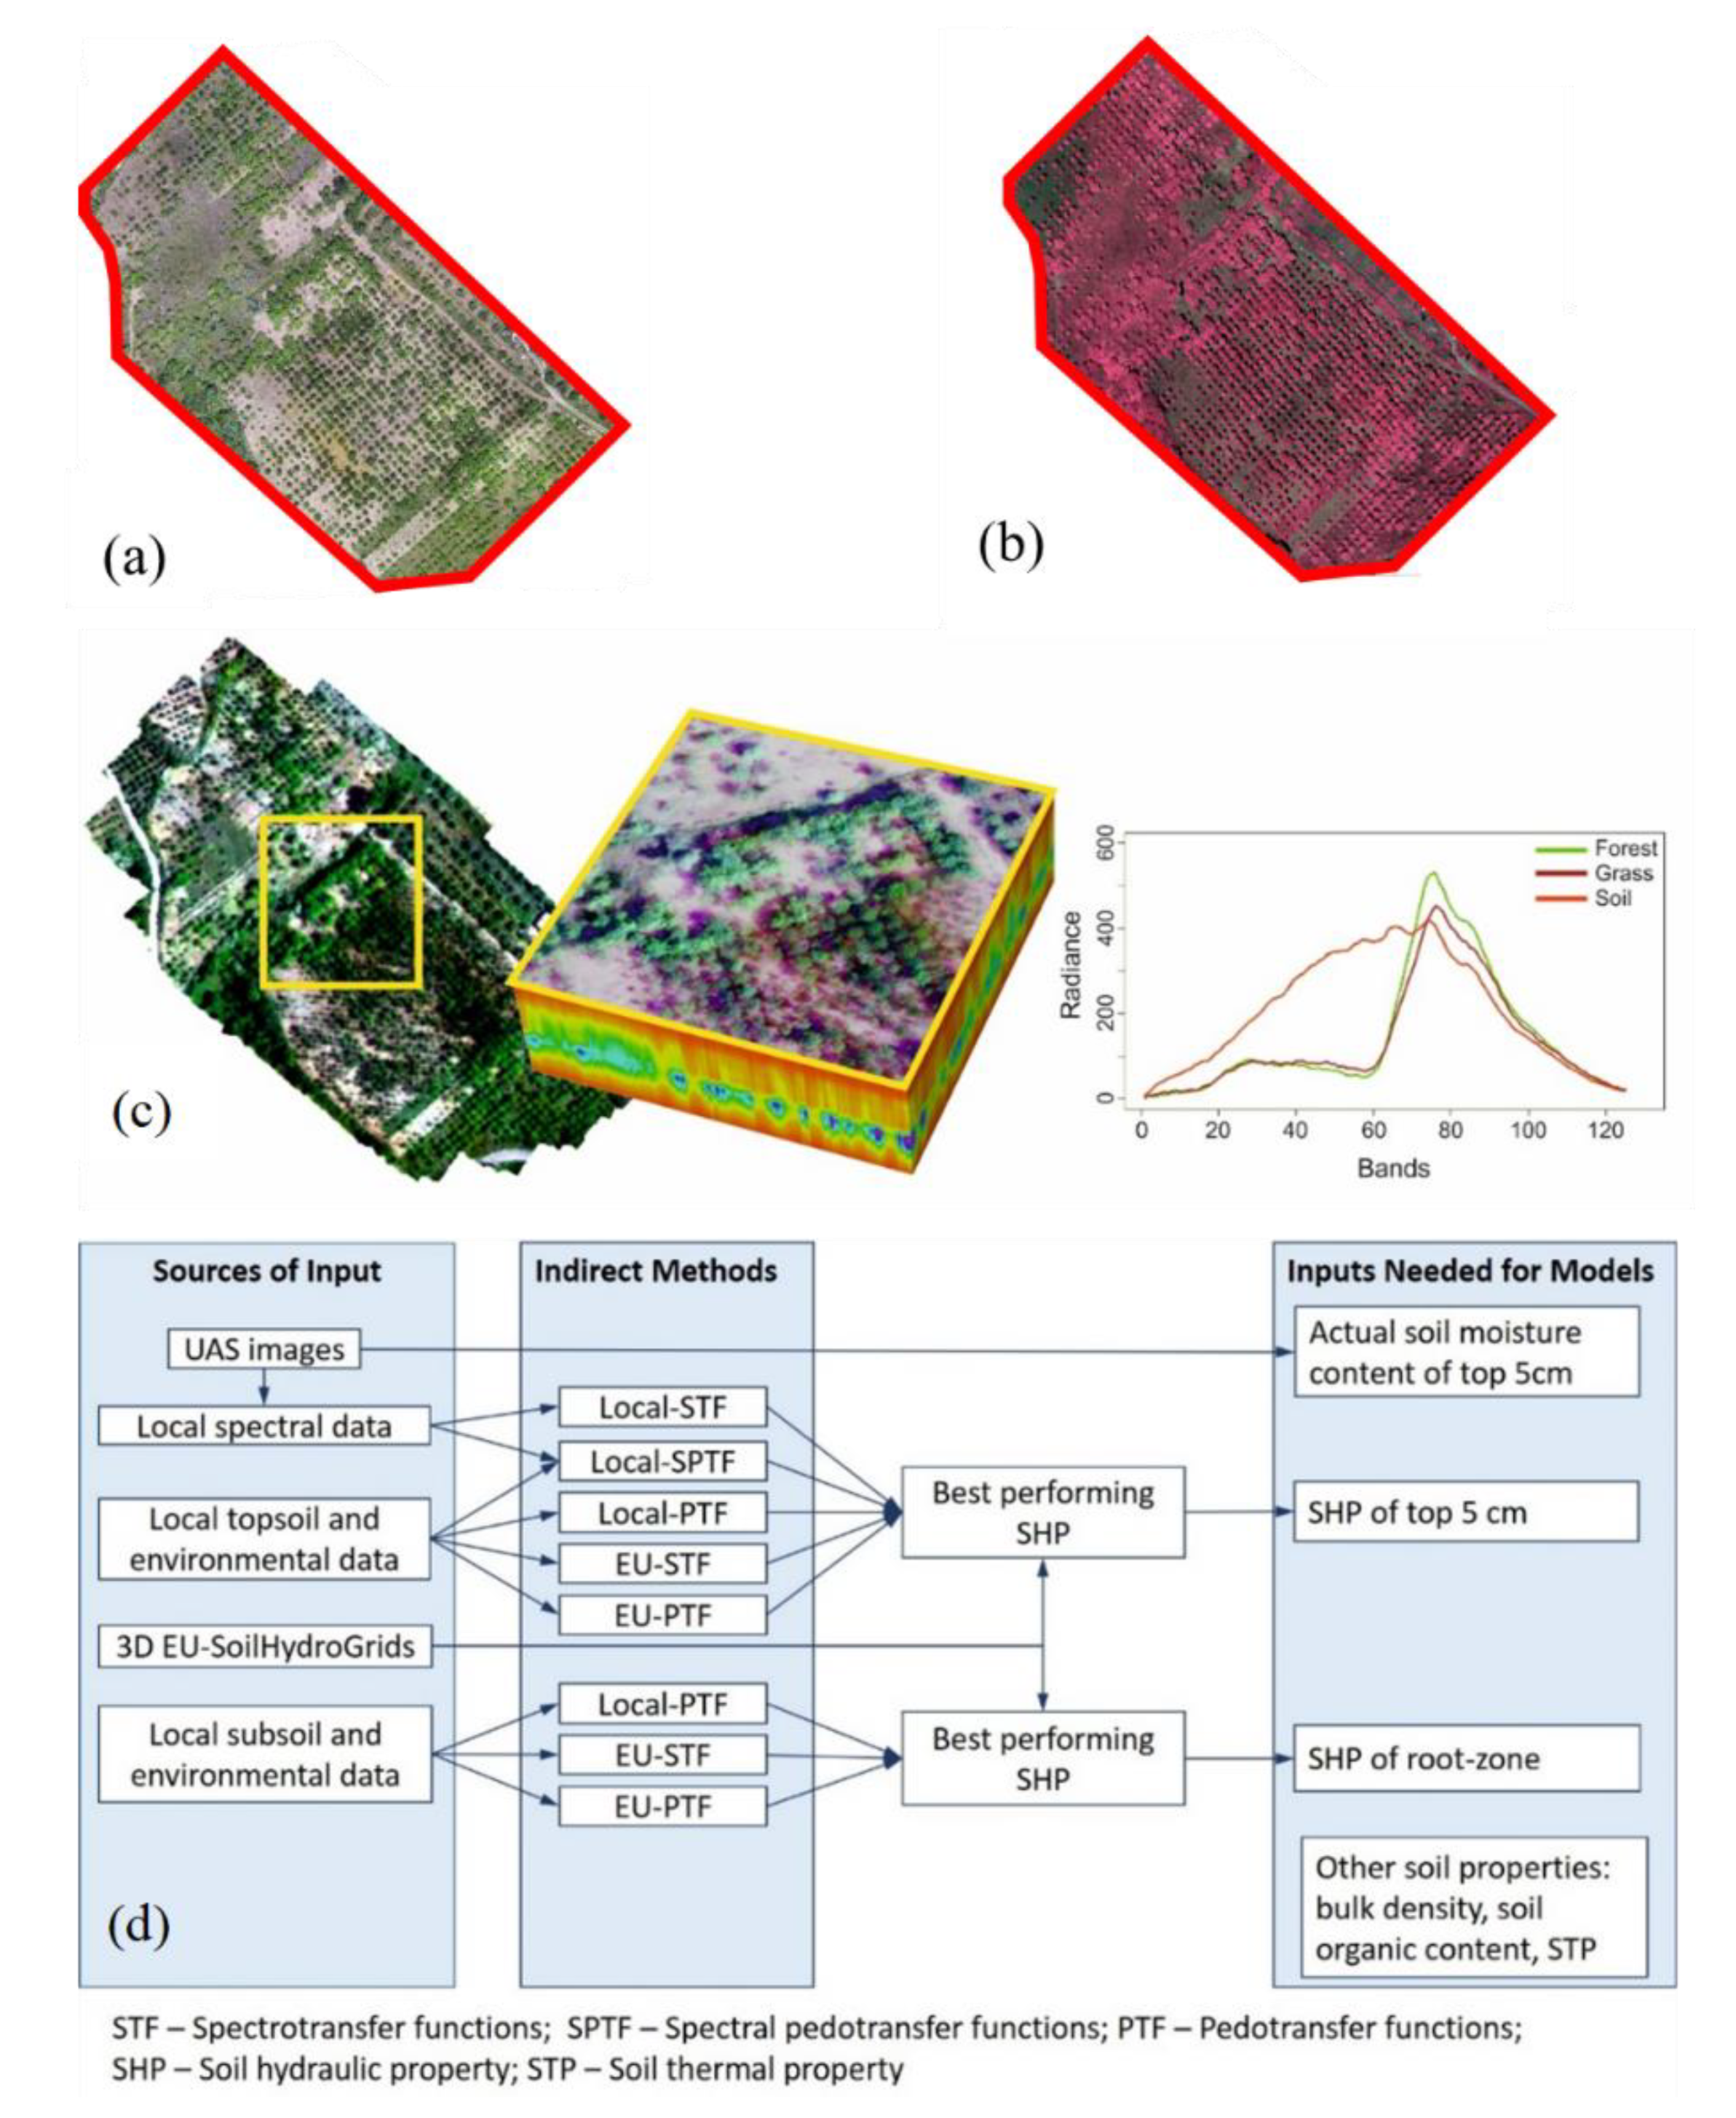
As the first step, we will validate STFs on the test set and samples of the MFC2-Alento catchment. We collected disturbed soil sample and undisturbed soil cores in the MFC2-Alento catchment at 20 locations, corresponding to the positions of the wireless sensor network end-devices (SoilNET) [95] (Figure 8). We measured in the laboratory the soil particle-size distribution, oven-dry bulk density, soil organic carbon content, and the hydraulic properties of soil-water retention and hydraulic conductivity at the full suction range. Furthermore, we also acquired visible (VIS), hyperspectral, and thermal images with the UAS platform and conducted spectral analysis in the laboratory and in the field (Table 2, Figure 8 and Figure 9). These data will be used to relate soil spectral information with soil basic and hydrothermal properties.
Figure 8 shows the hydrographic basin of MFC2-Alento (detailed geographical location is referred to Appendix A.3), the wireless sensor network, the spatial coverage of RGB (red, green, blue) VIS, thermal, multispectral, and hyperspectral UAS imageries. Figure 9a shows the RGB image of MFC2-Alento, taken at noon time, Figure 9b the multispectral image taken at afternoon, and Figure 9c the hyperspectral image taken in the morning and the corresponding hyperspectral data cube and mean spectral curves of forest, grass, and soil features. The timing of UAS flights follow the best practice according to local conditions. Figure 9d shows the workflow on the combined use of different sources of data to produce soil texture information and corresponding soil hydro-thermal properties for the top 5 cm and root zone layers.

3.3. Linking Soil Properties, Soil Moisture, and Evapotranspiration (WB3)

With the downscaled water cycle products, as well as soil hydrothermal properties, this WB will retrieve field- and grid-specific relationship functions between soil properties, soil moisture, and evapotranspiration and their generalization. With the pilot study at MFC2-Alento, the field and grid-specific relationship function will be firstly derived with hierarchical multi-scale EO data, i.e., from the local scale (by the wireless sensor network), to the field scale (by the cosmic-ray neutron probe), to the catchment scale (e.g., by UAS, Sentinel 1-2-3, etc.), and to the regional scale (e.g., by SMOS, SMAP, MODIS, etc.). Both upscaling and downscaling relationships will be developed to link soil properties, soil moisture, and evapotranspiration (see Figure 2). Tests will be done at other sites to validate the proposed procedures.
It is expected that different selected sites (i.e., with different climate zones) will have different specific relationship functions between soil properties, soil moisture, and evapotranspiration. However, as iAqueduct work is still in progress, we are not able to show the sensitivity of such relationship functions under different climate zones (and with the wide-enough variation range of soil properties) from the selected iAqueduct field sites. Nevertheless, in order to demonstrate this concept, we will use existing data from WaPOR (Water Productivity Open-access portal), FAO’s (Food and Agriculture Organization) portal to monitor water productivity through open-access of remotely sensed derived data [97,98,99]. It is to note that the WaPOR data coverage is over Africa, which is different from the iAqueduct study sites (see Figure 1 and Appendix A.1, Appendix A.2, Appendix A.3, Appendix A.4, Appendix A.5 and Appendix A.6).

3.3.1. Example: WaPOR Database

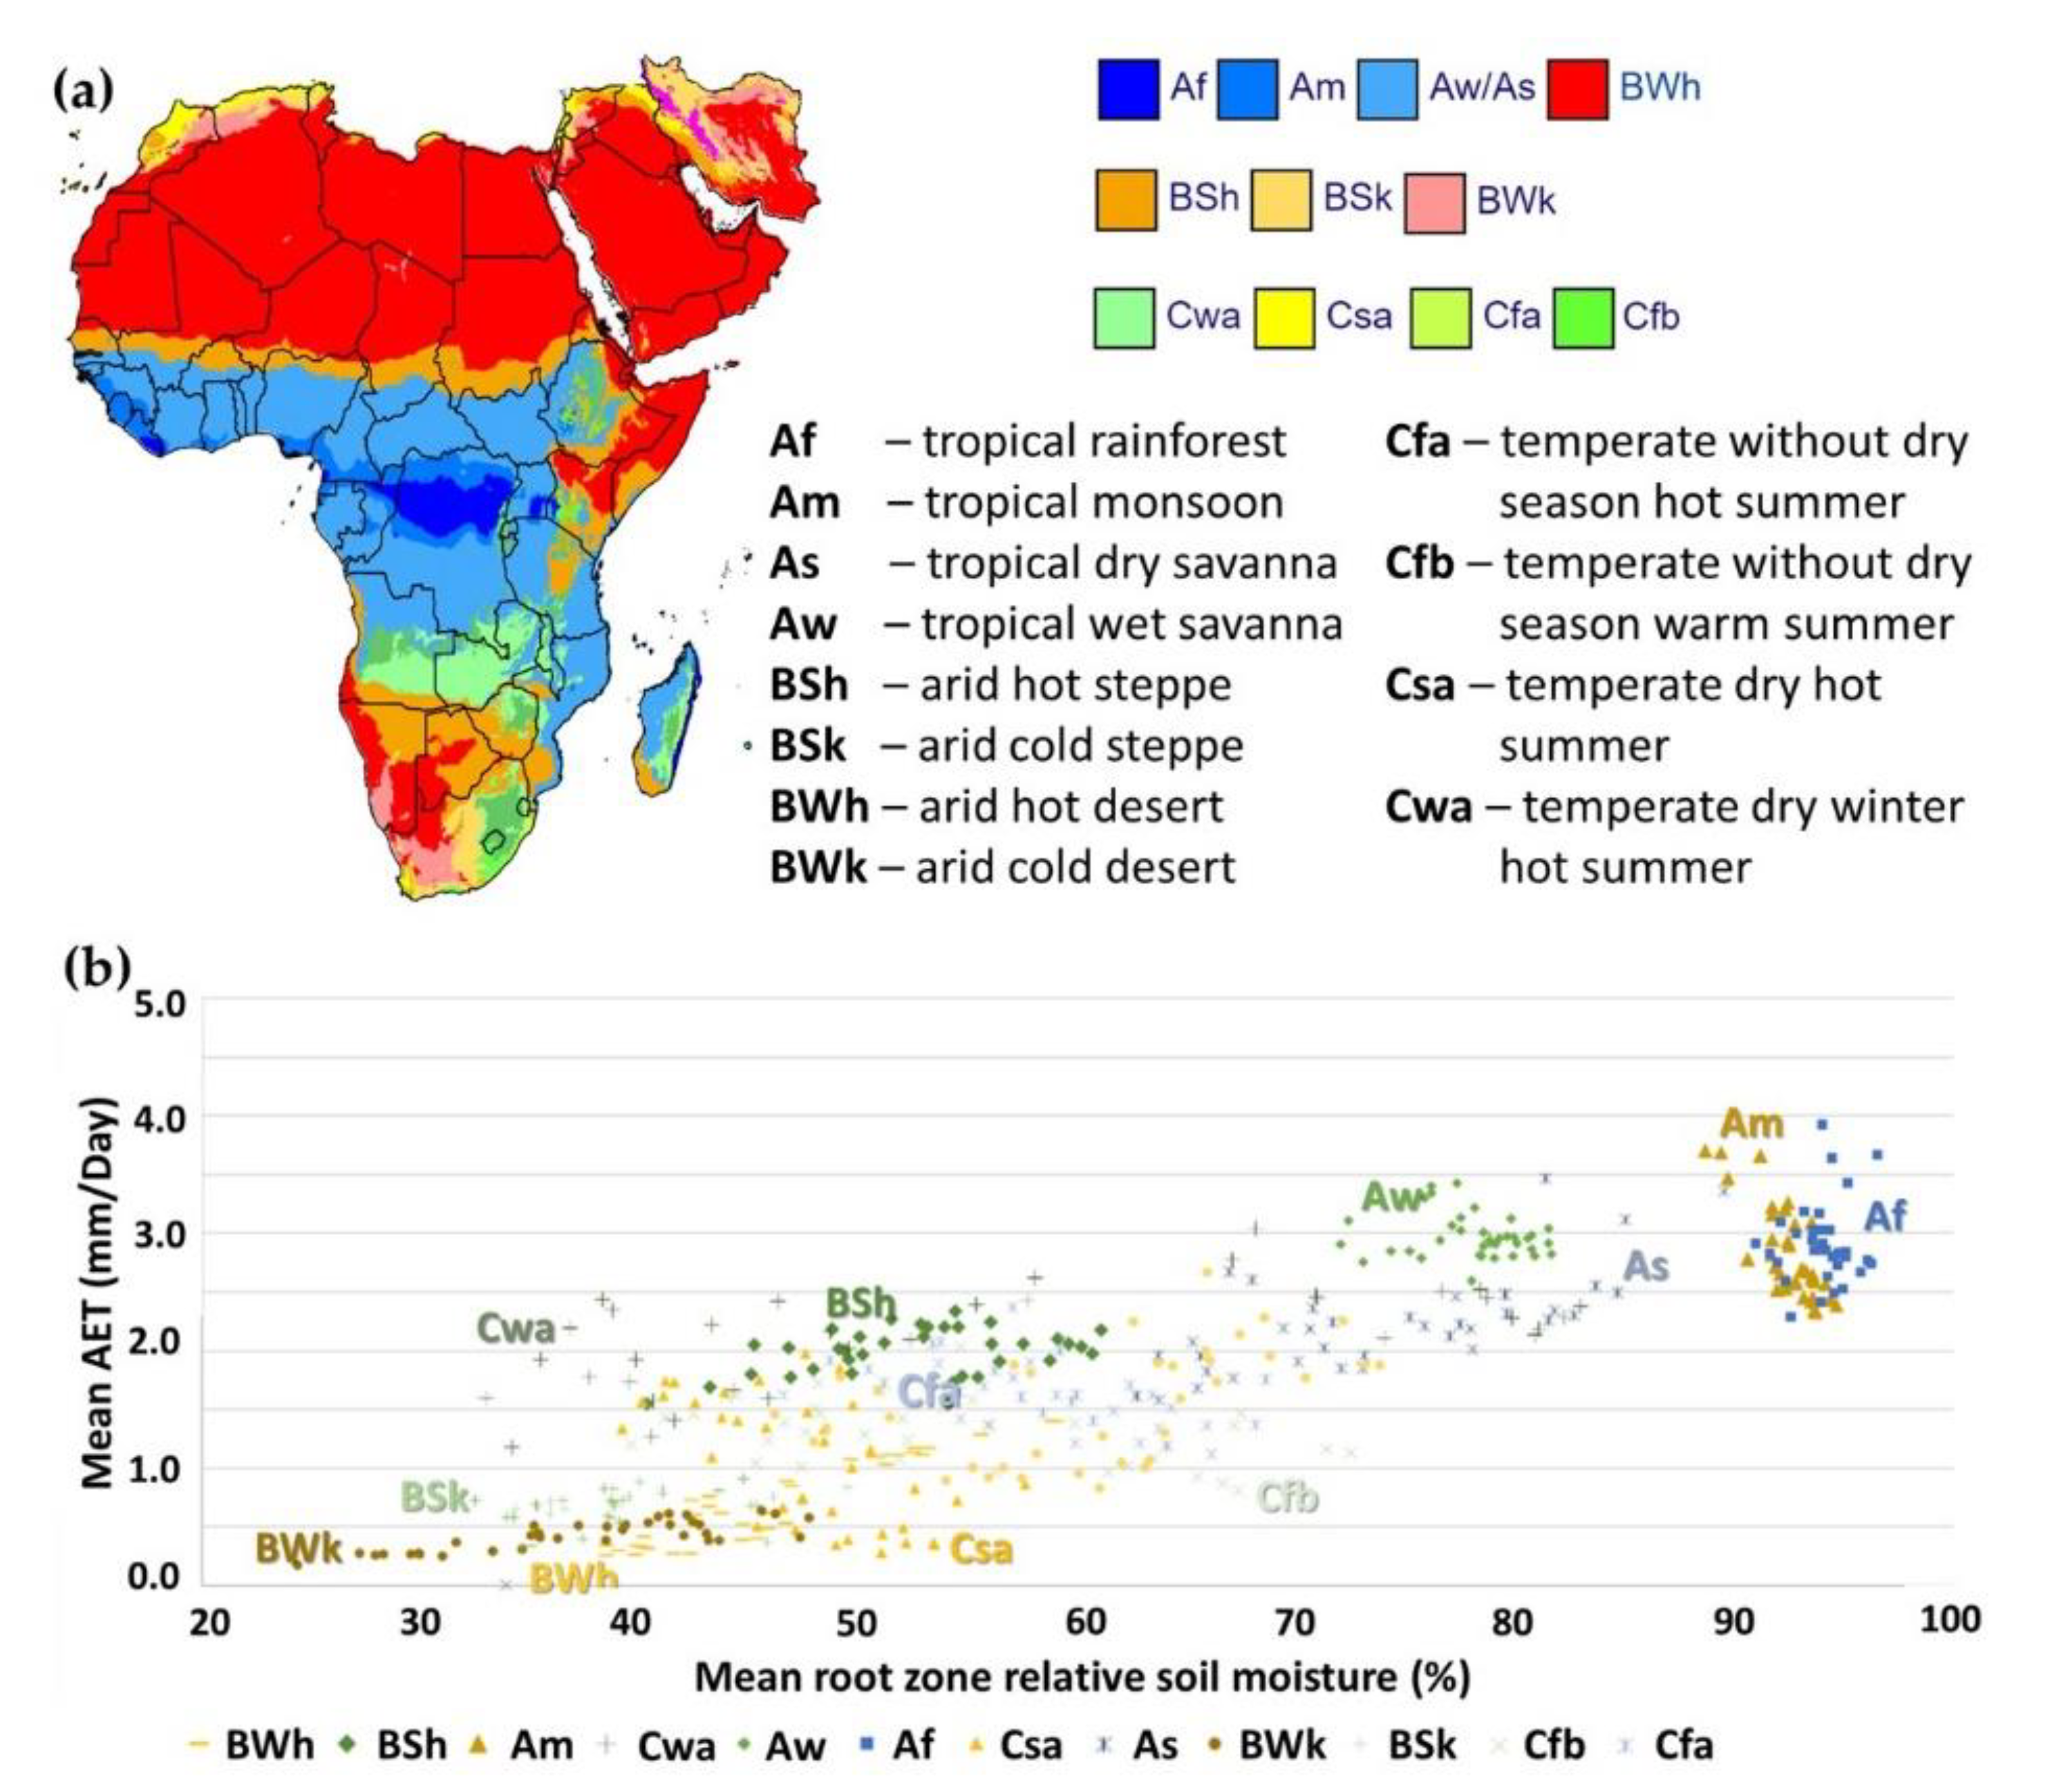
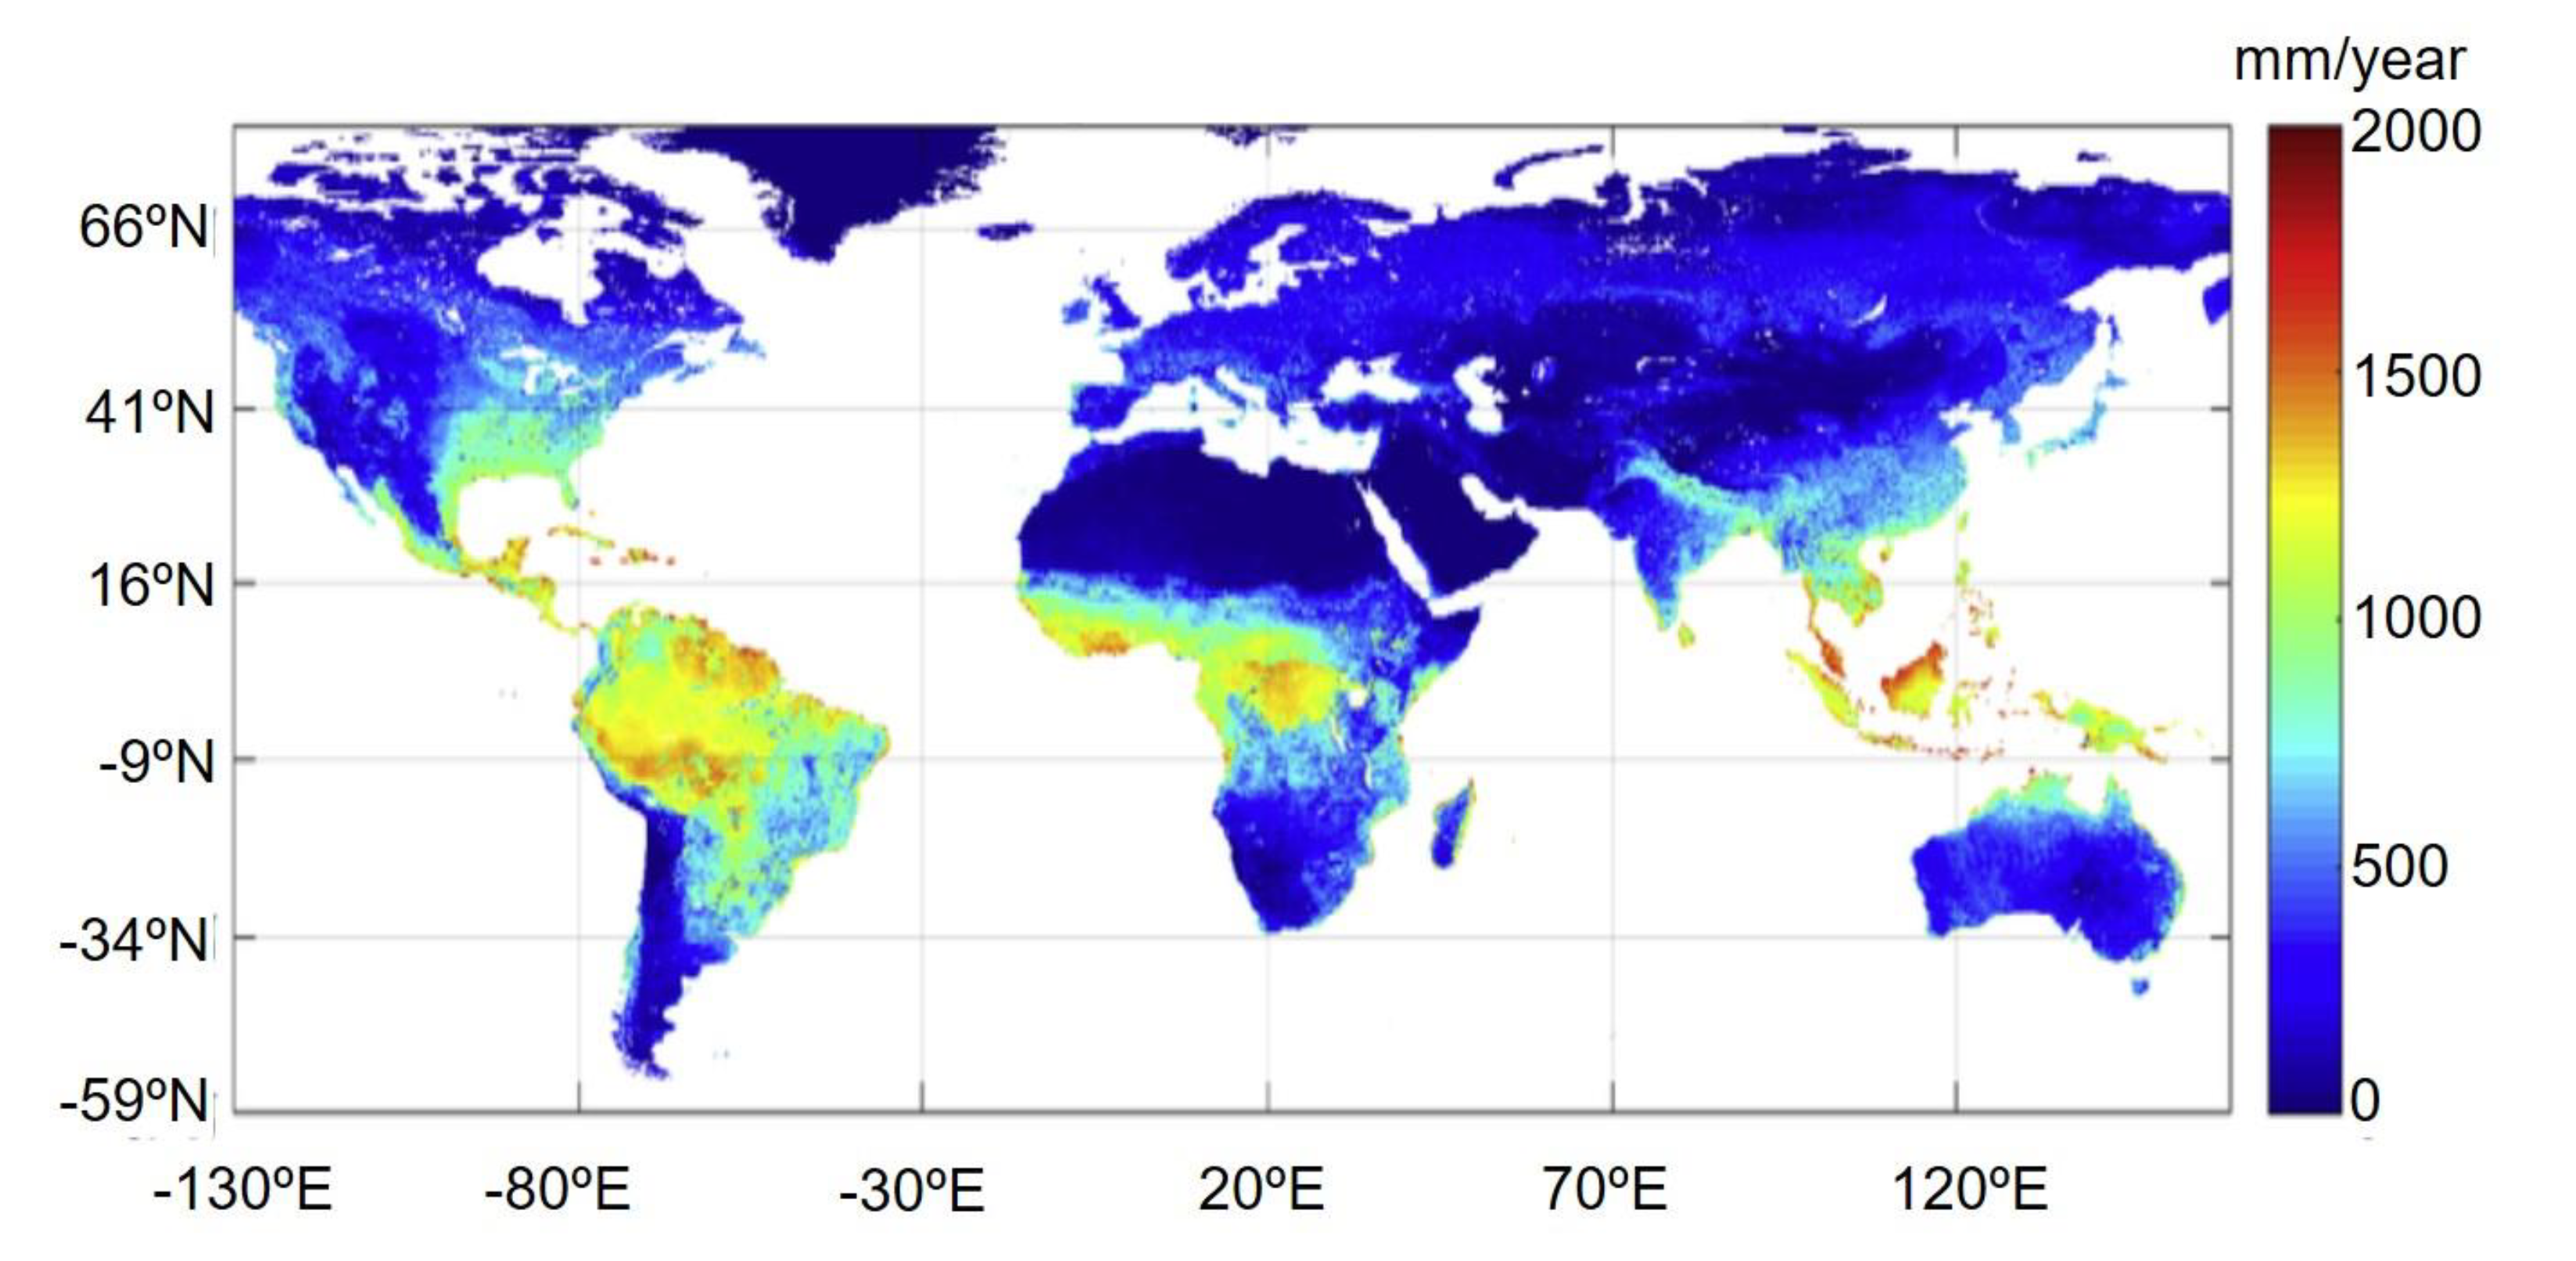
WaPOR includes the products of soil moisture and evapotranspiration over Africa and the Middle East between 2009 and 2018 at the spatial resolution of 250 m [98,99]. Figure 10 shows that the actual evapotranspiration (AET) increases generally with the soil moisture across all climate zones over Africa. Nevertheless, there are different characteristics within different climate zones.
For the hot (BWh) and cold (BWk) desert climates, one can see a slight positive relationship between soil moisture (SM) and actual evapotranspiration (AET), indicating the AET is limited by soil moisture for these arid zones, with a maximum rate of 1.5 mm d−1. For the hot (BSh) and cold (BSk) semi-arid climates, the AET–SM relationship is generally positive with flat slopes alike for desert climates. The BSk is close to desert climates, as it is simultaneously limited by available energy (i.e., cold semi-arid climates) and partially by SM, while BSh has a higher AET as it is not limited by energy and has higher SMs than arid zones.
For the humid subtropical climates with dry winter (Cwa) or fully humid ones without a dry season (Cfa), it is clear that the AET is not limited by soil moisture and has no or a slight negative relationship between SM and AET, respectively. For the hot-summer Mediterranean climate (Csa) and temperate oceanic climates (Cfb), AET-SM is clearly negative, indicating the control of available energy on AET. While for the tropical wet savanna (Aw) and tropical dry savanna (As) climates, the tropical monsoon (Am), and tropical rainforest (Af) climates, the AET is generally high, but there is no relationship with SM.

3.3.2. Approach of iAqueduct

It is noted that the WaPOR relative soil moisture is derived using the trapezoid approach, which needs calibrations for different soils and vegetation covers, due to its assumption of constant meteorology and constant resistance (to heat transfer) [98,99]. The iAqueduct will use a more consistent way with the surface energy balance system (SEBS) equations [25], by which the relative evaporation (RE) can be calculated as [100]:
R E = 1 H H w e t H d r y H w e t ,
where H is the sensible heat flux, H w e t ,   H d r y are the sensible heat flux at the wet limit (i.e., the surface is completely wet and the AET is not limited by soil moisture) and dry limit (i.e., there is no AET due to absence of soil moisture), respectively. As H = ρ c P ( T s T a ) / r a h ( ρ air density, c P specific heat capacity of air, T s land surface temperature, T a air temperature, r a h aerodynamic resistance for heat transfer), if we assumed the climate (i.e., assuming T a constant) and land cover (i.e., assuming r a h constant) do not change spatially over the area of interest, we can rewrite RE as below:
R E = 1 T s T s _ w e t T s _ d r y T s _ w e t ,
where T s is modulated by SM; and T s _ d r y , T s _ w e t are land surface temperatures at the wet limit and dry limit. Equation (11) then describes the theoretical boundaries of the trapezoid approach (i.e., in the space of T s versus the albedo or vegetation index), when considering the uncertainties raised by assuming T a and r a h constants can be addressed by calibrating the system under different surface conditions. Because T s can be easily measured at various spatial resolutions by remote sensors, Equation (11) will relate ET and SM accordingly, which can be expressed as a sigmoid function by considering its dependence on soil texture [80,100].
Such a soil texture-dependent sigmoid function can be derived from multiscale data. It is expected with the availability of multiscale hierarchical information of soil moisture and evapotranspiration (e.g., from satellite, UAS, in situ measurements) for the selected study sites of iAqueduct (see Figure 1 and Appendix A), both upscaling and downscaling relationships can be developed to link soil properties, soil moisture, and evapotranspiration. Figure 11 shows an example of global evapotranspiration derived from MODIS satellite data in combination with global meteorological information, using the SEBS model [27]. This daily evapotranspiration dataset is at spatial resolution of 1 km. With Equation (11) and the ancillary data used to produce Figure 11, it is expected that the relationship function, as learned in iAqueduct, can be extended to the pan-European and global scale.

3.4. Developing Plant- and Plot-Level Ecohydrological Models Using Remote Sensing Information (WB4)

Both ecologists and hydrologists have long recognized the important interactions between water availability and ecosystems [101]. Vegetation represents the main return path of terrestrial water to the atmosphere [102] and modifies the surface albedo and roughness [103], thereby the ecosystem species composition and structure exert strong controls on hydrologic fluxes at multiple scales [101]. These plant–water interactions have been captured by plant- and plot-level ecohydrological models, ranging in complexity from minimalist soil water balances to detailed descriptions of the water, energy, carbon, and momentum fluxes in the soil, canopy, and atmosphere (see [104,105] for reviews). WB4 will use information retrieved from WBs 1 through 3 to develop and parameterize ecohydrological models of increasing complexity at the plot and plant level and evaluate to what extent this information enhances descriptions of the soil–plant–atmosphere system to inform resource management.
The soil ‘bucket filling’ model (e.g., [106,107]) is the simplest description of interactions between soil water and vegetation. This approach mechanistically represents the soil water balance over the rooting zone, generally at a daily time scale, but the effects of vegetation are included via an empirical closure, linking directly soil water availability to losses via evapotranspiration [107,108,109]. ‘Bucket filling’ models have often been used to investigate the role of rainfall unpredictability, because, thanks to their simplicity, the probability density function of soil moisture [107] and plant water stress [110] can be obtained analytically. In some cases, this minimalist description has been linked to the plant carbon balance, to quantify the assimilation rate of carbon dioxide (CO2) and its probability density function [111,112,113]. The minimalist soil moisture balance has been extended to include irrigation [114] and obtain analytically the probability density function of crop yield and irrigation requirements, thus directly linking to the management of water resources [115]. Once parameterized, these models provide a simple and practical output for WB6.
The ‘big-leaf’ approximation is a more realistic description of vegetation effects on the soil water balance. This approach couples lumped soil moisture dynamics to lumped vegetation models at daily or sub-daily time scales (see [116] for an example). ‘Big-leaf’ models up-scale mechanistic descriptions of leaf-level carbon and water fluxes to the whole canopy, assuming the entire canopy is subject to the same conditions and behaves in the same way [117,118]. ‘Big-leaf’ models allows also coupling the soil–vegetation water balance with the plant carbon balance, using various levels of complexity (see examples with increasing physiological detail in [105,113,119,120,121]). The most mechanistic models include a canopy energy balance (e.g., [75,122]), describing explicitly the interactions between leaf activity and leaf temperature; or carbon and nitrogen dynamics, thus accounting for the cycling of critical resources also in the soil (see [123] for some examples). In addition, to enhance model realism while maintaining low parameter and computational requirements, vegetation and soil can be stratified in two or more discrete layers [123]. The more detailed models include energy, carbon, and possibly nitrogen flux information beyond the water flux provided by ‘bucket-filling’ models. The ‘big-leaf’ approximation can be a valuable alternative to ‘bucket filling’ models in WB6 for managers of agricultural systems, when information for their parameterization is available.
Vertically distributed models represent the highest level of detail, where water and energy balances are fully resolved and discretized over thin layers. Vertically distributed canopy models are often based on the same mechanistic principles informing big leaf models, but they explicitly describe water transport within the soil–plant–atmosphere continuum (see [124] for a review) and the interactions between leaves at different positions inside the canopy and the surrounding conditions. Similarly to the lumped models, vertically distributed models in the soil can focus on the soil water dynamics, incorporating a simplified description of the aboveground component [73,125,126], or considering the full above- and belowground details (e.g., [123,127,128]).
Increasing levels of detail can enhance the model performance but are inevitably associated to increasing parameter requirements and hence difficulties in parameterization when specific in situ observations are not available. In addition to hydrometeorological variables and soil moisture, information about vegetation structure, biomass, temperature, and activity can be retrieved from the iAqueduct platform at various temporal and spatial scales (Table 1), to develop simple to complex ecohydrological models. ’Bucket-filling’ soil moisture balances require basic information on soil (soil porosity and hydraulic conductivity) and vegetation (active rooting depth, maximum evapotranspiration rate, and response to water stress). These ecohydrological parameters have been inferred successfully from point-, footprint-, and satellite-scale observations [129] and improve the description of soil moisture dynamics compared to reference constants [130]. Coupled soil and plant models, including a two-pool soil moisture model and vegetation dynamics relying on the radiation use efficiency approach, have been parameterized with satellite data [131]. Most recently, remote sensing has also contributed to the development of crop growth models (see [132,133] for a review).
The work within WB4 will follow these lines, exploiting downscaled data from WB1, data collected in WB2, and information derived from them in WB3. Particular attention will be devoted to the appropriate characterization of vegetation activity and its interactions with soil moisture dynamics. The ultimate goal is to explore the advantages and disadvantages of the different approaches to modelling soil–vegetation–atmosphere interactions when aiming at reducing the reliance on in situ observations and at taking full advantage of UAS, airborne, and satellite observations. The most promising models will be included in the iAqueduct toolbox and be available to improve distributed ecohydrological models in WB5.

3.5. Improving Distributed Catchment-Scale Ecohydrological Models Using Spatial Information (WB5)

Leaf- to plot-level plant activity affects and is affected by the spatial scale. The heterogeneity of soil moisture (vertical and horizontal) depends on the distribution of plant types [38,134,135]. At the same time, plants need water to survive, and thus, the composition and structure of plant communities are directly influenced by spatiotemporal patterns in water availability [136]. Piedallu et al. [137] demonstrated how an adequate spatial distribution of soil moisture can improve the performance of ecohydrological models by refining the prediction of the spatial distributions of species. It is obvious that the water cycle processes and their evolution in time and space are both a cause and consequence of vegetation [138].
Despite the pivotal role of plants on the water cycle, traditional hydrological models have neglected most plant–water interactions and vegetation dynamics [139,140]. Most traditional hydrological models include vegetation as a static parameter, which represents observed discharge fairly well at the catchment outlet [141]. As a consequence, there is still a lack of knowledge transfer, and the inclusion of vegetation in spatially distributed models remains challenging [35]. For instance, many recent large-scale models still incorporate vegetation as a constant or by using fixed phenology [142,143]. Fortunately, although including vegetation dynamics is not the norm yet, this trend is changing. During the last decade, new improved ecohydrological models have emerged, e.g., RHESSyS [144], SWIM [145], GEOTOP [146], LPJ-GUESS coupled with TOPMODEL [147], TETIS [136], STEMMUS-SCOPE [80], and STEMMUS-TeC [148].
The calibration of a hydrological model has traditionally relied on the temporal variation of the discharge at the catchment outlet. However, the discharge provides only limited insight on the spatial behavior of the catchment [149]. The development of distributed ecohydrological models and the availability of spatiotemporal data appear as a key alternative to overcome those limitations and can facilitate a spatial pattern-oriented model calibration [136]. In recent years, some researchers have used different sources of remotely sensed information from satellites to improve the implementation of ecohydrological models. For example, actual evapotranspiration was used by Immerzeel and Droogers (2008) [150], Demirel et al. (2018) [151], and Herman et al. (2018) [152]; NDVI by Ruiz-Pérez et al. (2017) [136]; LAI and actual evapotranspiration by Rajib et al. (2018) [153]; land surface temperature by Silvestro et al. (2013) [154] and Zink et al. (2018) [155]; large-scale total water storage anomaly by Lo et al. (2010) [156]; and near-surface soil moisture by Li et al. (2018) [157], Yang et al. (2019) [158], and Echeverría et al. (2019) [159].
In this WB, iAqueduct will advance how to effectively handle the multiscale multi-source water cycle products, regarding model calibration, and how to evaluate the accuracy of the simulated spatial patterns of vegetation and water states, at sub-catchment and catchment scales. Numerical experiments will be conducted for the calibration of a parsimonious distributed ecohydrological daily model in ungauged basins using exclusively spatiotemporal information obtained from WB1, WB2, and WB3. As such, this WB links the scales from the plant to plot, subcatchment, and catchment/basin, respectively, with the representative size of 1–10 m2 to 50–500 m2, 1–10 km2, and >100 km2, as derived by means of, for example, TDR observations, to cosmic ray/drone observations, drone/satellite, and satellite observations, respectively.

4. Towards Sustainable Water Management (WB6)

4.1. Summary

The main water challenge for many regions, including Europe, is to achieve the sustainable exploitation of natural and agricultural ecosystems, while enabling economic growth, under current and future climates. Addressing such challenge requires, among others, developing tools for sustainable integrative management of water resources, establishing networks and information sharing among existing research facilities/field labs and disciplines, and connecting science to society [3].
With the established framework of methodology and approaches, iAqueduct will enable the understanding of the space-time variability of EO data (e.g., regarding soil physical characteristics, soil moisture, and evapotranspiration fluxes) from the in situ/plot scale, to field and regional, and to global scales. As such, it will enable local-scale soil, vegetation, and water state information to be derived using satellite, UAS, in situ observations, ecohydrological modelling, and big data analytics tools, for sustainable integrative water management under climate change.
Several case studies are proposed at the local level, which cover a variety of climates, and hydrological and soil conditions, ensuring the generality of the methods developed. Meanwhile, iAqueduct establishes networks and information-sharing practices among existing research facilities/field labs, analytical methods, monitoring tools, and programs. Such knowledge, technology, and data hub complements available field sites with data products from satellite observations (e.g., bias corrected with in situ observation), and harmonizes protocols for the retrievals of soil properties and scaling between soil moisture and evapotranspiration for pan-European applications.
Furthermore, an end-to-end system will be developed to translate scientific data and knowledge into tailored water productivity information, establish a science–policy–business–society interface to allow for continuous dialogues and interactions across different scales and levels, influencing stakeholders towards desirable behaviors for sustainable water management. In the following section, we delineate the iAqueduct toolbox as an end-to-end system connecting science to society, and discuss the challenges to address science questions framing the scope of iAqueduct.

4.2. iAqueduct Toolbox

To address stakeholders’ requirement (Section 2.1, Appendix A), WB6 will develop an integrative information flow to close the gaps between satellite observations of the water cycle and local sustainable management of water resources (iAqueduct). The generic iAqueduct open source toolbox will integrate models, soil parameters, forcing, and field-scale observation, and gridded water states and fluxes to support the translation of science knowledge into water productivity information for the sustainable management of water resources.
The functionality of iAqueduct toolbox centers on: (1) Monitoring soil, vegetation, and water state information of the selected field sites (Table 1); (2) assessing the long-term and extreme event impacts on local agricultural and natural ecosystems, based on different policy options and climate scenarios; and (3) informing stakeholders and the general public about the actual status of the water resources. The toolbox is to be designed to facilitate the consumption of multiscale multi-source EO data, uses of ecohydrological models, and dissemination of data products via a web-based dashboard. The architecture design and main components were prototyped and the technical details can be found in [160]. The toolbox will use inputs/outputs from WB1-WB5 and make emulated visualization for users and stakeholders, and also as a tool to engage them to help iteratively develop the scenario storylines (policy interventions) for improved scenario assessment.
As a start, scenarios can be worked out for each of the selected sites using a technique developed in the EC CORE-CLIMAX project [6], whereby the distribution of forcings can be derived from the 2018 summer European drought period (as an example) and by replacing the distribution with that of another site, mimicking potential future climate changes and impact to water resources. For example, the observed climate in the Twente region (Appendix A.1) during the drought of 2018 summer will be replaced by that of the Spanish (Appendix A.5) or Italian sites (Appendix A.3) and the spatiotemporal water situation in the Twente region be simulated. In collaboration with the water authority, potential management scenarios will be developed, and citizens will be invited to propose additional measures (e.g., water-saving measures) as a preparation for such a scenario, thus connecting science to the society more effectively and influencing citizens towards desirable behavior.

4.3. Challenges

There are challenges to answer the questions framing the scope of iAqueduct (Section 2.1), in order to address stakeholders’ requirements:
-
How to downscale the global water cycle products to the local scale using multiple sources and scales of EO data?
WB1 is specifically designed to address this question, and is going to use multiple sources and scales of EO data, including in situ, UAS, medium-resolution satellites (e.g., Sentinel 1-2-3), and coarse-resolution satellites. Particularly, a number of procedures will be implemented to downscale remotely sensed water cycle products to scales suitable for water management purposes. The challenge here is to understand the physical consistency of the original satellite data and the downscaled one, when compared with in-situ measurements.
Taking soil moisture data as example, SMOS and SMAP are dedicated satellite missions for monitoring soil moisture globally at a 5-cm depth. However, Lv et al. [161,162] found that the soil moisture sensing depth of the L-Band sensor actually varies with the soil moisture itself. This means the direct comparison of in situ measured soil moisture (at 5 cm) to SMOS or SMAP observations may not be the optimal way to do the validation, which brings difficulties to the evaluation of the accuracy of downscaled soil moisture data. If we used the X-band sensor, the soil moisture sensing depth will be only limited to the top 1–2 cm [58], which renders the difficulties to placing soil moisture sensors in situ for a direct comparison with X-band data. These potential mismatches (between what we measure in situ and what is remotely sensed) highlight the need to understand physical processes behind different soil moisture products, which will guide the associated downscaling strategies and methodologies. Similar issues exist for other water cycle products [6,7,70].
-
How to explore and apply the downscaled information at the management level for a better understanding of water-energy- soil-vegetation processes?
The EO data alone is not sufficient to understand water–energy–soil–vegetation processes, which requires synergetic use of soil–plant–atmosphere continuum (SPAC) models. There is a wide diversity of SPAC models, ranging from minimalist models to detailed descriptions of the water, energy, carbon, and momentum fluxes in the soil–plant–atmosphere system (see Section 3.4). The challenge is to identify the advantages and disadvantages of these models, while aiming at reducing the reliance on in situ observations for model parameterization and at taking full advantage of UAS, airborne, and satellite observations. Another dimension of this challenge is to provide model inputs at various spatial scales, from plant to plot, sub-catchment, and catchment/basin. As such, it is possible to evaluate the optimal model complexity (e.g., either minimalist or complex model) for different scales. The optical and thermal sensors (e.g., space-based or UAS-based), together with soil spectroscopy and associated pedotransfer functions, can provide the model-required soil hydro-thermal properties at a high resolution (of the order of centimeters). However, there are well-known constraints for sensors in VIS-NIR and TIR regions of the electromagnetic spectrum, the applicability of which depends on vegetation cover. For the purpose of deriving soil texture information and soil hydro-thermal properties, these sensors can only be applied over the non-vegetated soil surface. How to address this constraint is vital to answering the second iAqueduct question, which may be examined based on a global-scale approach to evaluate clean soil areas [163].
-
How can such fine-scale information be used to improve the management of soil and water resources?
The aim of iAqueduct is to disseminate and communicate the generated knowledge and tools to water managers, companies, and farmers for actual sustainable water management. In order to be effective, stakeholders need to be engaged actively for the effective transfer of science knowledge and data into marketable tools, services, and/or products for addressing the actual needs for real life water management. This is actually demanding the establishment of an end-to-end system (iAqueduct toolbox), to enable a science–policy–business–society interface for continuous dialogues and interactions with stakeholders. The iAqueduct toolbox will build upon the existing open-source software system, MajiSys water information system [160], and will then be used for robust application (including machine learning algorithms) to the selected sites and also for use by stakeholders. The challenge here is how to facilitate such a dialogue to enable policy learning.
To sum up, iAqueduct will integrate various components from the global water cycle observation to local soil, vegetation, and water states in an open-source water information system, and test and demonstrate their utility at a set of carefully selected research sites for sustainable management of water resources. Furthermore, as iAqueduct links scales from plant to plot, field, catchment, and region, it is expected that the developed approach can be further upscaled to the pan-European scale.

Author Contributions

Conceptualization, Z.S. and Y.Z.; methodology, Z.S., Y.Z., S.M., N.R., F.F., P.N., E.B.D., B.SZ., G.V., R.Z., N.F., J.M., S.F.D.S., M.B., L.Y., M.L.B., C.M., D.T.R., B.R., L.Z.; resources and data curation, S.M., N.R., P.N., E.B.D., B.SZ., F.F., R.Z., N.F., J.M., L.Z.; writing—original draft preparation, Z.S. and Y.Z.; writing—review and editing, Z.S., Y.Z., S.M., N.R., P.N., E.B.D., B.SZ., G.V., R.Z., N.F., J.M., F.F., L.Z.; project administration, Z.S., Y.Z.; funding acquisition, Z.S., Y.Z., S.M., N.R., P.N., E.B.D., B.SZ., F.F., G.V. All authors have read and agreed to the published version of the manuscript.

Funding

The authors would like to thank the European Commission and Netherlands Organisation for Scientific Research (NWO) for funding, in the frame of the collaborative international consortium (iAqueduct) financed under the 2018 Joint call of the Water Works 2017 ERA-NET Cofund. This ERA-NET is an integral part of the activities developed by the Water JPI (Project number: ENWWW.2018.5); the EC and the Swedish Research Council for Sustainable Development (FORMAS, under grant 2018-02787); Contributions of B. Szabó was supported by the János Bolyai Research Scholarship of the Hungarian Academy of Sciences (grant no. BO/00088/18/4).

Acknowledgments

We wish to thank the COST Action CA16219 “HARMONIOUS—Harmonization of UAS techniques for agricultural and natural ecosystems monitoring” for coordination of the field experiment activities. We are grateful to the various water managers, companies and farmers in the related regions for supporting the iAqueduct project.

Conflicts of Interest

The authors declare no conflict of interest.

Appendix A. Selected Observatories for iAqueduct

Appendix A.1. Twente, The Netherlands (Temperate Maritime Climate)

Water safety and climate change have emerged as one of the first public concerns in the last years in the Twente area, the Netherlands. The major challenge is water management under climate change that needs to take into account periods of extremes, such as when it rains more and harder and when longer periods of drought persist, in maintaining the safeties and functionalities of the quays, dikes, weirs, and pumping stations. To meet this challenge, local and regional monitoring of the actual state of the water system and the anticipation of near future situations are needed. Agricultural water management requires, on the other hand, operational management of soil and water for adequate agricultural productions in the growth seasons at a field level. Other requirements are related to water quality management for nature conservation, including water treatments. A shortage of precipitation (i.e., precipitation minus potential evaporation) is used as a measure for water excess or shortage for the abovementioned tasks.
A regional soil moisture monitoring network has been installed since 2009 in the Twente region of The Netherlands [164], consisting of 20 stations continuously measuring soil moisture and soil temperature over an area of approximately 50 km × 40 km. The main objectives of Twente monitoring network are: (i) To investigate the sensitivity of active and passive microwave data to surface parameters, such as soil moisture, soil temperature, and vegetation cover; (ii) to run, calibrate, and validate new soil moisture retrieval algorithms; and (iii) to study new approaches to upscale soil moisture information from the point to large scale.
The precipitation data are available at the Royal Netherlands Meteorological Institute (KNMI). There are 15 KNMI stations measuring the precipitation in the area of the network since 1950 and the daily accumulated precipitation is available at http://www.knmi.nl/klimatologie/. According to the Koeppen Classification System, the climate in The Netherlands is a warm temperate humid climate (Cfb Climate). Other meteorological data are provided by KNMI at the Twente station located near Enschede. The precipitation is spread all over the year with an average of approximately 760 mm per year. The monthly average air temperature ranges between 3 °C in January to approximately 17 °C in July.
Detailed Land use map of Twente area are available as the Atlas of Overijssel by the Province of Overijssel (http://gisopenbaar.overijssel.nl/website/bodematlas/bodematlas.html). There are four main soil types in Twente: Sandy soils rich or poor of loam, loamy soils rich or poor of sand, man-made sandy thick earth soils, and peat soils covered by a layer of peat or sand. This information was retrieved from the soil maps (Bodemkaart van Nederland) by Stichting voor Bodemkartering (Wageningen) with a 1:50,000 scale and by Alterra, Wageningen UR (website www.bodemdata.nl). Groundwater monitoring data can be obtained from the Geological Survey of the Netherlands (TNO) (https://www.dinoloket.nl/en). Hydrological and water management information can be obtained at the water authority Vechtstromen (https://www.vechtstromen.nl/). The Twente SMST network serves as an SMOS and SMAP calibration and validation site [33].

Appendix A.2. Zala, Hungary (Cold, Humid Winter, Warm Summer)

One of the main threats in the catchment of Zala river is the more frequently occurring extreme weather events at the catchment. Information on the impact of potential future climate changes to water resources and possible management scenarios to adapt to future extreme weather events will be shared with the General Directorate of Water Management, the farmer organizations (e.g., AGRYA, Agrion Top Kft.) and public bodies (e.g., Hungarian Chamber of Agriculture, Zala County, Zala County Office of Agricultural and Rural Development Agency). At the catchment, it is also important to analyse how the transport of fertilizers, pesticides, and herbicides will change due to the extreme weather events. Recently, the amount of nitrate and pesticide in the groundwater at the catchment is close to the threshold value of groundwater pollution, and at a few plots, even exceeds it.
The catchment of river Zala in western Hungary belongs to the watershed of Lake Balaton. The catchment area of the Zala River is 2622 km2, it is situated in Zala Hills. Mean discharge of Zala is 5.6 m3 s−1. The climate is moderately warm, moderately humid, and the number of sunshine hours per year ranges between 1800 and 2000 h. The mean annual temperature of the region is about 10 ˚C. The average amount of rainfall is between 600 and 700 mm year−1.
In total, 37% of the total catchment area is arable land, which is much lower than the national average; 27% is forest, which exceeds the national average; 15% of the land is under grassland management; 5% is horticulture; 3% is pomiculture; 2% is viticulture; and 1% is reed management and fish farming. The “Kis-Balaton” nature conservation area, which is a wetland under protection of the Ramsar Convention habitat, is situated within the watershed of river Zala. The dominant soil types are Luvisols and Cambisols. Gleysols and Histosols occur in poorly drained valley bottoms [165,166].
Long-term data is available on water quantity and the water quality of Zala river, e.g., runoff, nutrients, dissolved oxygen, total dissolved solids, and water temperature. The depth of the groundwater level and daily rainfall are registered at 39 locations at the catchment of Zala river. Soil moisture is monitored with a TDR/MUX/mpts meter (Easy Test [167]) at two soil profiles till a 0.9-m depth at Vése and Keszthely since April 2018. Time series meteorological data for the sites is also available. Map of soil organic carbon content, texture, calcium-carbonate content, and pH [168] (http://dosoremi.hu/table.html) are available at a 100-m resolution at six soil depths up to 2 m. Soil water content at saturation, field capacity, wilting point (https://www.mta-taki.hu/en/kh124765), and saturated hydraulic conductivity have been mapped at a 100-m resolution at three soil depths up to 0.90 m [169]. For the mapping of soil properties, over 150 environmental parameters were collected to describe the topography, climate, parent material, state of vegetation, and land cover of the catchment.

Appendix A.3. Alento, Italy (Temperate, Dry Hot Summer)

This study area partly belongs to the “Cilento and Vallo di Diano” National Park, the largest national park in Italy, and is included as a representative site within the UNESCO-HELP program. The Alento River Catchment is usually split in the Upper Alento, a hilly and mountain marginal area that suffered from severe land abandonment and subsequent land-use changes, and the Lower Alento, characterized by a flourishing economy especially because of tourism along the entire coastline. A system of barrages, the largest being the “Piano della Rocca” earthen dam, were built and is managed by the “Velia” Bureau of Reclamation to increase irrigated agriculture and the quality of livestock methods, hence reducing the gap between the two parts of the catchment.
However, as in most water-stressed zones of the Mediterranean belt, this area is experiencing an excessive demand for water partly because of the competition among different users, which could yield conflicts among them, especially during summer. Decision-makers and stakeholders are now concerned about future benefits and constraints deriving from the changes observed in land uses and climate seasonality, and are therefore interested in addressing the following main issues: (a) Predicting the storage capacity of the artificial reservoirs in view of projected climate and land-use changes so as to meet short- and medium-term water requirements from households, agriculture, tourism, and hydropower generation; (b) promoting the most effective demand-side adaptation options; and (c) identifying optimal land resource management to ensure adequate water availability to all sectors, reduce fire risk during the prolonged dry seasons, and, at the same time, alleviate natural hazards, such as flooding and soil erosion, during the wet season.
To meet these needs, the Alento River catchment is becoming a science-driven critical zone observatory (CZO), with a major aim of supporting the issues of rural environmental protection and sustainable management of natural resources. The “Alento” CZO not only relies on background geological, pedological, and hydrological studies carried out over the last decades but also benefits from a series of investigations currently underway in the Upper Alento catchment [95]. Since 2016, wireless sensor networks (WSNs) and cosmic-ray neutron probes (CRNPs) monitor soil moisture in two small sub-catchments, named MFC2 and GOR1, having different topographic, pedological, and land-use characteristics as well as slightly different weather conditions.
More hydrologically oriented investigations have been carried out in three sub-catchments (MFC1, MFC2, and GOR1) of UARC, each with drainage areas ranging from 6 to 10 hectares [43]. MFC1 is a small sub-catchment (area of about 5 ha) located near the village of Monteforte Cilento. This experimental area was subject to intense monitoring activities from 2006 to 2011. The MFC2 sub-catchment is situated near MFC1 and both represent typical farmland areas with olive orchards, vineyards, fruit trees and crops. A portion of MFC2 is planted with cherry and walnut trees for wood production only. Another sub-catchment, named GOR1, is instead located close to the rural village of Gorga and reflects a typical forested area with mixed chestnut and oak woods. Apart from their different land-use/land-cover features, the MFC2 and GOR1 test sites should also be viewed as representative of two different hydrogeological settings. On March 2016, the MFC2 and GOR1 sub-catchments were both instrumented with a wireless sensor network (WSN) and a cosmic-ray neutron probe (CRNP).
Each wireless sensor network (SoilNet, Forschungszentrum Jülich, Germany) comprises an array of 20 underground measuring nodes that are distributed in space to account for the local geomorphological and pedological features. The following sensors were embedded at the soil depths of 0.15 and 0.30 m of each node: (i) GS3 sensor (METER, Pullman, WA, USA) to measure simultaneously soil permittivity (converted to soil moisture using empirical calibration equations), soil temperature, and soil electrical conductivity, and (ii) MPS-6 sensor (METER, Pullman, WA, USA) to measure soil matric pressure head. In each of these sub-catchments, one cosmic-ray neutron probe (CRS2000/B, Hydroinnova LLC, Albuquerque, USA) complements the SoilNet sensor network by providing area-averaged soil moisture values over a footprint of approximately 7–14 ha. To our knowledge, these two cosmic-ray neutron probes are the first to be installed and operational since 2016 in a catchment of central/southern Italy. Streamflow gauging stations are operating at the outlet of both the MFC2 and GOR1 sub-catchments. One weather station in close proximity to each sub-catchment acquires rainfall, air temperature, relative humidity, wind speed, and net solar radiation (four-component net radiation sensors, Hukseflux Thermal Sensors, www.hukseflux.com) at hourly time-steps. Wind speed and air temperature are measured at about a 3-m height while solar radiation is measured at a 2-m height. At each weather station, three GS3 sensors and three MPS-6 sensors were installed at depths of 15, 30, and 45 cm.

Appendix A.4. Fiumarella of Corleto, Italy (Temperate, Hot Humid Summer)

Fiumarella of Corleto belongs to the Basilicata region that is characterized by a significant diversity in terms of climatic conditions. For instance, the mean annual rainfall ranges between 400 and 2000 mm. Such variability reflects the regional hydrological patterns with areas affected by droughts and others that experience several floods and landslides. In this context, the study of river basin hydrology becomes critical from several points of view. The Fiumarella of Corleto is located in the water-rich part of the region that is crucial for the water supply of the region but also for the water supply of the Puglia region, which strongly relies on external resources for their agricultural and economical activities.
The experimental basin “Fiumarella of Corleto”, located in Basilicata region (southern Italy), is a tributary of the Sauro river (Agri basin) and has an area of 32.5 km2. It is situated in a sub-humid climatic zone with a mean annual rainfall of approximately 720 mm and characterized by hot-humid summers and chilly to mild winters. The interest towards this basin is due to its peculiarities. In fact, the two slopes of the catchment have different land uses: The slope on the left is covered mostly by forests, the slope on the right is covered by agricultural land. In order to characterize with a high level of details the morphology of the two slopes, a DSM of the basin at high-resolution (1 × 1 m) was derived with a LiDAR.
Catchment pedology was investigated through field campaigns and laboratory measurements aimed at identifying the main soil and units of the basin by Santini et al. (1999) [170] and by Romano and Santini, 1997 [171] and Romano and Palladino (2002) [172]. These data were reported in the land cover map elaborated by Carriero et al. (2007) [173] to define the soil hydraulic properties of each unit.
Meteorological variables are monitored on both slopes with the aim to characterize differences between the two. Moreover, an additional rainfall station and streamflow gauge is placed at the basin outlet. Soil moisture is monitored on a transect of about 60 m with a sampling frequency of 1 h. The installed instrumental system consists of a TDR100 system connected to 22 probes located in 11 sampling sites at two different depths of 30 and 60 cm. The datalogger is a CR10X produced by Campbell Scientific that transmits the soil moisture values, elaborated by the TDR100, in real time via the GSM network.

Appendix A.5. Carraixet Creek, Spain (Semiarid, Steppe, Mediterranean)

Barranco del Carraixet (or Carraixet Creek) is located in the east coast of Spain, has a catchment area of 314 km2, draining directly to the Mediterranean Sea, with a natural park in the upper part of the basin and with anthropogenic pressures in the middle and low basin. The human effect is quite important in this study site: The lowlands are characterized by alternation of the urban and industrial zones and agricultural fields, while the upper part is frequently affected by wildfires and it is a highly frequented leisure zone, subject to multiple pressures (hunters, several outdoor sports, owners, etc.). The climate is semiarid Mediterranean, with a mean annual precipitation of around 400 mm highly variable and potential evapotranspiration of 1100 mm. The hydrology is characterized by low or absent base flow, typical of Mediterranean ephemeral streams. Urban and irrigation water demands are supplied by the aquifer, mainly recharged by the upper catchment. The actual trend of the catchment is towards forest expansion in abandoned lands of the upper part and urbanization in the lower part. The main concern in Carraixet Creek is to improve forest management in order to increase aquifer recharge, increase the forest health, and to better control soil erosion. For this project, we will consider the upper and medium parts of the catchment, with an area of 250 km2. Within this area, there is one experimental watershed of 1 km2 (with 3 meteorological stations, 1 cosmic ray, and 1 flowgauge) and 1 experimental forest plot heavily sensorized. At the catchment scale and operated by the Jucar Basin Water Authority, there is one additional flowgauge station and several raingauges and piezometric observations.

Appendix A.6. Kibbutz Sde Yoav and Afeka, Israel (Arid, Dry Hot Summer)

Kibbutz Sde Yoav is an agricultural settlement located in south-central Israel, between the cities of Ashkelon, Kyriat Gat, and Kyriat Malakhi. Like Sde Yoav, in Israel, there are several agricultural settlements that were created during the establishment of the state of Israel in order to ensure the food supply. In order to monitor the fields that sustain these settlements, farmers need chemical/physical analyses. However, traditional soil survey methods are expensive, time-consuming, and need high skilled professionals. Moreover, in order to represent these parameters spatially in these large agricultural fields, it is necessary to take several samples for a correct kriging methodology, and the measurements in question varies seasonally. Additionally, farmers cannot see the status of every point of interest in these fields with a common frequency.
Given the lack of rains and the dry climate of the region [174], water is a critical resource that is necessary to manage carefully. Remote sensing is a potential solution for this problem, because it can replace field chemical/physical measurements, and could monitor the infiltration rate in the fields of interest in a spatial scale.
Study sites for the estimation of water infiltration rate using surface spectra include not only Kibbutz Sde Yoav, and Afeka, Israel but also the Alento catchment. The idea is to create a dataset with infiltration rate measurements, with laboratory and field spectral measurements. The study sites from which we collected samples until now are the following:
(i)
Kibbutz Sde Yoav, Israel (30 Samples): Kibbutz Sde Yoav is an agricultural settlement located in south-central Israel, between the cities of Ashkelon, Kyriat Gat, and Kyriat Malakhi. According to a detailed map of the soils of Israel, the soil type of the study area of Kibbutz Sde Yoav is alluvial, and according to an updated version of the Koeppen climate classification [174], the climate of Sde Yoav is hot-semiarid (Bsh). In this study area, 30 samples were collected.
(ii)
Afeta, Tel Aviv, Israel (18 Samples): Afeka is a residential neighborhood located in the north of Tel Aviv. The soil type of the study area of Afeka is brown-red sandy soil, and the climate according the classification of Rubel and Kottek, 2010 [174] is hot-summer Mediterranean climate (Csa). From Afeka, we collected 18 samples. In Afeka, we only collected samples for the calibration of the model and to expand our dataset. We did not carry out UAS campaigns there because they are forbidden.
(iii)
Alento, Italy (21 Samples): The Alento River Catchment is located in the Campania Region (Salerno Province, Italy). As in Afeka, the climate of Alento according the classification of Rubel and Kottek, 2010 is hot-summer Mediterranean climate (Csa). According to [175] in the book “Soils of Italy”, Alento is located in an area characterized by three soil types: Cambisols, Leptosols, and Luvisols. In this book, Costantini and Dazzi remark that this area is characterized hills and mountains on limestones covered by volcanic ashes, including alluvial and coastal plains.

References

  1. Ligtvoet, W.; Bouwman, A.; Knoop, J.; de Bruin, S.; Nabielek, K.; Huitzing, H.; Janse, J.; van Minne, J.; Gernaat, D.; van Puijenbroek, P. The Geography of Future Water Challenges; PBL Environmental Assessment Agency: The Hague, The Netherlands, 2018; ISBN 978-94-92685-04-9. [Google Scholar]
  2. The United Nations. The United Nations World Water Development Report 2019: Leaving No One behind; UNESCO: Paris, France, 2019; ISBN 978-92-3-100309-7. [Google Scholar]
  3. Water-JPI. Strategic Research & Innovation Agenda 2.0. 2018. Available online: http://www.waterjpi.eu/images/documents/SRIA2.0.pdf (accessed on 27 March 2020).
  4. Manfreda, S.; McCabe, M.; Miller, P.; Lucas, R.; Pajuelo Madrigal, V.; Mallinis, G.; Ben Dor, E.; Helman, D.; Estes, L.; Ciraolo, G.; et al. On the Use of Unmanned Aerial Systems for Environmental Monitoring. Remote Sens. 2018, 10, 641. [Google Scholar] [CrossRef] [Green Version]
  5. McCabe, M.F.; Rodell, M.; Alsdorf, D.E.; Miralles, D.G.; Uijlenhoet, R.; Wagner, W.; Lucieer, A.; Houborg, R.; Verhoest, N.E.C.; Franz, T.E.; et al. The Future of Earth Observation in Hydrology. Hydrol. Earth Syst. Sci. 2017, 21, 3879–3914. [Google Scholar] [CrossRef] [Green Version]
  6. Su, Z.; Timmermans, W.; Zeng, Y.; Schulz, J.; John, V.O.; Roebeling, R.A.; Poli, P.; Tan, D.; Kaspar, F.; Kaiser-Weiss, A.K.; et al. An overview of european efforts in generating climate data records. Bull. Am. Meteorol. Soc. 2018, 99, 349–359. [Google Scholar] [CrossRef]
  7. Zeng, Y.; Su, Z.; Barmpadimos, I.; Perrels, A.; Poli, P.; Boersma, K.F.; Frey, A.; Ma, X.; de Bruin, K.; Goosen, H.; et al. Towards a traceable climate service: Assessment of quality and usability of essential climate variables. Remote Sens. 2019, 11, 1186. [Google Scholar] [CrossRef] [Green Version]
  8. Zeng, Y.J.; Su, Z.B.; van der Velde, R.; Wang, L.C.; Xu, K.; Wang, X.; Wen, J. Blending Satellite Observed, Model Simulated, and in Situ Measured Soil Moisture over Tibetan Plateau. Remote Sens. 2016, 8, 268. [Google Scholar] [CrossRef] [Green Version]
  9. Babaeian, E.; Sadeghi, M.; Jones, S.B.; Montzka, C.; Vereecken, H.; Tuller, M. Ground, Proximal, and Satellite Remote Sensing of Soil Moisture. Rev. Geophys. 2019, 57, 530–616. [Google Scholar] [CrossRef] [Green Version]
  10. Pachepsky, Y.; Hill, R.L. Scale and scaling in soils. Geoderma 2017, 287, 4–30. [Google Scholar] [CrossRef]
  11. Nasta, P.; Penna, D.; Brocca, L.; Zuecco, G.; Romano, N. Downscaling near-surface soil moisture from field to plot scale: A comparative analysis under different environmental conditions. J. Hydrol. 2018, 557, 97–108. [Google Scholar] [CrossRef] [Green Version]
  12. DeBell, L.; Anderson, K.; Brazier, R.E.; King, N.; Jones, L. Water resource management at catchment scales using lightweight UAVs: Current capabilities and future perspectives. J. Unmanned Veh. Syst. 2016, 4, 7–30. [Google Scholar] [CrossRef]
  13. Shimoda, H.; Kimura, T. Japanese Space Program. In Comprehensive Remote Sensing; Liang, S., Ed.; Elsevier: Oxford, UK, 2018; Volume 1–9, pp. 246–279. ISBN 9780128032206. [Google Scholar]
  14. Markham, B.L.; Arvidson, T.; Barsi, J.A.; Choate, M.; Kaita, E.; Levy, R.; Lubke, M.; Masek, J.G. 1.03 - Landsat Program. In Comprehensive Remote Sensing; Liang, S., Ed.; Elsevier: Oxford, UK, 2018; Volume 1–9, pp. 27–90. ISBN 9780128032206. [Google Scholar]
  15. Hulley, G.; Hook, S.; Fisher, J.; Lee, C. ECOSTRESS, A NASA Earth-Ventures Instrument for studying links between the water cycle and plant health over the diurnal cycle. In Proceedings of the 2017 IEEE International Geoscience and Remote Sensing Symposium (IGARSS), Fort Worth, TX, USA, 23–28 July 2017; pp. 5494–5496. [Google Scholar]
  16. Manfreda, S.; Brocca, L.; Moramarco, T.; Melone, F.; Sheffield, J. A physically based approach for the estimation of root-zone soil moisture from surface measurements. Hydrol. Earth Syst. Sci. 2014, 18, 1199–1212. [Google Scholar] [CrossRef] [Green Version]
  17. Maggioni, V.; Meyers, P.C.; Robinson, M.D. A Review of Merged High-Resolution Satellite Precipitation Product Accuracy during the Tropical Rainfall Measuring Mission (TRMM) Era. J. Hydrometeorol. 2016, 17, 1101–1117. [Google Scholar] [CrossRef]
  18. Gebregiorgis, D.; Hathorne, E.C.; Giosan, L.; Clemens, S.; Nurnberg, D.; Frank, M. Southern Hemisphere forcing of South Asian monsoon precipitation over the past ~1 million years. Nat. Commun. 2018, 9, 4702. [Google Scholar] [CrossRef]
  19. Kimani, M.W.; Hoedjes, J.C.; Su, Z. An assessment of satellite-derived rainfall products relative to ground observations over East Africa. Remote sens. 2017, 9, 430. [Google Scholar] [CrossRef] [Green Version]
  20. AghaKouchak, A.; Nakhjiri, N. A near real-time satellite-based global drought climate data record. Environ. Res. Lett. 2012, 7, 044037. [Google Scholar] [CrossRef] [Green Version]
  21. Mu, Q.; Heinsch, F.A.; Zhao, M.; Running, S.W. Development of a global evapotranspiration algorithm based on MODIS and global meteorology data. Remote Sens. Environ. 2007, 111, 519–536. [Google Scholar] [CrossRef]
  22. Zhang, K.; Kimball, J.S.; Nemani, R.R.; Running, S.W. A continuous satellite-derived global record of land surface evapotranspiration from 1983 to 2006. Water Resour. Res. 2010, 46. [Google Scholar] [CrossRef] [Green Version]
  23. Miralles, D.G.; Holmes, T.R.H.; De Jeu, R.A.M.; Gash, J.H.; Meesters, A.; Dolman, A.J. Global land-surface evaporation estimated from satellite-based observations. Hydrology and Earth System Sciences 2011, 15, 453–469. [Google Scholar] [CrossRef] [Green Version]
  24. Anderson, M.C.; Kustas, W.P.; Norman, J.M.; Hain, C.R.; Mecikalski, J.R.; Schultz, L.; Gonzalez-Dugo, M.P.; Cammalleri, C.; d’Urso, G.; Pimstein, A.; et al. Mapping daily evapotranspiration at field to continental scales using geostationary and polar orbiting satellite imagery. Hydrol. Earth Syst. Sci. 2011, 15, 223–239. [Google Scholar] [CrossRef] [Green Version]
  25. Su, Z. The Surface Energy Balance System (SEBS) for estimation of turbulent heat fluxes. Hydrol. Earth Syst. Sci. 2002, 6, 85–99. [Google Scholar] [CrossRef]
  26. Chen, X.; Su, Z.; Ma, Y.; Liu, S.; Yu, Q.; Xu, Z. Development of a 10-year (2001-2010) 0.1 degrees data set of land-surface energy balance for mainland China. Atmos. Chem. Phys. 2014, 14, 13097–13117. [Google Scholar] [CrossRef] [Green Version]
  27. Chen, X.; Su, Z.; Ma, Y.; Middleton, E.M. Optimization of a remote sensing energy balance method over different canopy applied at global scale. Agric. For. Meteorol. 2019, 279, 107633. [Google Scholar] [CrossRef]
  28. Mueller, B.; Seneviratne, S.I.; Jimenez, C.; Corti, T.; Hirschi, M.; Balsamo, G.; Ciais, P.; Dirmeyer, P.; Fisher, J.B.; Guo, Z.; et al. Evaluation of global observations-based evapotranspiration datasets and IPCC AR4 simulations. Geophys. Res. Lett. 2011, 38. [Google Scholar] [CrossRef] [Green Version]
  29. Vinukollu, R.K.; Wood, E.F.; Ferguson, C.R.; Fisher, J.B. Global estimates of evapotranspiration for climate studies using multi-sensor remote sensing data: Evaluation of three process-based approaches. Remote Sens. Environ. t 2011, 115, 801–823. [Google Scholar] [CrossRef]
  30. Wang, K.C.; Dickinson, R.E. A review of global terrestrial evapotranspiration: Observation, modeling, climatology, and climatic variability. Rev. Geophys. 2012, 50. [Google Scholar] [CrossRef]
  31. Bhattarai, N.; Mallick, K.; Brunsell, N.A.; Sun, G.; Jain, M. Regional evapotranspiration from an image-based implementation of the Surface Temperature Initiated Closure (STIC1.2) model and its validation across an aridity gradient in the conterminous US. Hydrol. Earth Syst. Sci. 2018, 22, 2311–2341. [Google Scholar] [CrossRef] [Green Version]
  32. Kerr, Y.H.; Waldteufel, P.; Richaume, P.; Wigneron, J.P.; Ferrazzoli, P.; Mahmoodi, A.; Al Bitar, A.; Cabot, F.; Gruhier, C.; Juglea, S.E.; et al. The SMOS Soil Moisture Retrieval Algorithm. IEEE Trans. Geosci. Remote Sens. 2012, 50, 1384–1403. [Google Scholar] [CrossRef]
  33. Colliander, A.; Jackson, T.J.; Bindlish, R.; Chan, S.; Das, N.; Kim, S.B.; Cosh, M.H.; Dunbar, R.S.; Dang, L.; Pashaian, L.; et al. Validation of SMAP surface soil moisture products with core validation sites. Remote Sens. Environ. 2017, 191, 215–231. [Google Scholar] [CrossRef]
  34. Sadeghi, M.; Gao, L.; Ebtehaj, A.; Wigneron, J.-P.; Crow, W.T.; Reager, J.T.; Warrick, A.W. Retrieving global surface soil moisture from GRACE satellite gravity data. J. Hydrol. 2020, 584, 124717. [Google Scholar] [CrossRef]
  35. Bierkens, M.F.P. Global hydrology 2015: State, trends, and directions. Water Resour. Res. 2015, 51, 4923–4947. [Google Scholar] [CrossRef]
  36. Isham, V.; Cox, D.R.; Rodríguez-Iturbe, I.; Porporato, A.; Manfreda, S. Representation of space–time variability of soil moisture. Proc. R. Soc. A Math. Phys. Eng. Sci. 2005, 461, 4035–4055. [Google Scholar] [CrossRef]
  37. Manfreda, S.; McCabe, M.F.; Fiorentino, M.; Rodríguez-Iturbe, I.; Wood, E.F. Scaling characteristics of spatial patterns of soil moisture from distributed modelling. Adv. Water Resour. 2007, 30, 2145–2150. [Google Scholar] [CrossRef]
  38. Rosenbaum, U.; Bogena, H.R.; Herbst, M.; Huisman, J.A.; Peterson, T.J.; Weuthen, A.; Western, A.W.; Vereecken, H. Seasonal and event dynamics of spatial soil moisture patterns at the small catchment scale. Water Resour. Res. 2012, 48, W10544. [Google Scholar] [CrossRef] [Green Version]
  39. Wang, T.; Franz, T.E.; Li, R.; You, J.; Shulski, M.D.; Ray, C. Evaluating climate and soil effects on regional soil moisture spatial variability using EOFs. Water Resour. Res. 2017, 53, 4022–4035. [Google Scholar] [CrossRef]
  40. Mwangi, S.; Zeng, Y.; Montzka, C.; Yu, L.; Su, Z. Assimilation of Cosmic-Ray Neutron Counts for the Estimation of Soil Ice Content on the Eastern Tibetan Plateau. J. Geophys. Res. Atmos. 2020, 125, e2019JD031529. [Google Scholar] [CrossRef] [Green Version]
  41. Qu, W.; Bogena, H.R.; Huisman, J.A.; Vanderborght, J.; Schuh, M.; Priesack, E.; Vereecken, H. Predicting subgrid variability of soil water content from basic soil information. Geophys. Res. Lett. 2015, 42, 789–796. [Google Scholar] [CrossRef] [Green Version]
  42. Montzka, C.; Rötzer, K.; Bogena, H.; Sanchez, N.; Vereecken, H. A New Soil Moisture Downscaling Approach for SMAP, SMOS, and ASCAT by Predicting Sub-Grid Variability. Remote Sens. 2018, 10, 427. [Google Scholar] [CrossRef] [Green Version]
  43. Nasta, P.; Schonbrodt-Stitt, S.; Bogena, H.; Kurtenbach, M.; Ahmadian, N.; Vereecken, H.; Conrad, C.; Romano, N. Integrating ground-based and remote sensing-based monitoring of near-surface soil moisture in a Mediterranean environment. In Proceedings of the 2019 IEEE International Workshop on Metrology for Agriculture and Forestry (MetroAgriFor), Portici, Italy, 24–26 October 2019; Institute of Electrical and Electronics Engineers Inc.: Piscataway, NJ, USA, 2019; pp. 274–279. [Google Scholar]
  44. Mishra, V.; Ellenburg, W.L.; Griffin, R.E.; Mecikalski, J.R.; Cruise, J.F.; Hain, C.R.; Anderson, M.C. An initial assessment of a SMAP soil moisture disaggregation scheme using TIR surface evaporation data over the continental United States. Int. J. Appl. Earth Obs. Geoinf. 2018, 68, 92–104. [Google Scholar] [CrossRef]
  45. Sadeghi, M.; Babaeian, E.; Tuller, M.; Jones, S.B. The optical trapezoid model: A novel approach to remote sensing of soil moisture applied to Sentinel-2 and Landsat-8 observations. Remote Sens. Environ. 2017, 198, 52–68. [Google Scholar] [CrossRef] [Green Version]
  46. Haubrock, S.N.; Chabrillat, S.; Lemmnitz, C.; Kaufmann, H. Surface soil moisture quantification models from reflectance data under field conditions. Int. J. Remote Sens. 2010, 29, 3–29. [Google Scholar] [CrossRef]
  47. Ben-dor, E.; Goldshleger, N.; Braun, O.; Kindel, B.; Goetz, A.F.H.; Bonfil, D.; Margalit, N.; Binaymini, Y.; Karnieli, A.; Agassi, M. Monitoring infiltration rates in semiarid soils using airborne hyperspectral technology. Int. J. Remote Sens. 2010, 25, 2607–2624. [Google Scholar] [CrossRef]
  48. Ben-Gal, A.; Agam, N.; Alchanatis, V.; Cohen, Y.; Yermiyahu, U.; Zipori, I.; Presnov, E.; Sprintsin, M.; Dag, A. Evaluating water stress in irrigated olives: Correlation of soil water status, tree water status, and thermal imagery. Irrig. Sci. 2009, 27, 367–376. [Google Scholar] [CrossRef]
  49. Agam, N.; Berliner, P.R.; Zangvil, A.; Ben-Dor, E. Soil water evaporation during the dry season in an arid zone. J. Geophys. Res. D Atmos. 2004, 109, D16103. [Google Scholar] [CrossRef] [Green Version]
  50. de Oliveira Costa, J.; José, J.V.; Wolff, W.; de Oliveira, N.P.R.; Oliveira, R.C.; Ribeiro, N.L.; Coelho, R.D.; da Silva, T.J.A.; Bonfim-Silva, E.M.; Schlichting, A.F. Spatial variability quantification of maize water consumption based on Google EEflux tool. Agric. Water Manag. 2020, 232, 106037. [Google Scholar] [CrossRef]
  51. Ochsner, T.E.; Cosh, M.H.; Cuenca, R.H.; Dorigo, W.A.; Draper, C.S.; Hagimoto, Y.; Kerr, Y.H.; Larson, K.M.; Njoku, E.G.; Small, E.E.; et al. State of the Art in Large-Scale Soil Moisture Monitoring. Soil Sci. Soc. Am. J. 2013, 77, 1888–1919. [Google Scholar] [CrossRef] [Green Version]
  52. Reichle, R.H.; De Lannoy, G.J.M.; Liu, Q.; Ardizzone, J.V.; Colliander, A.; Conaty, A.; Crow, W.; Jackson, T.J.; Jones, L.A.; Kimball, J.S.; et al. Assessment of the SMAP Level-4 Surface and Root-Zone Soil Moisture Product Using In Situ Measurements. J. Hydrometeorol. 2017, 18, 2621–2645. [Google Scholar] [CrossRef]
  53. Wagner, W.; Lemoine, G.; Rott, H. A method for estimating soil moisture from ERS scatterometer and soil data. Remote Sens. Environ. 1999, 70, 191–207. [Google Scholar] [CrossRef]
  54. Baldwin, D.; Manfreda, S.; Keller, K.; Smithwick, E.A.H. Predicting root zone soil moisture with soil properties and satellite near-surface moisture data across the conterminous United States. J. Hydrol. 2017, 546, 393–404. [Google Scholar] [CrossRef]
  55. Buras, A.; Rammig, A.; Zang, C.S. Quantifying impacts of the drought 2018 on European ecosystems in comparison to 2003. Biogeosciences Discuss. 2019, 2019, 1–23. [Google Scholar] [CrossRef] [Green Version]
  56. Vogel, M.M.; Zscheischler, J.; Wartenburger, R.; Dee, D.; Seneviratne, S.I. Concurrent 2018 Hot Extremes Across Northern Hemisphere Due to Human-Induced Climate Change. Earth’s Future 2019, 7, 692–703. [Google Scholar] [CrossRef]
  57. Peng, J.; Loew, A.; Merlin, O.; Verhoest, N.E.C. A review of spatial downscaling of satellite remotely sensed soil moisture. Rev. Geophys. 2017, 55, 341–366. [Google Scholar] [CrossRef]
  58. Sabaghy, S.; Walker, J.P.; Renzullo, L.J.; Jackson, T.J. Spatially enhanced passive microwave derived soil moisture: Capabilities and opportunities. Remote Sens. Environ. 2018, 209, 551–580. [Google Scholar] [CrossRef]
  59. Mascaro, G.; Ko, A.; Vivoni, E.R. Closing the Loop of Satellite Soil Moisture Estimation via Scale Invariance of Hydrologic Simulations. Sci. Rep. 2019, 9, 1–8. [Google Scholar] [CrossRef] [PubMed] [Green Version]
  60. Zhao, H.; Zeng, Y.; Lv, S.; Su, Z. Analysis of soil hydraulic and thermal properties for land surface modeling over the Tibetan Plateau. Earth Syst. Sci. Data 2018, 10, 1031–1061. [Google Scholar] [CrossRef] [Green Version]
  61. Su, Z.; de Rosnay, P.; Wen, J.; Wang, L.; Zeng, Y. Evaluation of ECMWF’s soil moisture analyses using observations on the Tibetan Plateau. J. Geophys. Res. Atmos. 2013, 118, 5304–5318. [Google Scholar] [CrossRef] [Green Version]
  62. Tang, Q.; Gao, H.; Yeh, P.; Oki, T.; Su, F.; Lettenmaier, D.P. Dynamics of Terrestrial Water Storage Change from Satellite and Surface Observations and Modeling. J. Hydrometeorol. 2010, 11, 156–170. [Google Scholar] [CrossRef] [Green Version]
  63. Tapley, B.D.; Bettadpur, S.; Ries, J.C.; Thompson, P.F.; Watkins, M.M. GRACE Measurements of Mass Variability in the Earth System. Science 2004, 305, 503. [Google Scholar] [CrossRef] [Green Version]
  64. Rodell, M.; Famiglietti, J.S.; Wiese, D.N.; Reager, J.T.; Beaudoing, H.K.; Landerer, F.W.; Lo, M.H. Emerging trends in global freshwater availability. Nature 2018, 557, 651–659. [Google Scholar] [CrossRef]
  65. Save, H.; Bettadpur, S.; Tapley, B.D. High-resolution CSR GRACE RL05 mascons. J. Geophys. Res. Solid Earth 2016, 121, 7547–7569. [Google Scholar] [CrossRef]
  66. Zhang, L.; Yi, S.; Wang, Q.; Chang, L.; Tang, H.; Sun, W. Evaluation of GRACE mascon solutions for small spatial scales and localized mass sources. Geophys. J. Int. 2019, 218, 1307–1321. [Google Scholar] [CrossRef]
  67. Frappart, F.; Ramillien, G. Monitoring Groundwater Storage Changes Using the Gravity Recovery and Climate Experiment (GRACE) Satellite Mission: A Review. Remote Sens. 2018, 10, 829. [Google Scholar] [CrossRef] [Green Version]
  68. Duan, J.; Miller, N.L. A generalized power function for the subsurface transmissivity profile in TOPMODEL. Water Resour. Res. 1997, 33, 2559–2562. [Google Scholar] [CrossRef]
  69. Beven, K.J.; Kirkby, M.J. A physically based, variable contributing area model of basin hydrology / Un modèle à base physique de zone d’appel variable de l’hydrologie du bassin versant. Hydrol. Sci. Bull. 1979, 24, 43–69. [Google Scholar] [CrossRef] [Green Version]
  70. Zeng, Y.; Su, Z.; Calvet, J.C.; Manninen, T.; Swinnen, E.; Schulz, J.; Roebeling, R.; Poli, P.; Tan, D.; Riihelä, A.; et al. Analysis of current validation practices in Europe for space-based climate data records of essential climate variables. Int. J. Appl. Earth Obs. Geoinf. 2015, 42, 150–161. [Google Scholar] [CrossRef]
  71. Zhuang, R.; Zeng, Y.; Manfreda, S.; Su, Z. Quantifying Long-Term Land Surface and Root Zone Soil Moisture over Tibetan Plateau. Remote Sens. 2020, 12, 509. [Google Scholar] [CrossRef] [Green Version]
  72. Zeng, Y.; Su, Z. STEMMUS: Simultaneous Transfer of Engery, Mass and Momentum in Unsaturated Soil. (ITC-WRS Report); University of Twente, Faculty of Geo-Information and Earth Observation (ITC): Enschede, The Netherlands, 2013; pp. 6161–6164. ISBN 978-90-6164-351-7. [Google Scholar]
  73. Yu, L.; Zeng, Y.; Su, Z.; Cai, H.; Zheng, Z. The effect of different evapotranspiration methods on portraying soil water dynamics and ET partitioning in a semi-arid environment in Northwest China. Hydrol. Earth Syst. Sci. 2016, 20, 975–990. [Google Scholar] [CrossRef] [Green Version]
  74. Yu, L.; Zeng, Y.; Wen, J.; Su, Z. Liquid-Vapor-Air Flow in the Frozen Soil. J. Geophys. Res. Atmos. 2018, 123, 7393–7415. [Google Scholar] [CrossRef] [Green Version]
  75. van der Tol, C.; Verhoef, W.; Timmermans, J.; Verhoef, A.; Su, Z. An integrated model of soil-canopy spectral radiances, photosynthesis, fluorescence, temperature and energy balance. Biogeosciences 2009, 6, 3109–3129. [Google Scholar] [CrossRef] [Green Version]
  76. Zeng, Y.; Su, Z.; Wan, L.; Yang, Z.; Zhang, T.; Tian, H.; Shi, X.; Wang, X.; Cao, W. Diurnal pattern of the drying front in desert and its application for determining the effective infiltration. Hydrol. Earth Syst. Sci. 2009, 13, 703–714. [Google Scholar] [CrossRef] [Green Version]
  77. Zeng, Y.; Su, Z.; Wan, L.; Wen, J. A simulation analysis of the advective effect on evaporation using a two-phase heat and mass flow model. Water Resour. Res. 2011, 47. [Google Scholar] [CrossRef]
  78. Zeng, Y.; Su, Z.; Wan, L.; Wen, J. Numerical analysis of air-water-heat flow in unsaturated soil: Is it necessary to consider airflow in land surface models? J. Geophys. Res. Atmos. 2011, 116. [Google Scholar] [CrossRef] [Green Version]
  79. Zeng, Y.J.; Wan, L.; Su, Z.B.; Saito, H.; Huang, K.L.; Wang, X.S. Diurnal soil water dynamics in the shallow vadose zone (field site of China University of Geosciences, China). Environ. Geol. 2009, 58, 11–23. [Google Scholar] [CrossRef]
  80. Wang, Y.; Zeng, Y.; Su, Z.; Yu, L.; Yang, P.; Van der Tol, C.; Cai, H. Integrated Modeling of Photosynthesis and Transfer of Energy, Mass and Momentum in the Soil-Plant-Atmosphere Continuum System. Geosci. Model Develop. Discuss. 2020. under review. [Google Scholar]
  81. Ben-Dor, E. Soil Spectral Imaging: Moving from Proximal Sensing to Spatial Quantitative Domain. ISPRS Ann. Photogramm. Remote Sens. Spat. Inf. Sci. 2012, I–7, 67–70. [Google Scholar] [CrossRef] [Green Version]
  82. Ben-Dor, E.; Granot, A.; Notesco, G. A simple apparatus to measure soil spectral information in the field under stable conditions. Geoderma 2017, 306, 73–80. [Google Scholar] [CrossRef]
  83. Dohnal, M.; Dusek, J.; Vogel, T. Improving Hydraulic Conductivity Estimates from Minidisk Infiltrometer Measurements for Soils with Wide Pore-Size Distributions. Soil Sci. Soc. Am. J. 2010, 74, 804–811. [Google Scholar] [CrossRef]
  84. Pedregosa, F.; Varoquaux, G.; Gramfort, A.; Michel, V.; Thirion, B.; Grisel, O.; Blondel, M.; Prettenhofer, P.; Weiss, R.; Dubourg, V.; et al. Scikit-learn: Machine Learning in Python. J. Mach. Learn. Res. 2011, 12, 2825–2830. [Google Scholar]
  85. Savitzky, A.; Golay, M.J.E. Smoothing and Differentiation of Data by Simplified Least Squares Procedures. Anal. Chem. 1964, 36, 1627–1639. [Google Scholar] [CrossRef]
  86. Ben-Dor, E. Quantitative remote sensing of soil properties. In Advances in Agronomy; Academic Press: Cambridge, MA, USA, 2002; Volume 75, pp. 173–243. ISBN 0120007932. [Google Scholar]
  87. Ben-Dor, E.; Chabrillat, S.; Demattê, J.A.M. Characterization of Soil Properties Using Reflectance Spectroscopy. In Fundamentals, Sensor Systems, Spectral Libraries, and Data Mining for Vegetation; CRC Press: Boca Raton, FL, USA, 2018; pp. 187–247. [Google Scholar]
  88. Nasta, P.; Romano, N.; Assouline, S.; Vrugt, J.A.; Hopmans, J.W. Prediction of spatially variable unsaturated hydraulic conductivity using scaled particle-size distribution functions. Water Resour. Res. 2013, 49, 4219–4229. [Google Scholar] [CrossRef] [Green Version]
  89. Toth, B.; Weynants, M.; Nemes, A.; Mako, A.; Bilas, G.; Toth, G. New generation of hydraulic pedotransfer functions for Europe. Eur. J. Soil Sci. 2015, 66, 226–238. [Google Scholar] [CrossRef]
  90. Van Looy, K.; Bouma, J.; Herbst, M.; Koestel, J.; Minasny, B.; Mishra, U.; Montzka, C.; Nemes, A.; Pachepsky, Y.A.; Padarian, J.; et al. Pedotransfer Functions in Earth System Science: Challenges and Perspectives. Rev. Geophys. 2017, 55, 1199–1256. [Google Scholar] [CrossRef] [Green Version]
  91. Tóth, B.; Weynants, M.; Pásztor, L.; Hengl, T. 3D soil hydraulic database of Europe at 250m resolution. Hydrol. Process. 2017, 31, 2662–2666. [Google Scholar] [CrossRef] [Green Version]
  92. Viscarra Rossel, R.A.; Behrens, T.; Ben-Dor, E.; Brown, D.J.; Demattê, J.A.M.; Shepherd, K.D.; Shi, Z.; Stenberg, B.; Stevens, A.; Adamchuk, V.; et al. A global spectral library to characterize the world’s soil. Earth Sci. Rev. 2016, 155, 198–230. [Google Scholar] [CrossRef] [Green Version]
  93. Toth, G.; Jones, A.; Montanarella, L. The LUCAS topsoil database and derived information on the regional variability of cropland topsoil properties in the European Union. Environ. Monit. Assess. 2013, 185, 7409–7425. [Google Scholar] [CrossRef] [PubMed]
  94. Babaeian, E.; Homaee, M.; Vereecken, H.; Montzka, C.; Norouzi, A.A.; van Genuchten, M.T. A Comparative Study of Multiple Approaches for Predicting the Soil-Water Retention Curve: Hyperspectral Information vs. Basic Soil Properties. Soil Sci. Soc. Am. J. 2015, 79, 1043–1058. [Google Scholar] [CrossRef] [Green Version]
  95. Romano, N.; Nasta, P.; Bogena, H.; De Vita, P.; Stellato, L.; Vereecken, H. Monitoring Hydrological Processes for Land and Water Resources Management in a Mediterranean Ecosystem: The Alento River Catchment Observatory. Vadose Zone J. 2018, 17, 180042. [Google Scholar] [CrossRef] [Green Version]
  96. Weynants, M.; Montanarella, L.; Tóth, G. European HYdropedological Data Inventory (EU-HYDI); Office of the European Union: Brussels, Belgium, 2013; ISBN 978-92-79-32355-3. [Google Scholar]
  97. FAO. WaPOR, FAO’s portal to monitor Water Productivity through Open access of Remotely sensed derived data. Available online: https://wapor.apps.fao.org/home/WAPOR_2/1 (accessed on 22 May 2020).
  98. FAO. WaPOR Database Methodology: Level 1 Data; Food and Agriculture Organization of the United Nations: Rome, Italy, 2018. [Google Scholar]
  99. Blatchford, M.L.; Mannaerts, C.M.; Njuki, S.M.; Nouri, H.; Zeng, Y.; Pelgrum, H.; Wonink, S.; Karimi, P. Evaluation of WaPOR V2 evapotranspiration products across Africa. Hydrol. Process. 2020. [Google Scholar] [CrossRef]
  100. Su, Z.; Yacob, A.; Wen, J.; Roerink, G.; He, Y.; Gao, B.; Boogaard, H.; van Diepen, C. Assessing relative soil moisture with remote sensing data: Theory, experimental validation, and application to drought monitoring over the North China Plain. Phys. Chem. Earth 2003, 28, 89–101. [Google Scholar] [CrossRef]
  101. Asbjornsen, H.; Goldsmith, G.R.; Alvarado-Barrientos, M.S.; Rebel, K.; Van Osch, F.P.; Rietkerk, M.; Chen, J.; Gotsch, S.; Tobón, C.; Geissert, D.R.; et al. Ecohydrological advances and applications in plant-water relations research: A review. J. Plant Ecol. 2011, 4, 3–22. [Google Scholar] [CrossRef]
  102. Jasechko, S.; Sharp, Z.D.; Gibson, J.J.; Birks, S.J.; Yi, Y.; Fawcett, P.J. Terrestrial water fluxes dominated by transpiration. Nature 2013, 496, 347–350. [Google Scholar] [CrossRef]
  103. Pielke, R.A.; Avissar, R.; Raupach, M.; Dolman, J.A.; Zeng, X.; Denning, S.A. Interactions between the atmosphere and terrestrial ecosystems: Influence on weather and climate. Glob. Chang. Biol. 1998, 4, 461–475. [Google Scholar] [CrossRef]
  104. Fatichi, S.; Pappas, C.; Ivanov, V.Y. Modeling plant-water interactions: An ecohydrological overview from the cell to the global scale. Wiley Interdiscip. Rev. Water 2016, 3, 327–368. [Google Scholar] [CrossRef]
  105. Mencuccini, M.; Manzoni, S.; Christoffersen, B. Modelling water fluxes in plants: From tissues to biosphere. New Phytol. 2019, 222, 1207–1222. [Google Scholar] [CrossRef] [Green Version]
  106. Milly, P.C.D. Climate, soil water storage, and the average annual water balance. Water Resour. Res. 1994, 30, 2143–2156. [Google Scholar] [CrossRef]
  107. Rodriguez-Iturbe, I.; Porporato, A.; Rldolfi, L.; Isham, V.; Cox, D.R. Probabilistic modelling of water balance at a point: The role of climate, soil and vegetation. Proc. R. Soc. A Math. Phys. Eng. Sci. 1999, 455, 3789–3805. [Google Scholar] [CrossRef]
  108. Allen, R.; Pereira, L.; Raes, D.; Smith, M. Guidlines for Computing Crop Water Requirements. In FAO Irrigation and Drainage Paper 56; FAO - Food and Agriculture Organization of the United Nations: Rome, Italy, 1998; ISBN 92-5-104219-5. [Google Scholar]
  109. Verhoef, A.; Egea, G. Modeling plant transpiration under limited soil water: Comparison of different plant and soil hydraulic parameterizations and preliminary implications for their use in land surface models. Agric. For. Meteorol. 2014, 191, 22–32. [Google Scholar] [CrossRef] [Green Version]
  110. Porporato, A.; Laio, F.; Ridolfi, L.; Rodriguez-Iturbe, I. Plants in water-controlled ecosystems: Active role in hydrologie processes and responce to water stress III. Vegetation water stress. Adv. Water Resour. 2001, 24, 725–744. [Google Scholar] [CrossRef]
  111. Daly, E.; Porporato, A.; Rodriguez-Iturbe, I. Coupled dynamics of photosynthesis, transpiration, and soil water balance. Part II: Stochastic analysis and ecohydrological significance. J. Hydrometeorol. 2004, 5, 559–566. [Google Scholar] [CrossRef]
  112. Farrior, C.E.; Rodriguez-Iturbe, I.; Dybzinski, R.; Levin, S.A.; Pacala, S.W. Decreased water limitation under elevated CO2 amplifies potential for forest carbon sinks. Proc. Natl. Acad. Sci. USA 2015, 112, 7213–7218. [Google Scholar] [CrossRef] [Green Version]
  113. Vico, G.; Porporato, A. Modelling C3 and C4 photosynthesis under water-stressed conditions. Plant Soil 2008, 313, 187–203. [Google Scholar] [CrossRef]
  114. Vico, G.; Porporato, A. From rainfed agriculture to stress-avoidance irrigation: I. A generalized irrigation scheme with stochastic soil moisture. Adv. Water Resour. 2011, 34, 263–271. [Google Scholar] [CrossRef]
  115. Vico, G.; Porporato, A. Probabilistic description of crop development and irrigation water requirements with stochastic rainfall. Water Resour. Res. 2013, 49, 1466–1482. [Google Scholar] [CrossRef]
  116. Thornton, P.E.; Law, B.E.; Gholz, H.L.; Clark, K.L.; Falge, E.; Ellsworth, D.S.; Goldstein, A.H.; Monson, R.K.; Hollinger, D.; Falk, M.; et al. Modeling and measuring the effects of disturbance history and climate on carbon and water budgets in evergreen needleleaf forests. Agric. For. Meteorol. 2002, 113, 185–222. [Google Scholar] [CrossRef]
  117. Amthor, J.S. Scaling CO2-photosynthesis relationships from the leaf to the canopy. Photosynth. Res. 1994, 39, 321–350. [Google Scholar] [CrossRef] [PubMed]
  118. Jarvis, P.G.; Mcnaughton, K.G. Stomatal Control of Transpiration: Scaling Up from Leaf to Region. Adv. Ecol. Res. 1986, 15, 1–49. [Google Scholar] [CrossRef]
  119. Medlyn, B.E. Physiological basis of the light use efficiency model. Tree Physiol. 1998, 18, 167–176. [Google Scholar] [CrossRef]
  120. Farquhar, G.D.; von Caemmerer, S.; Berry, J.A. A biochemical model of photosynthetic CO2 assimilation in leaves of C3 species. Planta 1980, 149, 78–90. [Google Scholar] [CrossRef] [Green Version]
  121. Damour, G.; Simonneau, T.; Cochard, H.; Urban, L. An overview of models of stomatal conductance at the leaf level. Plant. Cell Environ. 2010, 33, 1419–1438. [Google Scholar] [CrossRef]
  122. Tuzet, A.; Perrier, A.; Leuning, R. A coupled model of stomatal conductance, photosynthesis and transpiration. Plant. Cell Environ. 2003, 26, 1097–1116. [Google Scholar] [CrossRef]
  123. Hanson, P.J.; Amthor, J.S.; Wullschleger, S.D.; Wilson, K.B.; Grant, R.F.; Hartley, A.; Hui, D.; Hunt, E.R.; Johnson, D.W.; Kimball, J.S.; et al. Oak forest carbon and water simulations: Model intercomparisons and evaluations against independent data. Ecol. Monogr. 2004, 74, 443–489. [Google Scholar] [CrossRef] [Green Version]
  124. Manzoni, S.; Vico, G.; Porporato, A.; Katul, G. Biological constraints on water transport in the soil-plant-atmosphere system. Adv. Water Resour. 2013, 51, 292–304. [Google Scholar] [CrossRef]
  125. Schymanski, S.J.; Sivapalan, M.; Roderick, M.L.; Hutley, L.B.; Beringer, J. An optimality-based model of the dynamic feedbacks between natural vegetation and the water balance. Water Resour. Res. 2009, 45. [Google Scholar] [CrossRef] [Green Version]
  126. Guswa, A.J.; Celia, M.A.; Rodriguez-Iturbe, I. Models of soil moisture dynamics in ecohydrology: A comparative study. Water Resour. Res. 2002, 38, 1166. [Google Scholar] [CrossRef]
  127. Drewry, D.T.; Kumar, P.; Long, S.; Bernacchi, C.; Liang, X.Z.; Sivapalan, M. Ecohydrological responses of dense canopies to environmental variability: 1. Interplay between vertical structure and photosynthetic pathway. J. Geophys. Res. 2010, 115, G04022. [Google Scholar] [CrossRef]
  128. Launiainen, S.; Katul, G.G.; Lauren, A.; Kolari, P. Coupling boreal forest CO2, H2O and energy flows by a vertically structured forest canopy - Soil model with separate bryophyte layer. Ecol. Modell. 2015, 312, 385–405. [Google Scholar] [CrossRef]
  129. Bassiouni, M.; Higgins, C.W.; Still, C.J.; Good, S.P. Probabilistic inference of ecohydrological parameters using observations from point to satellite scales. Hydrol. Earth Syst. Sci 2018, 22, 3229–3243. [Google Scholar] [CrossRef]
  130. Bassiouni, M.; Good, S.P.; Still, C.J.; Higgins, C.W. Plant Water Uptake Thresholds Inferred from Satellite Soil Moisture. Geophys. Res. Lett. 2020, 47, e2020GL087077. [Google Scholar] [CrossRef] [Green Version]
  131. Ruiz-Pérez, G.; González-Sanchis, M.; Del Campo, A.D.; Francés, F. Can a parsimonious model implemented with satellite data be used for modelling the vegetation dynamics and water cycle in water-controlled environments? Ecol. Modell. 2016, 324, 45–53. [Google Scholar] [CrossRef] [Green Version]
  132. Jin, X.; Kumar, L.; Li, Z.; Feng, H.; Xu, X.; Yang, G.; Wang, J. A review of data assimilation of remote sensing and crop models. Eur. J. Agron. 2018, 92, 141–152. [Google Scholar] [CrossRef]
  133. Kasampalis, D.; Alexandridis, T.; Deva, C.; Challinor, A.; Moshou, D.; Zalidis, G. Contribution of Remote Sensing on Crop Models: A Review. J. Imaging 2018, 4, 52. [Google Scholar] [CrossRef] [Green Version]
  134. Christensen-Dalsgaard, K.K.; Tyree, M.T.; Mussone, P.G. Surface tension phenomena in the xylem sap of three diffuse porous temperate tree species. Tree Physiol. 2011, 31, 361–368. [Google Scholar] [CrossRef]
  135. Caylor, K.K.; D’Odorico, P.; Rodriguez-Iturbe, I. On the ecohydrology of structurally heterogeneous semiarid landscapes. Water Resour. Res. 2006, 42. [Google Scholar] [CrossRef]
  136. Ruiz-Pérez, G.; Koch, J.; Manfreda, S.; Caylor, K.; Francés, F. Calibration of a parsimonious distributed ecohydrological daily model in a data-scarce basin by exclusively using the spatio-temporal variation of NDVI. Hydrol. Earth Syst. Sci. 2017, 21, 6235–6251. [Google Scholar] [CrossRef] [Green Version]
  137. Piedallu, C.; Gégout, J.C.; Perez, V.; Lebourgeois, F. Soil water balance performs better than climatic water variables in tree species distribution modelling. Glob. Ecol. Biogeogr. 2013, 22, 470–482. [Google Scholar] [CrossRef]
  138. Rodriguez-Iturbe, I. Ecohydrology: A hydrologic perspective of climate-soil-vegetation dynamies. Water Resour. Res. 2000, 36, 3–9. [Google Scholar] [CrossRef] [Green Version]
  139. Snyder, K.A.; Williams, D.G. Water sources used by riparian trees varies among stream types on the San Pedro River, Arizona. Agric. For. Meteorol. 2000, 105, 227–240. [Google Scholar] [CrossRef]
  140. Aydin, M.; Yang, S.L.; Kurt, N.; Yano, T. Test of a simple model for estimating evaporation from bare soils in different environments. Ecol. Modell. 2005, 182, 91–105. [Google Scholar] [CrossRef]
  141. Quevedo, D.I.; Francés, F. A conceptual dynamic vegetation-soil model for arid and semiarid zones. Hydrol. Earth Syst. Sci. 2008, 12, 1175–1187. [Google Scholar] [CrossRef] [Green Version]
  142. Gosling, S.N.; Arnell, N.W.; Lowe, J.A. The implications of climate policy for avoided impacts on water scarcity. Procedia Environ. Sci. 2011, 6, 112–121. [Google Scholar] [CrossRef] [Green Version]
  143. Visser, M.E.; Caro, S.P.; van Oers, K.; Schaper, S.V.; Helm, B. Phenology, seasonal timing and circannual rhythms: Towards a unified framework. Philos. Trans. R. Soc. Lond. B Biol. Sci. 2010, 365, 3113–3127. [Google Scholar] [CrossRef] [Green Version]
  144. Tague, C.L.; Band, L.E. RHESSys: Regional Hydro-Ecologic Simulation System—An Object-Oriented Approach to Spatially Distributed Modeling of Carbon, Water, and Nutrient Cycling. Earth Interact. 2004, 8, 1–42. [Google Scholar] [CrossRef]
  145. Krysanova, V.; Srinivasan, R. Assessment of climate and land use change impacts with SWAT. Reg. Environ. Chang. 2015, 15, 431–434. [Google Scholar] [CrossRef] [Green Version]
  146. Rigon, R.; Bertoldi, G.; Over, T.M. GEOtop: A distributed hydrological model with coupled water and energy budgets. J. Hydrometeorol. 2006, 7, 371–388. [Google Scholar] [CrossRef]
  147. Wolf, S.; Eugster, W.; Potvin, C.; Buchmann, N. Strong seasonal variations in net ecosystem CO2 exchange of a tropical pasture and afforestation in Panama. Agric. For. Meteorol. 2011, 151, 1139–1151. [Google Scholar] [CrossRef]
  148. Yu, L.; Zeng, Y.; Fatichi, S.; Su, Z. How vadose zone mass and energy transfer physics affects the ecohydrological dynamics of a Tibetan meadow? Cryosphere Discuss. 2020. [Google Scholar] [CrossRef]
  149. Conradt, T.; Wechsung, F.; Bronstert, A. Three perceptions of the evapotranspiration landscape: Comparing spatial patterns from a distributed hydrological model, remotely sensed surface temperatures, and sub-basin water balances. Hydrol. Earth Syst. Sci. Discuss 2013, 17, 2947–2966. [Google Scholar] [CrossRef] [Green Version]
  150. Immerzeel, W.W.; Droogers, P. Calibration of a distributed hydrological model based on satellite evapotranspiration. J. Hydrol. 2008, 349, 411–424. [Google Scholar] [CrossRef]
  151. Demirel, M.C.; Mai, J.; Mendiguren, G.; Koch, J.; Samaniego, L.; Stisen, S. Combining satellite data and appropriate objective functions for improved spatial pattern performance of a distributed hydrologic model. Hydrol. Earth Syst. Sci 2018, 22, 1299–1315. [Google Scholar] [CrossRef] [Green Version]
  152. Herman, M.R.; Nejadhashemi, A.P.; Abouali, M.; Hernandez-Suarez, J.S.; Daneshvar, F.; Zhang, Z.; Anderson, M.C.; Sadeghi, A.M.; Hain, C.R.; Sharifi, A. Evaluating the role of evapotranspiration remote sensing data in improving hydrological modeling predictability. J. Hydrol. 2018, 556, 39–49. [Google Scholar] [CrossRef]
  153. Rajib, A.; Evenson, G.R.; Golden, H.E.; Lane, C.R. Hydrologic model predictability improves with spatially explicit calibration using remotely sensed evapotranspiration and biophysical parameters. J. Hydrol. 2018, 567, 668–683. [Google Scholar] [CrossRef]
  154. Silvestro, F.; Gabellani, S.; Delogu, F.; Rudari, R.; Boni, G. Exploiting remote sensing land surface temperature in distributed hydrological modelling: The example of the Continuum model. Hydrol. Earth Syst. Sci. 2013, 17, 39–62. [Google Scholar] [CrossRef] [Green Version]
  155. Zink, M.; Mai, J.; Cuntz, M.; Samaniego, L. Conditioning a Hydrologic Model Using Patterns of Remotely Sensed Land Surface Temperature. Water Resour. Res. 2018, 54, 2976–2998. [Google Scholar] [CrossRef]
  156. Lo, M.H.; Famiglietti, J.S.; Yeh, P.J.F.; Syed, T.H. Improving parameter estimation and water table depth simulation in a land surface model using GRACE water storage and estimated base flow data. Water Resour. Res. 2010, 46. [Google Scholar] [CrossRef]
  157. Li, Y.; Grimaldi, S.; Pauwels, V.R.N.; Walker, J.P. Hydrologic model calibration using remotely sensed soil moisture and discharge measurements: The impact on predictions at gauged and ungauged locations. J. Hydrol. 2018, 557, 897–909. [Google Scholar] [CrossRef]
  158. Yang, H.; Xiong, L.; Ma, Q.; Xia, J.; Chen, J.; Xu, C.-Y. Utilizing Satellite Surface Soil Moisture Data in Calibrating a Distributed Hydrological Model Applied in Humid Regions Through a Multi-Objective Bayesian Hierarchical Framework. Remote Sens. 2019, 11, 1335. [Google Scholar] [CrossRef] [Green Version]
  159. Echeverría, C.; Ruiz-Pérez, G.; Puertes, C.; Samaniego, L.; Barrett, B.; Francés, F. Assessment of Remotely Sensed Near-Surface Soil Moisture for Distributed Eco-Hydrological Model Implementation. Water 2019, 11, 2613. [Google Scholar] [CrossRef] [Green Version]
  160. Morales, J.; Becht, R.; Munyao, J.N. Supporting sustainable water management in Lake Naivasha Basin, Kenya: A water information system tailored for users. GIM Int. 2015, 29, 26–29. [Google Scholar]
  161. Lv, S.; Zeng, Y.; Su, Z.; Wen, J. A Closed-Form Expression of Soil Temperature Sensing Depth at L-Band. IEEE Trans. Geosci. Remote Sens. 2019, 57, 4889–4897. [Google Scholar] [CrossRef]
  162. Lv, S.; Zeng, Y.; Wen, J.; Zhao, H.; Su, Z. Estimation of Penetration Depth from Soil Effective Temperature in Microwave Radiometry. Remote Sens. 2018, 10, 519. [Google Scholar] [CrossRef] [Green Version]
  163. Rogge, D.; Bauer, A.; Zeidler, J.; Mueller, A.; Esch, T.; Heiden, U. Building an exposed soil composite processor (SCMaP) for mapping spatial and temporal characteristics of soils with Landsat imagery (1984–2014). Remote Sens. Environ. 2018, 205, 1–17. [Google Scholar] [CrossRef] [Green Version]
  164. Dente, L.; Su, Z.; Wen, J. Validation of SMOS soil moisture products over the Maqu and Twente regions. Sensors 2012, 12, 9965–9986. [Google Scholar] [CrossRef]
  165. Dövényi, Z. Magyarország kistájainak katasztere (Inventory of Microregions in Hungary), 2nd ed.; MTA Földrajztudományi Kutatóintézet: Budapest, Hungary, 2010. [Google Scholar]
  166. Kisgyörgy Botond, G.; Tyson, J.M.S. Water quality management and legislation in Hungary — A river basin approach. Water Sci. Technol. 1999, 40. [Google Scholar] [CrossRef]
  167. Skierucha Wilczek, A.; Walczak, R.T.W. Recent software improvements in moisture (TDR method), matric pressure, electrical conductivity and temperature meters of porous media. Int. Agrophys. 2006, 20, 229–235. [Google Scholar]
  168. Pásztor Laborczi, A.; Takács, K.; Szatmári, G.; Bakacsi, Z.; Szabó, J.; Illés, G.L. DOSoReMI as the national implementation of GlobalSoilMap for the territory of Hungary. In Proceedings of the Global Soil Map 2017 Conference, Moscow, Russia, 4–6 July 2017; pp. 17–22. [Google Scholar]
  169. Szabó, B.; Szatmári, G.; Takács, K.; Laborczi, A.; Makó, A.; Rajkai, K.; Pásztor, L. Mapping soil hydraulic properties using random-forest-based pedotransfer functions and geostatistics. Hydrol. Earth Syst. Sci. 2019, 23, 2615–2635. [Google Scholar] [CrossRef] [Green Version]
  170. Santini, A.; Coppola, A.; Romano, N.; Terribile, F. Interpretation of the Spatial Variability of Soil Hydraulic Properties Using a Land System Analysis. Model. Transp. Process. Soils 1999, 1, 491–500. [Google Scholar]
  171. Romano, N.; Santini, A. Effectiveness of using pedo-transfer functions to quantify the spatial variability of soil water retention characteristics. J. Hydrol. 1997, 202, 137–157. [Google Scholar] [CrossRef]
  172. Romano, N.; Palladino, M. Prediction of soil water retention using soil physical data and terrain attributes. J. Hydrol. 2002, 265, 56–75. [Google Scholar] [CrossRef]
  173. Carriero, D.; Romano, N.; Fiorentino, M. A simplified approach for determining hydrologic behavior and depth of soils at basin scale. J. Agric. Eng. 2007, 38, 1. [Google Scholar] [CrossRef]
  174. Rubel, F.; Kottek, M. Observed and projected climate shifts 1901–2100 depicted by world maps of the Köppen-Geiger climate classification. Meteorol. Zeitschrift 2010, 19, 135–141. [Google Scholar] [CrossRef] [Green Version]
  175. Costantini, E.A.C.; Dazzi, C. The Soils of Italy; Springer: Dordrecht, The Netherlands, 2013; ISBN 978-94-007-5641-0. [Google Scholar]
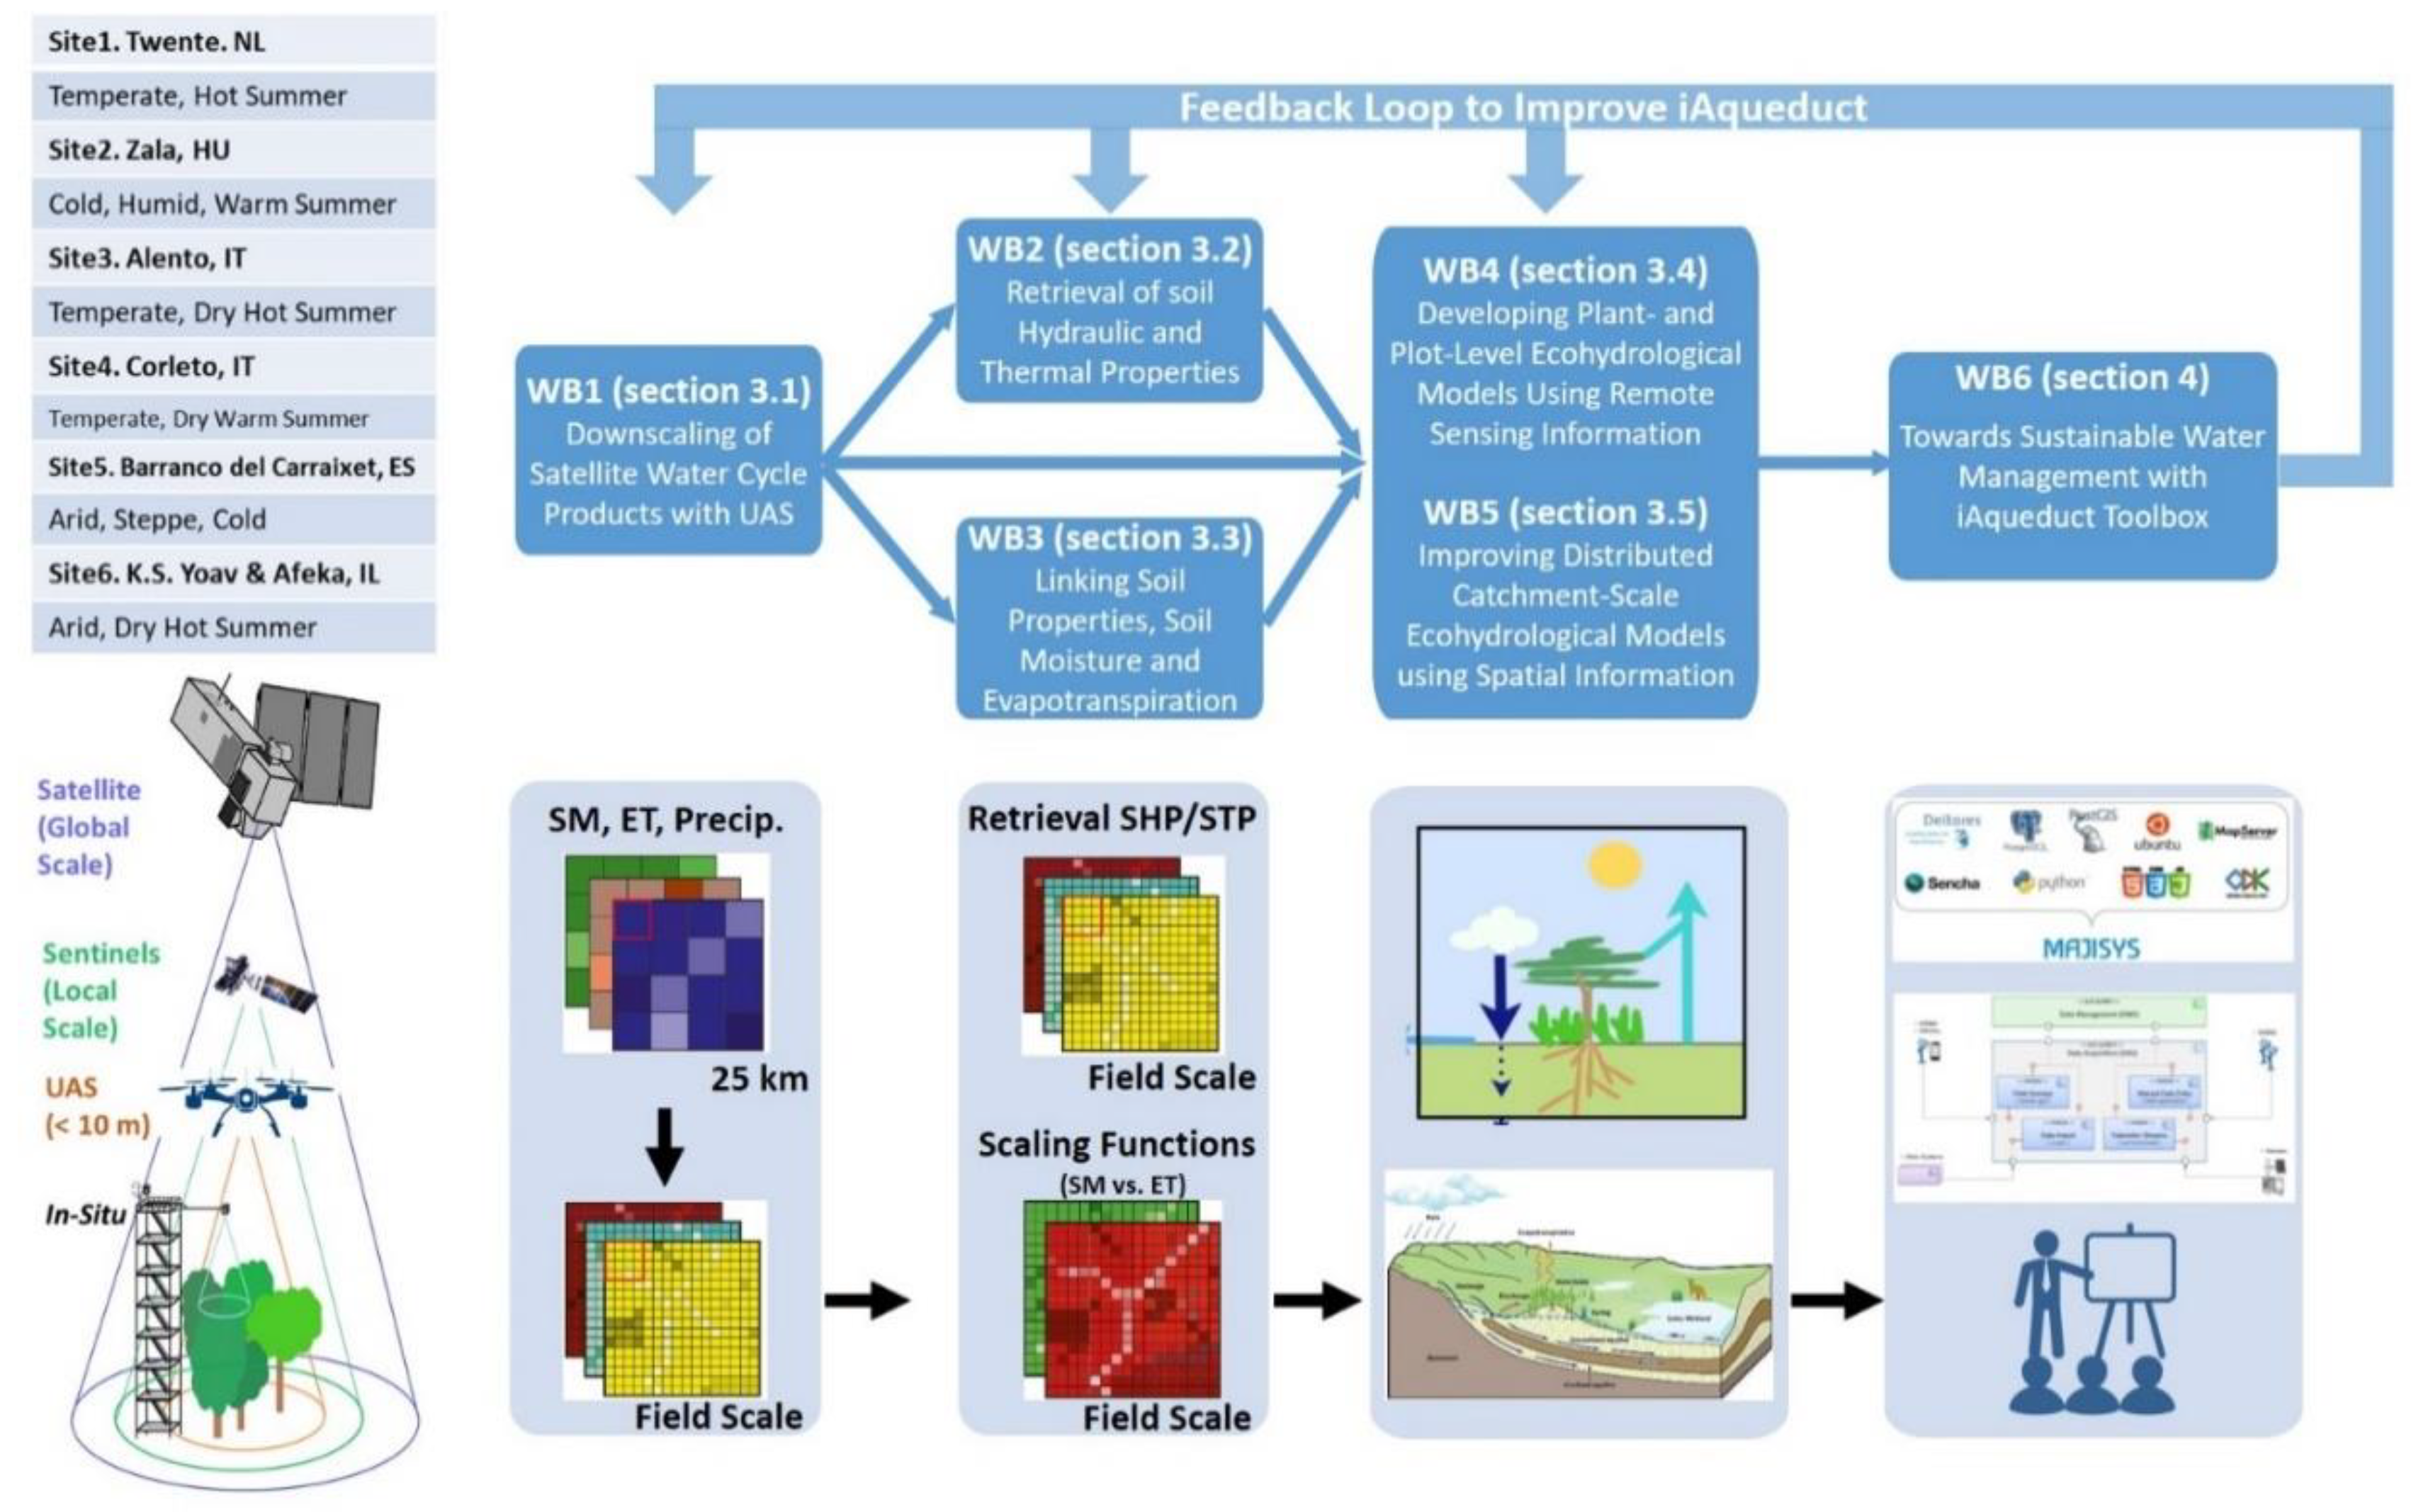
Figure 1. Theoretical framework of iAqueduct: the interconnected working blocks (WBs) and the corresponding sections, with the study sites listed.
Water 12 01495 g001
Figure 2. (a) Physical features influencing the spatial dynamic of soil moisture; (b) Identification of the temporal and spatial scales of different monitoring techniques.
Water 12 01495 g002
Figure 3. (a) Soil moisture downscaling workflow based on random forest regression (RF); (b) The importance of land surface features for the RF model; (c) RF-based downscaling of Sentinel-1 soil moisture products at 1 km to 15 cm, taking land surface features derived from UAS as predictors over the MFC2-Alento catchment. The UAS thermal image taken at sunrise 05:13 14 June 2019 was used to derive LST, the multispectral image taken 15:42, 13 June 2019 was used to derive NDVI; (d) the comparison of the downscaled soil moisture with in situ measurements.
Water 12 01495 g003
Figure 4. The example workflow for deriving root zone soil moisture (RZSM) from surface soil moisture (SSM), which results in ~10-year consistent surface and root zone soil moisture over Tibetan Plateau (adopted from [71]).
Water 12 01495 g004
Figure 5. The main physical processes in the STEMMUS-SCOPE continuum model, integrating radiative transfer, vegetation photosynthesis, energy balance, root system dynamic, and soil moisture and soil temperature dynamic. The coupled model integrates vegetation photosynthesis and transfer of energy, mass, and momentum in the soil–vegetation system, via a simplified 1-D root growth model and a resistance scheme (from soil, through root zones and plants, to atmosphere) [80].
Water 12 01495 g005
Figure 6. The undisturbed and disturbed soil surfaces at Afeka site, Israel [82].
Water 12 01495 g006
Figure 7. The results of the PLSR model of the field-based dataset (a) and the lab-based dataset (b) using the 450–2400 nm spectral range; (c) histogram of the measured infiltration rate values at different study areas.
Water 12 01495 g007
Figure 8. Map of the MFC2-Alento catchment. Red crosses indicate the locations of SoilNet sensors installed at soil depths of 15 and 30 cm. The positions of the SoilNet sensors correspond to soil sampling locations. The RGB-VIS coverage area is 18 ha, and the thermal and hyperspectral coverage area is 7.5 ha.
Water 12 01495 g008
Figure 9. (a) a RGB image taken on 13 June 2019, 12:23, MFC2-Alento; (b) a multispectral image (Band1 NIR (Near Infrared), Band2 Red, Band3 Green) taken on 13 June 2019 at 15:42, MFC2-Alento; (c) a hyperspectral image in RGB colors with the hyperspectral data cube and mean spectral curves of forest, grass, and soil features taken on 15 June 2019, between 9:50 and 10:30, MFC2-Alento; (d) the workflow on the combined use of different sources of data to produce soil texture information and corresponding soil hydro-thermal properties. (EU-STF-LUCAS -spectrotransfer functions derived based on the European Spectral Soil Library [93]; 3D EU-SoilHydroGrids – Soil Hydraulic Database of Europe at 250 m [91], EU-PTF - EU-HYDI – pedotransfer functions derived based on the European Hydropedological Data Inventory [96].
Water 12 01495 g009
Figure 10. (a) Koeppen–Geiger climate classifications across the WaPOR domain of the Africa and the Middle-East; (b) Mean Actual Evapotranspiration (AET) versus root zone relative soil moisture (i.e., saturation degree) stratified by the Koeppen–Geiger climate classifications.
Water 12 01495 g010
Figure 11. An example of global evapotranspiration derived from the MODIS satellite data in combination with global meteorological information using the SEBS model [27].
Water 12 01495 g011
Table 1. Essential variables/parameters measured in iAqueduct observatories.
Variables/ParametersTargeted ResearchIn Situ 1UAS 2Airborne 3Satellite Missions 4
PrecipitationDownscalingX X
Air Temperature X
Air Pressure X
Humidity X
Wind speed/direction X
Four-component (and Net) Radiation X X 5
Soil Heat Flux X
Evaporation/transpirationDownscaling X
Runoff XX
Stream Flow X
Groundwater level X
Soil Properties (texture, hydraulic, thermal, etc.)RetrievalXXXX
Soil Moisture (surface, profile)DownscalingXX X
Soil Temperature (surface, profile) XXXX
Soil Freeze-Thaw (surface, profile) XXXX
Snow Depth XXXX
Snow Water Equivalent X
Land Cover Types XX X
Vegetation Coverage XXXX
Plantation Structure XX
Leaf Area Index XX X
Vegetation Structure Parameters (density, canopy height, crown diameter, etc.) XX X
Biomass (NPP and NEE) XXXX
DEM X X
Laser altimetry X X
Reflectance (optical range)Energy balance and vegetation dynamicsXXXX
Fluorescence (optical range) X X
Emittance (thermal range)Energy balance and temperature downscalingXXXX
Brightness temperature (microwave range)Soil moisture downscaling XX
Backscattering coefficient (microwave range)Soil moisture downscaling X
1 In Situ spatial resolution: 1 cm to 5 cm; temporal resolution: seconds to minutes, hours, and days. 2 UAS spatial resolution: 5 cm to 15 cm; temporal resolution: hours to days. 3 Airborne spatial resolution: 15 cm–10 m; temporal resolution: hours to days. 4 Satellite spatial resolution: 10 m–25 km; temporal resolution: days to weeks.5 Only Albedo, Land Surface Temperature.
Table 2. Spectral information acquired by spectrometer and UAS platform for the MFC2-Alento Catchment.
Acquired Spectral DataState of Soil SampleExtension of SurveyEquipment Used for the SurveyDate of Survey
1234
soil reflectance in the 450–1000 and 450–2400 nm range xx 20 points, close to the SoilNET probesASD Spectrometer with SoilPRO13 June 2019
soil reflectance in the 450–1000 and 450–2400 nm rangex x 20 points, close to the SoilNET probesASD Spectrometer, Laboratory3–4 October 2018
13 June 2019
soil reflectance in the 450–950 nm range, 125 channels xx 7.5 ha of study siteCubert UHD-185 hyperspectral snapshot camera on UAS platform with a spatial resolution of 5 cm15 June 2019
soil reflectance in the 450–2400 nm spectral rangex x20 points, close to the SoilNET probesSoilPRO in situ measurement & spectral analysis in laboratory 4 October 2018,
13 June 2019
soil reflectance in the 7.5–13.5 µm range xx 7.5 ha of study siteFLIR Tau 336 thermal camera on UAS platform with a spatial resolution of 15 cm3–4 October 2018,
13–14 June 2019
RGB in VIS range xx 18 ha of sub-catchment Fuji X-T20 snapshot camera on UAS platform13 June 2019
Notes: state of soil samples - 1-Disturbed; 2-Undisturbed; 3-Actual moisture content; 4-Dry.