Article

Long-Term Consequences of Water Pumping on the Ecosystem Functioning of Lake Sekšu, Latvia

1
Institute of Geography and Spatial Organisation, Polish Academy of Sciences, Twarda 51/55, PL-00818 Warsaw, Poland
2
Latvian Institute of Aquatic Ecology, Agency of Daugavpils University, Voleru 4, LV-1007 Riga, Latvia
3
Norwegian Institute for Nature Research, Gaustadalléen 21, NO-0349 Oslo, Norway
4
Faculty of Biological and Environmental Sciences, Ecosystems and Environment Research Programme, University of Helsinki, Niemenkatu 73, FI-15140 Lahti, Finland
5
Institute of Geoecology and Geoinformation, Adam Mickiewicz University, Bogumiła Krygowskiego 10, PL-61680 Poznań, Poland
6
Faculty of Biological and Environmental Sciences, Aquatic Biogeochemistry Research Unit, Ecosystems and Environment Research Program, University of Helsinki, P.O. Box 65, FI-00014 Helsinki, Finland
7
Department of Geography, University of Latvia, Jelgavas 1, LV-1004 Riga, Latvia
8
Department of Geology, Tallinn University of Technology, Ehitajate tee 5, EST-19086 Tallinn, Estonia
9
Lake and Peatland Research Centre, LV-4063 Puikule, Aloja, Latvia
10
Faculty of Oceanography and Geography, University of Gdańsk, Bażyńskiego 4, PL-80309 Gdańsk, Poland
11
Faculty of Biology, University of Latvia, Jelgavas 1, LV-1004 Riga, Latvia
12
Department of Geology, University of Latvia, Jelgavas 1, LV-1004 Riga, Latvia
*
Author to whom correspondence should be addressed.
Water 2020, 12(5), 1459; https://doi.org/10.3390/w12051459
Submission received: 4 April 2020 / Revised: 14 May 2020 / Accepted: 16 May 2020 / Published: 20 May 2020
(This article belongs to the Special Issue Water Quality of Freshwater Ecosystems in a Temperate Climate)

Abstract

:
Cultural eutrophication, the process by which pollution due to human activity speeds up natural eutrophication, is a widespread and consequential issue. Here, we present the 85-year history of a small, initially LobeliaIsoëtes dominated lake. The lake’s ecological deterioration was intensified by water pumping station activities when it received replenishment water for more than 10 years from a eutrophic lake through a pipe. In this study, we performed a paleolimnological assessment to determine how the lake’s ecosystem functioning changed over time. A multi-proxy (pollen, Cladocera, diatoms, and Chironomidae) approach was applied alongside a quantitative reconstruction of total phosphorus using diatom and hypolimnetic dissolved oxygen with chironomid-based transfer functions. The results of the biotic proxy were supplemented with a geochemical analysis. The results demonstrated significant changes in the lake community’s structure, its sediment composition, and its redox conditions due to increased eutrophication, water level fluctuations, and erosion. The additional nutrient load, particularly phosphorus, increased the abundance of planktonic eutrophic–hypereutrophic diatoms, the lake water’s transparency decreased, and hypolimnetic anoxia occurred. Cladocera, Chironomidae, and diatoms species indicated a community shift towards eutrophy, while the low trophy species were suppressed or disappeared.

1. Introduction

Eutrophication strongly influences the functioning of freshwater ecosystems by changing their water qualities, such as oxygen availability, light conditions, and increasing the production of algae, which results in a reduction of the water’s self-purification capacity. The process of nutrient enrichment of water bodies is a part of a lake’s natural lifecycle. However, the introduction of sewage water, fertilizer, and detergent to lake systems greatly accelerates eutrophication and results in significantly increased biological productivity. Therefore, cultural eutrophication continues to be ranked as the most common water-quality problem in the world [1,2,3,4,5].
Not only intensified cultivation and clear-cut logging, but also activities such as artificial water replenishment into lakes, can strongly affect lake ecosystems. There are several reasons for taking such actions, such as increasing the flow of water into lakes for restoration (particularly relevant in arid regions due to intense evaporation), in connection to the hydropower industry [6,7], or increasing the groundwater level to secure the operations of water pumping stations. Such activities can cause significant environmental issues since the physical, chemical, and biological characteristics of the lake can be changed.
Water was artificially replenished to increase the water level in Lake Sekšu, located in the vicinity of Riga city (Latvia, Baltic Region, Northern Europe). This lake is a part of the drinking water supply system and enriches the groundwater horizons near the “Baltezers” drinking water pumping station. The pumping station “Baltezers” began to operate in 1904 as an extension to the pre-existing water supply system meant to solve the problem of water shortages in the Riga city. In addition to the existing drinking water source (the river Daugava), the new water pumping station was designed to use groundwater. However, alongside the construction of residential and public buildings, the area’s population and industrial activity increased rapidly after World War I. The size of the water supply network developed proportional to urban growth, but during World War II, the water supply system was seriously damaged. However, by 1948, the pre-war level of industrial activity was again reached [8]. In the late 1950s, the suburbs of Riga were developed for housing purposes. Natural biotopes in the vicinity of the city were replaced by dense residential areas and small kitchen gardens [9]. The consumption of water continued to increase, and in 1953, an artificial groundwater recharge system went into operation. Between 1953 and 1965, the water supply from an adjacent eutrophic lake to Lake Sekšu was established through a pipe and ditch [10].
In this study, we hypothesized that even the relatively short-term pumping of water from the nearby eutrophic lake could have changed the trophic conditions in Lake Sekšu and could have led to persistent shifts in the lake’s ecosystem functioning. We analyzed sediment core representing the time period ~1935–2018 to investigate how water replenishment affected the lake’s ecosystem functioning and to determine if the lake system showed recovery after the water replenishment activities were terminated. We applied a multi-proxy approach and developed a quantitative reconstruction of the total amount of phosphorus using diatoms and hypolimnetic dissolved oxygen with chironomid-based transfer functions along with the indicative properties of Cladocera. The plant succession in the lake and catchment was reconstructed using pollen analysis. The results were supplemented with a geochemical analysis, which helped to detect changes in the relative supply of organic and inorganic sediment material, as well as variability in the organic matter sources. The geochemical analysis also provided further evidence of changes in the lake’s trophic state.

2. Materials and Methods

2.1. Study Site

Lake Sekšu (57°03′ N, 24°35′ E, Figure 1) is a small (surface area 7.9 ha), shallow (the average and maximum depth is 2.5 m and 6 m, respectively) lake at an elevation of 2.5 m a.s.l., located in the vicinity of the capital city of Riga, central Latvia, Northern Europe [11,12]. The average annual air temperature (1981–2010) in areas close to the Baltic Sea coast is +6.8 to +7.4 °C. July is the warmest month of the year, with an average air temperature +17.4 °C (average maximum +22.3 °C). The coldest month of the year is February, with an average air temperature of −3.7 °C. The annual rainfall is 692 mm. According to the data on climate change, the air temperature and precipitation in the area are increasing [13].
The lake is mostly surrounded by inland dune forest and dominated by pine growing on sandy soil. The southern part of the lake is dominated by birches growing on organic soils [14]. The lake has no runoff apart from a small, shallow ditch that transports humic substances to the lake. In this area, there is also a peat soil-based, meliorated forest [9,13].
According to the EU Water Framework Directive criteria (total phosphorus, Secchi depth, and chlorophyll a), the lake’s current ecological status is good. The latest macrozoobenthos studies confirmed the lake’s high biodiversity. Following Carlson’s trophic state index, in terms of water transparency (SD), Lake Sekšu is a mesotrophic lake, while its chlorophyll a concentration (CA) indicates a eutrophic lake status. The average value of the indices corresponds to a eutrophic lake. Nevertheless, the lake still features low eutrophication. The main problem for such lakes is a loss of transparency [15].

2.2. Materials and Methods

2.2.1. Lake Sediment Coring

A 46 cm sediment core from the deepest part of Lake Sekšu was taken on 13th February 2019 using a Kayak/HTH gravity-type corer. The sediment core was divided in the field into 1 cm sections and stored in a cold room. In the laboratory, 1 cm3 subsamples of fresh sediment from each section were taken for analysis of the biological (Cladocera, Chironomidae, diatoms, pollen) and spheroidal carbonaceous particles (SCPs). Dried material was used for 137Cs/210Pb dating, as well as chemical and physical analysis.

2.2.2. Core Chronology

A sediment core from Lake Sekšu was dated with 137Cs and 210Pb at the Geochronology Laboratory at the Gdańsk University according to the standard procedure [16]. The activity of 137Cs and 226Ra was determined directly by gamma-ray spectrometry. Gamma measurements were carried out using a HPGe well-type detector (GCW 2021, Canberra) coupled to a multi-channel analyzer and shielded by a 15 cm thick layer of lead. Counting efficiency was determined using reference materials (CBSS-2 for 137Cs at 661.6 keV, and RGU-1 for 226Ra via 214Pb at 352 keV) with the same measurement geometry as the samples. The counting time for each sediment sample was 24 h.
The activity of total 210Pb was determined indirectly by measuring 210Po using alpha spectrometry. Dry and homogenized sediment samples of 0.2 g were transferred into Teflon containers, spiked with a 209Po yield tracer, and digested with concentrated HNO3, HClO4, and HF at a temperature of 100 °C using a CEM Mars 6 microwave digestion system. After 24 h, the solution was transferred into a Teflon beaker, evaporated with 6 M HCl to dryness, and then dissolved in 0.5 M HCl. Polonium isotopes were spontaneously deposited within 4 h on silver discs. After deposition, the discs were analyzed for 210Po and 209Po using a 7200-04 APEX Alpha Analyst integrated alpha-spectroscopy system (Canberra) equipped with PIPS A450-18AM detectors. The samples were counted for 24 h. A certified mixed alpha source (234U, 238U, 239Pu, and 241Am; SRS 73833-121, Analytics, Atlanta, Georgia, USA) was used to check the detector counting efficiencies, which varied from 30.9% to 33.9% for the applied geometry.
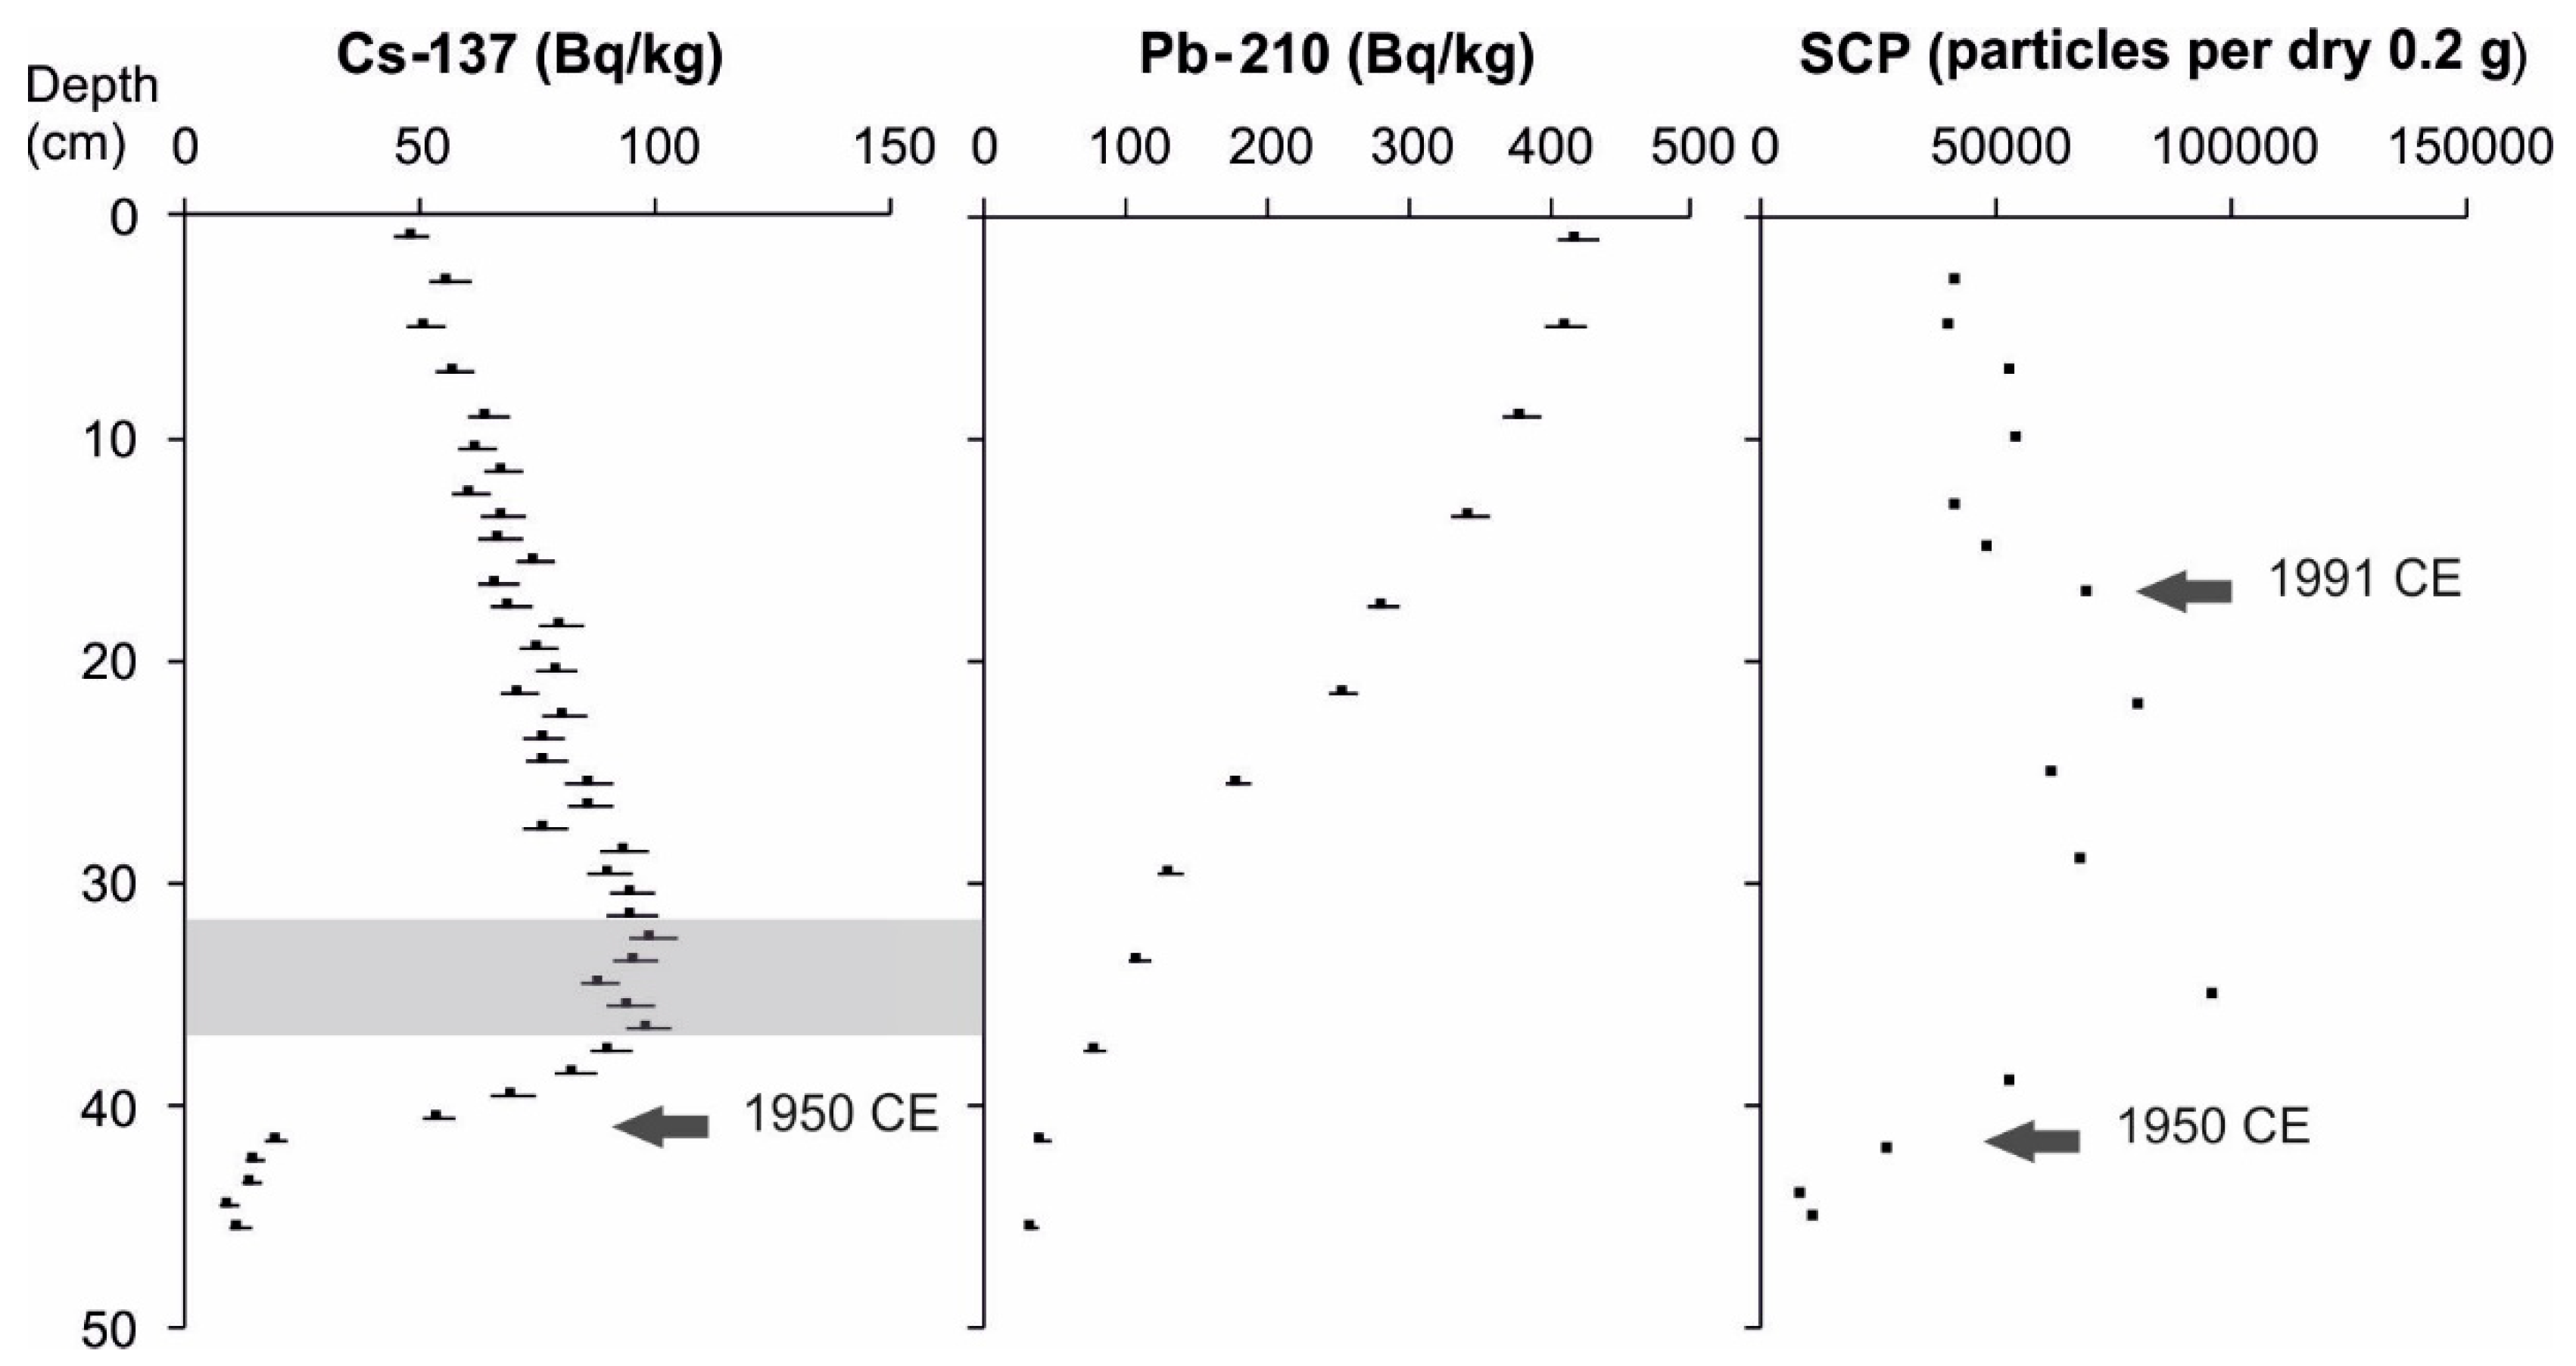
In addition, an abundance of spheroidal carbonaceous particles (SCPs) was estimated throughout the sediment sequence following the methodology of Rose [17] and Alliksaar [18]. The analysis was performed in the Department of Geography, University of Latvia. According to the black carbon combustion continuum model of Hedges et al. [19] and Masiello [20], SCPs only form during industrial fuel combustion at high temperatures (greater than 1000 °C). Therefore, the peak followed the fuel combustion pattern: 1950—the rise of SCPs, 1982—the peak of SCPs, and 1991—the decrease of SCPs. The peak SCP emissions were previously established for Latvia at 1982 ± 10 years [21].
In the final step, we combined the results from the radionuclides and the SCP analyses to build an age-depth model using the Clam 2.2 deposition model [22] with a 95.4% confidence level in the R environment [23].

2.2.3. Physical and Chemical Sediment Analyses

Sediment geochemical characteristics were determined using loss on ignition (LOI) combustion analysis and inductively coupled plasma-optical emission spectrometry (ICP-OES). Altogether, 45 subsamples at 1 cm intervals were analyzed, but only the topmost two sediment samples were merged into one sample representing depths from 0 to 2 cm. The sediment organic matter and carbonate content were investigated using the LOI method [24]. A measure of 0.1–0.2 g of fresh sub-sample sediment was weighed in a crucible and dried at 105 °C for 12 h; then, it was combusted at 550 °C for 4 h and, finally, at 950 °C for 2 h. Between each step, the samples were cooled with an exicator and weighed. The organic matter (OM) content was measured as the LOI from the combusted samples at 550 °C, and the carbonate matter (CM) was calculated as the difference between the LOI at 950 °C and the LOI at 550 °C multiplied by 1.36 [24]. Non-carbonate siliciclastic matter, here referred to as minerogenic matter (MM) content, was obtained by subtracting OM and CM from the total sample weight after final combustion. MM also includes biogenic silica (opal). However, siliciclastic matter here mainly represents terrigenous clastic matter.
A set of homogenized sub-samples was freeze dried and powdered using an agate mortar. The total carbon (TC) and total nitrogen (TN) contents were analyzed using thermal combustion elemental analyses (Element Analyzer Vario EL III) with an uncertainty of ±5%. Approximately 7–8 mg of prepared material was weighed into tin cups for analyses that were performed at an accredited laboratory (ISO/IEC/17025).
For the ICP-OES analyses, 0.1–0.2 g of dry sediment powder was weighed in Teflon vials, and 5 mL of 65% HNO3 was added. The vials were closed loosely, and digestion was carried out at 160 °C for 30 min. Gases and volatiles from the digestion were allowed to escape through the cap. Following digestion, 10 mL H2O was added to dilute the remaining acid, and the vials were weighed to determine the dilution factor. A measure of 1 mL of the resulting solution was then pipetted into 15 mL centrifuge tubes, and 9 mL 0.5 mol/l HNO3 was added. These steps were performed to give the samples a final acid concentration of approximately 1 mol/l HNO3 and to have the element concentrations in a suitable range for the ICP-OES analysis. The sulfur (S) concentration was determined by ICP-OES (Thermo Scientific iCAP 6000) using a concentric nebulizer. Certified control samples and blank samples were used to ensure the quality of the analytical process.

2.2.4. Pollen and Non-Pollen Palynomorphs

Samples of known volume for the pollen analysis were processed using standard procedures [25]. Known quantities of Lycopodium spores were added to each sample to allow the calculation of pollen concentrations [26]. At least 500 terrestrial pollen grains per sample were counted under a light microscope (400× magnification). Taxa were identified to the lowest possible taxonomic level using the reference collection at the Department of Geography at the University of Latvia along with published pollen keys [27]. The percentage of dry-land taxa was estimated using arboreal and non-arboreal pollen sums (excluding the sporomorphs of aquatic and wetland plants). Counts of spores were calculated as the percentages of the total sum of terrestrial pollen. Non-pollen palynomorphs were recorded throughout the pollen analysis and identified using the published literature listed in Miola [28], as well as from the descriptions of Sweeney [29] and Finsinger and Tinner [30]. Non-pollen palynomorphs were expressed as presence or concentrations. The pollen diagram was compiled using TILIA software [31].

2.2.5. Diatom Analysis

Samples were prepared according to the standard methods [32]. The material was treated with 10% HCl to remove calcareous matter, washed with distilled water, and then treated with 30% H2O2 in a water bath to remove organic matter. The material was repeatedly washed with distilled water, and a known number of microspheres in a solution (concentration 8.02 × 10⁶ microspheres/cm3) was added to the diatom suspensions to estimate the diatom concentrations [33]. A few drops of diatom suspension were dried on a cover glass. At least 300 diatom valves per sample were analyzed using oil immersion at 1000× magnification under a light microscope. For identification, a selection of published keys was used [34,35,36,37,38,39,40,41].
The diatom ecological groups were determined using the OMNIDIA software (Version 4.2) [42]. Next, the resulting groups were distinguished according to Denys [43] and van Dam [44]. We considered the following indicator parameters: habitat category [43], dominant taxa (abundance over 2%) and preference for pH, saprobic level (OM contamination), and trophy [44]. The percentage diatom diagram was prepared with the Tilia software [31].
The total phosphorus (TP) concentration was reconstructed based on changes in the diatom species composition (DI-TP). The reconstruction was performed using the European Diatom Database (EDDI) in the ERNIE software [45]. A model based on inverse regression had a root mean square error of prediction (RMSEP) of 0.33 μg L−1 and a coefficient of determination (r2) of 0.64. The reconstruction of the TP was based on the diatom taxa present at more than 2% abundance. The DI-TP was calculated using the combined TP dataset (derived from nine datasets with 347 samples in total), covering a TP range of 2–1189 μg L−1, with a mean of 98.6 μg L−1. The weighted averaging (WA) method with good empirical predictive ability was used [45].

2.2.6. Cladocera Analysis

The 46 fresh sediment samples were prepared in a laboratory according to the standard procedures [46], heated in 10% KOH, and sieved using a 38 µm mesh size. Microscope slides were prepared from 0.1 mL of each sample and examined with a light microscope under magnifications of ×100, ×200, and ×400. For each sample, 1–3 slides were scanned, and all skeletal elements (head shields, shells, and postabdomens) were counted until 70–100 individuals were found, which is regarded as an adequate number to characterize the assemblages [47]. Identification of the cladoceran remains was based on the key by Szeroczyńska and Sarmaja-Korjonen [46]. The stratigraphic diagrams presenting the results were prepared using C2 freeware [48].
The Cladocera composition is presented in the stratigraphic diagrams with percentage values. For trophic state reconstruction, we used changes in the percentage of species regarded as indicators for the eutrophic state, which, according to Flössner [49], are Alona rectangula and Chydorus cf. sphaericus. Lake water level changes were reconstructed by using the added percentage values of planktonic and littoral cladocerans.

2.2.7. Chironomidae Analysis

Standard methods were applied in the fossil Chironomidae analysis [50]. The wet sediment was sieved through mesh (100 μm), and the residue was examined under a stereomicroscope for larval head capsule extraction using a target counting sum of 50 per sample. The head capsules were mounted with Euparal on microscope slides for taxonomic identification following Brooks et al. [50] under a light microscope (400× magnification).
Hypolimnetic dissolved oxygen (DO) was reconstructed using a Finnish 30-lake chironomid-based calibration model [51,52]. The calibration sites range from anoxic (O2 = 0.5 mg L−1) to hypersaturated sites (O2 = 18.1 mg L−1). The weighted averaging partial least squares (WA-PLS) model had an r2 (leave-one-out cross-validation) of 0.74 and an RMSE P of 2.3 mg L−1.

3. Results

3.1. Core Chronology

The depth profile of 137Cs activity is long and smooth, with only one wide maximum between a 28 and 38 cm sediment depth (Figure 2). The sharp decrease below 41 cm indicates the presence of sediments older than 1950 below this depth. The lack of two independent peaks indicating global fallout during 1961–1965 and the Chernobyl peak in 1986 might suggest the deep mixing of surface sediments.
However, the excess 210Pb activities decrease regularly with mass depth, which demonstrates no significant disturbance of the sediment column and relatively stable mass accumulation rates. Thus, we used the CFCS (Constant Flux Constant Sedimentation) model to calculate the mean value of the mass accumulation rate (MAR) for the entire core. The mean MAR value is 34.5 ± 2.2 mg/cm2/yr and allows us to estimate a maximum age of 84 ± 5 yrs (1935 ± 5) at a 45.5 cm sediment depth. The age of the depth interval with the greatest 137Cs activities (37–32 cm) is 1956–1965 according to the CFCS model, which is consistent with global fallout history. This comparison suggests that the lack of a Chernobyl peak is related to 137Cs migration within the sediment column rather than physical sediment mixing.
Based on the SCP results, it was possible to define the years 1950 and 1991 with an error of +/− 10 years at depths 42 and 17 cm, respectively. The locations of these peaks are, with relative certainty, consistent with the 137Cs and 210Pb data.
The final age-depth model, including the radionuclide and SCP data, shows relatively stable sedimentation rates with only a moderate increase in the topmost part of the profile (Figure 3). The maximum age of sediment at a depth of 46 cm is 84 ± 9 yrs (95%). The mean sedimentation rate is 0.6 cm per year.

3.2. Sediment Composition

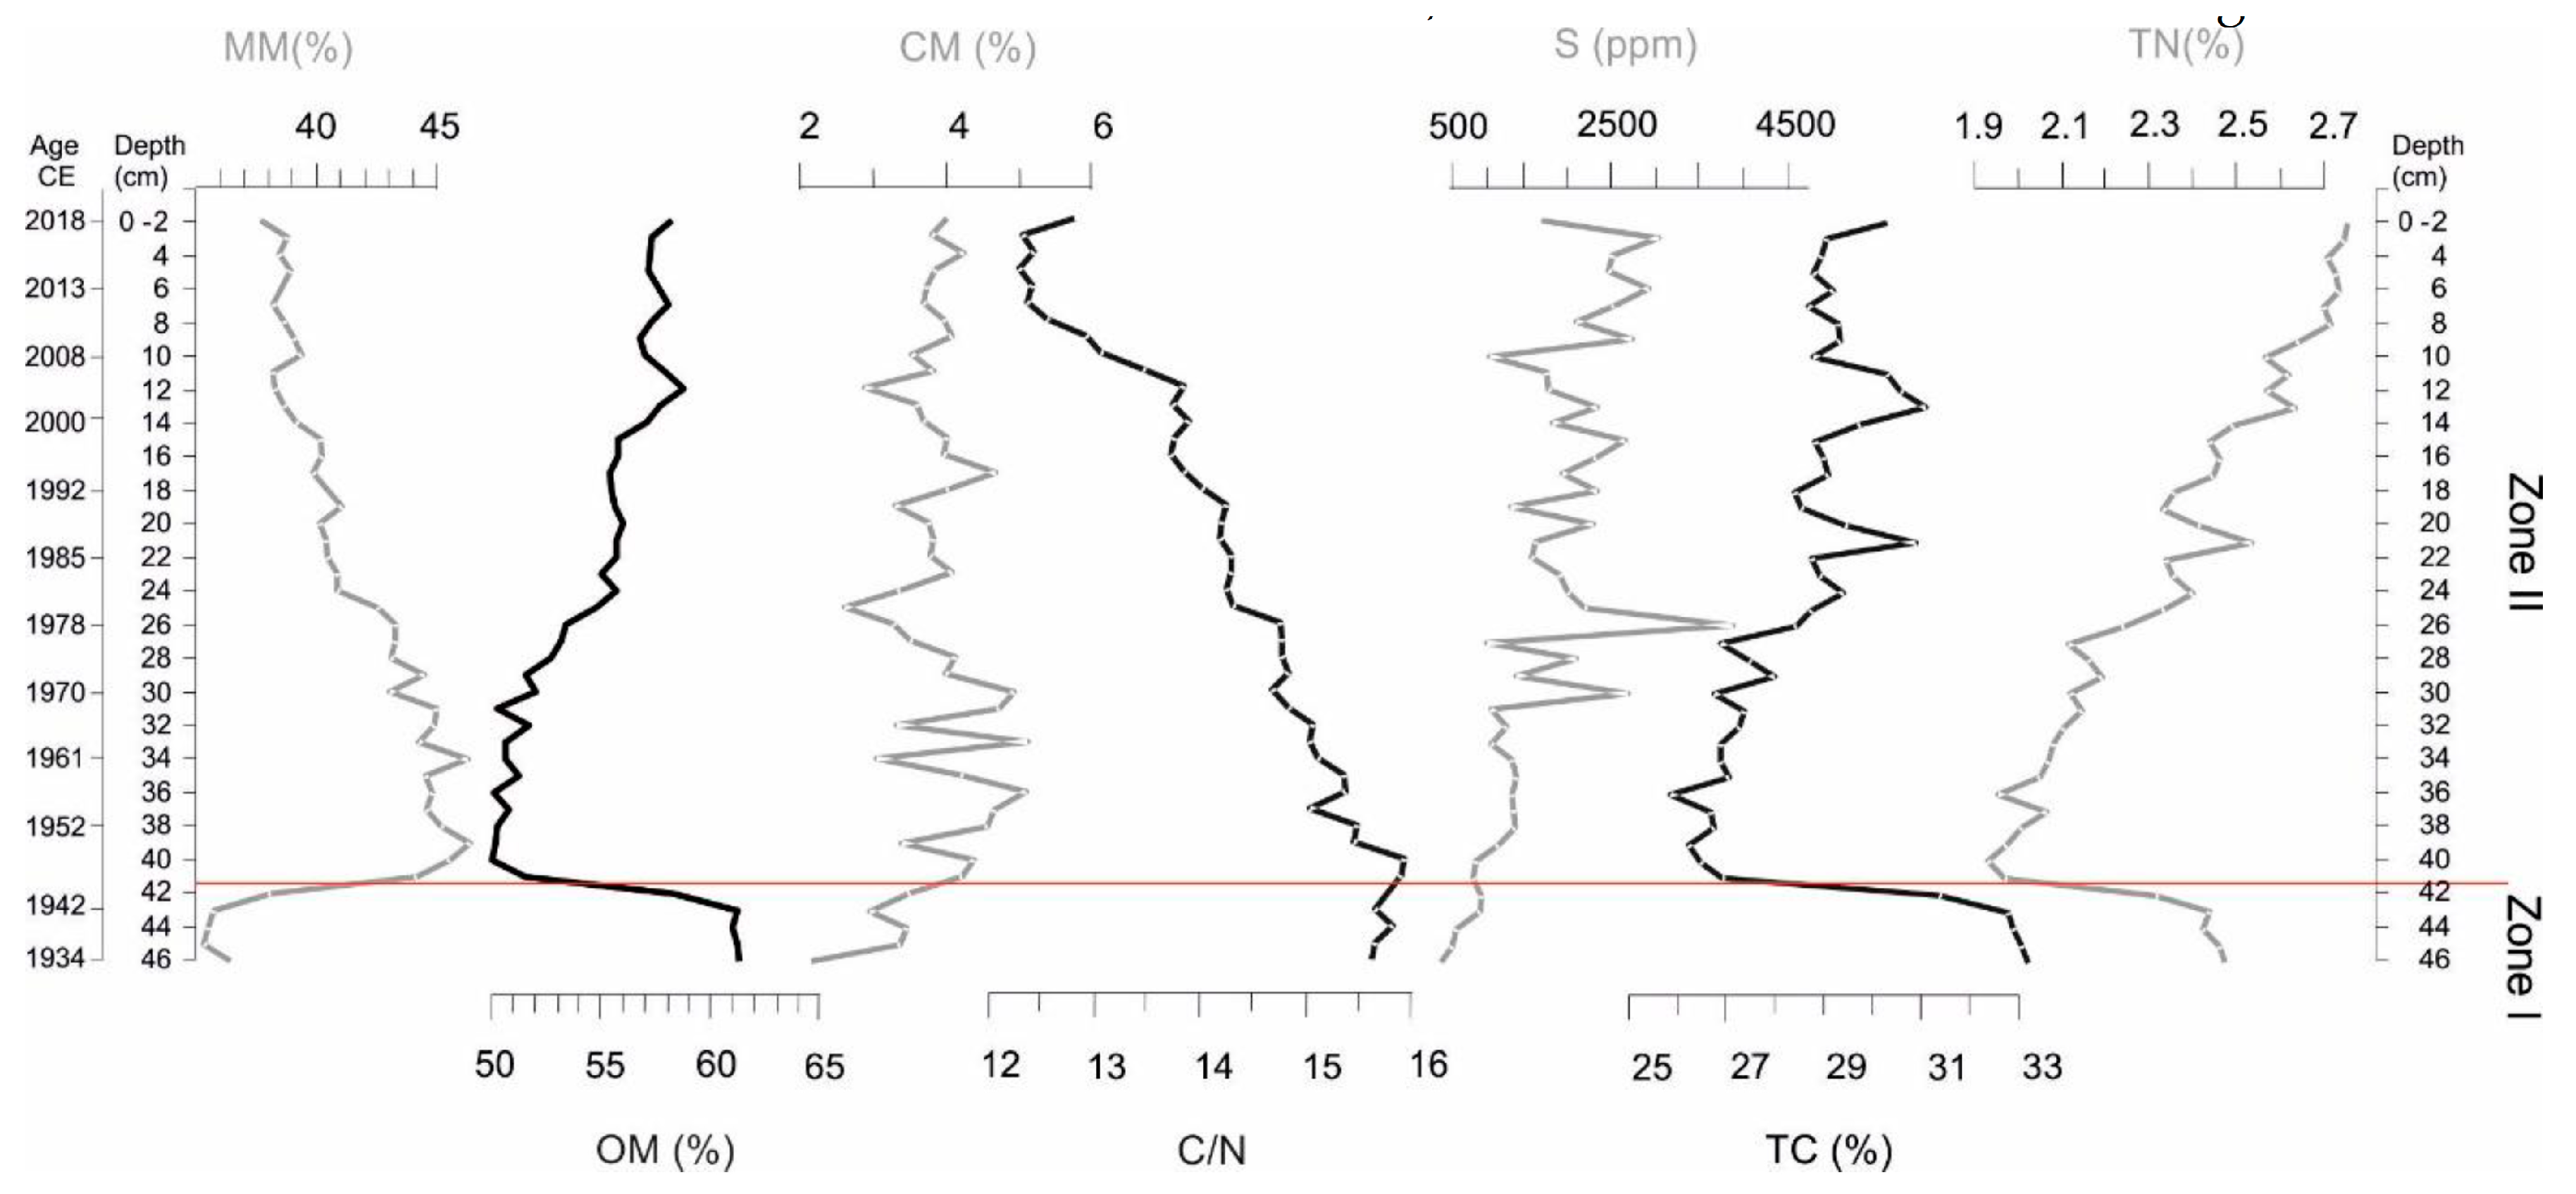
The Lake Sekšu sediment composition is dominated by organic matter (50%–61%) with a significant component of minerogenic matter (35%–46%, Figure 4). The sediments contain 2%–5% carbonate matter. Based on sediment composition and the variation in element concentrations, the sedimentary data are divided into two zones, Zones I and II, which correspond to the approximate time period before 1950 and between 1950 and 2018. Within Zone II, short-lived events can be distinguished.
Zone I
The relative organic matter (OM), total carbon (TC), and total nitrogen (TN) content show high values in this time period (Figure 4). The OM is around 61%, while TC is around 32%, and TN is around 2.5%. The C/N value, expressed as the atomic ratio, is around 15.7. The sulfur (S) content is approximately 500 ppm. The relative minerogenic matter (MM) (36%) displays the lowest values, while approximately 3.5% is carbonate matter (CM).
Zone II
At the boundaries of Zone I and Zone II, a large change occurs. The OM content shows a sudden drop from 61% to 51% accompanied by a fall in TC and TN content from 33% to 27% and from 2.45% to 1.95%, respectively. Simultaneously, the MM content increases from 36% to 45%. After this rapid change, a steady gradient emerges from 41 cm to the sediment surface, during which MM, OM, and TC gradually reset towards their Zone I value. However, TN increases over the same period to values far exceeding those of Zone I (approximately 2.8% at the sediment surface, Figure 4). Consequently, C/N displays a continuous gradient towards lower values throughout the entire core. Similarly, S content increases gradually throughout the entire core, with some pronounced variability within Zone II.

3.3. Pollen and Non-Pollen Palynomorphs

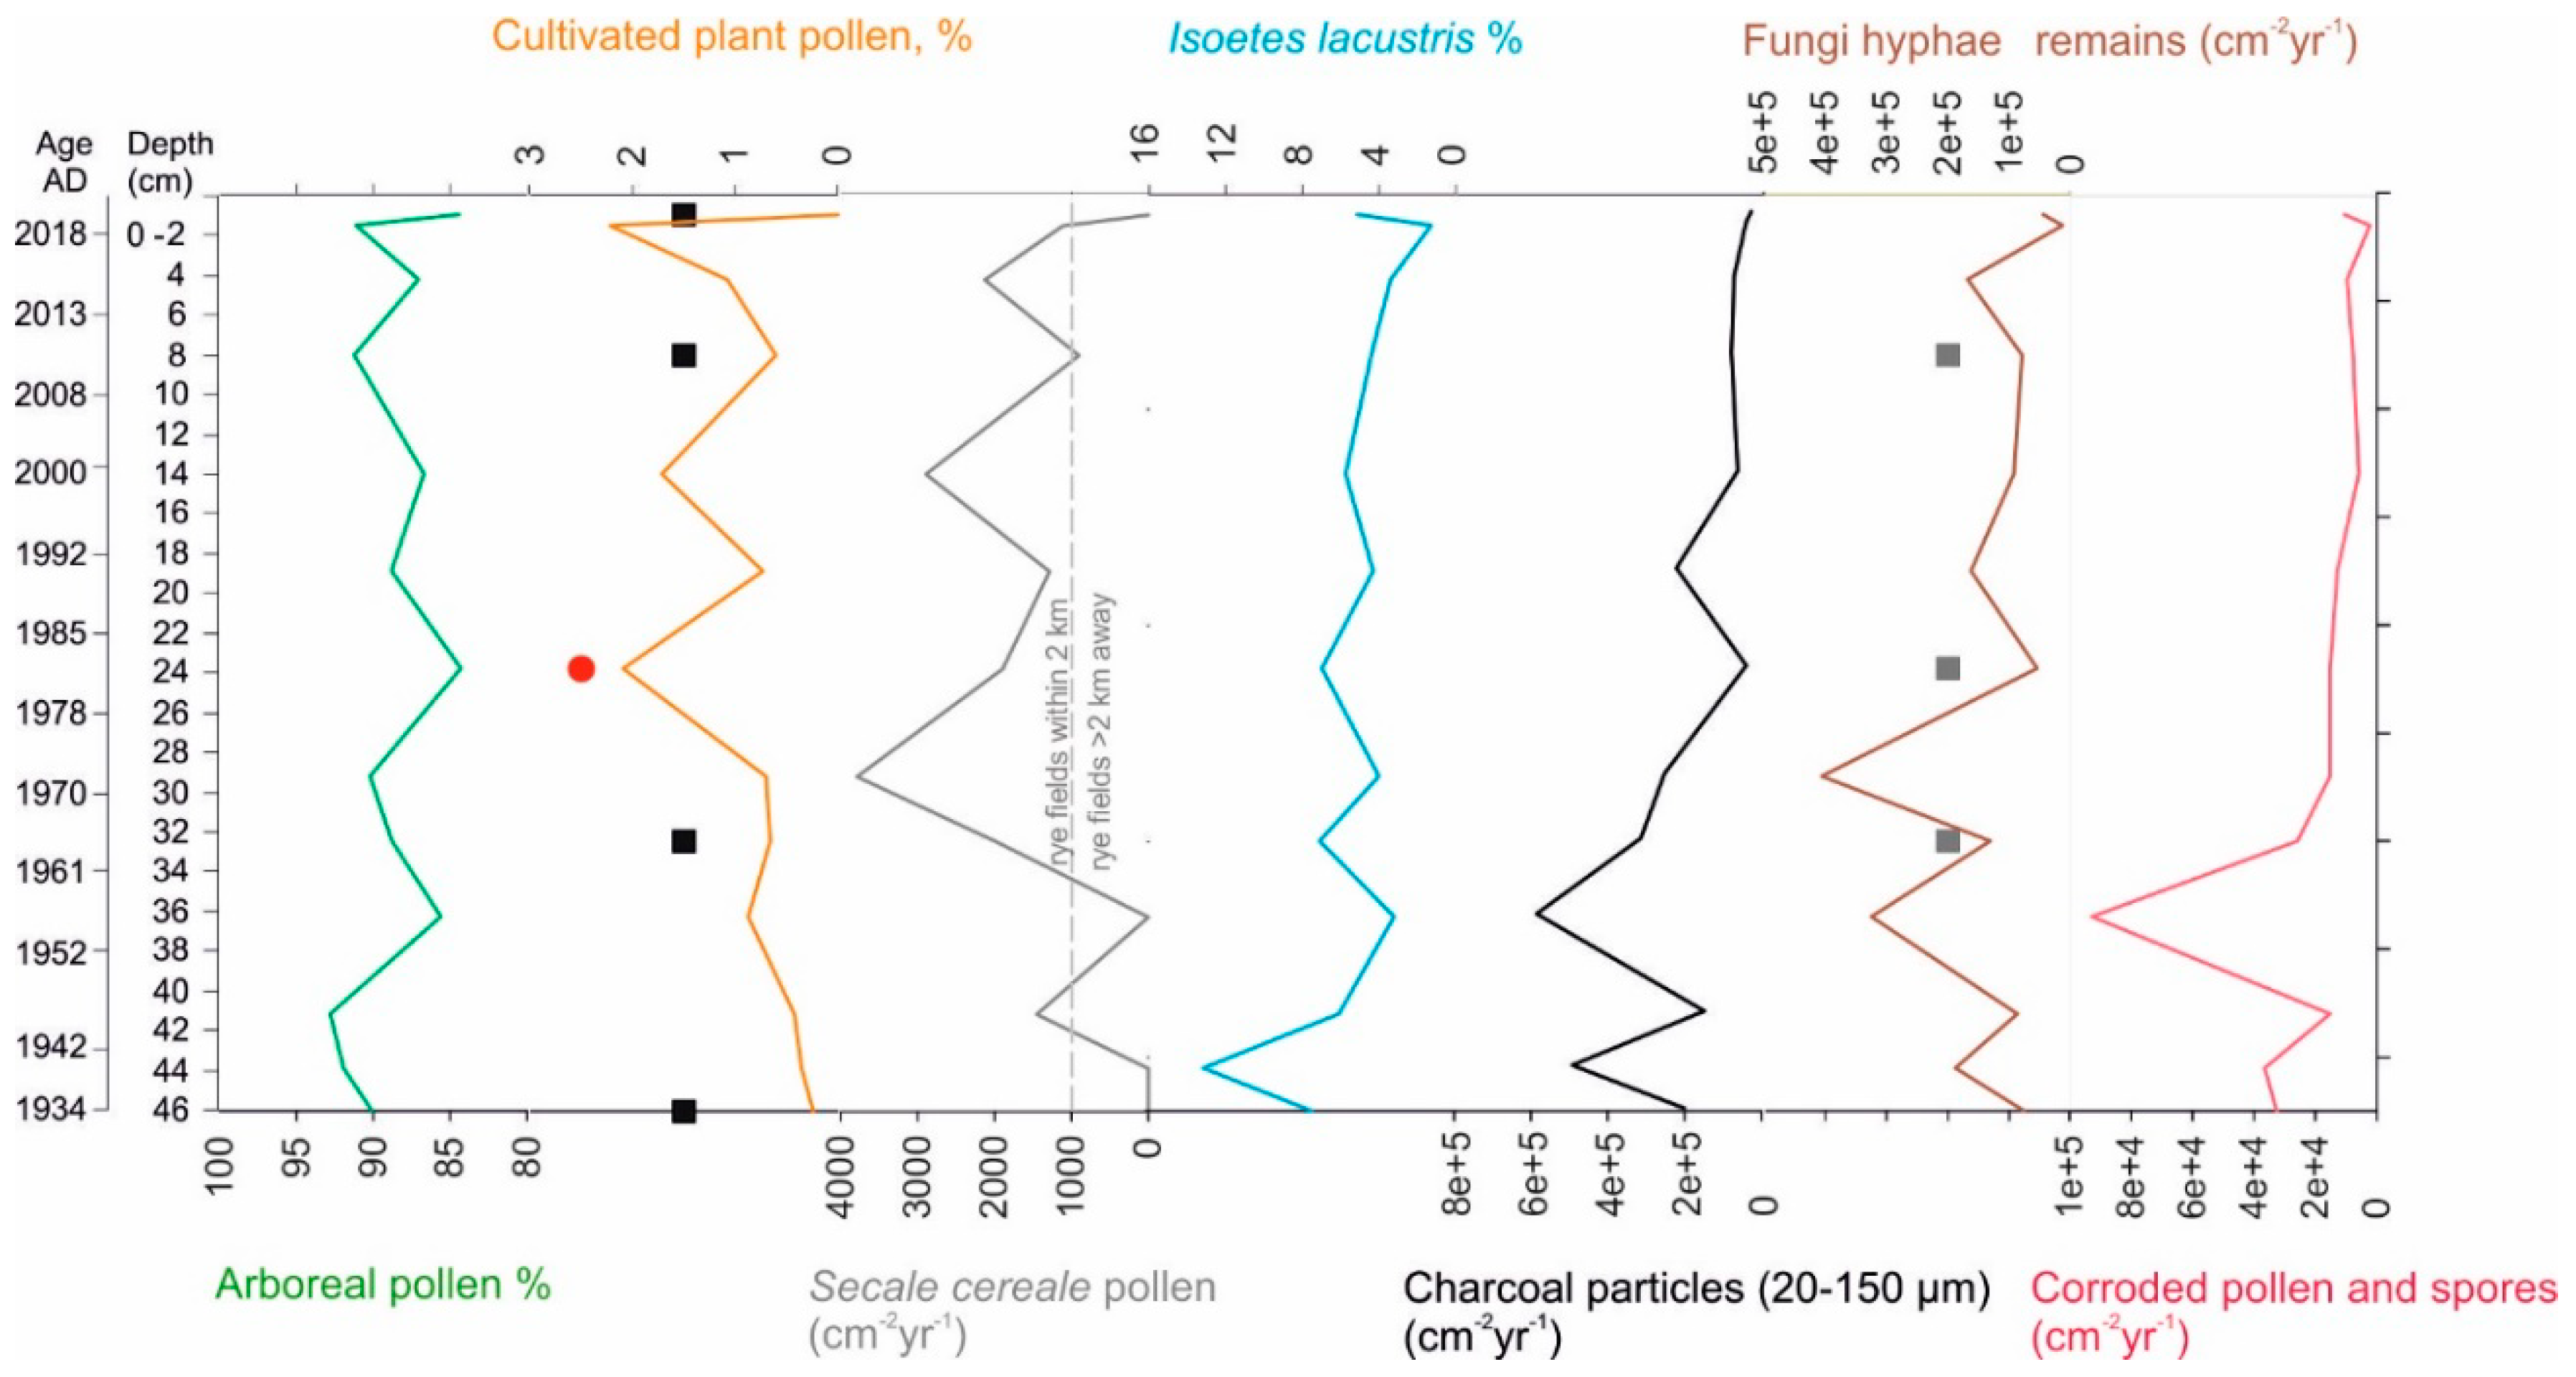
There is no significant change in surrounding vegetation before or after the pipe installation. The vegetation includes the stable dominance of pine (Pinus), birch (Betula), spruce (Picea), and alder (Alnus) over the studied period (Figure 5). The presence of conifer stomata in the lake sediment supports local abundance of spruce and pine. Although, the surrounding landscape is forested, there is continuous evidence of human-activities in the vicinity. For instance, the presence of pollen of flax (Linum), rye (Secale cereale), barley (Hordeum), and wheat/oat (Triticum/Avena) is a direct indication of agricultural practices. Our results also underline that there have not been agricultural fields directly at the Sekšu lake shores, but only further away, as evidenced by the high (nearly 85–90%) forest pollen component in the landscape. It is interesting that the rye pollen accumulation rates above 1000 cm−2 year−1 (Figure 6) point to cereal fields within a 2 km radius of Lake Sekšu [53,54]. Based on USSR topographic maps from the time period of 1941–1991, the cereal fields could be present in the northwest and east of the Sekšu Lake where pastoral activities have also been evident. It is, however, possible that the high concentration of rye pollen can be partially a result of soil erosion and water pumping (enlarging the pollen source area outside the watershed) into the Lake Sekšu. This assumption is further supported by a strong increase of fungi hyphae and corroded pollen grains.
Regarding in-lake vegetation, lake quillwort/Merlin’s grass (Isoëtes lacustris) was recorded throughout the sediment sequence. The highest relative abundance of I. lacustris was recorded prior the pipe installation, after which values continuously declined and did not reach previous values. Sporadically, the pollen of water lilies (Nymphaeaceae), bulrush (Typha), spiked water-milfoil (Myriophyllum spicatum), pondweed (Potamogeton), and bur-reed (Sparganium) were found.

3.4. Diatom Analysis

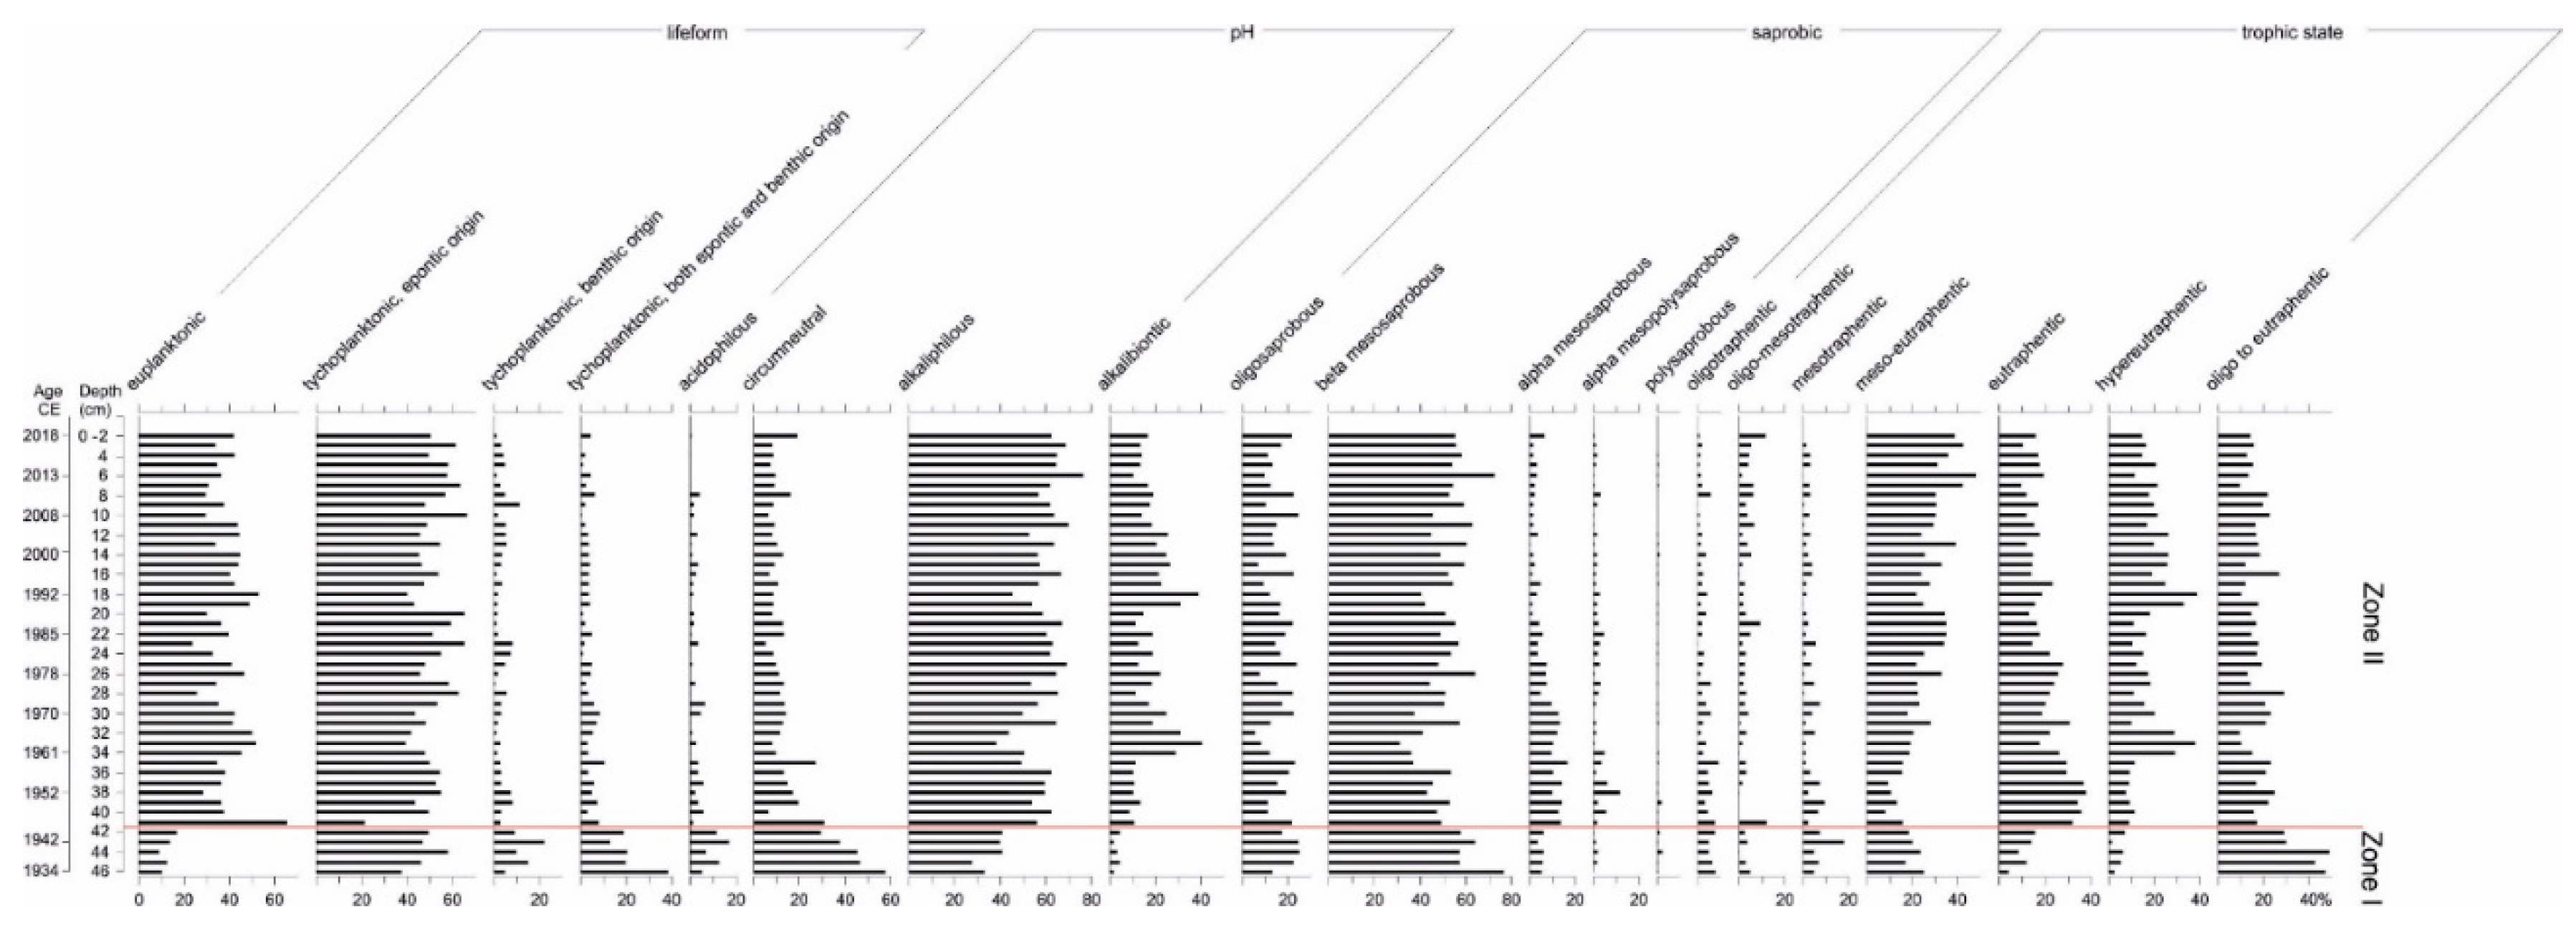
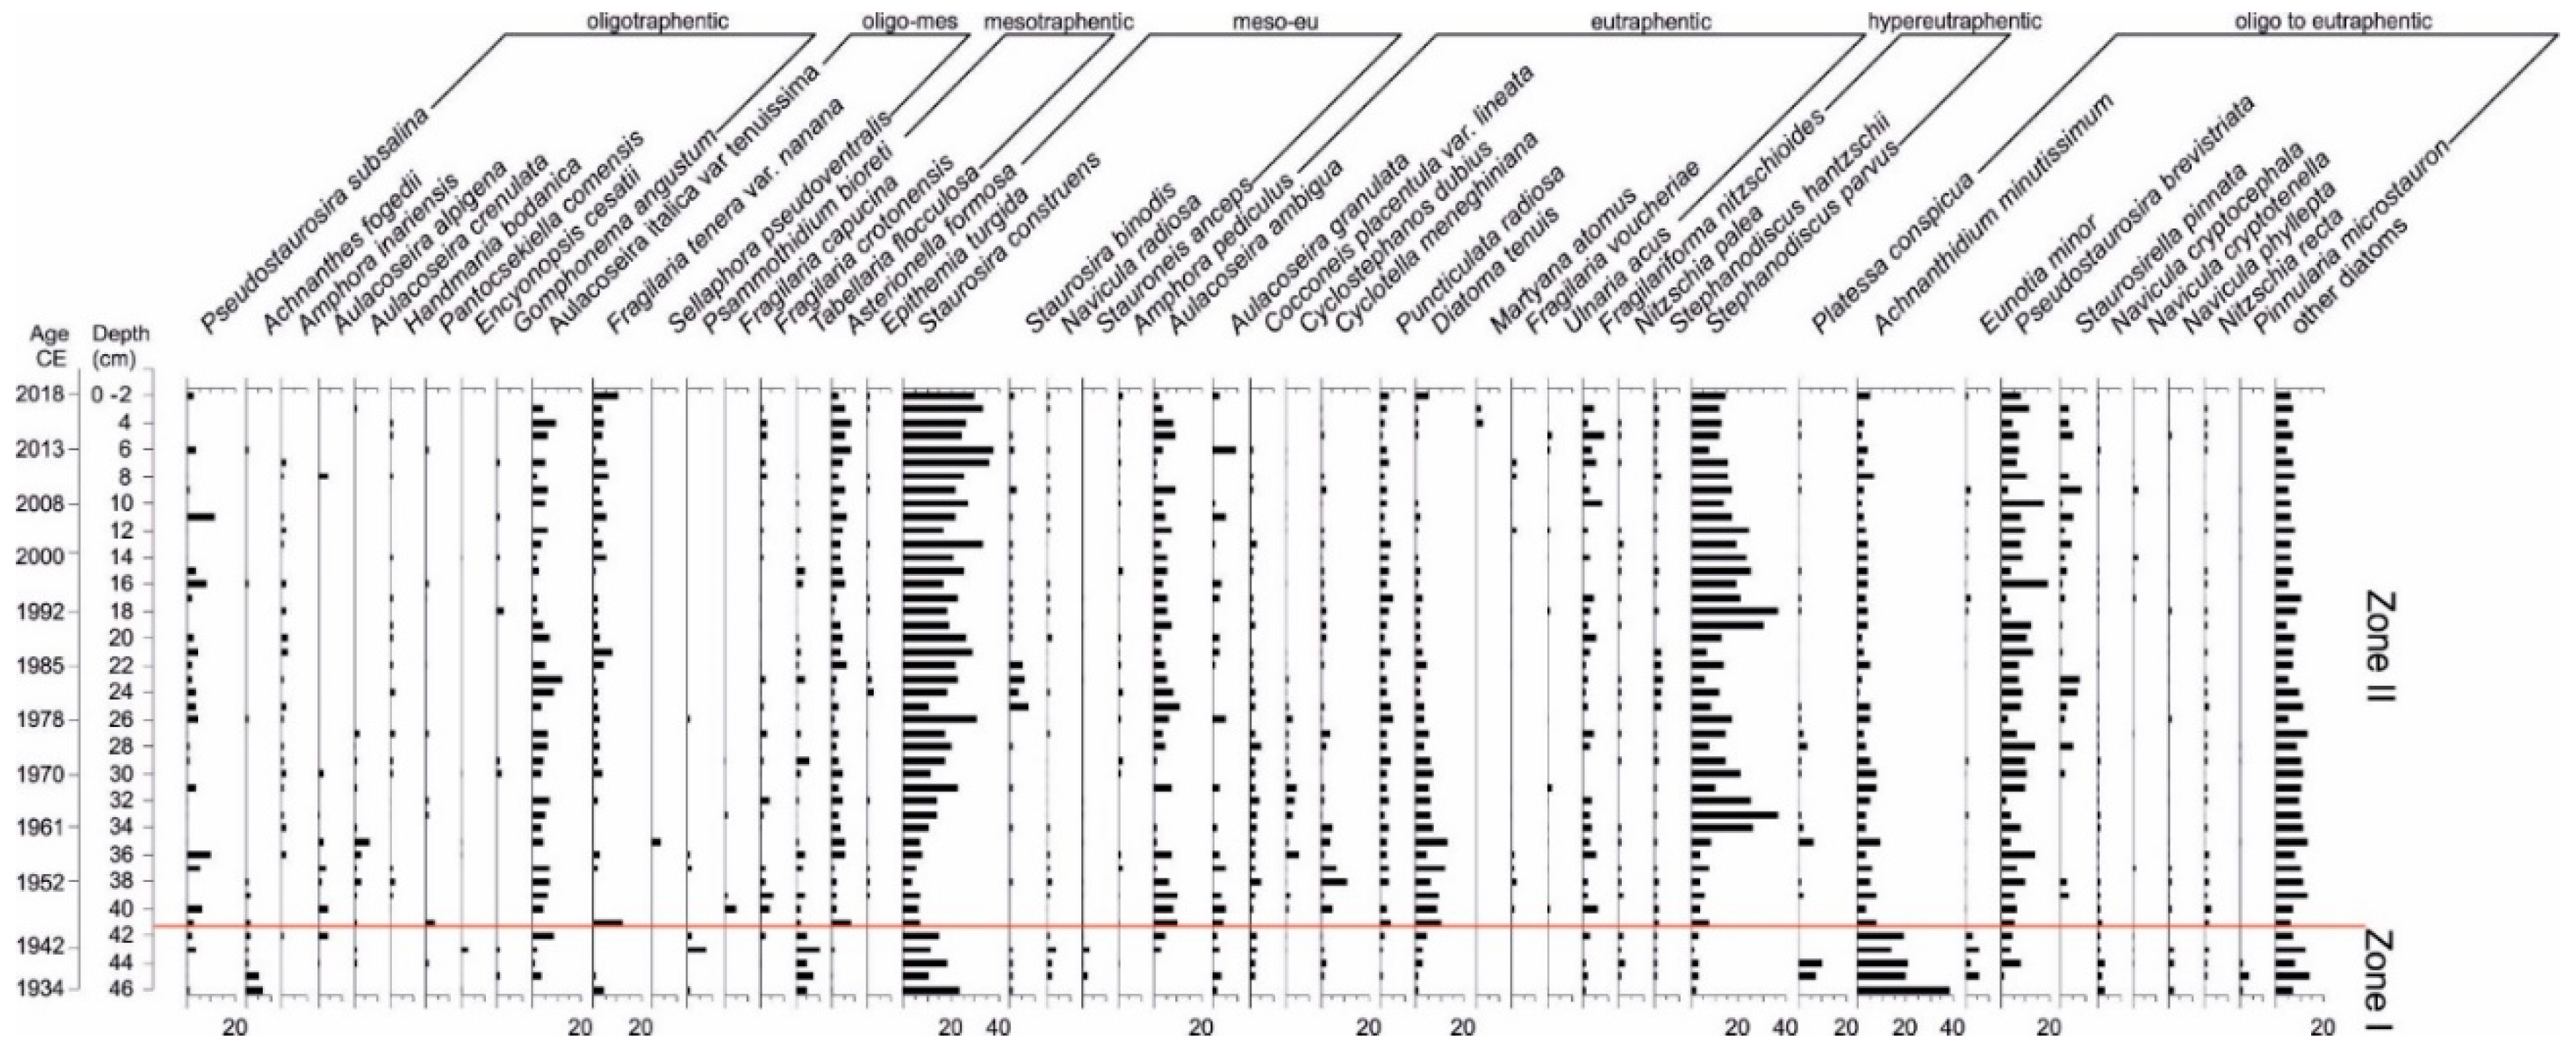
The results show a medium to deplorable state for the diatom frustules, with numerous traces of destruction and dissolution. In total, 178 species of diatoms were identified. There were 47 dominant taxa, whose share was more than 2% of the relative abundance. Based on the changes in species composition and the proportions between the ecological diatom groups, the data are divided into two zones, Zones I and II, which closely correspond to the geochemical zones (Figure 7 and Figure 8). Species were classified according to their habitat category, preference for pH, saprobic state, and trophic state (Figure 7). The total phosphorous (TP) reconstruction presented values between 21.43 and 102.14 µg L−1 (Figure 11).
Zone I
This zone was characterized by the dominance of tychoplanktonic taxa, especially Staurosira construens and Achnanthidium minutissimum (Figure 8). In terms of pH, circumneutral taxa dominated. At the beginning of the phase, we observed an increase in alkaliphilous diatoms. The analysis of saprobic preferences revealed the domination of β-mesosaprobous diatoms. In terms of its trophic state, a high proportion of oligo to eutraphentic taxa was observed. The TP reconstruction remained low, between 21.43–57.66 µg L−1 (Figure 11).
Zone II
Several short-term fluctuations in species composition were observed. Around 1950, the planktonic taxa (euplanktonic) increased by up to 65%, represented by Asterionella formosa, Aulacoseira ambigua, A. granulata, Diatoma tenuis, Fragilaria nanana, Cyclotella planktonica, Handmania bodanica, and Pantocsekiella comensis (Figure 8). The alkaliphilous species dominated the pH group, with an abundance between 38.7 and 76.5 R. Around 1950, the α-mesosaprobous species increased by 0.3%–17.0%. An increase in eutrophic and hypereutrophic taxa was also observed (Figure 7). The TP reconstruction values increased up to 102.14 µg L−1 (Figure 11).

3.5. Cladocera Analysis

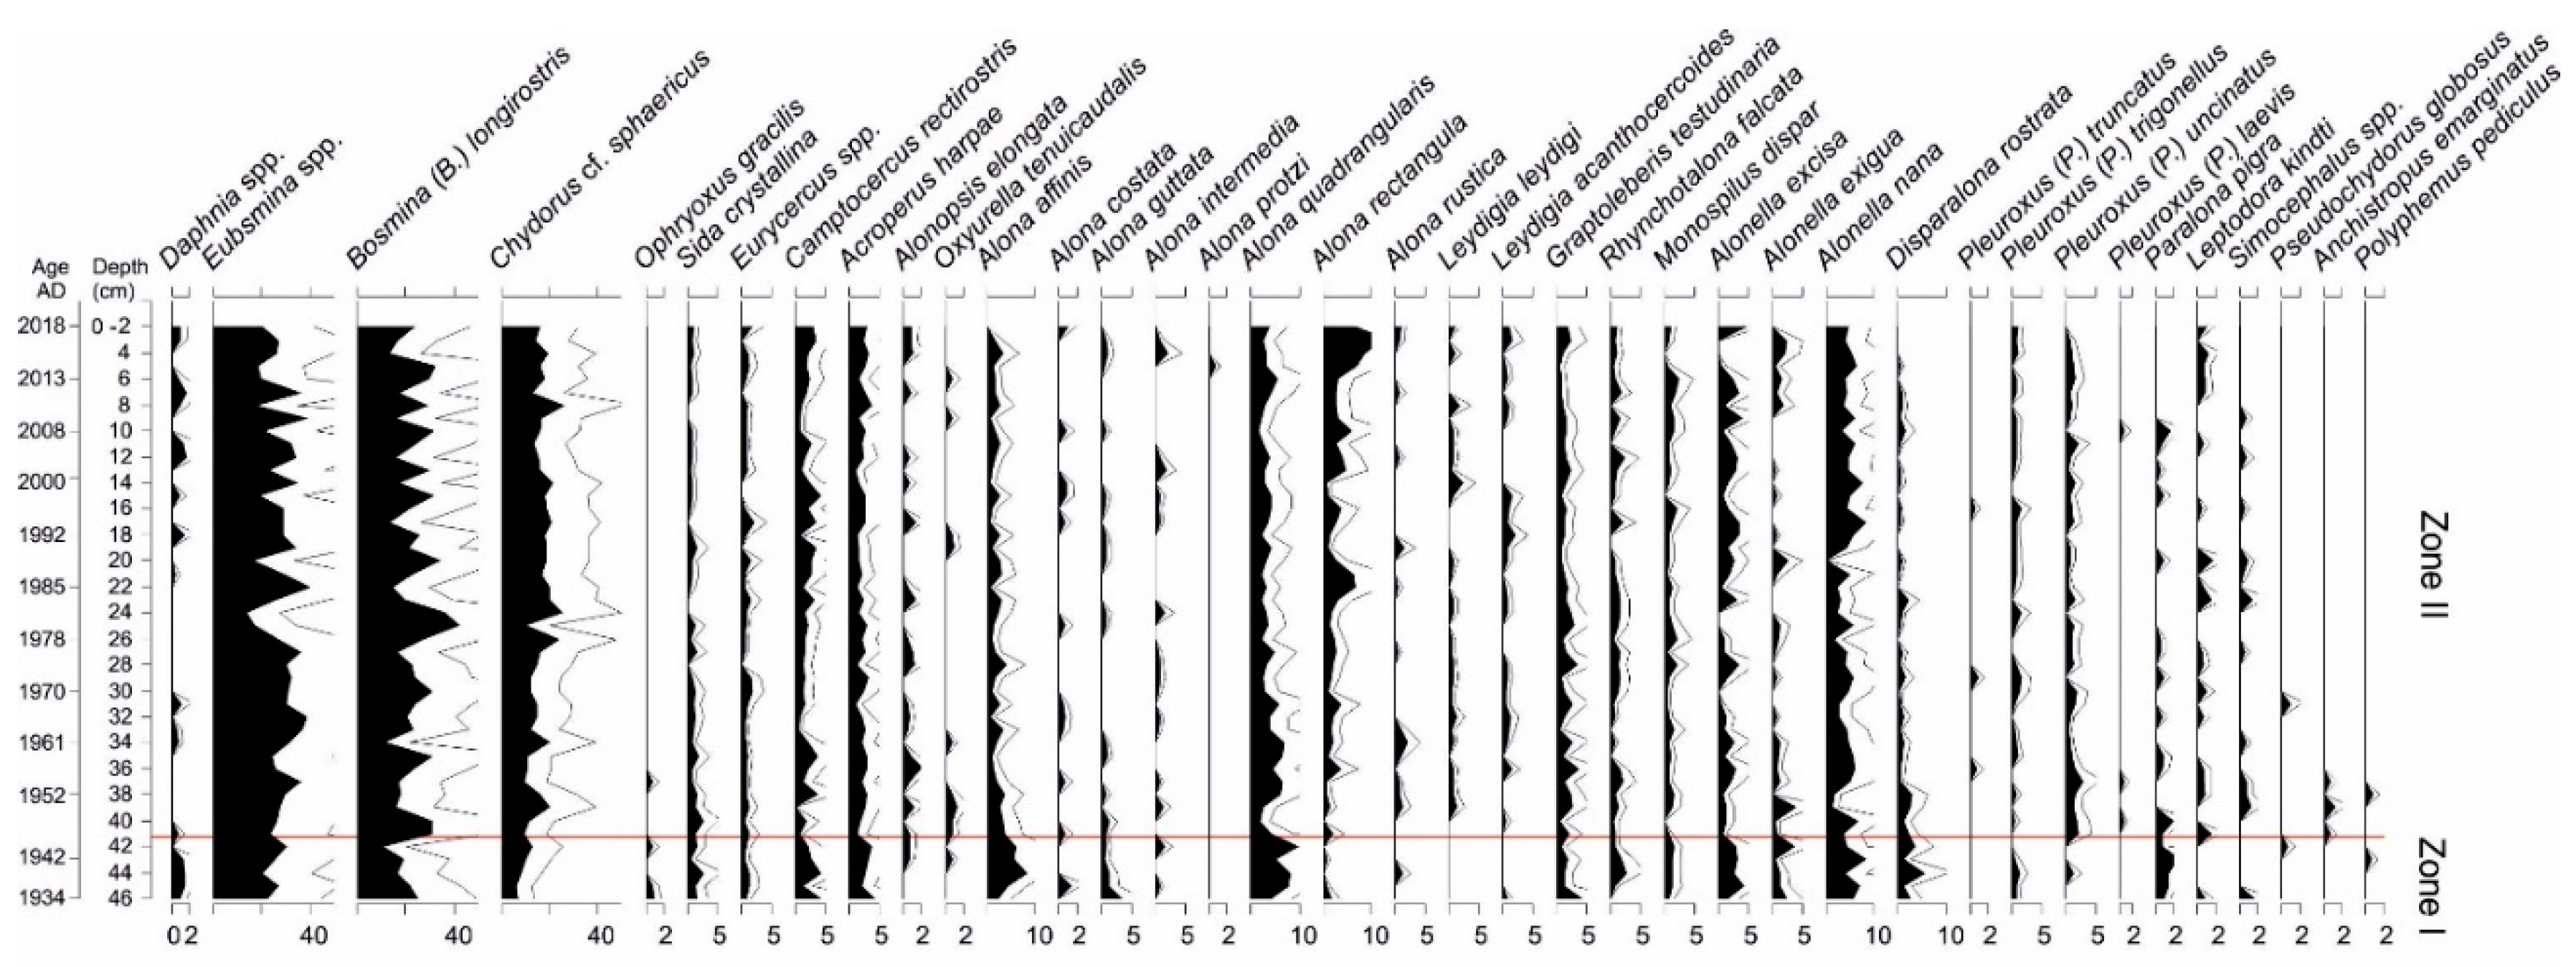
The remains of 44 cladoceran species were found (Figure 9). Throughout the core, the dominant planktonic species were Bosmina (Eubosmina) spp. and Bosmina (Bosmina) longirostris, while among the littoral species, Chydorus cf. sphaericus, Alona quadrangularis and Alonella nana dominated. The overall species composition changes, as well as the indicator species appearance and continuation, allowed us to distinguish between Zones I and II, which correspond to the time before and after the pipe started to operate (Figure 9).
Zone I
The littoral cladocerans comprised more than 50% of all species, among which Alona affinis, A. quadrangularis, and Alonella nana dominated. The Cladocera eutrophic indicator, which is based on the littoral species, showed the lowest values in the sequence. The rare species Ophryoxus gracilis was present almost continuously. Among the pelagic species, Bosmina (E.) spp. dominated, and Daphnia spp. remains were constantly present.
Zone II
During this time, several fluctuations in the species share and Cladocera indicator are observable. The pelagic species constitute more that 50% of all species until 2014 CE. However, an increase in the littoral taxa share was noted at the beginning of 1950, 1960, 1980, and ~1995. Next, Chydorus cf. sphaericus becomes the dominant littoral species. After 2014 CE, a clear decrease of pelagic species and an increase of littoral species occurred, and littoral A. rectangula started to dominate. The trophic indicator increased from around 1950 CE, but even more visibly from the ~1978 (Figure 9). The highest values of the indicator species were observed almost continuously from ~2010 until present.

3.6. Chironomidae Analysis

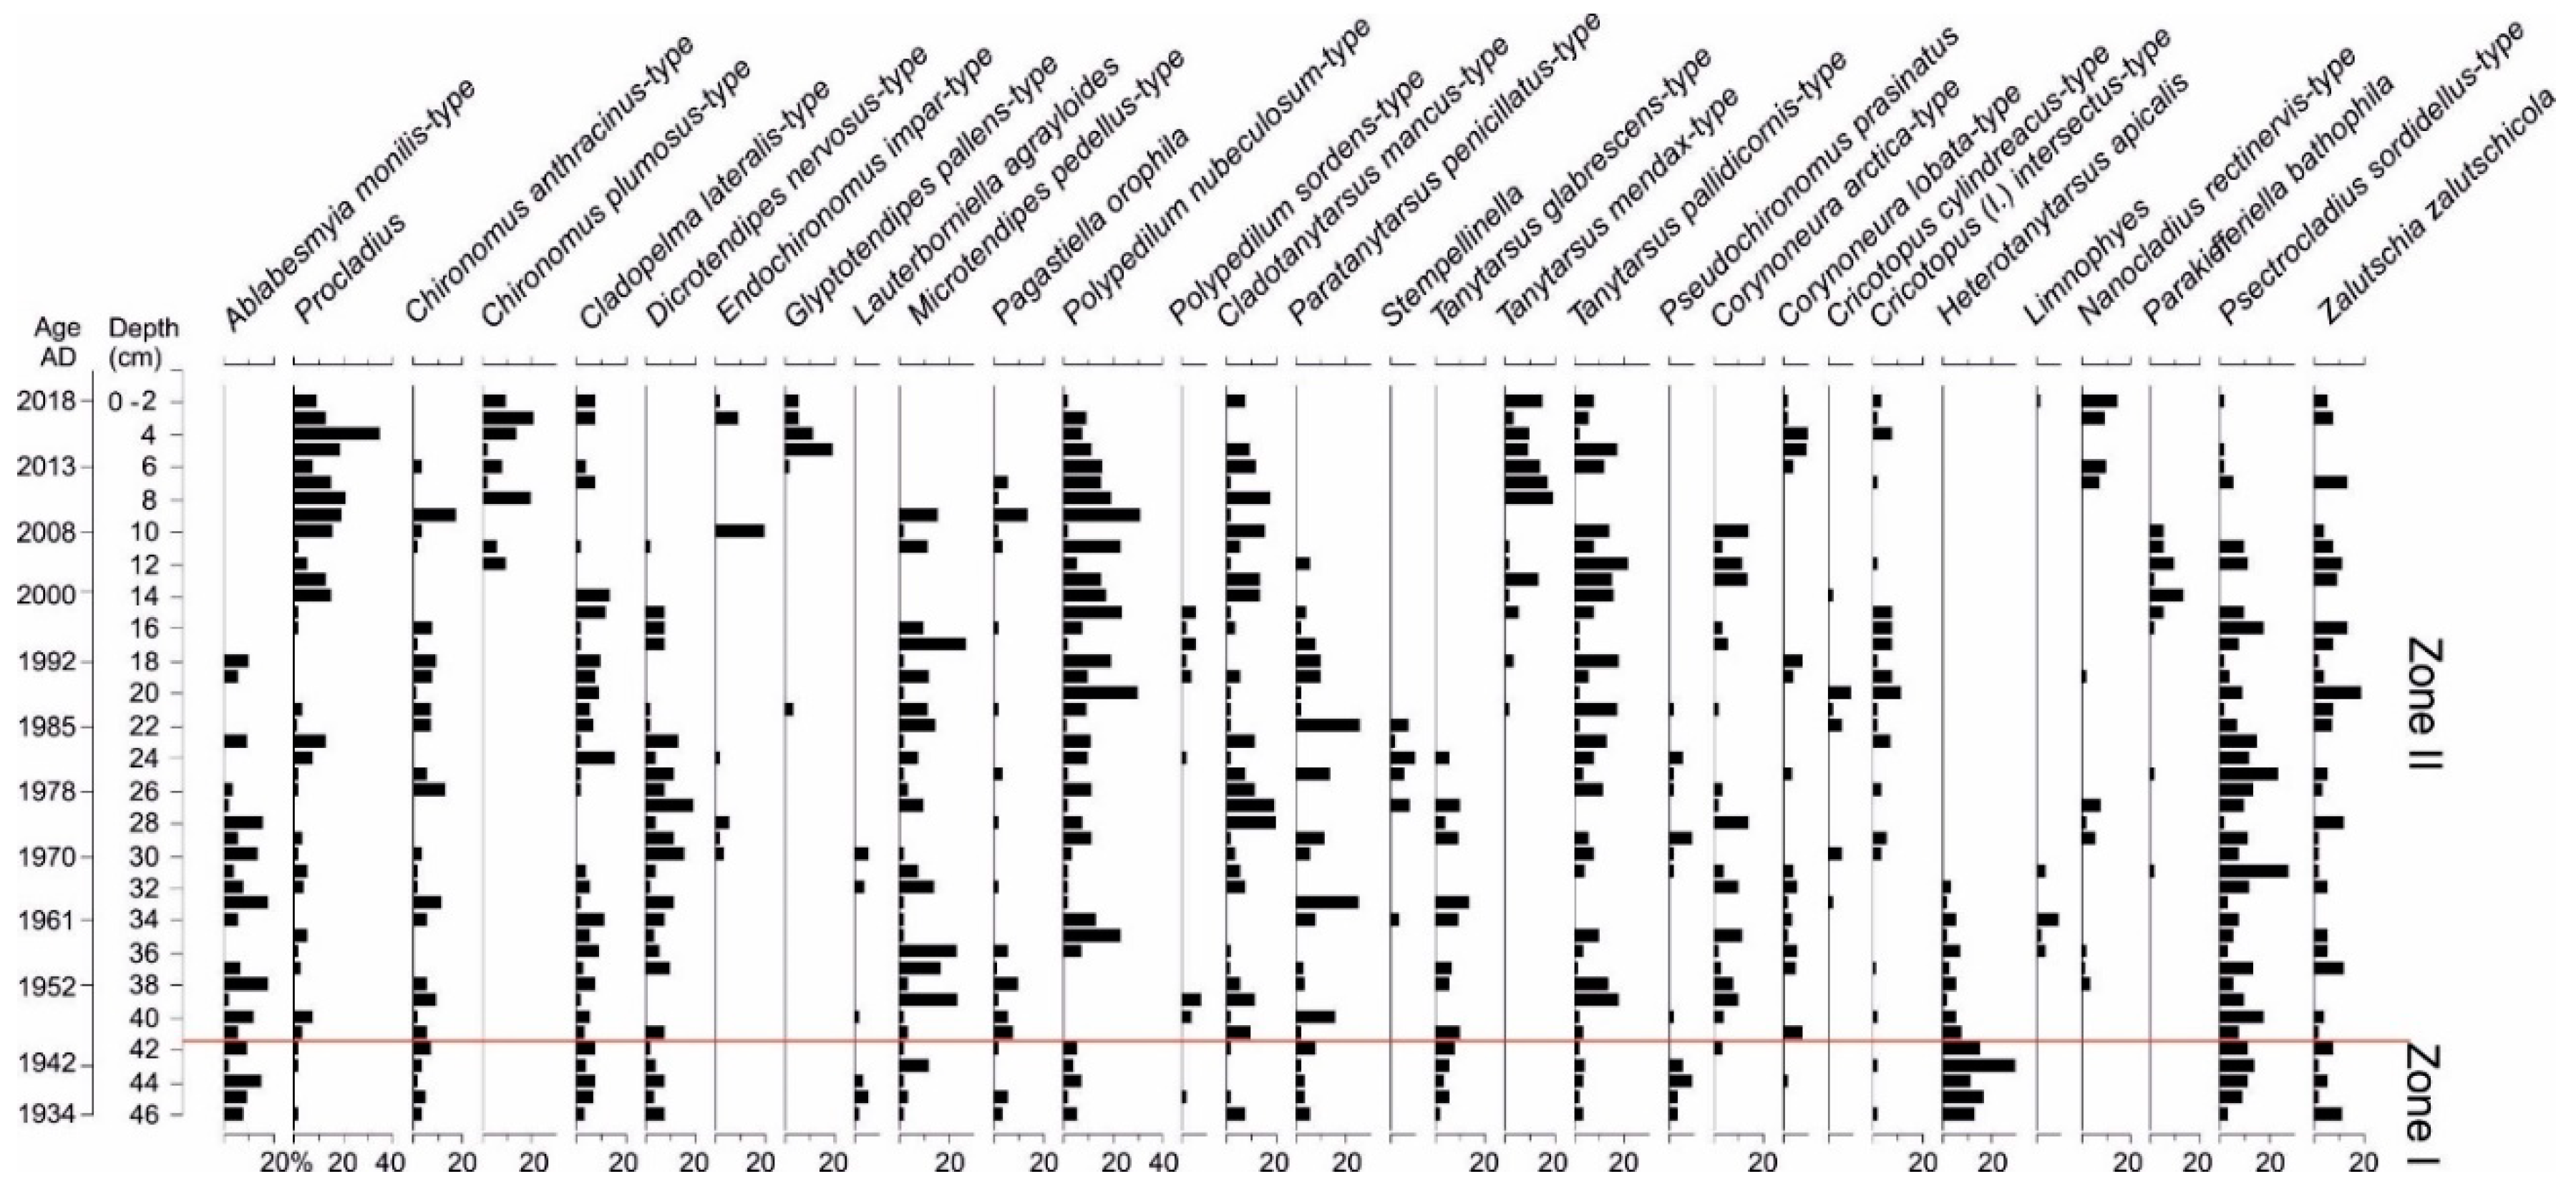
In the 45 sediment samples, 52 different chironomid taxa were observed. None of the taxa occurred in all the samples. The Polypedilum nubeculosum-type was the most frequent, as it was observed in 40 samples. The highest maximum abundance values belonged to Procladius (35.3%), P. nubeculosum-type (31.4%), and Heterotanytarsus apicalis (30.0%). The P. nubeculosum-type also had the highest mean abundance (9.3%), followed by the Psectrocladius sordidellus-type (7.9%) and the Tanytarsus pallidicornis-type (6.6%) (Figure 10). The hypolimnetic oxygen reconstruction showed values between 0.2 and 15.7 mg L−1 (Figure 11).
Zone I
The initial part of the sediment profile (before ~1950 CE) was dominated by oligotrophic taxa, such as H. apicalis and the Ablabesmyia monilis-type. The hypolimnetic oxygen reconstructed values remained high at ~10 mg L−1.
Zone II
In the middle portion of the sediment profile (1950–1990 CE), the P. sordidellus-type, which is a common species, was the most abundant. From 2000 CE onwards, Procladius, which prefers nutrient enriched waters, began to dominate. During the most recent years, the eutrophy indicating the Chironomus plumosus-type and Glyptotendipes pallens-type also significantly increased. From the 1950s until the 1980s, the oxygen values decreased to a level of ~4–8 mg L−1. The hypolimnetic oxygen reconstructed values remained at ~4 mg L−1 from the late 1980s until 2010, after which the values further decreased to anoxic levels in recent years.

4. Discussion

Lake Sekšu exemplifies how environmental changes have occurred, in this case, as a result of artificial water pumping station activities, and also shows how such changes at the trophic level can have a lasting influence on lake functioning. In 1953 CE, the pipe was built and for 12 years (1953–1965) pumped water to Lake Sekšu from the large eutrophic lake, Mazais Baltezers. Our results clearly show that this action persistently changed the lake’s ecosystem by causing increased eutrophication.
A major cause of eutrophication is an increase in the nutrient supply, particularly phosphorus [55]. Besides excessive plant production, algal blooms, and anoxia, the lake community structure changes through cascading trophic effects and benthic-pelagic coupling [56,57]. Another stressor controlling ecosystem functioning is water level fluctuations, which are essential for aquatic–terrestrial shared boundary processes. The physical and biological effects are especially pronounced in the littoral zone and in shallow water ecosystems in general (e.g., erosion, sedimentation, habitat alterations, and biota changes) [58]. Furthermore, erosion is a source of enhanced nutrient supply, and a greater sediment load decreases water quality. An increase of suspended solids reduces water transparency and increases turbidity, which negatively affects the photosynthesis processes but may also reduce the density of fish and invertebrates [56,59].
The Time Before ~1950
Before the pipe started to operate in 1953 CE, Lake Sekšu was a low productivity lake. However, the Cladocera community composition found in our research and in a study by Kuptsch [60] shows that already at the beginning of our core (~1935), the lake trophy had increased compared to 1924. This increase is indicated by a disappearance of the oligotrophy indicating Holopedium gibberum and the appearance of the increasing trophy indicator, Bosmina (Bosmina) longirostris [61,62,63,64,65].
The oldest available investigations from 1924 report a transparency of 5.8 m in the middle of June [60], i.e., almost throughout the lake. It was also reported that Lake Sekšu is one of the 14 lakes located in the vicinity of Latvia’s capital city, Riga, that are Lobelia–Isoëtes population dominated lakes [66]. At the beginning of 20 century, there were at least three species typical for Lobelia–Isoëtes lakes found in Lake Sekšu—L. dortmanna, Isoëtes lacustris, and Juncus bulbosus [67]. Our research revealed the presence and high share of lake quillwort pollen Isoëtes lacustris, as well as Cladocera species Ophryoxus gracilis, around 1935 (Figure 9). Ophyroxus gracilis is a species characteristic of deep, transparent lakes, indicating low/moderate trophy [64,68]. Flössner [49] considers O. gracilis a species typical for Lobelia–Isoëtes lakes.
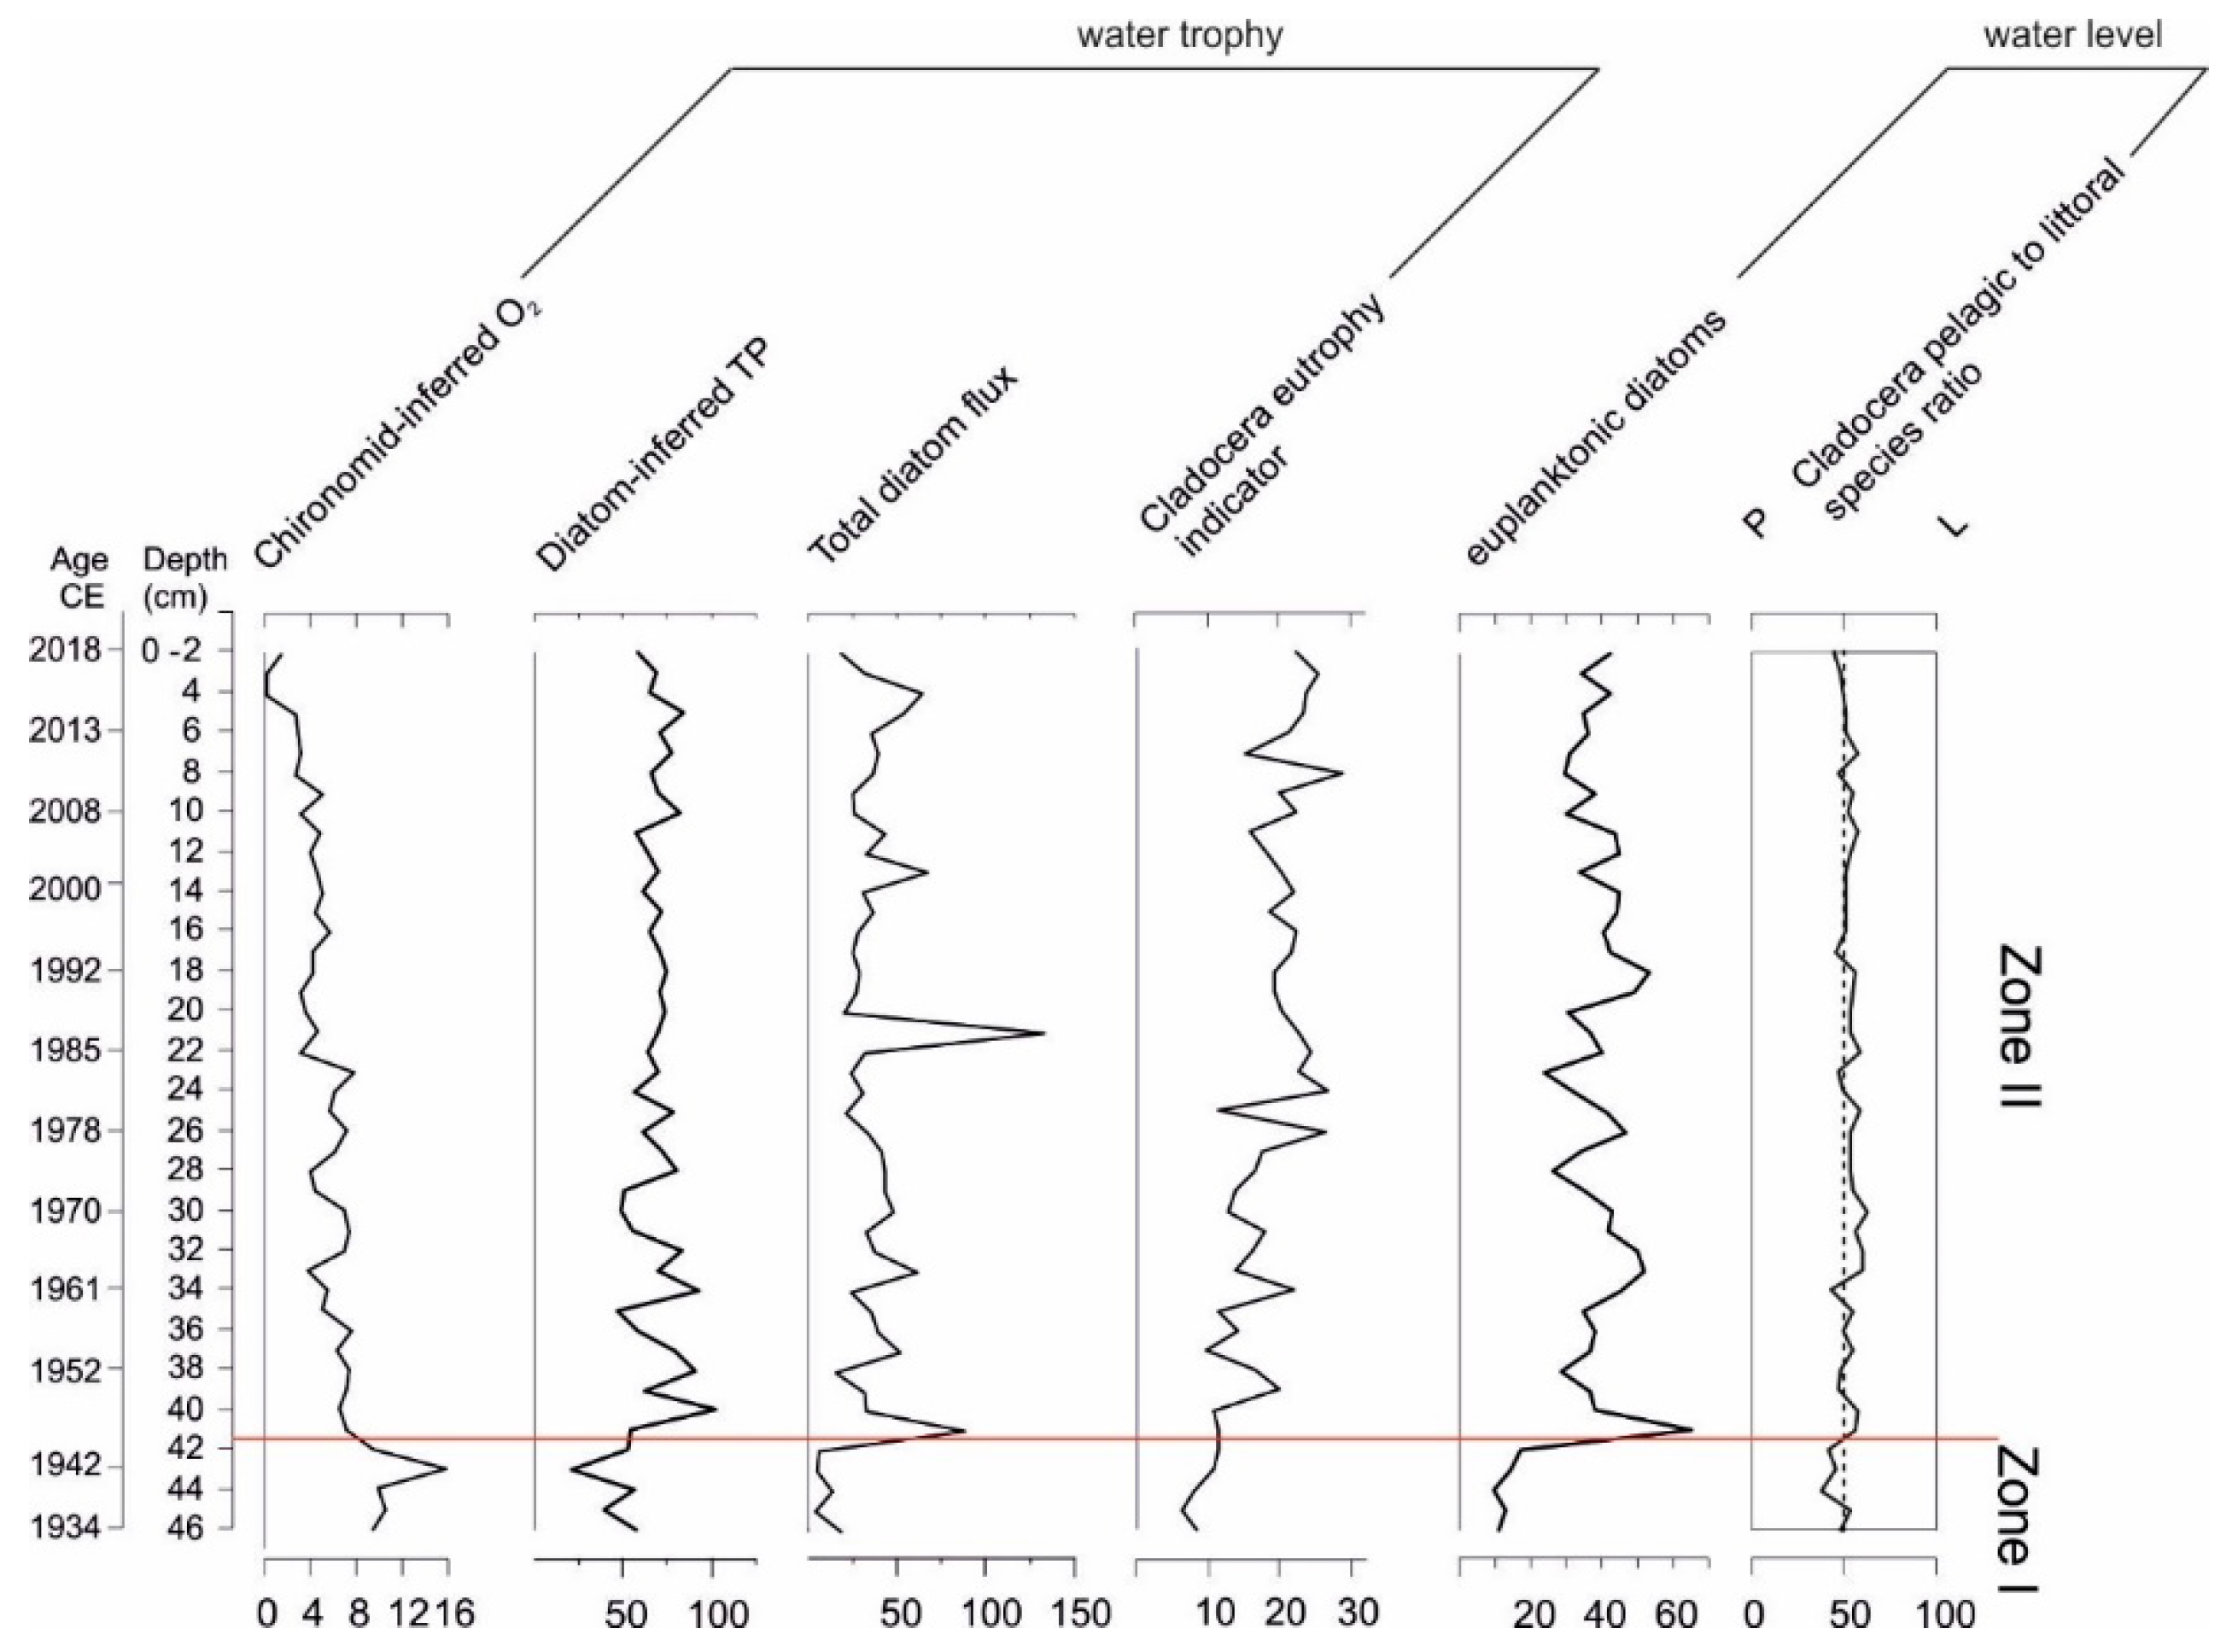
The diatom-based total phosphorus (TP) reconstruction for Lake Sekšu indicates values between 25–50 µg L−1 before the pipe started to operate (Figure 11), which, according to the OECD (Organisation for Economic Cooperation and Development) classification, indicates a meso- to eutrophic type lake [69]. However, this reconstruction seems to overestimate the TP values when considering the other paleoindicators. This might be due to weak diatom assemblage analogues [70,71,72,73]. Nevertheless, the diatom-inference model closely reflected a significant trend in the measured TP, namely, declining TP values before pipe installation and increasing TP values after pipe installation.
The low trophy status is confirmed by the high share of oligotraphentic diatoms and dominance of Chironomidae oligotrophic taxa [74,75]. The well oxygenated hypolimnetic water (values 9–16 mg L−1, Figure 11) was inferred by chironomid-based reconstruction and supports a low trophic status. The chironomid-inferred oxygen values remained at a high level (>8 mg L−1) from the beginning of the record until the mid-1940s, when a step change to a lower level (4–8 mg L−1 between the 1950s and early 1980s) occurred. The relative oxygen saturation exceeded 50% [56]. Lake Sekšu was slightly acidic to neutral at that time, indicated by the dominance of acidophilous and circumneutral diatoms [76,77,78,79].
The geochemical results support the conclusion of low trophy before the construction of the pipe. However, at that time, the sediment was dominated by organic matter (OM) (Figure 4) with a very high concentration of carbon compared to other lakes in the region [80,81,82,83]. The high carbon/nitrogen (C/N) values suggest a significant contribution of terrigenous OM. Atomic C/N values of phytoplankton vary between 4 and 10, while cellulose-rich vascular plants have C/N ratios of more than 20 [84,85]. Therefore, high C/N rates are expected for oligotrophic lakes with low autochthonous production, and the values observed here are consistent with those of the densely forested catchment of Lake Sekšu. The low water levels of this period due to water pumping, and the subsequent water level decreases as early as 1930, may also have led to the concentration of OM in the coring location due to erosion from exposed organic rich littoral sediments from the lake. The water level in 1930 was reported to be very shallow at 1 m a.s.l [86]. The dominance of littoral over planktonic Cladocera confirms this information [87]. In addition, we reconstructed the high hypolimnetic water’s oxygen values (Figure 11), which suggest that the sediment was exposed for efficient bioturbation. Water mixing is also confirmed by the dominance of tychoplanktonic diatoms, i.e., random planktonic diatoms, which require turbulent waters to remain suspended within the photic zone [77,88,89].
The Time Between ~1950–2018
The Lake Sekšu water level was artificially increased by pumping water from Lake Mazais Baltezers starting in 1953 CE in order to elevate the ground water level. Apart from the physical changes caused by an increased water level, this action also caused significant changes to the lake’s ecology and functioning. The lake became eutrophic according to the diatom-inferred TP values around 100 µg L−1 [69]. During the period of artificial water pumping, until 1965, a high P concentration existed at the water column. After the pipe operation was terminated, the TP decreased to about 70 µg L−1 until the present, indicating that elevated trophy continued. According to our results, the additional nutrient load increased the presence of planktonic eutrophic–hypereutrophic diatoms (Figure 7), which, in turn, decreased water transparency. For instance, in August 2013, the Secchi depth was 2.1 m [15], while in 2019, in April, June, and October, it was 1.6 m, 1.6 m, and 1 m, respectively [90].
The total diatom flux (Figure 11) shows an increase, suggesting higher primary production [91,92,93]. As a result, the I. lacustris population greatly decreased. In turn, eutrophic-indicating macrophyte species, such as pondweed (Potamogeton), reed (Typha), and water lily (Nuphar), started to flourish in the lake (Figure 6). Lobelia–Isoëtes lakes indicating species have disappeared from Lake Sekšu according to botanical observations [67].
Further evidence of the rapid shift towards higher trophy during artificial water pumping is provided by the other biological and geochemical results. The Cladocera eutrophic indicator, based on the species living in the littoral zone (Alona rectangula and Chydorus cf. sphaericus), increased, thereby indicating eutrophic conditions until the most recent sample (Figure 11). Simultaneously, the higher trophy in the pelagic zone is indicated by the increase of the Bosmina (B.) longirostris share. This species is associated with higher concentrations of TP [65,94].
The sudden change in the relative minerogenic matter and OM input coincides with the implementation of the pipeline and water pumping from Lake Mazais Baltezers to Lake Sekšu. The increased MM content of around 10% indicates substantial changes in the sediment sources. The pipe was installed tens of meters from today’s lake shore, and flowing waters likely eroded the substrate—sandy soil that is prone to erosion. A comparable increase occurred in carbonate content, which also suggests intensified catchment erosion. The coeval decrease in OM accumulation, as well as carbon and nitrogen content, is likely a result of dilution by an excess MM supply (Figure 4). Despite the prominent relative changes in sediment composition, no evidence of significant increases in the total sedimentation rate are observable. This could be explained by a sudden change from the erosion of previous littoral sediments at a low-water level stage to channel erosion of the ditch, as well as erosion higher on the shore where no former lake sediments exist. Another indicator of the highly dynamic environment after the pipe started to operate is the increased share of corroded pollen grains [95]. The erosion of the shores is also indicated by the presence of herbivores (via coprophilous fungal spores), Fungi hyphae remains, and Glomus spores [54,96].
Pumping caused a significant elevation of the water level from 1 m a.s.l up to 4.5 m a.s.l [86], which is also reflected in the paleolimnological results. The higher water stand is expressed by the larger share of euplanktonic diatoms [97,98] and the dominance of pelagic over littoral Cladocera species [87] (Figure 9 and Figure 11). However, the fluctuation of water level during the whole 12-year period can be deduced from the different share of the Cladocera pelagic/littoral taxa [87]. Both the increasing and decreasing water levels are related to increased catchment erosion [99,100,101]. The variable MM and carbonate matter (CM) content during the period of external water pumping indicate that fluctuating water levels enhanced catchment erosion in addition to channel erosion of the ditch from the pipe-end to the lake.
The C/N ratio (Figure 4) began to decrease soon after the major sedimentary change occurred, which suggests a steadily increasing proportion of phytoplankton in the total organic matter up to the present day. This is consistent with the gradual eutrophication of the lake, as indicated by the microfossil data. The sediment sulfur (S) profile also provides indirect evidence of eutrophication. Sulfur in lake sediments may be derived from natural processes, such as the weathering of sulfur-bearing rocks and the oxidation of organic sulfur in the catchment [102]. However, changes in S contents in recently deposited lake sediments generally indicate the balance between anthropogenic inputs and the rate of sulfate reduction leading to iron sulfide precipitation in sediments [103]. The steady increase in sedimentary S towards the present day suggests an additional input of sulfate from Lake Mazais Baltezers during the period of pumping, followed by enhanced iron sulfide precipitation in anoxic, OM-rich sediments during subsequent eutrophication. Eutrophication due to sewage water input from Lake Mazais Baltezers was suggested by Leinerte [10] (p.2) and is further supported by the high abundance of α-mesosaprobous diatoms [104,105]. This diatom group flourishes under the lower oxygen saturation in the water column [44].
In the middle part of the sediment record, representing the early 1980s, a threshold change can be observed in the chironomid-inferred hypolimnetic oxygen values (Figure 11). At this point, the values decreased from the previous level of 4–8 mg L−1 (between ~1945 and 1980) to a constant level of 4 mg L−1, which prevailed until the 2010s. This is supported by the rapid decrease in hypolimnetic oxygen levels reconstructed from the chironomid data and recent measurements in April and June 2019, when the hypolimnetic oxygen concentration was 4.0 mg L−1 and 0.1 mg L−1, respectively [90]. Jansons [9] (p. 27) and Zarina [15] (p.41) reported an amount of oxygen close to zero or zero in the hypolimnion of the deepest part of the basin, which agrees well with our reconstruction. Oxygen depletion was likely also favored by the water depth increase from <3 meters to 8 meters. Deeper waters reduced wind-driven mixing and enabled efficient thermal stratification.
From around 2000 CE, the water level lowered, reaching 2.5 m a.s.l. at present. This might have increased sedimentary nutrient release, further favoring eutrophication [58]. This higher productivity is indicated by the increase of the Chironomidae species Procladius, which prefers nutrient-rich waters [106] (Figure 10), but is also evidenced by the higher values of diatom-inferred TP (Figure 11). The lowering of the water level inferred from the Cladocera pelagic/littoral species ratio was also confirmed by the local authority [107]. The water level decrease and water trophy increase resulted in oxygen depletion in the hypolimnion, which was revealed by the chironomid reconstruction and recent measurements. Another threshold change based on the chironomid reconstruction occurred during the most recent decade, when the values decreased from a level of 4 mg L−1 (between the ~1940s and 2010s) to <2 mg L−1 (Figure 11). Such a decrease in oxygen concentration is ecologically highly significant for chironomid larvae [108].
The lake continues to be significantly overgrown with water plants, which is evidenced by the slight increase in the abundance of the Cladocera phytophilous species, Alonella exigua, and A. excisa [49,109,110]. More sand and mud associated species (Rhynchotalona falcata, Leydigia spp., and Ilyocryptus sp.) have joined the existing community since 1924 [58]. The lake surface pH in 2019 varied within a season from 7.9 to 8.4 [88], which is consistent with previous studies [9,15].
Due to inappropriate water resource management, many lakes in Riga and its vicinity have lost their high ecological quality. The pumping of water from the eutrophic Lake Mazais Baltezers into the low trophic Lake Sekšu increased nutrient inflow and pushed the lake over the threshold, causing eutrophication. Presently, Lake Sekšu continues to be overgrown with macrophytes such as Phragmites australis, Nuphar sp., and Nymphaea sp. [15]. Phytoplankton blooms can be observed in the lake. In 1995/1996, the majority of the cyanobacterial mass contained toxic species [111], while in 2002, Balode et al. [112] found no toxic species.
The “Baltezers” water pumping station is still in use. However, its contribution to the drinking water supply is not as significant as it was in previous years because other pumping stations were established, and additional resources for water supply were found [8].

5. Conclusions

The pumping of water from the eutrophic lake changed the water level and contributed to faster eutrophication in Lake Sekšu. Before the pipe began operations, the lake was shallow with low productivity and could be defined as a Lobelia–Isoëtes population-dominated biotope. The core studied represents the time period ~1935–2018. In 1953, the water level was artificially increased by pumping water from another lake. The sudden nutrient load increased the abundance of planktonic eutrophic–hypereutrophic diatoms, causing the lake water transparency to decrease and inducing hypolimnetic anoxia. The deterioration of the lake’s ecological state, as indicated by the results of the biological analysis, was also confirmed by the geochemical results. Cladocera species indicating low trophy became suppressed or disappeared.
Reducing external nutrient loading is known as an important approach to improve the environmental state in small shallow lakes suffering from eutrophication. Nevertheless, in Lake Sekšu, after the water replenishment activities were terminated, the disturbance effect caused by the pumping continued to occur over decades, slowly changing assemblages of keystone species and the foodweb. This highlights the long legacy effects of eutrophication in lacustrine systems. Artificial restoration measures may, therefore, be considered as a strategy to accelerate the recovery of Lake Sekšu.

Author Contributions

Conceptualization, I.Z. and I.D.-D.; methodology, I.Z., T.P.L., S.S., N.S., W.T., T.J.; software NO; validation, NO; formal analysis, I.Z., T.P.L., M.R., S.S., N.S., W.T., T.J.; investigation, I.Z., I.D.-D., S.S., A.L., M.R.; resources, I.D.-D.; data curation, I.Z., T.P.L., M.R., S.S., N.S.; writing—original draft preparation, I.Z., I.D.-D., T.P.L., M.R., S.S., N.S., W.T., A.L., M.R., T.J.; writing—review and editing, I.Z., I.D.-D., M.R., S.S., N.S., W.T.; visualization, I.Z., N.S., W.T., M.R.; supervision, NO.; project administration, I.D.-D.; funding acquisition, I.D.-D., I.Z., N.S. All authors have read and agreed to the published version of the manuscript.

Funding

Research was funded by the European Regional Development Fund, 1.1.1.2 Post-doctoral project No.1.1.1.2/VIAA/2/18/359 and Latvian Institute of Aquatic Ecology. The effort of Izabela Zawiska was supported by a grant from Polish National Science Centre No.2016/23/D/ST10/03071. The work of Normunds Stivrins was supported by grants founded by Estonian Research Council grant PRG323 and the Latvian Council of Science Project No. LZP-2018/1-0171 and performance-based funding of the University of Latvia within the “Climate change and sustainable use of natural resources” program. Funding for Tomi P. Luoto was provided by the Kone Foundation (grant number 090140).

Acknowledgments

Our special thanks to lab assistants Juris Tunens, Nina Sunelika and all who participated in sampling. In particular, we would like to acknowledge Timo Saarinen for organizing sampling campaign, storyteller Pauls Timrots from Riga Water Supply Museum for providing historical background of the study site and expert in lake plants Uvis Susko from Latvian Fund for Nature for sharing his notes on historical observations.

Conflicts of Interest

The authors declare no conflict of interest.

References

  1. Haas, M.; Baumann, F.; Castella, D.; Haghipour, N.; Reusch, A.; Strasser, M.; Eglinton, T.I.; Dubois, N. Roman-driven cultural eutrophication of Lake Murten, Switzerland. Earth Planet Sci. Lett. 2019, 505, 110–117. [Google Scholar] [CrossRef]
  2. Wassmann, P. Cultural eutrophication: Perspectives and prospects. In Drainage Basin Nutrient Inputs and Eutrophication: An Integrated Approach; Wassmann, P., Olli, K., Eds.; University of Tromsø: Tromsø, Norway, 2005; pp. 224–234. [Google Scholar]
  3. Hasler, A.D. Eutrophication of lakes by domestic drainage. Ecology 1947, 28, 383–395. [Google Scholar] [CrossRef]
  4. Elmgren, R.; Larsson, U. Eutrophication in the Baltic Sea area: Integrated coastal management issues. In Science and Integrated Coastal Management; von Bodungen, B., Turner, R.K., Eds.; University Press: Berlin, Germany, 2001; pp. 15–35. [Google Scholar]
  5. Smol, J.P. Pollution of Lakes and Rivers. A Paleoenvironmental Perspective, 2nd ed.; Blackwell Publishing Ltd.: Oxford, UK, 2008; pp. 1–396. [Google Scholar]
  6. Yuksel, I.; Arman, H.; Ceribasi, G. Water Resources Management of Hydropower and Dams as Sustainable Development. In Proceedings of the International Conference on Sustainable Systems and the Environment (ISSE), Sharjah, UAE, 23–24 March 2011. [Google Scholar]
  7. Chen, J.; Qian, H.; Gao, Y.; Wang, H.; Zhang, M. Insights into hydrological and hydrochemical processes in response to water replenishment for lakes in arid regions. J. Hydrol. 2020, 581. [Google Scholar] [CrossRef]
  8. Dziluma, M. Riga Water and the Riga Water Supply Museum; Riga Water: Riga, Latvia, 2003; pp. 1–86. [Google Scholar]
  9. Jansons, E. Rīgas Dzeramais ūdens un tā Resursu Aizsardzība. Baltezeru un to Apkaimes Izpēte; Rīgas Ūdens: Rīga, Latvija, 1997; pp. 1–53. [Google Scholar]
  10. Krutofala, T.; Levins, I. Pazemes ūdeņu Atradnes “Baltezers”, Iecirkņa “Akoti” Pase. Pazemes ūdeņu Ekspluatācijas Krājumu Novērtējums. Atradne “Baltezers”, iecirknis “Akoti”. Gruntsūdens Horizonts; Latvijas Vides, ģeoloģijas un Meteoroloģijas Aģentūra: Rīga, Latvija, 2006; pp. 1–38. [Google Scholar]
  11. Pastors, A. Sekšu ezers. In Latvijas Daba: Enciklopēdija; Kavacs, G., Ed.; Latvijas Enciklopēdija: Rīga, Latvija, 1995; Volume 5, pp. 12–13. [Google Scholar]
  12. Bauze-Krastiņš, M.G. Garkalnes novada teritorijas plānojums 2009–2021. Gadam. Paskaidrojuma Raksts; Garkalnes novads: Rīga, Latvija, 2009; pp. 1–169. [Google Scholar]
  13. Latvijas Klimats. Latvijas Vides, ģeoloģijas un Meteoroloģijas Centrs. Available online: https://www.meteo.lv/lapas/laika-apstakli/klimatiska-informacija/latvijas-klimats/latvijas-klimats?id=1199&nid=562 (accessed on 10 March 2020).
  14. Natural Data Management System OAK, Meža Valsts Reģistra Informācija. Available online: http://ozols.daba.gov.lv/pub/Life/ (accessed on 10 March 2020).
  15. Zarina, D. Sekšu Ezera, Sudrabezera un Venču Ezera Ekoloģiskais Stāvoklis. Master’s Thesis, Latvijas Universitāte, Riga, Latvija, 2014. [Google Scholar]
  16. Tylmann, W.; Bonk, A.; Goslar, T.; Wulf, S.; Grosjean, M. Calibrating 210Pb dating results with varve chronology and independent chronostratigraphic markers: Problems and implications. Quat. Geochronol. 2016, 32, 1–10. [Google Scholar] [CrossRef] [Green Version]
  17. Rose, N. A method for the selective removal of inorganic ash particles from lake sediments. J. Paleolimnol. 1990, 4, 61–68. [Google Scholar] [CrossRef]
  18. Alliksaar, T. Spatial and temporal variability of the distribution of spherical fly-ash particles in sediments in Estonia. Ph.D. Thesis, Tallinn Pedagogical University, Tallinn, Estonia, 2000. [Google Scholar]
  19. Hedges, J.I.; Eglinton, G.; Hatcher, P.G.; Kirchman, D.L.; Arnosti, C.; Derenne, S.; Evershed, R.P.; Kögel-Knabner, I.; de Leeuw, J.W.; Littke, R.; et al. The molecularly-uncharacterized component of non-living organic matter in natural environments. Org. Geochem. 2000, 31, 945–958. [Google Scholar] [CrossRef]
  20. Masiello, C.A. New directions in black carbon organic geochemistry. Mar. Chem. 2004, 92, 201–213. [Google Scholar] [CrossRef]
  21. Stivrins, N.; Wulf, S.; Wastegård, S.; Lind, E.M.; Allisaar, T.; Gałka, M.; Andersen, T.J.; Heinsalu, A.; Seppä, H.; Veski, S. Detection of the Askja AD 1875 cryptotephra in Latvia, Eastern Europe. J. Quat. Sci. 2016, 31, 437–441. [Google Scholar] [CrossRef] [Green Version]
  22. Blaauw, M. Methods and code for ‘classical’ age-modelling of radiocarbon sequences. Quat. Geochronol. 2010, 5, 512–518. [Google Scholar] [CrossRef]
  23. R Core Team. R: A Language and Environment for Statistical Computing; R Foundation: Vienna, Austria, 2018. [Google Scholar]
  24. Heiri, O.; Lotter, A.F.; Lemcke, G. Loss on ignition as a method for estimating organic and carbonate content in sediments, reproducibility and comparability of results. J. Paleolimnol. 2001, 25, 101–110. [Google Scholar] [CrossRef]
  25. Berglund, B.E.; Ralska-Jasiewiczowa, M. Pollen analysis and pollen diagrams. In Handbook of Holocene Palaeoecology and Palaeohydrology; Berglund, B., Ed.; John Wiley & Sons: Chichester, UK, 1986; pp. 455–484. [Google Scholar]
  26. Stockmarr, J. Tablets with spores used in absolute pollen analysis. Pollen Spores 1971, 13, 615–621. [Google Scholar]
  27. Fægri, K.; Iversen, J. Textbook of Pollen Analysis; John Wiley & Sons: Chichester, UK, 1986. [Google Scholar]
  28. Miola, A. Tools for non-pollen palynomorphs (NPPs) analysis: A list of quaternary NPP types and reference literature in English language (1972–2011). Rev. Palaeobot. Palynol. 2012, 186, 142–161. [Google Scholar] [CrossRef]
  29. Sweeney, C.A. A key for the identification of stomata of the native conifers of Scandinavia. Rev. Palaeobot. Palynol. 2004, 128, 281–290. [Google Scholar] [CrossRef]
  30. Finsinger, W.; Tinner, W. New insights on stomata analysis of European conifers 65 years after the pioneering study of Werner Trautmann (1953). Veg. Hist. Archaeobotany 2019. [Google Scholar] [CrossRef]
  31. Grimm, E.C. TILIA Software; Illinois State Museum, Research and Collection Center: Springfield, IL, USA, 2012. [Google Scholar]
  32. Battarbee, R.W. Diatom analysis. In Handbook of Holocene Paleoecology and Paleohydrology; Berglund, B.E., Ed.; John Wiley and Sons Ltd.: Chichester, UK, 1986; pp. 527–570. [Google Scholar]
  33. Battarbee, R.W.; Kneen, M.J. The use of electronically counted microsphere sin absolute diatom analysis. Limnol. Oceanogr. 1982, 27, 184–188. [Google Scholar] [CrossRef]
  34. Krammer, K.; Lange-Bertalot, H. Bacillariophyceae 4. Achnanthaceae. In Süsswasserflora von Mitteleuropa, 3rd ed.; Ettl, H., Gärtner, G., Gerloff, J., Heyning, H., Mollenhauer, D., Eds.; Fisher: Stuttgardt, Germany, 2011; Volume 2, p. 437. [Google Scholar]
  35. Krammer, K.; Lange-Bertalot, H. Bacillariophyceae 1. Naviculaceae. In Süsswasserflora von Mitteleuropa, 4th ed.; Ettl, H., Gerloff, J., Heyning, H., Mollenhauer, D., Eds.; Fisher: Stuttgardt, Germany, 2010; Volume 2, p. 876. [Google Scholar]
  36. Krammer, K.; Lange-Bertalot, H. Bacillariophyceae 2. Ephitemiaceae. Bacillariaceae. Surirellaceae. In Süsswasserflora von Mitteleuropa, 4th ed.; Ettl, H., Gerloff, J., Heyning, H., Mollenhauer, D., Eds.; Fisher: Stuttgardt, Germany, 2008; Volume 2, p. 596. [Google Scholar]
  37. Krammer, K.; Lange-Bertalot, H. Bacillariophyceae 3. Centrales. Fragilariaceae. Eunotiaceae. In Süsswasserflora von Mitteleuropa, 3rd ed.; Ettl, H., Gerloff, J., Heyning, H., Mollenhauer, D., Eds.; Fisher: Stuttgardt, Germany, 2008; Volume 2, pp. 1–577. [Google Scholar]
  38. Lange-Bertalot, H.; Hofmann, G.; Werum, M. Diatomeen im Süßwasser-Benthos von Mitteleuropa; A.R.G. Gantner Verlag, K.G.: Ruggell, Liechtenstein, 2011; pp. 1–908. [Google Scholar]
  39. Lange-Bertalot, H.; Metzeltin, D. Indicators of Oligotrophy. 800 taxa representative of three ecologically distinct lake types. In Iconographia Diatomologica: Annotated Diatom Micrographs; Lange-Bertalot, H., Ed.; A.R.G. Gantner Verlag, K.G.: Ruggel, Liechtenstein, 1996; pp. 1–390. [Google Scholar]
  40. Lange-Bertalot, H.; Bąk, M.; Witkowski, A.; Tagliaventi, N. Eunotia and related genera. In Diatoms of Europe; A.R.G. Gantner Verlag, K.G.: Ruggell, Liechtenstein, 2011; Volume 6, pp. 1–747. [Google Scholar]
  41. AlgaeBase. Available online: https://www.algaebase.org/ (accessed on 19 February 2020).
  42. Lecointe, C.; Coste, M.; Prygiel, J. “Omnidia”: Software for taxonomy, calculation of diatom indices and inventories management. In Twelfth International Diatom Symposium; Springer: Dordrecht, The Netherlands, 1993; pp. 509–513. [Google Scholar]
  43. Denys, L. A Check-List of the Diatoms in the Holocene Deposits of the Western Belgian Coastal Plain with a Survey of their Apparent Ecological Requirements; Service Geologique de Belgique: Brussels, Belgium, 1991; Volume 1, pp. 1–2. [Google Scholar]
  44. Van Dam, H.; Mertens, A.; Sinkeldam, J. A coded checklist and ecological indicator values of freshwater diatoms from the Netherlands. Neth. J. Aquat. Ecol. 1994, 28, 117–133. [Google Scholar]
  45. Juggins, S. Version 1.0. User Guide. The European Diatom Database; Newcastle University: Newcastle upon Tyne, UK, 2001. [Google Scholar]
  46. Szeroczyńska, K.; Sarmaja-Korjonen, K. Atlas of Subfossil Cladocera from Central and Northern Europe; Friends of Lower Vistula Society: Świecie, Poland, 2007; pp. 1–84. [Google Scholar]
  47. Kurek, J.; Korosi, J.B.; Jeziorski, A.; Smol, J.P. Establishing reliable minimum count sizes for cladoceran subfossils sampled from lake sediments. J. Paleolimnol. 2010, 44, 603–612. [Google Scholar] [CrossRef]
  48. Juggins, S. C2 Version 1.5. User Guide. Software for Ecological and Palaeoecological Data Analysis and Visualisation; Newcastle University: Newcastle upon Tyne, UK, 2007. [Google Scholar]
  49. Flössner, D. Die Haplopoda und Cladocera (ohne Bosminidae) Mitteleuropas; Backhuys Publishers: Leiden, The Netherlands, 2000; p. 428. [Google Scholar]
  50. Brooks, S.J.; Langdon, P.G.; Heiri, O. The Identification and Use of Palaearctic Chironomidae Larvae in Palaeoecology; Quaternary Research Association: Edinburgh, UK, 2007. [Google Scholar]
  51. Luoto, T.P.; Nevalainen, L. Inferring reference conditions of hypolimnetic oxygen for deteriorated Lake Mallusjärvi in the cultural landscape of Mallusjoki, southern Finland using fossil midge assemblages. Water Air Soil Pollut. 2011, 217, 663–675. [Google Scholar] [CrossRef]
  52. Luoto, T.P.; Salonen, V.P. Fossil midge larvae (Diptera: Chironomidae) as quantitative indicators of late-winter hypolimnetic oxygen in southern Finland: A calibration model, case studies and potentialities. Boreal Environ. Res. 2010, 15, 1–18. [Google Scholar]
  53. Meltsov, V.; Poska, A.; Odgaardd, B.V.; Sammula, M.; Kull, T. Palynological richness and pollen sample evenness in relation to local floristic diversity in southern Estonia. Rev. Palaeobot. Palynol. 2011, 166, 344–351. [Google Scholar] [CrossRef]
  54. Stivrins, N.; Kołaczek, P.; Reitalu, T.; Seppä, H.; Veski, S. Phytoplankton response to the environmental and climatic variability in a temperate lake over the last 14,500 years in eastern Latvia. J. Paleolimnol. 2015, 54, 103–119. [Google Scholar] [CrossRef]
  55. Schindler, D.W. The Dilemma of Controlling Cultural Eutrophication of Lakes. Proc. R. Soc. B 2012, 279, 4322–4333. [Google Scholar] [CrossRef] [PubMed] [Green Version]
  56. Lampert, W.; Sommer, U. Limnoecology; Oxford University Press: Oxford, UK, 1997; pp. 1–382. [Google Scholar]
  57. Schindler, D.W. Recent advances in the understanding and management of eutrophication. Limnol. Oceanogr. 2006, 51, 356–363. [Google Scholar] [CrossRef] [Green Version]
  58. Leira, M.; Cantonati, M. Effects of water-level fluctuations on lakes: An annotated bibliography. Hydrobiologia 2008, 613, 171–184. [Google Scholar] [CrossRef]
  59. Koralay, N.; Kara, O. Effects of Soil Erosion on Water Quality and Aquatic Ecosystem in a Watershed. In Proceedings of the 1st International Congress on Agricultural Structures and Irrigation, Antalya, Turkey, 26–28 September 2018; pp. 20–29. [Google Scholar]
  60. Kuptsch, P. Die Cladoceren der Umgegend von Riga. Arch. Hydrobiol. 1927, 18, 273–315. [Google Scholar]
  61. Hakkari, L. Zooplankton species as indicators of environment. Aqua Fenn. 1972, 1, 46–54. [Google Scholar]
  62. Lyche, A. Cluster analysis of plankton community structure in 21 lakes along a gradient of trophy. Verh. Internat. Verein Limnol. 1990, 24, 586–591. [Google Scholar] [CrossRef]
  63. Urtane, L. Cladocera as indicators of lake types and trophic state in Latvian lakes. Ph.D. Thesis, University of Latvia, Riga, Latvia, 1998. [Google Scholar]
  64. Walseng, B.; Halvorsen, G. Littoral microcrustaceans as indices of trophy. Verh. Internat. Verein Limnol. 2005, 29, 827–829. [Google Scholar] [CrossRef]
  65. Jensen, T.C.; Dimante-Deimantovica, I.; Schartau, A.K.; Walseng, B. Cladocerans respond to differences in trophic state in deeper nutrient poor lakes from Southern Norway. Hydrobiologia 2013, 715, 101–112. [Google Scholar] [CrossRef]
  66. Umja Ezera Dabas Aizsardzības Plāns. Available online: https://www.daba.gov.lv/upload/File/DAPi_apstiprin/DL_Ummis-06.pdf (accessed on 20 March 2020).
  67. Susko, U.; Latvian Fund for Nature, Riga, Latvia. Personal communication, 2020.
  68. Sloka, N. Latvijas PSR Dzīvnieku Noteicējs. Latvijas Kladoceru (Cladocera) Fauna un Noteicējs; P. Stučkas Latvijas valsts universitāte: Rīga, Latvia, 1981; p. 146. [Google Scholar]
  69. Eutrophication of Waters, Monitoring, Assessment and Control; OECD (Organisation for Economic Cooperation and Development): Paris, France, 1982.
  70. Andrén, E. Changes in the Composition of the Diatom Flora During the Last Century Indicate Increased Eutrophication of the Oder Estuary, South-western Baltic Sea. Estuar. Coast. Shelf Sci. 1999, 48, 665–676. [Google Scholar] [CrossRef]
  71. Andrén, E.; Clarke, A.L.; Telford, R.J.; Wesckström, K.; Vilbaste, S.; Aigars, J.; Conley, D.; Johnsen, T.; Juggins, S.; Korhola, A. Defining Reference Conditions for Coastal Areas in the Baltic Sea; TemaNord Series; Nordic Council of Ministers: Copenhagen, Denmark, 2007. [Google Scholar]
  72. Andrén, E.; Shimmield, G.; Brand, T. Environmental changes of the last three centuries indicated by siliceous microfossil records from the southwestern Baltic Sea. Holocene 1999, 9, 25–38. [Google Scholar] [CrossRef]
  73. Weckström, K. Assessing recent eutrophication in coastal waters of the Gulf of Finland (Baltic Sea) using subfossil diatoms. J. Paleolimnol. 2006, 35, 571–592. [Google Scholar] [CrossRef]
  74. Milecka, K.; Bogaczewicz-Adamczak, B. Zmiany żyzności trofii w ekosystemach miękkowodnych jezior Borów Tucholskich. Przegl. Geol 2006, 54, 81–86. [Google Scholar]
  75. Christensen, K.K.; Sand-Jensen, K. Precipitated iron and manganese plaques restrict root uptake of phosphorus in Lobelia dortmanna. Can. J. Bot. 1998, 76, 2158–2163. [Google Scholar]
  76. Battarbee, R.W.; Simpson, G.L.; Shilland, E.M.; Flower, R.J.; Kreiser, A.; Yang, H.; Clarke, G. Recovery of UK lakes from acidification: An assessment using combined palaeoecological and contemporary diatom assemblage data. Ecol. Indic. 2014, 37, 365–380. [Google Scholar] [CrossRef]
  77. Battarbee, R.W.; Jones, V.J.; Flower, R.J.; Cameron, N.G.; Bennion, H.; Carvalho, L.; Juggins, S. Diatoms. In Tracking Environmental Change Using Lake Sediments. Terrestrial, Algal, and Siliceous Indicators; Smol, J.P., Birks, H.J.B., Last, W.M., Eds.; Kluwier Academic Publishers: Norwell, MA, USA, 2001; Volume 3, pp. 155–202. [Google Scholar]
  78. Battarbee, R.W.; Charles, D.F.; Dixit, S.S.; Renberg, I. Diatoms as indicators of surface water acidity. In The Diatoms: Applications for the Environmental and Earth Sciences; Stoermer, E.F., Smol, J.P., Eds.; Cambridge University Press: Cambridge, UK, 1999; pp. 85–127. [Google Scholar]
  79. Battarbee, R.W.; Charles, D.F. Diatom-based pH reconstruction studies of acid lakes in Europe and North America: A synthesis. Water Air Soil Pollut. 1986, 30, 347–354. [Google Scholar] [CrossRef]
  80. Klavins, M.; Kokorite, I.; Jankevica, M.; Mazeika, J.; Rodinov, V. Trace elements in sediments of lakes in Latvia. In Proceedings of the 4th WSEAS International Conference on Energy and Development—Environment—Biomedicine, Corfu Island, Greece, 14–16 July 2011. [Google Scholar]
  81. Kļaviņš, M.; Briede, A.; Kļaviņa, I.; Rodinov, V. Metals in sediments of lakes in Latvia. Environ. Int. 1995, 21, 451–458. [Google Scholar] [CrossRef]
  82. Liiv, M.; Alliksaar, T.; Amon, L.; Freiberg, R.; Heinsalu, A.; Reitalu, T.; Saarse, L.; Seppä, H.; Stivrins, N.; Tõnno, I.; et al. Late glacial and early Holocene climate and environmental changes in the eastern Baltic area inferred from sediment C/N ratio. J. Paleolimnol. 2019, 61, 1–16. [Google Scholar] [CrossRef]
  83. Terasmaa, J.; Puusepp, L.; Marzecová, A.; Vandel, E.; Vaasma, T.; Koff, T. Natural and human-induced environmental changes in Eastern Europe during the Holocene: A multi-proxy palaeolimnological study of a small Latvian lake in a humid temperate zone. J. Paleolimnol. 2013, 49, 663–678. [Google Scholar] [CrossRef]
  84. Meyers, P.A.; Ishiwatari, R. Lacustrine organic geochemistry—An overview of indicators of organic matter sources and diagenesis in lake sediments. Org. Geochem. 1993, 20, 867–900. [Google Scholar] [CrossRef] [Green Version]
  85. Meyers, P.A.; Teranes, J.L. Sediment Organic Matter. In Tracking Environmental Change Using Lake Sediments: Physical and Geochemical Methods, Developments in Paleoenvironmental Research; Last, W.M., Smol, J.P., Eds.; Springer: Dordrecht, The Netherlands, 2001; pp. 239–269. [Google Scholar]
  86. Buzajevs, V.; Levina, N.; Levins, I. Pazemes ūdeņu bilance un kvalitāte Baltezera ūdensgūtnēs; Valsts Ģeoloģijas Dienests: Riga, Latvia, 1997; pp. 1–56. [Google Scholar]
  87. Sarmaja-Korjonen, K. Correlation of fluctuations in cladoceran planktonic: Littoral ratio between three cores from a small lake in southern Finland: Holocene water-level changes. Holocene 2001, 11, 53–63. [Google Scholar] [CrossRef]
  88. Cooper, J.T.; Steinitz-Kannan, M.; Kallmeyer, D.E. Bacillariophyta: The Diatoms. In Algae: Source of Treatment; Ripley, M.G., Ed.; American Water Works Association: Denver, CO, USA, 2010; pp. 207–215. [Google Scholar]
  89. Zelnik, I.; Balanč, T.; Toman, M. Diversity and Structure of the Tychoplankton Diatom Community in the Limnocrene Spring Zelenci (Slovenia) in Relation to Environmental Factors. Water 2018, 10, 361. [Google Scholar] [CrossRef] [Green Version]
  90. Dimante-Deimantovica, I.; Latvian Institute of Aquatic Ecology, Riga, Latvia. Personal communication, 2020.
  91. Ardiles, V.; Alcocer, J.; Vilaclara, G.; Oseguera, L.A.; Velasco, L. Diatom fluxes in a tropical, oligotrophic lake dominated by large-sized phytoplankton. Hydrobiologia 2012, 679, 77–90. [Google Scholar] [CrossRef]
  92. Romero, O.E.; Thunell, R.C.; Astor, Y.; Varela, R. Seasonal and interannual dynamics in diatom production in the Cariaco Basin, Venezuela. Deep-Sea Res. 2009, 56, 571–581. [Google Scholar] [CrossRef]
  93. Ryves, D.B.; Jewson, D.H.; Sturm, M.; Battarbee, R.W.; Flower, R.J.; Mackay, A.W.; Granin, N.G. Quantitative and qualitative relationships between planktonic diatom communities and diatom assemblages in sedimenting material and surface sediments in Lake Baikal, Siberia. Limnol. Oceanogr. 2003, 48, 1643–1661. [Google Scholar] [CrossRef] [Green Version]
  94. Ceirans, A. Zooplankton indicators of trophy in Latvian lakes. In Acta Universitatis Latviensis. Biology; University of Latvia: Riga, Latvia, 2007; Volume 723, pp. 61–69. [Google Scholar]
  95. Veski, S.; Amon, L.; Heinsalu, A.; Reitalu, T.; Saarse, L.; Stivrins, N.; Vassiljev, J. Lateglacial vegetation dynamics in the eastern Baltic region between 14,500 and 11,400 cal yr BP: A complete record since the Bolling (GI-1e) to the Holocene. Quat. Sci. Rev. 2012, 40, 39–53. [Google Scholar] [CrossRef]
  96. Kołaczek, P.; Zubek, S.; Błaszkowski, J.; Mleczko, P.; Włodzimierz, M. Erosion or plant succession—How to interpret the presence of arbuscular mycorrhizal fungi (Glomeromycota) spores in pollen profiles collected from mires. Rev. Palaeobot. Palynol. 2013, 189, 29–37. [Google Scholar] [CrossRef]
  97. Wang, L.; Mackay, A.W.; Leng, M.J.; Rioual, P.; Panizzo, V.N.; Lu, H.; Gu, Z.; Chu, G.; Han, J.; Kendrick, C.P. Influence of the ratio of planktonic to benthic diatoms on lacustrine organic matter δ13C from Erlongwan maar lake, northeast China. Org. Geochem. 2013, 54, 62–68. [Google Scholar] [CrossRef] [Green Version]
  98. Wolin, J.A.; Stone, J.R. Diatoms as Indicators of Water-Level Change in Freshwater Lakes. In The Diatoms Applications to the Environmental and Earth Sciences; Stoermer, E.F., Smol, J.P., Eds.; Cambridge University Press: Cambridge, UK, 2010; pp. 174–185. [Google Scholar]
  99. Carmignani, J.R.; Roy, A.H. Ecological impacts of winter water level drawdowns on lake littoral zones: A review. Aquat. Sci. 2017, 79, 803–824. [Google Scholar] [CrossRef] [Green Version]
  100. Magny, M.; Arnaud, F.; Billaud, Y.; Marguet, A. Lake-level fluctuations at Lake Bourget (eastern France) around 4500–3500 cal. a BP and their palaeoclimatic and archaeological implications. J. Quat. Sci. 2012, 27, 494–502. [Google Scholar] [CrossRef]
  101. Theuerkauf, E.J.; Braun, K.N.; Nelson, D.M.; Kaplan, M.; Vivirito, S.; Williams, J.D. Coastal geomorphic response to seasonal water-level rise in the Laurentian Great Lakes: An example from Illinois Beach State Park, USA. J. Great Lakes Res. 2019, 45, 1055–1068. [Google Scholar] [CrossRef]
  102. Holmer, M.; Storkholm, P. Sulphate reduction and sulphur cycling in lake sediments: A review. Freshw. Biol. 2001, 46, 431–451. [Google Scholar] [CrossRef]
  103. Couture, R.M.; Fischer, R.; Van Cappellen, P.; Gobeil, C. Non-steady state diagenesis of organic and inorganic sulfur in lake sediments. Geochim. Cosmochim. Acta 2016, 194, 15–33. [Google Scholar] [CrossRef] [Green Version]
  104. Aasif, A.; Nilli, A.; Aasif, L.; Hema, A.; Rayees, S. Diatom Diversity and Organic Matter Sources in Water Bodies around Chennai, Tamil Nadu, India. MOJ Ecol. Environ. Sci. 2017, 2, 141–146. [Google Scholar]
  105. Rosińska, A.; Rakocz, K. Rola biodegradowalnej materii organicznej w procesie dezynfekcji wody. Inż. Ochr. Środ. 2013, 16, 511–521. [Google Scholar]
  106. Brodersen, K.P.; Quinlan, R. Midges as palaeoindicators of lake productivity, eutrophication and hypolimnetic oxygen. Quat. Sci. 2006, 25, 1995–2012. [Google Scholar] [CrossRef]
  107. Timrots, P.; Riga Water Supply Museum, Riga, Latvia. Personal communication, 2019.
  108. Brodersen, K.P.; Pedersen, O.; Lindegaard, C.; Hamburger, K. Chironomids (Diptera) and oxy-regulatory capacity: An experimental approach to paleolimnological interpretation. Limnol. Oceanogr. 2004, 49, 1549–1559. [Google Scholar]
  109. Kacalova, O.; Laganovsla, R. Zivju Barības Bāze Latvijas PSR Ezeros; Latvijas PSR Zinātņu akadēmijas izdevniecība: Rīga, Latvija, 1961; pp. 17–23. [Google Scholar]
  110. Bledzki, L.A.; Rybak, J.I. Freshwater Crustacean Zooplankton of Europe Cladocera and Copepoda (Calanoida, Cyclopoida), Key to Species Identification, with Notes on Ecology, Distribution, Methods and Introduction to Data Analysis; Springer: New York, NY, USA, 2016; pp. 1–918. [Google Scholar]
  111. Lielā un Mazā Baltezera Eitroficēšanās Izpēte. Available online: https://www.google.com/url?sa=t&rct=j&q=&esrc=s&source=web&cd=1&ved=2ahUKEwiPufXQp7_oAhXpxIsKHfMmDOcQFjAAegQIBRAB&url=https%3A%2F%2Fwww.ezeri.lv%2Fblog%2FDownloadAttachment%3Fid%3D347&usg=AOvVaw1qjWh6fVLl6-JGxc-_EbzG (accessed on 10 March 2020).
  112. Balode, M.; Purina, I.; Strake, S.; Purvina, S.; Pfeifere, M.; Barda, I.; Povidisa, K. Toxic cyanobacteria in the lakes located in Rīga (the capital of Latvia) and its surroundings: Present state of knowledge. Afr. J. Mar. Sci. 2006, 28, 225–230. [Google Scholar] [CrossRef]
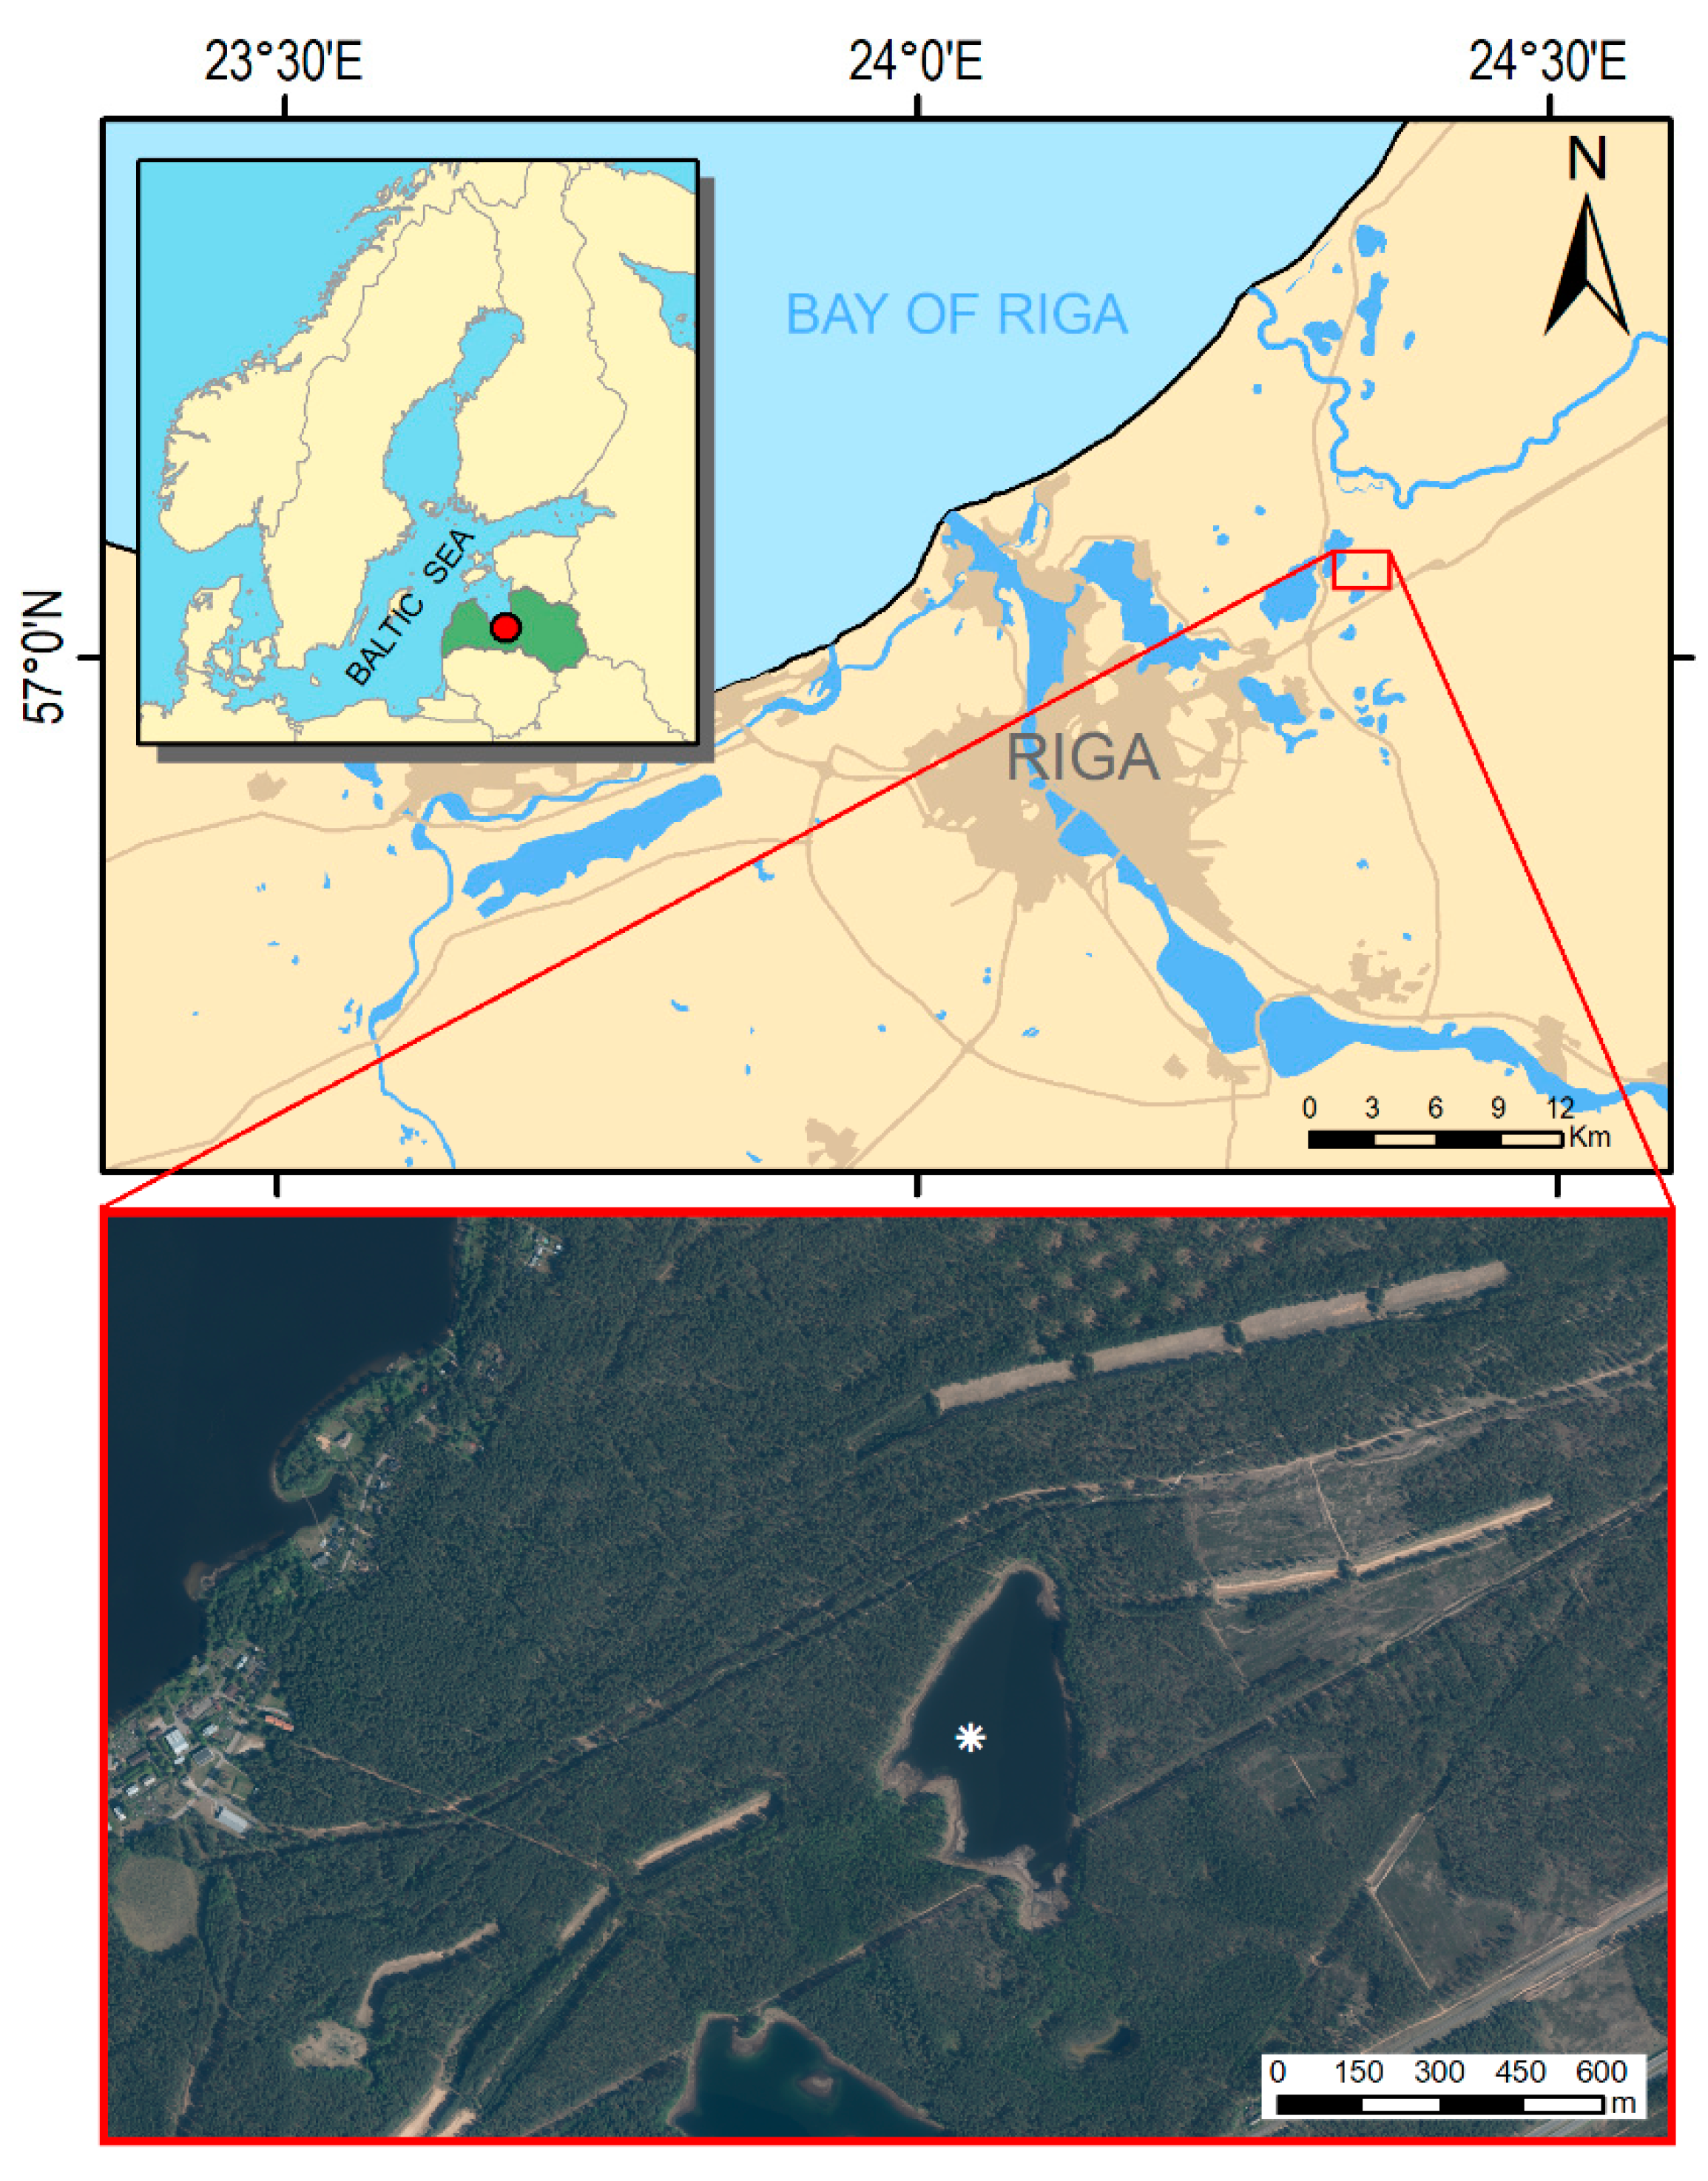
Figure 1. Lake Sekšu location on map. Asterisk indicates deepest part of the lake where sampling occurred.
Water 12 01459 g001
Figure 2. Downcore distribution of 137Cs and 210Pb activities as well as spheroidal carbonaceous particles (SCP) concentrations in the Lake Sekšu topmost sediments. The grey shaded area on the caesium diagram indicates time period 1956–1965 CE.
Water 12 01459 g002
Figure 3. Lake Sekšu age depth model. The black solid line shows the weighted mean ages of all depths, whereas the grey area indicates a reconstructed 95% chronological uncertainty band. Dates of 210Pb (pale blue boxes) and spheroidal carbonaceous particles (electric blue boxes) with their error margin and associated age-depth model uncertainties are displayed.
Water 12 01459 g003
Figure 4. Lake Sekšu Sediment composition: minerogenic matter (MM), organic matter (OM), carbonate matter (CM), C/N expressed as atomic ratio, sulfur (S), carbon (TC), nitrogen (TN), and the division in two zones based on major changes in sedimentary composition.
Water 12 01459 g004
Figure 5. Pollen and non-pollen palynomorphs of Lake Sekšu. Trees, shrubs, herbs, crops, ruderal plants, bryophytes, and water plants expressed in percentages. Non-pollen palynomorphs and charcoal expressed as microscopic object accumulation rate cm−2 year−1. Grey shaded areas indicate ×10 time exaggeration to underline the presence of microscopic remains.
Water 12 01459 g005
Figure 6. Selection of pollen and non-pollen palynomorphs, from the left: arboreal pollen (%), cultivated plant pollen (%), secale-cereale pollen (cm−2 yr−1), Isoëtes lacustris (%), charcoal particles (cm−2yr−1), fungi hyphae remains (cm−2yr−1), and corroded pollen grains and spores (cm−2 yr−1). The presence of whipworm in the sample is marked with a red circle, the presence of herbivores with black squares and the presence of Glomus spores indicating erosion with grey squares.
Water 12 01459 g006
Figure 7. Relative abundance of the diatom group in Lake Sekšu according to habitat category (lifeform), pH, OM contamination (saprobic), and trophy preference.
Water 12 01459 g007
Figure 8. Relative abundance of dominant diatom species in Lake Sekšu (species with values >2%).
Water 12 01459 g008
Figure 9. Relative abundance of the Cladocera species in Lake Sekšu.
Water 12 01459 g009
Figure 10. Relative abundance of Chironomidae in Lake Sekšu sediment.
Water 12 01459 g010
Figure 11. Comparison of indicators used to reconstruct trophic state changes: chironomid-inferred hypolimnetic oxygen reconstruction (O2) mg L−1, diatom-inferred total phosphorus reconstruction (TP) µg L−1, total diatom flux (frustules × 106 /cm2/yr−1), Cladocera based eutrophy indicators, and water-level changes indicators, such as the euplanktonic diatoms (%) and pelagic (P) to littoral (L) Cladocera species ratio (%).
Water 12 01459 g011