1. Introduction
Soil is a precious natural resource that covers Earth’s land surfaces, and it contributes to basic human needs like food, clean water, and clean air, as well as being a major carrier for biodiversity. There have been antecedents (from 3500 B.C to 17th century) of soil knowledge and its relationship with human practices before soil scientific studies. Soil is an integrated discipline within soil sciences, geography, and land management, and it was developed in parallel with agriculture [
1,
2]. In the globalized world of the 21st century, soil sustainability depends not only on management choices by farmers, foresters, and land planners but also on political decisions on rules and regulations; it also requires a large effort of awareness raising and the communication of issues related to the degradation of soils and land by scientists, civil society organizations, and policy makers [
3]. Estimations have shown that worldwide, 75% of land is degraded due to physical, chemical, and biological processes [
4]. Soil erosion has a severe impact on the degradation of quality fertile topsoil. Worldwide, soil erosion losses are the highest in the agro-ecosystems of Asia, Africa, and South America, averaging 30–40 t ha
−1 year
−1, and it is the lowest in the United States, Europe, and Australia, averaging 5–20 t ha
−1 year
−1 [
5,
6]. The multifunctional use of land is needed within the boundaries of the soil–water system to achieve land degradation neutrality, avoid further land degradation, and promote land restoration [
7]. Keesstra et al. [
7] introduced four concepts (systems thinking, connectivity, nature-based solutions, and regenerative economics) in a more integrated way to accomplish land degradation neutrality in an effort to achieve the soil-related Sustainable Development Goals (SDGs). A robust soil–water system is essential to achieve interlinked SDGs through smart planning based on a socio–economical–ecological systems analysis [
3,
7].
Agricultural land degradation in rainfed mountainous areas is a major onsite problem (the removal of top soil) that also causes offsite effects, such as downstream sediment deposition in fields, floodplains, and water bodies. The costliest offsite damages occur when the soil particles enter lakes or river systems [
8,
9]. Annual soil loss in the middle Yellow River basin of China amounts to 3700 t km
−2, the largest sediment-carrying river in the world [
10]. The world’s 13 large rivers carry 5.8 billion tons of sediments to reservoirs every year [
11]. The Indus River in Pakistan ranks third in the world, with an annual sediment load of 435 million tons in the Tarbela dam, which has lost about 35% of initial reservoir capacity (11,600 Mm
3) [
12]. Water and soil are the most crucial natural resources for agriculture and livestock production. Globally, water resource deterioration caused by soil erosion is a growing concern. An estimated productivity loss of US
$13–28 billion annually in drylands can be attributed to soil erosion as well [
13].
In Pakistan, dryland farming is practiced on 12 Mha of the Pothwar Plateau, the northern mountains, and the northeastern plains. Soil erosion is a severe problem due to erratic rainfall, varied soil slopes, and land use. A lot of land has been converted into gullies that are difficult to restore. Different studies related to soil erosion severity have been conducted in the Pothwar region. Hussain et al. evaluated the soil erosion parameters and estimated the annual sediment loss in small watersheds of the Dhrabi River using the Soil and Water Assessment Tool (SWAT) model. The annual sediment yield ranged from 2.6 to 31.1 t hm
−2 for the non-terraced catchments, while it ranged from 0.52 to 10.10 t hm
−2 for the terraced catchments [
14]. Iqbal et al. studied runoff plots in the Dhrabi watershed in Chakwal Pakistan; cultivated slopes produced the highest soil loss (8.96 Mg ha
−1) annually compared to both undisturbed gentle and steep slopes at approximately 2.08 and 4.66 Mg ha
−1 [
15].
Nasir et al. applied the Revised Universal Soil Loss Equation (RUSLE) and a Geographic Information System (GIS) at the small mountainous watershed of Rawal Lake near Islamabad. The predicted annual soil loss ranged from 0.1 to 28 t ha
−1 [
11]. Similarly, Ahmad et al. reported annual soil loss rates of 17–41 t ha
−1 under fallow conditions, as well as an annual rate of 9–26 t ha
−1 under vegetative cover in the Fateh Jang watershed with a slope of 1–10% [
16]. Saleem et al. assessed the annual soil erosion (70–208 t ha
−1) of the Pothwar region using the RUSLE model integrated with a GIS [
17]. Bashir et al. estimated the soil erosion risk using the Coordination of Information on the Environment (CORINE) model in the Rawal watershed. The annual soil loss ranged between 24 and 28 t ha
−1, with a high erosion risk (26%) in areas with steep slopes and low vegetative cover [
18].
The highest estimated record of soil erosion was 150–165 t ha
−1 year
−1 in the Dhrabi watershed of the Pothwar region [
12]. Nabi et al. reported that in the Soan watershed of Pothwar, the soil loss rates in barren and shrub land were 63.41 and 53.41 t ha
−1 year
−1, respectively, whereas those in low and high cropping intensity land were 34.91 and 25.89 t ha
−1 year
−1, respectively [
19]. Vegetation cover on sloped ground helps to reduce soil loss; however, during field preparation and cultivation, surface soil becomes pulverized and easily eroded, causing acute topsoil erosion due to the removal of vegetation cover. Therefore, during the cultivation of sloping land, measures should be adopted to stop fertile surface soil loss caused by substantial rainfall–runoff. If such measures are not applied, agricultural land may turn barren in only a few years. Vegetation cover is a key measure for soil protection against water erosion; it reduces the flow velocity of surface runoff by increasing surface roughness, in addition to increasing the infiltration rate of soil [
20,
21,
22].
Considerable increase in sediment yield at the expense of soil development poses a major threat to soil and water resource development. Though water erosion is a function of many environmental factors, its assessment and mitigation at the watershed level are complex phenomena; this is due to the unpredictable nature of rainfall and topographic heterogeneities, climate, and land use–land cover variability, as well as other watershed features for the specified areas under study. In addition, inappropriate land management practices and human activities increase the dynamics of these factors.
At present, many models with a broad spectrum of concepts—which are classified as spatially lumped, spatially distributed, empirical, regression, semi-distributed eco-hydrological models, and factorial scoring models—are in use for modelling the rainfall–runoff–soil erosion and sediment transport processes at different scales [
23]. The empirical models are generally the simplest, limited to the conditions and parameter inputs for which they have been developed. For example, the Universal Soil Loss Equation (USLE) [
24], the Agricultural Non-Point Source Pollution Model (AGNPS) [
25], and the Sediment Delivery Distributed (SEDD) model [
26]. In conceptual models, a watershed is represented by a storage system, such as the SWAT [
27], the Large Scale Catchment Model (LASCAM) [
28], or the European Modeling and Simulation Symposium (EMSS) [
29]. Physics-based models rely on the solution of fundamental physical equations and are used for the quantification of physical processes. Areal Nonpoint Source Watershed Environment Response Simulation (ANSWERS) [
30]; Chemicals, Runoff, and Erosion from Agricultural Management Systems (CREAMS) [
31]; the Watershed Erosion Simulation Program (WESP) [
32]; Système Hydrologique Européen Sediment (SHESED) [
33]; and the European Soil Erosion Model (EUROSEM) [
34] are some examples of physically based erosion and sediment transport models.
This research was conducted in ungauged micro-watersheds of the Chakwal and Attock districts of the Pothwar region. Soil erosion and water loss are extreme hazards in this area due to cultivated highland slopes where timely soil and water conservation strategies and remedial measures are required for sustainable crop productivity. A large number of loose stone structures have been built by public departments and farmers themselves to reduce the soil erosion and moisture conservation upside of these structures. There are few measurement points for rainfall and runoff, and most of the watersheds are ungauged; both of these issues hamper model calibration and validations. The purpose of the study was to evaluate the effectiveness of soil and water conservation structure for soil erosion control using the SWAT model. The calibrated and validated model related to soil erosion was adopted from Hussain et al. [
14], where an experimental setup was used to monitor the soil and water loss from agricultural catchment. The collected data were used to calibrate and validate soil erosion parameters using the SWAT model.
This validated model was further modified for the application of soil and water conservation structures, eventually to be recommended by this study as a strategy to counteract the soil erosion with soil and conservation structures at a broader scale. Several studies related to soil and water conservation intervention were carried out to control soil erosion at the field and sub-watershed scale within the Gumara-Maksegnit watershed in the northern Highlands of Ethiopia [
35,
36,
37], while Melaku et al. predicted the impact of soil and water conservation structures on runoff and erosion processes using the SWAT model [
38]. However, studies on the impacts of soil and water structures on the erosion process at the watershed scale that have used the SWAT model have been limited.
Our study was localized to the micro-watersheds with soil and water conservation structures installed through the cooperative project coordinated by the International Centre for Agricultural Research in the Dry Areas (ICARDA), the Centre of Excellence in Water Resources Engineering, (CEWRE), and the Soil and Water Conservation Research Institute (SAWCRI). To the best of our knowledge, no study has been conducted to evaluate the effectiveness of these structures to control soil erosion in the Pothwar region. The study results may encourage the stakeholders to extend this practice to a larger scale by knowing the quantitative benefits of soil conservation structures. Therefore, the SWAT model was adopted due to the availability of a comprehensive agricultural management database, as well as a reduced time and cost [
39,
40,
41]. In this context, the objective of this work was to evaluate the effectiveness of soil and water conservation structures for soil erosion control using the SWAT model in the micro-watersheds of the Chakwal and Attock districts.
2. Materials and Methods
2.1. Pothwar Region and Study Watersheds Description
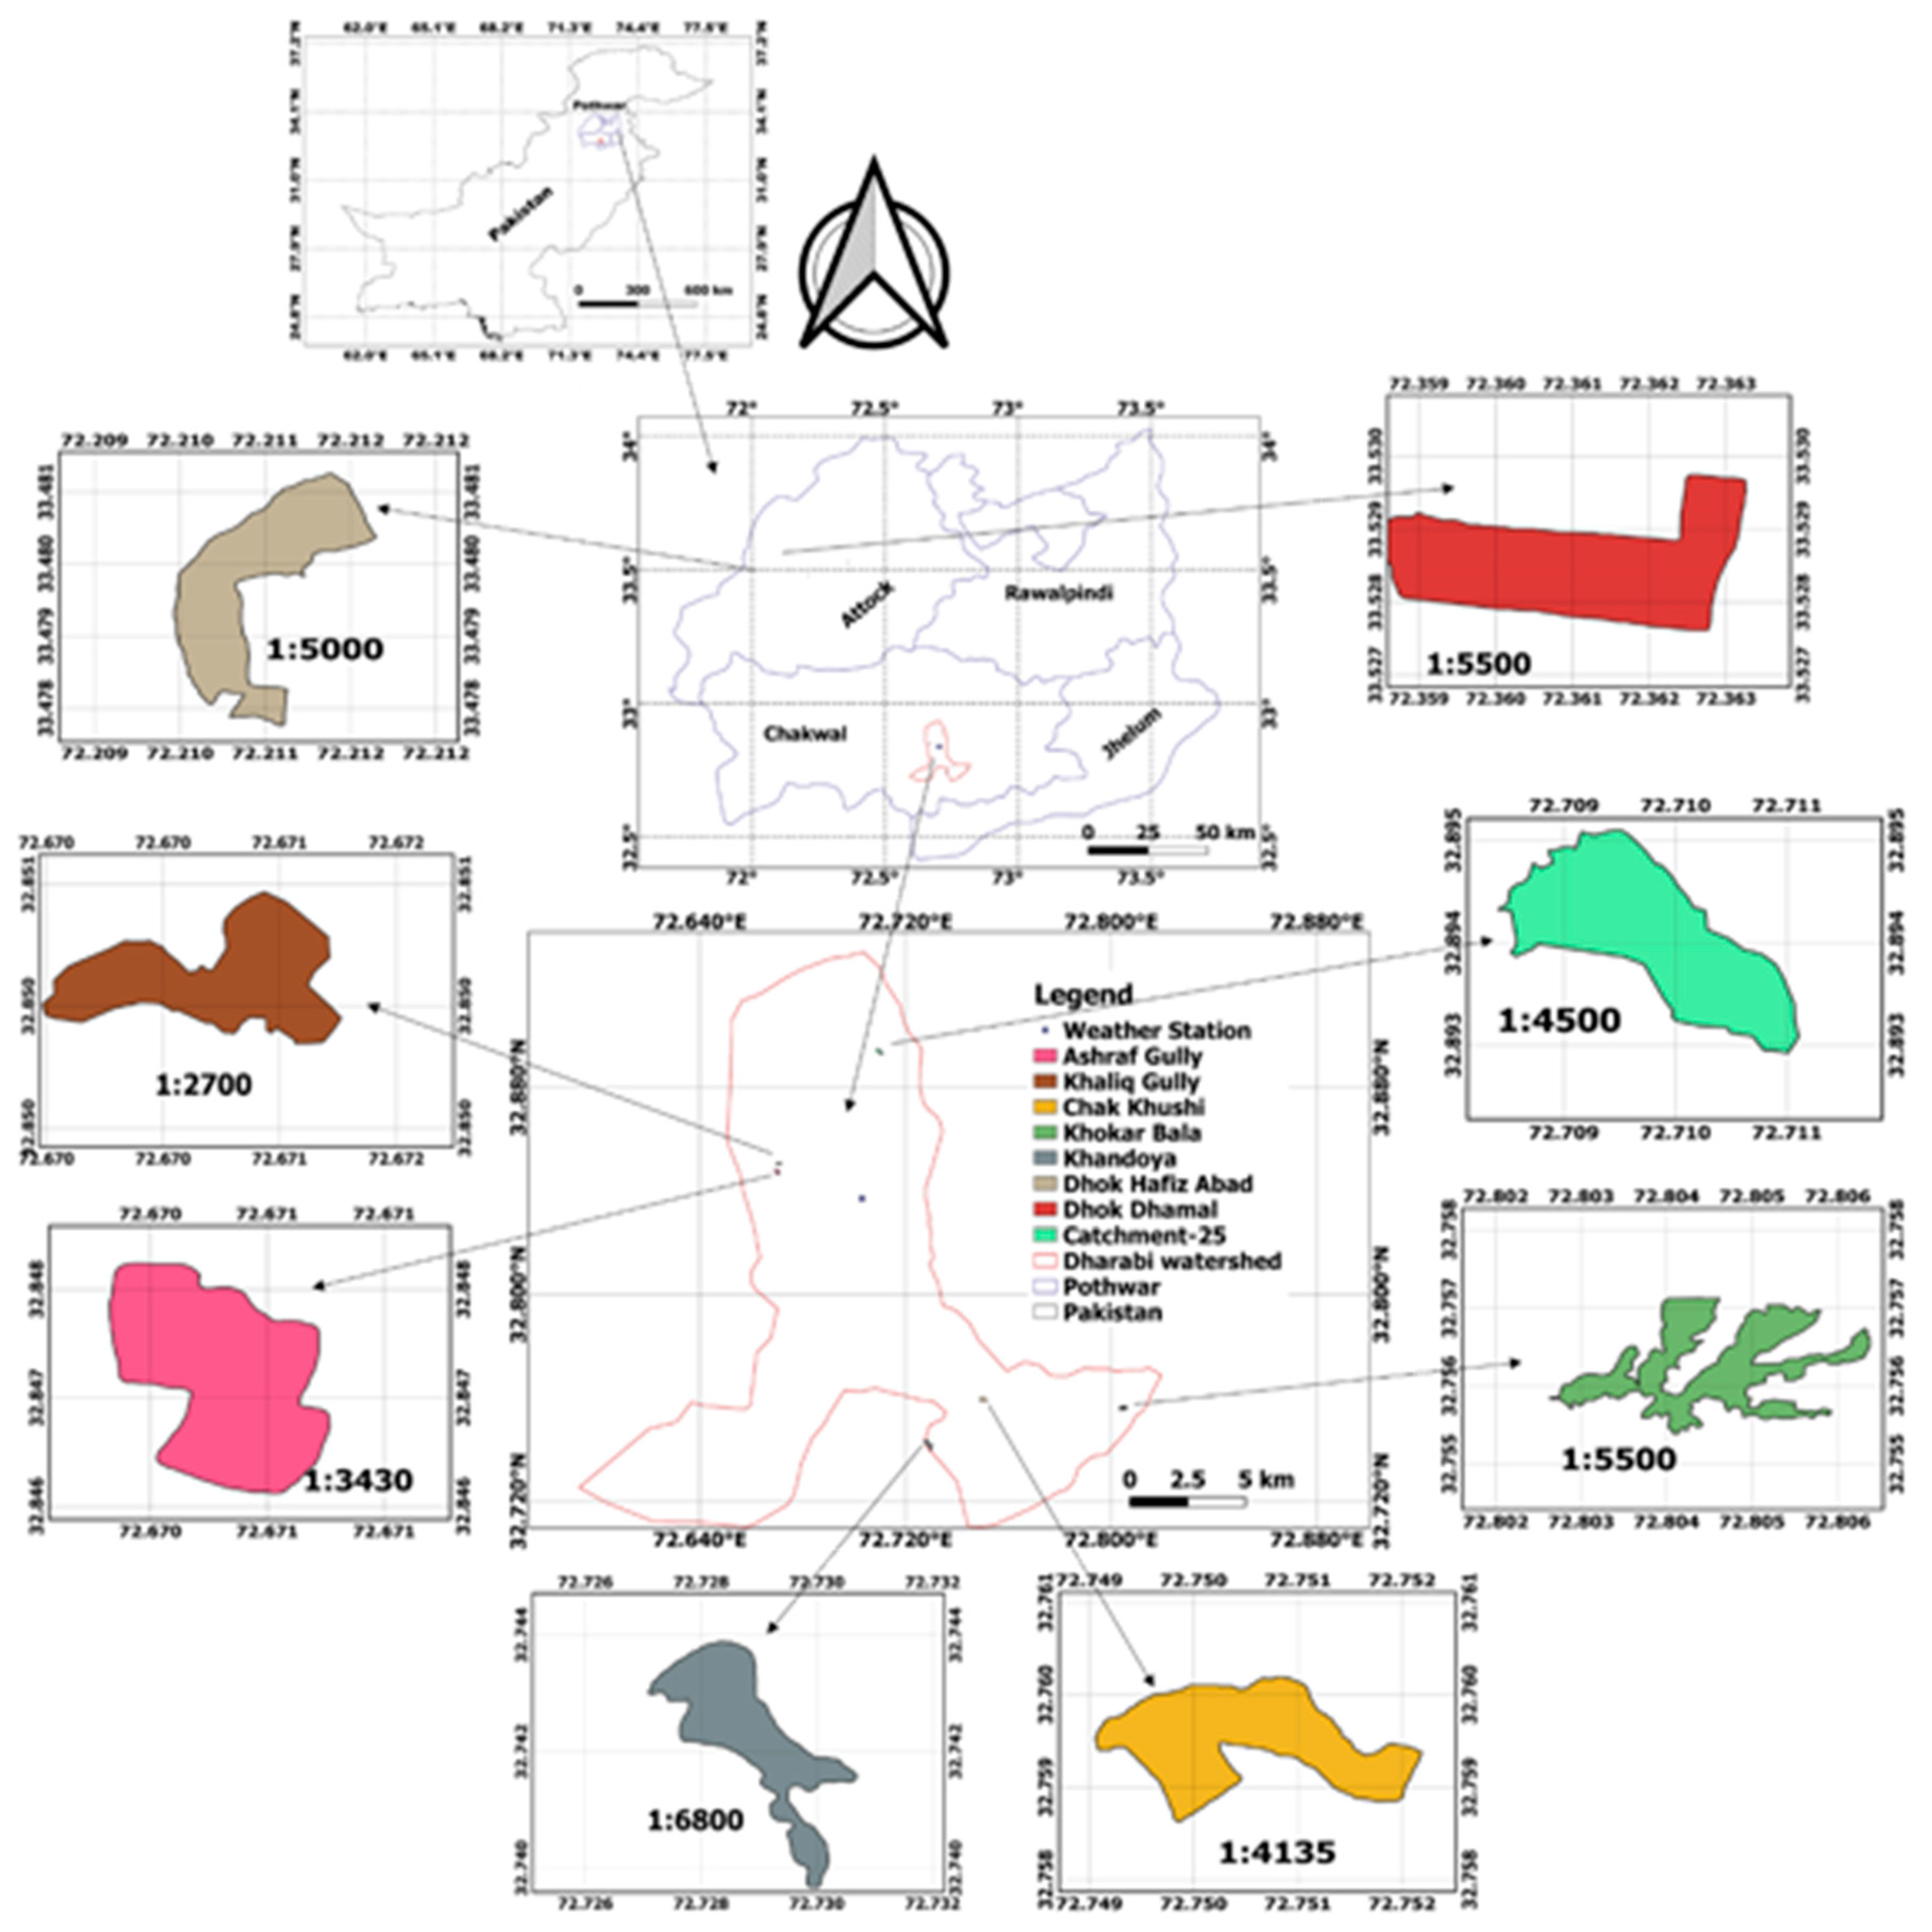
Determining the relationship between rainfall, runoff, and soil erosion was imperative in the Pothwar rainfed region for creating applicable soil and water conservation mechanisms, as well as for enhancing crop productivity. Considering the long-term sustainability and productivity of eroded land, the present study focused on the Chakwal and Attock districts of the Pothwar plateau between 32°30′ and 34° north latitudes and 71°45′ and 73°45′ east longitudes, as shown in
Figure 1. The region has an arid-to-semiarid climate with hot summers and cold winters [
42]. The plateau land comprises broken gullies, low hill ranges, and a flat to gently undulating topography. The textural classification varies from sandy to silt and clay loam, and the land consists of poor-to-fertile soil derived from sandstone and loess parent material [
43].
The rainfall pattern is unpredictable with a high intensity; 60–70% of the total rainfall occurs during the monsoon season (from mid-June to mid-September). The average annual rainfall varies from 250 to 1675 mm, with a decreasing trend from the north to the south. After rainfall, soil crusting decreases the infiltration rate and aeration and increases the soil strength, which reduces plant emergence and exposes the soil surface to erosion [
44]. The soil loss rate becomes relatively high with higher intensity rainfall–runoff over greater slope lengths and steepness levels.
Out of the total 1.82 Mha of the Pothwar region, approximately 0.77 Mha (43%) are cultivated, and the remaining is mostly grazing land. Only 4% of the cultivated area has irrigated agriculture, while the remaining area is under rainfed agriculture [
45]. Rainfall plays an important role in crop production. The principal crops of the area are wheat, maize, bajra, barley, pulses, groundnut, fruits, and vegetables. Without adequate protection, the effects of rainfall–runoff erosion on this highly erodible soil are severe, causing extensive fertile soil loss [
19], endangered soil and water conservation structures, and reservoir depletion through sedimentation. Moreover, this raises doubts regarding the viability of existing and future soil and water conservation schemes.
The high rate of erosion creates a silting problem in the small dams of the Pothwar area. For the sustainable agricultural and socioeconomic development of the region, the government has started various projects for watershed development in the upstream of storage reservoirs, such as the Watershed Management Program by Pakistan’s Water and Power Development Authority (WAPDA).
Similarly, soil and water conservation activities have also been carried out in the Pothwar region for erosion control and land development through a series of Barani area development projects. The application of the loose stone structures project of SAWCRI (Soil and Water Conservation Research Institute, Chakwal) with ICARDA (International Center for Agricultural Research in the Dry Areas) for erosion control resulted in the development of some environmentally friendly and cost-effective resource conservation technologies.
The soil and water conservation structures were installed in small terraced agriculture fields in the Chakwal and Attock districts by the SAWCRI Chakwal department. Seven small sites were selected to evaluate the effectiveness of these structures on soil erosion control. The description of these sites is given in
Table 1, and a location map is shown in
Figure 1. The demarcation of the watershed areas was a challenging task and was performed using a Global Positioning System (GPS) survey. During the survey, the point elevation data at different locations were collected within and at the boundary of the watersheds. Using the elevation data in ArcGIS, we performed a topographic analysis and observed that all the watersheds have a land slope of 2–7% where the crops are grown. The location of the conservation structures was also noted for use with the SWAT model setup.
2.2. Soil and Water Conservation Structures
In the Pothwar region, the terrace land use system and the wide and deep gullies are used for field crop production. The agriculture fields are usually not flat; however, various field terraces are situated at different elevation levels (
Figure 2a). Farmers make earthen embankments (bunds) to retain rainwater and conserve soil moisture. When heavy rainstorms occur, the terrace land use system often fails due to the breaching of the field embankments/bunds. This is mainly caused by the hydraulic shear failure of the soil under saturated conditions. The disturbance of soil organisms can aggravate the impact.
Figure 2b shows such terrace failures, which increase the surface runoff and soil erosion, especially in the Pothwar area.
The moving runoff from higher to lower fields takes not only the fertile topsoil but also essential nutrients and organic matter with it, thereby reducing the productive capacity of soils. If the breached bund is not repaired before next rainy season, it leads to the formation of gullies and renders the area out of plough, a great national loss. Crop yields on such eroded lands are poor, and the livelihood of resource-poor farmers is adversely affected. To reduce this problem, the eroded areas need sustainable rehabilitation to ensure food security in the region. With the collaboration work of SAWCRI and ICARDA, loose stone structures were installed in the upper, middle, and lower parts of terraced watersheds, as shown in
Figure 2c,d.
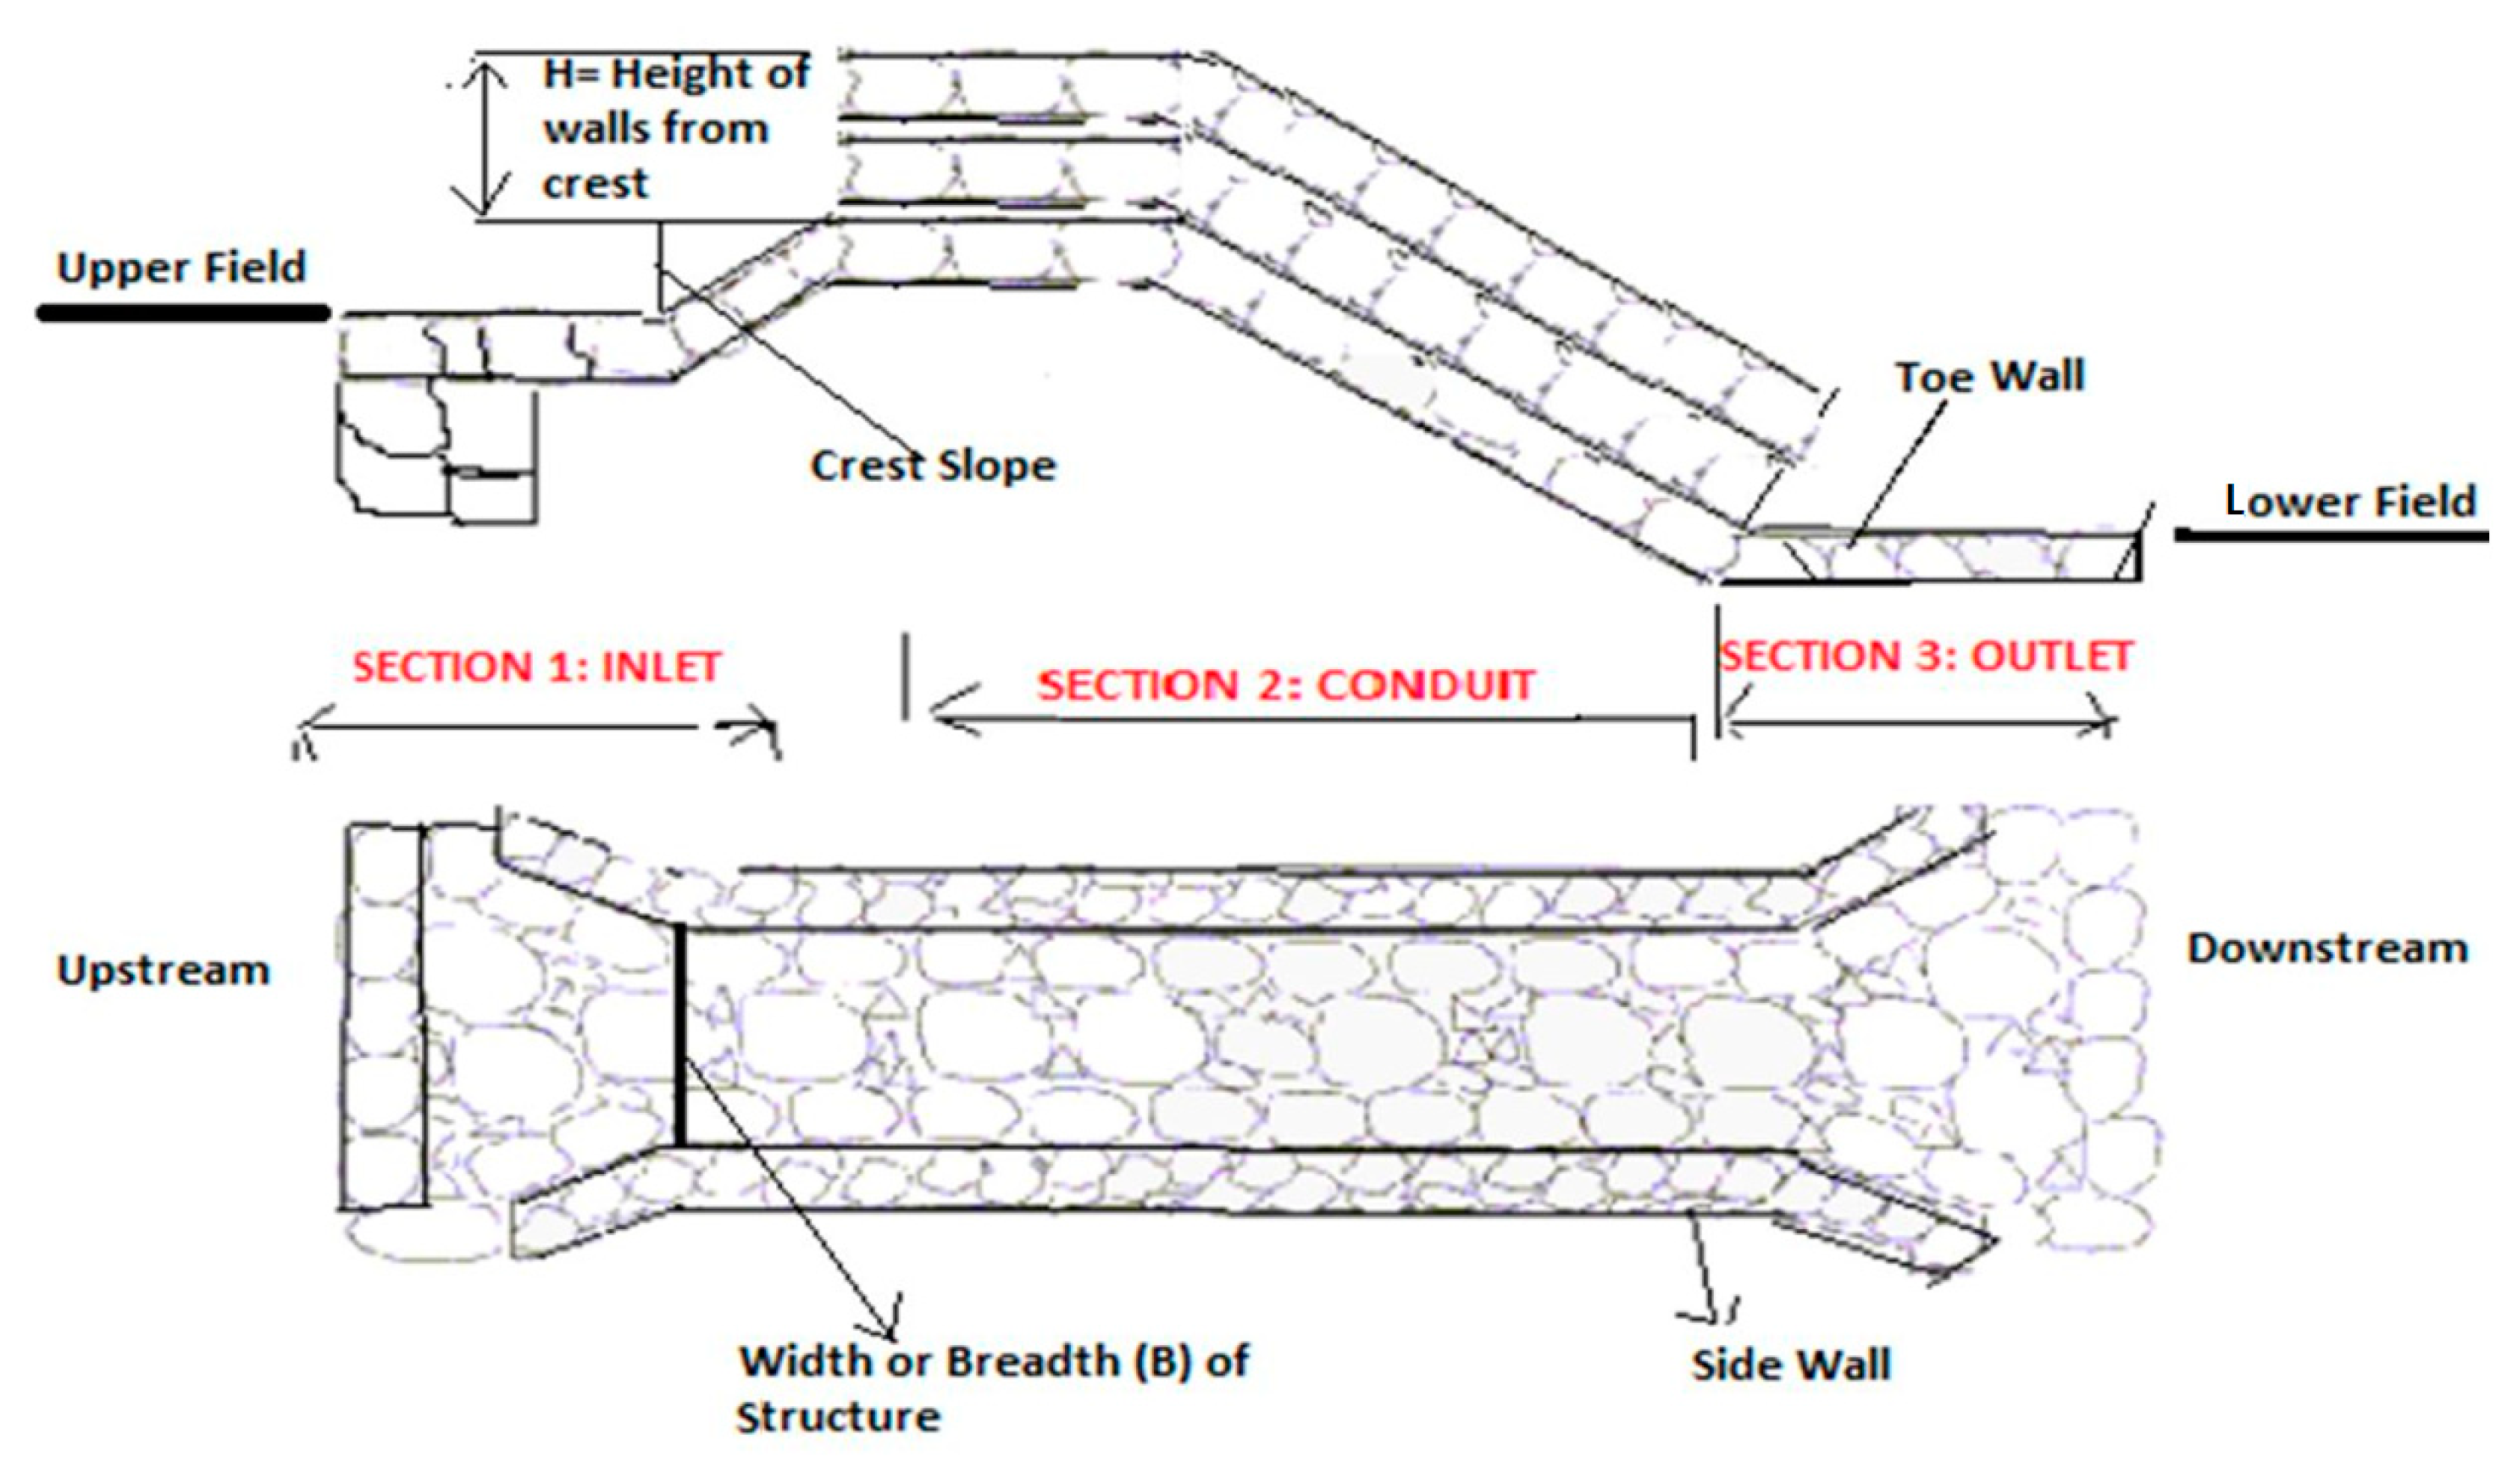
The idea is to retain water in a terrace until a certain rainfall amount (without overflowing the terrace) and then to divert the excess rainfall in a non-erosive way. First, this increases the infiltration and improves the amount of plant-available water; secondly, it reduces soil erosion by reducing the amount and kinetic energy of the flowing water. On average, a water height of approximately 4–6 inches can be held back in the fields. The crest of the structures is kept raised 6–9 inches from the soil surface to encourage in situ rainwater conservation. The height of the sidewalls of a structure should be equal to the height of the field bund/embankment where the structure is to be installed. The cross-section view of these structures is shown in
Figure 3.
2.3. SWAT Model Description
The SWAT model is a semi-distributed, watershed scale, eco–hydrological model that deals with land–soil–water–plant systems [
27]. This model has been tested for a wide variety of watershed and environmental conditions worldwide [
46,
47,
48,
49,
50,
51,
52,
53,
54,
55,
56]. ArcSWAT jointly developed by USDA Agricultural Research Service (USDA-ARS) and Texas A&M AgriLife Research, was used to spatially link multiple model input data, such as watershed topography (digital elevation model (DEM)), soil, land use, land management, and climatic data. During watershed delineation, the entire watershed was divided into different sub-basins. Then, each sub-basin was discretized into a series of hydrologic response units (HRUs) as the smallest computation unit of a SWAT model, which were characterized by homogeneous soil, land use, and slope combinations. The daily climate input data for defined locations were spatially related to the different sub-basins of the model using a nearest neighbor GIS algorithm. The simulated sediment yield for each HRU was then aggregated and processed to sub-basin level results on a daily time step resolution. The surface runoff computation was performed using modified Soil Conservation Service–Curve Number (SCS–CN) method [
57]. Sediment yield levels from each HRU were estimated using the Modified Universal Soil Loss Equation (MUSLE) [
58] written as a mass balance equation as follows:
where SY is the sediment yield (t), Q
surf is the surface runoff (mm ha
−1), q
peak is the peak discharge (m
3 s
−1), and area
hru is the area of the hydrological response unit (ha). K
USLE (0.013 (t.m
2.hr)/(m
3.t.cm)), C
USLE, P
USLE, and LS
USLE are the USLE parameters. CFRG is the coarse fragment factor.
The sediment transport capacity of the stream channel is a direct function of the channel peak velocity, which is used in the SWAT model, as shown in Equation (2):
where
(t m
−3) is the transport capacity of a channel,
v (m s
−1) is the channel peak velocity, and α and b are constant coefficients.
The channel peak velocity was calculated using Manning’s formula in a reach segment, as presented in Equation (3):
where
n is Manning’s roughness coefficient,
(m) is hydraulic radius, and
(m m
−1) is the channel bed slope.
Channel aggradation (
) and channel degradation (
) in tons were computed in the channel segment using the criteria presented in Equations (4) and (5):
where
(t m
−3) is the initial concentration of sediment,
is the channel cover factor,
is the channel erodibility factor, and
(m
3) is the channel segment water volume.
(t) is the total sediment transported out of the channel segment, which was computed using Equation (6):
where
(m
3) is the volume of water leaving the channel segment at each time step,
(t) is the sediment inflow concentration at each time step,
(t) is the channel aggradation,
(t) is channel degradation at each time step, and
(m
3) is volume of channel segment water at each time step.
Soil erosion is a direct function of the slope length and steepness, and it increases due to increases in shear stress. Thus, a major influence of the slope on erosion appears to be exerted through its impact on runoff velocity, and the sediment transport capacity of runoff increases with the increasing flow velocity.
2.4. SWAT Model Input and Setup
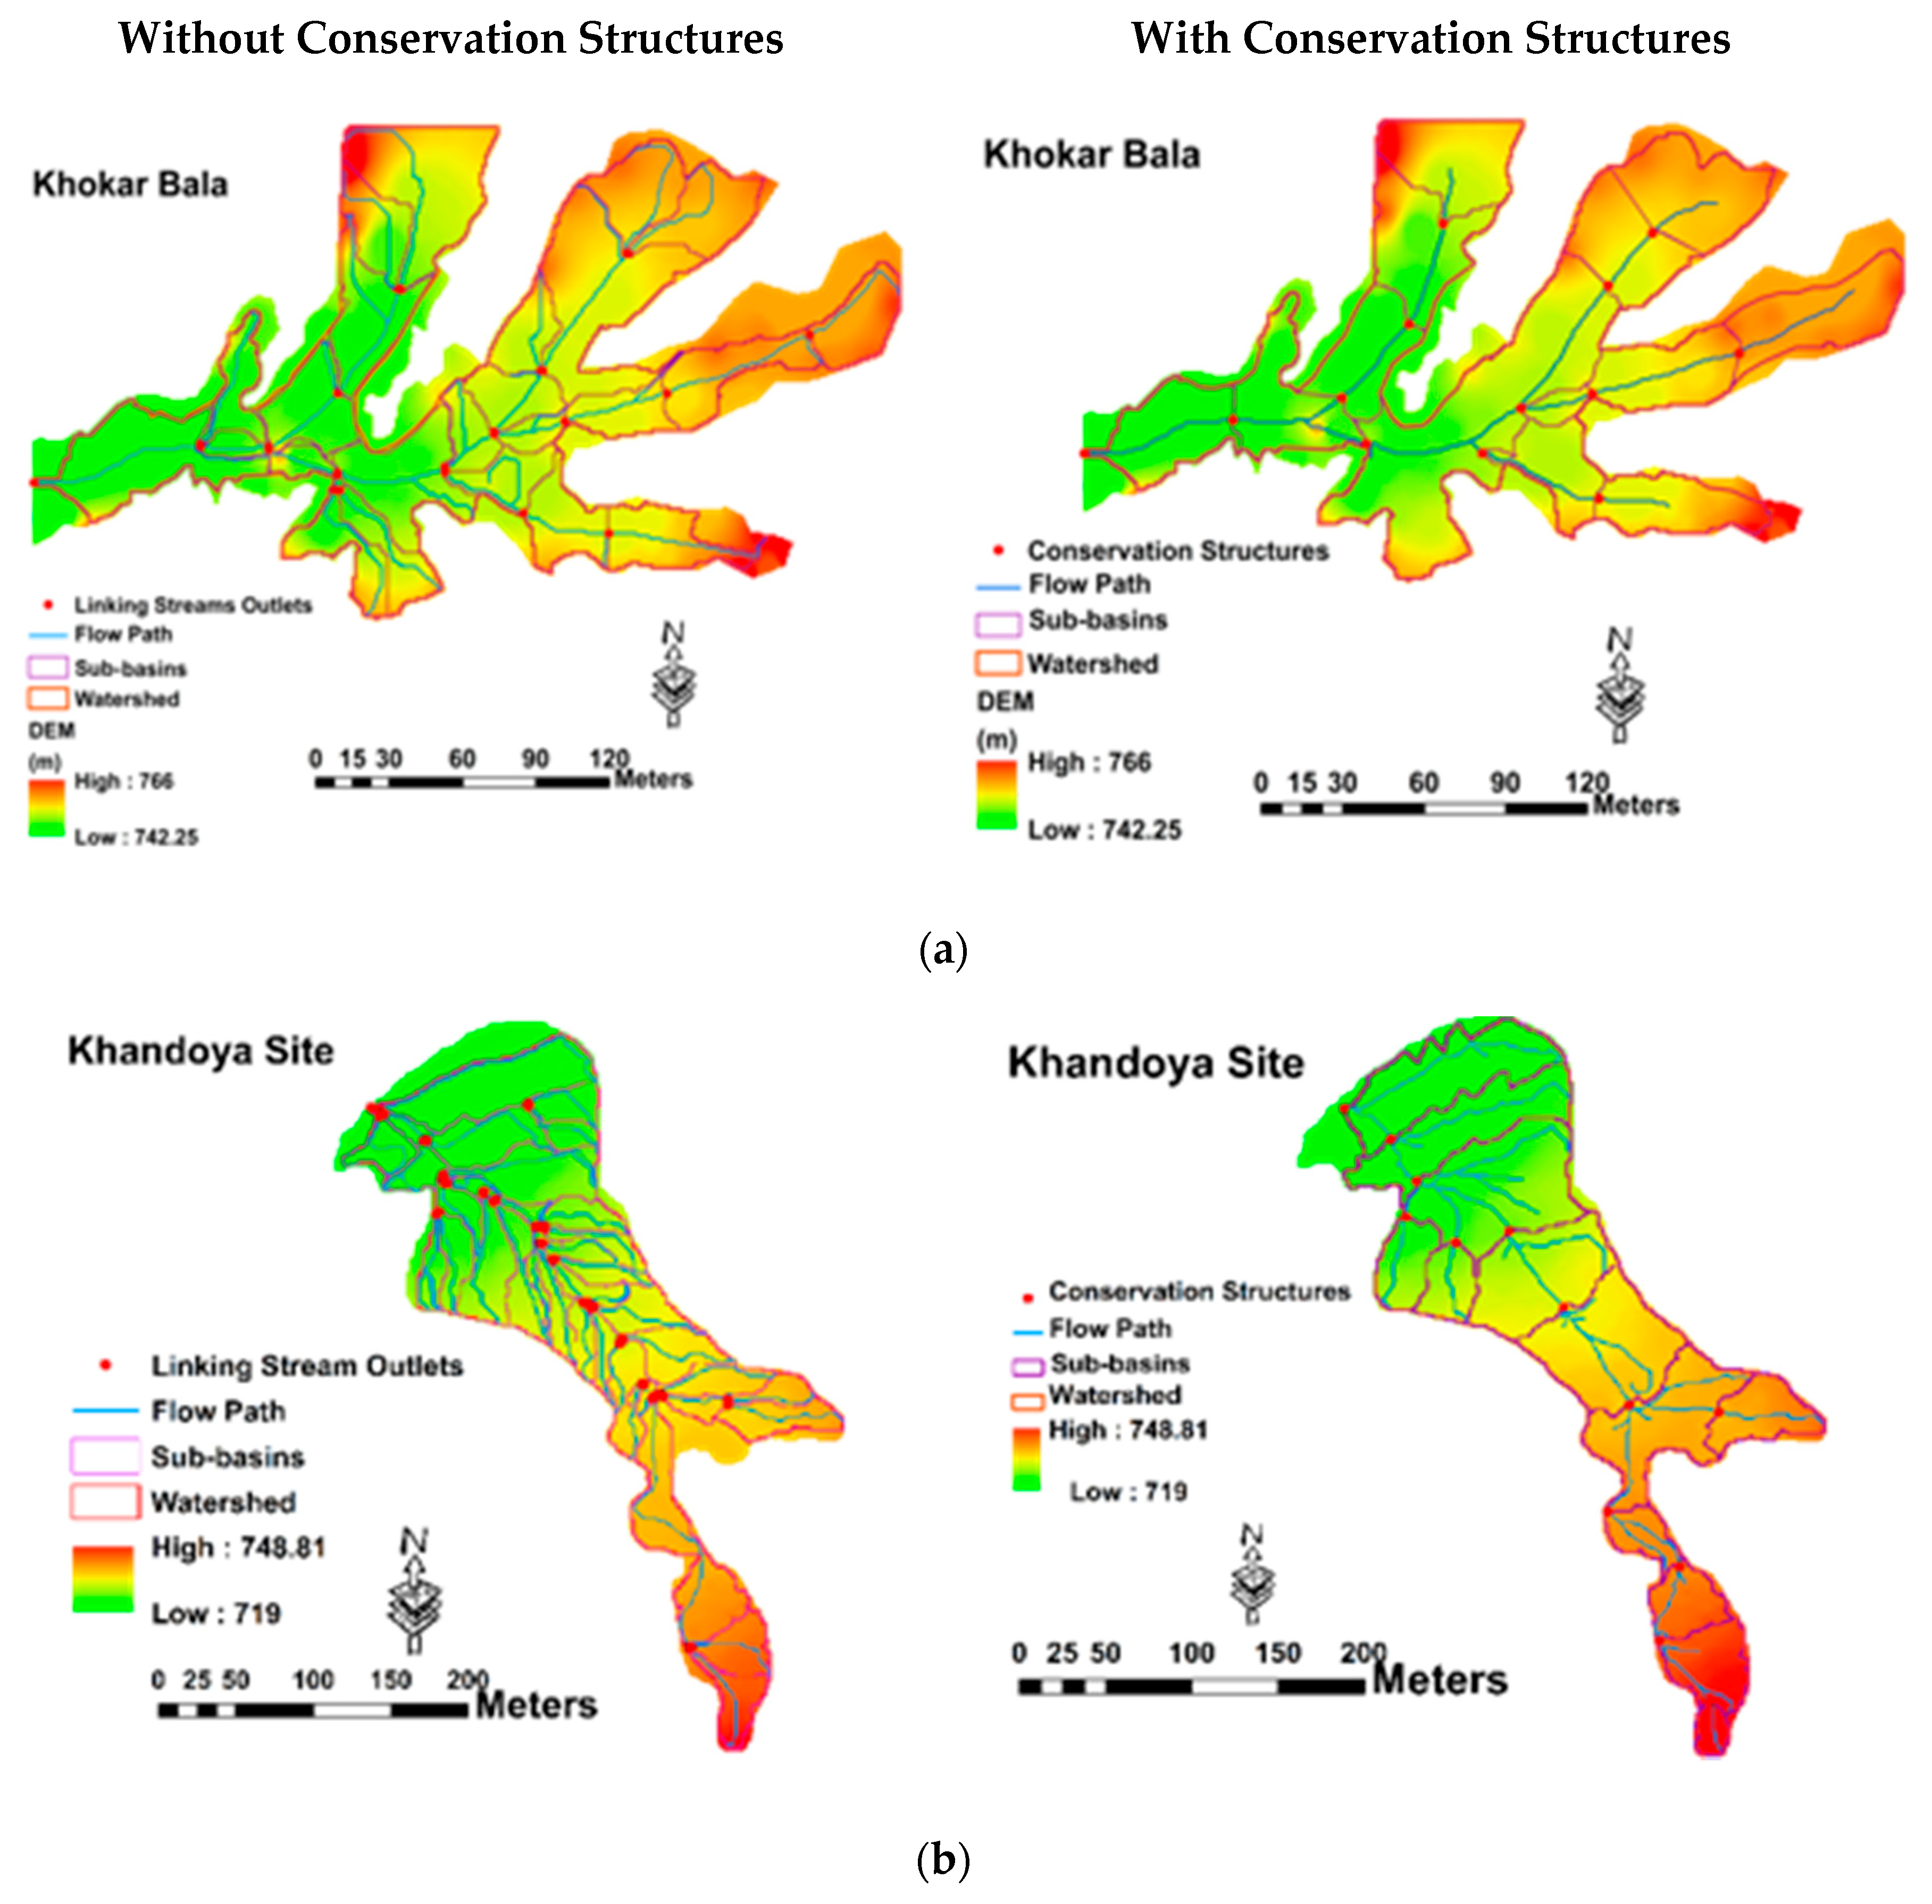
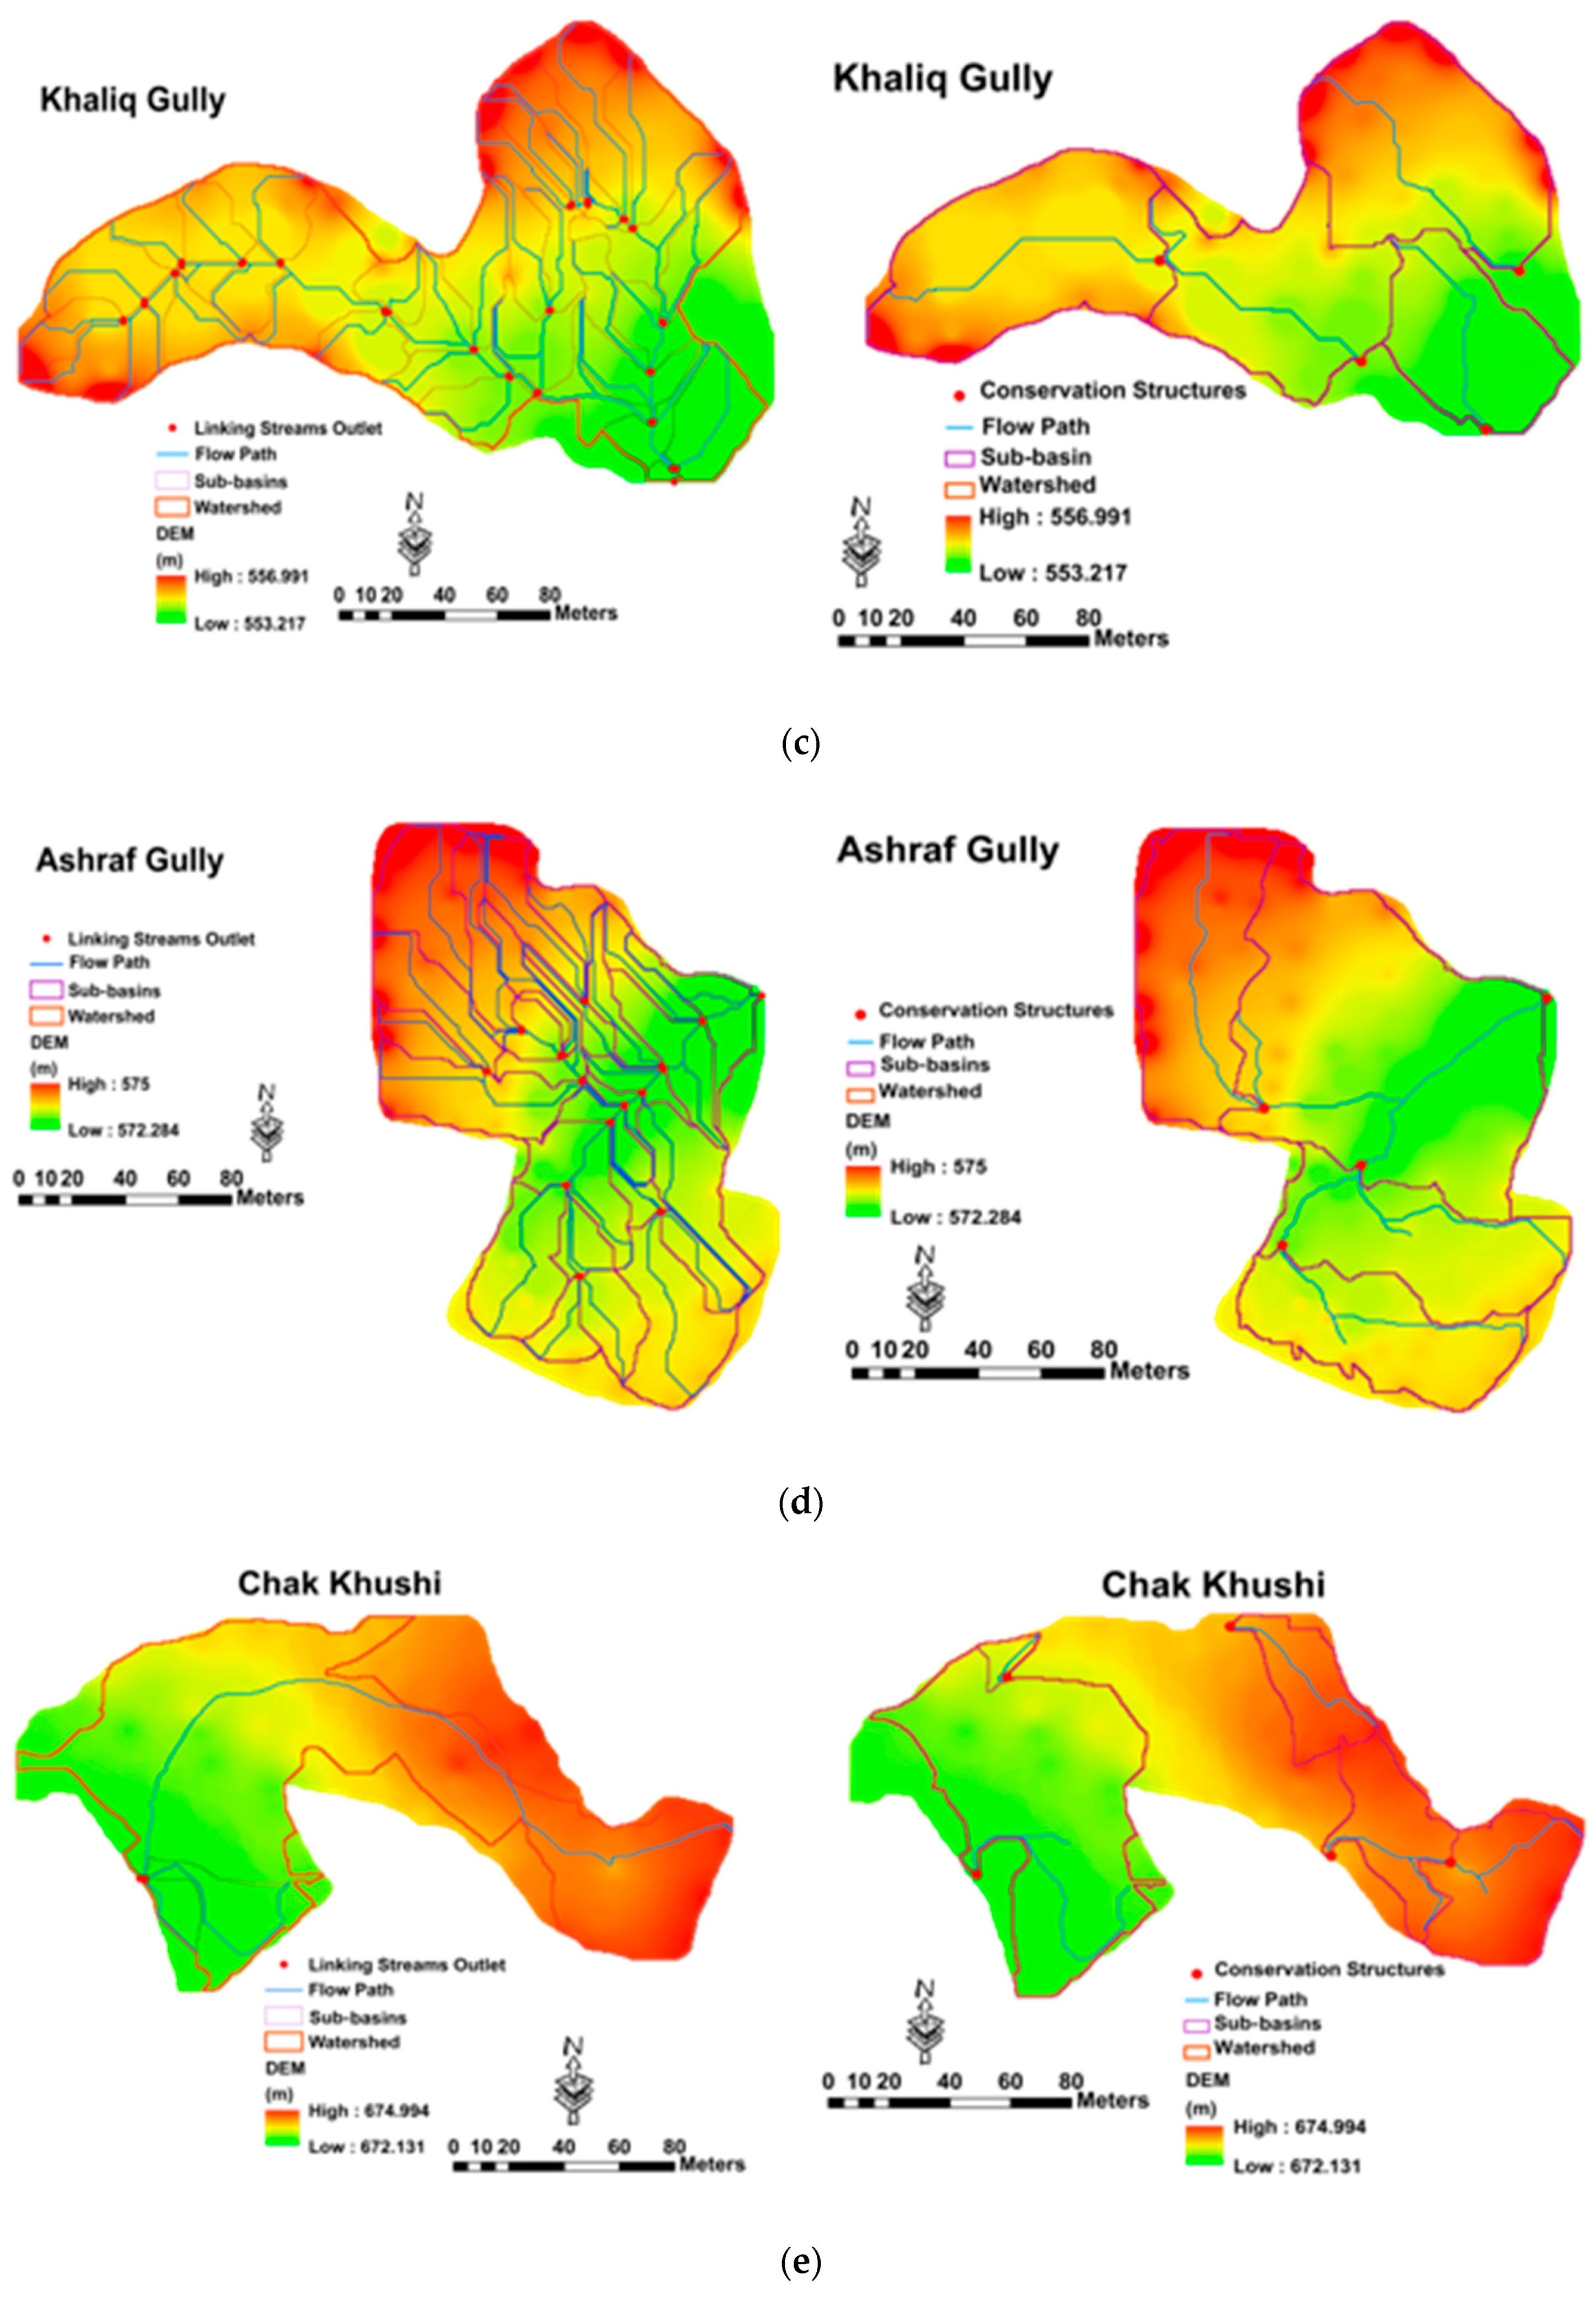
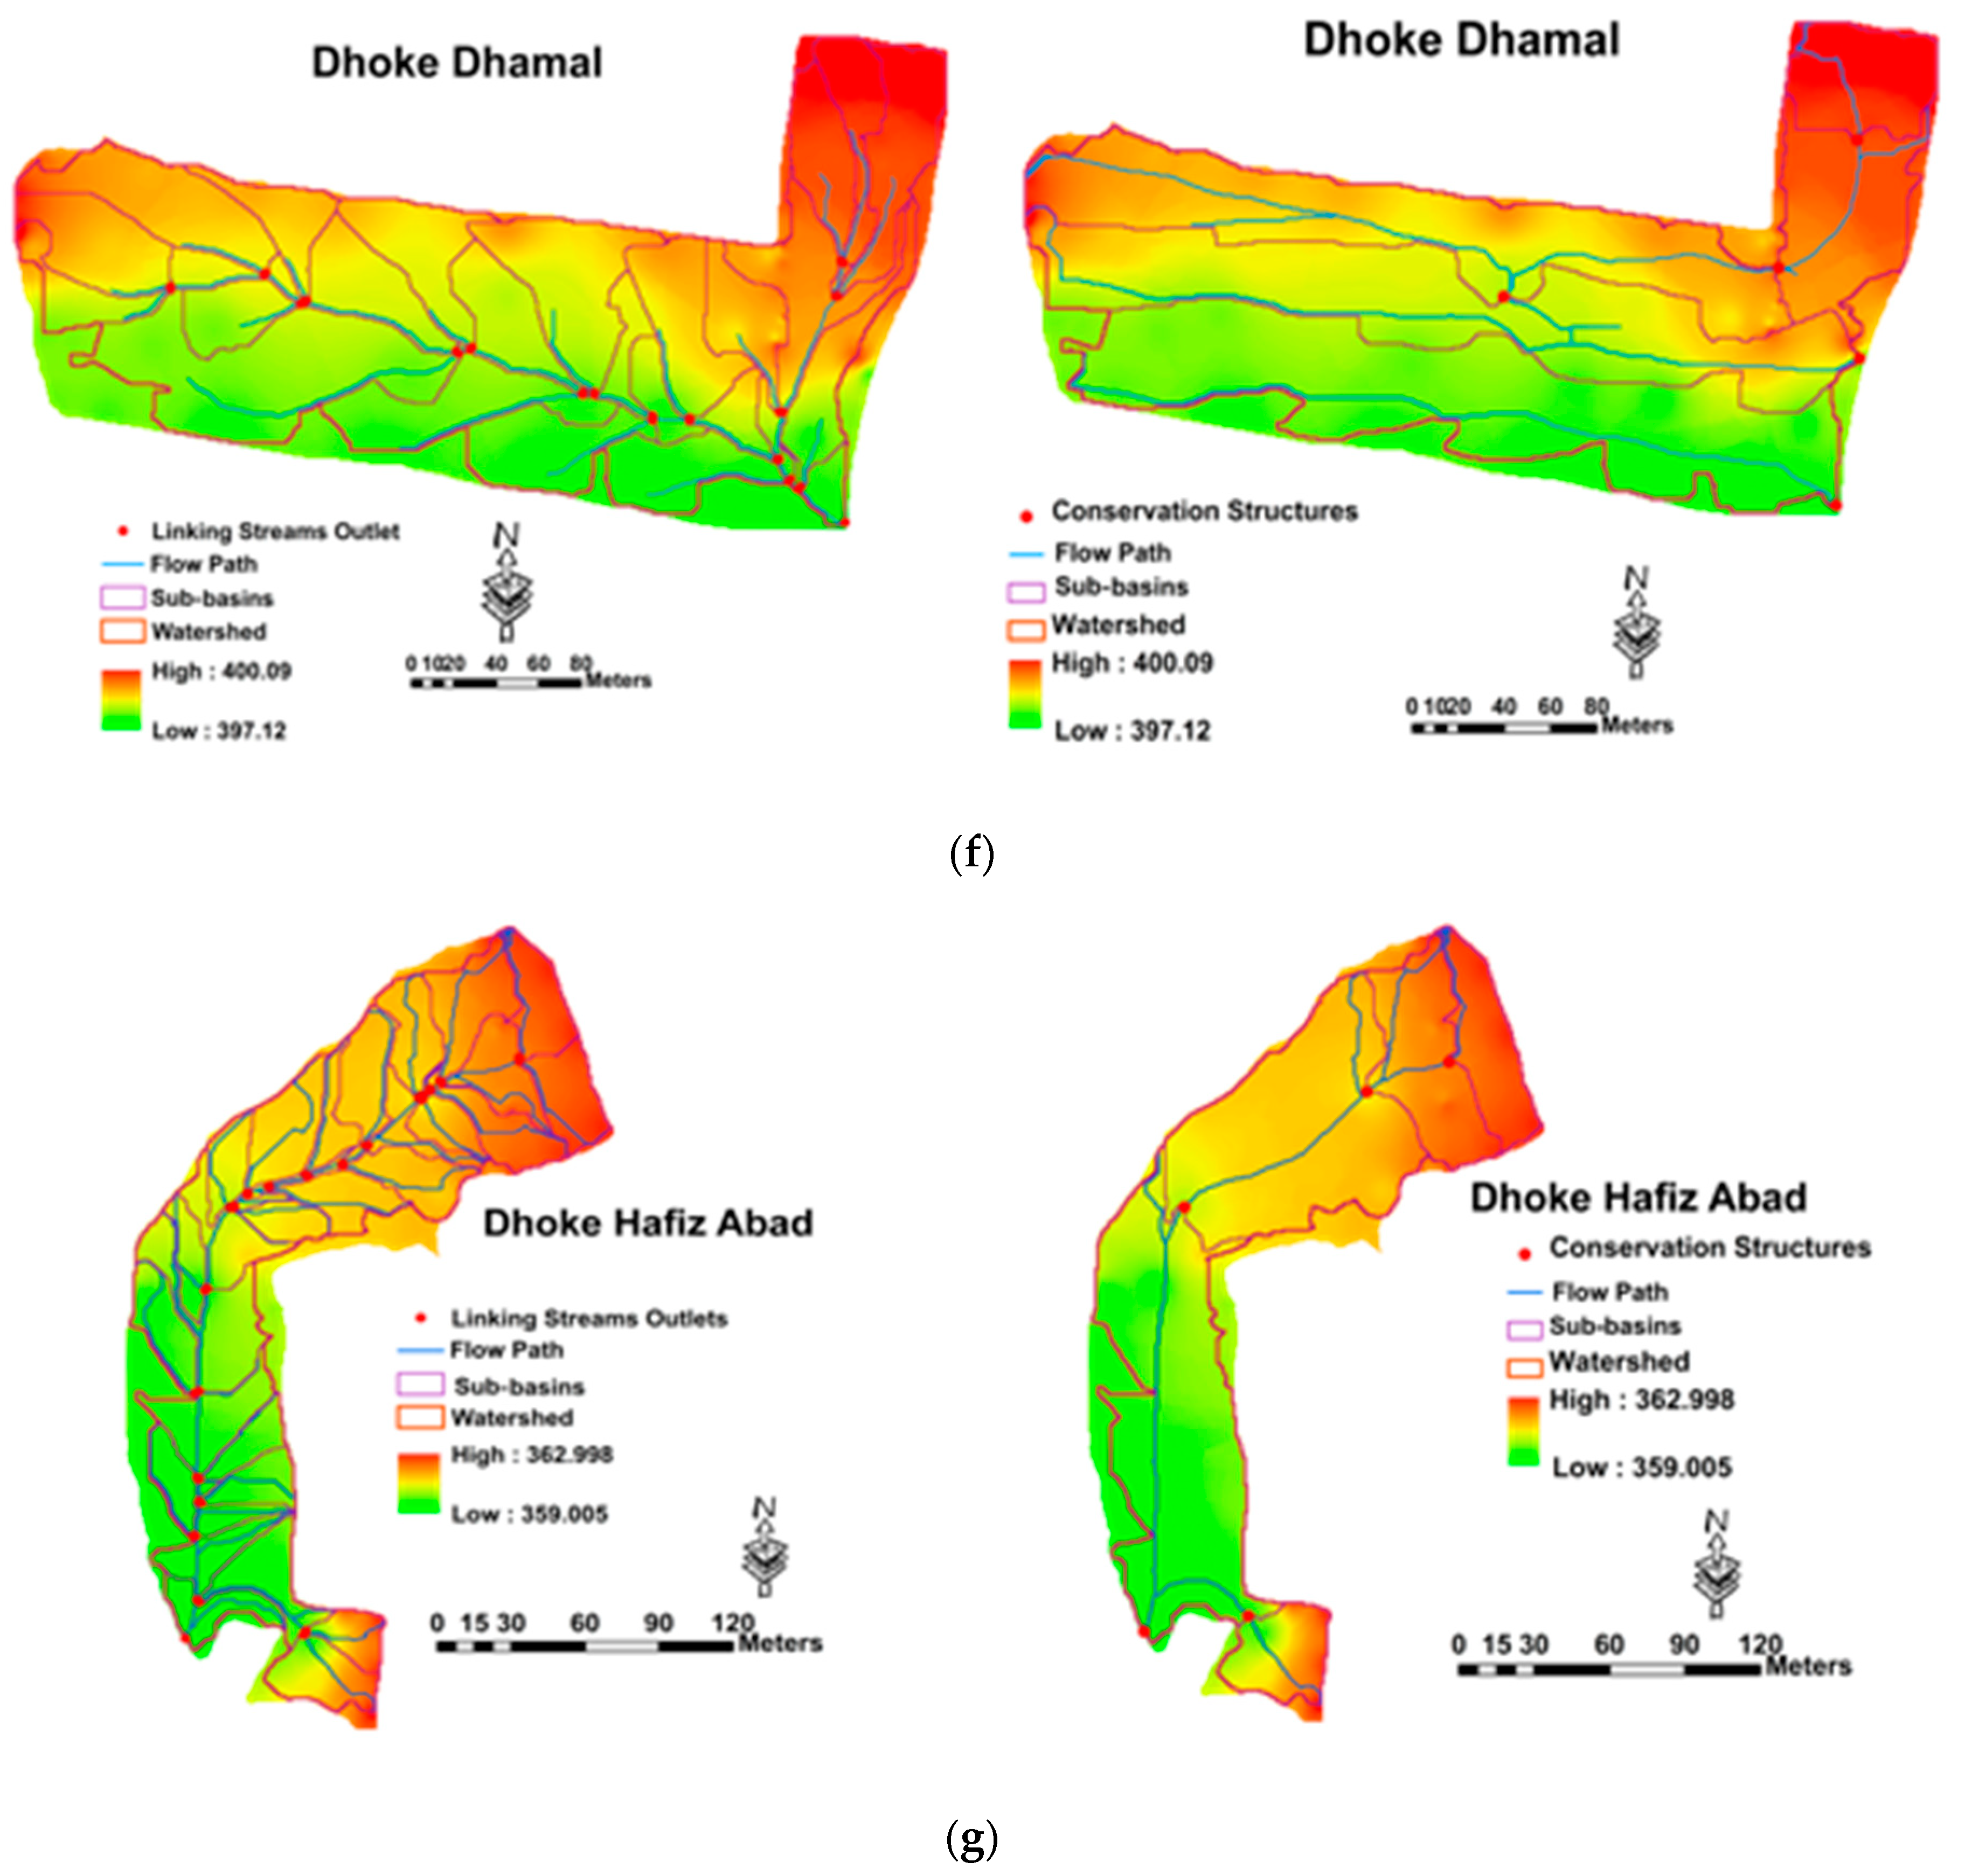
The requisite spatial data (DEM, land use, and soil data) and temporal data (rainfall and temperature) were prepared for the SWAT model setup. A physical topographical survey of the watersheds was conducted using a GPS. The DEM of each watershed was generated using point-source elevation data in a geographic information system by applying the inverse distance weighting (IDW) method, as shown in
Figure 4. The winter wheat land use classification was used according to cropping practice, and the soil type was sandy loam for all small watersheds based upon the soil textural analysis. The daily precipitation and temperature data were collected from the SAWCRI Chakwal for six years from January 2010 to April 2015.
After the preparation of the requisite data file for model input, ArcSWAT9.3 was used to automatically delineate sub-watersheds and to generate a stream network based on the DEM. An appropriate database of sub-basin parameters and a comprehensive topographic report of the watersheds were generated. The sub-watersheds topographic report was rechecked for area, slope, location of outlet, and soil textural class according to the physical characteristics to make appropriate database changes. SWAT coding conventions were used to reclassify the land use and soil maps into HRUs based on the unique land use, soil class, and slope class in the overlaying section.
The weather station location and lookup tables of daily precipitation and temperature (maximum and minimum) data were loaded to link them with the required files. First, the model was simulated for each watershed with validated parameters adopted from Hussain et al. [
14] without the consideration of the conservation structures, and then interventions of the soil and water conservation structures were made by modifying the parameters for surface runoff and sediment yield. The setup of model for each watershed with and without the consideration of the conservation structures is shown as the right and left of
Figure 4, respectively.
The locations of each soil and water conservation structure were marked and used for the correct delineations of sub-basins. The demarcated sub-basins indicated the boundary of the agriculture fields, while the structures were the outlet of each field in model setup when the conservation structures were considered. The ideal factors that describe the effect of stone bunds are the USLE support practice factor (P-factor), the curve number, and the average slope length for the sub-basin (SLSUBBSN).
The SLSSUBSN value was modified by editing the HRU (.hru) input table, whereas the P-factor and curve number values were modified by editing the Management (.mgt) input table. Three more parameters were modified, namely the average slope steepness (HRU_SLP) of the HRU input tables and two basin parameters (SPCON and SPEXP) representing the general watershed attributes in the Basin (.bsn) input files. SPCON and SPEXP are linear and exponential channel sediment routing factors, respectively, that affect the movement and separation of sediment fractions in the channel and were used to calculate the maximum amount of sediment re-entrained during channel sediment routing.
2.5. Model Calibration and Validation—Reference to the Previous Study
In this study, the calibrated and validated model was adopted from a previous study [
14]. The calibrated parameters were directly used during the simulation of the SWAT model without the consideration of the soil and water conservation structures. Hussain et al. [
14] successfully performed the calibration of soil erosion parameters in small watersheds of the Dhrabi River Catchment. In this study, the Catchment-25 parameters were selected, as shown in
Table 2 [
14]. Catchment-25, having an area of 2.0 ha, is an agricultural watershed consisting of deep gullies, and its average land slope is 10.5%. It has well-defined boundaries and wide gully beds that mimic the full representation of the other study watersheds. The detailed description of Catchment-25 and SWAT model calibration and validation procedure and performance can be seen in the study of Hussain et al. [
14].
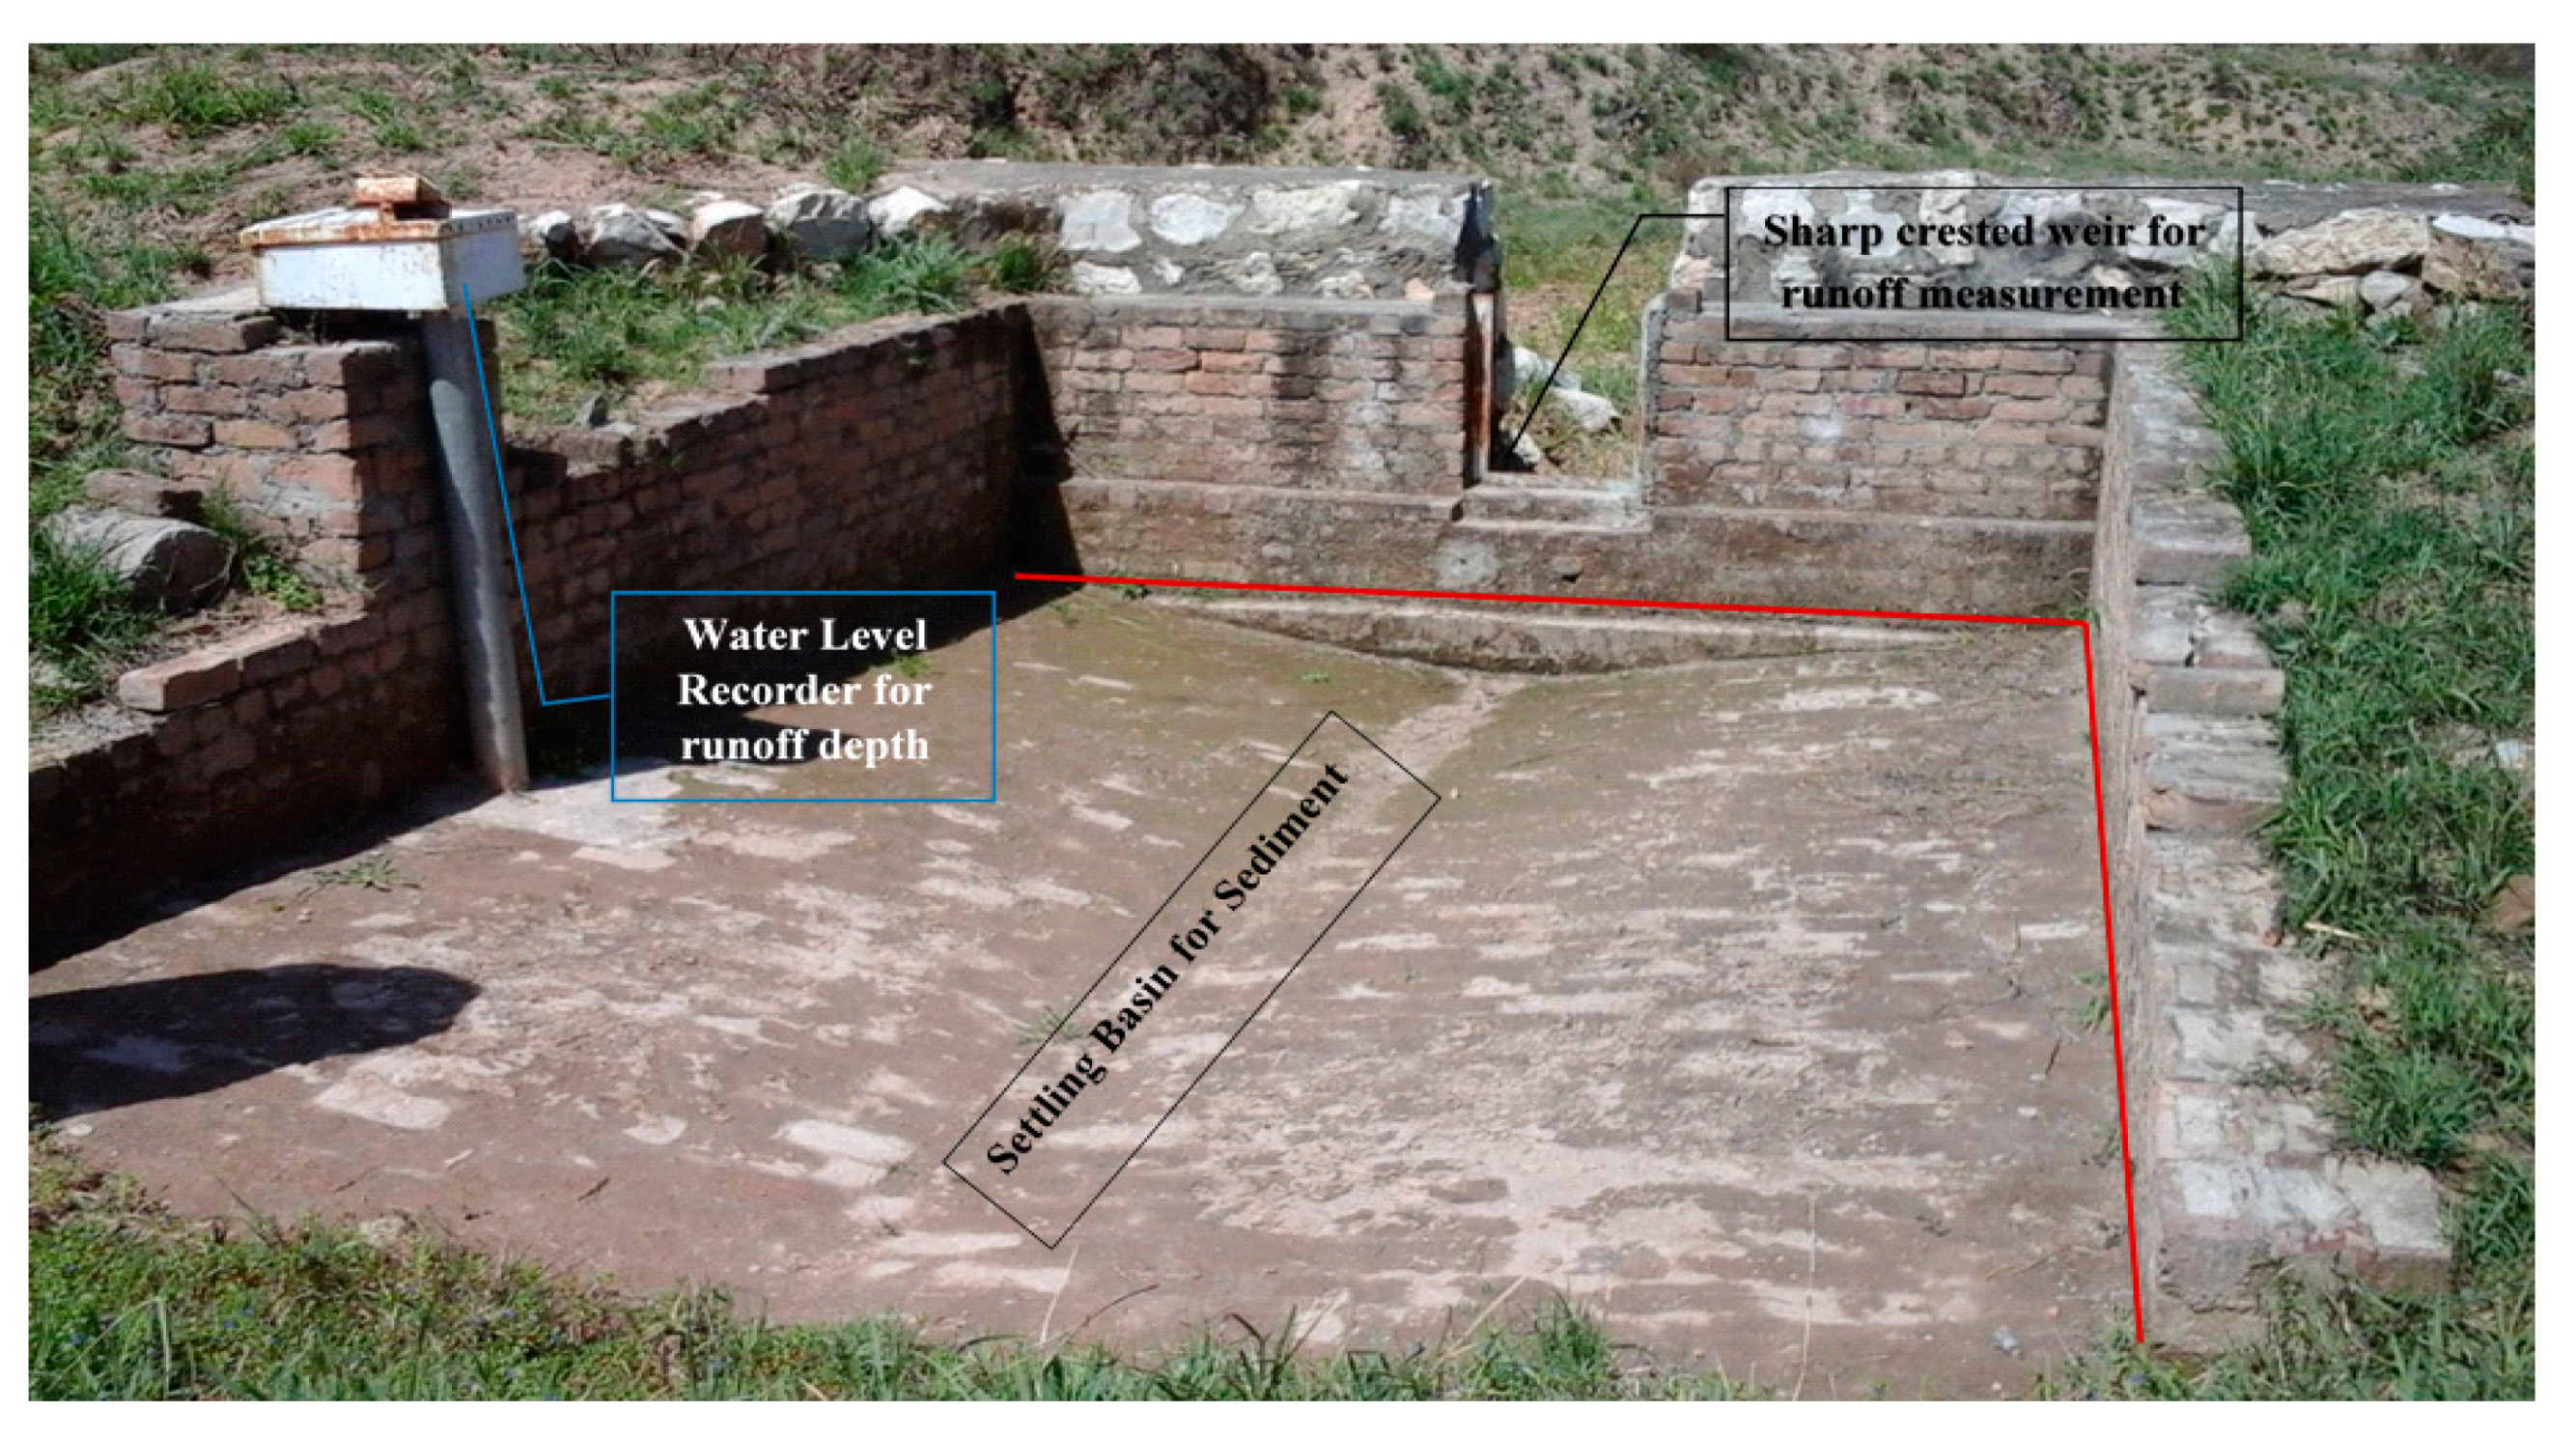
The SAWCRI collected the surface runoff and sediment yield data at the outlet of Catchment-25. The experimental setup for data collection is shown in
Figure 5. The automatic rain gauge and water level recorder were installed for rainfall and runoff depth measurements. The runoff discharge measurement was done using a sharp crested rectangular weir. The settling basin was used for sediment collection. The stilling basin was 3 m wide, 4 m long, and 65 cm deep at the weir and 15 cm deep upstream, in order to trap coarse sediment as bed load, while the suspended load was collected separately in 20 liter plastic buckets covered with a plastic sheet.
The total sediment yield of the catchment for a particular event is the sum of the bed load and suspended sediment. Coarser sediments were trapped in the stilling basin during the runoff event. After each runoff event, the standing water from the stilling basin was drained off through the drainpipe, and the wet sediments were collected and weighed. A composite sample of the wet bed load was obtained after mixing six-to-seven sub-samples collected throughout the stilling basin and oven dried to determine the moisture contents. The moisture contents were deducted from the wet weight to determine the dry weight of the sediment. Finer sediments in the runoff water passing the weir were sampled using vertical sampling tubes with holes. Following the runoff events, the samples present in the container were collected and analyzed. The total suspended sediment loss from the catchment was obtained by multiplying the sediment concentration in the bucket with the runoff volume passing over the weir.
2.6. Land Use Scenarios
The scenarios were developed based upon the common cropping practices adopted by the farmers in this area. A common practice for agriculture is the sowing of one or two crops a year. Other than the sowing period, the fields remain uncultivated as fallow land. Based upon this practice, the scenario related to land cover change was adopted—that is, winter wheat to fallow land change. Another other management practice is the use of conservation structures, which are used by the farmers for soil–water conservation and to meet crop water requirements. These structures safely pass the overland flow during the monsoon season and minimize the damages to the terrace ridges and bunds.
The SWAT model was applied based on four scenarios at all watershed sites. The scenarios are described as follows:
Scenario 1 (S1): The model was applied for soil erosion estimation on land without structures under the following conditions: the land use type was determined to be winter wheat; for overland flow, Manning’s n = 0.15 (for short grass) was used, and for channel flow, Manning’s n = 0.025 (for natural, earth uniform streams) was used.
Scenario 2 (S2): The model was applied for soil erosion estimation on land with structures under the same conditions as S1.
Scenario 3 (S3): The model was applied for soil erosion estimation on fallow land without structures. Manning’s n = 0.09 was used for overland flow. The crop residue and channel flow conditions remained the same.
Scenario 4 (S4): The model was applied for soil erosion estimation on land with structures under the same conditions as S3.
3. Results
After the preparation of requisite input file, including different selected parameters, the model was applied to all selected sites for the evaluation of the effectiveness of soil conservation structures. For this purpose, the model was first run without soil conservation structures, and then conversation structures were modeled to see their effectiveness. The model was also applied for the above-mentioned four different scenarios related to field practices being adopted by the farmers in the area.
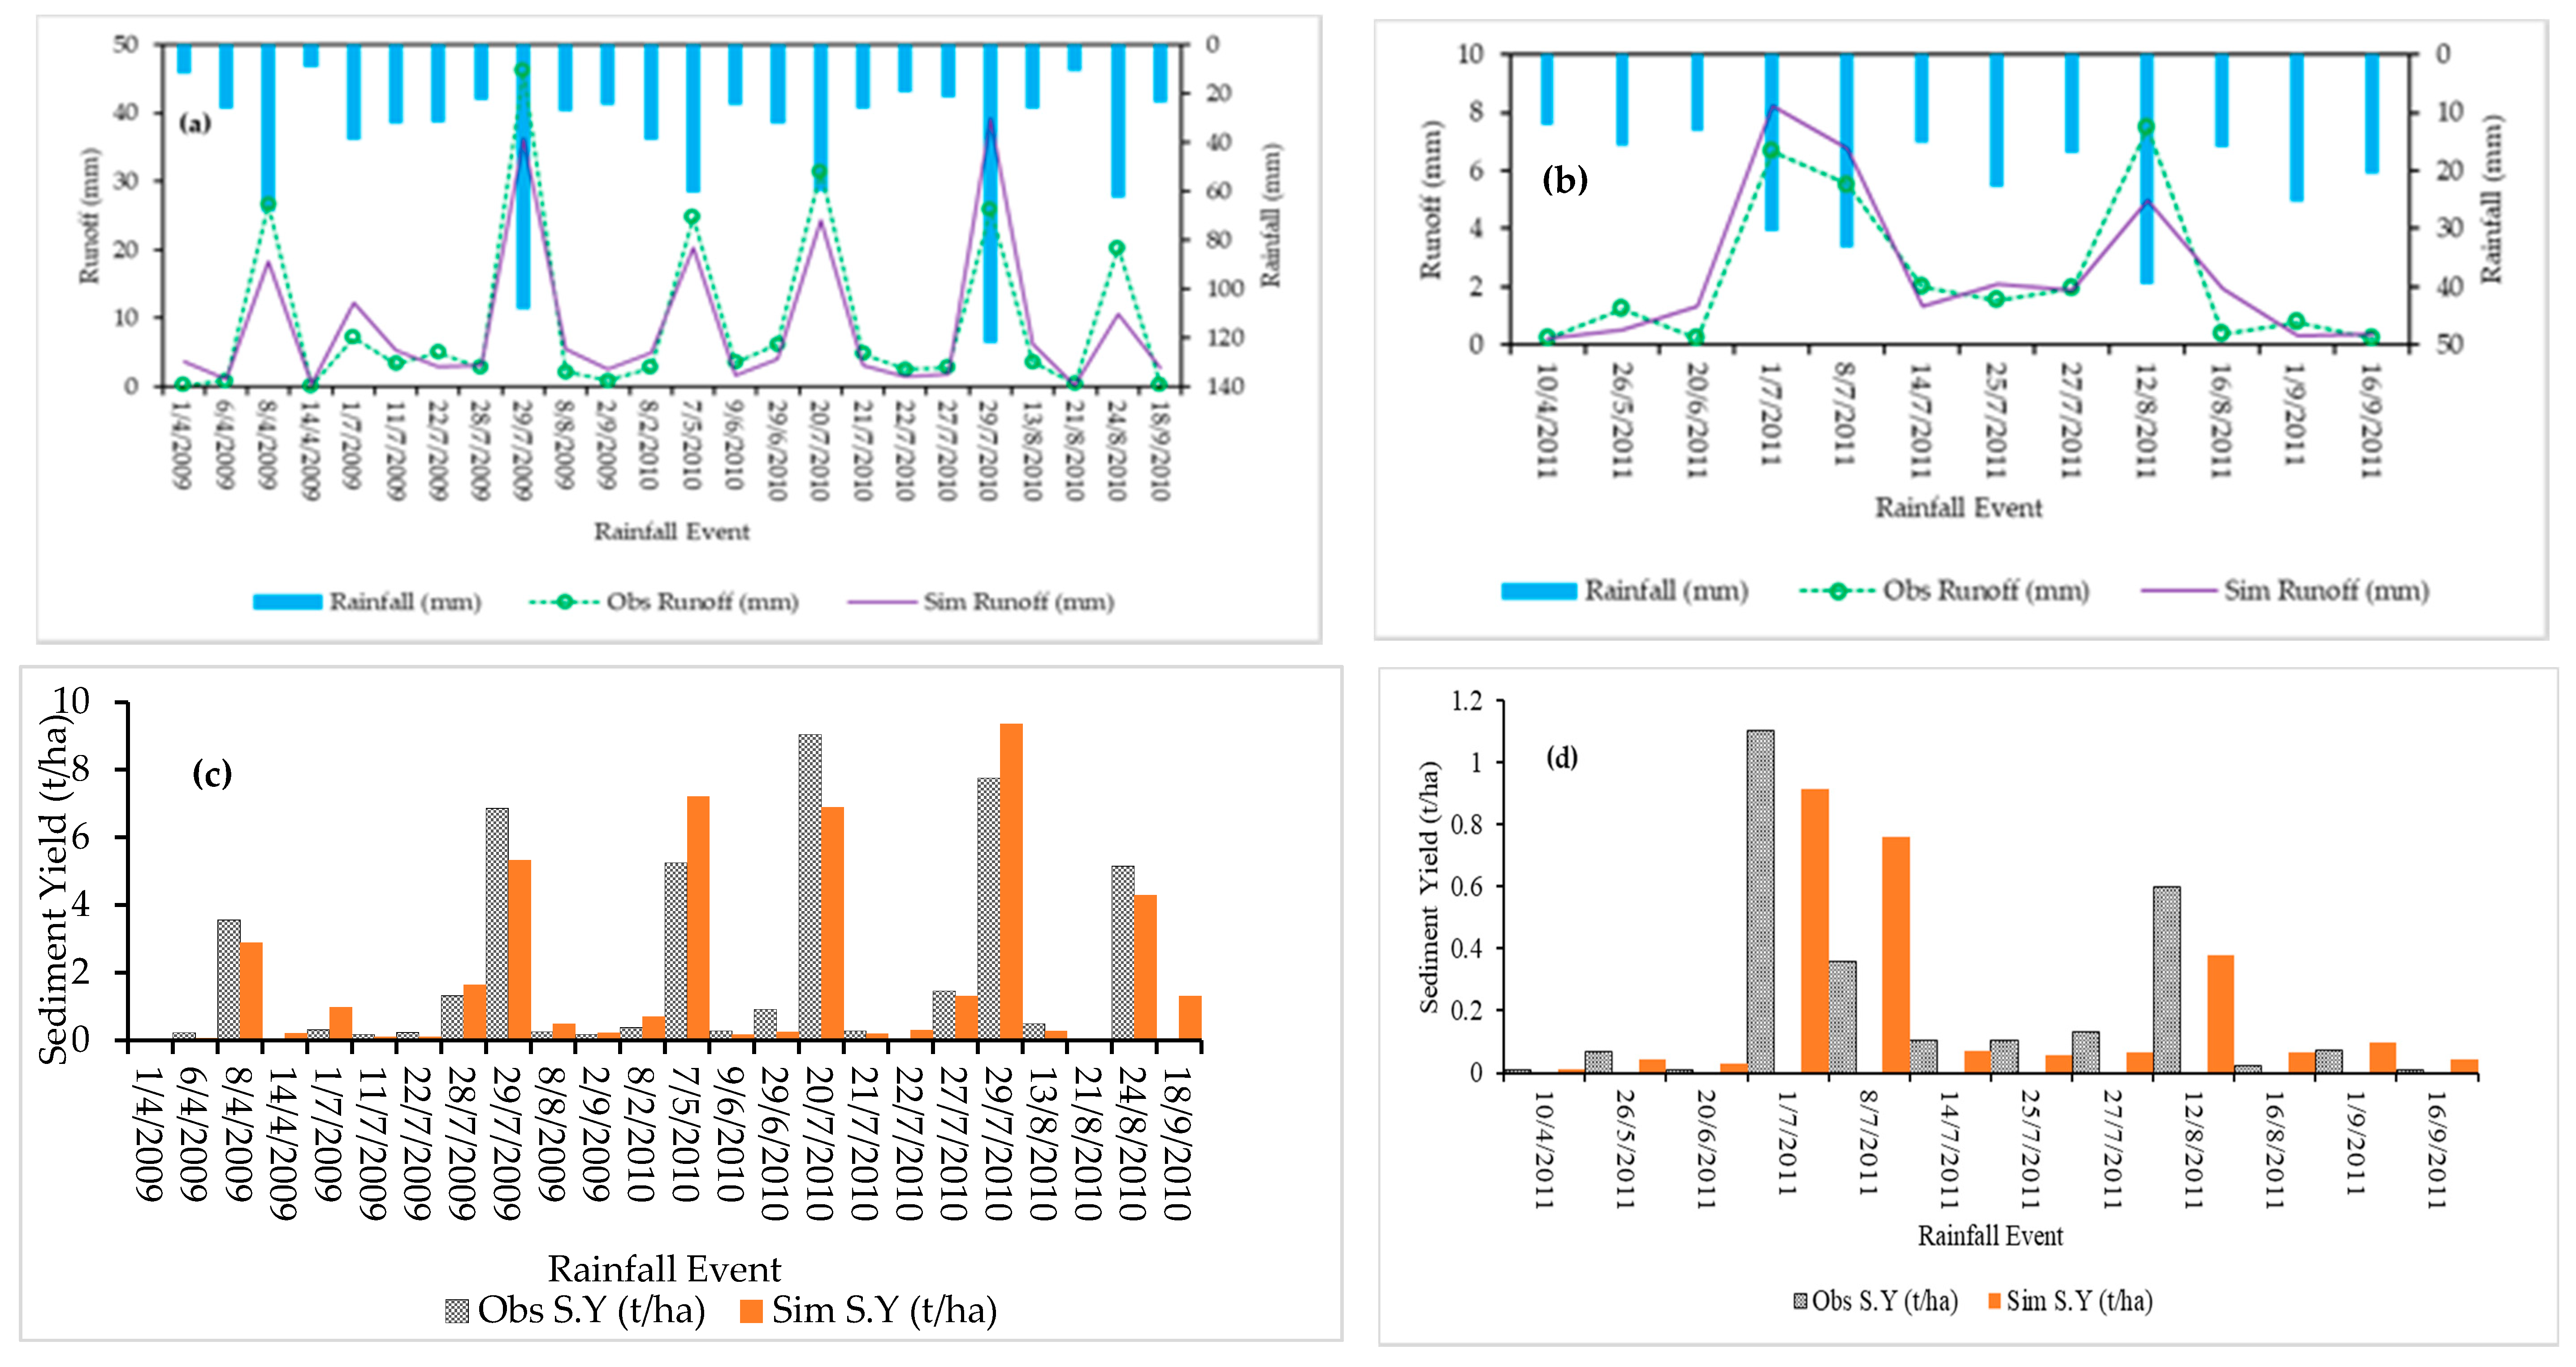
The modeled period was from 2009 to 2011 for Catchment-25. The runoff and sediment yield data collected during 2009–2010 were used for model calibration, while the 2011 data were used for validation. Some of the appropriate parameters were adjusted (
Table 2) until the predicted runoff and sediment yield approximately matched the measured ones at the outlet (
Figure 6). To determine the most sensitive parameters for model calibration, the sensitivity analysis was performed in the ArcSWAT interface using five parameters for sediment yield (
Table 2): USLE practice factor (P
USLE), USLE conservation practice factor (C
USLE), USLE soil erodibility factor (K
USLE), the linear parameter for calculating the maximum amount of sediment that can be re-entrained during channel sediment routing (SPCON), and the exponent parameter for calculating sediment re-entrained in channel sediment routing (SPEXP). The P
USLE factor was found to be the most sensitive parameter during model calibration using sensitivity analysis. Moreover, the obvious correspondence (coefficient of determination (R
2) = 0.80 and Nash–Sutcliffe efficiency (NSE) = 0.70) of the hydrographs of the observed and simulated surface runoff and sediment yield indicated that the SWAT is capable of simulating the hydrological regime of small watersheds in the Pothwar region (
Figure 6).
3.1. Model Application without Conservation Structures
After separately setting up the SWAT model for each watershed, the model simulation was performed with the default set of parameters in the default setting. Then, the soil erosion parameters (
Table 2) were used for sediment yield simulation in each watershed. The modeled period was from 2010 to 2015. We estimated that all the watersheds generated a maximum sediment yield in 2010, while a minimum sediment yield was simulated in 2012. This indicated that the sediment yield is a direct function of runoff and rainfall intensity. In 2010, Khaliq Gully model estimation was 59.3 t ha
−1, while in 2012, it was 2.3 t ha
−1. Similarly, the Ashraf Gully, Khokar Bala, Chak Khushi, Dhoke Dhamal, Dhoke Hafiz Abad, and Khandoya watershed models produced annual sediment yields of 25, 37.6, 1.6, 15.3, 32.3, and 45.9 t ha
−1, respectively, in 2010 (
Table 3).
3.2. Model Application with Conservation Structures
After the model application without conservation structures with calibrated soil erosion parameters, the model was applied to the small watersheds using soil and water conservation structures. The model setting was done in accordance with the location of conservation structures for the correct delineations of sub-basins. The intervention of the soil and water conservation structures was made by modifying the surface runoff and sediment yield parameters, as given in
Table 2. The SWAT provides various options to consider soil and water conservation structure impacts [
59] including: (i) surface runoff may be modified through the adjustment of the runoff ratio (curve number) and/or the consideration of a micro-pond (pothole) at the related HRU level, which also impacts the soil erosion, and (ii) impacts on the sediment yield levels may be modified via the adjustment of the support P-factor and/or the slope length and steepness factor (LS) of the MUSLE [
60]. The ideal factors that describe the effect of stone bunds are the USLE support P-factor, the curve number, and the SLSUBBSN.
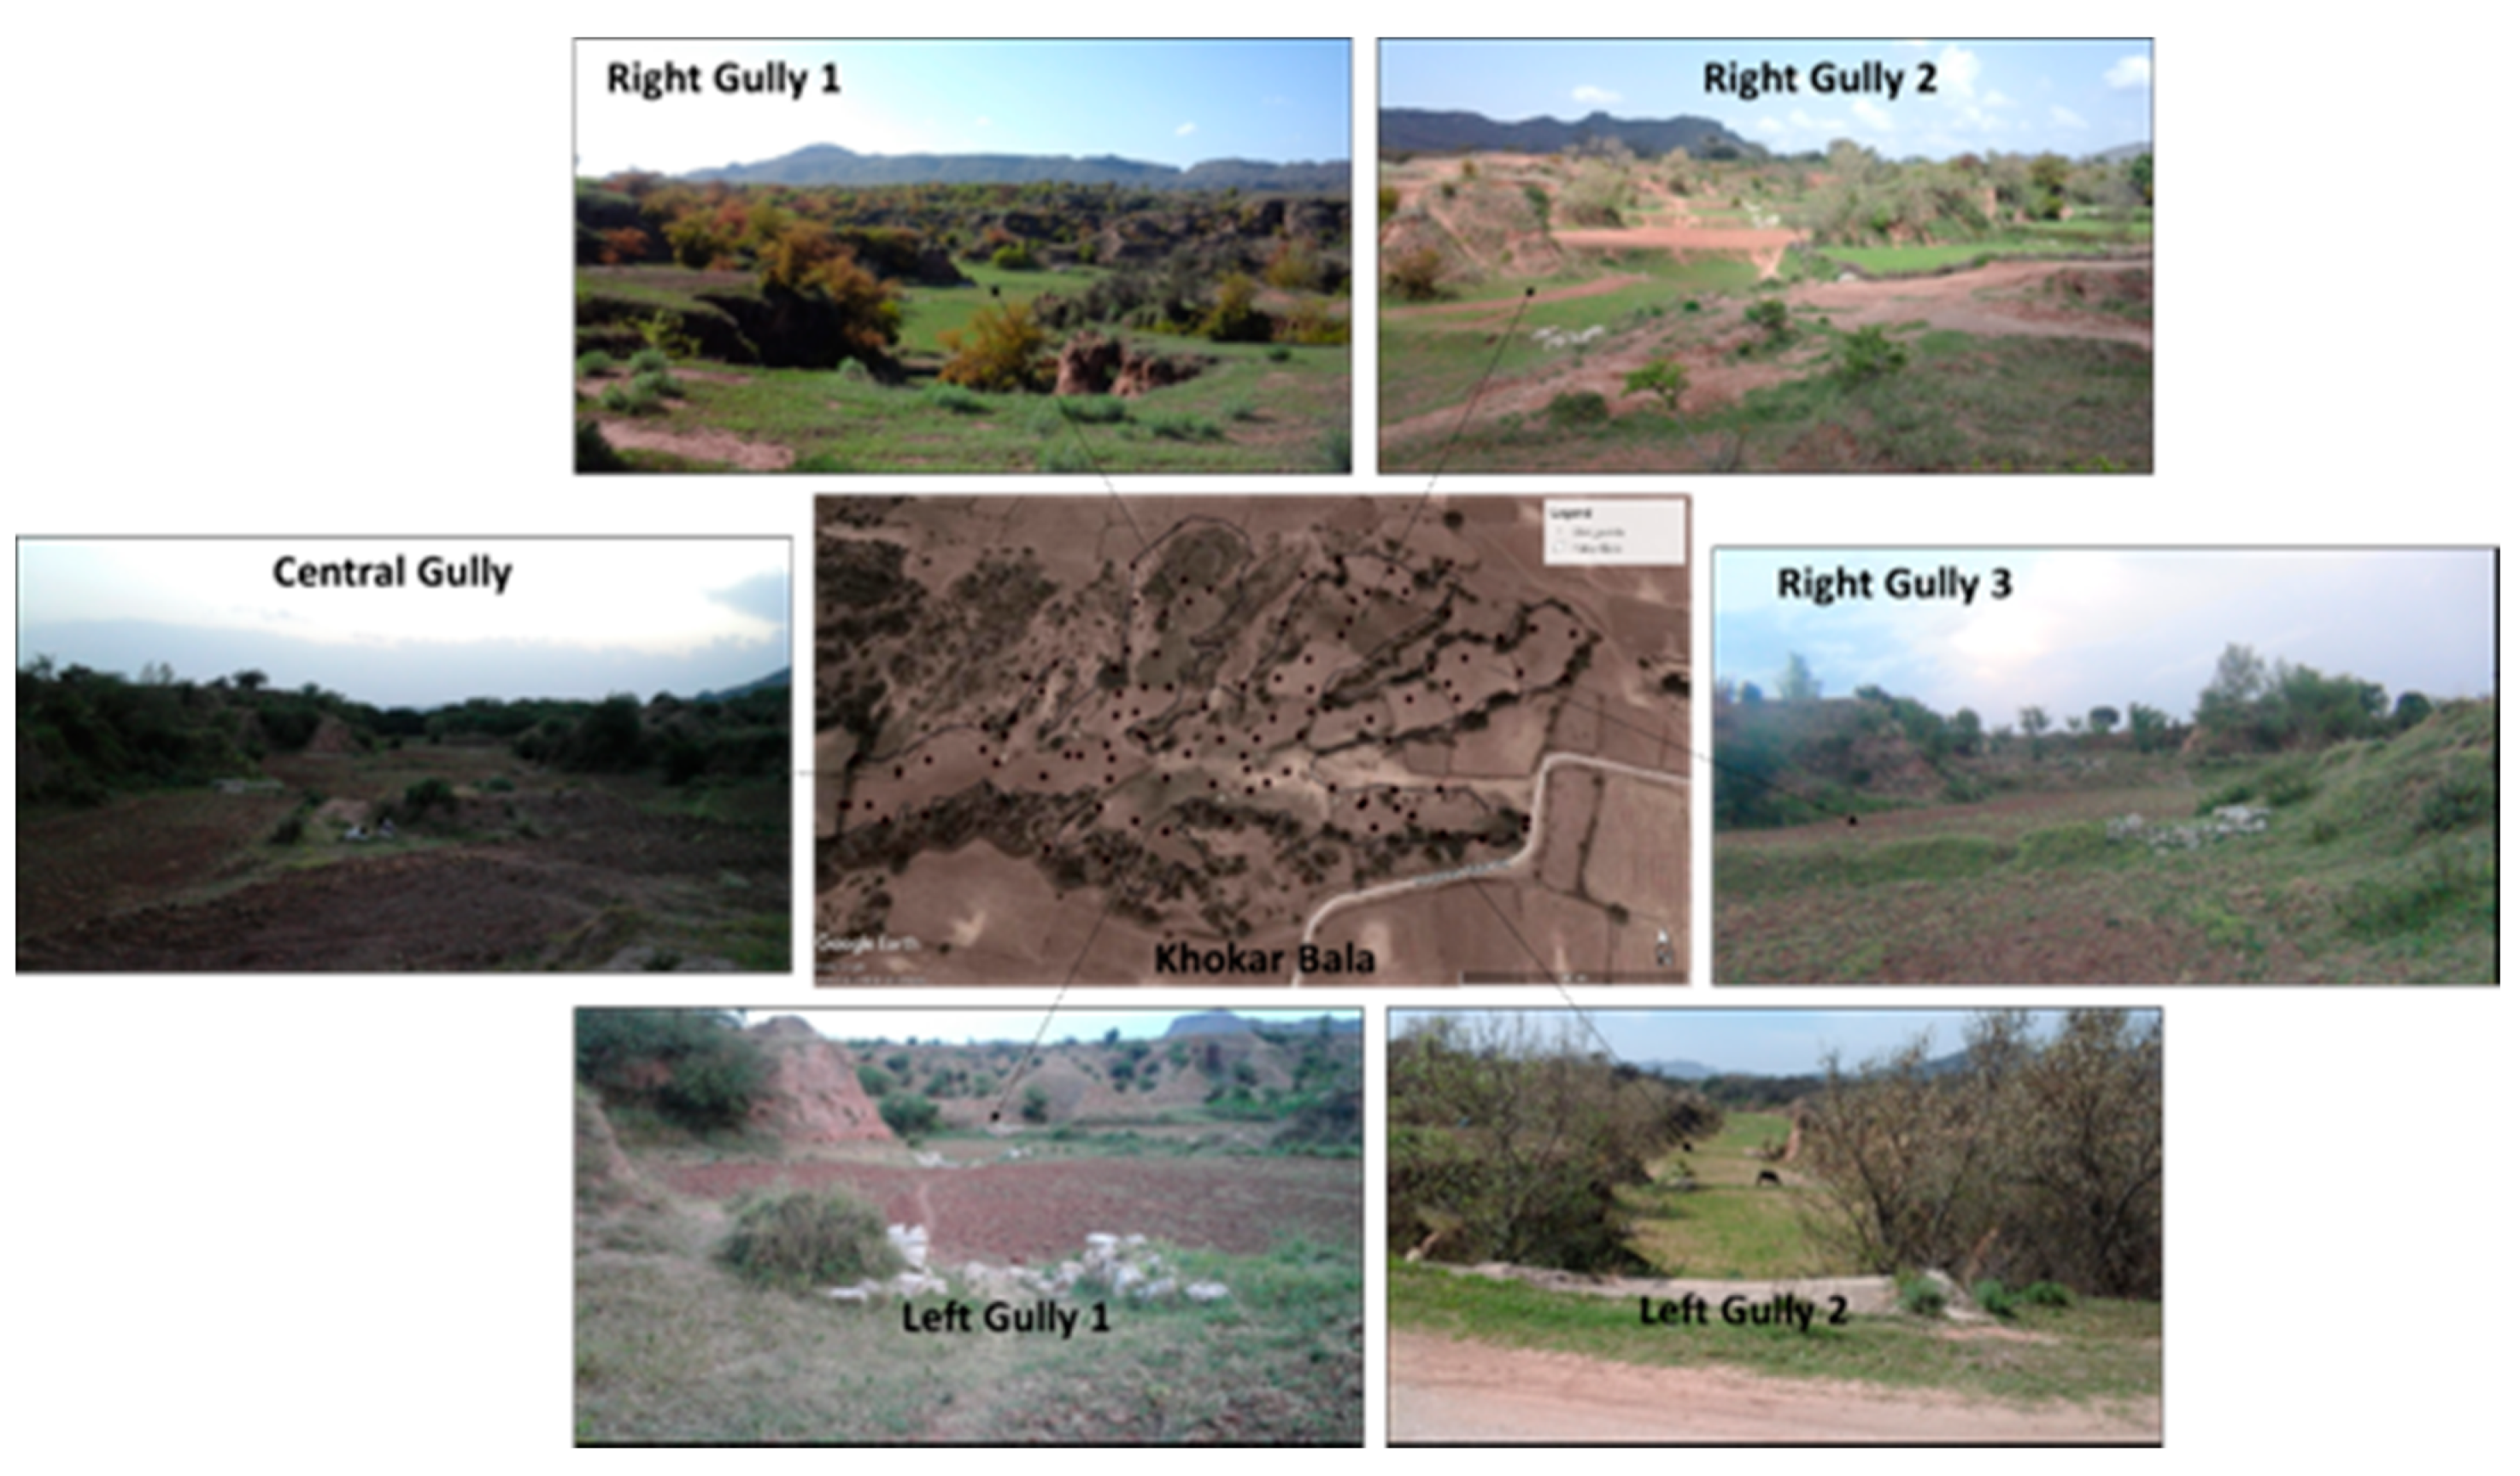
These small watersheds already have existing soil and water conservation structures for the control of soil erosion. The crests of the structures play a major role in reducing the flow velocity and sediment deposition (erosion reduction) due to ponding upstream of the structures, whereas the downstream sections of the structures prevent channel or gully development. The topography of the region consists of permanent gullies where farmers use these gullies for the cultivation of crops. The farmers manage the gullies in a terraced land use system by making field boundary bunds, as shown in
Figure 7 for the example of the Khokar Bala site. During the monsoon season, heavy rainstorms cause the shear failure of terrace edges (field bunds) due to the heavy surface runoff. This problem creates a loss of soil and damage to the crops. To reduce this problem, soil and water conservation structures have been installed to retain water in the terrace up to a certain rainfall amount (without overflowing the terrace) and then to divert the excess rainfall in a non-erosive way. These structures appear as a type of stone bund.
3.3. Soil Erosion Estimation and Effect of Conservation Structures
The sediment yield results were compared under each condition, as shown in
Table 3, by modifying the SWAT parameters representing the conservation structures. The six parameters were modified according to the slope characteristics of the small watersheds and field conditions, in addition to being modified according to the terraced and contoured section of the SWAT user’s manual [
59] and a literature review [
61,
62,
63,
64]. Soil and water conservation structures, such as stone bunds, act as vital measures in the reduction of flow velocity, surface runoff, soil erosion, and slope length in a watershed system [
65]. Suitable parameters that signify the effect and importance of loose stone structures are the SLSUBBSN, land management practice parameter (USLE_P), and the CN2 for rainfall–runoff conversion [
61].
The impact of stone bund soil and water conservation structures was simulated through the reduction of the CN2 for surface runoff ratio modification, as well as the adjustment of the P-factor to account for trapped sediments at the stone bunds.
Table 3 presents a significant sediment yield reduction achieved by incorporating the parameter values recommended for stone structures. The average annual sediment yield reduction varied from 40% to 98%; the Khokar Bala site showed the maximum reduction. The average five-year sediment yield reduction engendered by structures at various sites varied from 54% to 98%, and these results are relatively comparable to the findings of various studies [
61,
63,
66].
Betrie et al. indicated that 6–69% sediment reductions in the Upper Blue Nile River basin were caused by stone bunds [
61]. A field-scale study in the northern part of Ethiopia by Gebremichael et al. indicated a 68% sediment yield reduction was engendered by stone bunds [
66]. In addition, Herweg and Ludi conducted a study at plot scale in the Eritrean highlands and Ethiopia, and they reported 72–100% sediment yield reductions engendered by stone bunds [
63]. Based on the plot experiments carried out in 2013, stone bund structures were found to reduce surface runoff by approximately 60–80% and sediment yield between 40% and 80% [
67]. This is consistent with other plot experimental findings reported by Adimassu et al., where stone bunds were found to reduce the sediment yield by roughly 50% compared to untreated plots [
68]. The effect of conservation structures on sediment yield reduction was elucidated by Oweis and Ashraf in the Dhrabi watershed, and it was found that the average soil loss rates in 2009 without and with structures were calculated were 47 and 37.98 t ha
−1 year
−1, respectively, with a 20% reduction. However, the maximum soil loss rates without and with structures were 2716.17 and 1731 t ha
−1 year
−1, respectively, with a 37% reduction [
69].
The large variation in sediment reduction with conservation structures was observed due to the watershed topography and the numbers of soil and water conservation structures. For example, the Khokar Bala site showed the maximum 98% reduction because this site has a 90% area at a 0–10% slope (
Table 3) and a total of 13 soil and water conservation structures. Based on the field observation findings: (i) The conservation structures require regular maintenance because non-meshing can cause stones to slide, which may lead to the displacement of the whole structure, and (ii) the structures were not designed according to the hydraulic characteristics of the surface flow. Downstream damage of the structures was common due to the non-availability of downstream energy dissipation arrangements.
3.4. Soil Erosion Estimation under Different Scenarios
The scenarios were developed to estimate the further reduction in soil erosion associated with land use change under soil conservation structures. The scenarios were developed according to the scientific literature of land use and vegetation cover importance to assess soil erosion and farmer’s common cropping practices in the study region. Vegetation cover increases the infiltration rate [
70], reduces the erosive velocity of surface runoff, and plays a key role in resisting water erosion. A trivial variation in vegetative cover can produce considerable effects in overland flow [
71]. Vegetation cover is a key factor in controlling and reducing surface runoff and water erosion on agricultural land [
72].
The analysis of the various scenarios (
Table 4) revealed that the sediment yield level was higher in S1 and S2 than in S3 and S4. This indicated that the sediment yield level is higher on agricultural land than on fallow land with crop residue. In the comparative analysis of S1 and S2, the average sediment yield decreased to 1.25 t ha
−1, whereas in S3 and S4 (fallow land with crop residue), the average sediment yield decreased to 0.85 t ha
−1. The results disclosed that land use change facilitates sediment yield reduction, in addition to soil conservation structures.
Notably, a visual observation of the various structures revealed that the effects of the structures on soil erosion control generally extended to a 4–5 m radius from the center of the structure crests during high flow seasons; the water was accumulated and sediment was deposited upstream of the structures.
3.5. Spatial Analysis of Slope Ranges for Attock and Chakwal Districts
As reported by various researchers, the soil loss is minimal on sloping land with vegetation cover; however, when the available vegetation cover is removed, soil loss becomes more significant as a function of the slope length and slope steepness. The stream power, as a function of the shear stress and flow velocity, is the basic criterion for assessing the erosion of soil particles caused by overland flow. The shear stress and flow velocity are directly proportional to the slope steepness. This means that the steeper the land slope is, the greater the shear stress becomes, consequently increasing the potential for soil erosion.
Additionally, when soil conservation structures are installed in a field, farmers focus on cultivating agricultural crops in the areas above and below such structures. Considering these factors, this section estimated the potential area that would benefit from the installation of structures in Chakwal and Attock. Accordingly, the suitable slopes for stone structures and agricultural practices were analyzed at the district level based on the slope characteristics of selected sites. The areas under various slopes in the small watersheds were calculated and are shown in
Table 5.
All selected watershed sites were found to have a maximum slope area of less than 5%. This is because the selected sites were used for agricultural production. Farmers have graded the land as suitable for crop production and generating less surface runoff. The agricultural practices are only possible on soil that has a slope of less than 8%; otherwise, land grading must be carried out. The same has been suggested by various authors. A USLE experiment conducted at the SAWCRI office concluded that only a slope of less than 10% is acceptable for agricultural practices under rainfed conditions.
A slope classification analysis was performed to check the areal installation applicability of the soil and water conservation structures on district level, as shown in
Table 6. The maximum proportions of the areas in the Attock and Chakwal districts with less than 20% slope were 94% and 94.5%, respectively. The table shows that approximately 60% of the area of the Attock and Chakwal districts lies in a slope range of 0–4%, whereas 30% lies in a slope range of 4–10%. The minimum slope areas were considered according to the findings of Betrie et al., who recommended that stone bunds should be applied in low-slope areas for soil conservation [
61]. However, the effectiveness of the structures depends on the local topography and soil and land use–land cover conditions. Considering the topographic conditions, considerable potential exists for implementing soil conservation measures through the installation of stone structures. However, the appropriate maintenance of the structures is crucial for sustaining their effectiveness.
4. Discussion
The previous research study conducted by Hussain et al. [
14] in the Dhrabi River Catchment indicated that erratic and intensive rainfall during the rainy season generated several peak runoff events, exposing the steep sloped areas to potentially severe soil erosion. For example, in Catchment-25, a total 400 mm rainfall was accumulated from eleven erosive rainstorms in 2009, where a maximum of 108 mm day
−1 rainstorms generated 46.2 mm runoff and a 6.86 t ha
−1 sediment yield. Similarly, the total soil loss during the 2010 investigation period was 31.13 t ha
−1 [
14]. In the SWAT, the erosive impact of rainfall is generally estimated in terms of peak runoff generation, so the results obtained during calibration and validation are represented in
Figure 6 for surface runoff and sediment yield. The analysis was performed for each total rainfall event and the respective total surface runoff and sediment yield generated by each event. The overall statistical results indicated that the performance of the SWAT was satisfactory and that the simulated values generally matched the corresponding observed values well. However, model adequacy should be further evaluated by how well the model captures high and low rainfall events, specifically regarding the replication of fluctuations in the resulting hydrographs and sediment yields. The graphical results (
Figure 6) revealed that the SWAT was able to satisfactorily reproduce most of the low flow and sediment yield events (due to low rainfall events), although some relatively low sediment yields were considerably overpredicted, e.g., sediment yield events on 7 August 2011. In contrast, it was also found that the SWAT typically underestimated or overestimated high flow and sediment yield events in response to high rainfall events. For example, a maximum intensity rainstorm on 29 July 2010 resulted in the overestimation of surface runoff and sediment yields, while another maximum intensity rainstorm on 29 July 2009 resulted in underestimations. These discrepancies may have occurred due to inaccuracies in observed climate, runoff, and sediment data, such as some of the rainfall events, not being measured properly; this, in turn, could have led to underestimations or overestimations of runoff peaks. Another possible reason could be related to short, rapid rainfall events, which could have led lead to an overestimation discrepancy because small catchments have low times of concentration and thus a low capacity to minimize peak runoff. In addition, the CN technique cannot accurately predict runoff for days that experience several storms. The underestimation and/or overestimation of sediment yield was also observed during high intensity rainstorm events, which may have been due to uncertainties in runoff simulation measurements, as well as uncertainties in model parameterization. This may have also been due to the observed data used for model calibration and validation. Relatively short term events with several storms having high intensity may not have been captured well by the sampling of sediment data, including inaccurately high loads being measured during short term events, which led to an overestimation in sediment yield. The literature data findings indicated that the semi-mountainous region of Pothwar is rainfed and soil erosion is a serious issue due to the steep slope and heavy rainfall. The calibration and validation of the SWAT was successfully performed using parameters mentioned in
Table 2 for surface runoff and sediment yield. Similar studies, such as the sediment simulation results by Betrie et al. [
61] reported good agreement between the model daily sediment predictions and the observed concentrations at the El Diem gauging station (Ethiopia–Sudan border). SWAT studies for smaller watersheds in the northeast and northwest of Ethiopia have tended to show weaker hydrologic results [
73,
74], which is an indication that it may be difficult to accurately represent the processes and obtain better results for smaller watersheds. Keeping in view the literature studies, the validated SWAT model was applied to small watersheds of the Pothwar area with and without soil and water conservation structures.
The calibrated and validated model parameters were adopted for ungauged small watersheds for the simulation of sediment yield without the consideration of soil and water conservation structures. The soil and water conservation structures were modeled with the modification of appropriate parameters, and then the effectiveness of these structures in terms of reduction of soil erosion was calculated. The results showed that the soil and water conservation structures constructed by the farmers and the SAWCRI department reduced the soil losses in the small watersheds of the Pothwar region. The results showed that the watersheds in the case of without soil and water conservation structures had higher sediment losses than the watersheds with soil and water conservation structures, given similar climatic and land use patterns. The intervention of soil and water conservation structures measures by the mobilization of the community has a significant soil loss reduction to protect their land from the rainfall-driven soil erosion. To the best of our knowledge, no one has reported the effectiveness of soil and water conservation structures for the reduction of soil erosion in the Pothwar region or in Pakistan. This is the first study in this area where the SWAT model has been used for the evaluation of effectiveness of soil and water conservation structures for soil erosion control. For this purpose, appropriate parameters responsible for soil erosion were modified according to the type of soil and water conservation structures, as performed by different researchers in literature such as Betrie et al. [
61] in the Upper Blue Nile River basin, Gebremichael et al. [
66] in the northern part of Ethiopia, and Melaku et al. [
38] in the Gumara Maksegnit watershed in northwest Ethiopia. The SWAT model has been found to be a useful tool for understanding the hydrologic processes and the sediment dynamic in the study area watersheds, and it assessed the impacts of soil and water conservation structures on the erosion process. It was observed that severe erosion led to higher soil losses in some watersheds dominated with gullies, such as the Khokar Bala site. This is substantiated by the photo taken in
Figure 7, which shows the development of deep gullies in the upper parts of the watershed that were found to contribute higher soil erosion losses and to generate higher sediment load at the outlet.
The model results indicated that soil and water conservation structures might considerably decrease soil loss by 40–90% in small watersheds of the Pothwar region. Herweg and Ludi conducted a study at the plot scale in the Eritrean highlands of Ethiopia and reported 72–100% sediment yield reductions engendered by stone bunds [
63], which was close to the current finding of the soil loss reduction level due to soil and water conservation structures. Similarly, Betrie et al. [
61] indicated 6–69% sediment reductions in the Upper Blue Nile River basin caused by stone bunds, and their results were in agreement with our findings. The average annual sediment yield estimated by the SWAT model without the consideration of soil and water conservation structures in all selected sites was in the range of 8.05–30.31 t ha
−1. Our findings were in agreement with other studies conducted in the Pothwar region such as those from Hussain et al. [
14], who estimated the annual sediment loss (ranged from 2.6 to 31.1 t hm
−2) in small watersheds of the Dhrabi River Catchment, while Ahmad et al. [
16] reported annual soil loss rates of 9–26 t ha
−1 in the Fateh Jang watershed (Attock) with a slope of 1–10%. Similarly, Nasir et al. [
11] predicted an annual soil loss that ranged from 0.1 to 28 t ha
−1 at the small mountainous watershed of Rawal Lake in Rawalpindi. The literature data findings indicated that the semi-mountainous region of Pothwar is rainfed and soil erosion is a serious issue due to steep slope and heavy rainfall. The region receive erratic rainfall during a short rainy season and almost 70% precipitation occurs during monsoon [
75,
76]. The comparative studies on sediment and soil loss confirmed the results of the current study conducted in small watersheds of the Pothwar region.
The soil and water conservation structures are effective measures in reducing the soil erosion problems in the Pothwar region that have varied land slopes. This study reveals that considering the topographic conditions, loose stone soil and water conservation structures should be installed in areas with a slope range of 0–10%, and wire-meshed stone structures should be installed in areas with a slope range of 6–10%. Proper energy dissipation arrangements should be implemented to prevent downstream erosion.


