Modeling Improved Performance of Reduced-Height Biosand Water Filter Designs
Abstract
:1. Introduction
2. Materials and Methods
2.1. Biosand Filter Overview
2.2. Design Simplification
2.3. Experimental Design and Conditions
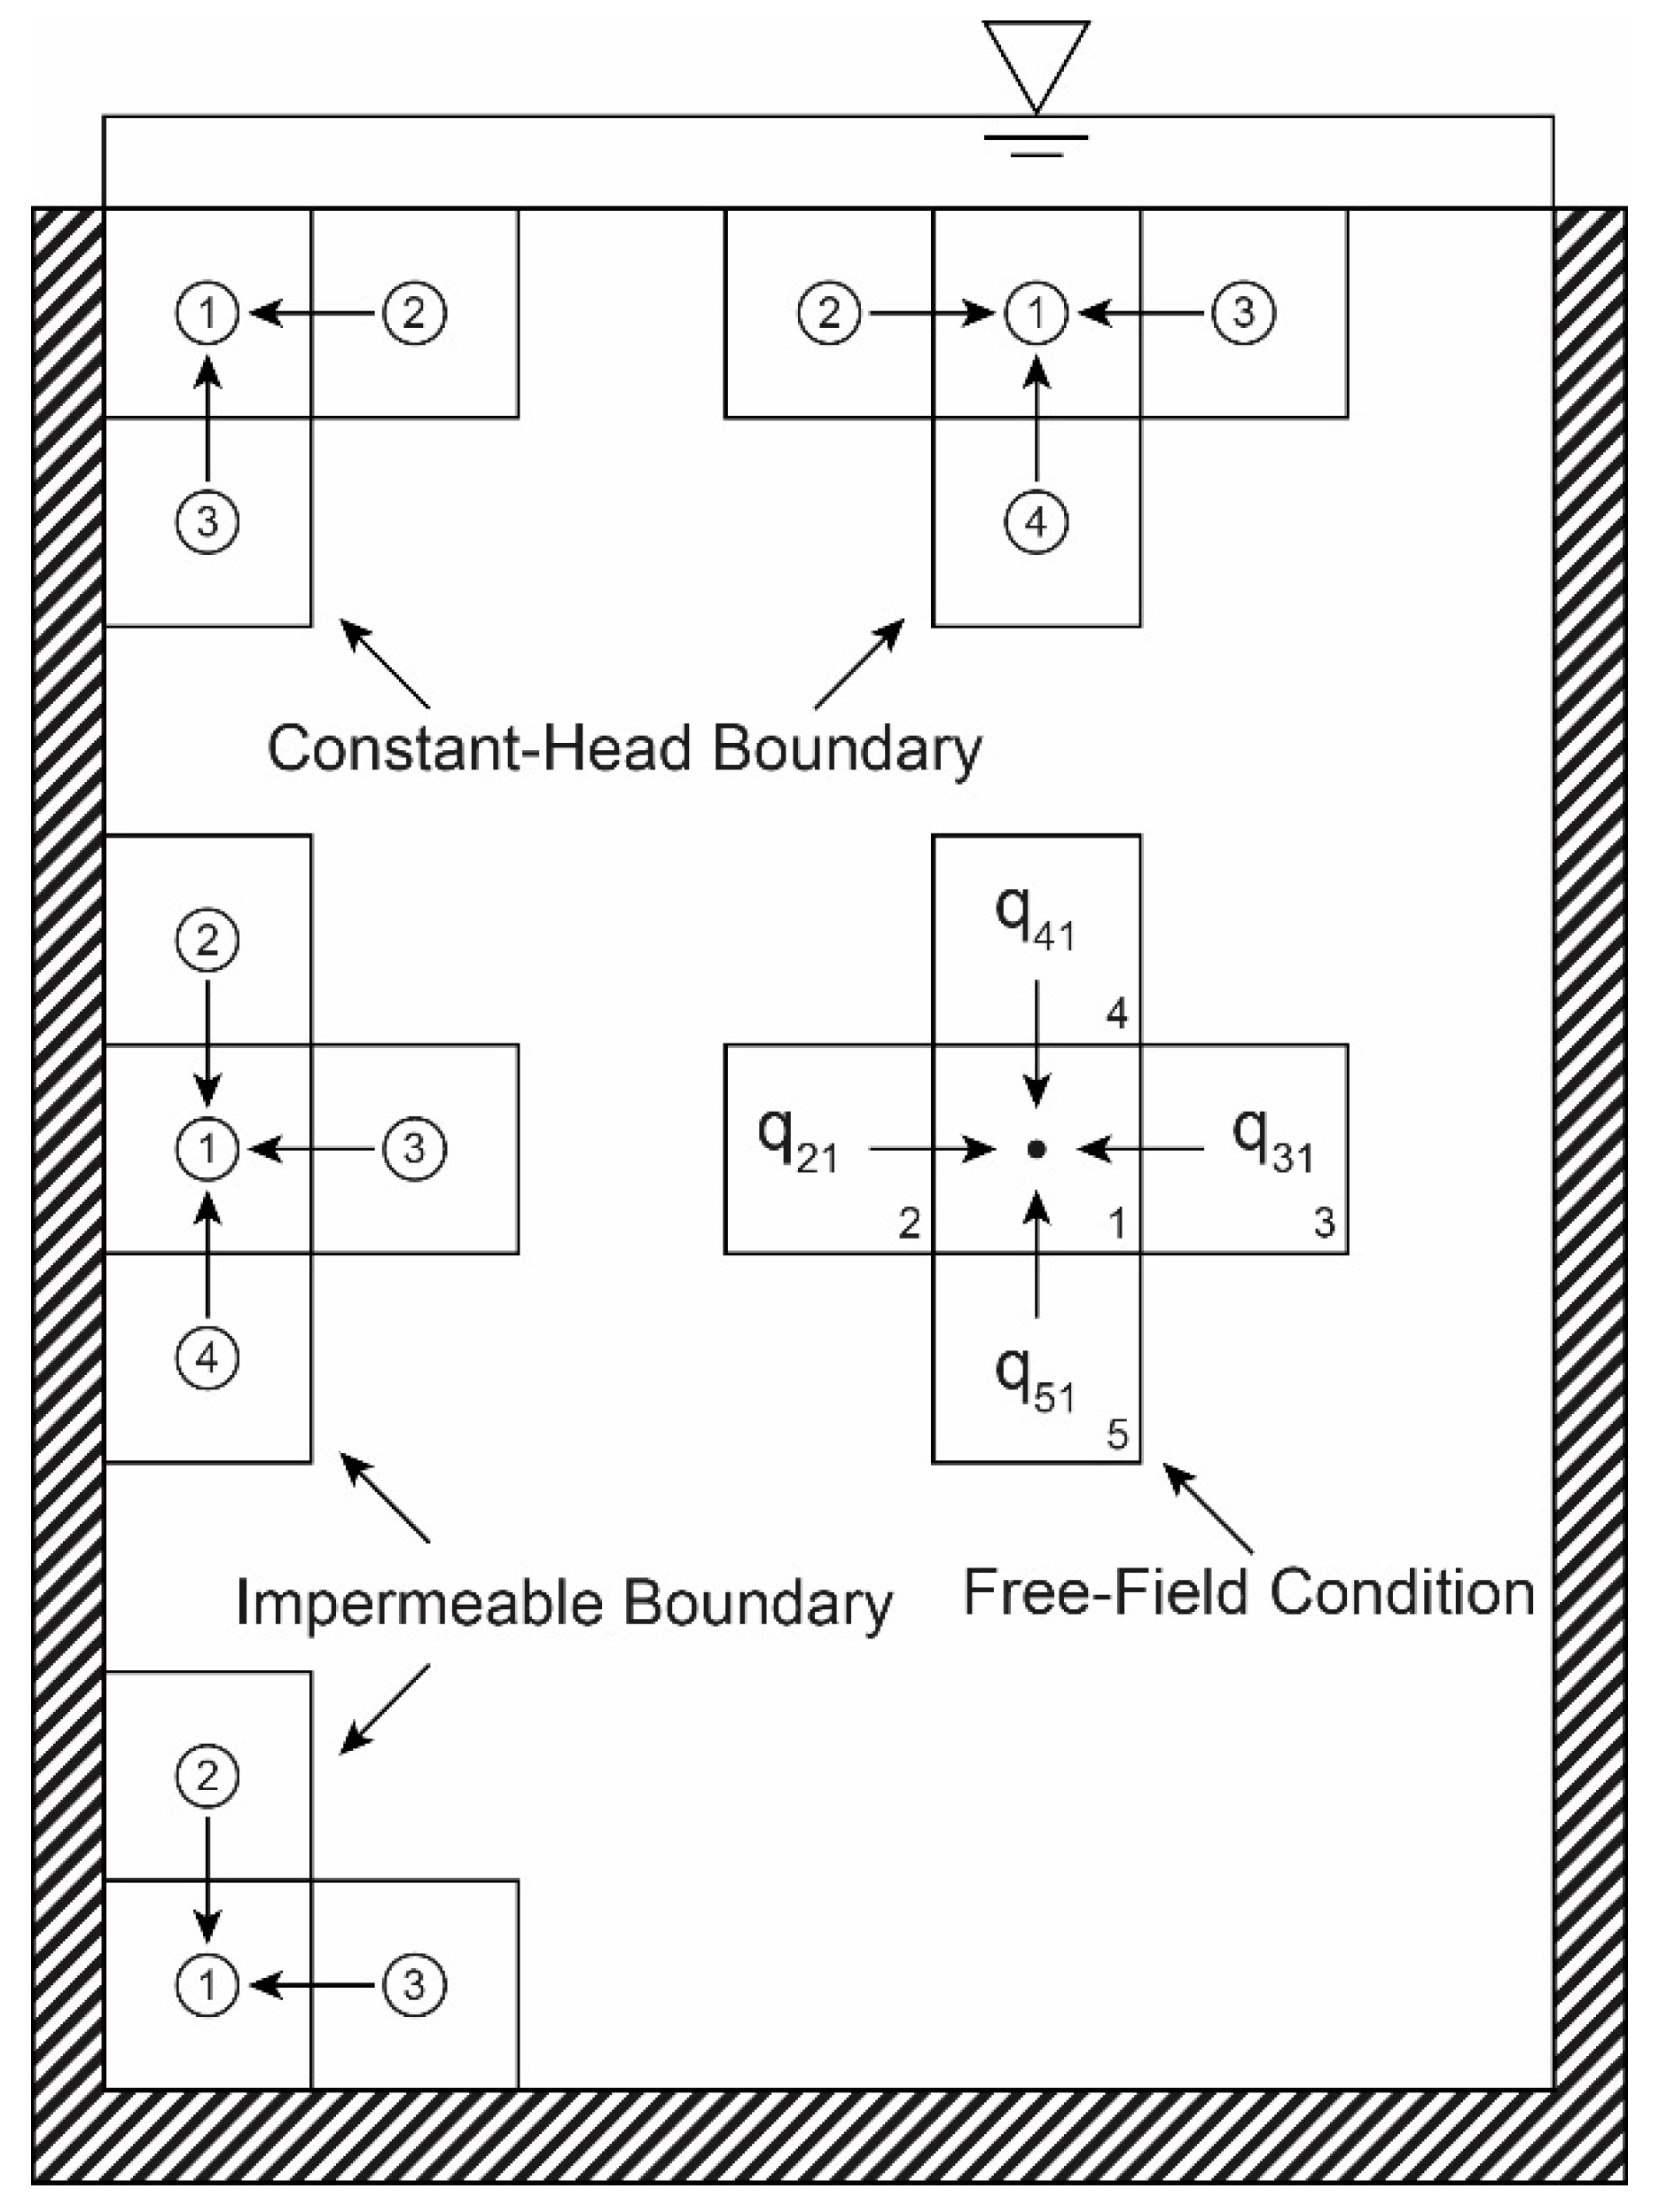
2.4. Finite Element Approximation of Darcy’s Law
2.5. Contaminant Removal Modeling
3. Results
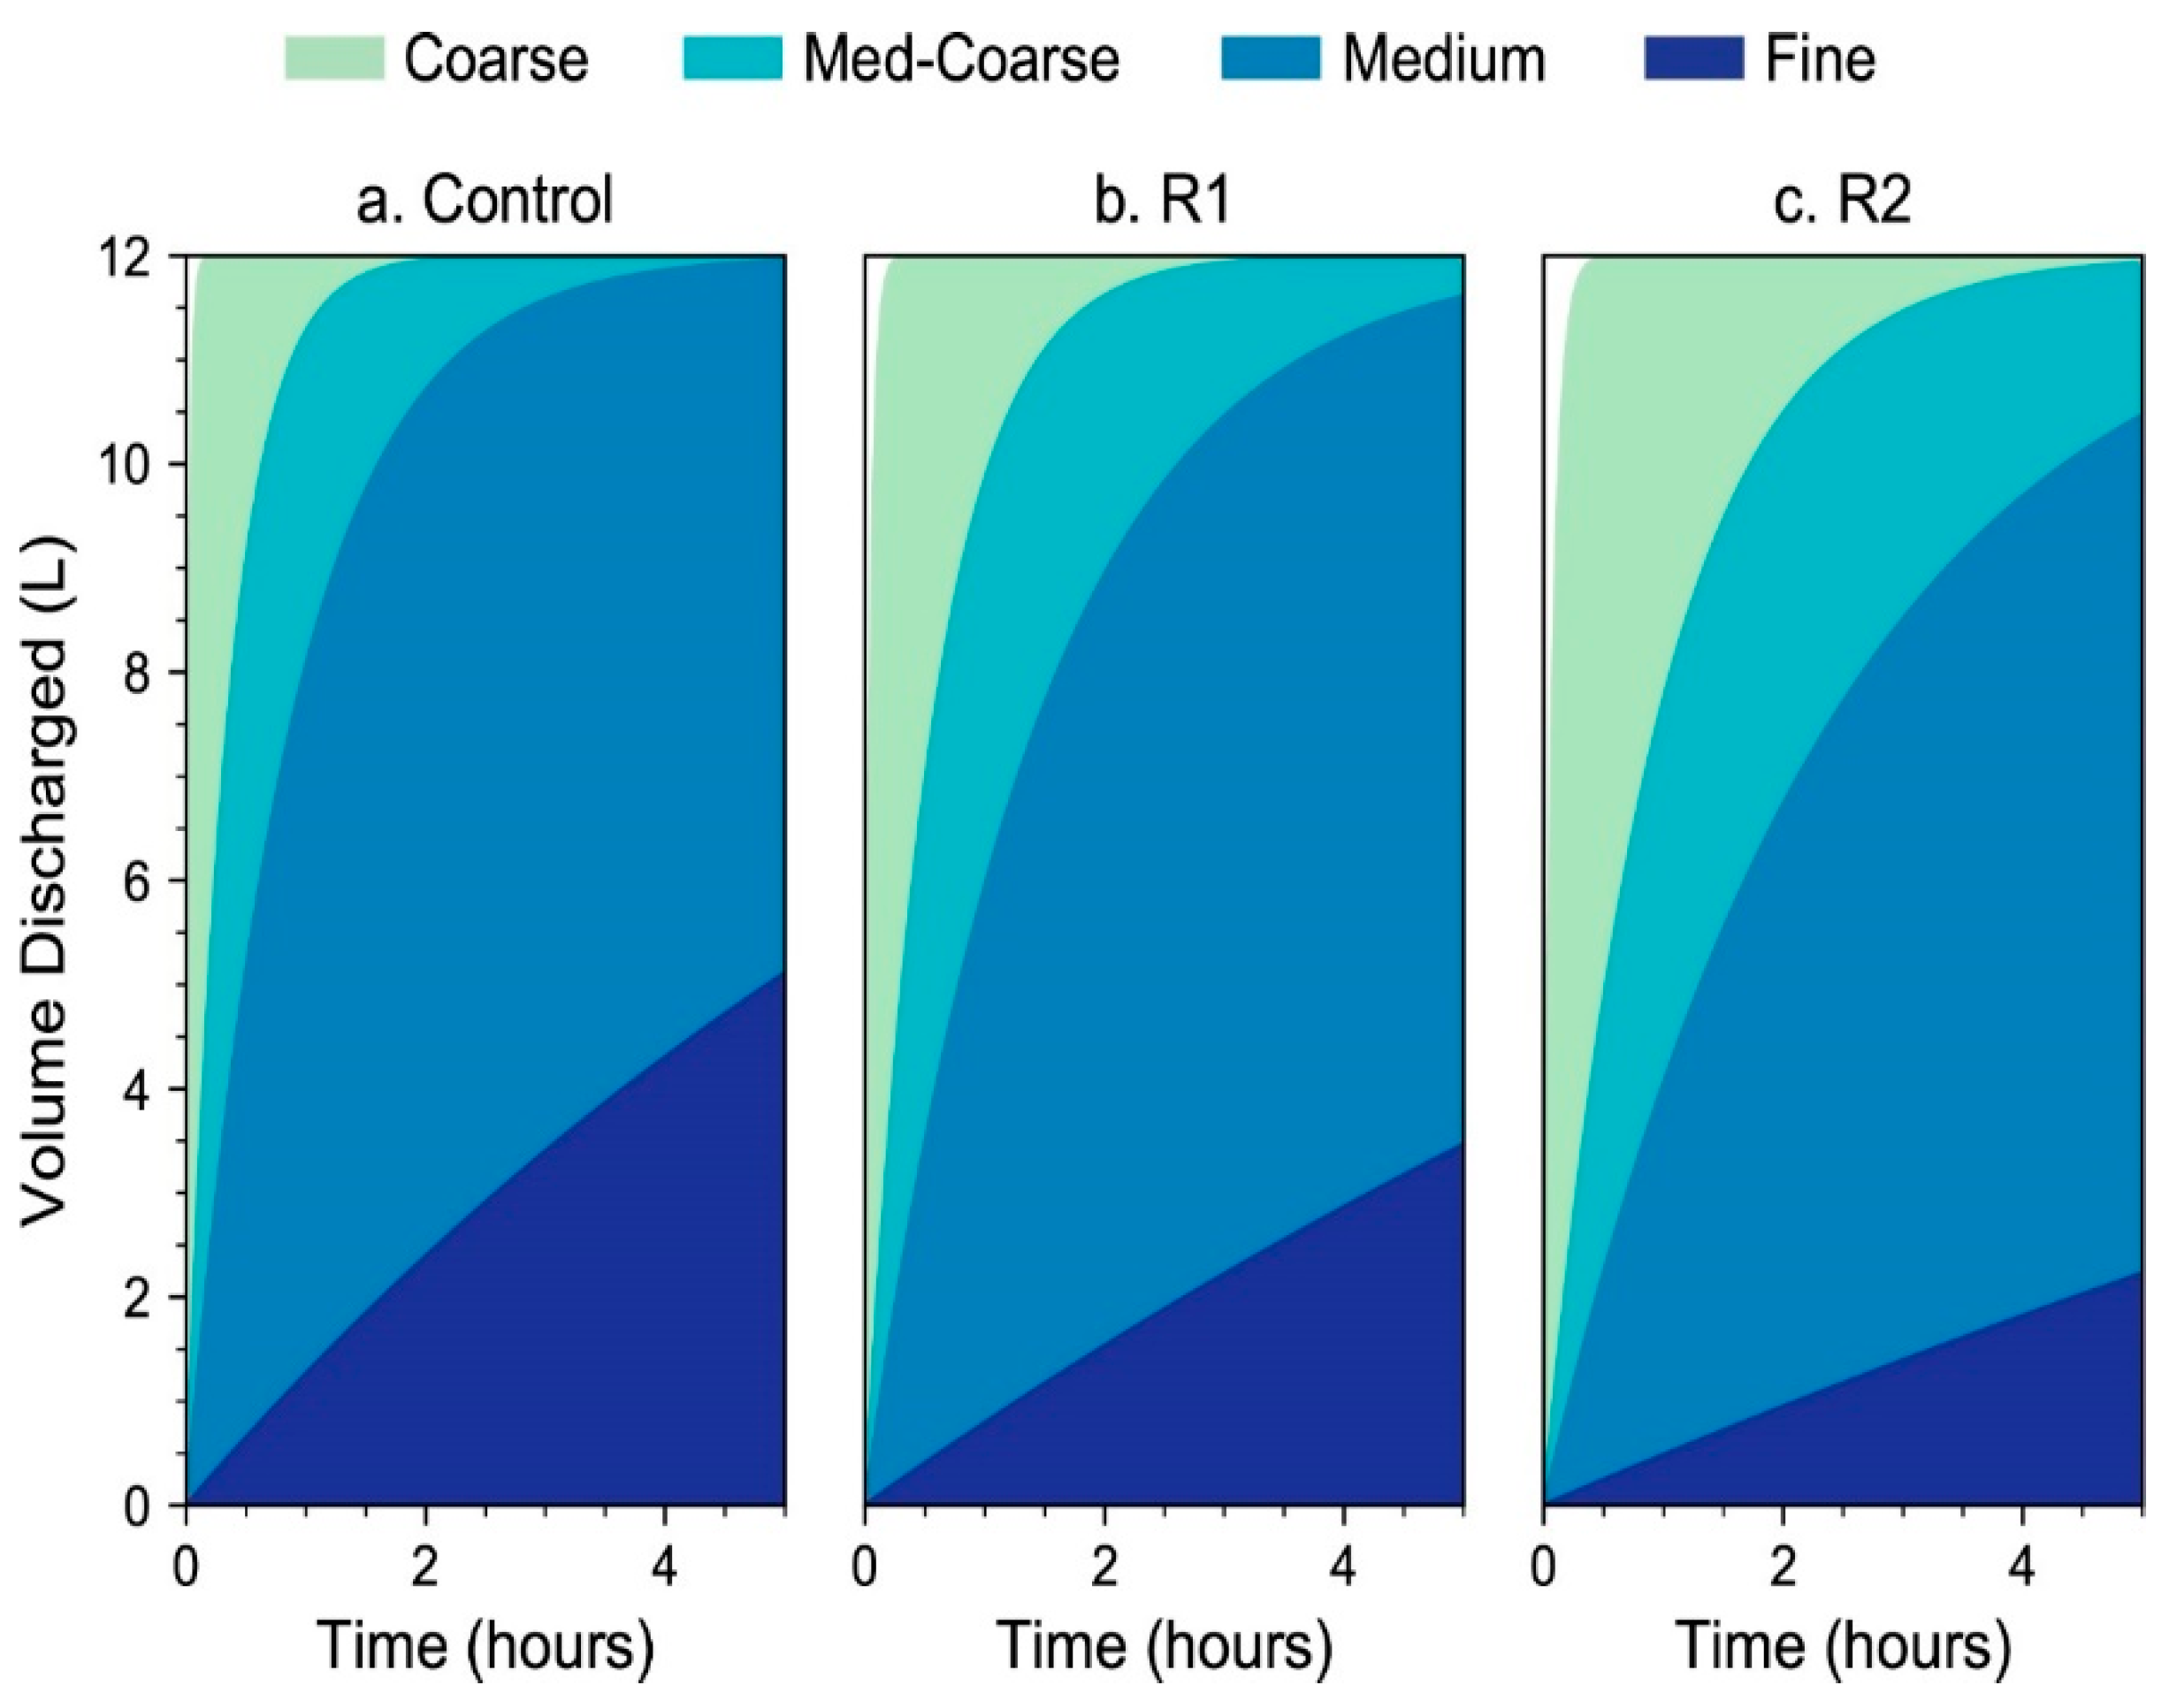
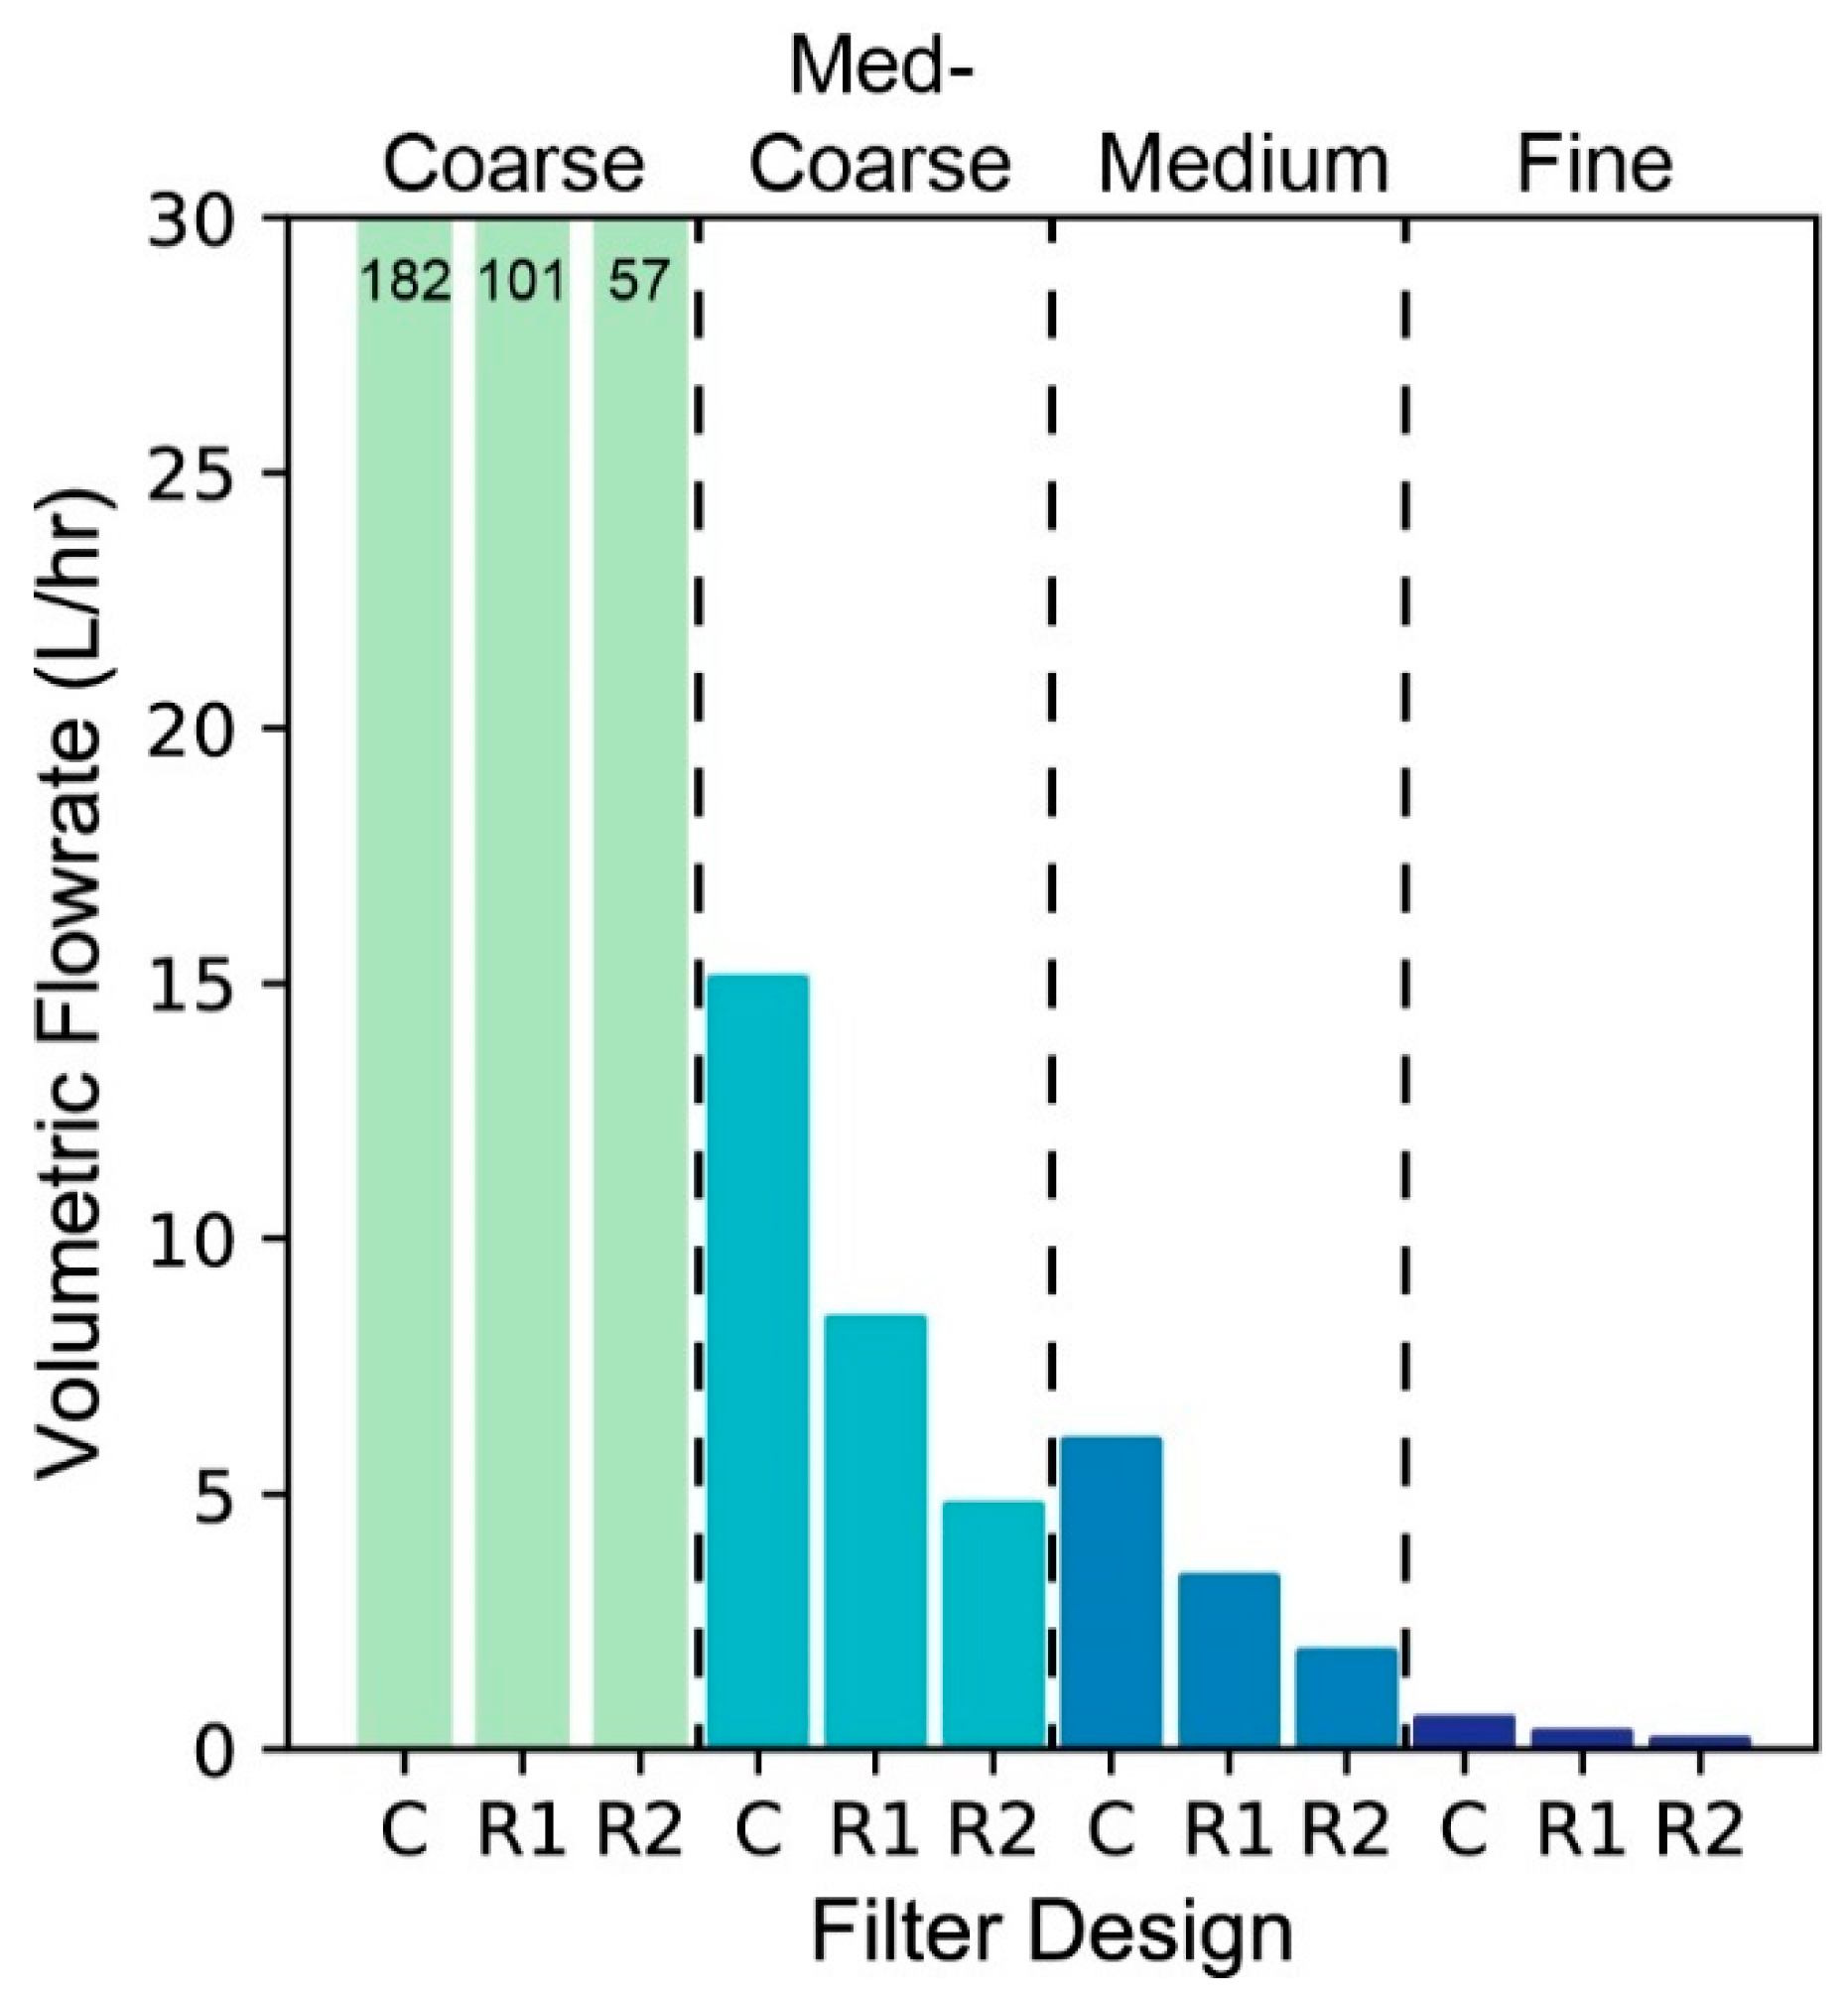
3.1. Fluid Velocity and Discharge
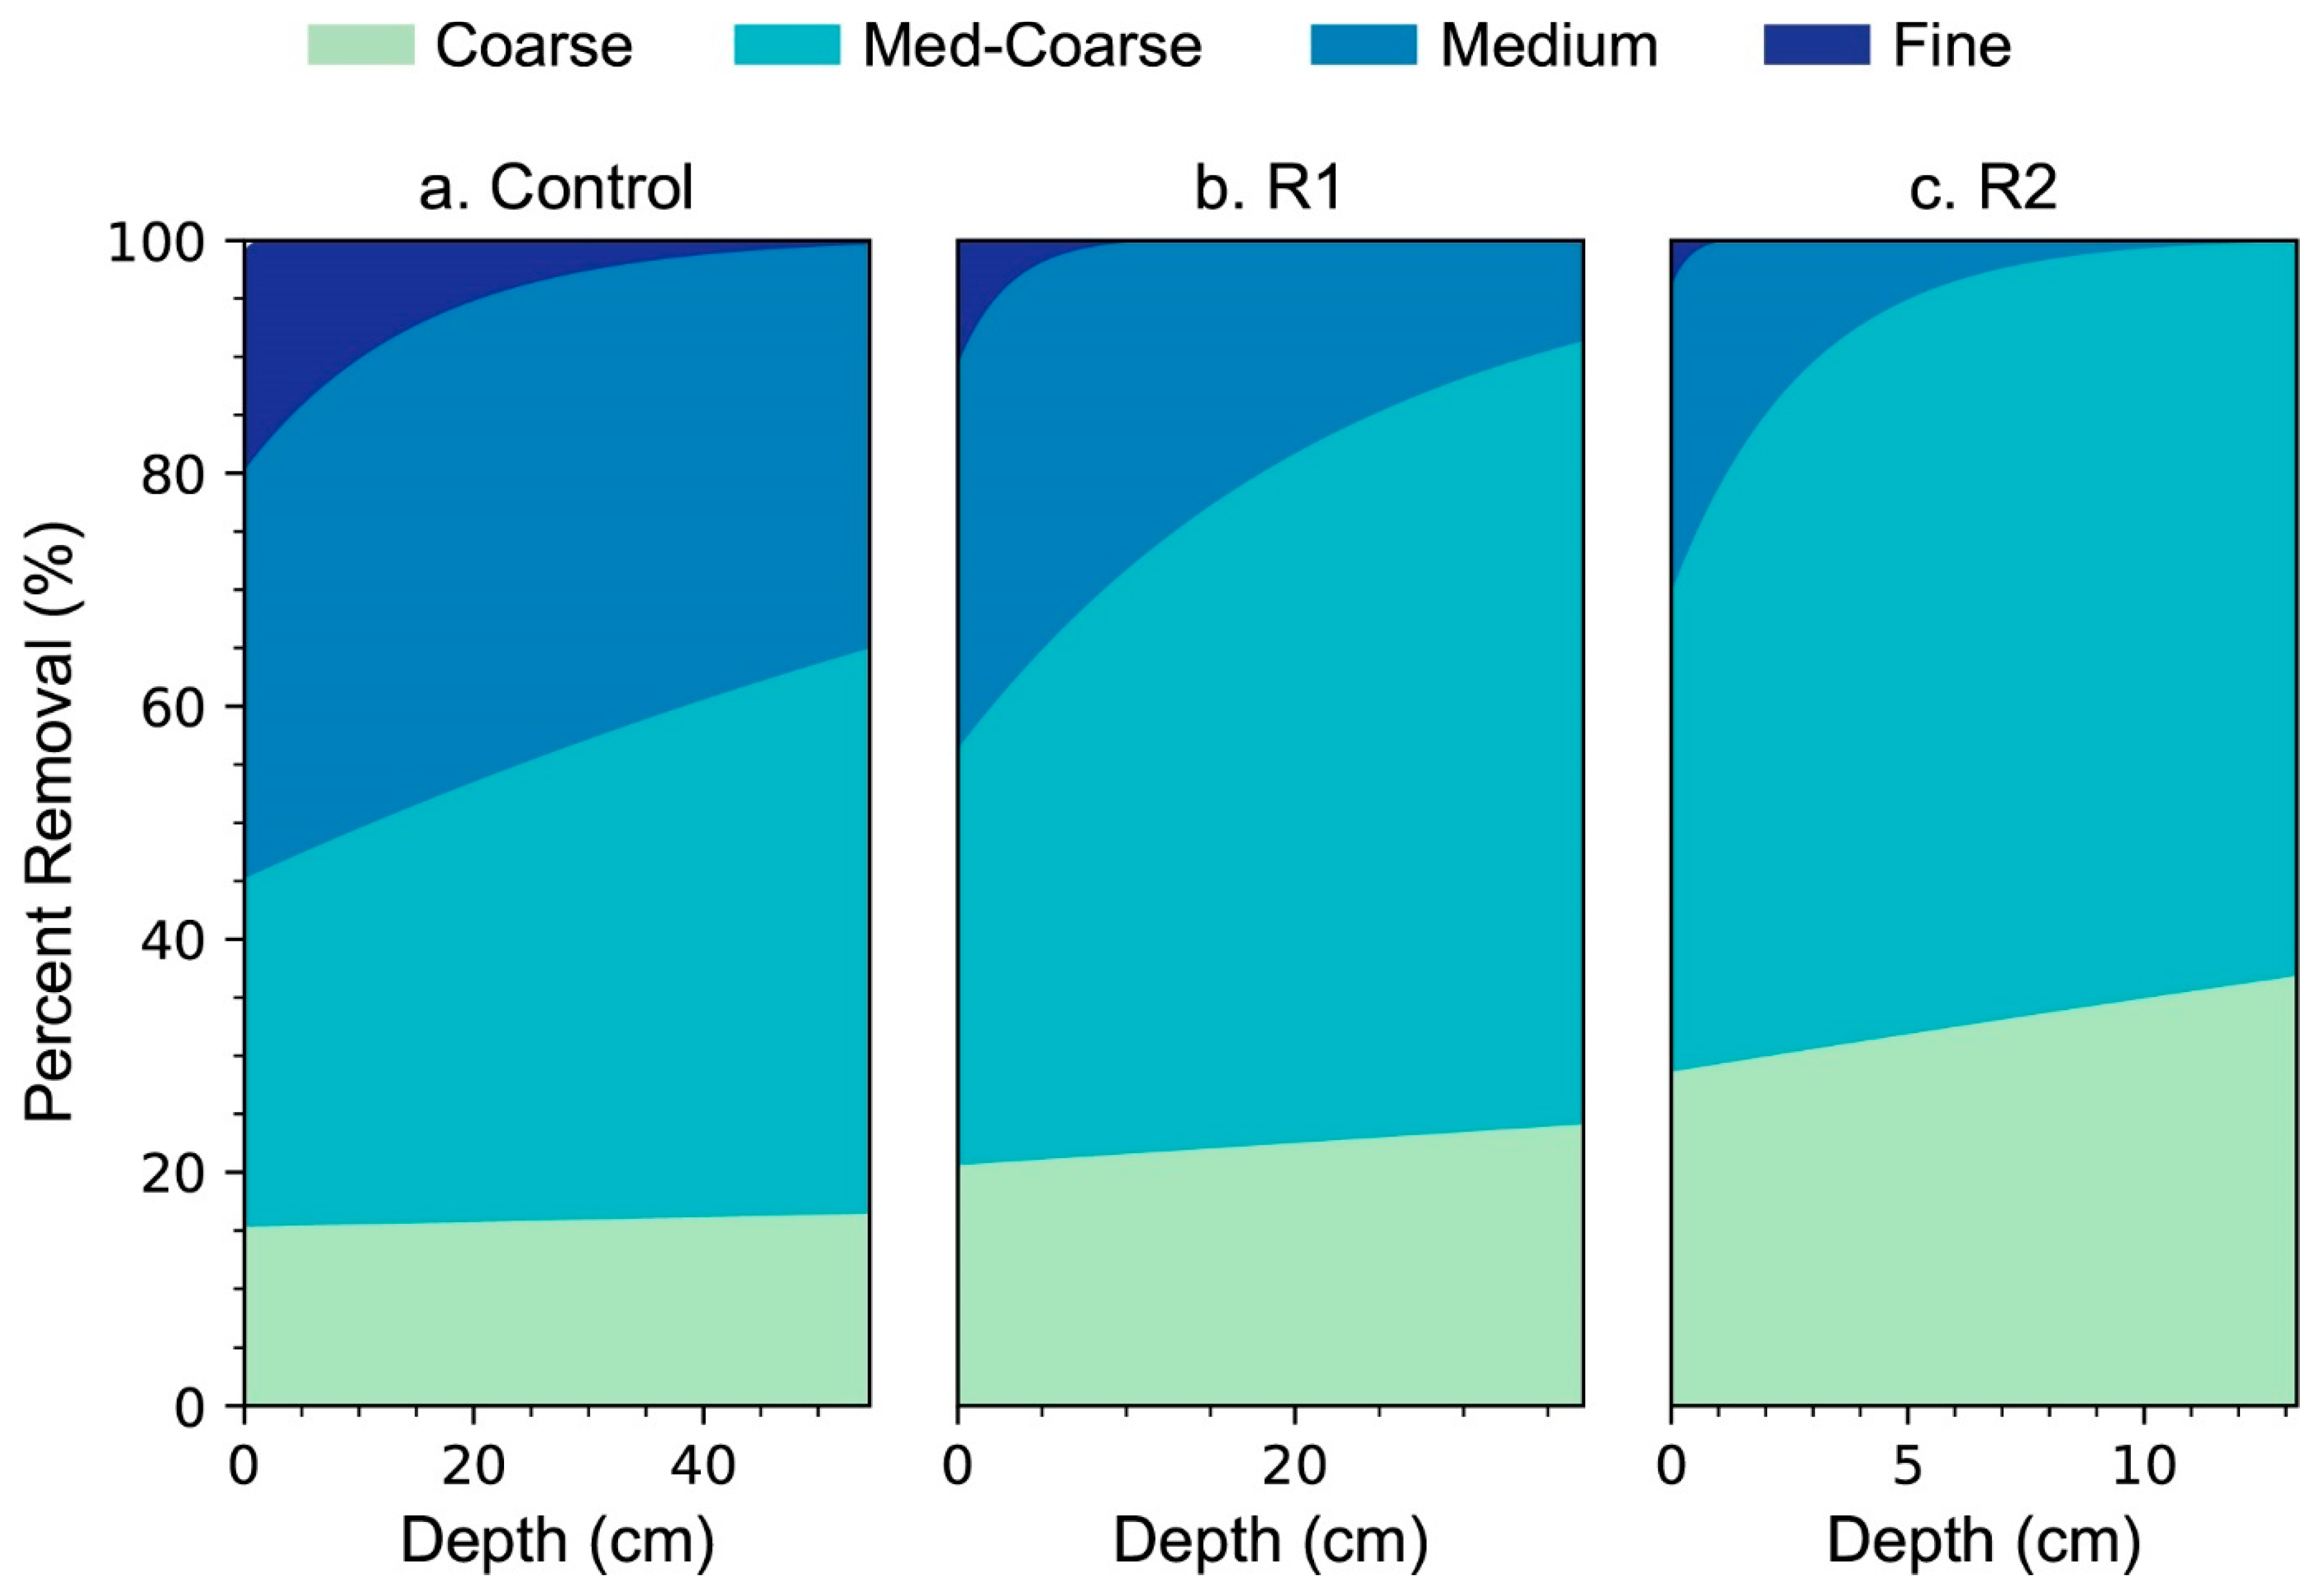
3.2. Contaminant Removal
4. Discussion
4.1. Comparison Between Designs
4.2. Biolayer Age and Media Depth
4.3. Literature Agreement
4.4. Comparison to Ceramic Filtration
4.5. Model Limitations and Experimental Error
4.6. Practical Design Applications
5. Conclusions
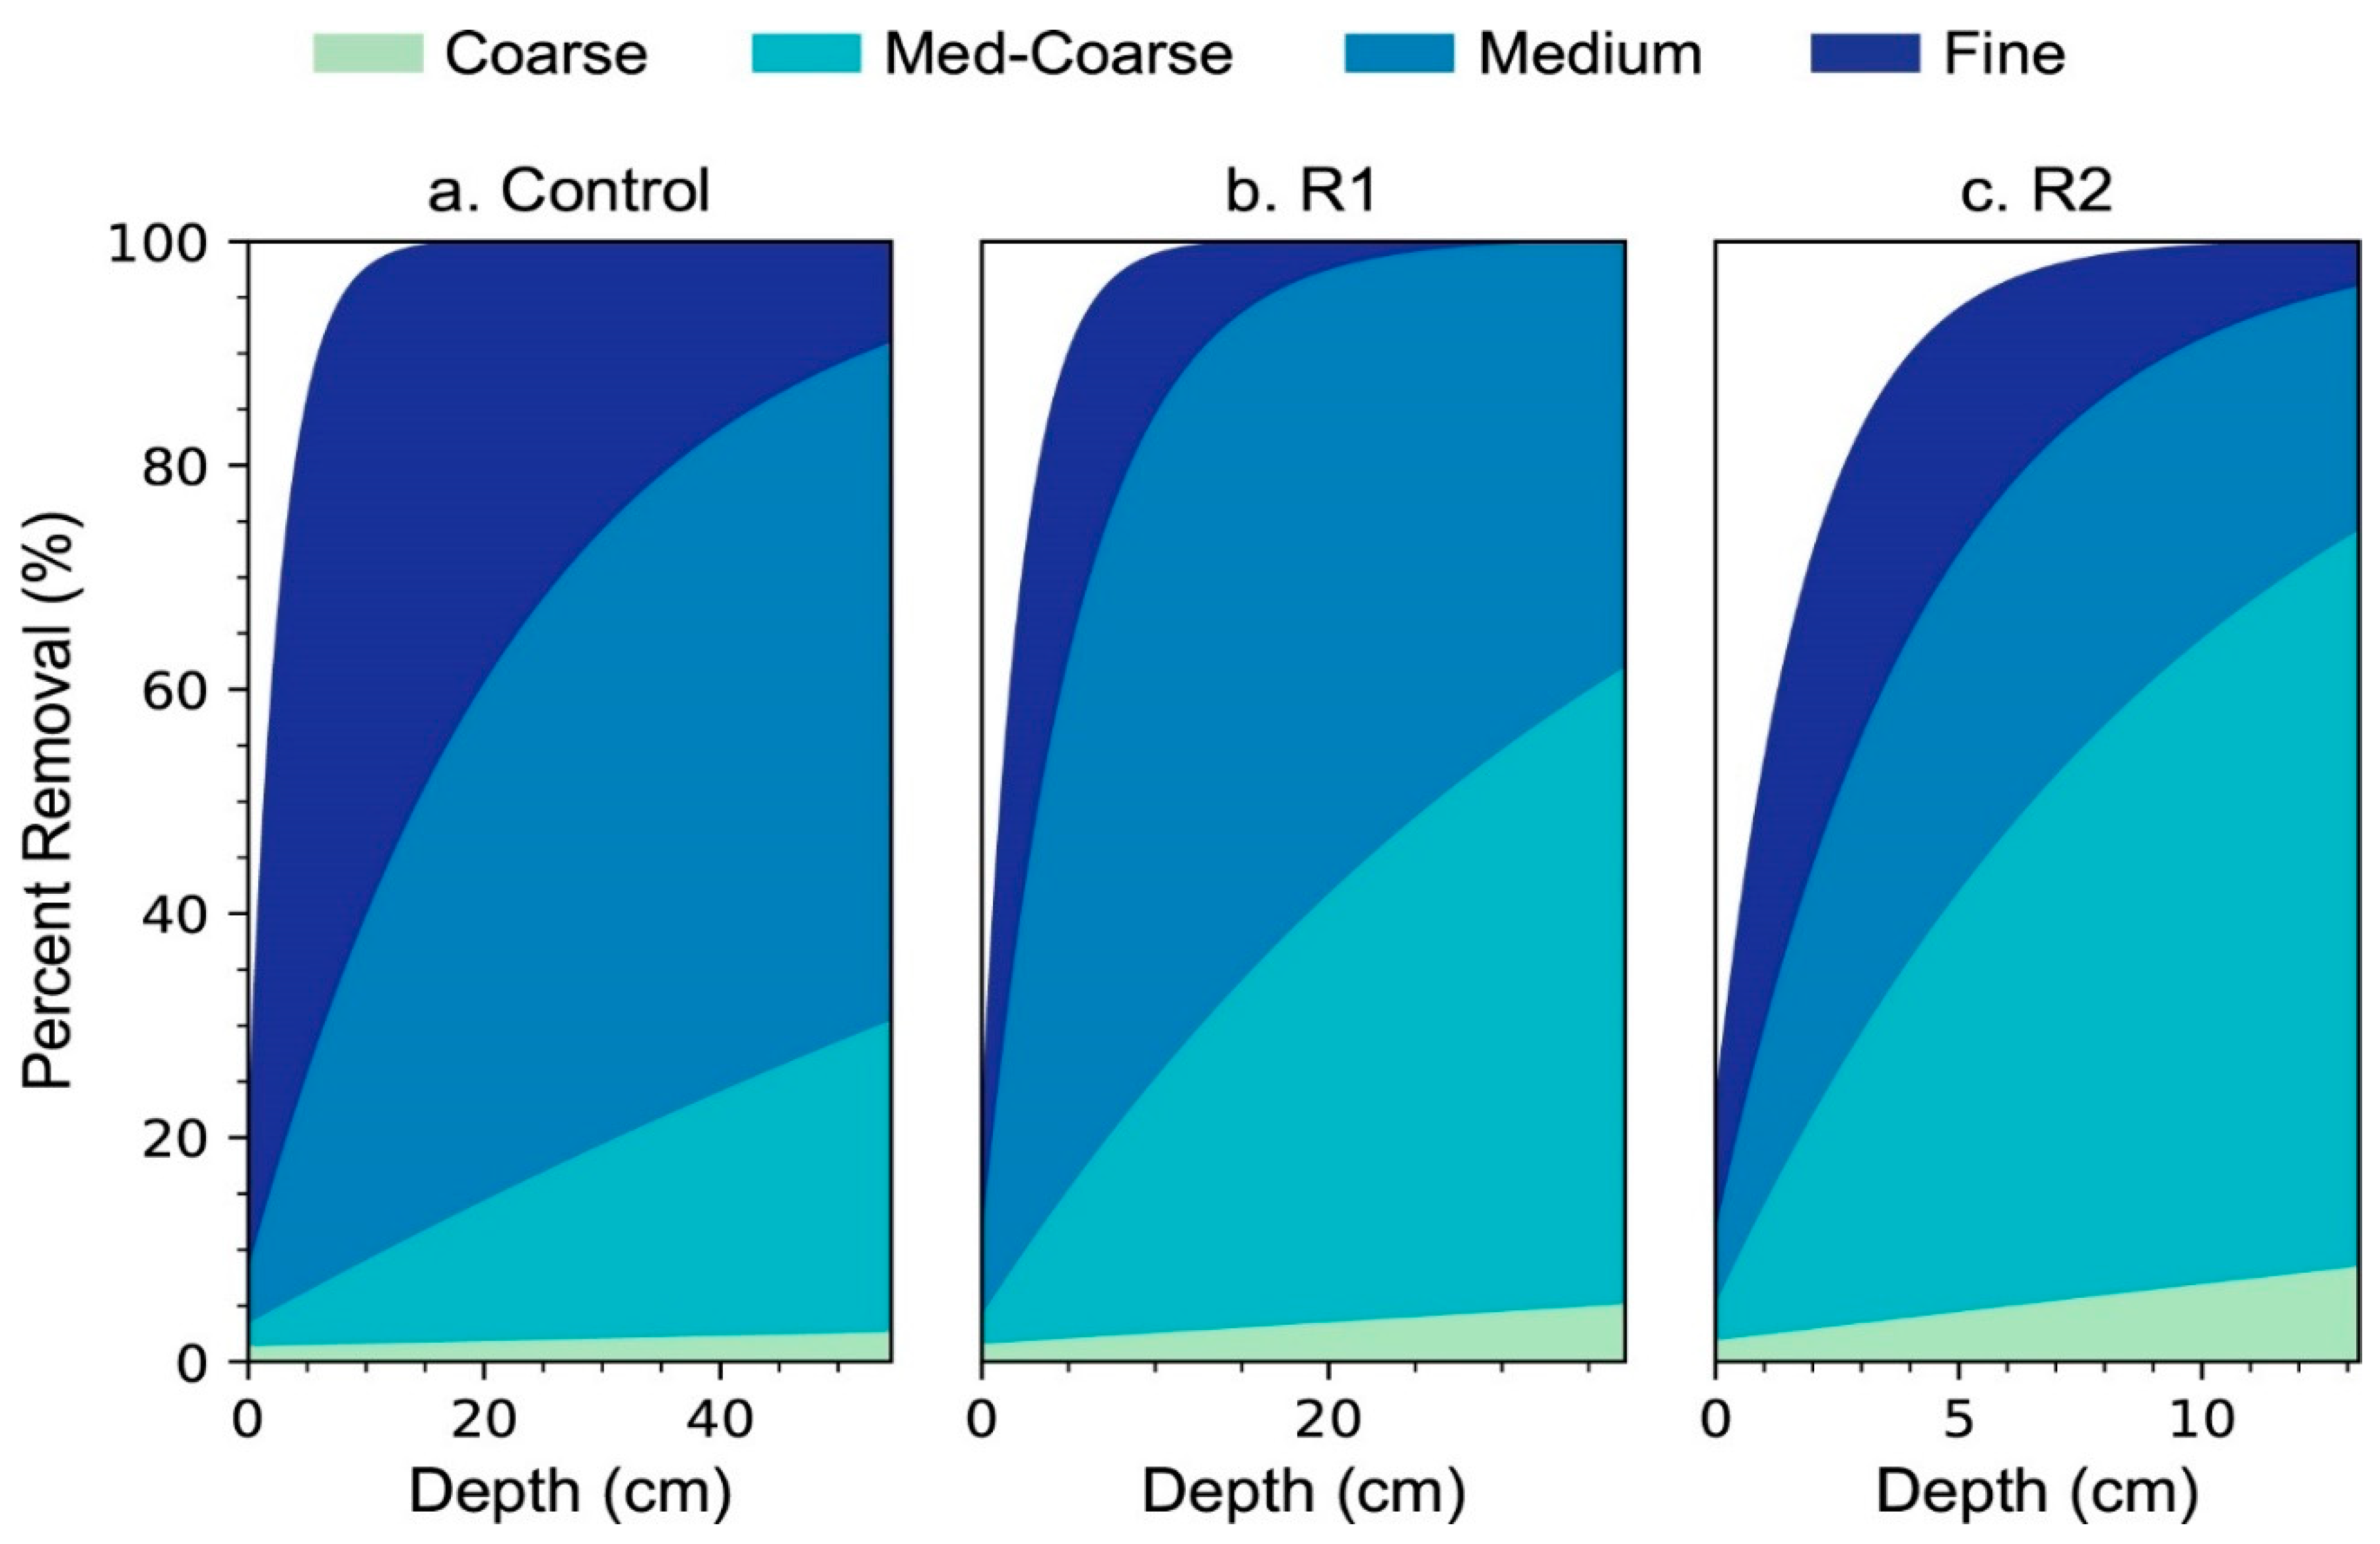
- Slower fluid velocities through the filter require less effective area depth, as residence times inside the filter increase. Increased residence times allow for longer contact time with the both the biolayer and effective media which leads to greater bacteria removal and virus deactivation. For the BSF, slow velocities are directly related to the hydraulic conductivity of the effective media, where fine sands have the greatest reduction in fluid velocity. Thus, BSF designs with finer-grained media can be designed with shorter filter bodies relative to the traditional BSF design size. Reduced velocities can also be achieved through decreased head pressure, which can be obtained by a shorter standing height on top of the filter media with each use. To maintain the total volume of discharged water, reduced standing heights require a wider filter body than the traditional design.
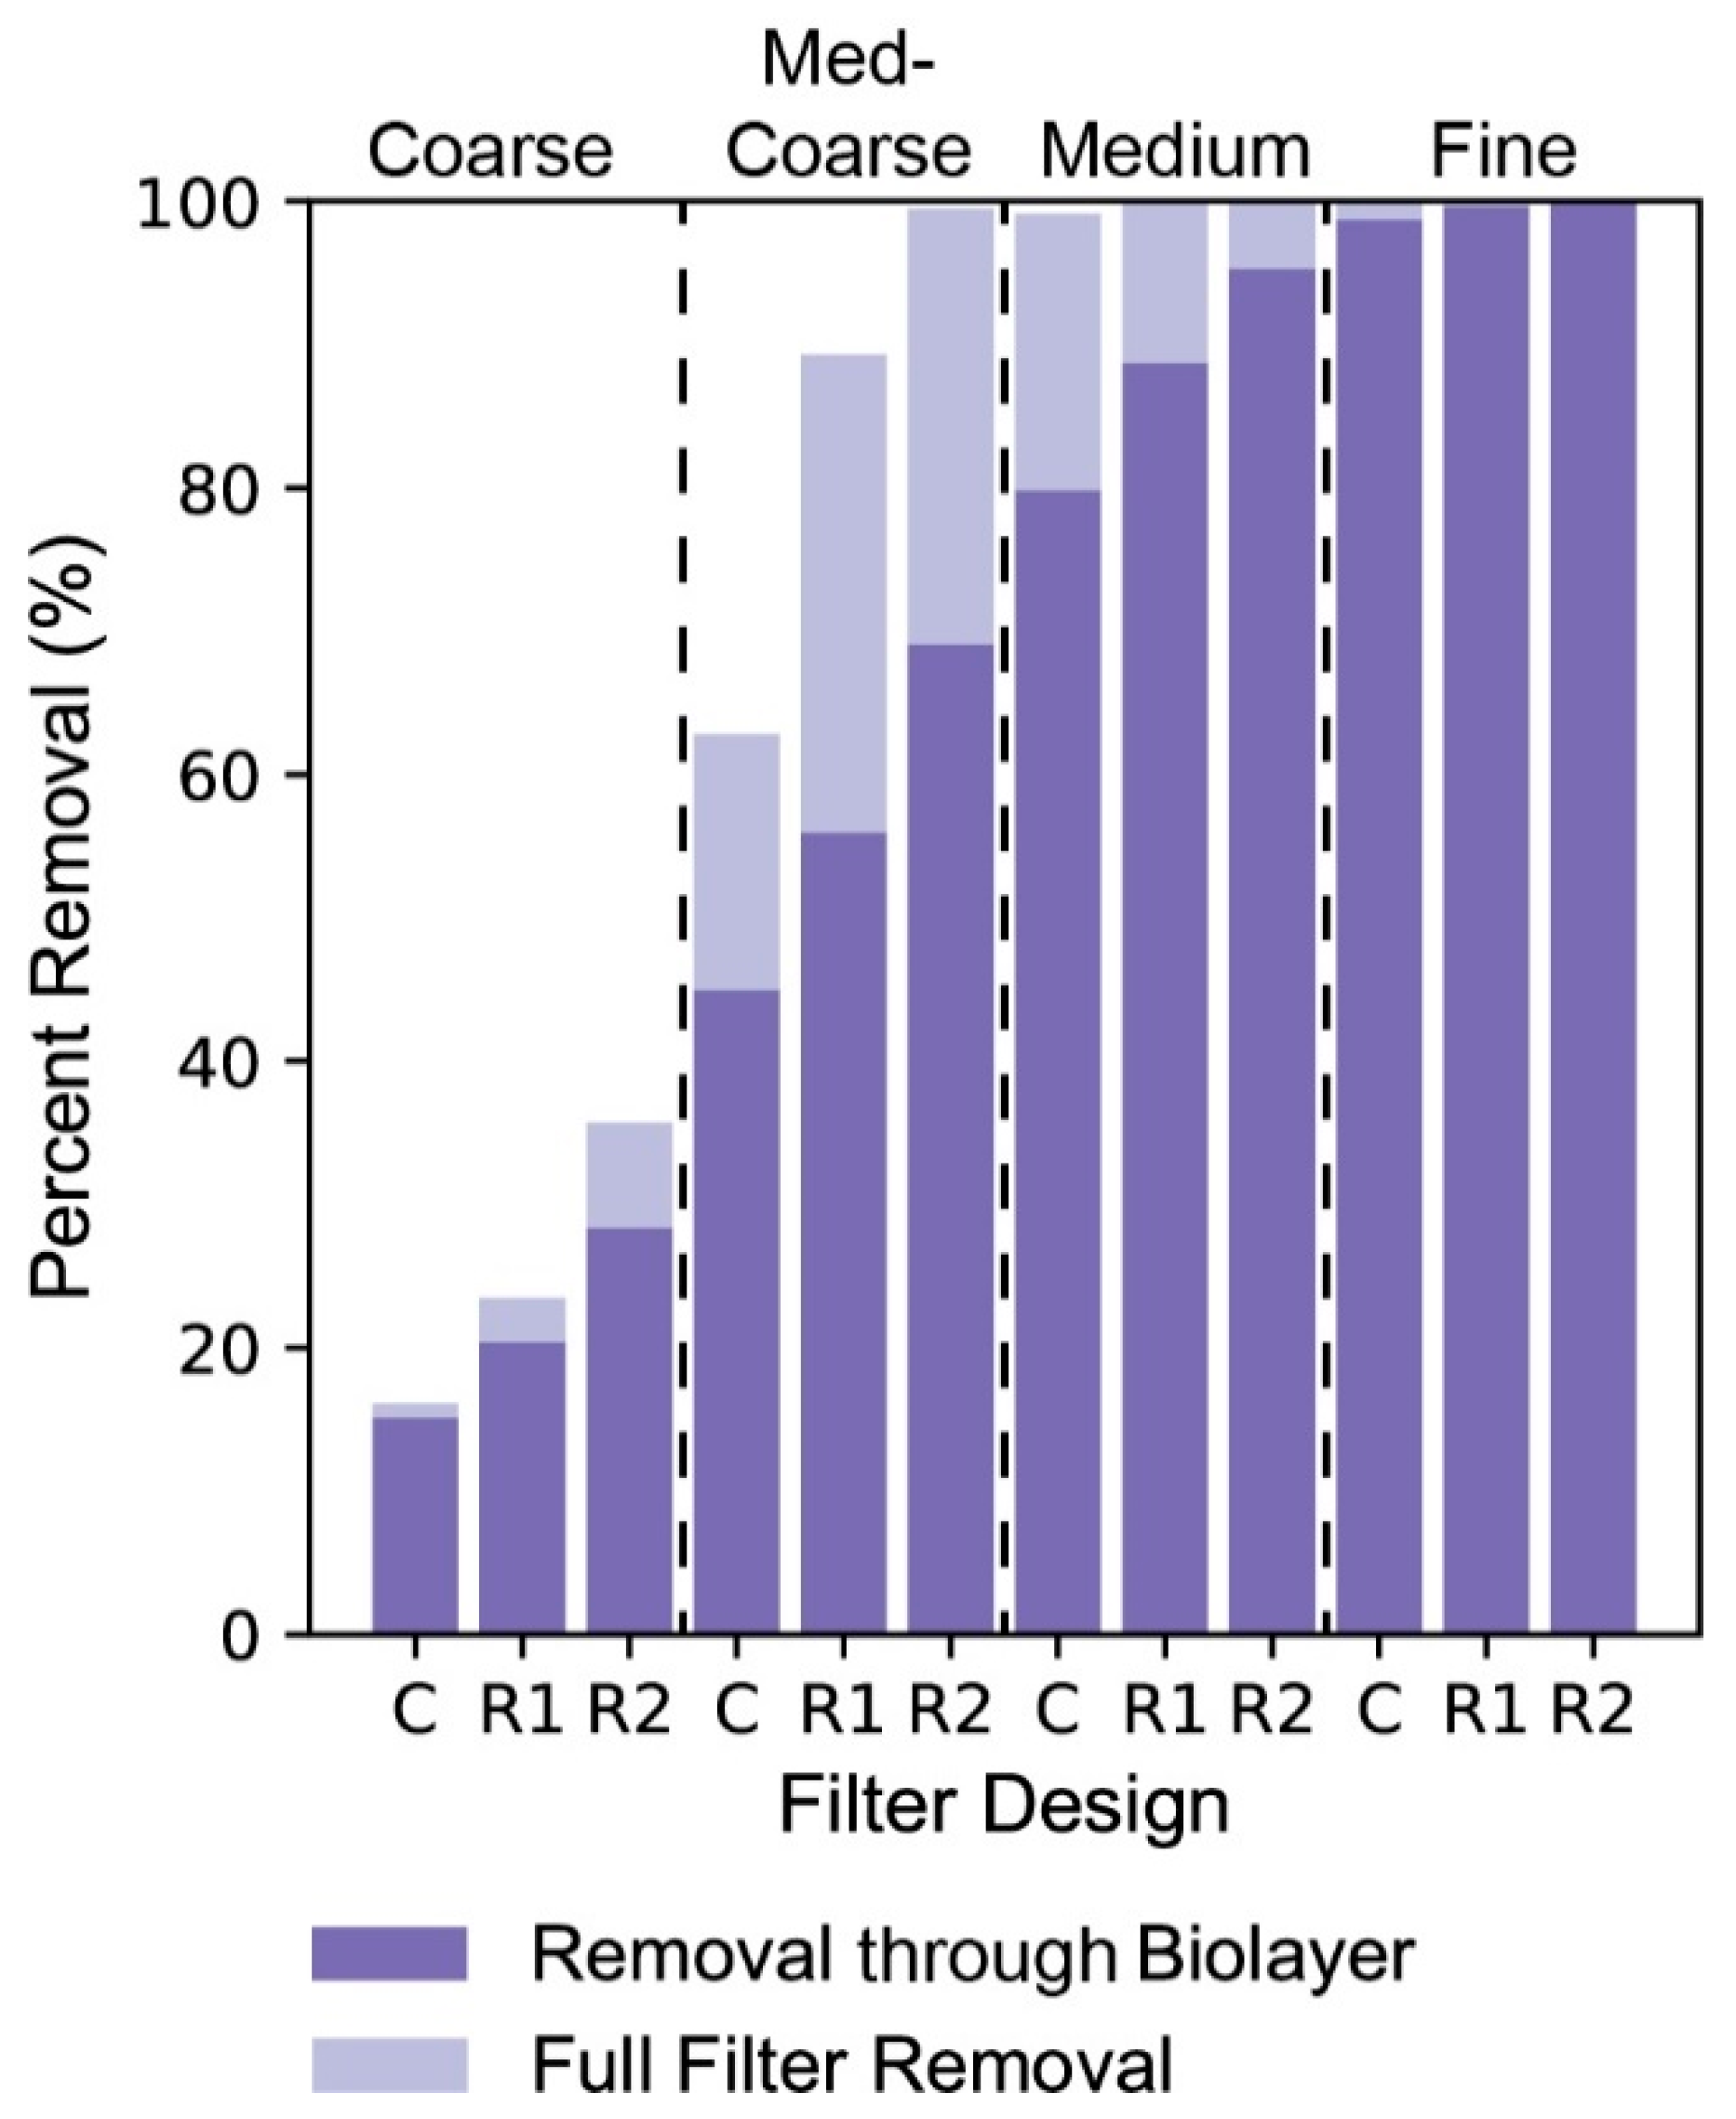
- Increased biolayer area leads to greater contaminant removal. Particularly for bacteria, contact with the biolayer is the most notable filtering mechanism in the BSF. Designs which increase the biolayer area relative to the traditional BSF design will have greater contaminant removal rates, assuming other conditions are consistent between filters. This can be accomplished through a wider design, which also enables a reduced standing water height above the filter media and slower fluid velocity as outlined in Conclusion #1. Under the proper conditions, BSF technology can remove nearly all bacteria contaminants through just the biolayer.
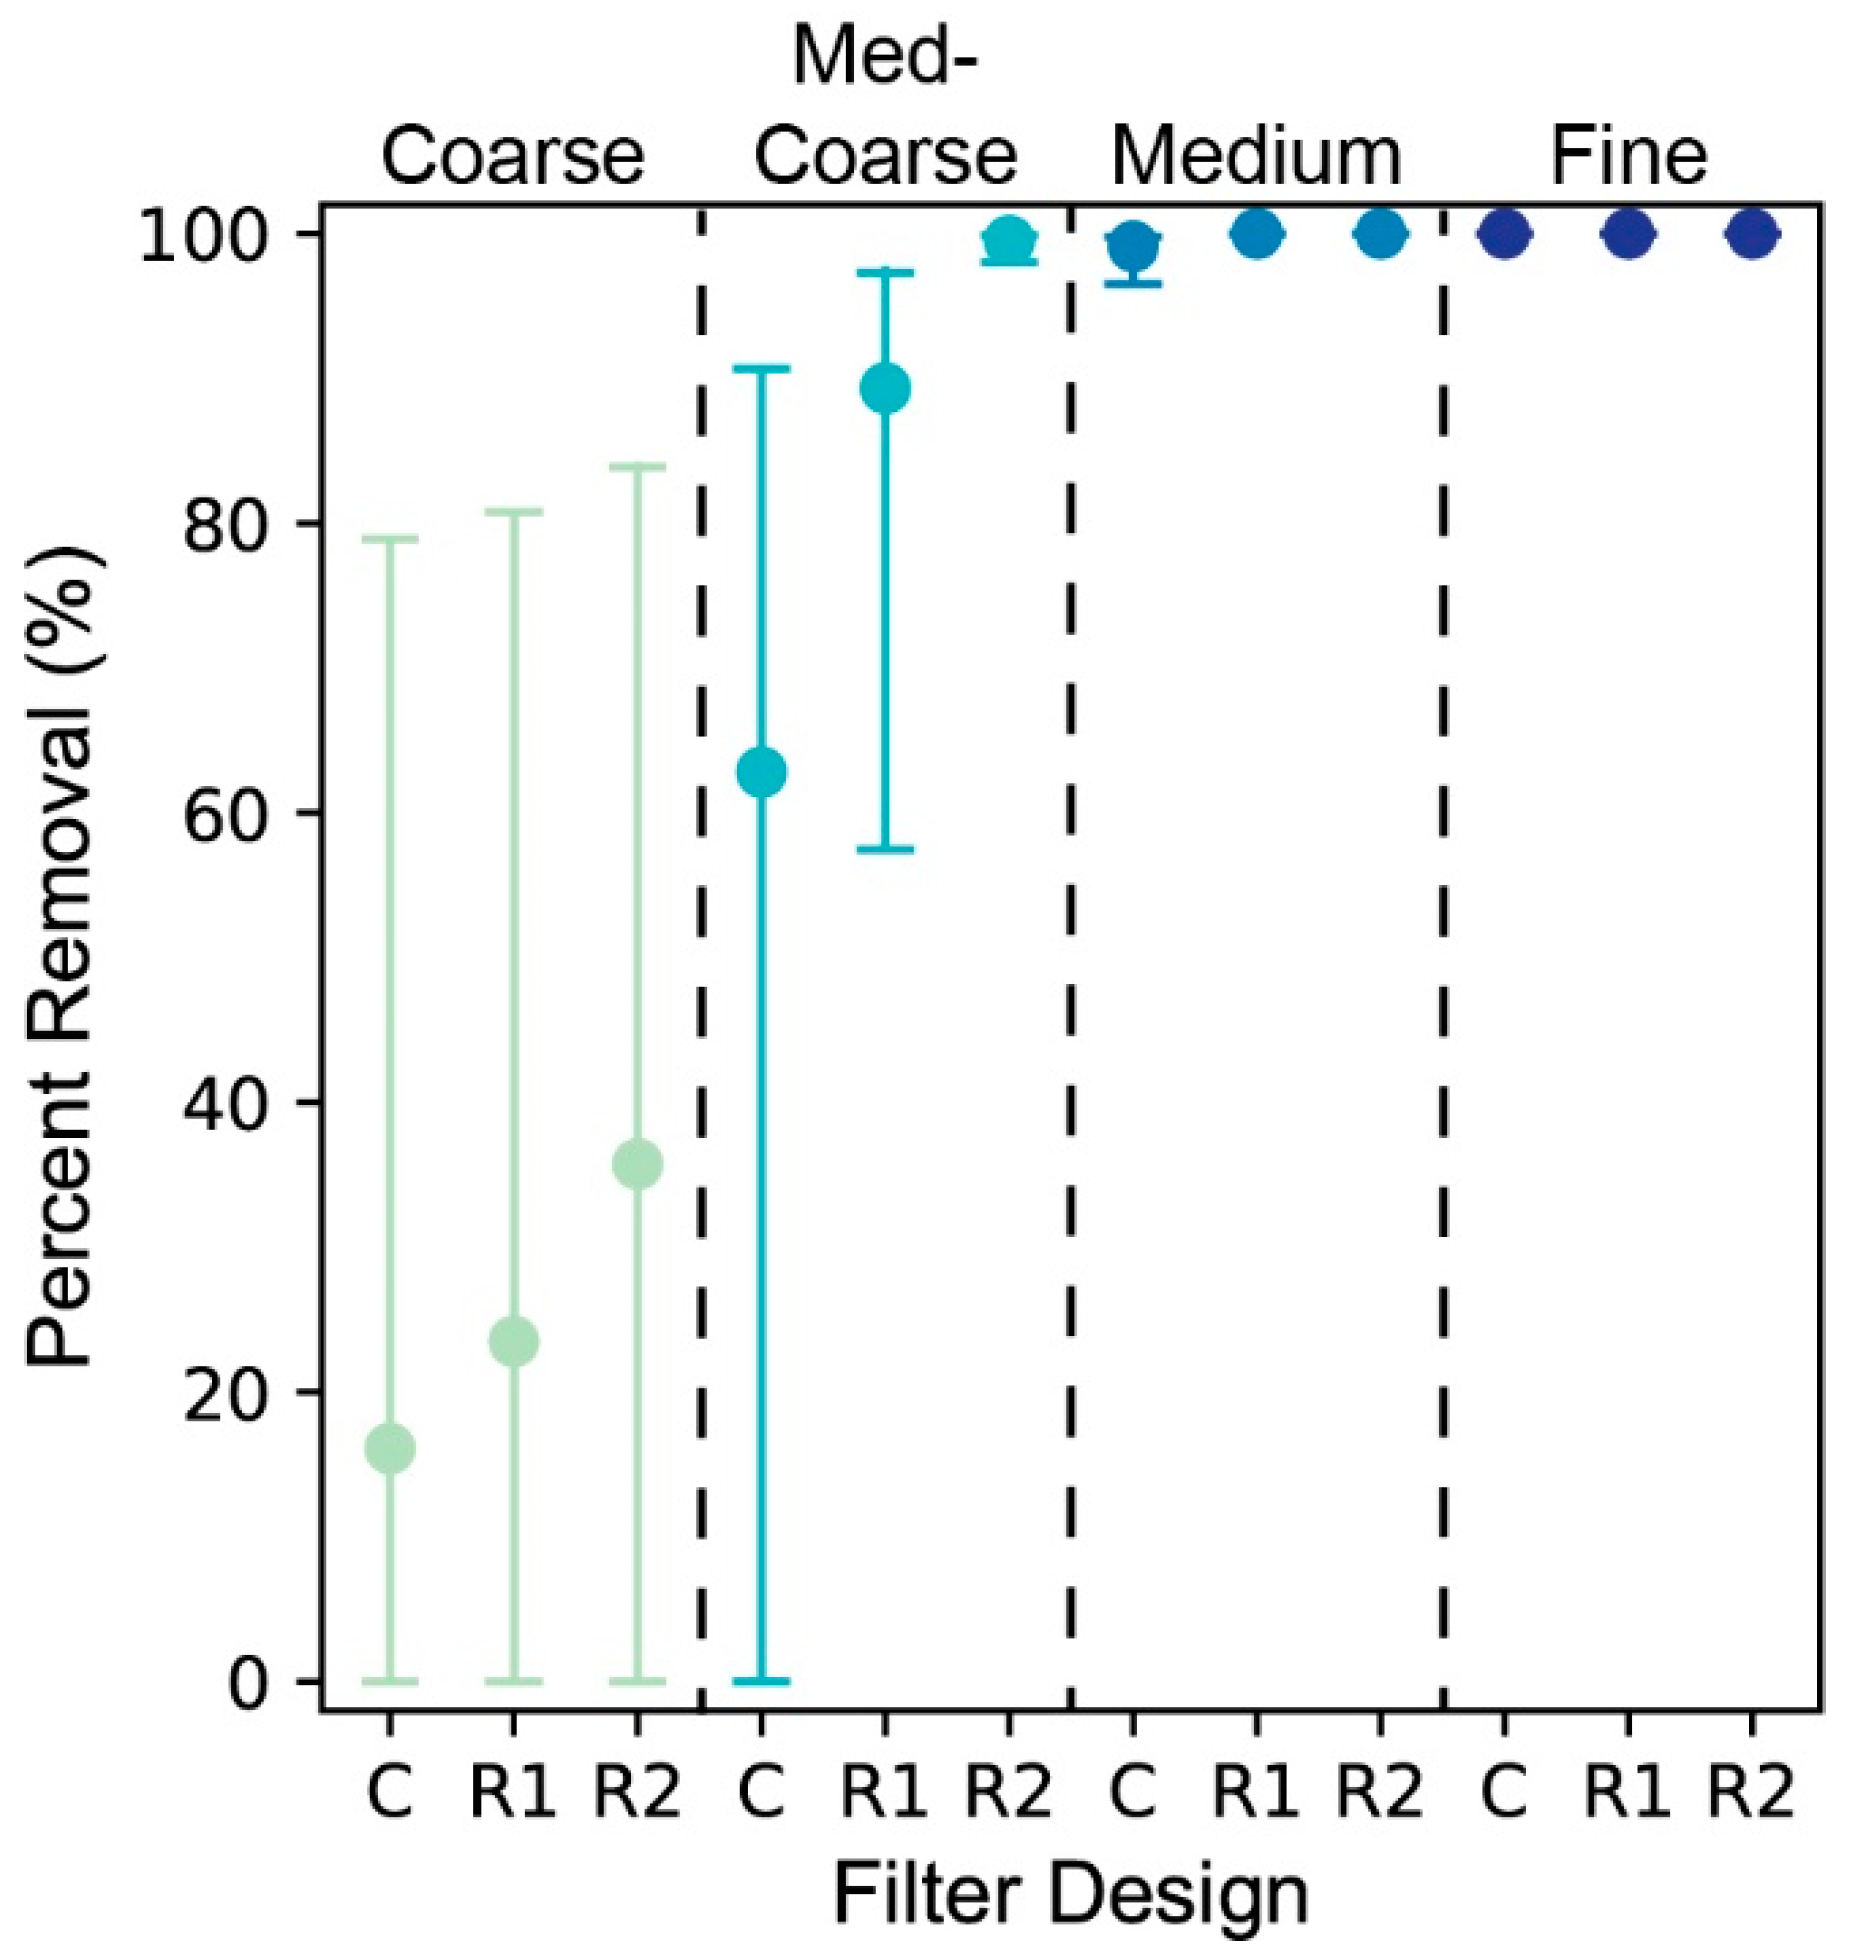
- Viruses, unlike bacteria, are less impacted by the biolayer and are more effectively removed with longer residence times inside the BSF. Longer residence times can be achieved by decreased media grain size (i.e., hydraulic conductivity), taller effective areas (i.e., taller filter bodies), or slower fluid velocity (i.e., slower water flow). With a modified design, BSF technology can remove 100% of virus contaminants.
- The R1 and R2 designs outperformed the traditional BSF in contaminant removal at all media grain sizes, but their total discharge was notably less. While not outside of other common HWT solutions at fine grain sizes, the discharge rates of R1 and R2 can be improved by a larger filter surface area or larger media grain sizes. With sand characteristics commonly used in the traditional BSF, both the R1 and R2 designs outperformed the traditional design while also maintaining practical discharge rates.
Author Contributions
Funding
Acknowledgments
Conflicts of Interest
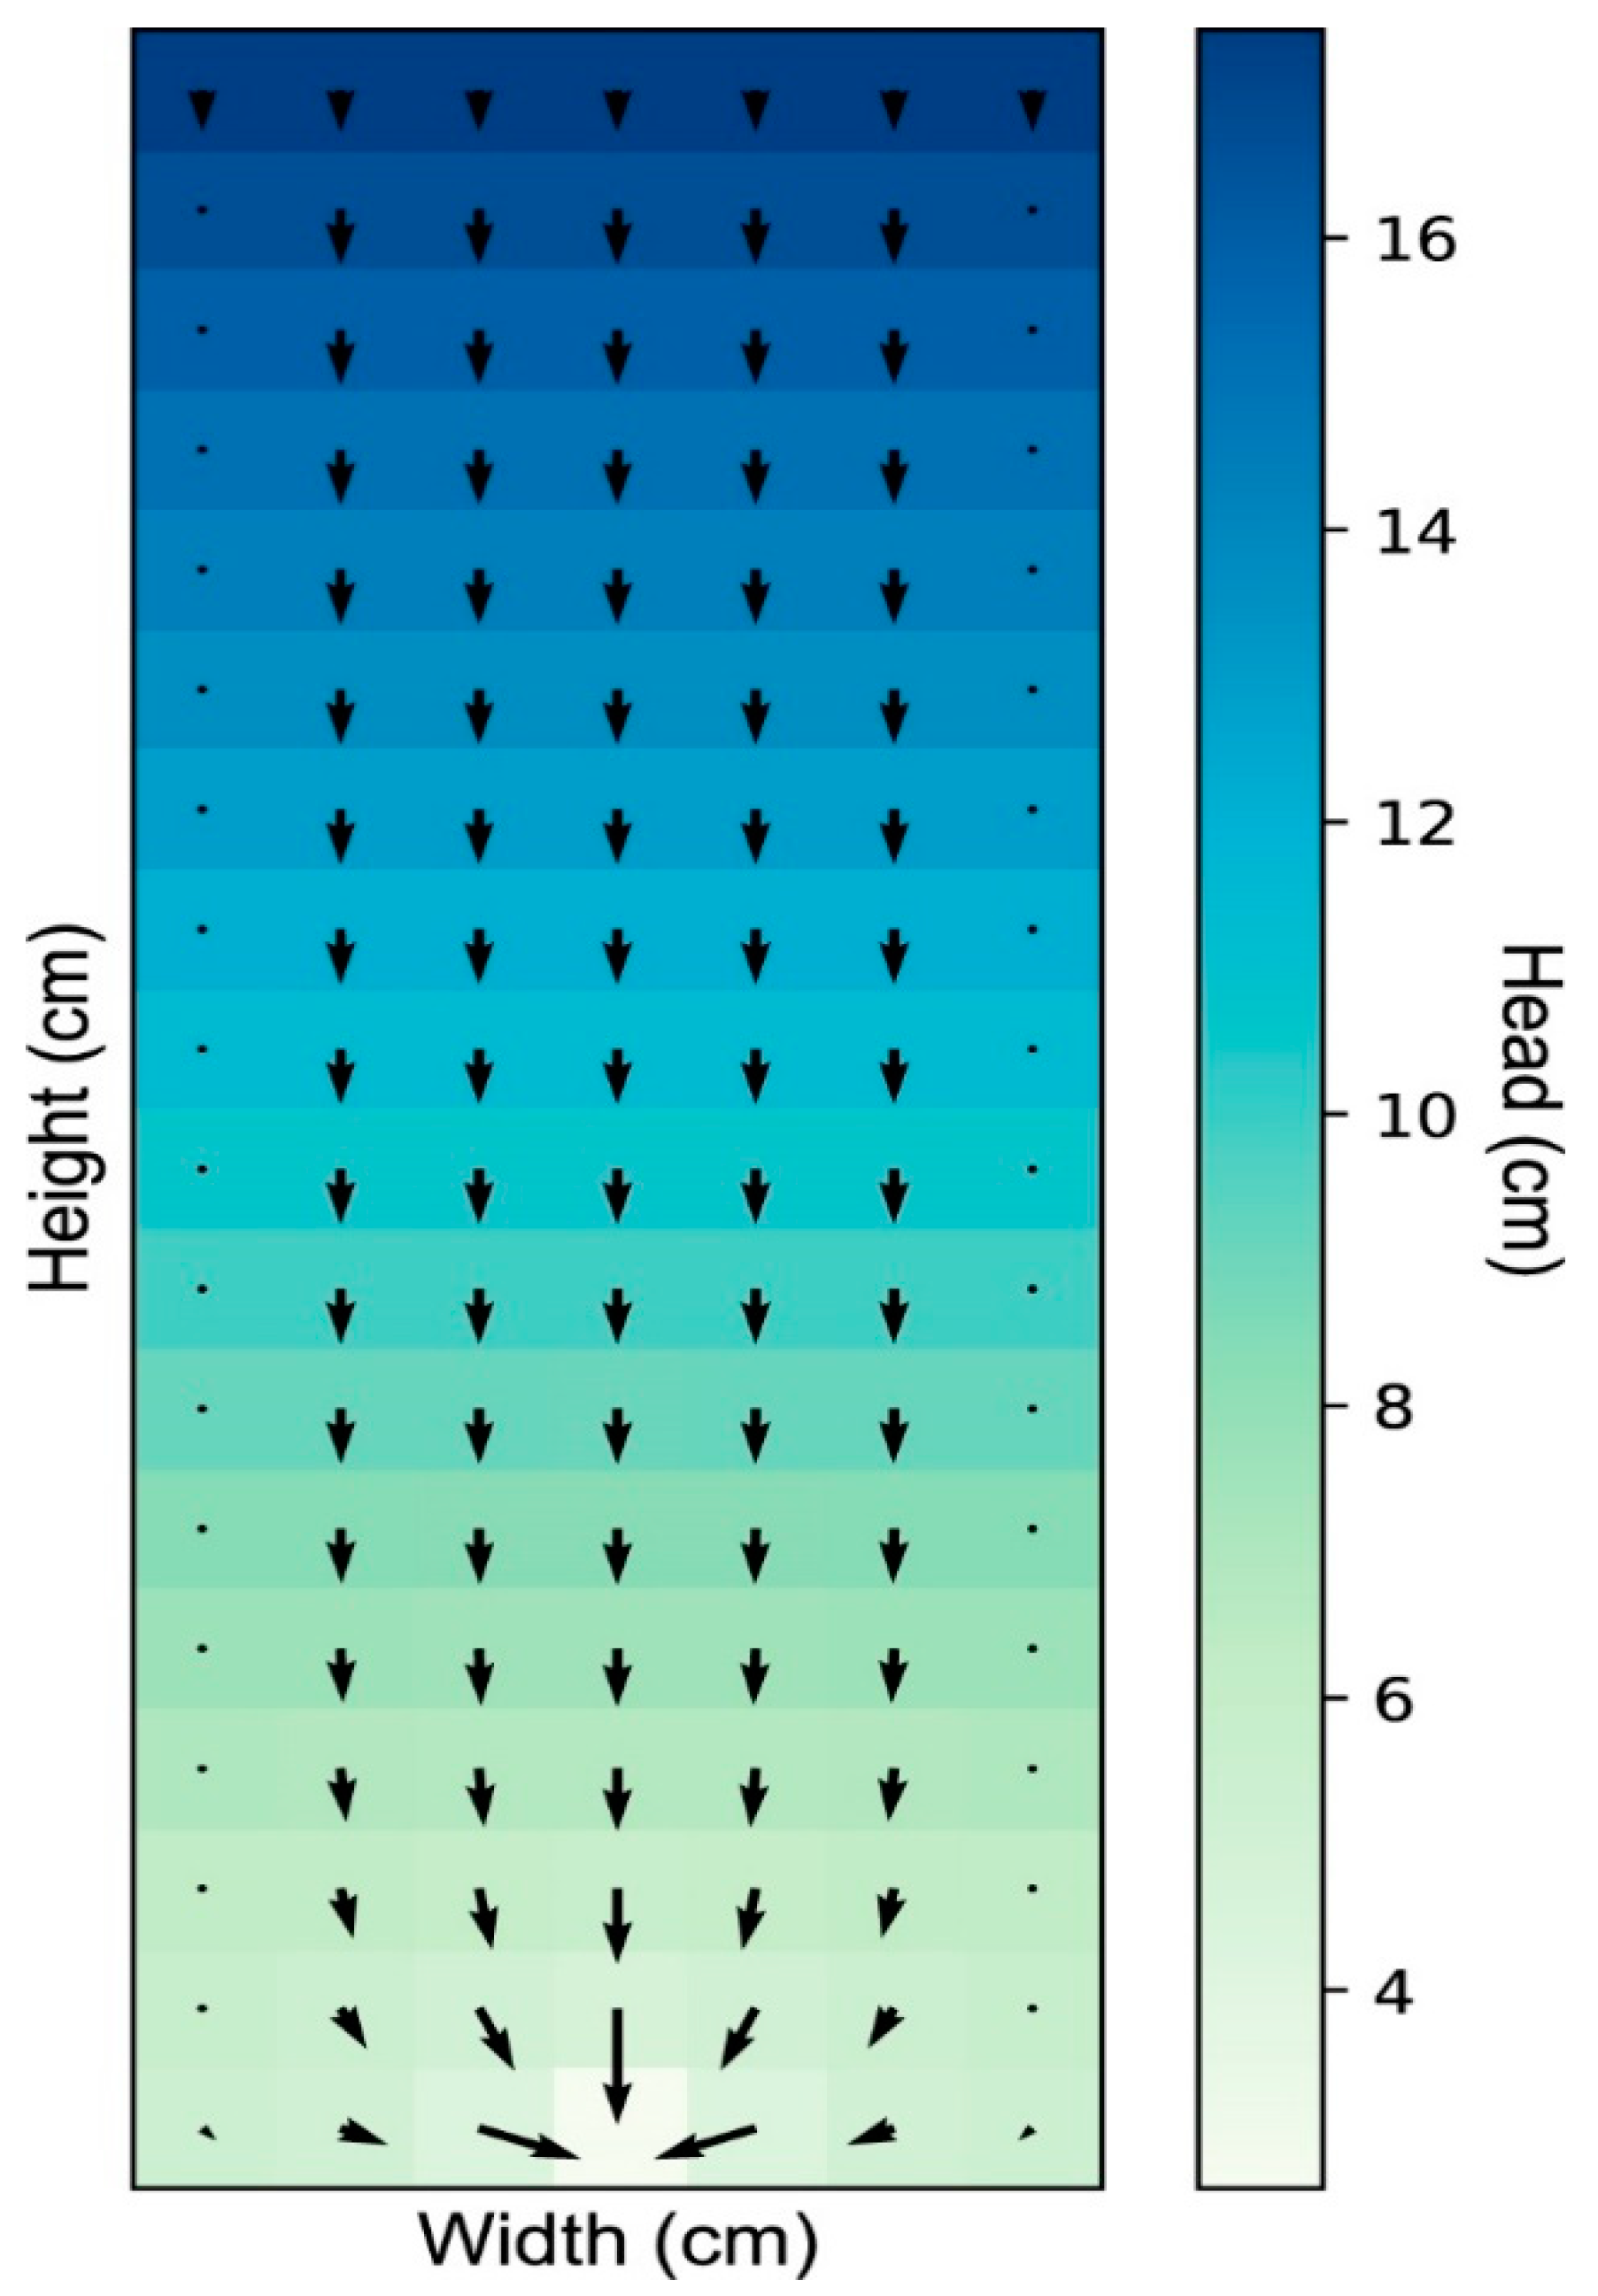
Appendix A. Pressure Distribution
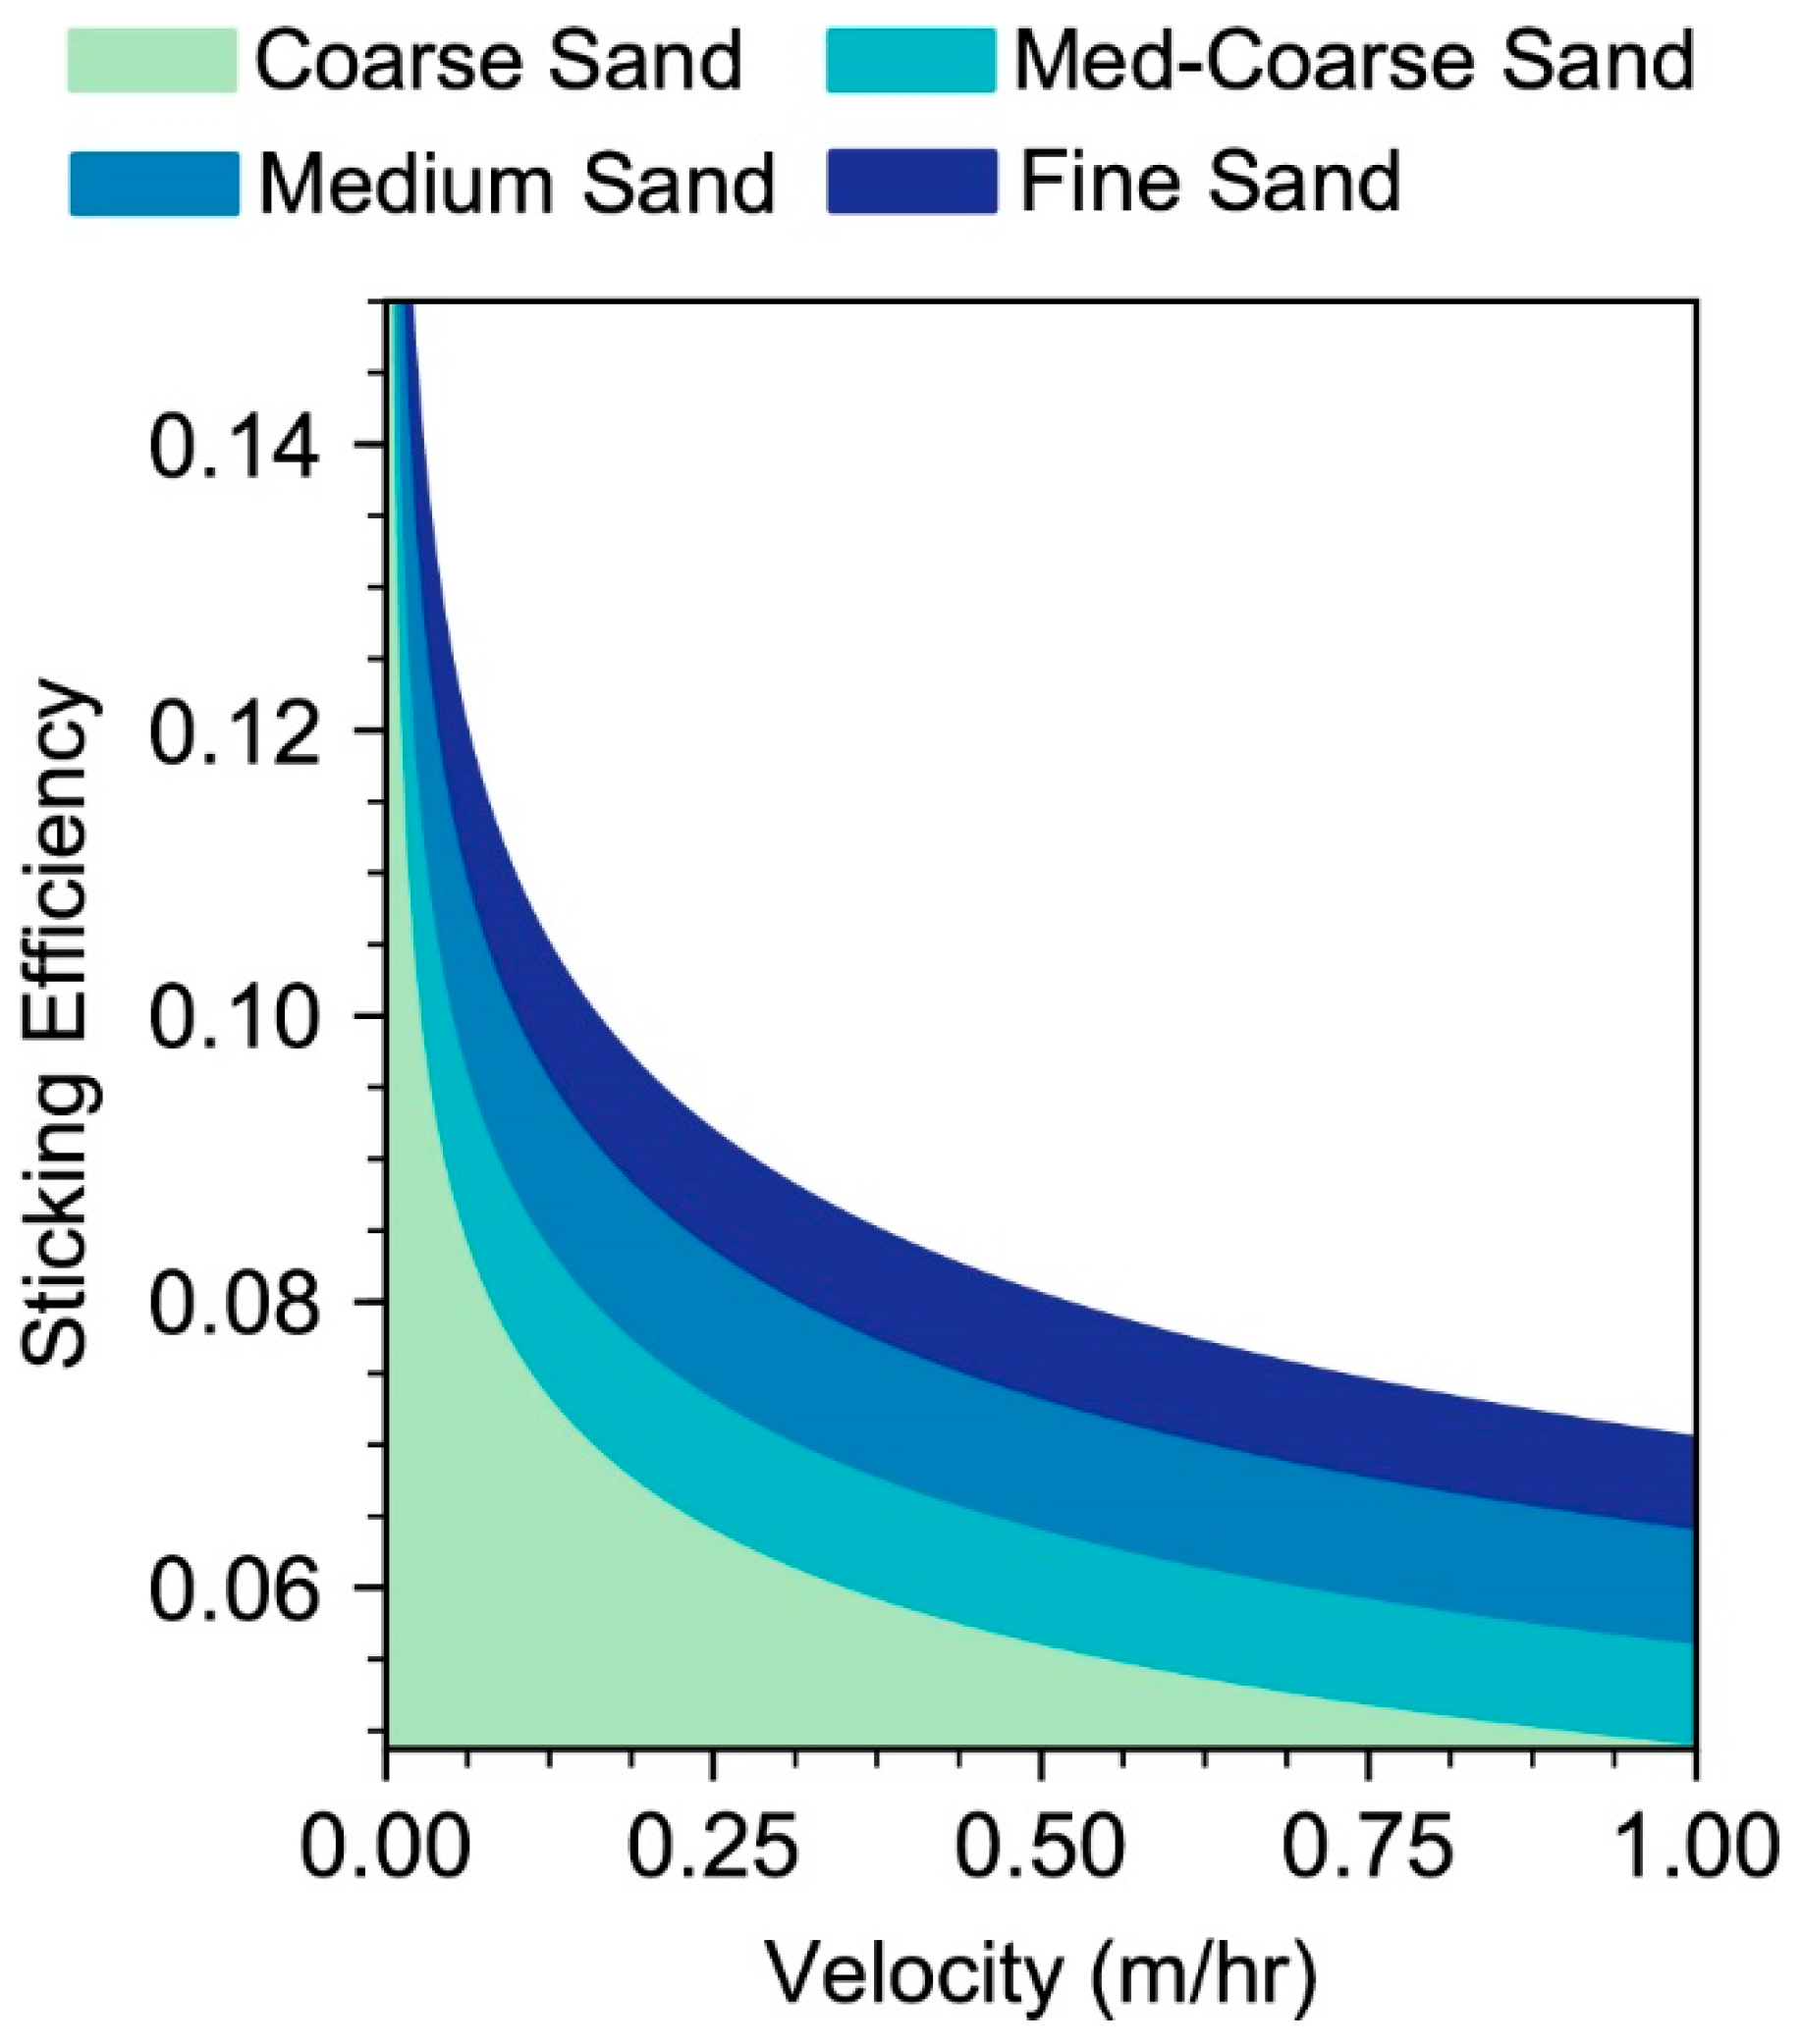
Appendix B. Collector and Sticking Efficiency

Appendix C. Model Constants
| Constant | Constant Description | Value | Units |
|---|---|---|---|
| Particle Density (E. coli) 1 | 1160 | kg/m3 | |
| Particle Density (MS2) * | 1000 | kg/m3 | |
| Particle Diameter (E. coli) | 1 | μm | |
| Particle Diameter (MS2) | 27.5 | nm | |
| Gravitational Constant | 9.80 | m/s2 | |
| Boltzmann Constant | 1.38 × 10⁻²³ | J/K | |
| Hamaker Constant 2 | 2.15 × 10⁻²⁰ | J | |
| Porosity 3 | 0.42 | - | |
| Fluid Density | 1000 | kg/m3 | |
| Power (E. coli) | 0.2 | - | |
| Power (MS2) | 0.1 | - | |
| a | Biolayer Age | 14 | days |
| Scale Factor 4,5 | 1.9 × 10⁻⁴ | m°C | |
| Rate Coefficient 4,5 | 0.072 | day−1 | |
| Sticking Factor (E. coli) | 0.0029 | - | |
| Sticking Factor (MS2) | 0.00075 | - |
| Type of Sand | Filter Design | Sticking Efficiency (α) | Single Collector Efficiency (η) | ||
|---|---|---|---|---|---|
| E. coli | MS2 | E. coli | MS2 | ||
| Coarse | Control | 0.0401 | 0.0028 | 0.0006 | 0.0087 |
| R1 | 0.0563 | 0.0033 | 0.0022 | 0.0301 | |
| R2 | 0.0837 | 0.0041 | 0.0112 | 0.1302 | |
| Medium–Coarse | Control | 0.0744 | 0.0039 | 0.0056 | 0.0794 |
| R1 | 0.1037 | 0.0046 | 0.0211 | 0.2753 | |
| R2 | 0.1521 | 0.0056 | 0.1176 | 1.0 | |
| Medium | Control | 0.1012 | 0.0045 | 0.0163 | 0.2373 |
| R1 | 0.1402 | 0.0054 | 0.0601 | 0.8239 | |
| R2 | 0.2036 | 0.0066 | 0.3200 | 1.0 | |
| Fine | Control | 0.1708 | 0.0060 | 0.1199 | 1.0 |
| R1 | 0.2330 | 0.0071 | 0.4759 | 1.0 | |
| R2 | 0.3295 | 0.0088 | 1.0 | 1.0 | |
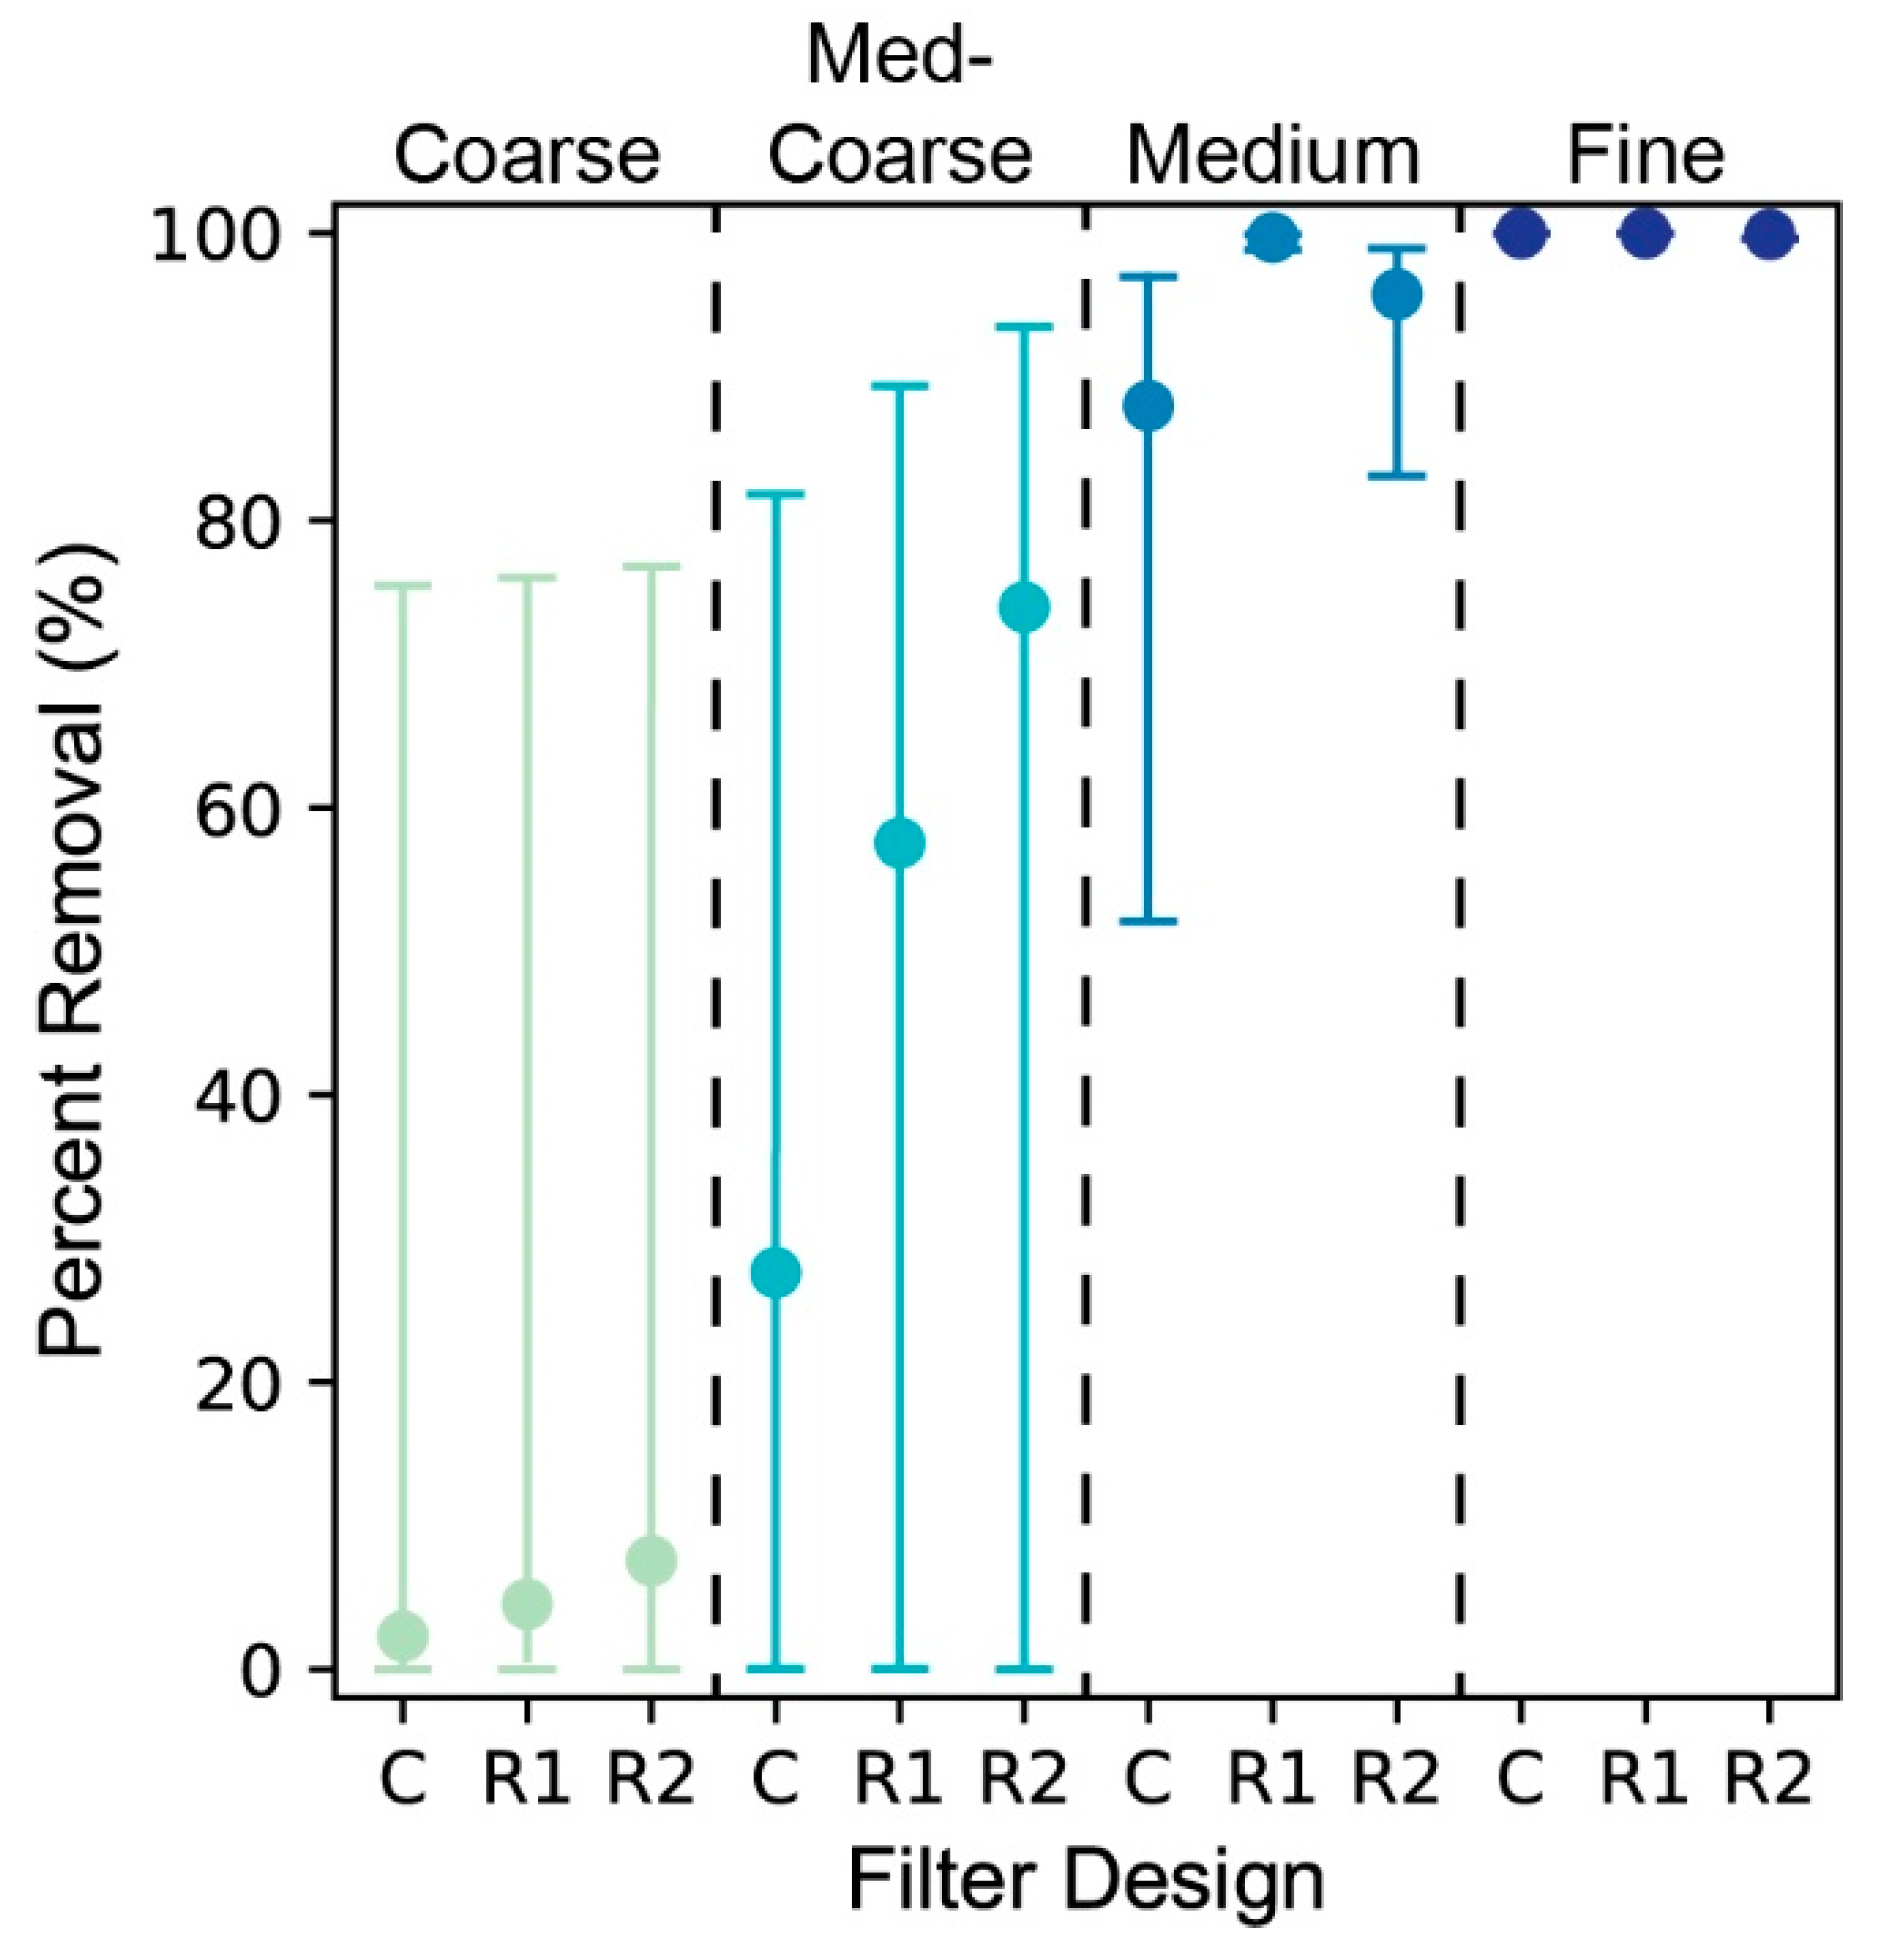
Appendix D. Model Error
Appendix E. Heavy Metals
References
- WHO. Progress on Household Drinking Water, Sanitation and Hygiene 2000–2017. Special Focus on Inequalities. World Health Organization. 2019. Available online: https://www.who.int/water_sanitation_health/publications/jmp-report-2019/en/ (accessed on 29 April 2020).
- Clasen, T.F. Scaling up Household Water Treatment among Low-Income Populations. World Health Organization. 2009. Available online: https://apps.who.int/iris/handle/10665/70049 (accessed on 8 August 2019).
- Center for Affordable Water and Sanitation Technology. Available online: https://www.cawst.org/services/expertise/biosand-filter (accessed on 8 August 2019).
- Center for Disease Control. Available online: https://www.cdc.gov/safewater/sand-filtration.html (accessed on 8 August 2019).
- Zinn, C.; Bailey, R.; Barkley, N.; Rose Walsh, M.; Hynes, A.; Coleman, T.; Savic, G.; Soltis, K.; Primm, S.; Haque, U. How are water treatment technologies used in developing countries and which are the most effective? An implication to improve global health. J. Public Health Emerg. 2018, 2. [Google Scholar] [CrossRef]
- Center for Affordable Water and Sanitation Technology. Available online: https://sswm.info/sites/default/files/reference_attachments/CAWST%202009%20Biosand%20Filter%20Manual.pdf (accessed on 8 August 2019).
- Jenkins, M.W.; Tiwari, S.K.; Darby, J. Bacterial, viral and turbidity removal by intermittent slow sand filtration for household use in developing countries: Experimental investigation and modeling. Water Res. 2011, 45, 6227–6239. [Google Scholar] [CrossRef] [PubMed]
- Elliott, M.A.; Stauber, C.E.; Koksal, F.; DiGiano, F.A.; Sobsey, M.D. Reductions of E. Coli, echovirus type 12 and bacteriophages in an intermittently operated household-scale slow sand filter. Water Res. 2008, 42, 2662–2670. [Google Scholar] [CrossRef] [PubMed]
- Pandit, A.B.; Kumar, J.K. Clean water for developing countries. Annu. Rev. Chem. Biomol. Eng. 2015, 6, 217–246. [Google Scholar] [CrossRef] [Green Version]
- Tiwari, S.K.; Schmidt, W.; Darby, J.; Kariuki, Z.G.; Jenkins, M.W. Intermittent slow sand filtration for preventing diarrhoea among children in kenyan households using unimproved water sources: Randomized controlled trial. Trop. Med. Int. Health 2009, 14, 1374–1382. [Google Scholar] [CrossRef] [Green Version]
- McGuigan, K.G.; Conroy, R.M.; Mosler, H.; du Preez, M.; Ubomba-Jaswa, E.; Fernandez-Ibañez, P. Solar water disinfection (SODIS): A review from bench-top to roof-top. J. Hazard. Mater. 2012, 235–236, 29–46. [Google Scholar] [CrossRef]
- Sobsey, M.D.; Handzel, T.R.; Venczel, L. Chlorination and safe storage of household drinking water in developing countries to reduce waterborne disease. Water Sci. Technol. J. Int. Assoc. Water Pollut. Res. 2003, 47, 221–228. [Google Scholar] [CrossRef] [Green Version]
- Annan, E.; Mustapha, K.; Odusanya, O.S.; Malatesta, K.; Soboyejo, W. Statistics of flow and the scaling of ceramic water filters. J. Environ. Eng. 2014, 140. [Google Scholar] [CrossRef]
- Lemley, A.; Wagenet, L.; Kneen, B. Activated Carbon Treatment of Drinking Water, Water Treatment Notes, Fact Sheet 3. Cornell Cooperative Extension, New York State College of Human Ecology. 1995. Available online: http://waterquality.cce.cornell.edu/publications/CCEWQ-03-ActivatedCarbonWtrTrt.pdf (accessed on 8 August 2019).
- Mellor, J.; Abebe, L.; Ehdaie, B.; Dillingham, R.; Smith, J. Modeling the sustainability of a ceramic water filter intervention. Water Res. 2014, 49, 286–299. [Google Scholar] [CrossRef] [Green Version]
- Napotnik, J.A.; Baker, D.; Jellison, K.L. Effect of sand bed depth and medium age on Escherichia coli and turbidity removal in Biosand filters. Environ. Sci. Technol. 2017, 51, 3402–3409. [Google Scholar] [CrossRef]
- Rojanschi, C.Y.; Madramootoo, C. Intermittent versus continuous operation of biosand filters. Water Res. 2014, 49, 1–10. [Google Scholar] [CrossRef] [PubMed]
- Earwaker, P. Evaluation of Household BioSand Filters in Ethiopia. Master’s Thesis, Cranfield University, Cranfield, England, 2006. [Google Scholar]
- Spowart, M.E. Educational Concerns of Implementing Biosand Water Filters in Rural Uganda. Master’s Thesis, Dominican University of California, San Rafael, CA, USA, 2012. [Google Scholar] [CrossRef] [Green Version]
- Schijven, J.F.; van den Berg, H.H.; Colin, M.; Dullemont, Y.; Hijnen, W.A.M.; Magic-Knezev, A.; Oorthuizen, W.A.; Wubbels, G. A mathematical model for removal of human pathogenic viruses and bacteria by slow sand filtration under variable operational conditions. Water Res. 2013, 47, 2592–2602. [Google Scholar] [CrossRef] [PubMed]
- Chan, C.C.V.; Neufeld, K.; Cusworth, D.; Gavrilovic, S.; Ngai, T. Investigation of the effect of grain size, flow rate and diffuser design on the CAWST biosand filter performance. Int. J. Serv. Learn. Eng. Humanit. Eng. Soc. Entrep. 2015, 10, 1–23. [Google Scholar] [CrossRef]
- Elliott, M.; Stauber, C.E.; DiGiano, F.A.; Fabiszewski De Aceituno, A.; Sobsey, M.D. Investigation of E. Coli and virus reductions using replicate, bench-scale biosand filter columns and two filter media. Int. J. Environ. Res. Public Health 2015, 12, 10276–10299. [Google Scholar] [CrossRef] [PubMed]
- Ellis, K.V.; Aydin, M.E. Penetration of solids and biological activity into slow sand filters. Water Res. 1995, 29, 1333–1341. [Google Scholar] [CrossRef]
- Muhammad, N.H.; Ellis, K.V.; Parr, J.R.; Smith, M. Optimization of Slow Sand Filtration. New Delhi: 22nd WEDC Conference. 1996. Available online: https://wedc-knowledge.lboro.ac.uk/resources/conference/22/Muhamme.pdf (accessed on 8 August 2019).
- Yao, K.; Habibian, M.T.; O’Melia, C.R. Water and waste water filtration. Concepts and applications. Environ. Sci. Technol. 1971, 5, 1105–1112. [Google Scholar] [CrossRef]
- Harvey, R.W.; Garabedian, S.P. Use of colloid filtration theory in modeling movement of bacteria through a contaminated sandy aquifer. Environ. Sci. Technol. 1991, 25, 178–185. [Google Scholar] [CrossRef]
- Vissink, E.M. Modelling the Removal of Microorganisms by Slow sand Filtration. Master’s Thesis, Utrecht University, Utrecht, The Netherlands, 2016. [Google Scholar]
- Huisman, L.; Wood, W.E. Slow Sand Filtration. World Health Organization. 1974. Available online: https://apps.who.int/iris/handle/10665/38974 (accessed on 8 August 2019).
- Unger, M.C. The Role of the Schmutzdecke in Escherichia Coli Removal in Slow Sand and Riverbank Filtration. Master’s Thesis, University of New Hampshire, Durham, New Hampshire, 2006. [Google Scholar]
- Chan, S.; Pullerits, K.; Riechelmann, J.; Persson, K.M.; Rådström, P.; Paul, C.J. Monitoring biofilm function in new and matured full-scale slow sand filters using flow cytometric histogram image comparison (CHIC). Water Res. 2018, 138, 27–36. [Google Scholar] [CrossRef]
- Ranjan, P.; Prem, M. Schmutzdecke—A filtration layer of slow sand filter. Int. J. Curr. Microbiol. Appl. Sci. 2018, 7, 637–645. [Google Scholar] [CrossRef]
- Domenico, P.A.; Schwartz, F.W. Physical and Chemical Hydrogeology; John Wiley & Sons: New York, NY, USA, 1990. [Google Scholar]
- Stauber, C.E.; Elliott, M.A.; Koksal, F.; Ortiz, G.M.; DiGiano, F.A.; Sobsey, M.D. Characterisation of the Biosand Filter for E. Coli Reductions from Household Drinking Water under Controlled Laboratory and Field Use Conditions. Water Sci. Technol. 2006, 54, 1–7. [Google Scholar] [CrossRef] [Green Version]
- Wentworth, C.K. A scale of grade and class terms for clastic sediments. J. Geol. 1922, 30, 377–392. [Google Scholar] [CrossRef]
- Fox, P.J. Spreadsheet solution method for groundwater flow problems. In Subsurface Fluid-Flow (Ground-Water and Vadose Zone) Modeling; ASTM International: West Conshohocken, PA, USA, 1996; pp. 137–153. [Google Scholar] [CrossRef]
- Akhter, M.G.; Ahmad, Z.; Khalid, A.K. Excel based finite difference modeling of ground water flow. J. Himal. Earth Sci. 2006, 39, 49–53. [Google Scholar]
- Kelly, A.C. Finite Element Modeling of Flow through Ceramic Pot Filters. Master’s Thesis, Massachusetts Institute of Technology, Cambridge, MA, USA, 2013. [Google Scholar]
- Tufenkji, N.; Elimelech, M. Correlation equation for predicting single-collector efficiency in physicochemical filtration in saturated porous media. Environ. Sci. Technol. 2004, 38, 529–536. [Google Scholar] [CrossRef] [PubMed]
- Huber, M.L.; Perkins, R.A.; Laesecke, A.; Friend, D.G.; Sengers, J.V.; Assael, M.J.; Metaxa, I.N.; Vogel, E.; Mareš, R.; Miyagawa, K. New international formulation for the viscosity of H2O. J. Phys. Chem. Ref. Data 2009, 38, 101–125. [Google Scholar] [CrossRef] [Green Version]
- Cabral, J.P.S. Water microbiology. Bacterial pathogens and water. Int. J. Environ. Res. Public Health 2010, 7, 3657–3703. [Google Scholar] [CrossRef] [PubMed]
- Schijven, J.F.; de Bruin, H.A.M.; Hassanizadeh, S.M.; de Roda Husman, A.M. Bacteriophages and clostridium spores as indicator organisms for removal of pathogens by passage through saturated dune sand. Water Res. 2003, 37, 2186–2194. [Google Scholar] [CrossRef]
- Hijnen, W.A.M.; Schijven, J.F.; Bonne, P.; Visser, A.; Medema, G.J. Elimination of viruses, bacteria and protozoan oocysts by slow sand filtration. Water Sci. Technol. 2004, 50, 147–154. [Google Scholar] [CrossRef] [Green Version]
- Chowdhury, S.; Mishra, M.; Suganya, O. The incorporation of wood waste ash as a partial cement replacement material for making structural grade concrete: An overview. Ain Shams Eng. J. 2015, 6, 429–437. [Google Scholar] [CrossRef] [Green Version]
- Choudhary, A.K.; Kumar, S.; Sharma, C. Constructed wetlands: An approach for wastewater treatment. Elixir Pollut. 2011, 37, 3666–3672. [Google Scholar]
- Wu, S.; Carvalho, P.N.; Müller, J.A.; Manoj, V.R.; Dong, R. Sanitation in constructed wetlands: A review on the removal of human pathogens and fecal indicators. Sci. Total Environ. 2016, 541, 8–22. [Google Scholar] [CrossRef]
- Godin, M.; Bryan, A.K.; Burg, T.P.; Babcock, K.; Manalis, S.R. Measuring the mass, density, and size of particles and cells using a suspended microchannel resonator. Appl. Phys. Lett. 2007, 91, 123121. [Google Scholar] [CrossRef] [Green Version]
- Tang, F.; Shi, Z.; Li, S.; Su, C. Effects of bio-sand filter on improving the bio-stability and health security of drinking water. In Proceedings of the International Conference on Mechanic Automation and Control Engineering, Wuhan, China, 26–28 June 2010; pp. 1878–1881. [Google Scholar] [CrossRef]
- Zhang, B.; Fazal, S.; Gao, L.; Mahmood, Q.; Laghari, M.; Sayal, A. Biosand filter containing melia biomass treating heavy metals and pathogens. Pol. J. Environ. Stud. 2016, 25, 859–864. [Google Scholar] [CrossRef]


| Sand Bed Depth (cm) | Percent Removal (%) |
|---|---|
| <1 | 94.380 1 |
| 5 | 99.370 1 |
| 10 | 99.980 2 |
| 15 | 99.984 2 |
| 40 | 99.700 3 |
| 54 | 98.500 4 |
| 55 | 99.987 2 |
| Media | K 1 (cm/s) | Grain Size 2 (mm) |
|---|---|---|
| Coarse | 0.6 | 1.0 |
| Medium–Coarse | 0.05 | 0.5 |
| Medium | 0.02 | 0.25 |
| Fine | 0.002 | 0.15 |
| Media | Design | Average Velocity (m/h) |
|---|---|---|
| Coarse | Control | 2.6933 |
| R1 | 0.4723 | |
| R2 | 0.0608 | |
| Medium–Coarse | Control | 0.2244 |
| R1 | 0.0394 | |
| R2 | 0.0051 | |
| Medium | Control | 0.0898 |
| R1 | 0.0157 | |
| R2 | 0.0020 | |
| Fine | Control | 0.0090 |
| R1 | 0.0016 | |
| R2 | 0.0002 |
| Sand Bed Depth (cm) | Percent Removal of E. coli (%) | |||
|---|---|---|---|---|
| Literature Values | Fine Sand † | Medium Sand † | Percent Difference | |
| 0 | 94.38 1,5 | 98.72 | N/A ‡ | 4.60% |
| 5 | 99.37 1,5 | 99.99 | N/A ‡ | 0.62% |
| 10 | 99.98 2,5 | ~100.00 | N/A ‡ | 0.02% |
| 15 | 99.984 2,5 | ~100.00 | N/A ‡ | 0.02% |
| 40 | 99.70 3,6 | N/A ‡ | 97.97 | 1.73% |
| 54 | 98.50 4,6 | N/A ‡ | 99.09 | 0.60% |
| 55 | 99.987 2,5 | ~100.00 | N/A ‡ | 0.01% |
© 2020 by the authors. Licensee MDPI, Basel, Switzerland. This article is an open access article distributed under the terms and conditions of the Creative Commons Attribution (CC BY) license (http://creativecommons.org/licenses/by/4.0/).
Share and Cite
Phillips, J.A.; Smidt, S.J. Modeling Improved Performance of Reduced-Height Biosand Water Filter Designs. Water 2020, 12, 1337. https://doi.org/10.3390/w12051337
Phillips JA, Smidt SJ. Modeling Improved Performance of Reduced-Height Biosand Water Filter Designs. Water. 2020; 12(5):1337. https://doi.org/10.3390/w12051337
Chicago/Turabian StylePhillips, James A., and Samuel J. Smidt. 2020. "Modeling Improved Performance of Reduced-Height Biosand Water Filter Designs" Water 12, no. 5: 1337. https://doi.org/10.3390/w12051337
APA StylePhillips, J. A., & Smidt, S. J. (2020). Modeling Improved Performance of Reduced-Height Biosand Water Filter Designs. Water, 12(5), 1337. https://doi.org/10.3390/w12051337


