Abstract
Rainfall and temperature variability causes changes in groundwater recharge that can also influence groundwater quality by different processes. The aim of this study is the analysis of the hydrogeochemical variations over time due to meteorological variability in two different study areas in Italy: an alluvial aquifer in the Piedmont Po plain and an alluvial-pyroclastic aquifer in the Campanian plain. The examined plains show groundwater with natural quality not satisfying the European drinking water standards, or anthropogenic contamination. The peculiar natural quality is due, in the Campanian plain, to the closeness of volcanic areas, and to the presence of reducing conditions. In Piedmont plain a test site is characterized by a point-source contamination by heavy metals, due to the presence of past industrial activities. In all the examined areas there is a diffuse nitrate contamination. The fluctuations of the ions As, F, Fe, Mn, Cr VI, NO3, and Cl were analyzed and compared, using statistical methods, with the variations over time in precipitation, temperature, and piezometric levels, sometimes significant. Results highlight the importance of the groundwater and meteorological monitoring and the key role of the recharge variation in the hydrogeochemical processes. The linking degree between rainfall/temperature variability and hydrogeochemistry is variable, in function of the typology of chemical species, their origin, and of the aquifer characteristics. The fluctuation of climate variables determines sudden changes in the geochemistry of shallow unconfined aquifers (e.g., in the Piedmont plain), while semiconfined or confined aquifers (e.g., in the Volturno-Regi Lagni plain) react with a greater delay to these variations. Moreover, natural quality is more affected by climatic variations than anthropogenic contamination, which is the result of multiple environmental and anthropic factors.
1. Introduction
The rainfall and temperature variability can cause changes in surface water and groundwater (GW). Often these changes have been analyzed in light of climate change [1,2]. Potential impacts on surface water have been studied in detail (see a review in [3]), and a lot of studies have focused on the implications of climate warming on GW recharge and discharge, and changes in storage characteristics. [4,5,6,7,8], concluding that the mean GW recharge could globally decrease of more than 10% in the long term.
The authors of [9] considered for Italy four climate change scenarios (from the Fifth Assessment Report of the IPCC [2]) and three different future 20-year time periods (2020–2039, 2040–2059, and 2080–2099) starting from the 20-year average of latest historical values related to the period 1996–2015. They concluded that the reduction of GW resources corresponding to the worst scenario in terms of GHG emissions (RCP8.5) is critical, for Campania region and for Italy, especially for the long-term projection 2080–2099 (42% and 52%, respectively).
Climate change will also modify water demands and water use [6]. Higher water demands will particularly affect areas where mean GW recharge is expected to decrease. In [10] the authors highlighted that GW management technique, variable in function of the climatic variability due to climatic changes, heavily impacts GW chemistry.
Other studies have considered the impact of climate change on GW salinization, particularly in coastal regions [11] and small islands, such as atolls (an overview is reported in [5]). Forecasts in coastal areas highlight a sea level rise of about 0.5–2 m. The main impact of sea level rise on GW is the intrusion of saline water into coastal aquifers, with huge repercussions because a large percentage of the world population lives in these areas [6,12]. Moreover, in arid and semi-arid areas increased evapotranspiration may lead to GW salinization [13].
Additionally, meteorological variability at limited temporal scale can influence GW quantity and quality. However, relatively little is known about how GW levels will respond to the human-induced climate change or climate variability [1,14,15,16]. The authors of [5] observed that the lack of necessary data has made it impossible to determine the magnitude and direction of change GW levels attributable to climate change. In [17] the authors investigated the changes in GW chemistry due to a prolonged drought, that led to a significant decline in the chemical quality (increase in Cl, Mg, and SO4). The authors of [18] performed a study on a shallow aquifer of NW Italy and observed different GW hydrodynamic behaviors, depending on natural factors (such as rainfall), and anthropic causes (mainly the presence of paddy fields). Over time, the GW hydrodynamic behavior generally showed the dependence of the water table level on rainfall variability. Moreover, a higher average monthly piezometric level due to the highest rainfall occurrence in 2009–2017 period was highlighted. The authors of [19] observed that GW systems are spatially heterogeneous and respond in a nonlinear manner to changes in climate forcing. Moreover, aquifers are generally characterized by a relatively slow response to environmental change compared with surface water, because of their large storage capacity [20,21]. Furthermore, multiple environmental change drivers (e.g., land use, land cover, water management, etc.) further complicates any assessment of GW level response to climate change or meteorological variability [5,18,22].
Some authors stated that climate induced changes in GW are relatively small compared with non-climate drivers. This situation depends on the slow response of GW systems and the presence of a temporal lag with respect to climate change or meteorological variability [23,24].
Despite the numerous studies about the impacts of climate change or variability on GW quantity, relatively few studies focused on processes affecting GW quality. In [12] it was stated that no dramatic changes in GW quality due to climate change are expected during the next decades, except for recharge salinity under extreme situations of dryness or coldness. Conversely, in [25] the authors affirmed that climate change can influence the quality of GW. Their study showed that water recharge during an arid period had higher salt concentration and total dissolved solids (TDS), whereas an opposite situation may occur during a wet period. The authors of [26,27] have noted potential implications of climate change and variability for the transport and fate of pesticides and nutrients in GW. Additionally, in [13] it was stated that changes in recharge and discharge are likely to change the vulnerability of aquifers to diffuse pollution. The authors of [28,29] observed that the spatial and temporal variability in rainfall patterns could result in important infiltration events. Consequently, the salt reservoirs in the vadose zone, mainly chloride and nitrate, will likely be flushed into many aquifers leading to increased GW salinization. Similarly, in [1] it was assumed that in areas where rainfall intensity is expected to increase, pollutants (such as pesticides, organic matter, heavy metals) will be increasingly washed from soils to water bodies.
The forecast of heavy precipitation events, where rainfall intensity is expected to increase suggests many consequences. The immediate impact is the prospect of flooding and landslide. Excessive precipitation can also degrade water quality, harming human health and ecosystems. Indeed, stormwater runoff, which often includes pollutants like pesticides, nitrogen, phosphorus, and heavy metals can end up in lakes and streams, damaging aquatic ecosystems and lowering water quality for human uses.
Additionally, GW temperature can reflect climate warming, with a temperature increase in shallow aquifers due to the increasing air temperature [30,31,32,33].
Understanding the impacts of climate change and climate variability on the complex processes influencing the availability and sustainability of GW resources is crucial [25].
As no systematic investigations of the relationship between GW quality and climate change or climate variability have been conducted in Italy up to now, the aim of this study was to analyze the presence of hydrogeochemical variations over time due to meteorological variability. The research was performed in two different hydrogeological environments chosen as test fields: an alluvial unconfined aquifer in the Piedmont Po plain (NW Italy) and an alluvial-pyroclastic aquifer in the Campanian plain (S Italy).
Three test sites were selected in the Piedmont plain. Two sites were chosen because a diffuse nitrate contamination in shallow GW, due to intensive agricultural and livestock activities, is present [34,35,36,37,38,39,40,41]. As chloride in some Piedmont agricultural areas was recognized to have the same behavior as nitrate and it shows high variability during the year [39], chloride was also selected for the analyses. Moreover, a further test site was chosen, that is characterized by a point-source contamination by heavy metals in the shallow aquifer, due to the presence of past industrial activities [42]. More specifically, a point source pollution by chromium VI was highlighted and currently the entire area is subjected to reclamation. Consequently, nitrate, chloride, and chromium VI fluctuations were analyzed and compared with rainfall and piezometric levels.
The study area in Campania is the “Volturno-Regi Lagni” plain, where the trends of the time series of five ions, As, F, Fe, Mn, and NO3, have been observed over almost 20 years and compared with the differences in recharge, sometimes significant due to climate variability. The study area is a large coastal plain, with porous aquifers containing waters high in As and F, due to the closeness of volcanic active areas (Phlegrean Fields and Vesuvius) [43]. Moreover, the presence of reducing environments brings high values of other two ions of natural origin: Fe and Mn [44,45]. Finally, since the 1990s there has been a widespread nitrate contamination, prevalently due to manure spreading and/or sewage leaking [46,47].
The trend analysis procedure was applied to the temporal dataset of available chemical data spatially significative for the considered areas [48]. The Mann–Kendall method [49,50] allowed the evaluation the statistical significance of the trends of the ions and of the climatological data. The cross-correlation was used for demonstrating the concordance between ions, temperature, precipitation, and piezometric levels. All these methods were used in order to clarify the relation between the annual/monthly recharge and the concentration of the chemical compounds in GW, which is the main aim of this paper.
2. Materials and Methods
2.1. Study Areas
The sample area in Piedmont plain (NW Italy) is located in the sector between Turin and Cuneo cities. The hydrogeological setting consists of superimposed complexes represented, from top to bottom, by Alluvial deposits complex (lower Pleistocene–Holocene), ‘‘Villafranchiano’’ transitional complex (late Pliocene–early Pleistocene), and Marine complex (Pliocene) [18,51,52,53,54].
Sedimentary rocks of Terziary Piedmont basin (Eocene–Miocene), generally consisting of clay, silt, limestone, conglomerates, sandstone, and gypsum, border the plain on the eastern side, with a hilly morphology. These rocks have low permeability and permit only a limited GW circulation along fractured zones. Crystalline rocks of the Alps border the plain on the northern and western sides. They are mostly impermeable or slightly permeable by fissuration.
The shallow unconfined aquifer, the object of this paper, is hosted in the Alluvial deposits complex, consisting of coarse gravel and sand of fluvial or fluvio-glacial origin, with subordinate silty-clayey intercalations. This complex has a thickness generally ranging between 20 and 50 m and high hydraulic conductivity (k = 5 × 10⁻³ – 5 × 10⁻⁴ m/s) [54]. It represents an important aquifer in which the water table is directly connected to surface water. The depth to water in the shallow aquifer is very variable: the water table is generally less than 5 m deep in the low plain and near the rivers, whereas it shows depths between 20 and 50 m close to the Alps. Recharge area of the shallow aquifer is located in the entire plain, due to infiltration of rainfall and secondly by surface water in the high plain sectors.
Deeper semi-confined and confined aquifers are present in the underlying fluvial-lacustrine ‘Villafranchiano’ complex and the pliocenic marine sediments. They generally serve as key sources of drinking water in the Piedmont plain, because of the better GW quality compared to the shallow aquifer [42]. Deep aquifers are not the object of this paper.
A more detailed description of the Piedmont plain hydrogeology is reported in a recent study [54].
The Piedmont plain has a strong agricultural vocation, and cereals and legumes represent the main crops. Livestock farming is highly developed in Cuneo area, particularly cows and pigs [39]. The land use in the plain can be identified as the cause of a GW nitrate contamination, especially for the shallow aquifer [34,55]. Industrial areas are mainly located in the surrounding of big cities, especially Turin, that is the third largest economically productive complex in the country.
The analyses of the impacts of meteorological variability on GW quality were conducted in three test sites (Figure 1) in the plain: two test sites (Fossano and Scalenghe) characterized by diffuse nitrate contamination in shallow GW, and a test site (Turin) with a point-source pollution by chromium VI in the shallow aquifer.
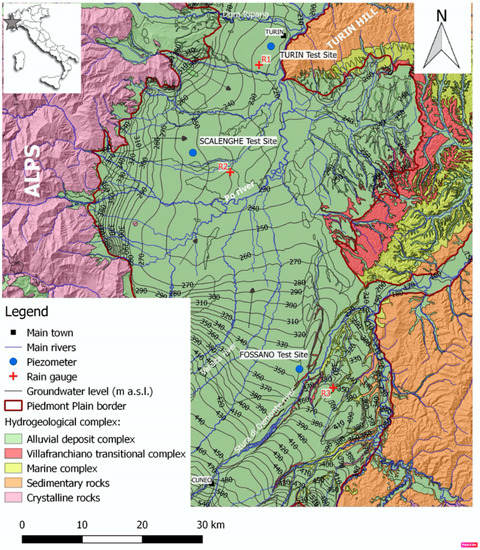
Figure 1.
Study area in Piedmont plain (NW Italy). Potenziometric contour lines of the shallow aquifer (m a.s.l.) refer to summer 2017.
The Scalenghe and Fossano test sites are located in the area between Cuneo and Turin, where shallow GW shows locally a high nitrate contamination, due to the intensive agricultural and livestock activities [34,35,36,37,38,39,40,41]. Depth to the water level in the analyzed period is low in the Scalenghe test site (minimum 1.20 m, maximum 5.40 m, and mean 2.6 m) and relatively higher in the Fossano test site (minimum 7.60 m, maximum 11.90 m, and mean 10.2 m).
The Turin test site is an industrial area characterized by past industrial activities, with heavy metals pollution by Chromium VI in the soil and GW. The point-source pollution by chromium VI is under control to avoid its downstream expansion in GW. More specifically, a hydraulic barrier was the first action. Then, a barrier with a series of reagent injection wells was used, to reduce chromium VI in chromium III, and then to cause its precipitation. The next step will be actions for the source of contamination. Before the barrier was put into operation, the plume had an extension of more than 400 m. Currently the total length from the source to the barrier is 180 m, with a maximum width of about 60 m. The shallow aquifer in Turin test site has a thickness of 30 m, and the depth to water level is about 9.56 m (minimum 7.53 m, maximum 10.63 m in the analyzed period).
In the three test sites, the shallow aquifer is composed of gravel and sand, and shows a high hydraulic conductivity (10−3–10−4 m/s) [54].
The average annual cumulative precipitation on the Piedmont Region over the 1957–2009 period shows values higher than 1600 mm/year in the northern part of the region and amounts of less than 720 mm/year in the southeastern sector [56]. The annual rainfall distribution in the Piedmont plain is characterised by two maxima (spring and autumn) and two minima (winter and summer) [57,58]. A recent study in Piedmont plain [18] evaluated the standardized anomalies of cumulative annual rainfall and mean annual GW levels for the 2002–2017 period and allowed to observe a relationship between rainfall and water table level at the yearly scale. Then, a further analysis permitted to observe the presence of a change point in 2008 in more than 80% of the analyzed piezometers. This change point corresponds to passage from a strong lowering to a sudden and considerable rise in the GW level. The 2008 change point was also detected in 88% of the rainfall time series for the Piedmont plain, confirming the strong relationship between rainfall and GW level. Furthermore, the most recent period (2009–2017) is characterized by higher average monthly piezometric levels compared to the previous period of 2002–2008 [18]. The highest rainfall could explain most of the average increase in the piezometric levels.
The Volturno-Regi Lagni plain is the largest GW body of the Campania region (>1000 km2). Stratigrafic and potenziometric studies [44] revealed the presence of two porous aquifers: the shallow aquifer is phreatic, with a maximum thickness of 20 m. The deposits are of alluvial-pyroclastic origin and of silty-sandy granulometry. The permeability is generally low, and this aquifer is not continuous along the plain. The deeper aquifer is much more productive, with a thickness of 60–70 m and a moderate-high degree of permeability. Sediments range from very coarse sand to fine and they are of alluvial, pyroclastic, and marine origin. A tuff (about 50–60 m thick), named Campanian Ignimbrite (39 ky B.P.), separates these two aquifers and confines the main aquifer. Connections between these two aquifers are possible for (i) the low thickness of the tuff near the rivers and channels, (ii) the non-welded condition of the tuff in some parts, (iii) the presence of old open pit quarries in the tuff reaching the main aquifer, (iv) the presence of a multitude of GW wells of different depth, with long well screens causing mixing of GW. Rainfall and underground flow coming from the adjacent carbonate mountains fed the aquifers of the plain; in the southern part, the hills of the Phlegrean Fields contribute in a small amount to the recharge.
The hydrogeochemistry of the GW body is influenced by the closeness of volcanic active areas (Phlegrean Fields and Vesuvius), by the volcanic origin of the sediments and by the GW underflow, from the calcareous adjacent aquifers (Figure 2). GW chemistry gradually becomes more alkaline, from the mountains to the east towards the coast to the west. Fluoride is high everywhere, while arsenic is high in the southern part, close to the Phlegrean Fields [43]. High As is due to water–rock interaction, favored by the presence of steam heated fluids in the Phlegrean Fields GW body that also facilitates the mobility [45]. In some parts of the GW body, prevalently along the Volturno river, there are reducing environments, determining in the aquifer high values of other two ions of natural origin: Fe and Mn [44,45]. These reducing conditions, prevalently attributable to the presence of natural organic matter, such as peats are also testified by low content in sulphate, with respect to the typical hydrochemical facies, low nitrates, and sometimes presence of NH4 [45].
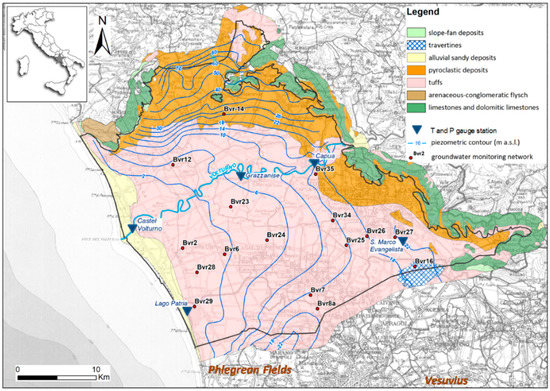
Figure 2.
Hydrogeological map of the “Volturno-Regi Lagni” plain study area (S Italy). Potenziometric contour lines (2004) refer to the main aquifer. Modified from [47].
Since the 1990s, a severe contamination by nitrate (more than 50 mg/L) has been recognised in the GW body, also in the main, deeper aquifer for the above-mentioned connections. Nitrate contamination in GW is present everywhere, prevalently due to manure spreading and/or sewage leaking from collectors or septic tanks, as revealed by isotopic studies [46].
2.2. Meteorological and GW Level Data Sets
Rainfall and temperature time series in the Piedmont plain test sites belong to climatic gauges managed by ARPA (Regional Agency for the Protection of the Environment) Piemonte (Turin, Italy). The location of climatic gauges is reported in Figure 1. Daily rainfall and air temperature data was collected for a period of at least 12 years (2004–2005 up to 2017) and aggregated at a monthly scale. Moreover, yearly rainfall and yearly average air temperature were plotted versus time.
GW level time series of Fossano and Scalenghe test sites referred to the automatic monitoring network of the shallow aquifer in the Piedmont region. The depth of the piezometers ranges between 30 and 50 m, and the screens are in the shallow unconfined aquifer. The Piedmont monitoring network is managed by ARPA Piemonte, and data are available on the web [59]. Piezometric level measures referred to 6 a.m., 12 a.m., 6 p.m., and 12 p.m. were collected and the average daily piezometric level was calculated. Then the average monthly level was calculated for the subsequent analyses.
GW levels in the Turin test sites were measured with a phreatimeter. The measurement of the GW level was conducted inside an open tube piezometer with a diameter of 3 inches and a depth of 38 m.
Distribution of monthly rainfall and average monthly GW level was analyzed and the parameters were compared, plotting data versus time.
Rainfall and temperature time series of the Volturno-Regi Lagni area belong to climatic gauges managed by “Centro Funzionale Regione Campania” and are available on the web [60]. Daily rainfall and air temperature data was collected from 2000 to 2019 and aggregated at a monthly scale.
Distribution of monthly rainfall and average monthly air temperature in the Volturno-Regi Lagni plain was analyzed, plotting these data versus time and comparing them. The evaluation of infiltration was completed in the Volturno-Regi Lagni area using the Turc formulation [61] for the evapotranspiration and a mean infiltration coefficient of 60%, consistent with the pyroclastic-alluvial deposits, outcropping in the plain.
2.3. Chemical Analyses
Chemical data (nitrate and chloride) of Fossano and Scalenghe test sites in Piedmont referred to the manual monitoring network of the shallow aquifer in the Region, managed by ARPA Piemonte. Sampling campaigns for chemical analysis are carried out twice a year in March/April and September/October. Chemical data are public and available on the web [59]. The analyzed piezometers for Fossano and Scalenghe test sites are screened in the shallow aquifer. Chromium concentration in Turin test site was analyzed according to the USEPA method [62]. Data of chromium VI concentrations referred to a piezometer screened in the shallow aquifer. The highest number of available data are in Turin test site (54 data points vs. 29 in Fossano, and 30 in Scalenghe). Moreover, available data of nitrate, chloride, and chromium VI were plotted with GW level versus time, to observe common trend between the analyzed parameters. Scatterplots were created to detect the correlation between chemicals (chromium, nitrate, and chloride) and GW level, and between nitrate and chloride concentrations.
Hydrochemical data of the Campania study area originate from the network for GW quality monitoring of the Environmental Protection Agency of Campania (ARPAC, Naples, Italy) and are available on the web [63].
In the examined area, the ion concentration data were from 16 monitoring wells (Figure 2), collected between 2003 and 2019 and with approximately two analyses per year. The number of samples ranges from 14 to 27 per monitoring well. The depth of the wells ranges from 50 to 130 m b.g.l. (median value 84 m b.g.l.) and therefore their screens are all located in the main, deeper aquifer [47].
Water sampling for GW quality monitoring is done by ARPAC, according to ISO standard [64]. In the laboratory, ion chromatography was used for the determination of dissolved ions. The chemical methods are described in detail in [47].
2.4. Statistical Analysis
Statistical analyses were performed in both study areas using the same approaches and elaborations, as far as possible according to the available data. More specifically, the possible presence of a trend for rainfall and temperature was analyzed, using the nonparametric Mann–Kendall test [49,50]. Moreover, to estimate the temporal variation in ion concentrations, the trends in each monitoring point were performed by using the nonparametric Mann–Kendall test [49,50], with the software ProUCL 4.1 [65], with a confidence level of 95%. The trend analysis was used to determine potential upward or downward trends present in ion concentrations identified in GW monitoring wells. At last, a cross-correlation analysis was performed in order to study the correlation of the ion concentrations and GW level, rainfall, and temperature in Piedmont plain. In the Volturno-Regi Lagni area we did not have time series of GW levels derived by continuous monitoring, but only the potenziometric contours of the year 2003, shown in Figure 2 and confirmed in the southern part by 107 new measurements [46]. Consequently, a time lag was considered between the meteoric input (rainfall and air temperature) and the response of the aquifer in terms of the concentration of the ions of interest. The time lag was considered variable between 0 and 12 months, with a monthly step.
3. Results
In the Piedmont plain test sites, yearly rainfall data ranges from 399.8 (during 2017 in Fossano rain gauge) to 1542.2 mm/year (during 2002 in Turin rain gauge) (Figure 3). Yearly average temperature ranges from 11.2 °C in the year 2006 in Fossano to 14.4 °C in the year 2018 in Turin. The hottest months are July and August, while the coldest are December, January, and February. Mean yearly air temperature data are generally higher in Turin than in Fossano (Figure 3). Scalenghe temperatures are quite similar to Fossano and are not reported in Figure 3. Temperature and rainfall showed a low correlation (R2 lower than 0.23).
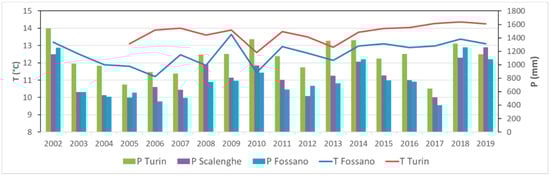
Figure 3.
Piedmont plain. Yearly rainfall in mm and yearly average temperature in °C from 2002 to 2019 (location of stations in Figure 1).
The trend analyses of meteorological parameters showed different situations.
An increasing trend in rainfall was observed in Fossano and Turin, whereas no trend was observed in Scalenghe in the period 2002–2019. Temperature showed no trend in the period 2003–2019.
Distribution of monthly rainfall and average monthly GW level in the test sites is reported in Figure 4 for at least 12 years. The annual distribution of precipitation is characterized by a bimodal trend, with a maximum in spring and an isolated main maximum in autumn (November), and two minima in winter and summer. This is in accordance with literature data [57,58]. Additionally, GW level shows the presence of a maximum in spring (April–May) and autumn (November), and a minimum in December and August.
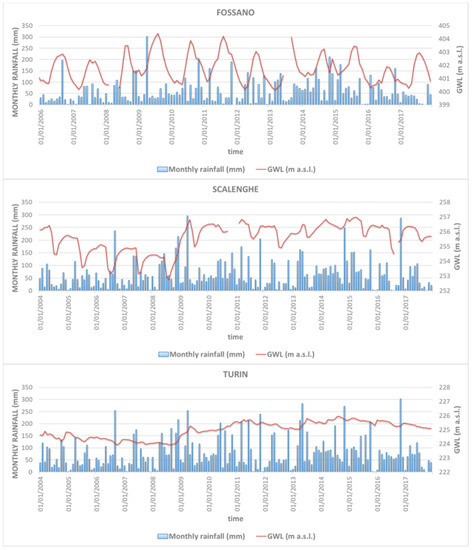
Figure 4.
Piedmont plain. Comparison between the average monthly water table level and monthly rainfall in correspondence with the three test sites from 2004–2006 and 2017. The locations of rain gauges are reported in Figure 1 (R1 for Turin test site, R2 for Scalenghe test site, and R3 for Fossano test site).
The comparison of GW level with the rainfall regime highlights a clear relationship between the parameters. In general, the water table level has a trend similar to the rainfall, with often approximately 1-month delay in the response of GW. Statistical analyses conducted in [18], using standardized anomalies and correlation plots confirm this direct relationship between rainfall and water table level in the analyzed sectors of Piedmont plain.
The analyzed test sites in Piedmont are polluted by nitrate (Fossano and Scalenghe) and chromium VI (Turin).
More specifically, the 14% of Fossano GW samples and the 70% of Scalenghe GW samples have nitrate concentrations higher than 50 mg/L, the limit set by the World Health Organization standards [66] and by the Italian Legislaton [67]. Turin test site shows a chromium VI pollution in GW, with levels higher than 5 µg/L, the maximum allowable concentration in GW according to Italian limits [67], in all the GW samples. Descriptive statistics (number of data, minimum, maximum, median, standard deviation, and skewness) of GW chemical parameters for three sample areas is reported in Table 1.

Table 1.
Piedmont plain. Summary statistics (from 2009–2019 for chromium VI and 2014–2018 for nitrate and chloride) for groundwater (GW) chemical parameters (nitrate and chloride in mg/L; chromium VI in µg/L); the location of the wells is in Figure 1. Medn = median; σ = standard deviation; γ = skewness; - = data not available.
A comparison between chemical compounds and GW levels highlighted varied situations. In the Turin test site, the chromium VI concentration and GW level show an evident common trend (Figure 5). Indeed, high GW levels always correspond to high chromium VI concentrations and vice versa. The scatterplot, analyzing chromium VI concentration versus GW level, shows a high correlation between the parameters, with a coefficient of determination R2 higher than 0.9 (Figure 6).
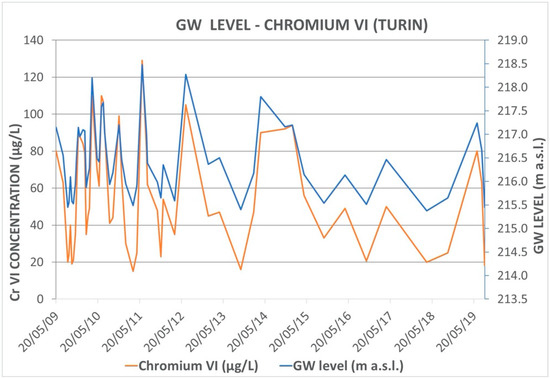
Figure 5.
Piedmont plain. Time series of chromium VI concentration and GW level in Turin test site from 2009 to 2019.
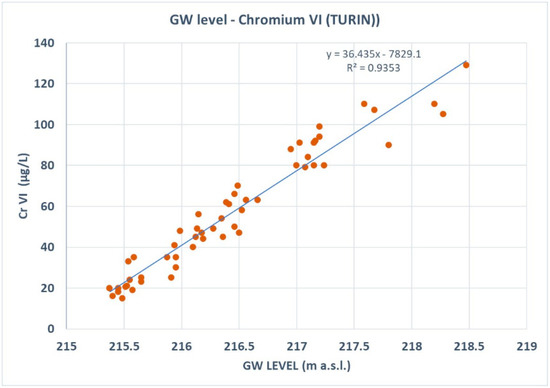
Figure 6.
Piedmont plain. Chromium VI concentrations vs. GW level in Turin test site.
The analysis of Fossano and Scalenghe test sites, characterized by a GW nitrate pollution in the shallow unconfined aquifer, shows less clear evidence.
In Fossano test site, a weak common trend between GW level and analyzed chemicals was found. The nitrate concentrations trend seems to be the same as GW, with a lag. When GW has a general decreasing trend, nitrate concentrations also decrease. On the contrary, in correspondence with a general increasing trend of piezometric level, nitrate also increases (Figure 7a). However, the lag occurring between GW level and nitrate concentration observations does not permit observation of a clear common behavior. This is also confirmed by the low R2 (0.039) between the analyzed parameters. The chloride versus GW level diagram shows a more evident correlation Indeed, high chloride concentration is generally located in periods with high piezometric level, and vice versa (Figure 7b). Nevertheless, the R2 remains lower than 0.3, indicating a scarce relationship between the parameters. The cross-correlation analysis between nitrate and chloride also highlights a low correlation (R2 = 0.02). This is probably due to a different origin or to different processes occurring in the vadose zone or in the aquifer, able to modify the concentrations.
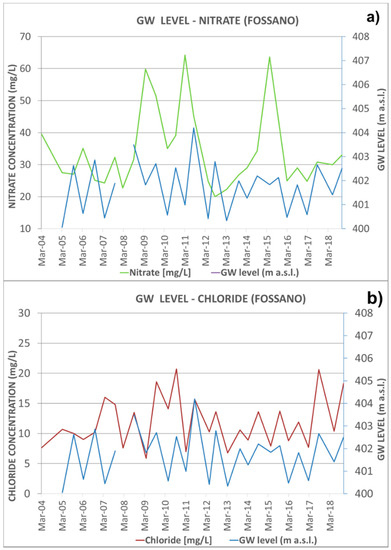
Figure 7.
Piedmont plain. Time series of nitrate (a) and chloride (b) concentration and monthly GW level in Fossano test site from 2004 to 2018.
In Scalenghe test site chloride and nitrate concentrations show a similar trend over time compared to the GW level (Figure 8). More specifically, the average GW level decrease in the period 2004–2008 (corresponding to a period of low precipitation), while a significant increase can be observed in 2009 (due to high precipitation). Similarly, nitrate levels show a decreasing trend, followed by an increasing trend, with lag respect to GW up to 1 year (e.g., the minimum GW in September 2008 and the corresponding minimum of nitrate concentration in September 2009). In other cases, GW level and nitrate do not show lag (e.g., the minimum value of GW level and nitrate in September 2012). Chloride concentration shows a similar trend as nitrate.
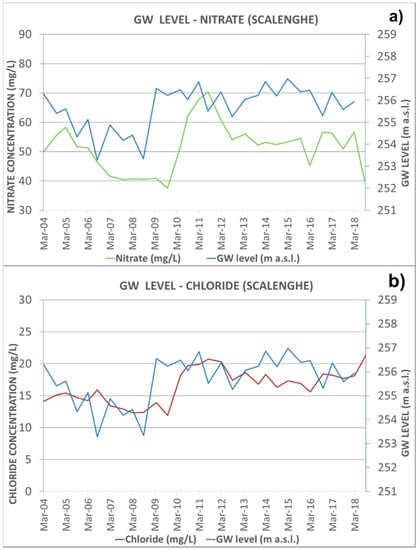
Figure 8.
Piedmont plain. Time series of nitrate (a) and chloride (b) concentration and monthly GW level in Scalenghe test site from 2004 to 2018.
Despite this general common trend, the scatterplots between nitrate and chloride concentrations and GW levels do not show a high correlation. More specifically, the R2 between nitrate and GW level is equal to 0.15, while it is equal to 0.237 between nitrate and GW level. In this test site, the correlation between nitrate and chloride is higher than in the Fossano test site, and R2 is equal to 0.47.
Observing the evolution over time of nitrate, chloride, and chromium VI in Piedmont plain (Table 2), the trend is absent for all parameters, except for chlorides in Scalenghe (increasing trend).
Table 2.
Piedmont plain. Results of Mann–Kendall trend test analysis of GW chemical parameters. Level of confidence 95%. - = data not available.
The cross-correlation analysis shows an excellent correlation (r = 0.96) between GW level and chromium VI considering a lag of 0 months in Turin test site (Figure 9a). The best positive correlation between GW level and nitrate is considering a temporal lag of 3 months both in Fossano (r = 0.58) and in Scalenghe test sites (r = 0.38). The better correlation between GW level and chloride is positive in Scalenghe (r = 0.59) and negative in Fossano (r = −0.45) considering a temporal lag of 3 months.
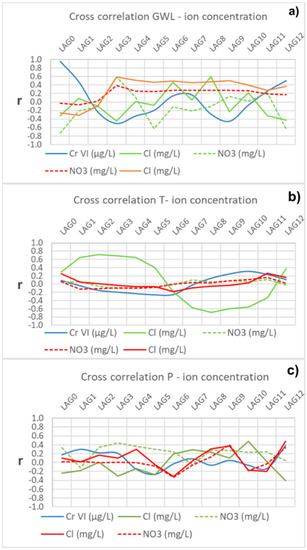
Figure 9.
Piedmont plain. Cross-correlation between ion concentrations and GW level (a), monthly temperature (b), and monthly rainfall (c). (blue = Turin test site; green = Fossano test site; red = Scalenghe test site).
The correlation between the yearly temperature and ion concentration (Figure 9b) are generally very low. The only exception is chloride in Fossano, where a positive correlation was observed with a temporal lag of 2 months (r = 0.72).
The correlation between yearly rainfall and ion concentrations (Figure 9c) is better for chromium VI considering a temporal lag of 1 month (r = 0.30). The best correlation between rainfall, nitrate, and chloride is considering a temporal lag of 3 months in Fossano. More specifically, the correlation is positive (r = 0.43) between nitrate and rainfall, and negative (r = −0.31) between nitrate and chloride. In Scalenghe, the correlation between nitrate, chloride, and rainfall is generally very low.
In the Volturno-Regi Lagni plain, precipitation data are quite similar in all the examined stations (Figure 2). The more complete dataset is for Grazzanise station, from 2000 to 2019. Yearly data ranges from 560 to 1260 mm/year and they do not indicate a clear trend (Figure 10). The rainiest month is generally November, while the driest is August. Temperature data are practically identical in the examined stations. For this reason, we used the data of Grazzanise station, with the longest and complete time series. Mean yearly data ranges from 15.6 °C in the year 2005 to 16.8 °C in the years 2015 and 2018. The trend is increasing (+0.43 °C in the period 2000–2019).
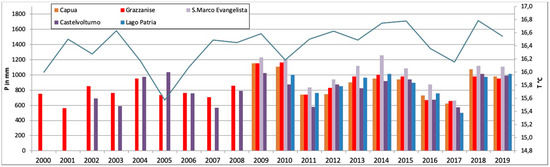
Figure 10.
“Volturno-Regi Lagni” plain. The 2000–2019 yearly rainfall in mm in the gauge stations indicated in Figure 2 and yearly average temperature in °C in Grazzanise station.
The hottest months are July and August, while the coldest are December, January, and February. It is interesting to note that since 2011 precipitation and temperature are well correlated (R2 = 0.67), as also noticeable in Figure 10.
For the 16 GW sampling wells (Figure 2), summary statistics of hydrochemical data (minimum, maximum and mean values, standard deviation, skewness coefficient) are shown in Table 3. In the period 2003–2019 the concentrations of nitrate range from 0.1 to 250 mg/L and the median value was 35 mg/L. For fluoride, the maximum concentrations are for all the wells higher than 1.5 mg/L, the limit set by the World Health Organization standards [66] and by the Italian Legislation [67]. For arsenic, 44% shows maximum values exceeding the 10 µg/L, the maximum allowable concentration in GW according to the WHO standards [66]. For iron and manganese, 80%–90% shows maximum values exceeding the Italian law limits (200 and 50 µg/L respectively, in [67]). Observing the evolution over time of these concentrations (Table 4), the trend is absent for fluoride, while it is prevalently decreasing for iron and manganese. The trend of iron and manganese is generally concordant (70%) and discordant with the trends of other ions (see Bvr 2, Bvr 28, or Bvr 6 in Table 3).
Table 3.
“Volturno-Regi Lagni” plain. Summary statistics in 2003–2019 for GW chemical parameters (As, Fe, and Mn in µg/L, NO3 in mg/L); the location of the wells is in Figure 2; Medn = median; σ = standard deviation; γ = skewness.
Table 4.
“Volturno-Regi Lagni” plain. Results of Mann–Kendall trend test analysis of GW chemical parameters (software ProUCL 4.1). Level of confidence 95%.
The cross-correlation analysis shows a better correlation between rainfall and ion concentrations than temperature and ion concentrations (Figure 11). For Bvr 23, and similarly in the other wells, the best correlation between rainfall and ion concentrations is considering a temporal lag of 5 months for arsenic and fluoride (r = 0.442 and 0.491, respectively), a temporal lag of 11 months for Fe end Mn (r = 0.384 and 0.357, respectively) and a temporal lag of 4 months for fluoride (r = 0.451). The better correlation is always the positive one.
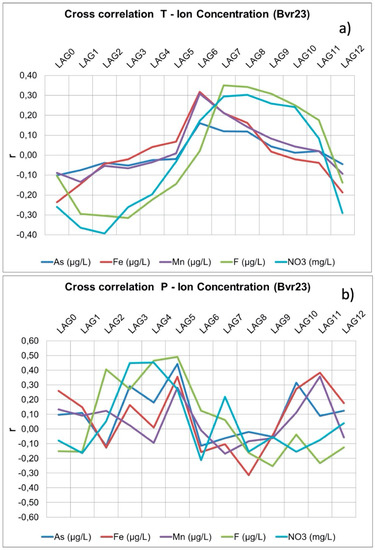
Figure 11.
“Volturno-Regi Lagni” plain. Cross-correlation between temperature and ion concentrations (a) and between rainfall and ion concentrations (b) in Bvr 23 well.
The correlation between air temperature and ion concentrations is better for iron and manganese considering a temporal lag of 6 months (r = 0.317 and 0.308, respectively), and for fluoride with a temporal lag of 7 months (r = 0.350). The better correlation is always the positive one.The correlation between the yearly infiltration and ion concentration is good for arsenic (r = 0.572), as shown in Figure 12.
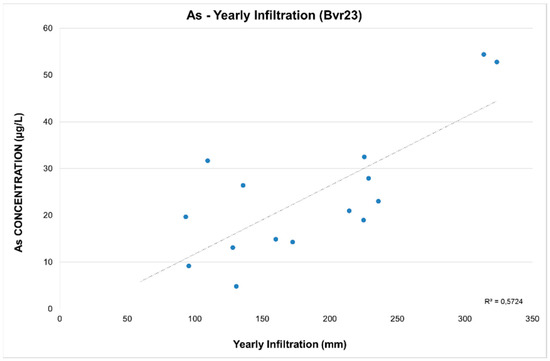
Figure 12.
“Volturno-Regi Lagni” plain. Arsenic concentrations vs. yearly infiltration.
4. Discussion and Conclusions
This research aimed to analyze the hydrogeochemical variations over time due to fluctuation of climate variables in correspondence to two study areas, very different from a hydrogeological point of view. For the two areas we analyzed different hydrogeological characteristic due to the different kinds of contamination and to the availability of input data.
The analysis in Piedmont plain highlighted a low correlation between ion concentrations (chromium VI, chloride, and nitrate) and temperature. The correlation between ion contents and GW level or rainfall, on the contrary, showed different degree of concordance, depending on the analyzed test site. In the Turin test site, the correlation between chromium VI in the shallow aquifer and GW level was clearly identified. More specifically, the cross-correlation analysis showed an excellent correlation between GW level and chromium VI considering a lag of 0 months, and a good correlation between yearly rainfall and chromium VI considering a temporal lag of 1 month. Consequently, it is possible to suppose that chromium VI in the unsaturated zone is mobilized by infiltration water during precipitation events. Then chromium VI arrives in the shallow aquifer with infiltration water and contaminates GW. Moreover, the rise of the piezometric level as result of intense rainfall events could lead to a further increase of aquifer pollution, due to the solution of the chemical that is present in the vadose zone.
The analysis of Fossano and Scalenghe test sites showed less clear evidence. A general common trend between GW level and nitrate and chloride was found, especially in Scalenghe test site, but the correlation was low. In both the test sites, a good cross-correlation between GW level, nitrate, and chloride was observed considering a temporal lag of 3 months.
In the Volturno-Regi Lagni plain the variability of the precipitation and, especially, of the air temperature is very low. Climatological data demonstrates a low concordance of temperature and precipitation with the examined ions of geogenic origin (arsenic, fluoride, iron, and manganese) and of anthropogenic origin (nitrate). F is very stable and NO3 is randomly variable, being affected by other factors of anthropogenic origin. The best correlations are between rainfall and ion concentrations, and they are always positive. The temporal lags for rainfall and temperature are variable between 4 and 11 months, in agreement with the lithology of the overlying deposits. On the yearly scale, there is a strong positive correlation between infiltration and arsenic. That is probably due to the leaching of pyroclastic rocks.
The unclear correlation between nitrate and GW level, precipitation, and temperature both in the Piedmont plain and in the Volturno-Regi Lagni plain could be due to aquifer features and multiple environmental change drivers (e.g., land use, land cover, irrigation management, etc.), in addition to climate drivers. Contaminant distribution in GW is strictly connected to the features of the chemical and the structure of aquifer. In the case of a diffuse contamination, as nitrate pollution, it is important to consider the contaminant pathway, because the pollutant levels of one point in the aquifer are due to the sum of contaminant concentrations following both vertical and horizontal pathways [38]. However, it is very challenging to separate horizontal and vertical input for nonpoint source contamination, and consequently to distinguish between the nitrate that is already present in the aquifer and the contaminant vertically leaching to GW and related to a heavy precipitation event. Our analysis of the impact of climate variability on GW quality was probably influenced by the difficulty of analyzing these transport mechanisms.
Other processes occurring in the aquifer, with a key role in the mitigation of nitrate concentration, probably further exacerbated the comprehension of the situation. Indeed, biological denitrification and dilution [37] lower the nitrate concentration. However, our study did not use these data that are few and related to small areas.
Other drivers connected to agricultural activities and management may have modified nitrate concentrations in GW, complicating our study. The Nitrates Directive [68] implied the designation of “Nitrate Vulnerable Zones” (NVZs), where the use of fertilizers, especially manure, was significantly restricted. The NVZs was applied in Piedmont Region for subsequent steps [40]. The first designation of NVZs dated back to 2002, and NVZs were progressively enlarged in 2004, 2006, 2007, and 2013. This progressive enlargement of the designated areas created different input of fertilizers along the Piedmont plain. In Campania Region the designation of NVZs counts on two designations in 2003 and 2017. In this last version the 43% of the whole region is vulnerable to nitrate, and the zones appear hardly increased (101%) with respect to the first version. The consequence is a very complex picture, with a sudden variation of nitrate concentrations in time and in space. Furthermore, irrigation systems and the quantity of water applied in agricultural areas are further information not to be neglected. However, data about the volume of water applied to crops in the Piedmont plain and in Volturno-Regi Lagni plain are very lacking, creating confusion in the analysis of meteorological variability impacts on GW quality.
At last, in Piedmont, a main issue could be the current monitoring of GW quality that, from the results of this study, is inadequate for the investigation and quantification of climate variability impacts on GW. Indeed, the GW levels are measured four times during the day in the Piedmont monitoring network, offering an accurate picture of quantitative situation of the shallow aquifer. On the contrary, the semi-annual sampling and analysis of chemicals is not able to clarify all the impacts of climate variability on GW quality. As also observed by [19], it could be recommended that dedicated monitoring of GW is established to enable assessment of future meteorological variability impacts on GW.
Finally, our study highlighted that ions in GW are generally strictly related to climatological data. However, the dependency degree is variable, based on the typology of contaminant and the aquifer features. In general, ions in shallow unconfined aquifers (e.g., in the Piedmont plain) are highly correlated to the fluctuation of climate variables. In contrast, semiconfined or confined aquifers (e.g., in the Volturno-Regi Lagni plain) react with a higher delay to these variations. The excellent correlation between GW level and chromium VI in the unconfined aquifers confirms the possible activation of a severe impact, concerning the degradation of GW quality during important infiltration events, as supposed by [28,29], and particularly by [1]. The forecast of an increasing rainfall intensity [69,70] and the presence of many industrial sites worldwide characterized by high heavy metal concentrations in the soil and vadose zone suggests a growing occurrence of this impact in future, with severe consequences for GW quality.
However, multiple environmental change drivers can obliterate the dependency between chemicals and meteorological data, also in the unconfined aquifers. In this paper, some of these factors were listed and described, especially regarding nitrate contamination, to help the scientific community and also local groundwater management to understand similar situations in other locations.
Lastly, the study emphasizes the importance of the evaluation of climatic changes also for the GW chemistry and the need to have a GW monitoring network, with a high frequency of sampling and analysis, in order to individuate any modification.
In this context, identifying climate variability effects on GW quality is extremely challenging, and long-term monitoring efforts are required to understand climate-related spatiotemporal trends in GW quality.
Author Contributions
Conceptualization, M.L. and D.D.; methodology, M.L. and D.D.; software, M.S. and S.M.; formal analysis, M.L., D.D., S.M. and M.S.; data curation, M.L., D.D., M.S.; writing—original draft preparation, M.L., D.D.; writing—review and editing, M.L., D.D., S.M., M.S.; supervision, M.L., D.D., D.A.D.L. All authors have read and agreed to the published version of the manuscript.
Funding
This research received no external funding.
Acknowledgments
The authors gratefully acknowledge the valuable suggestions from the reviewers and especially the constructive comments from the Editor. The authors would thank the Ing. Mauro Biafore and the Ing. Matteo Gentilella of the “Centro Funzionale per la Previsione Meteorologica e il Monitoraggio Meteo-Idro-Pluviometrico e delle Frane Settore Programmazione Interventi di Protezione Civile sul Territorio – Giunta Regionale della Campania” for facilitating us in the climatic data download.
Conflicts of Interest
The authors declare no conflict of interest.
References
- Parry, M.; Parry, M.L.; Canziani, O.; Palutikof, J.; Van der Linden, P.; Hanson, C. Climate Change 2007-Impacts, Adaptation and Vulnerability; Working Group II Contribution to the Fourth Assessment Report of the IPCC; Cambridge University Press: Cambridge, UK; New York, NY, USA, 2007; Volume 4. [Google Scholar]
- IPCC. Climate Change 2014: Impacts, Adaptation, and Vulnerability. Part A: Global and Sectoral Aspects; Field, C.B., Barros, V.R., Dokken, D.J., Mach, K.J., Mastrandrea, M.D., Bilir, T.E., Eds.; Contribution of Working Group II to the Fifth Assessment Report of the Intergovernmental Panel on Climate Change; Cambridge University Press: New York, NY, USA, 2014; p. 1132. [Google Scholar]
- Delpla, I.; Jung, A.V.; Baures, E.; Clement, M.; Thomas, O. Impacts of climate change on surface water quality in relation to drinking water production. Environ. Int. 2009, 351, 225–1233. [Google Scholar] [CrossRef] [PubMed]
- Taylor, R.G.; Scanlon, B.; Döll, P.; Rodell, M.; Van Beek, R.; Wada, Y.; Longuevergne, L.; Leblanc, M.; Famiglietti, J.S.; Edmunds, M.; et al. Ground water and climate change. Nat. Clim. Chang. 2013, 3, 322–329. [Google Scholar] [CrossRef]
- Green, T.R.; Taniguchi, M.; Kooi, H.; Gurdak, J.J.; Allen, D.M.; Hiscock, K.M.; Treidel, H.; Aureli, A. Beneath the surface of global change: Impacts of climate change on groundwater. J. Hydrol. 2011, 405, 532–560. [Google Scholar] [CrossRef]
- van der Gun, J. Groundwater and Global Change: Trends, Opportunities and Challenges; United Nations Educational: Paris, France, 2012; ISBN 978-92-3-001049-2. [Google Scholar]
- Döll, P.; Fiedler, K. Global-scale modelling of groundwater recharge. Hydrol. Earth Syst. Sci. 2008, 12, 863–885. [Google Scholar] [CrossRef]
- Döll, P. Vulnerability to the impact of climate change on renewable groundwater resources: A global scale assessment. Environ. Res. Lett. 2009, 4, 035006. [Google Scholar] [CrossRef]
- Braca, G.; Bussettini, M.; Ducci, D.; Lastoria, B.; Mariani, S. Evaluation of national and regional groundwater resources under climate change scenarios using a GIS-based water budget procedure. Rend. Lincei Sci. Fis. Nat. 2019, 30, 109–123. [Google Scholar] [CrossRef]
- Kløve, B.; Ala-Aho, P.; Bertrand, G.; Gurdak, J.J.; Kupfersberger, H.; Kværner, J.; Muotka, T.; Mykra, H.; Preda, E.; Rossi, P.; et al. Climate change impacts on groundwater and dependent ecosystems. J. Hydrol. 2014, 518, 250–266. [Google Scholar] [CrossRef]
- Aladejana, J.A.; Kalin, R.M.M.; Sentenac, P.; Hassan, I. Assessing the Impact of Climate Change on Groundwater Quality of the Shallow Coastal Aquifer of Eastern Dahomey Basin, Southwestern Nigeria. Water 2020, 12, 224. [Google Scholar] [CrossRef]
- Custodio, E. Trends in Groundwater Pollution: Loss of Groundwater Quality & Related Services. Groundwater Governance: A Global Framework for Action, GEF-World Bank-UNESCO. Available online: http://www.groundwatergovernance.Org/fileadmin/user_upload/groundwatergovernance/docs/Themat (accessed on 5 February 2020).
- van Vliet, M. Impact of Climate Change on Groundwater Review; IGRAC Report for TNO Bouw en Ondergrond: Delft, The Netherlands, 2007. [Google Scholar]
- Holman, I.P. Climate change impacts on groundwater recharge-uncertainty, shortcomings, and a way forward? Hydrogeol. J. 2006, 14, 637–647. [Google Scholar] [CrossRef]
- Green, T.R.; Taniguchi, M.; Kooi, H. Potential impacts of climate change and human activity on subsurface water resources. Vadose Zone J. 2007, 6, 531–532. [Google Scholar] [CrossRef]
- Bovolo, C.I.; Parkin, G.; Sophocleous, M. Groundwater resources, climate and vulnerability. Environ. Res. Lett. 2009, 4, 035001. [Google Scholar] [CrossRef]
- Fallahati, A.; Soleimani, H.; Alimohammadi, M.; Dehghanifard, E.; Askari, M.; Eslami, F.; Karami, L. Impacts of drought phenomenon on the chemical quality of groundwater resources in the central part of Iran—Application of GIS technique. Environ. Monit. Assess. 2020, 192, 64. [Google Scholar] [CrossRef] [PubMed]
- Lasagna, M.; Mancini, S.; De Luca, D.A. Groundwater hydrodynamic behaviours based on water table levels to identify natural and anthropic controlling factors in the Piedmont Plain (Italy). Sci. Total Environ. 2020, 716, 137051. [Google Scholar] [CrossRef] [PubMed]
- Bloomfield, J.P.; Jackson, C.R.; Stuart, M.E. Changes in Groundwater Levels, Temperature and Quality in the UK Over the 20th Century: An Assessment of Evidence of Impacts from Climate Change. LWEC, p. 14, (UNSPECIFIED). 2013; Available online: http://www.lwec.org.uk/publications/water-climate-change-impacts-report-card/1-groundwater-temperature-quality (accessed on 10 March 2020).
- Arnell, N.W. Climate change and water resources in Britain. Clim. Chang. 1998, 39, 83–110. [Google Scholar] [CrossRef]
- Alley, W.M. Ground water and climate. Ground Water 2001, 39, 161. [Google Scholar] [CrossRef]
- Lasagna, M.; Mancini, S.; De Luca, D.A.; Cravero, M. Piezometric levels in the Piedmont plain (NW Italy): Trend and hydrodynamic behaviour of the shallow aquifer. Rend. Online Soc. Geol. It. 2019, 48, 2–9. [Google Scholar] [CrossRef]
- Hanson, R.T.; Dettinger, M.D.; Newhouse, M.W. Relations between climatic variability and hydrologic time series from four alluvial basins across the southwestern United States. Hydrogeol. J. 2006, 14, 1122–1146. [Google Scholar] [CrossRef]
- Aribisala, J.O.; Awopetu, M.S.; Ademilua, O.I.; Okunadel, E.A.; Adebayo, W.O. Effect of climate change on groundwater resources in southwest Nigeria. J. Environ. Earth Sci. 2015, 5, 12. [Google Scholar]
- Dragoni, W.; Sukhija, B.S. Climate Change and Groundwater; Dragoni, W., Sikhija, B.S., Eds.; Geological Society, Special Publications: London, UK, 2008; Volume 288, pp. 1–12. [Google Scholar]
- Bloomfield, J.P.; Williams, R.J.; Gooddy, D.C.; Cape, J.N.; Guha, P.M. Impacts of climate change on the fate and behaviour of pesticides in surface and groundwater—A UK perspective. Sci. Total Environ. 2006, 369, 163–177. [Google Scholar] [CrossRef]
- Stuart, M.E.; Gooddy, D.C.; Bloomfield, J.P.; Williams, A.T. A review of the impact of climate change on future nitrate concentrations in groundwater of the UK. Sci. Total Environ. 2011, 409, 2859–2873. [Google Scholar] [CrossRef]
- Sugita, F.; Nakane, K. Combined effects of rainfall patterns and porous media properties on nitrate leaching. Vadose Zone J. 2007, 6, 548–553. [Google Scholar] [CrossRef]
- Gurdak, J.J.; Hanson, R.T.; McMahon, P.B.; Bruce, B.W.; McCray, J.E.; Thyne, G.D.; Reedy, R.C. Climate variability controls on unsaturated water and chemical movement, High Plains aquifer, USA. Vadose Zone J. 2007, 6, 533–547. [Google Scholar] [CrossRef]
- Taylor, C.A.; Stefan, H.G. Shallow groundwater temperature response to climate change and urbanization. J. Hydrol. 2009, 375, 601–612. [Google Scholar] [CrossRef]
- Bucci, A.; Barbero, D.; Lasagna, M.; Forno, M.G.; De Luca, D.A. Shallow groundwater temperature in the Turin area (NW Italy): Vertical distribution and anthropogenic effects. Environ. Earth Sci. 2017, 76, 221. [Google Scholar] [CrossRef]
- Bucci, A.; Barbero, D.; Forno, M.G.; Lasagna, M.; De Luca, D.A. Urban groundwater warming in Turin area (NW Italy). Rend. Online Soc. Geol. It. 2019, 47, 2–6. [Google Scholar] [CrossRef]
- Mastrocicco, M.; Busico, G.; Colombani, N. Deciphering Interannual Temperature Variations in Springs of the Campania Region (Italy). Water 2019, 11, 288. [Google Scholar] [CrossRef]
- Debernardi, L.; De Luca, D.A.; Lasagna, M. Correlation between nitrate concentration in groundwater and parameters affecting aquifer intrinsic vulnerability. Environ. Geol. 2008, 55, 539–558. [Google Scholar] [CrossRef]
- Lasagna, M.; Franchino, E.; De Luca, D.A. Areal and vertical distribution of nitrate concentration in Piedmont plain aquifers (North-western Italy). In Engineering Geology for Society and Territory-Volume 3; Springer: Berlin/Heidelberg, Germany, 2015; pp. 389–392. [Google Scholar] [CrossRef]
- Lasagna, M.; De Luca, D.A.; Franchino, E. Nitrate contamination of groundwater in the western Po Plain (Italy): The effects of groundwater and surface water interactions. Environ. Earth Sci. 2016, 75, 240. [Google Scholar] [CrossRef]
- Lasagna, M.; De Luca, D.A.; Franchino, E. The role of physical and biological processes in aquifers and their importance on groundwater vulnerability to nitrate pollution. Environ. Earth Sci. 2016, 75, 961. [Google Scholar] [CrossRef]
- Lasagna, M.; De Luca, D.A.; Franchino, E. Intrinsic groundwater vulnerability assessment: Issues, comparison of different methodologies and correlation with nitrate concentrations in NW Italy. Environ. Earth Sci. 2018, 77, 277. [Google Scholar] [CrossRef]
- Lasagna, M.; De Luca, D.A. The use of multilevel sampling techniques for determining shallow aquifer nitrate profiles. Environ. Sci. Pollut. Res. 2016, 23, 20431–20448. [Google Scholar] [CrossRef] [PubMed]
- Lasagna, M.; De Luca, D.A. Evaluation of sources and fate of nitrates in the western Po Plain groundwater (Italy) using nitrogen and boron isotopes. Environ. Sci. Pollut. Res. 2019, 26, 2089–2104. [Google Scholar] [CrossRef] [PubMed]
- Martinelli, G.; Dadomo, A.; De Luca, D.A.; Mazzola, M.; Lasagna, M.; Pennisi, M.; Pilla, G.; Sacchi, E.; Saccon, P. Nitrate sources, accumulation and reduction in groundwater from Northern Italy: Insights provided by a nitrate and boron isotopic database. Appl. Geochem. 2018, 91, 23–35. [Google Scholar] [CrossRef]
- De Luca, D.A.; Lasagna, M.; Mancini, S. Strategies for deep aquifers protection at local and regional scale: The Piedmont Region example. Geoing. Ambient. Mineraria 2019, 156, 24–29. [Google Scholar]
- Sellerino, M.; Forte, G.; Ducci, D. Identification of the natural background levels in the Phlaegrean fields groundwater body (Southern Italy). J. Geochem. Explor. 2019, 200, 181–192. [Google Scholar] [CrossRef]
- Corniello, A.; Ducci, D. Hydrogeochemical characterization of the main aquifer of the “Litorale Domizio-Agro Aversano NIPS” (Campania—southern Italy). J. Geochem. Explor. 2014, 137, 1–10. [Google Scholar] [CrossRef]
- Ducci, D.; Condesso De Melo, M.T.; Preziosi, E.; Sellerino, M.; Parrone, D.; Ribeiro, L. Combining Natural Background Levels (NBLs) assessment with indicator kriging analysis to improve groundwater quality data interpretation and management. Sci. Total Environ. 2016, 569–570, 569–584. [Google Scholar] [CrossRef]
- Ducci, D.; Del Gaudio, E.; Sellerino, M.; Stellato, L.; Corniello, A. Hydrochemical and isotopic analyses to identify groundwater nitrate contamination. The alluvial-pyroclastic aquifer of the Campanian plain (southern Italy). Geoing. Ambient. e Mineraria 2019, 156, 4–12. [Google Scholar]
- Ducci, D.; Della Morte, R.; Mottola, A.; Onorati, G.; Pugliano, G. Nitrate trends in groundwater of the Campania region (southern Italy). Environ. Sci. Pollut. Res. 2019, 26, 2120–2131. [Google Scholar] [CrossRef]
- ISPRA. Guidelines for the Assessment of Increasing and Inversion Trends in Groundwater (Ministerial Decree, 2016); Italian Institute for Environmental Protection and Research: Rome, Italy, 2017. [Google Scholar]
- Mann, H.B. Nonparametric test against trend. Econometrica 1945, 13, 245–259. [Google Scholar] [CrossRef]
- Kendall, M. Multivariate Analysis; Charles Griffin Co. LTD: London, UK, 1975; p. 210. [Google Scholar] [CrossRef]
- Bortolami, G.; Maffeo, B.; Maradei, V.; Ricci, B.; Sorzana, F. Lineamenti di litologia e geoidrologia del settore piemontese della Pianura Padana. Quad. Ist. Ricerca sulle Acque 1976, 28, 1–37. [Google Scholar]
- Bove, A.; Casaccio, D.; Destefanis, E.; De Luca, D.A.; Lasagna, M.; Masciocco, L.; Ossella, L.; Tonussi, M. Idrogeologia Della Pianura Piemontese. Regione Piemonte; Mariogros Industrie Grafiche, S.p.A.: Torino, Italy, 2005; p. 15. [Google Scholar]
- Forno, M.G.; De Luca, D.; Bonasera, M.; Bucci, A.; Gianotti, F.; Lasagna, M.; Lucchesi, S.; Pelizza, S.; Piana, F.; Taddia, G. Synthesis on the Turin subsoil stratigraphy and hydrogeology (NW Italy). Alp. Mediterr. Quat. 2018, 31, 147–170. [Google Scholar] [CrossRef]
- De Luca, D.A.; Lasagna, M.; Debernardi, L. Hydrogeology of the western Po Plain (Piedmont, NW Italy). J. Maps 2020, 16, 265–273. [Google Scholar] [CrossRef]
- Lasagna, M.; De Luca, D.A.; Debernardi, L.; Clemente, P. Effect of the dilution process on the attenuation of contaminants in aquifers. Environ. Earth Sci. 2013, 70, 2767–2784. [Google Scholar] [CrossRef]
- Available online: http://rsaonline.arpa.piemonte.it/meteoclima50/clima_ed_indicatori.htm (accessed on 15 February 2020).
- Biancotti, A.; Bellardone, G.; Bovio, S.; Cagnazzi, B.; Giacomelli, L.; Marchisio, C. Distribuzione Regionale Di Piogge E Temperature; Vol. I. Collana studi climatologici in Piemonte (Rainfall and Temperature Regional Distribution. Vol. I. Climatic Studies of Piedmont); Cima Icam: Turin, Italy, 1998. [Google Scholar]
- Acquaotta, F.; Fratianni, S. Analysis on long precipitation series in Piedmont (northwest Italy). Am. J. Clim. Chang. 2013, 2, 14–24. [Google Scholar] [CrossRef]
- Available online: http://www.regione.piemonte.it/monitgis/jsp/cartografia/mappa.do (accessed on 10 February 2020).
- Available online: http://centrofunzionale.regione.campania.it/#/pages/sensori/archivio (accessed on 2 February 2020).
- Turc, L. Estimation of irrigation water requirements, potential evapotranspiration: A simple climatic formula evolved up to date. Ann. Agron 1961, 12, 13–49. [Google Scholar]
- USEPA. Determination of Hexavalent Chromium in Drinking Water, Groundwater and Industrial Wastewater Effluents by Ion Chromatography; Method 7199. In Test Methods for Evaluating Solid Waste, Physical/Chemical Methods; SW-846; US Government Printing Office: Washington, DC, USA, 1996. [Google Scholar]
- Available online: http://www.arpacampania.it/web/guest/365 (accessed on 1 February 2020).
- ISO 5667-11. Water Quality—Sampling—Part 11: Guidance on Sampling of Groundwater; ISO: Geneva, Switzerland, 2009. [Google Scholar]
- Singh, A.; Maichle, R.; Singh, A.K.; Lee, S.E.; Armbya, N. PROUCL Version 4.00. 02 User Guide; US EPA, Office of Research and Development: Washington, DC, USA, 2007. Available online: https://www.epa.gov/sites/production/files/2015-03/documents/proucl_v4.1_tech.pdf (accessed on 5 February 2020).
- WHO. Guidelines for Drinking-Water Quality: Fourth Edition Incorporating the First Addendum; WHO: Geneva, Switzerland, 2017. [Google Scholar]
- D.Lgs. 152. del 03/04/2006 Norme in materia ambientale, G.U. n. 88 del 14/04/2006—Suppl. Ord. n. 96. 2006.
- European Commission. Directive 91/676/EEC Council Directive of 12 December 1991 Concerning the Protection of Waters against Pollution Caused by Nitrates from Agricultural Sources. Off. J. Eur. Commun. 1991, L375, 1–8. [Google Scholar]
- Field, C.B.; Barros, V.; Stocker, T.F.; Dahe, Q. (Eds.) Managing the Risks of Extreme Events and Disasters to Advance Climate Change Adaptation: Special Report of the Intergovernmental Panel on Climate Change; Cambridge University Press: Cambridge, UK, 2012; p. 582. [Google Scholar]
- USGCRP. Impacts, Risks, and Adaptation in the United States: Fourth National Climate Assessment, Volume II. US Global Change Research Program; USGCRP: Washington, DC, USA, 2018; p. 1515. [CrossRef]


© 2020 by the authors. Licensee MDPI, Basel, Switzerland. This article is an open access article distributed under the terms and conditions of the Creative Commons Attribution (CC BY) license (http://creativecommons.org/licenses/by/4.0/).