1. Introduction
In water conveyance systems, water flows under free-surface flow condition or pressurized flow condition. Under certain circumstances, transition between the two flow regimes may occur (i.e., the flow regime transition phenomenon). Following the transition, force exerting on structures changes violently and causes structural damage [
1,
2,
3]. Numerical simulation of flow regime transition can provide substantial information for the design and management of river-crossing bridges, tunnels, conducts and culverts [
4,
5,
6,
7,
8,
9,
10].
The complexity of flow regime transition lies in the presence of free-surface and pressurized flows, which are governed by different equations. This problem can be avoided by adopting one set of governing equations for two flow regimes. Based on this idea, the Preissmann slot model (PSM) is proposed [
11]; it was adopted by many researchers and commercial software packages [
12,
13,
14,
15,
16,
17,
18]. The strong gradient in piezometric head at the interface between two flow regimes forms a discontinuity in flow. Finite volume methods can capture the discontinuity in the flow implicitly, which makes them popular in simulating flow regime transition [
19].
Despite of all the fine properties that finite volume methods have, the numerical oscillations in a flow regime transition simulation have troubled many hydraulic engineers [
12]. These numerical oscillations have the same origin with “post-shock oscillations” in gas dynamics [
20,
21,
22,
23]. In analytical results, the thickness of the filling-bore is infinitely small, and the flow states at the two sides of a filling-bore satisfy the Rankine–Hugoniot condition. In numerical simulations, a filling-bore spreads over several computational cells, and the flow states at the two adjacent cells do not satisfy the Rankine–Hugoniot condition. This causes trivial discrepancies in the mass and momentum fluxes, which are amplified in simulation results due to the large acoustic wave speed. High-order finite volume methods cause more numerical oscillations because of low dissipation away from the shocks [
21]. First-order upwind finite volume methods fail to prevent numerical oscillations without compromising the representation of the filling-bore [
23,
24,
25].
A lot of effort has been spent to obtain a stable and accurate result of flow regime transition [
12,
23,
24]. In this paper, some existing oscillation-suppressing methods are tested on a benchmark model. Considering the lack of an efficient and simple method, the authors derive a new method, which can suppress numerical oscillations and capture the filling-bore nicely under a high acoustic wave speed. The structure of this paper is as follows:
Section 2 introduces the governing equations and the discretization method.
Section 3 reviews the existing oscillation-suppressing methods, and their effects are evaluated on the benchmark model that was adopted by Malekpour and Karney [
24].
Section 4 proposes a new and simple modified HLL solver to suppress numerical oscillations. Its accuracy and robustness are tested against the analytical results and experiment data in
Section 5. Conclusions are drawn in the last section.
2. Governing Equations and Discretization Method
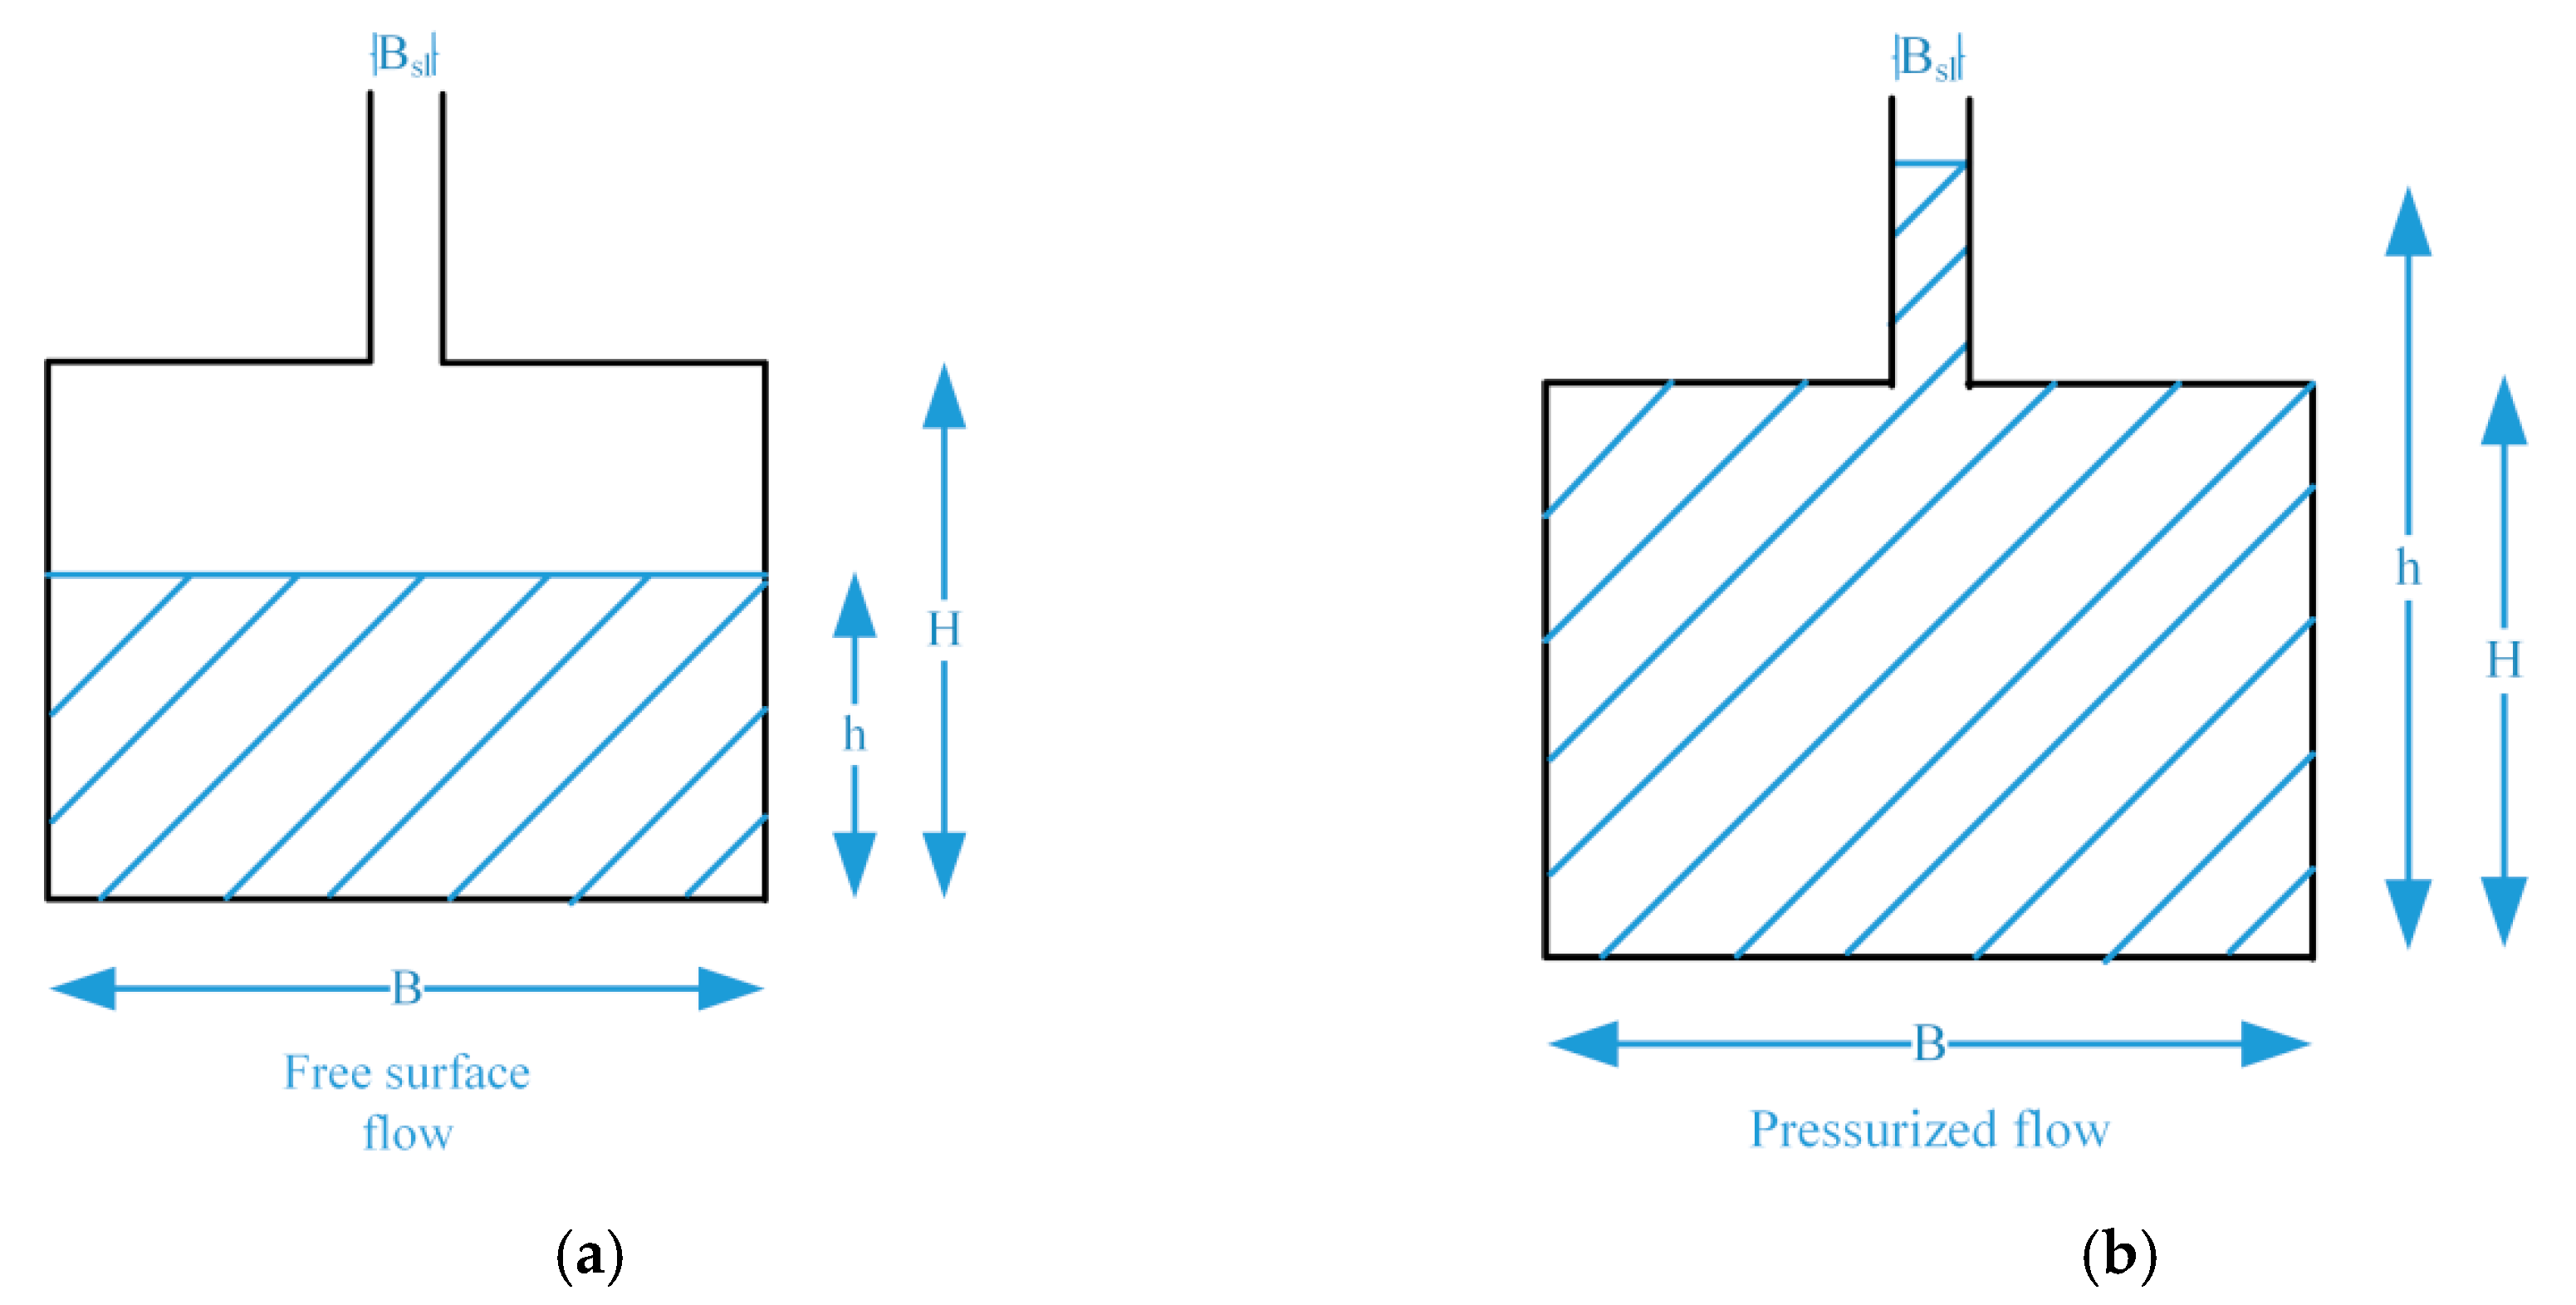
The PSM places an infinitely high narrow slot on the top of the conduct, so that it becomes an open-channel with a composite cross-section. The water depth in the slot represents the piezometric head of the pressurized flow inside the original conduct, as shown in
Figure 1. The slot width needs to be very small so that the gravity wave speed inside it is identical to the acoustic wave speed.
Under the framework of PSM, the governing equations of one-dimensional flow regime transition with uniform cross-sections can be written as [
26]:
where
Q is the volume flow rate,
A is the wetted area,
g is the acceleration of gravity,
h is the water depth,
I is the moment of inertia,
l is the cross-sectional width and
l(
x,
h) =
b(
x) the water surface width. The external force acting on the flow is accounted in the source term, where
Sb is the bed slope and
Sf is the friction slope, which can be computed using the Manning relation:
where
u is the flow velocity,
n is the Manning coefficient and
R is the hydraulic radius. For a rectangular cross-section with a slot on its top, the parameters
b,
A,
I and wave speed
c can be expressed as functions of
h:
where
H and
B are the cross-sectional height and width, and
Bsl is slot width. In order to make the gravity wave speed inside the slot equal to the acoustic wave speed
a, the slot width
Bsl =
gAf a−2, where
Af is the full cross-sectional area of the conduct [
27]. Using the Godunov-type finite volume methods with first-order accuracy and assuming a piecewise constant data construction, the governing equations are discretized as
3. Review of Current Oscillation-Suppressing Methods
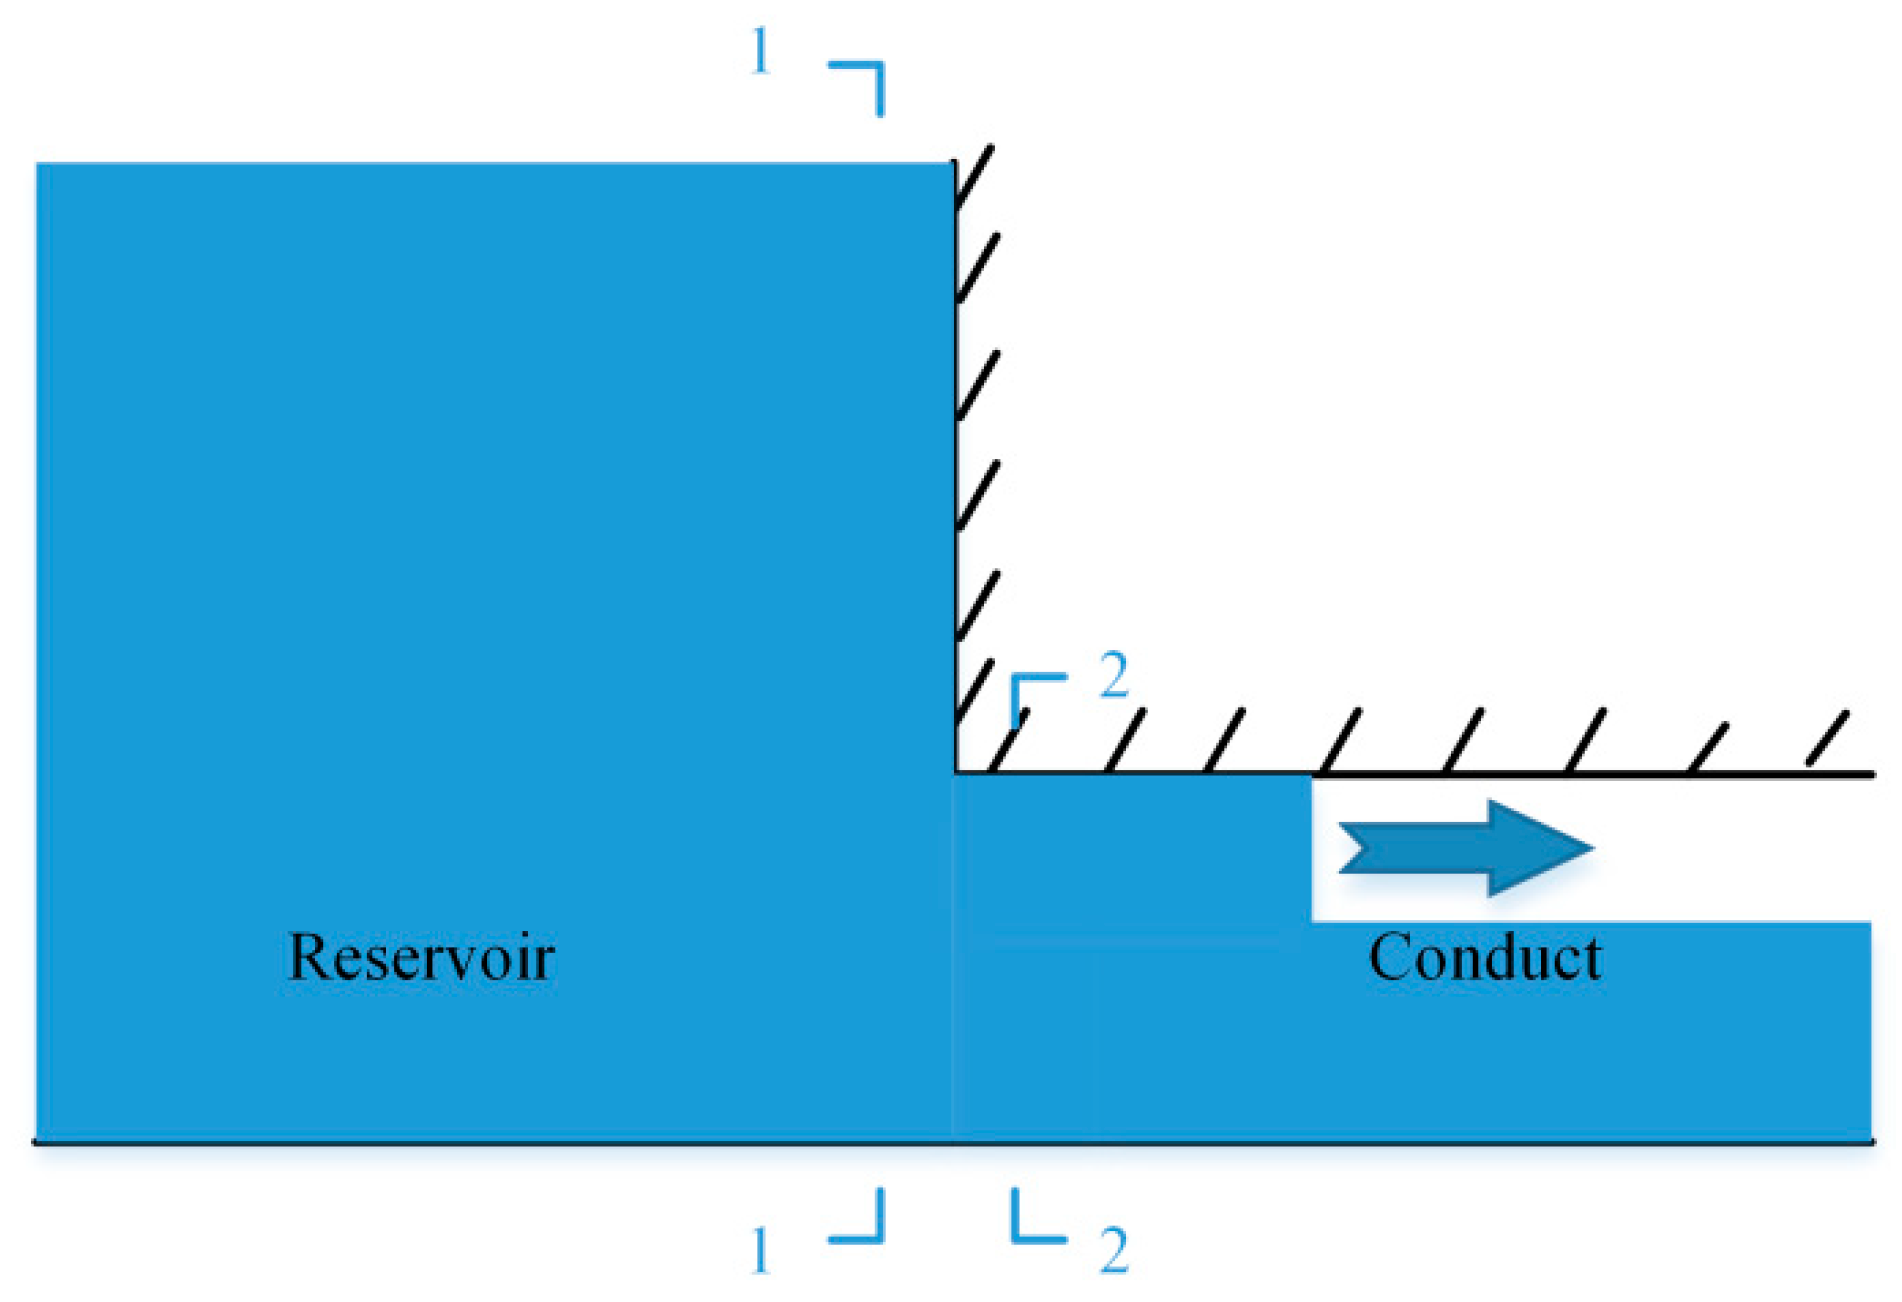
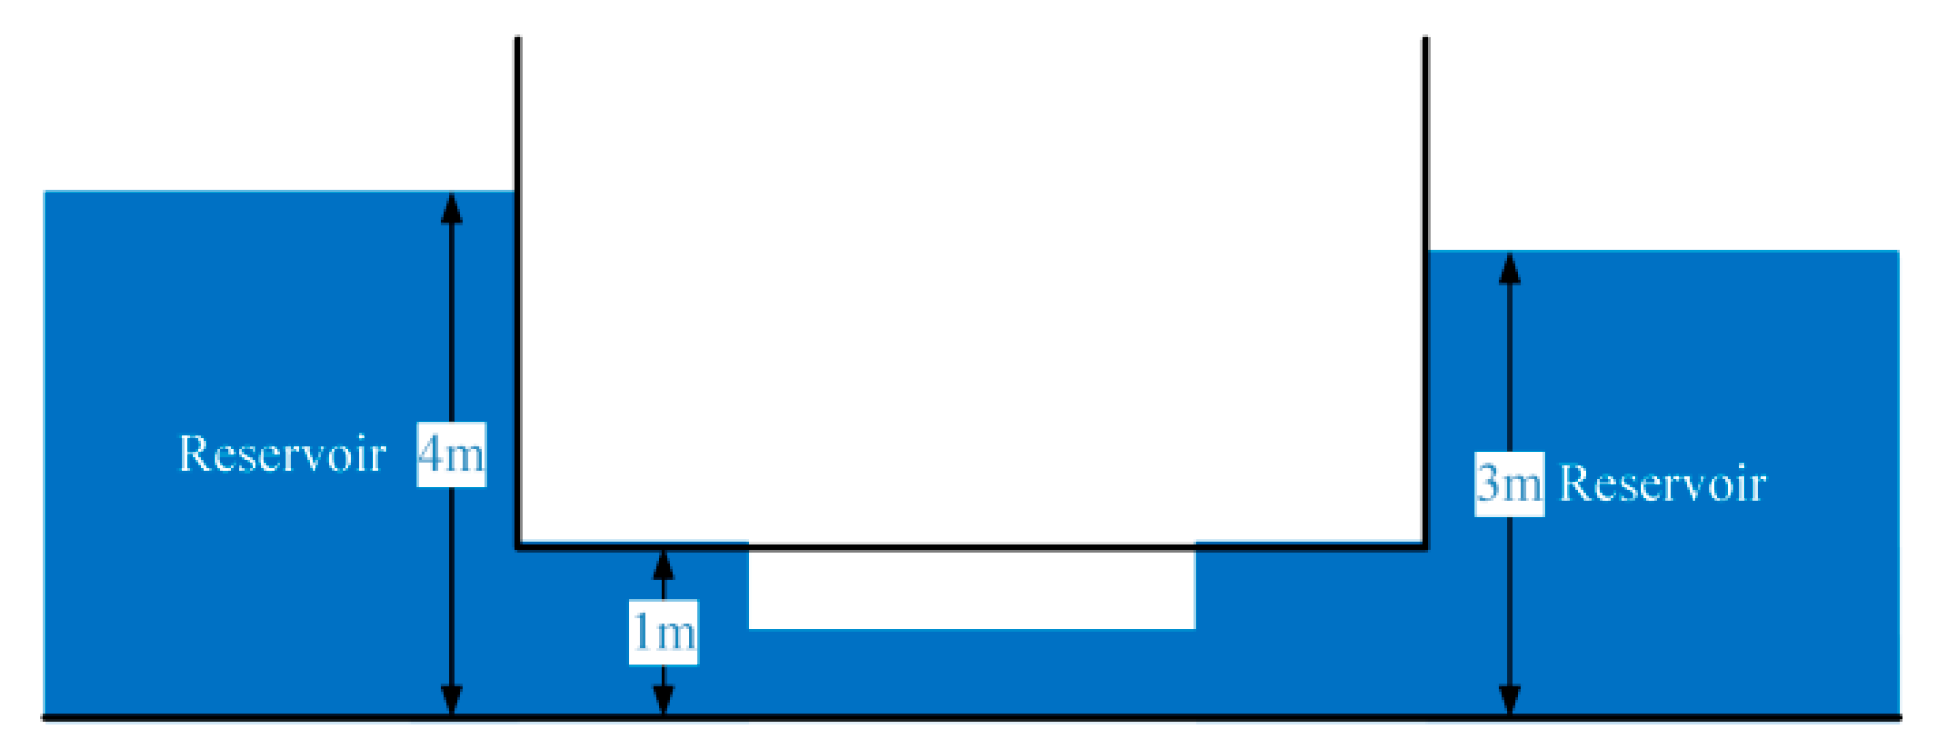
The benchmark model was proposed by Malekpour and Karney [
24], it consists of a conduct with square-unit cross-sections that are connected to a reservoir at the upstream end. The acoustic wave speed is 1000 ms
−1 and the slot width is 9.8 × 10
−6 m. Under the initial condition, 0.6 m-deep stagnant water is in the conduct while the water level inside the reservoir is constantly 4 m, as shown in
Figure 2.
Under initial condition, flow states
UL in the reservoir and
UR in the conduct are discontinuous:
Since
hL is larger than
hR, a shock wave (filling-bore) belonging to the second characteristic field is formed at the conduct inlet and propagates downstream. Consider 1–1 as a cross-section in the reservoir and 2–2 as a cross-section at conduct inlet: flow sates at 1–1 and 2–2 are
U1 and
U2, respectively. Then
U2 can be obtained by solving the following equations iteratively [
24]:
where
U1 =
UL by assuming that flow velocity inside the reservoir is negligible. In this case,
h2 and
u2 are 3.167 m and 4.0334 ms
−1, a ghost cell is set at the upstream boundary adopting
h2 and
u2. Since
U2 is connected to
UR through a right shock, the flow states inside the conduct ultimately will take place by
U2. The propagation speed of the filling-bore is given by the Rankine–Hugoniot condition, which is 10.067 ms
−1. Then we can construct the analytical result in the benchmark model at
t0:
As customary,
x denotes the distance to the conduct inlet. In a numerical simulation, the size of each computational cell is 1 m, the time step is 0.008 s and the Courant number is 0.8. When the acoustic wave speed adopted in the simulation exceeds 100 ms
−1, the magnitude of the numerical oscillations become so large that the simulated piezometric head become negative, and the simulation will not proceed [
24]. In the remaining part of this section, the readers will see that only one method can get a satisfactory result under a high acoustic wave speed, while its performance rely on two parameters which must be well tuned. This shows the importance of devising an alternative method, which is stable and convenient.
3.1. Numerical Filtering Method
In this method, the exact Riemann solver is adopted to solve the Riemann problem at each cell boundary. Flow states
Ui+1/2 at
xi+1/2 satisfy the following equations:
Equations (13) and (14) can be solved iteratively, then the wave structure in the Riemann problem can be determined and utilized to compute the flux; see Kerger et al. [
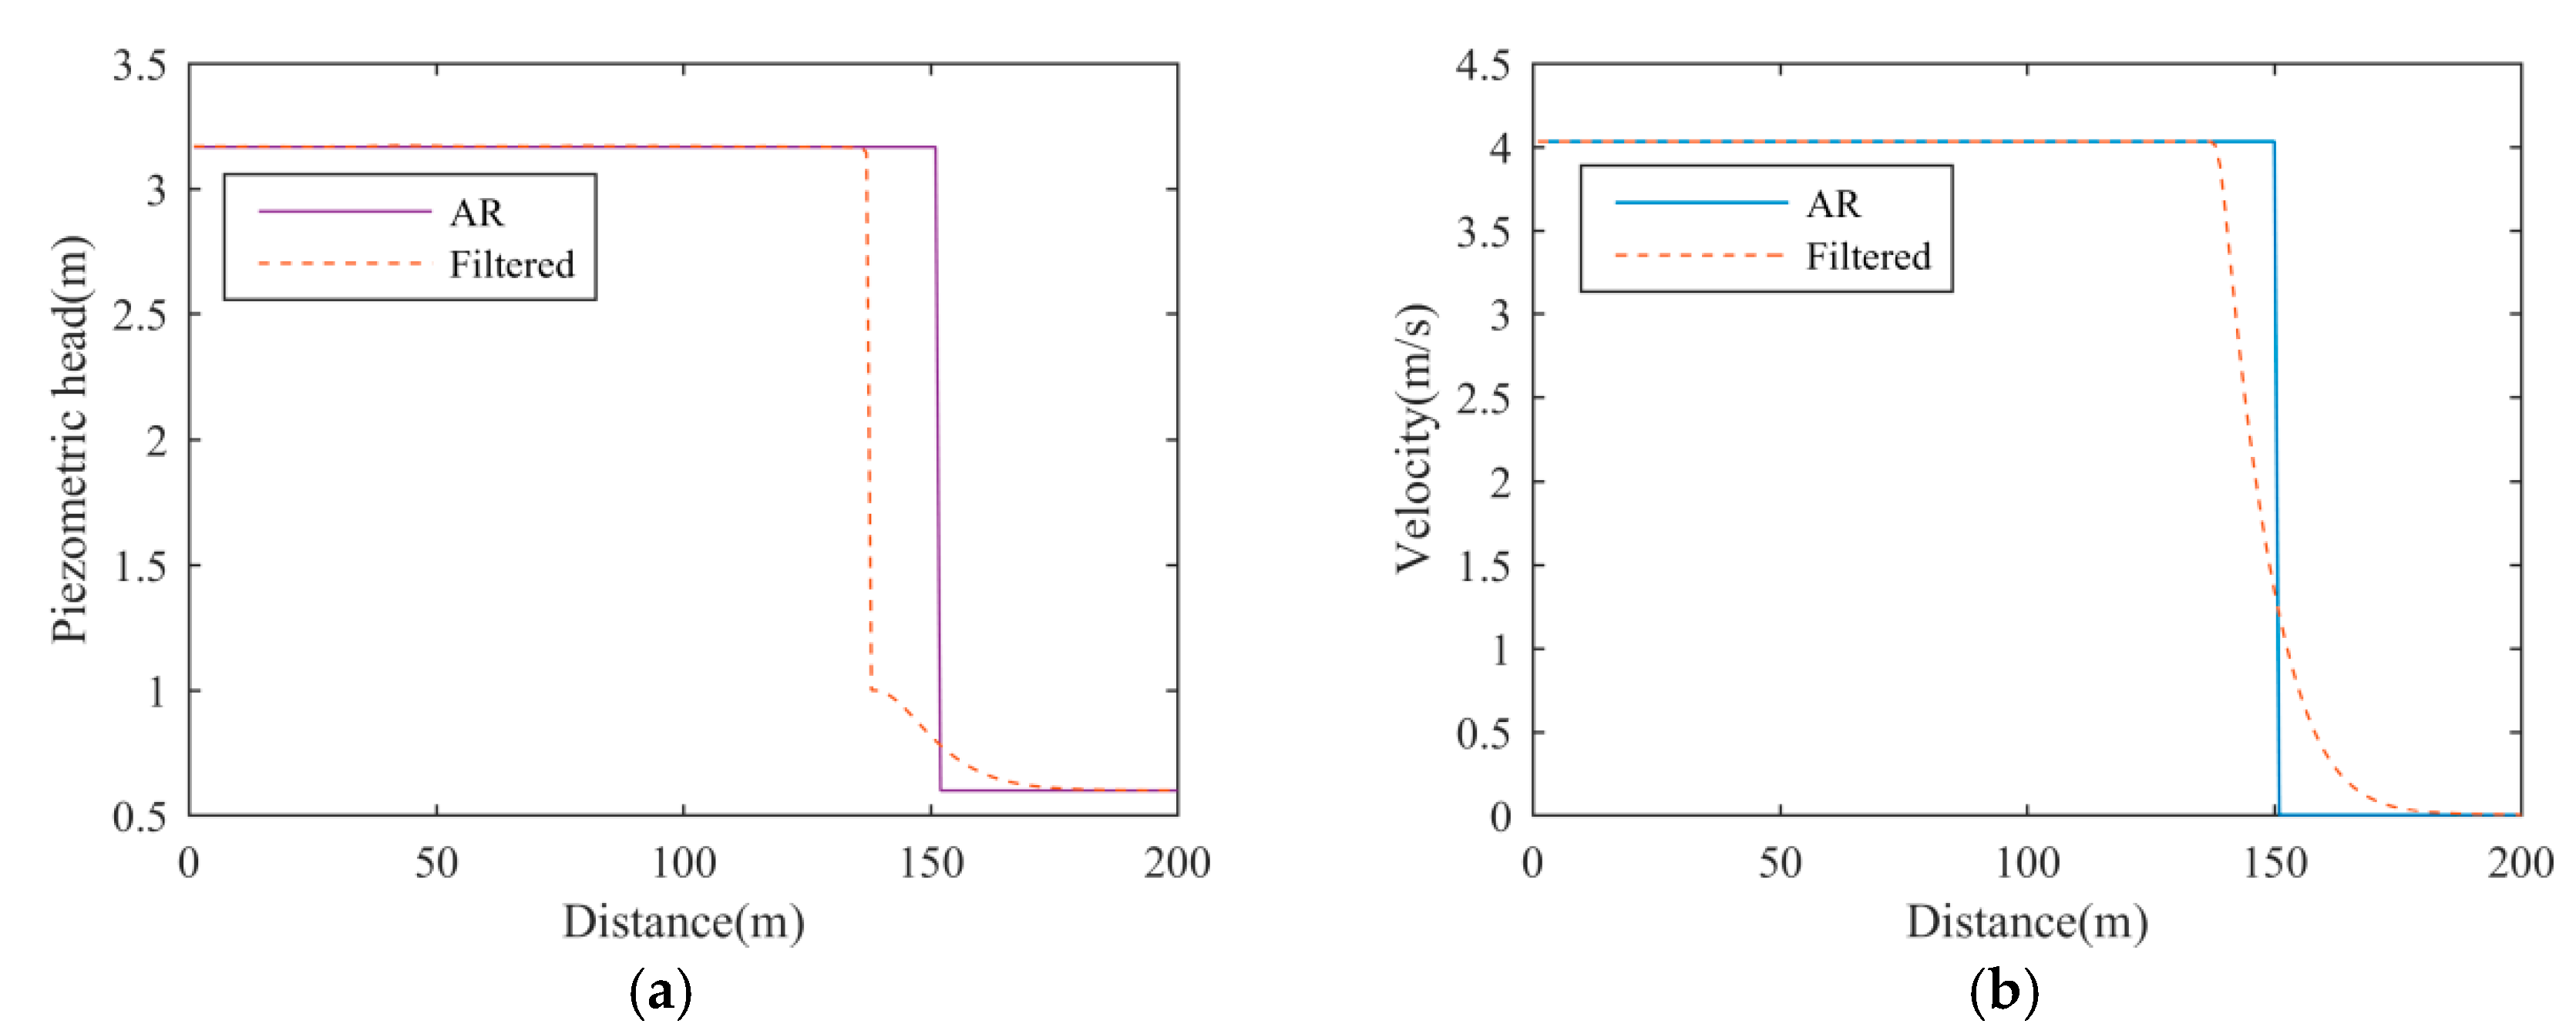
26] for detail. Although the exact solver can obtain the complete wave structure, serious numerical oscillations appear in the simulation result. Vasconcelos et al. [
23] proposed to suppress the numerical oscillations by averaging the flow states among the three conjunct cells at each time step:
The authors suggest
ε to be between 0.025 and 0.050. This method will increase the spreading length of the filling-bore front and remove any physical oscillations that appear in the solution. The simulation result of this method using
ε = 0.04 is drawn in
Figure 3.
3.2. Hybrid Flux Method
The hybrid flux method uses two types of numerical fluxes alternatively. The first one is based on the Roe solver [
28] and the LxF scheme [
23]. Define
as eigenvalues of the linearized Jacobian matrix,
as the corresponding right eigenvectors and
as the wave strengths across the cell boundary:
where
,
and
are Roe averages:
Then the fluxes obtained by the Roe solver are written as
The Roe solver is known to be vulnerable to numerical oscillations [
21,
29], while the LxF scheme is robust against numerical oscillations but causes too much diffusion of the filling-bore:
Compare Equations (22) with (23): The difference between the Roe solver and LxF scheme is the choice of eigenvalues. Vasconcelos et al. [
23] proposed a new method to determine the eigenvalues:
This method is referred to as the hybrid one from here on further. At the cell boundary between the free-surface and pressurized flows, Δ
ci+1/2 = 1, as
L changes from 0 to 1, the eigenvalues switches from those obtained by the Roe solver to those adopted in the LxF scheme. At the other cell boundaries, Δ
ci+1/2 is approximately 0, thus the eigenvalues in Equation (24) remain close to those obtained by the Roe solver. In this way, numerical viscosity is added at the cell boundary where flow condition transition happens, and its amount increases with
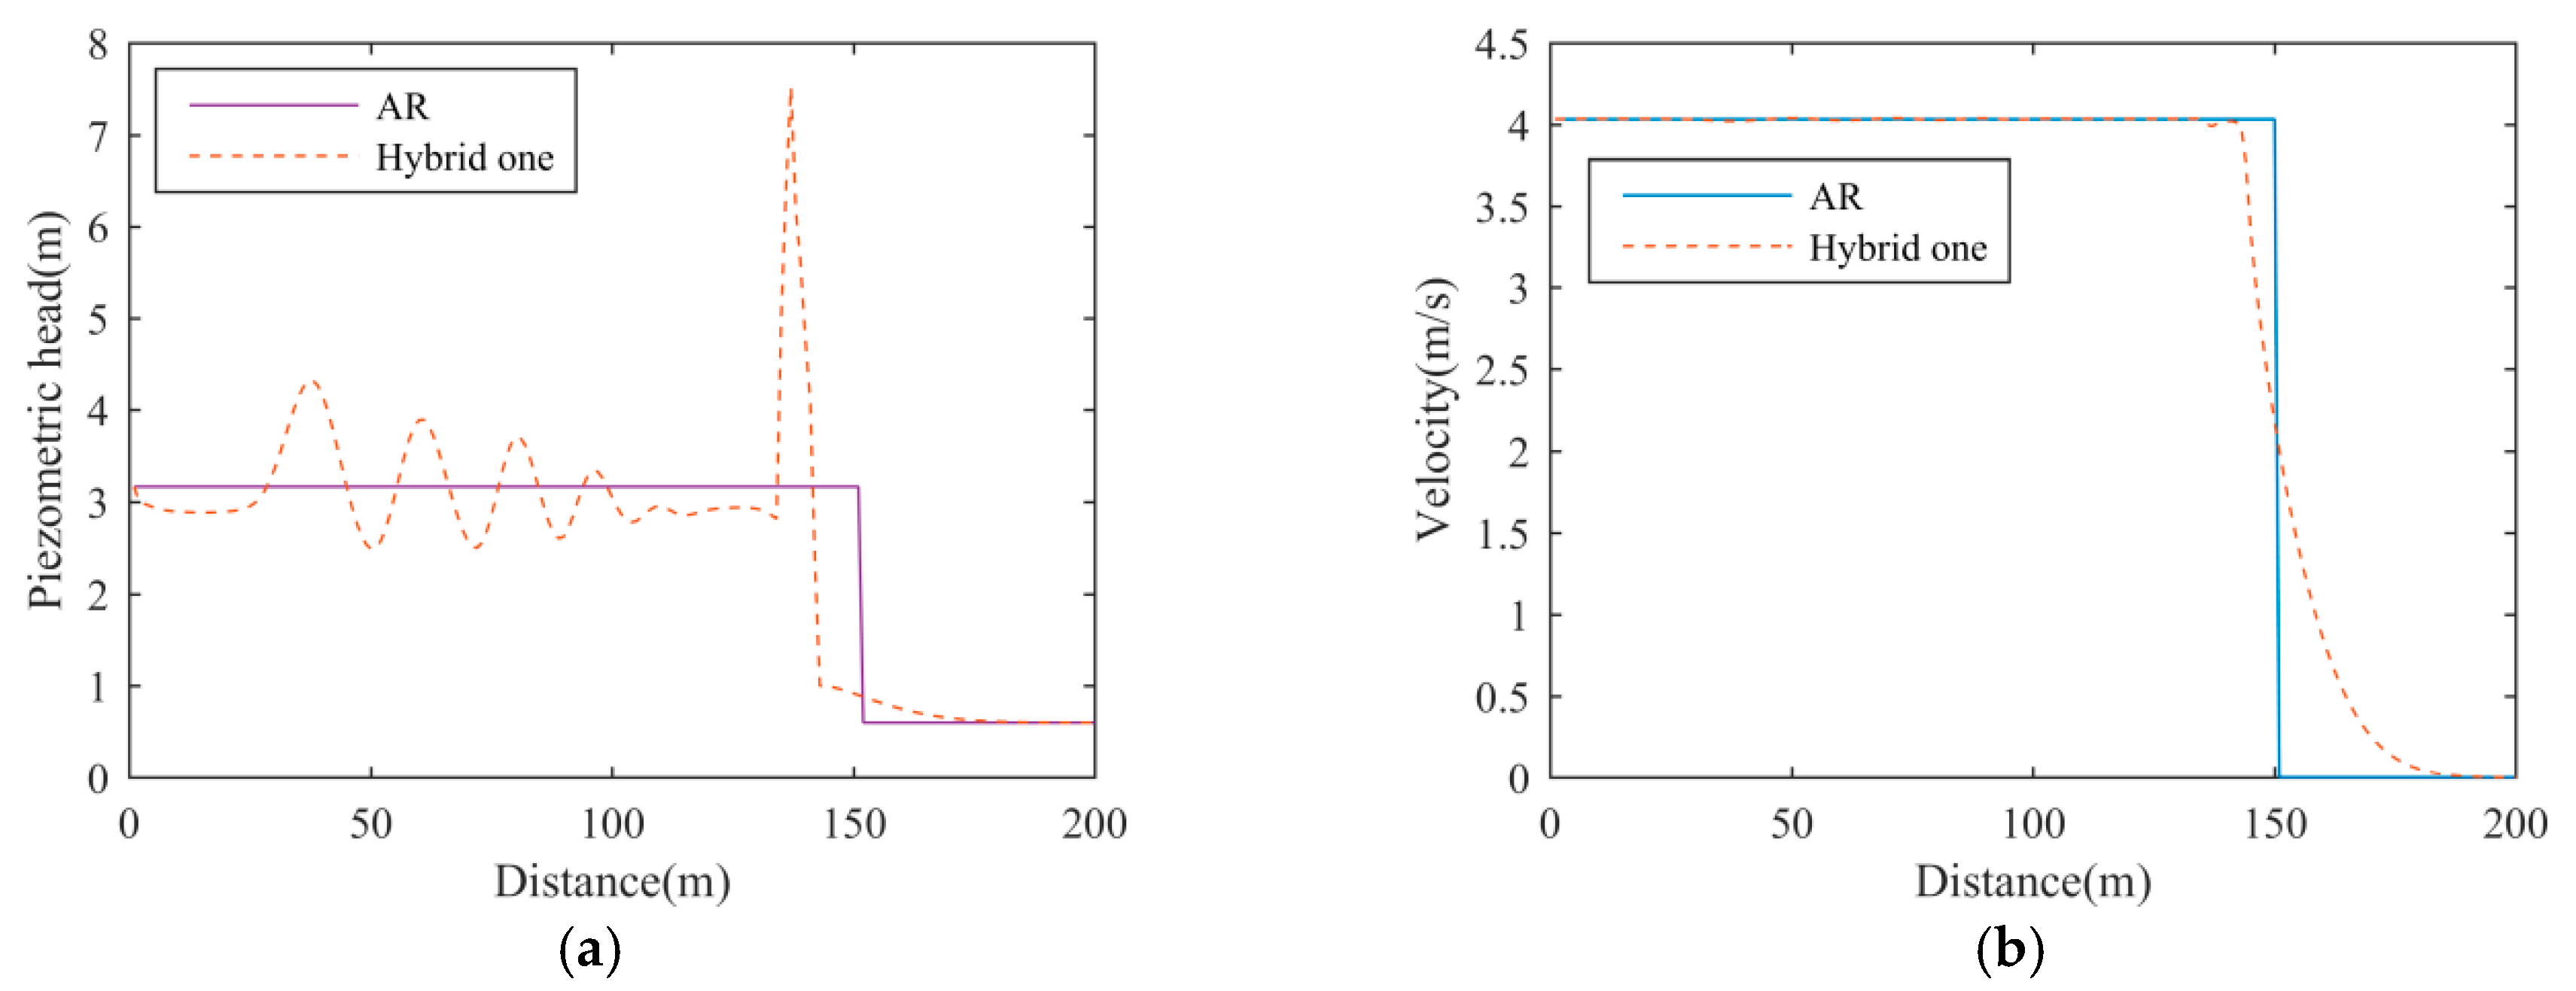
L. The simulation results of the hybrid one with
L = 0.6 are drawn in
Figure 4. This method overestimates the spreading length of the filling-bore, and it fails to suppress the numerical oscillations under a high acoustic wave speed.
Hyunuk et al. [
12] chose different fluxes; they used the FORCE scheme [
30] at the cell boundary between the free-surface and pressurized flows, and the HLL solver [
30] elsewhere:
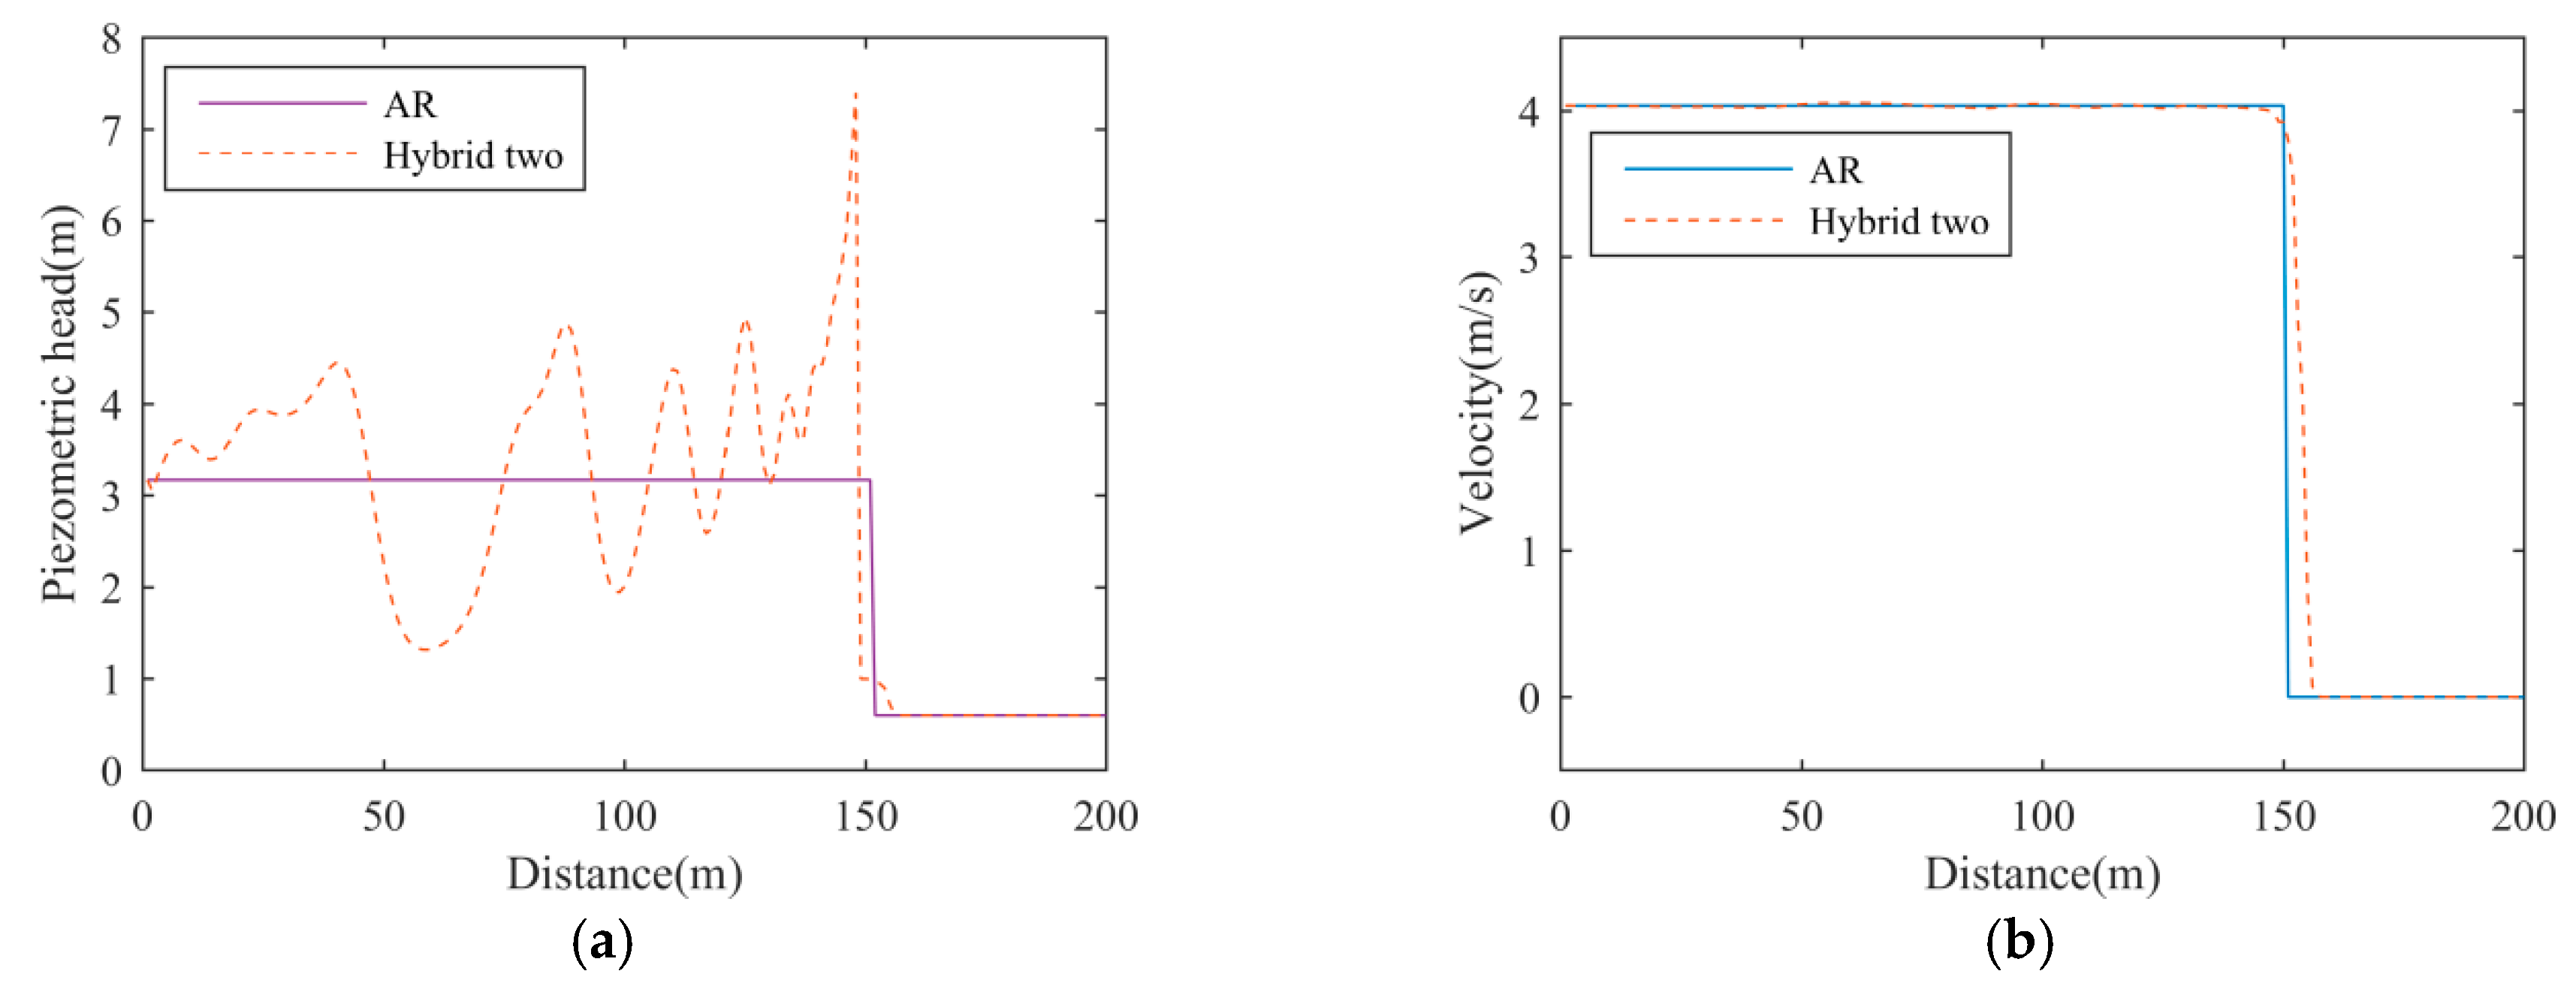
This method is referred to as hybrid two from here on further. The HLL solver starts by estimating the largest wave speed
SwR and smallest wave speed
SwL in the Riemann problem. The fluxes are computed based on the signs of
SwL and
SwR:
The choices of
SwL and
SwR follow Toro [
31]:
where
Ai+1/2 is an estimate of the wetted area at
xi+1/2; we adopt the one proposed by Leno et al. [
32], which admits the minimum amount of numerical viscosity:
The FORCE flux can be written as the algebraic average of the LxF scheme and Lax–Wendorff scheme:
The FORCE scheme is a centred scheme; thus, it is robust against numerical oscillations. It is less diffusive than the LxF scheme, which can reduce the over-smearing at strong gradients [
33]. The simulation results of hybrid two are depicted in
Figure 5.
The hybrid flux methods have added enough numerical viscosity at the cell boundary between the two flow regimes but, still, serious numerical oscillations appear in the simulation results. The reason is that the numerical oscillations appear as soon as the flow regime transition happens, and while the two methods start to add numerical viscosity one time-step falls behind of it. If one method can foresee the happening of the flow regime transition, and admits numerical viscosity ahead of it, it will achieve a more stable result.
3.3. Modified HLL Solver
Malekpour and Karney [
24] pointed out that the amount of numerical viscosity in the HLL fluxes increases with the magnitude of
SwL and
SwR. In fact, the HLL fluxes equal the LxF fluxes when |
SwL| and |
SwR| equal Δ
x/Δ
t. To increase the amount of numerical viscosity, they proposed a modified HLL solver (referred to as the M_HLL solver). In the M_HLL solver,
Ai+1/2 in Equation (29) is computed according to a reference depth
hG:
The depth
hG is defined as
Ka, multiplying the highest piezometric head in the 2
NS+1 cells surrounding cell
i, while
Ka > 1 and
NS ≥ 3. The solution of Equation (33) produces a larger magnitude of
SwL and
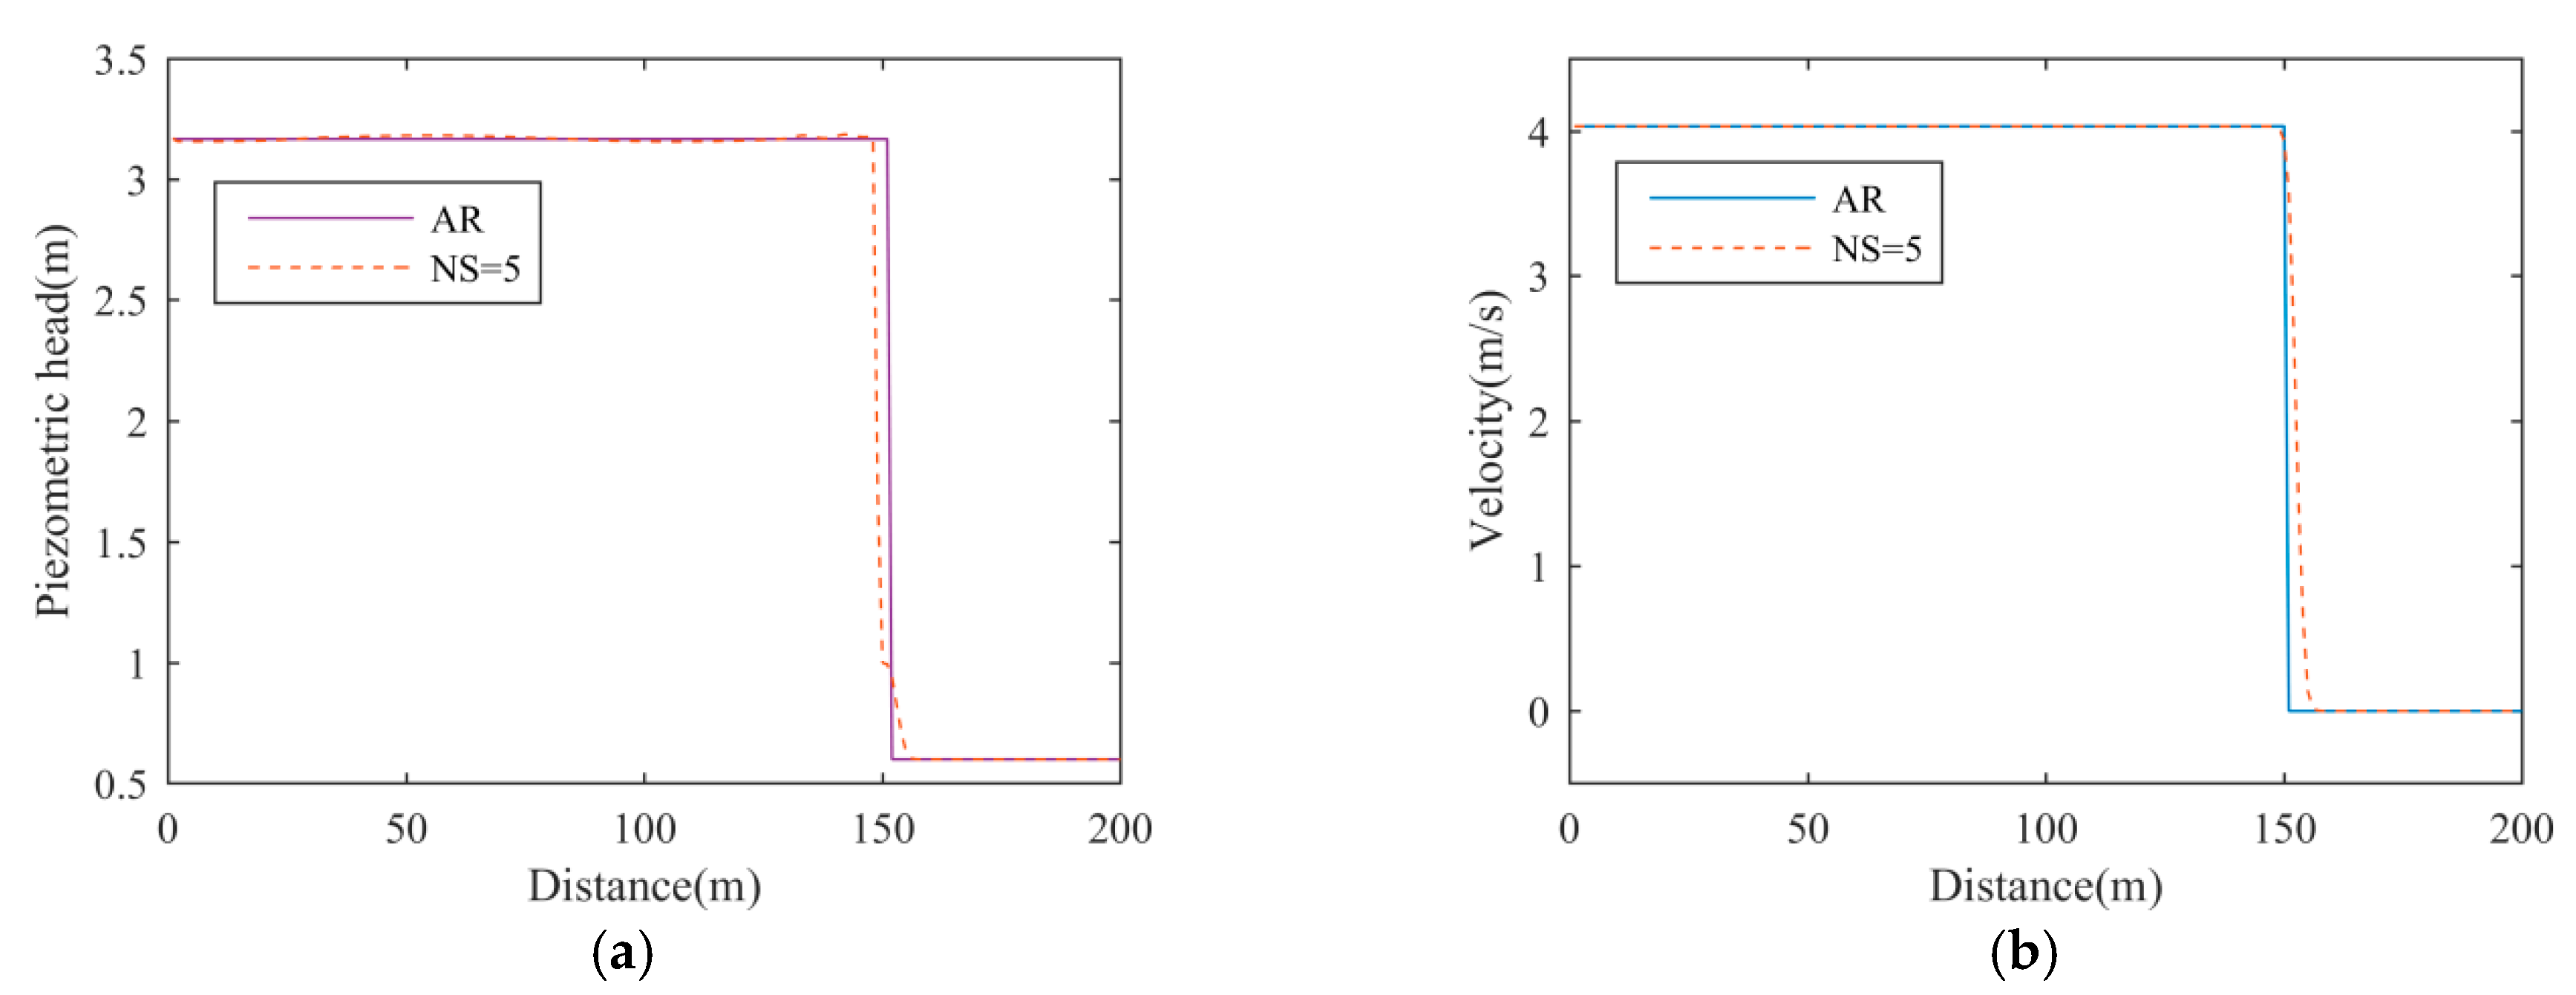
SwR; thus, increasing the numerical viscosity before the flow regime transition happens. The simulation results of M_HLL with
Ka = 1.4 and
NS = 5 are drawn in
Figure 6.
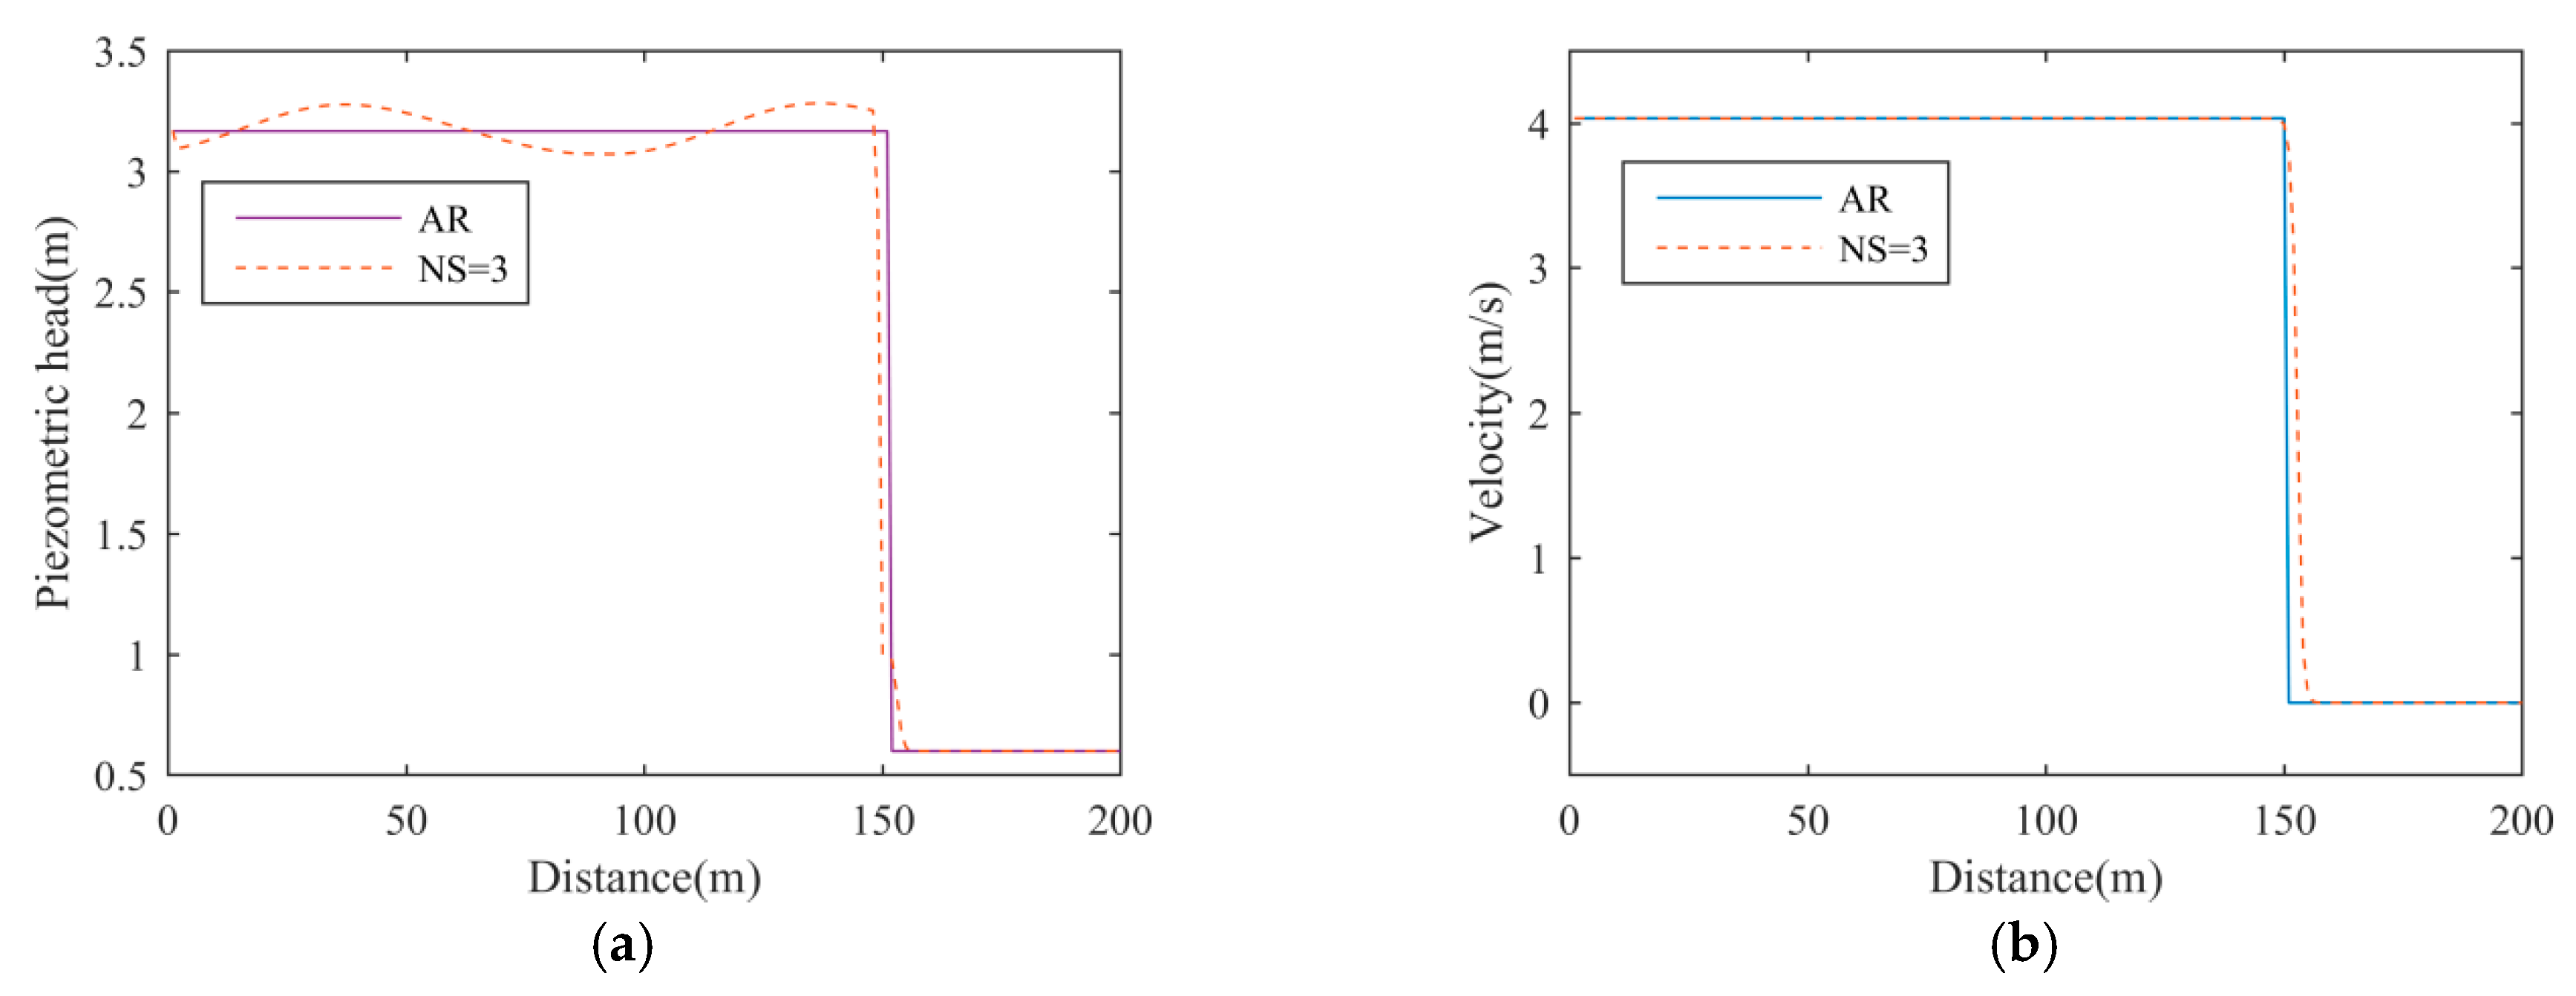
The M_HLL solver can suppress numerical oscillations in the benchmark model, and it only slightly increases the spreading length at the filling-bore front. However, the values of
Ka and
NS can affect the diffusion and accuracy of the M_HLL solver to a great extent; see
Figure 7.
Thus, the values of Ka and NS must be well-tuned. Meanwhile, the way to determine hG makes the HLL solver hard to use in parallelized computation. In the next section, the authors present an alternative method, which is equally efficient as the M_HLL solver.
4. A New Modified HLL Solver
In this section, we present a new modified HLL solver (referred to as the P_HLL solver) to suppress numerical oscillations. In the P_HLL solver, the solution to
Ai+1/2 depends on the water depths at cell
i and
i + 1. When
hi and
hi+1 are below
PbH,
Ai+1/2 is computed using Equation (30) to admit the minimum amount of numerical viscosity, otherwise
Ai+1/2 is computed according to a constant depth
PaH:
Pb must be smaller than one, and a preferable value is between 0.6 and 0.8. PaH must be larger than the piezometric head peak during the transition to admit enough numerical viscosity.
To illustrate the effect of
Pa and
Pb, we study the Riemann problem at
xi+1/2 in the benchmark model. Suppose
hi and
hi+1 is 3.167 m and 0.6 m, respectively, and
ui and
ui+1 is 4.0334 ms
−1 and 0 ms
−1, respectively. The solution of Equation (30) lies between
Ai and
Ai+1, and after substituting it into Equation (28), one will get
SwL (noted as
SwL1) as the speed of the left rarefaction wave head, and
SwR (noted as
SwR1) as the speed of right shock wave:
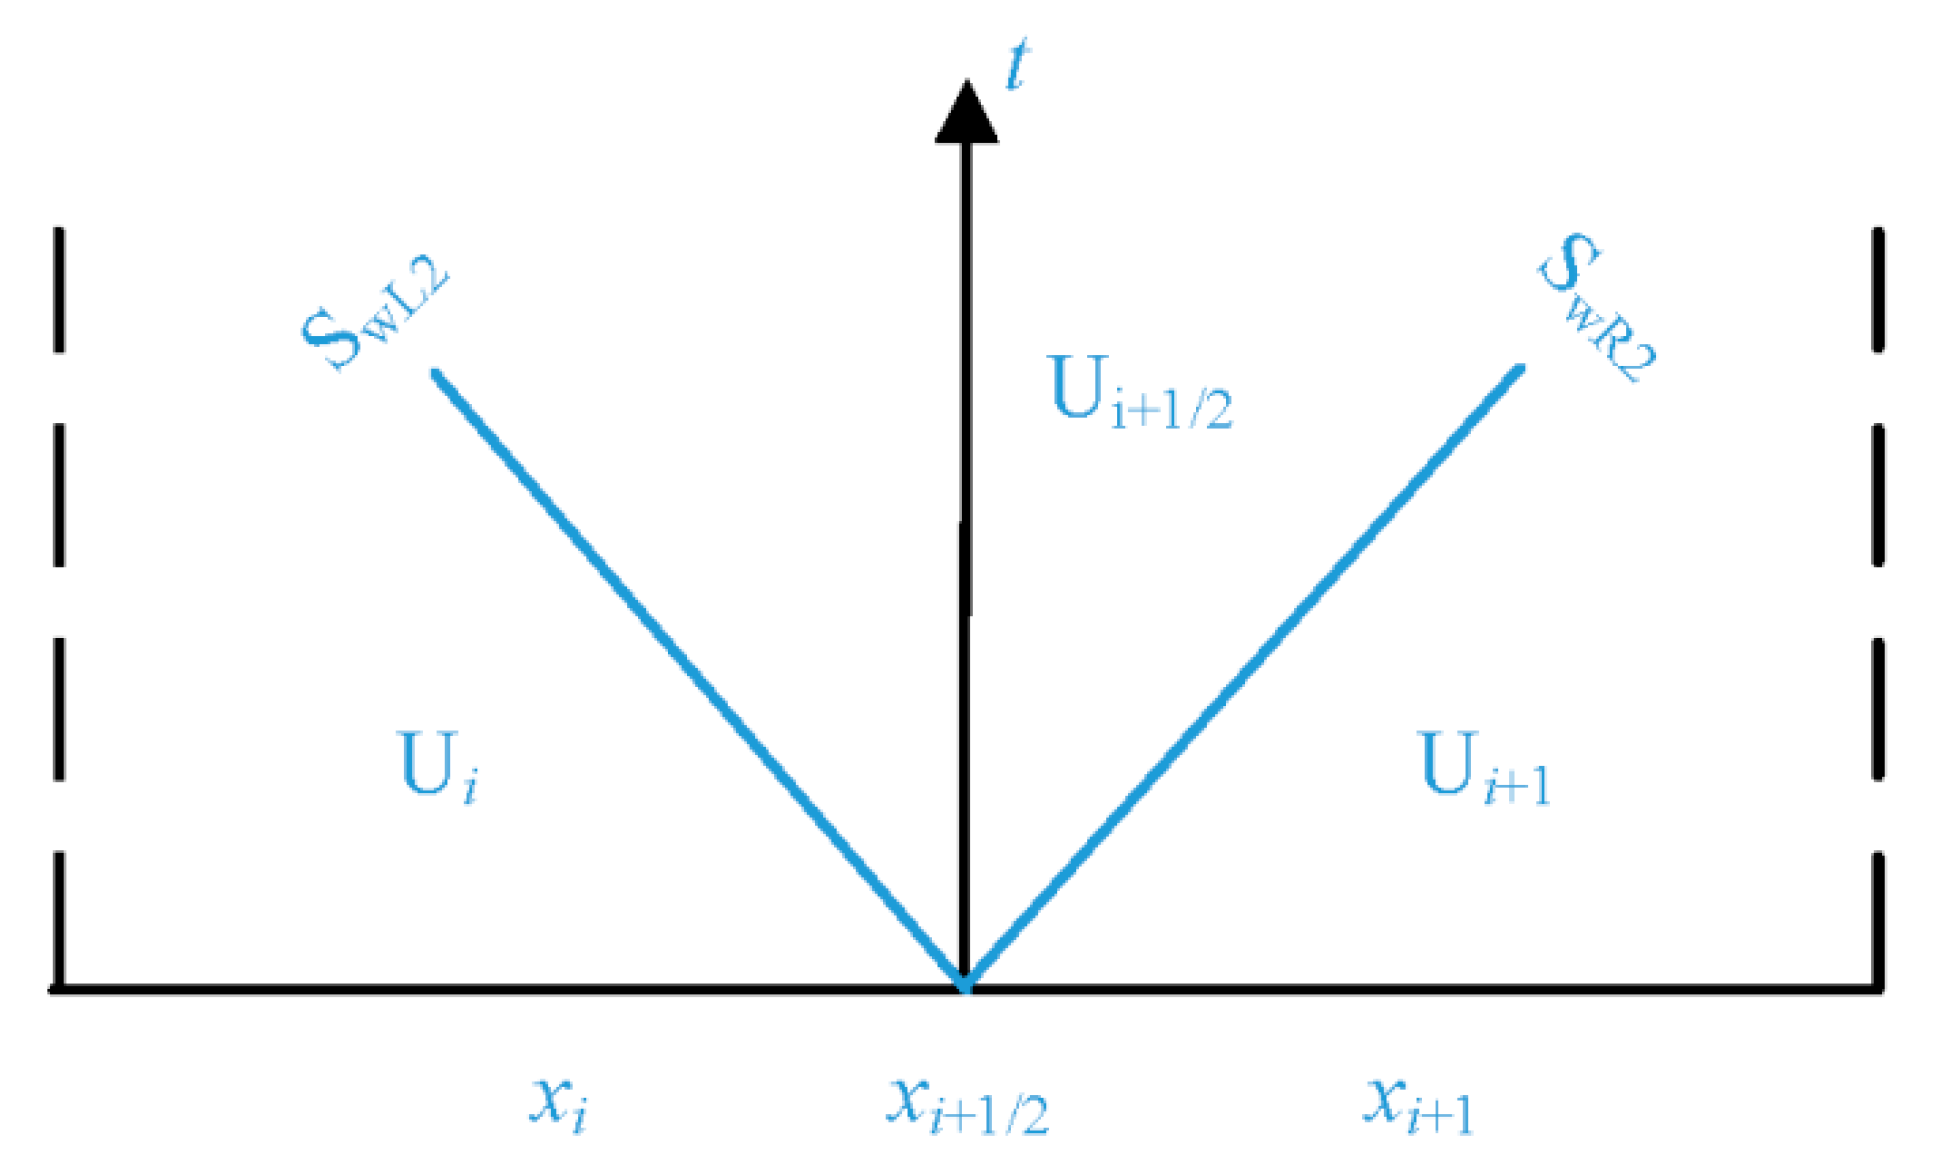
A sketch of two waves in the Riemann problem is shown in
Figure 8.
Because cell
i is under a pressurized flow condition, it is easy to see that |
SwL1| nearly equals the acoustic wave speed. The entropy condition of right shock wave requires
The magnitude of SwR1 equals the propagation speed of the filling-bore, which is 10.067 ms−1, and it is much smaller than the acoustic wave speed.
The solution of Equation (34) is unconditionally larger than
Ai and
Ai+1, which produces two shock waves in the Riemann problem. Consequently,
SwR2 is the speed of the right shock wave, and
SwL2 is the speed of the left shock wave; see
Figure 9.
The entropy condition of the left shock wave requires
Since cell
i is under a pressurized flow condition,
ui <<
ci; thus, |
SwL2| > |
SwL1| and they are both close to the acoustic wave speed. The speed of the right shock wave increases with
Ai+1/2; thus,
SwR2 >
SwR1. This larger magnitude of
SwR admits more mass and momentum into cell
i + 1 before it becomes pressurized. The loci of
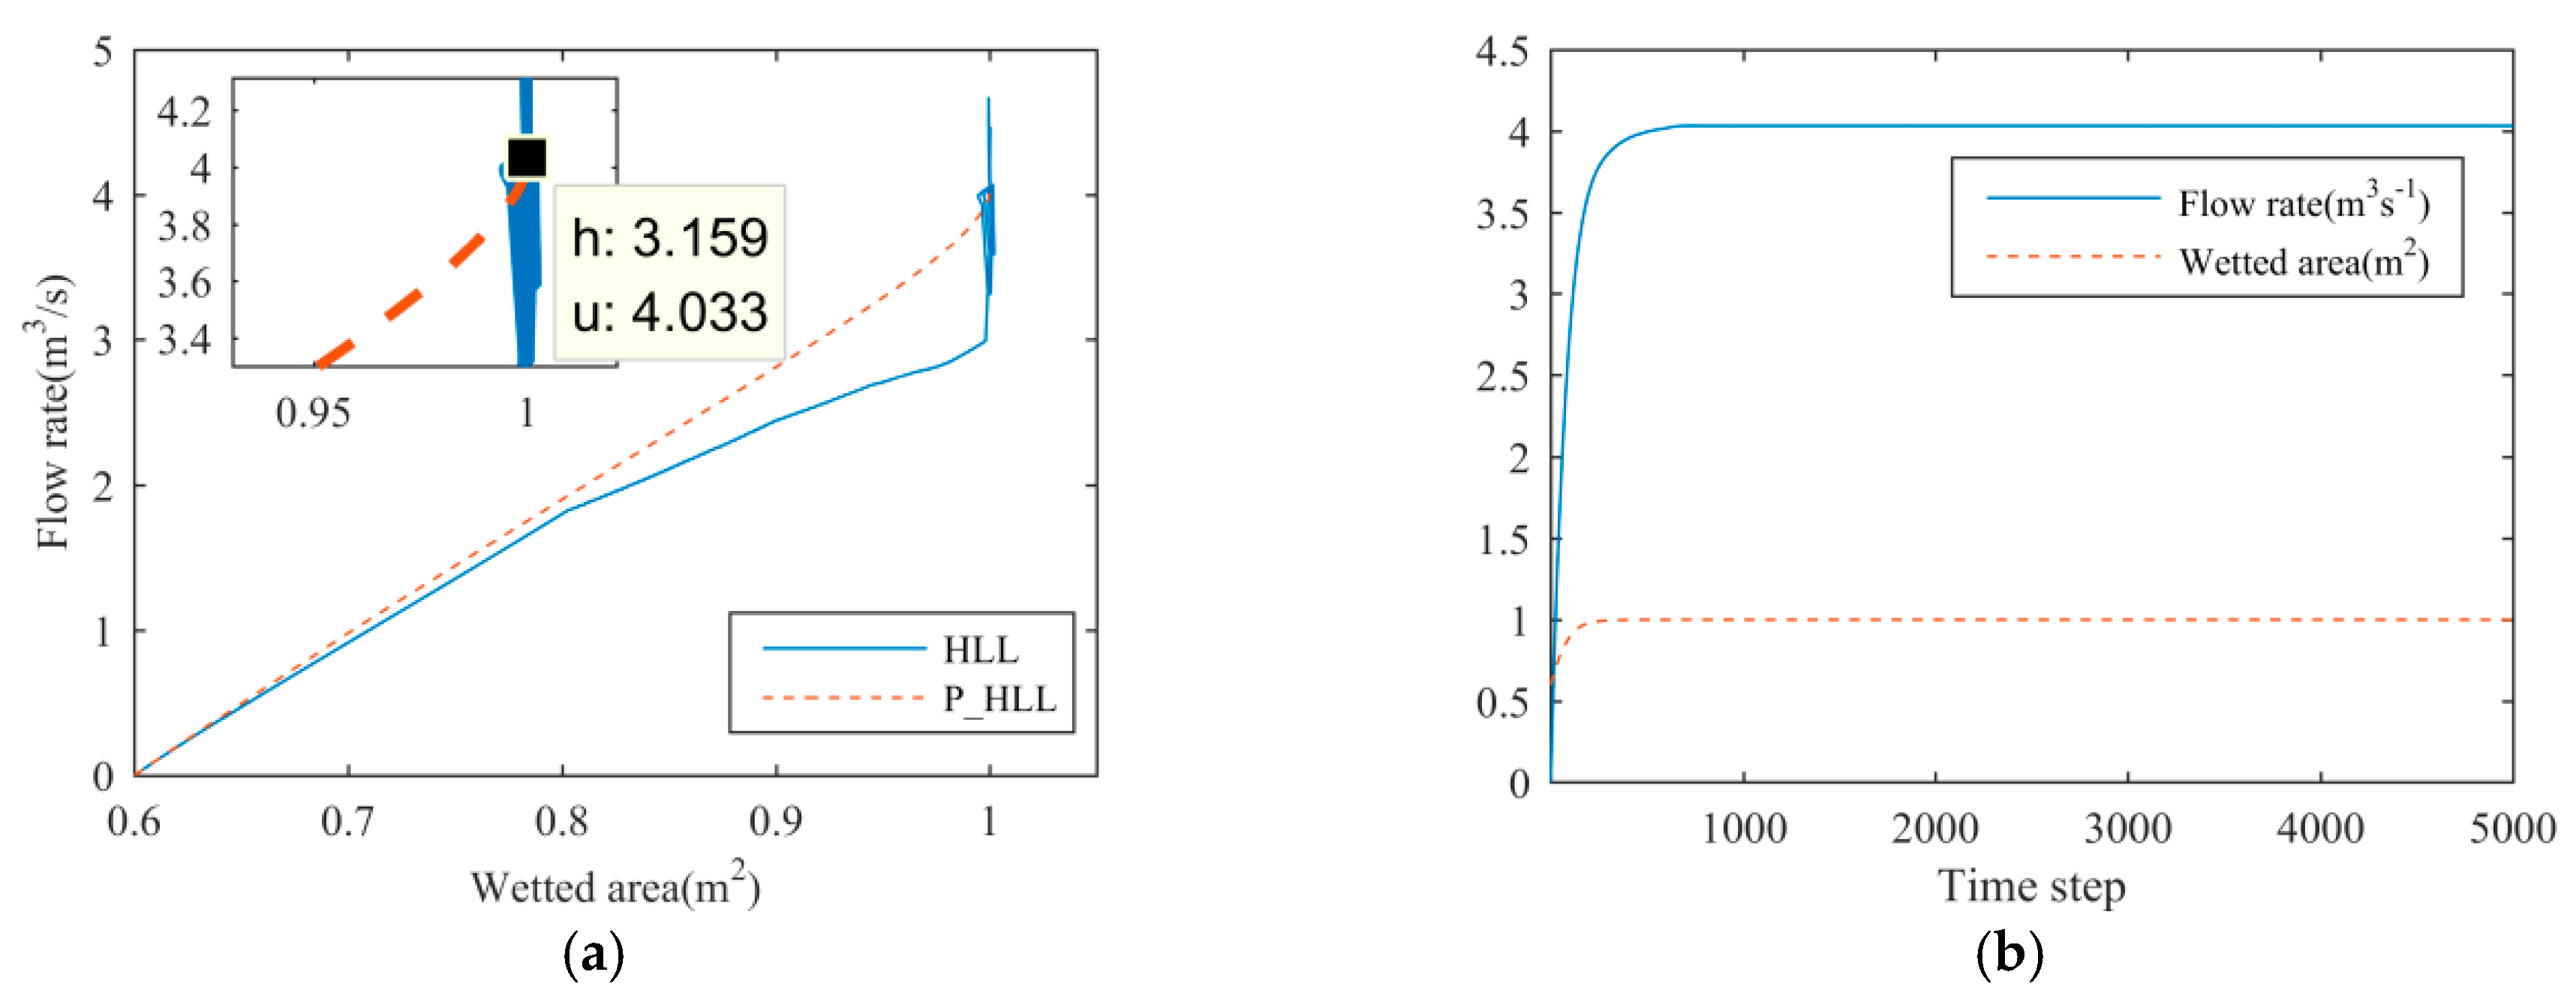
Ui+1 simulated by HLL and P_HLL (
Pa = 5,
Pb = 0.7) are drawn in
Figure 10.
Vertexes appear in the locus simulated by HLL after cell i + 1 becomes pressurized, which represent numerical oscillations in the simulation result. In contrast, P_HLL achieves a smooth and stable transition between the free-surface flow and pressurized flow. The locus simulated by P_HLL converges to a 3.159 m depth and 4.033 ms−1 velocity, which is very close to the flow states at the entrance of the conduct. The discrepancy in water depth is more pronounced due to the small value of the slot width. Therefore, P_HLL preserves the conservation in mass and momentum.
A larger magnitude of
SwR2 admits more mass and momentum into cell
i + 1 before it is pressurized; thus, it increases the diffusion of the filling-bore.The magnitude of
SwL2 and
SwR2 are related to the value of
Ai+1/2, which consequently depends on the value of
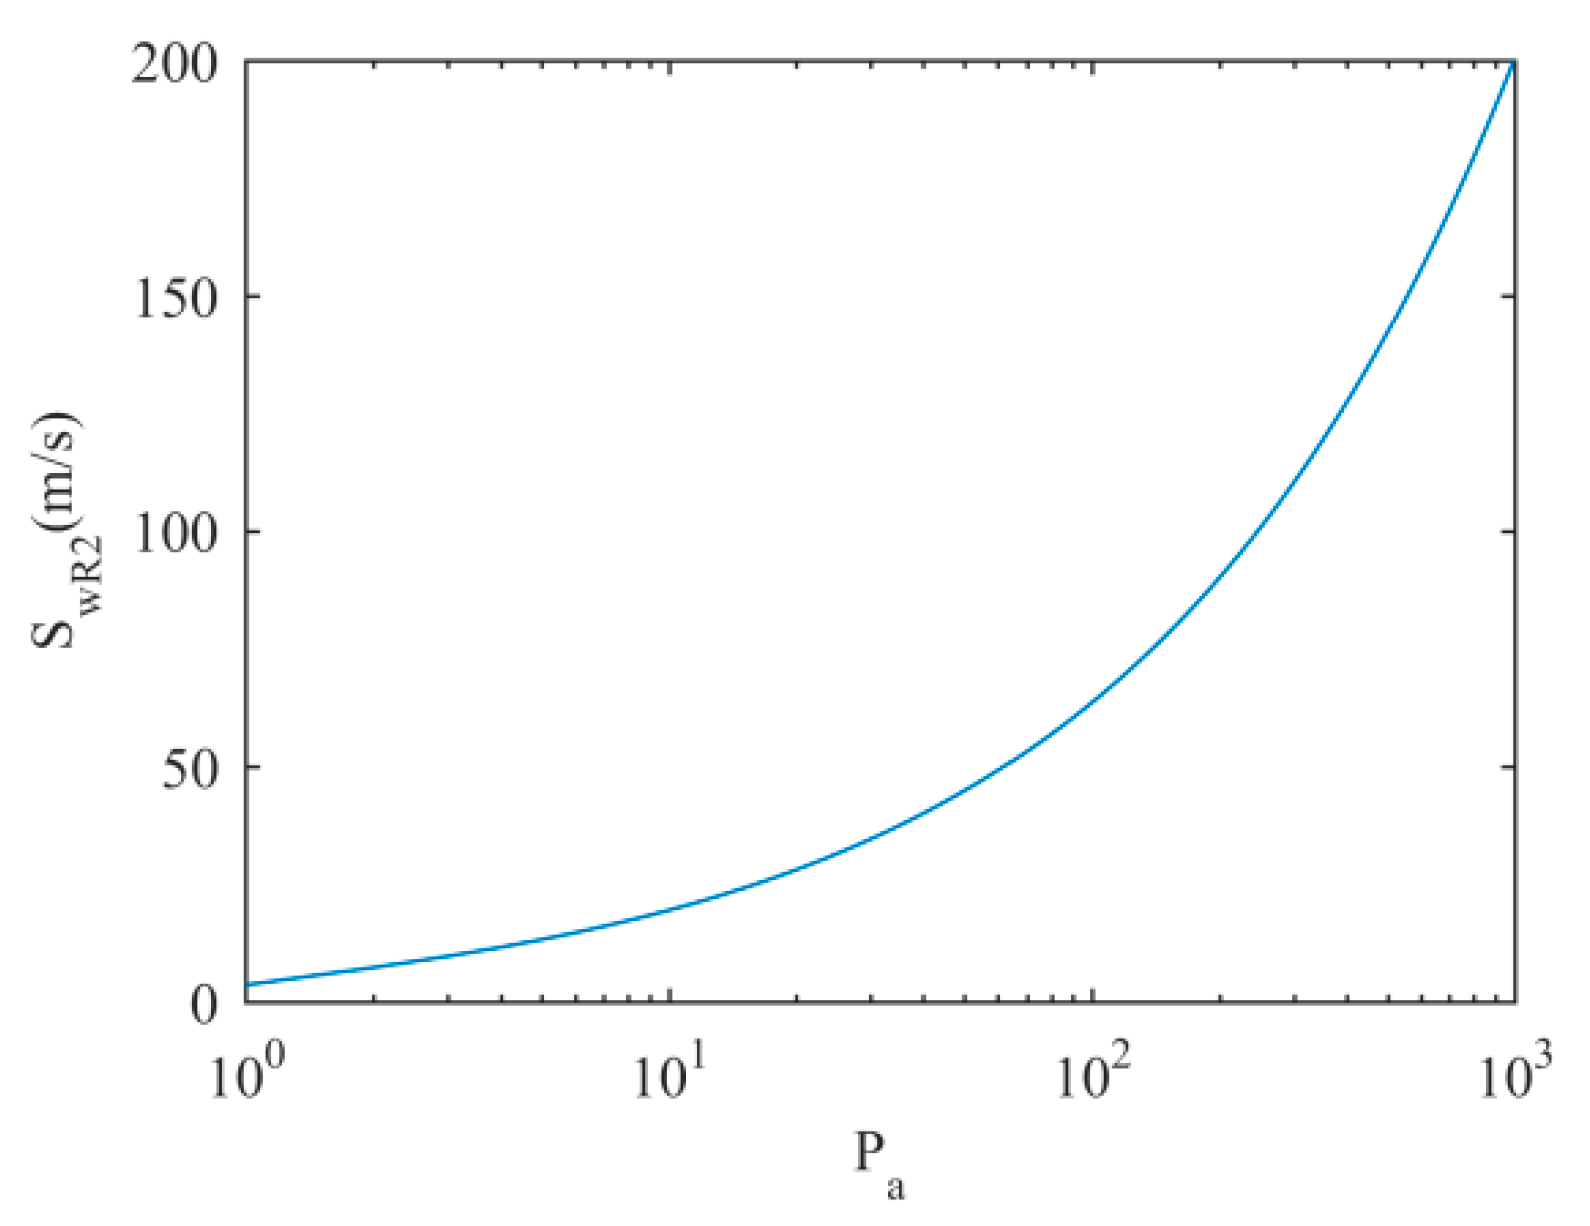
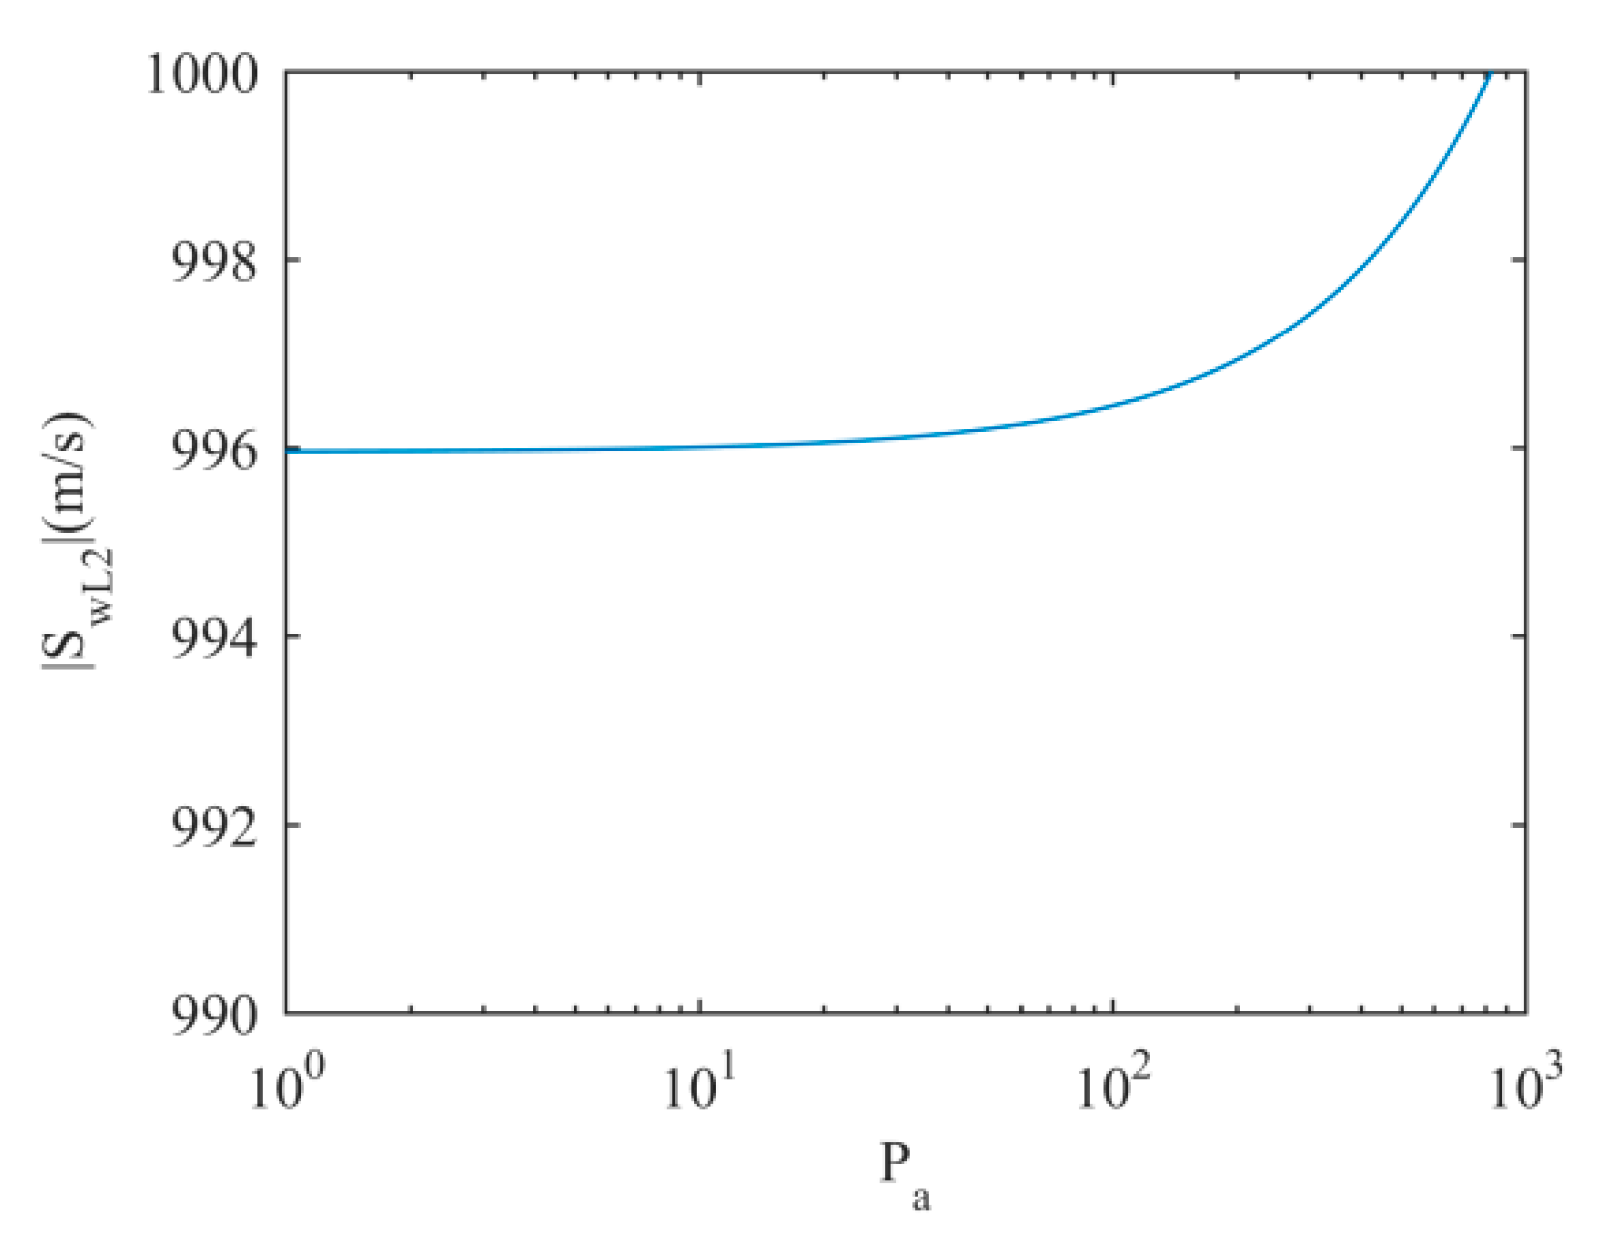
Pa; see
Figure 11 and
Figure 12:
Figure 11 shows that
SwR2 increases with
Pa, while|
SwL2| barely changes with
Pa and stays close to the acoustic wave speed. However,
SwR2 does not increase significantly when
Pa changes from 1 to 10, which denotes that the diffusion of the filling-bore does not increase significantly when
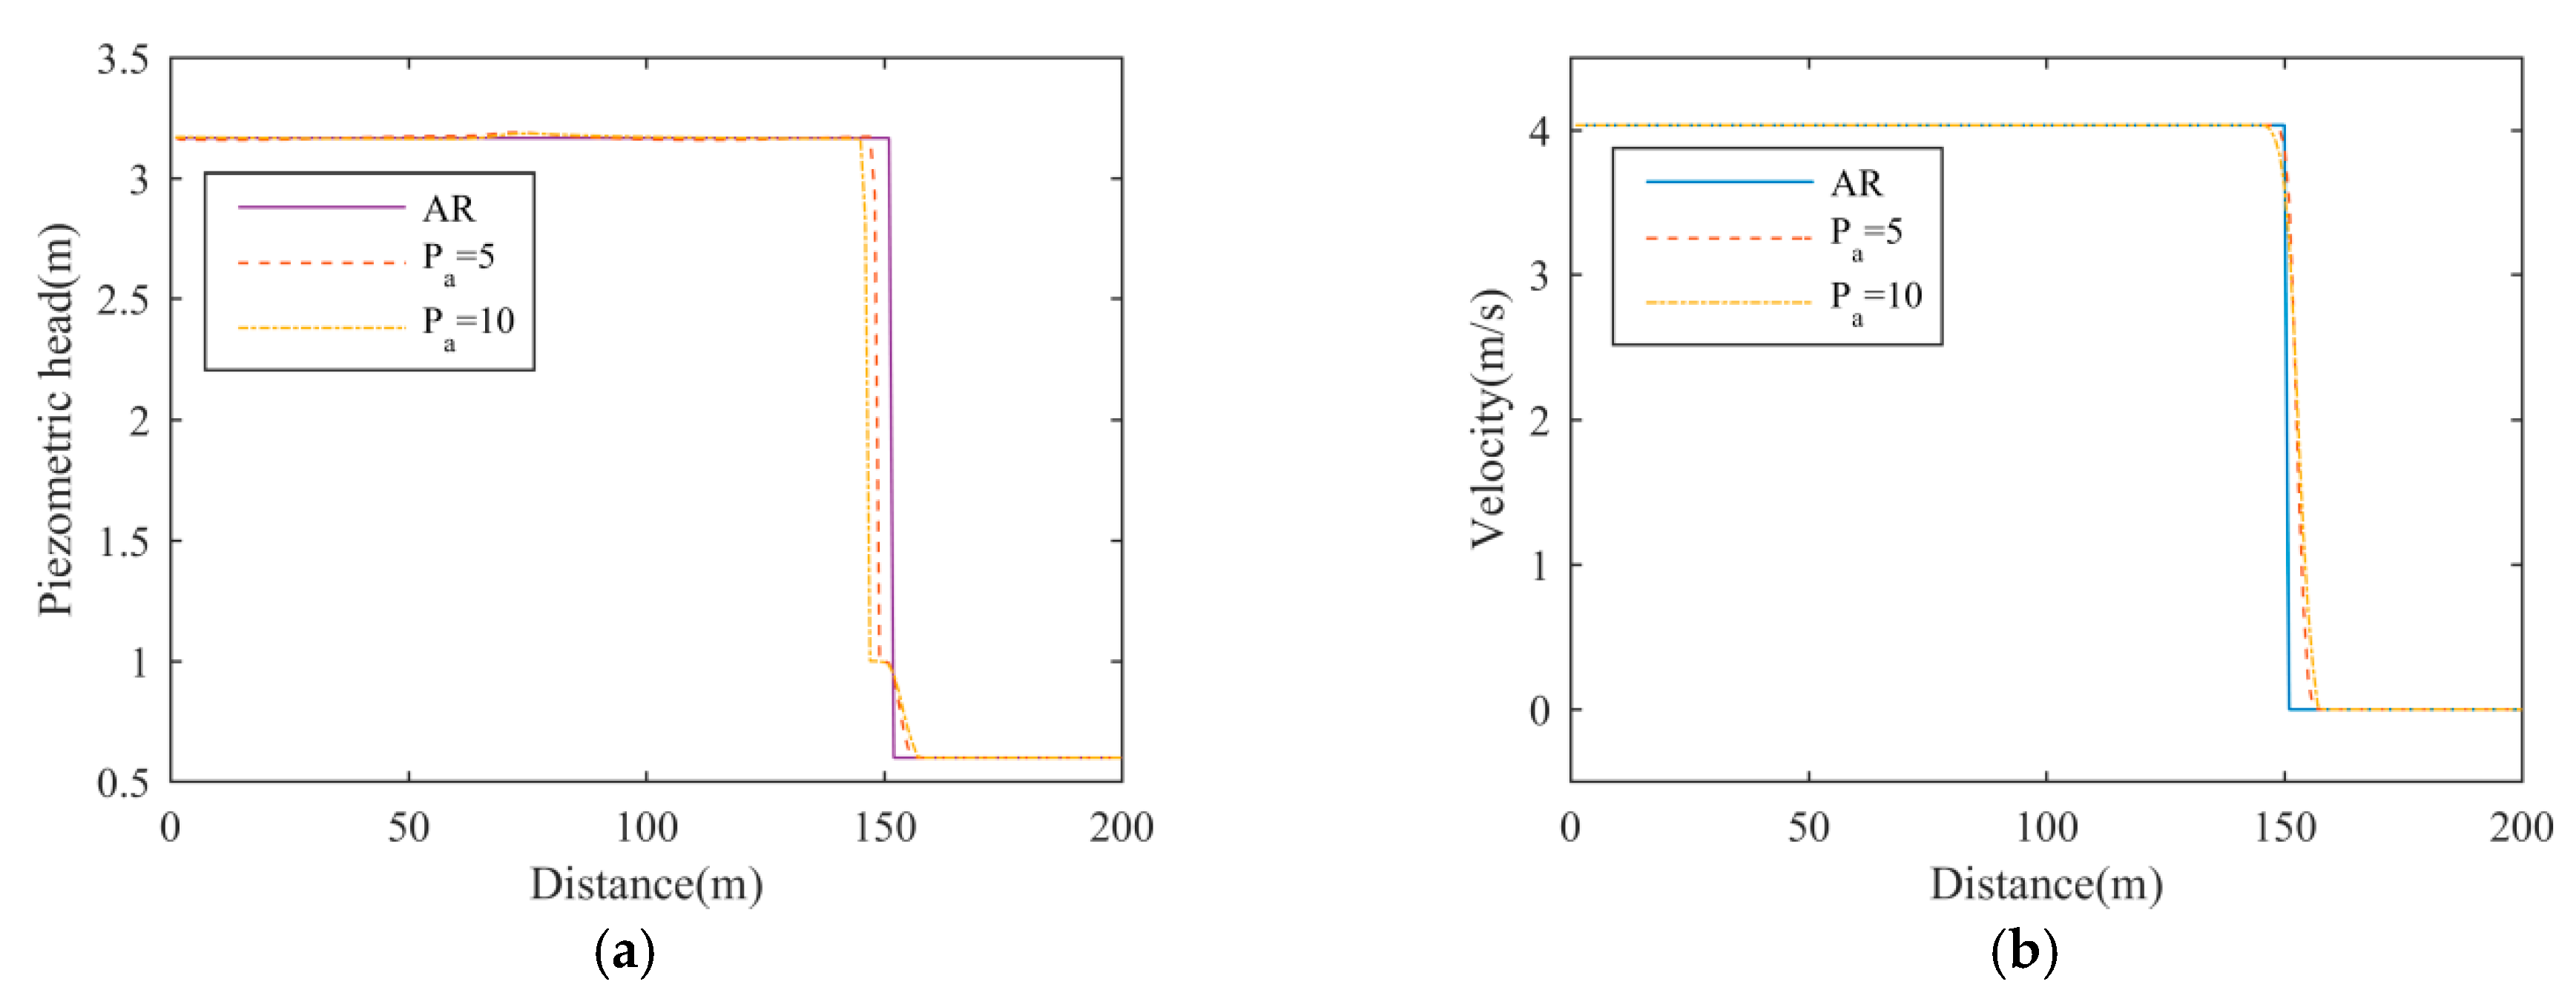
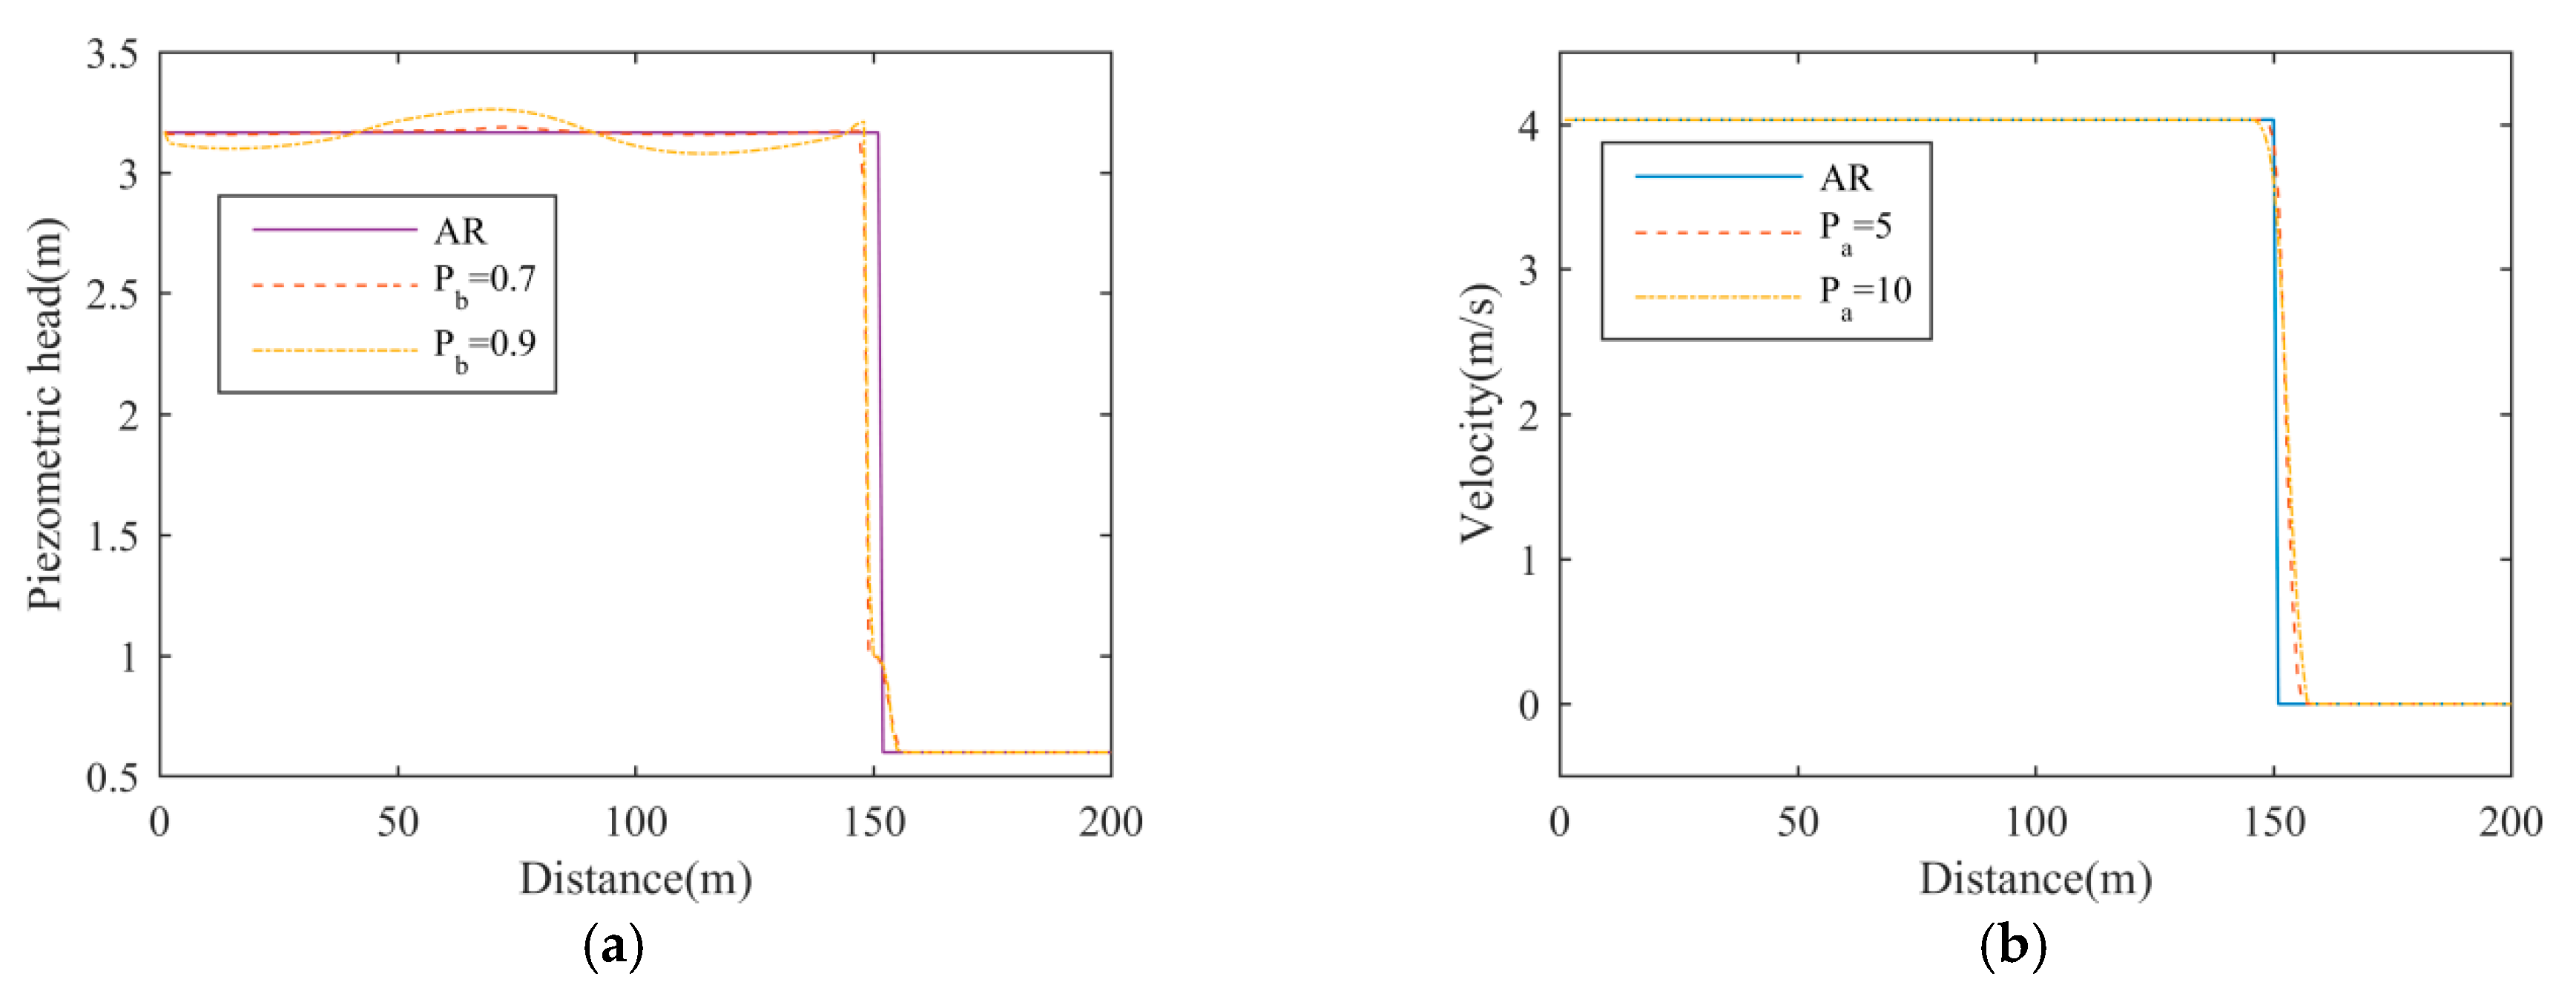
Pa changes from 1 to 10. The simulation results using the P_HLL solver with
Pb = 0.7 and different values of
Pa are drawn in
Figure 13.
Although Pa = 10 produces a more diffusive filling-bore, the spreading length of the filling-bore does not increase significantly compared to that using Pa = 5. During a realistic transition phenomenon, the piezometric head peak seldom exceeds 10 times the cross-sectional depth. Therefore, one can always start by adopting a large Pa (for example 10) in the P_HLL solver and do not worry about significantly compromising the representation of the filling-bore.
Compared to
Pa, the value of
Pb has a more significant effect on the numerical oscillations, for it determines the threshold depth where numerical viscosity starts to increase.
Pb must be smaller than one so that the numerical viscosity is added before the flow regime transition happens. A smaller
Pb leads to more stable result, but it may cause more diffusion. The simulation results using
Pa = 5 and
Pb = 0.7 or 0.9 are drawn in
Figure 14.
When Pb = 0.9, a smooth transition between the free-surface and pressurized flows cannot be guaranteed. Therefore, we suggest a Pb between 0.6 and 0.8 to avoid causing two much diffusion of the filling-bore. This is also supported by the numerical tests in the next section.
In conclusion, at a free-surface cell, P_HLL admits numerical viscosity once the water depth is higher than a threshold value PbH. Thus, a smooth transition from the free-surface flow to pressurized flow can be obtained. Meanwhile, P_HLL causes diffusion of the filling-bore. In realistic applications, a Pa of 10 is large enough to suppress numerical oscillations without significantly increasing the spreading-length of the filling-bore. The value of Pb is suggested to be between 0.6 and 0.8.
6. Conclusions
Numerical oscillation is a critical problem in transient mixed flow simulations. These numerical oscillations arise from the ambiguity about the location of the filling-bore within one computational cell, which cannot be captured even with high-order finite volume methods. First order finite volume methods have failed to suppress them while capturing the filling-bore front.
Four oscillation-suppressing methods were tested on a benchmark model, with three of them failing to get a satisfactory result under a high acoustic wave speed. The key is to admit numerical viscosity before the flow regime transition occurs. Numerical viscosity can be added by artificially increasing the magnitude of the wave speed in the HLL solver. Following this idea, this paper presents a P_HLL solver that has two parameters: Pa and Pb. Pa needs to be larger than the highest piezometric head while Pb needs to be between 0.7 and 0.9. This solver adds numerical viscosity when the water depth is above PbH so that a smooth transition between the free-surface and pressurized flows can be achieved. The amount of numerical viscosity increases with Pa, while a large Pa does not smear the simulation result significantly. Therefore, one can always start by adopting a Pa that is large enough under realistic applications, for example 10.
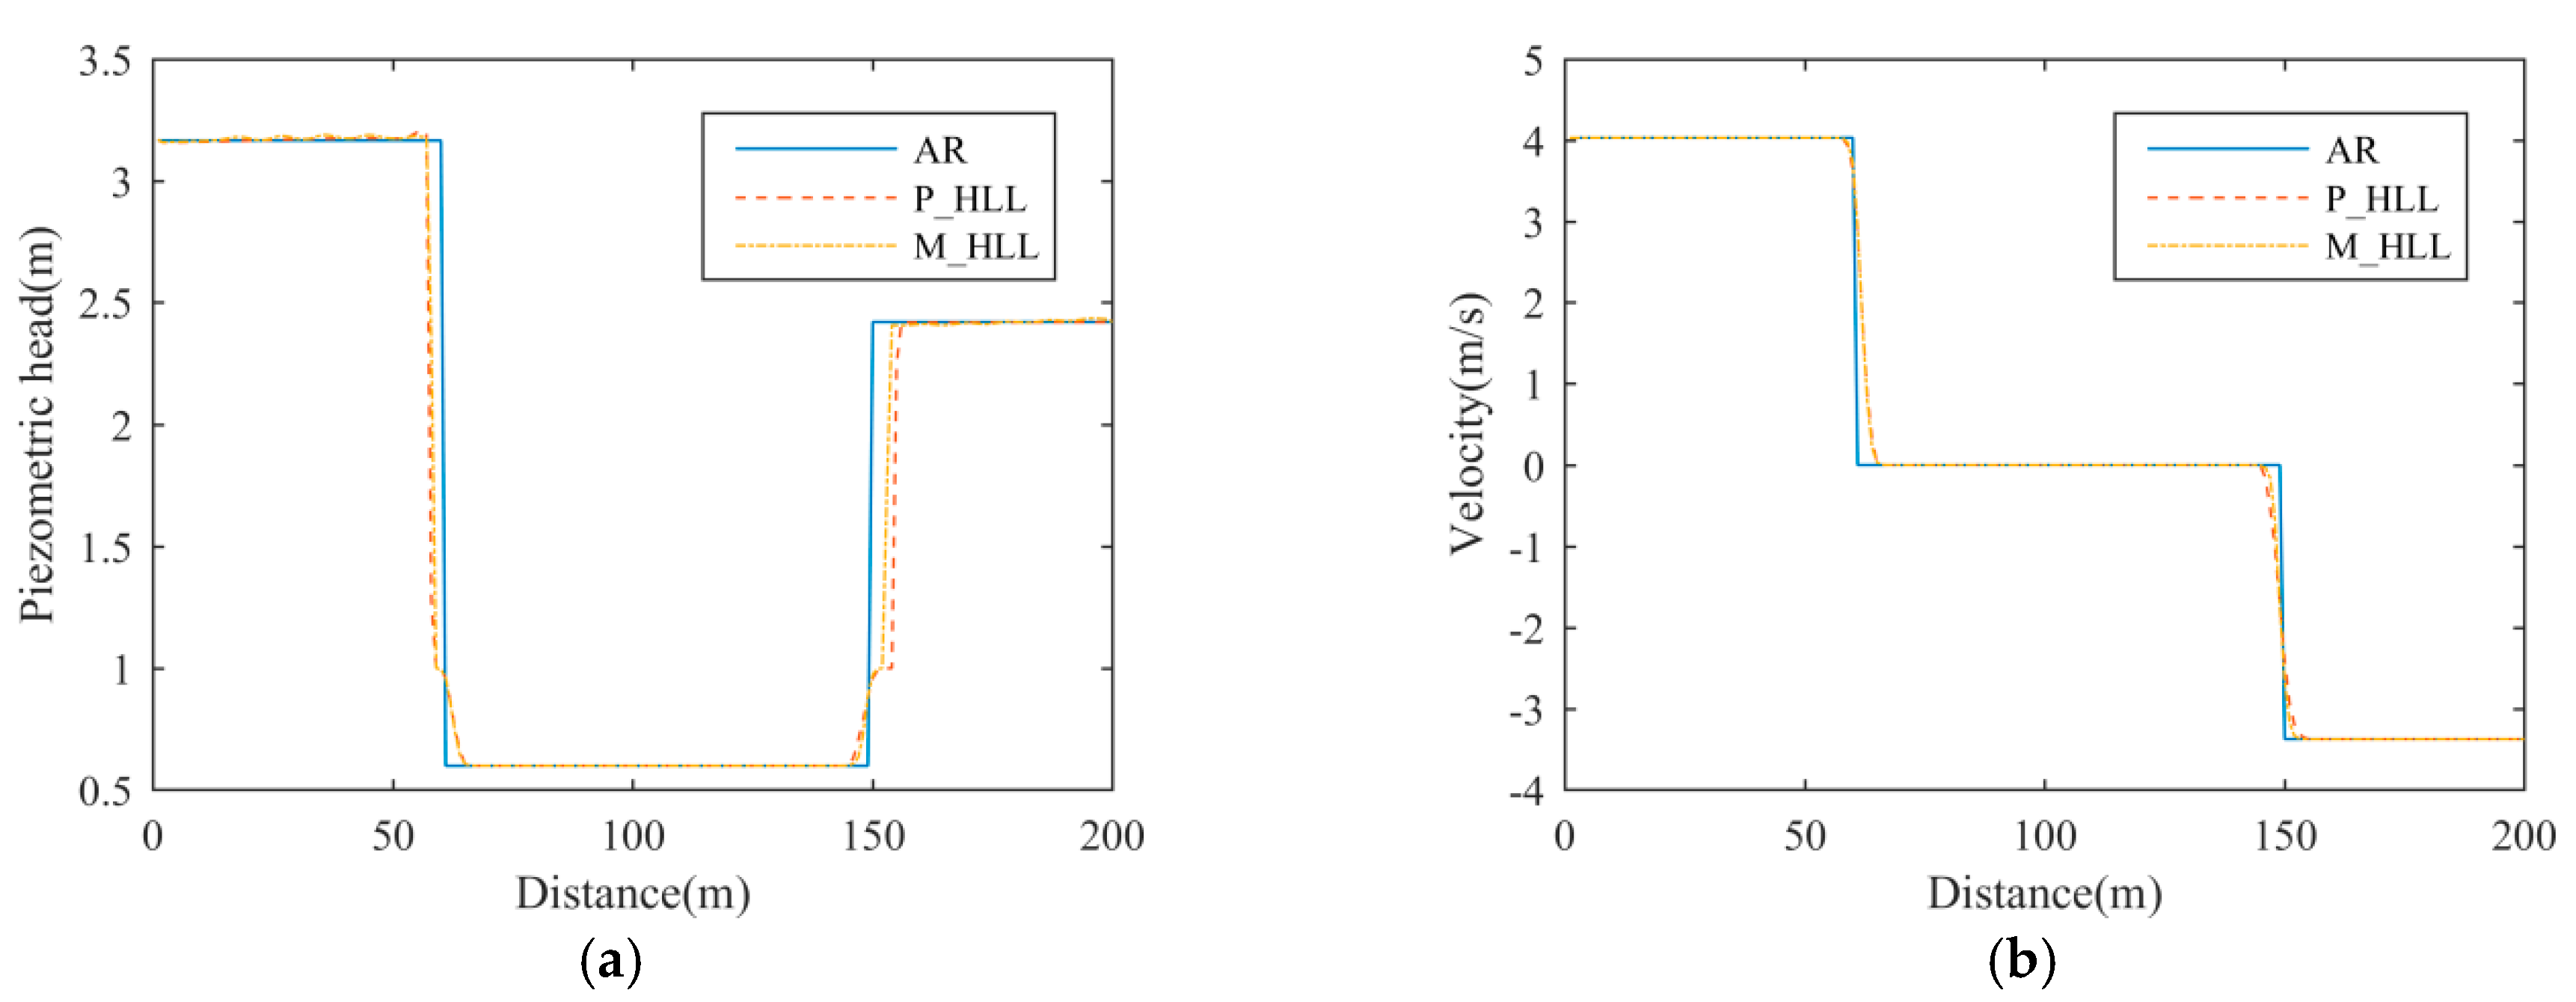
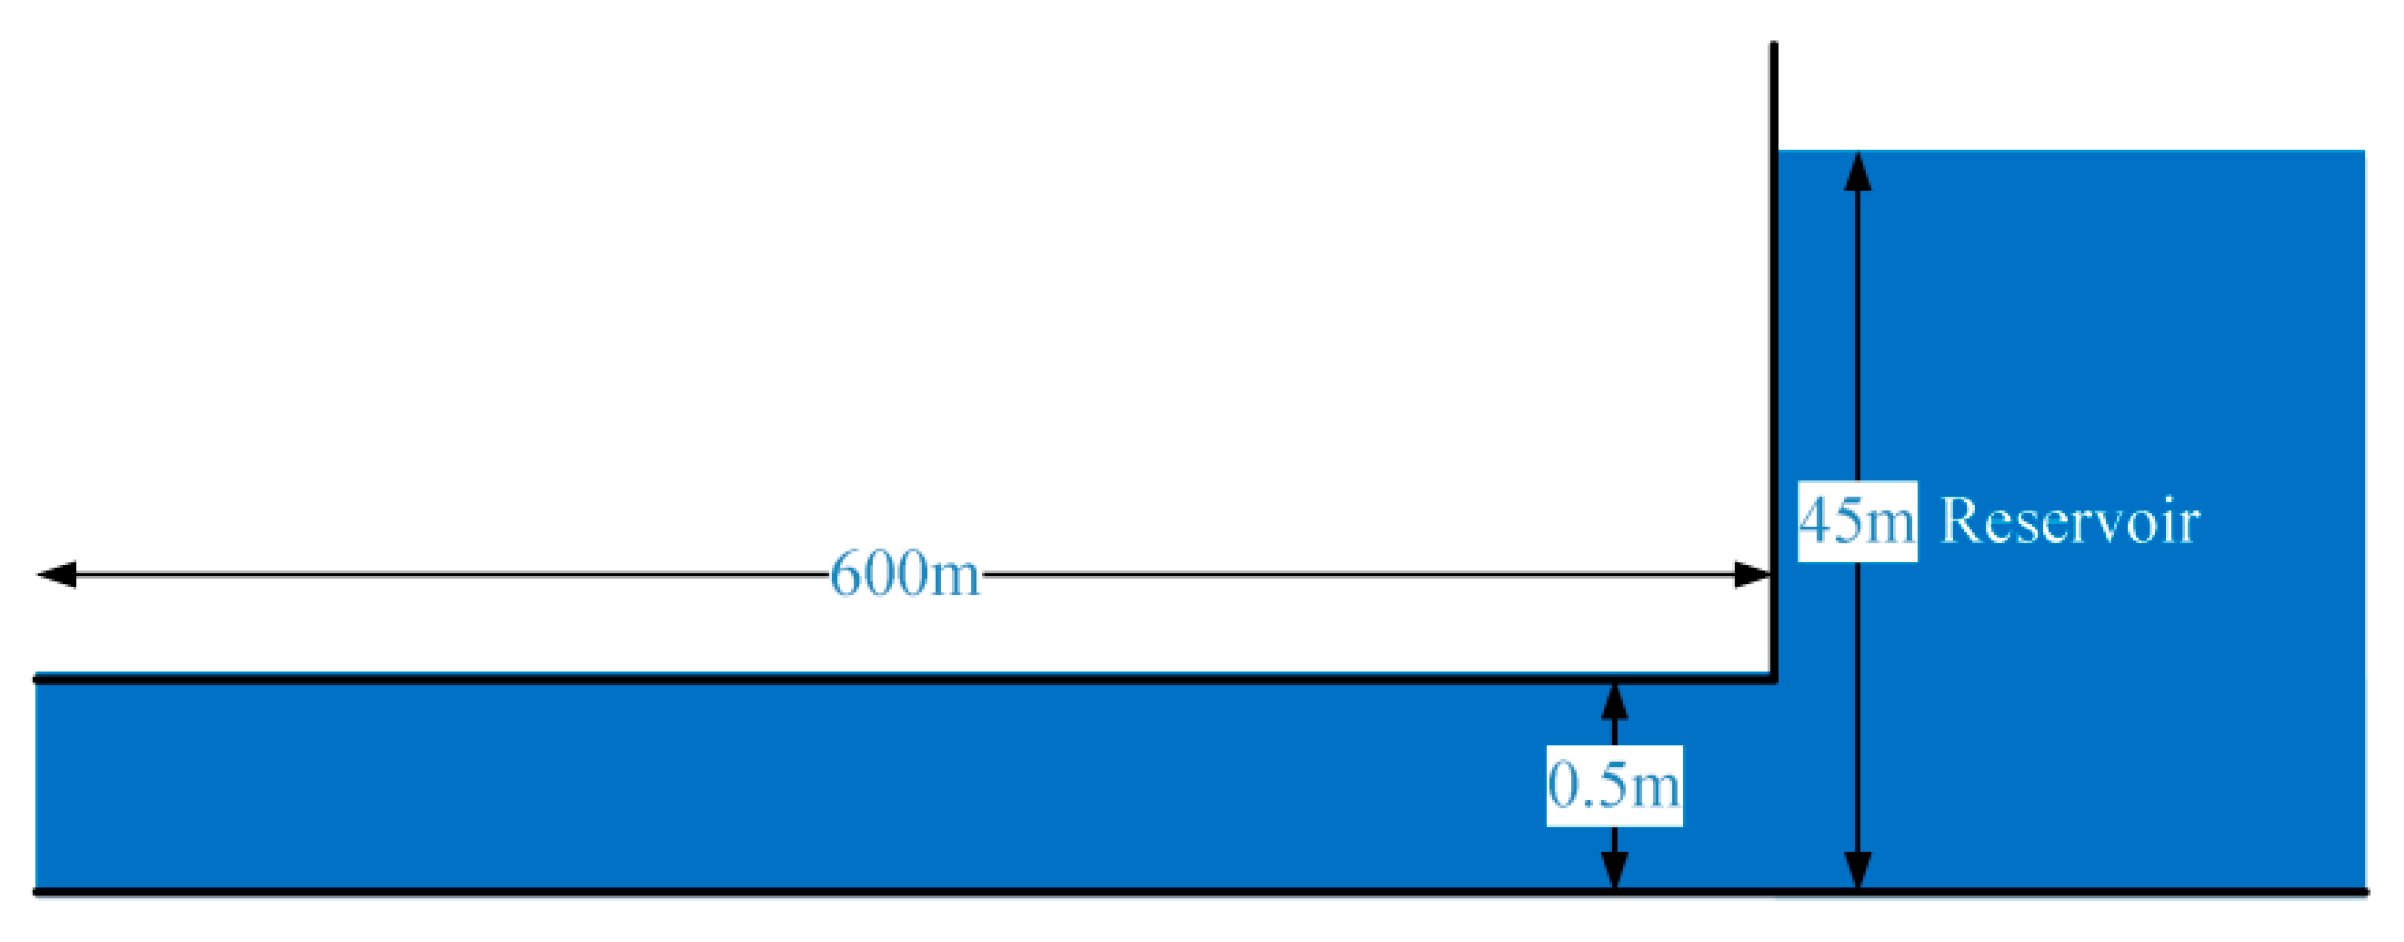
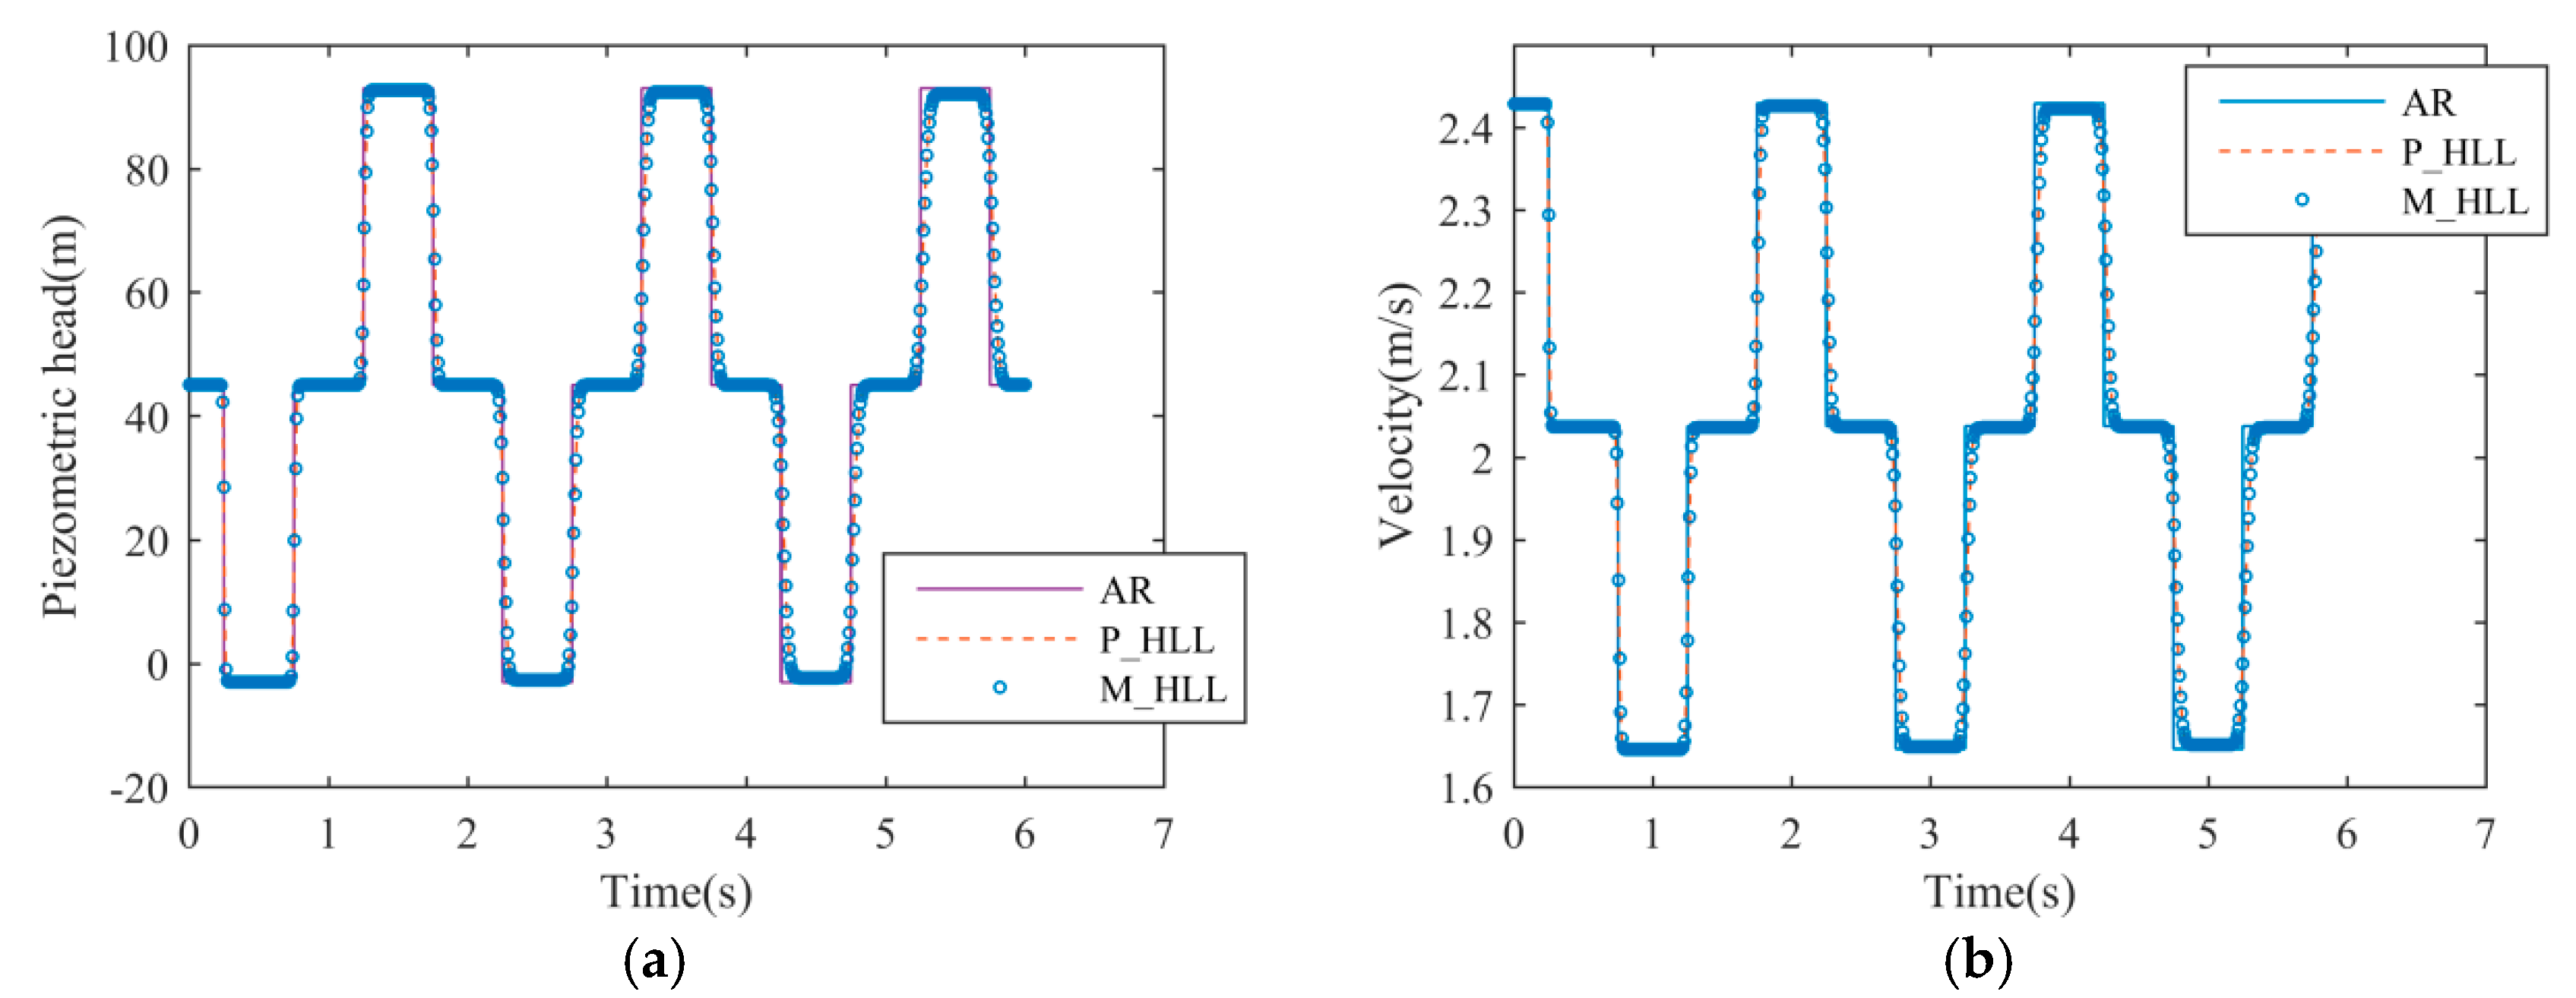
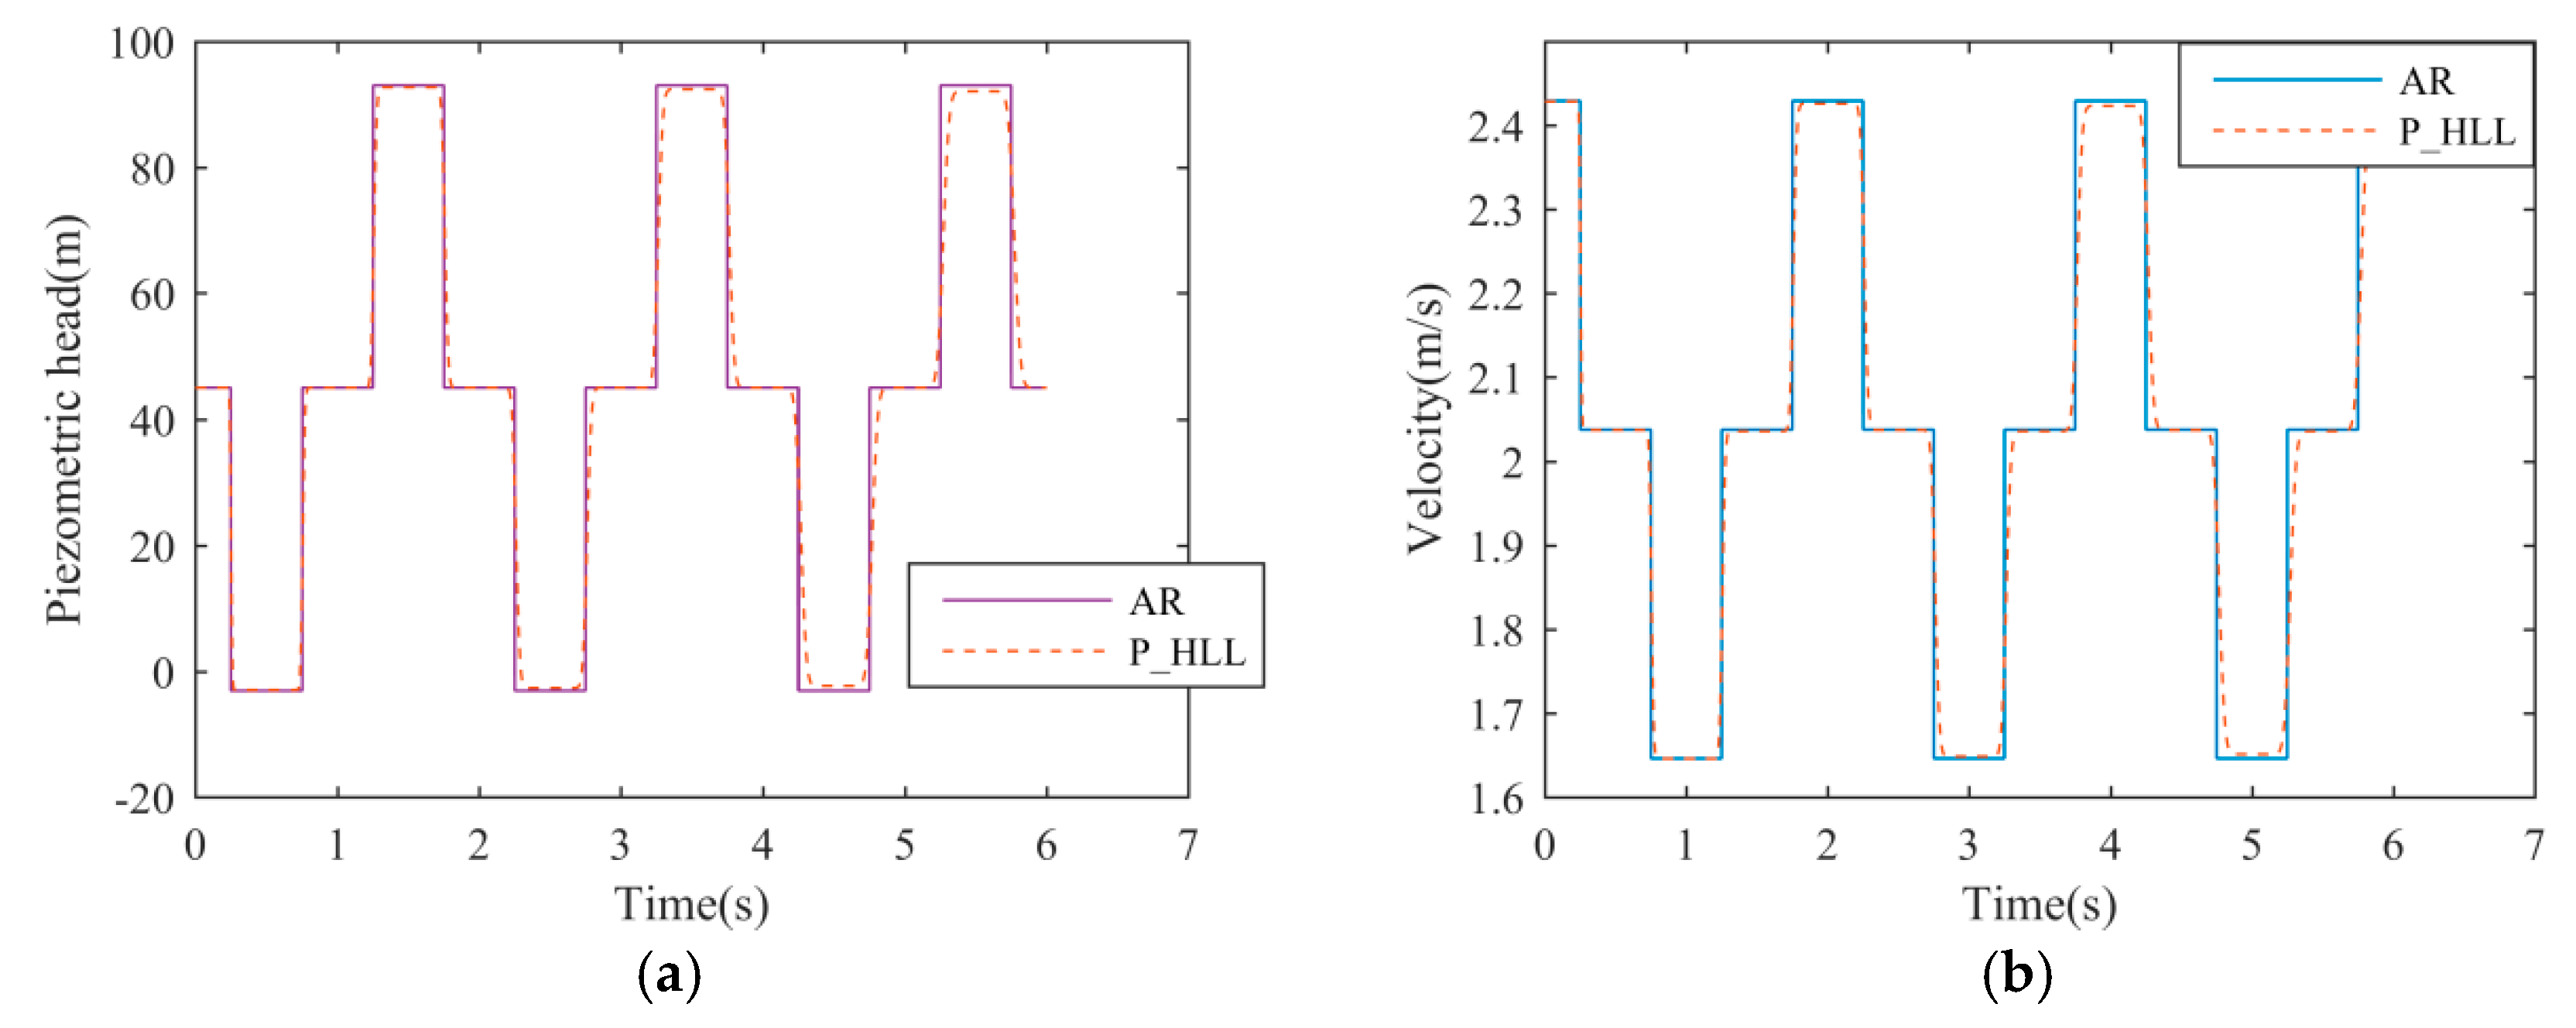
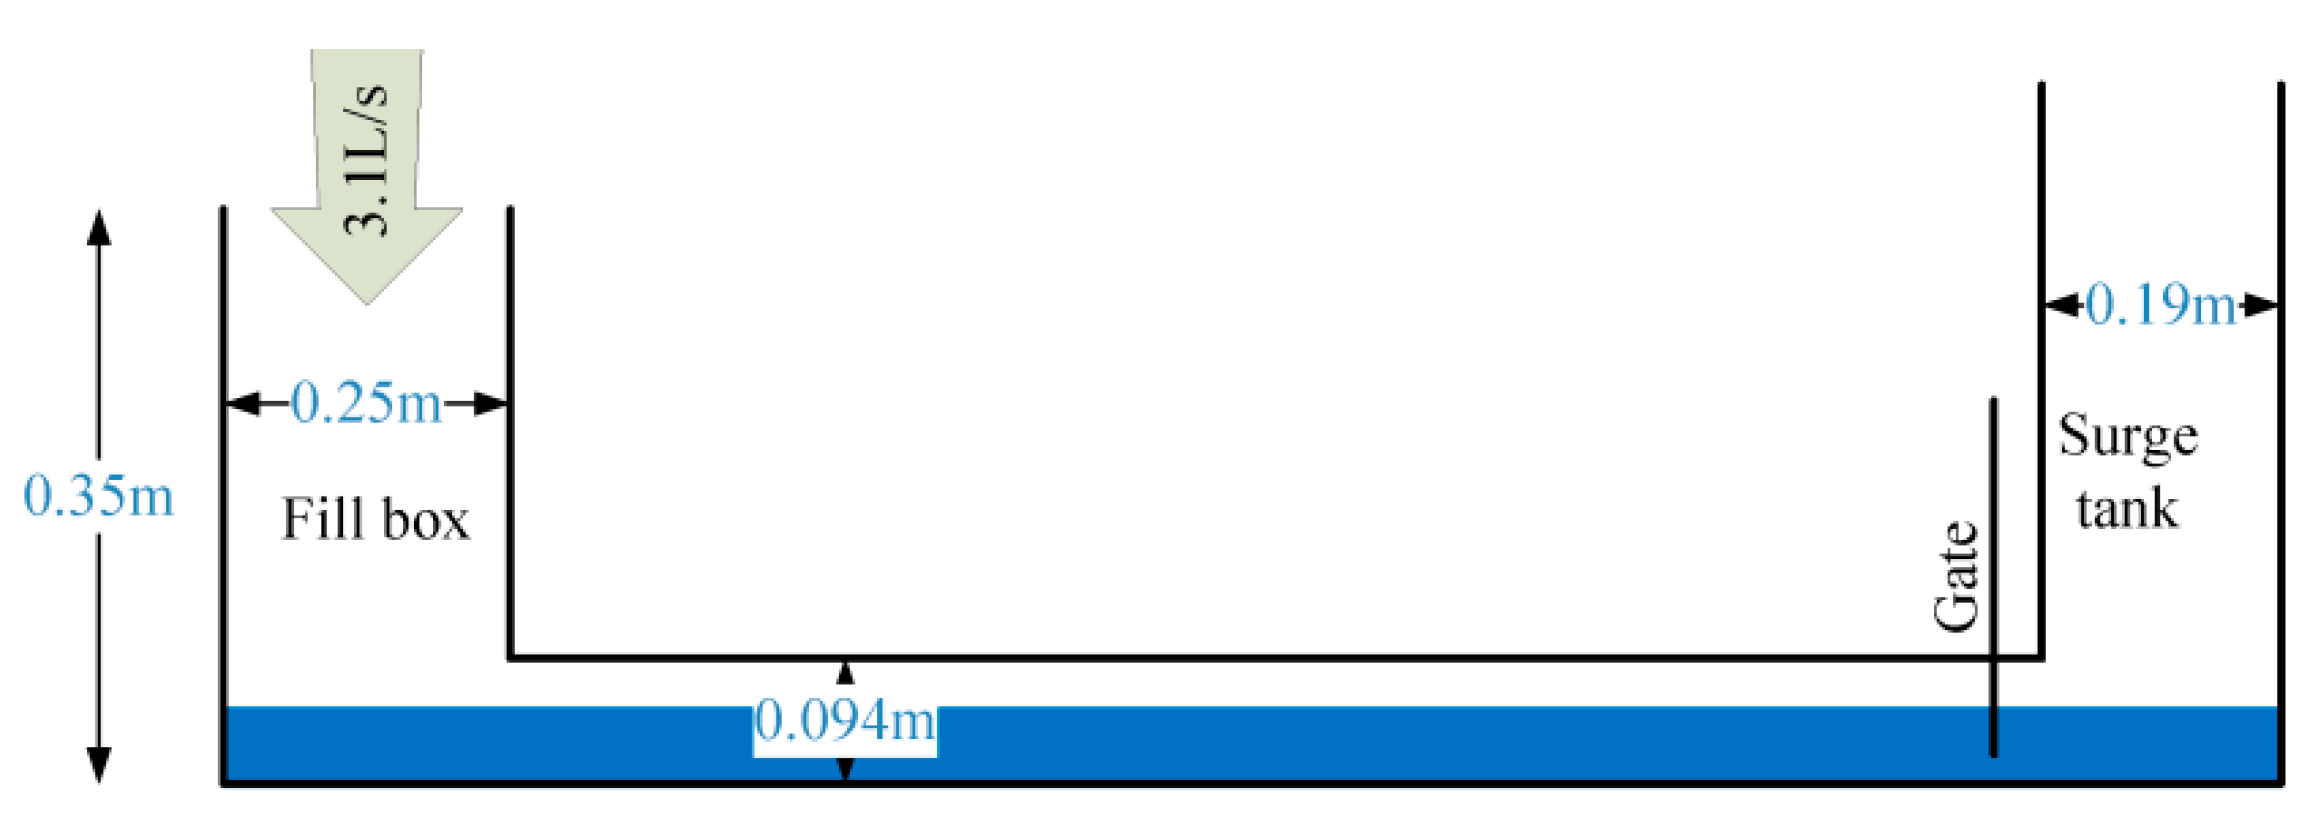
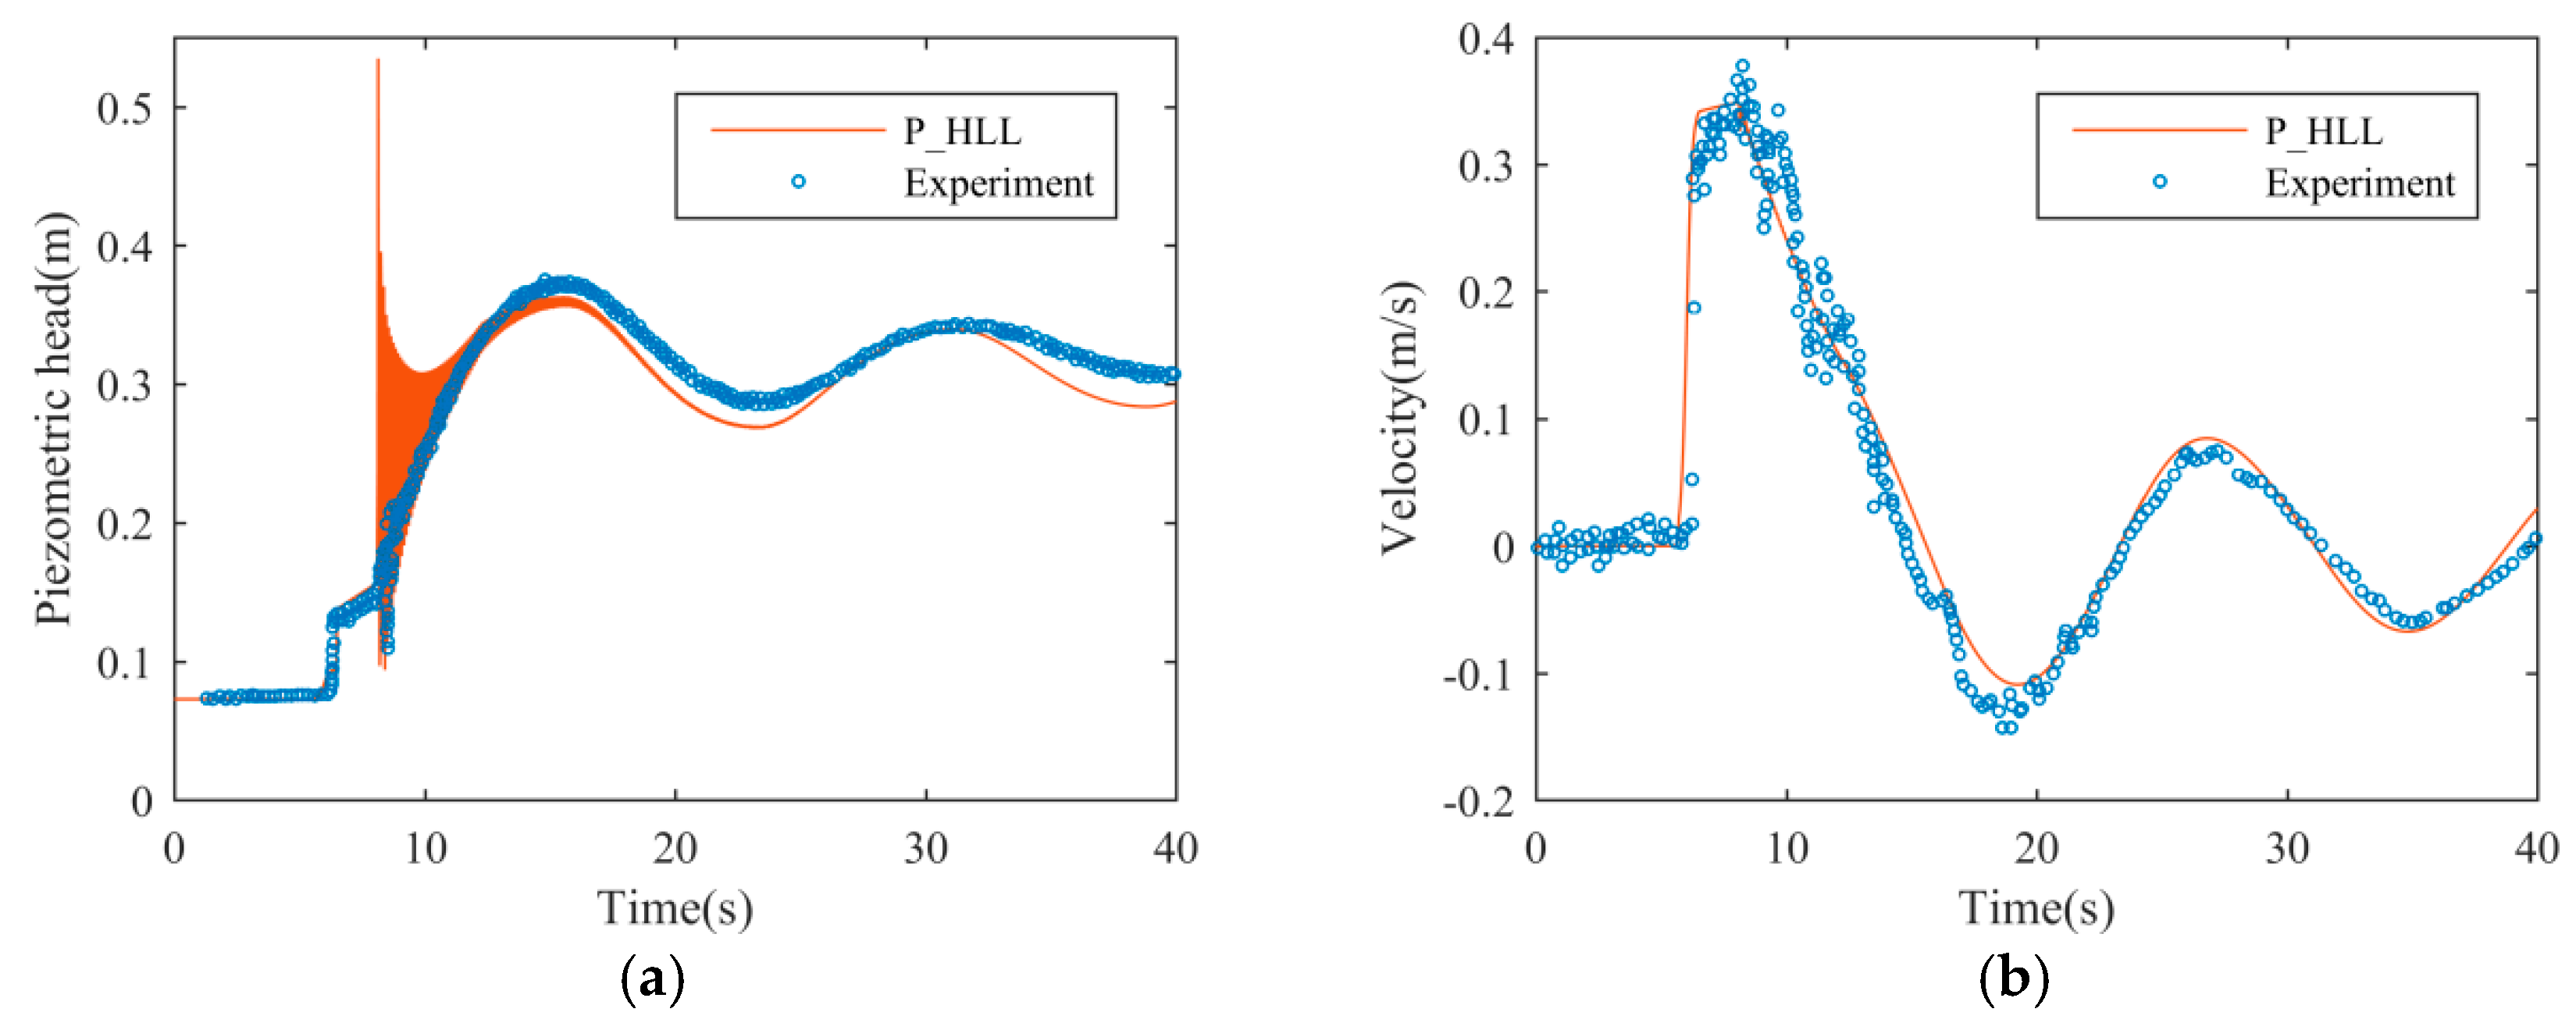
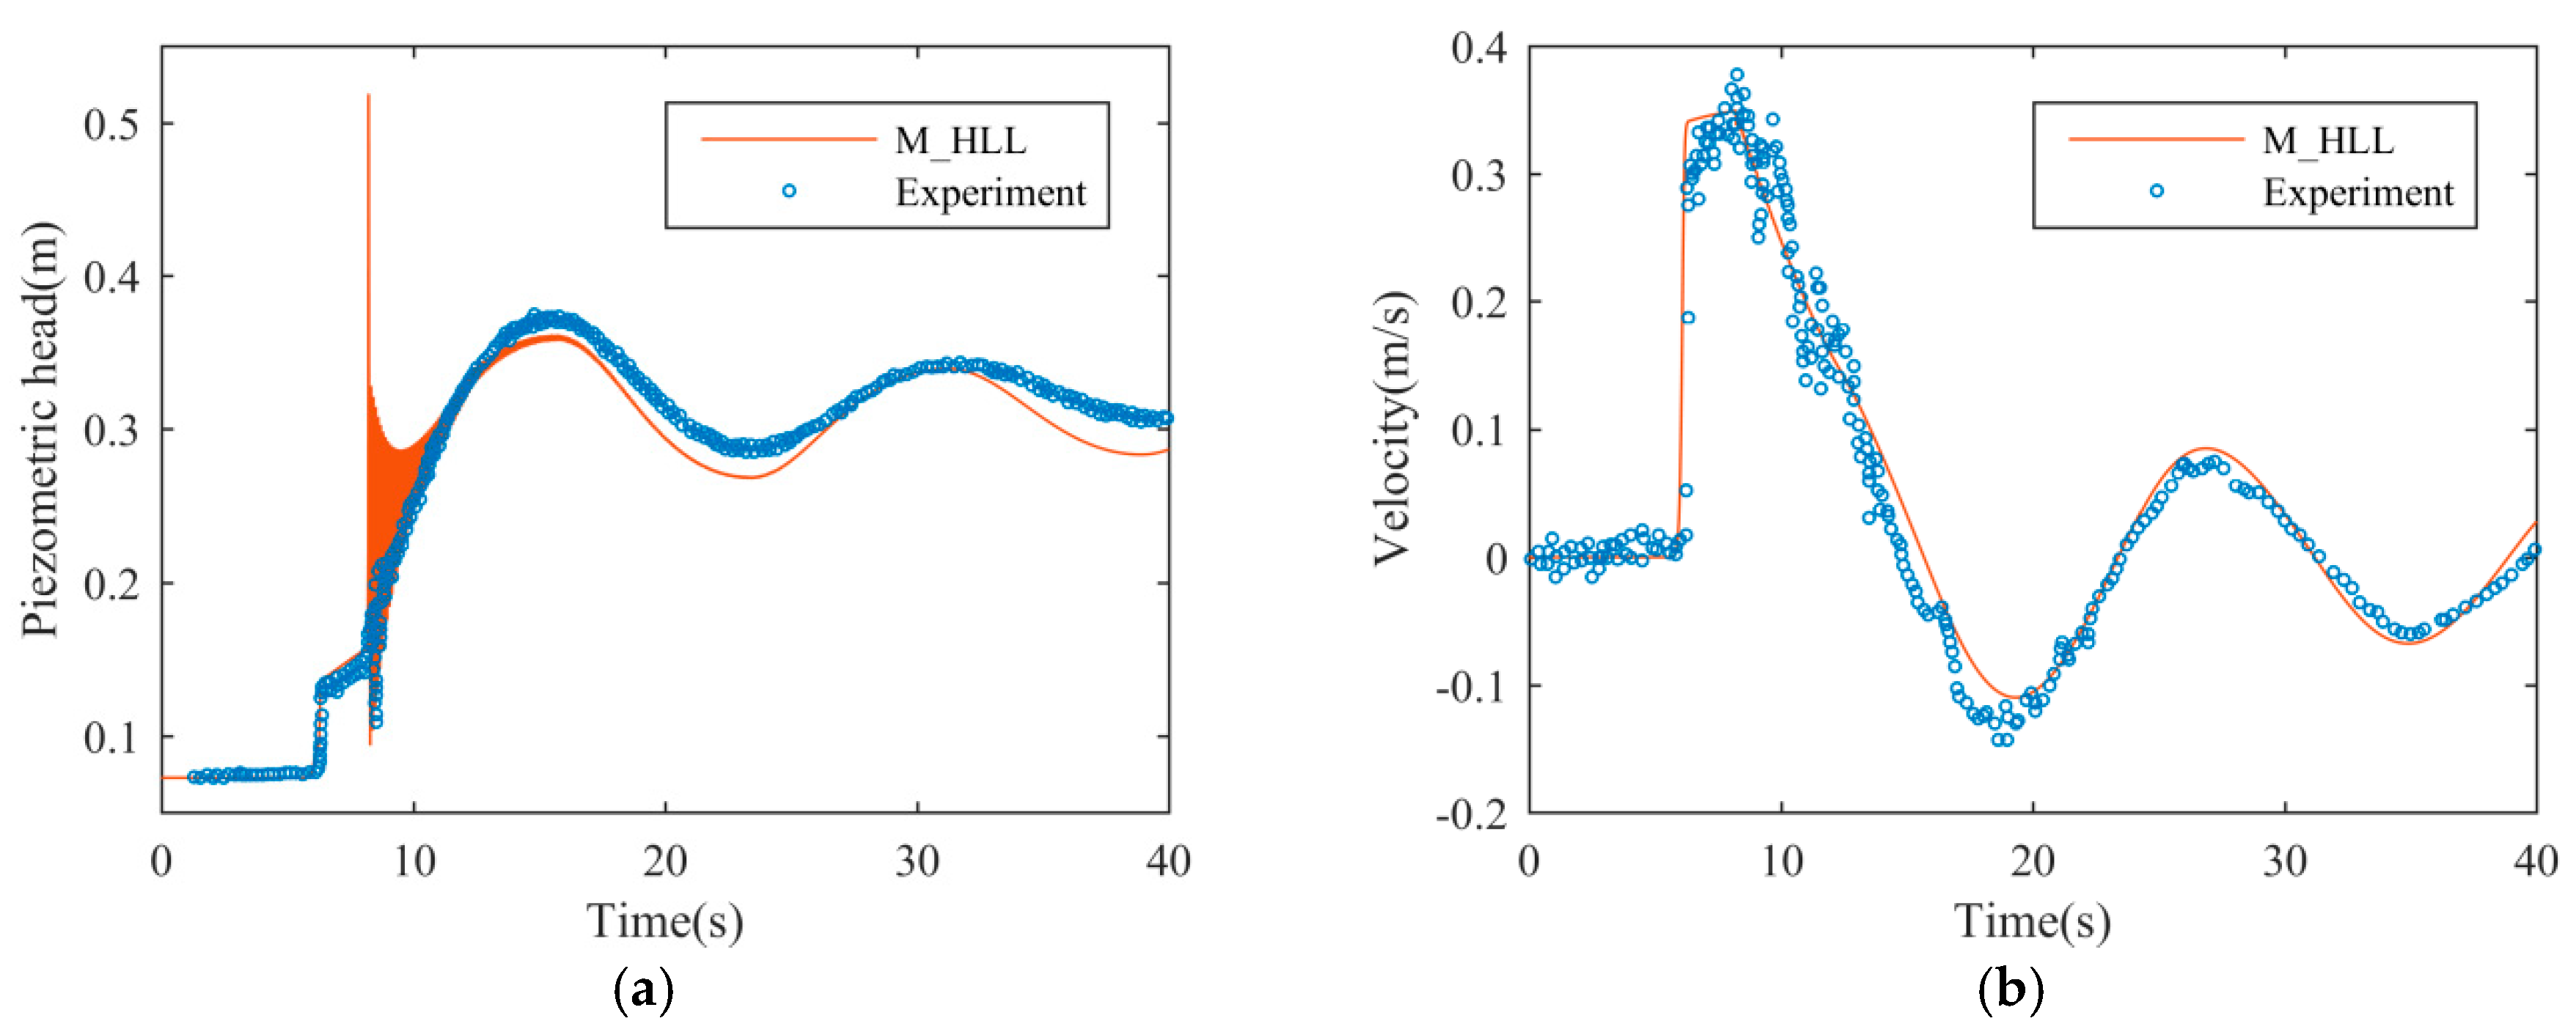
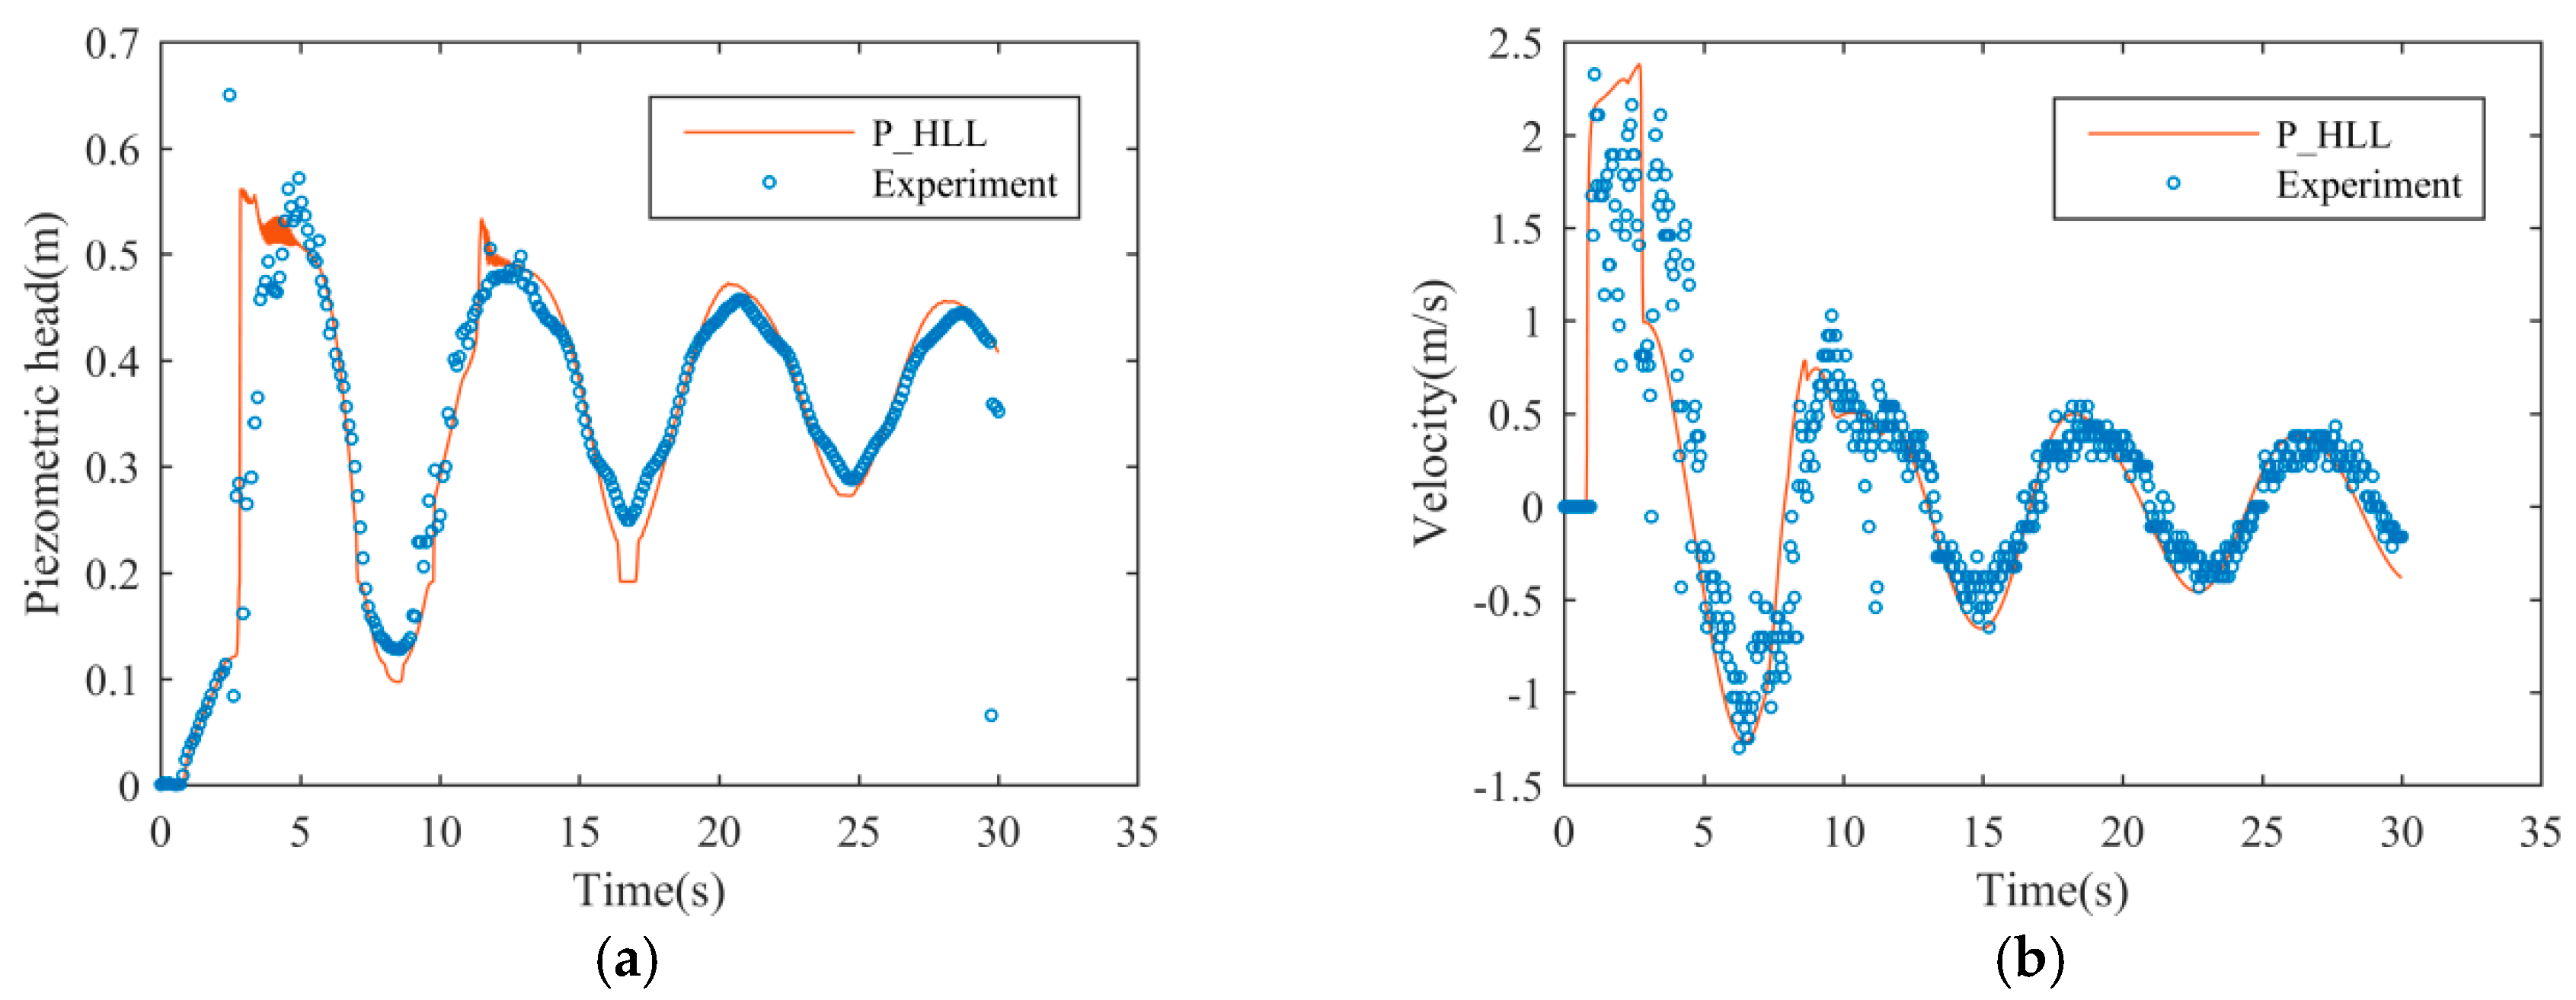
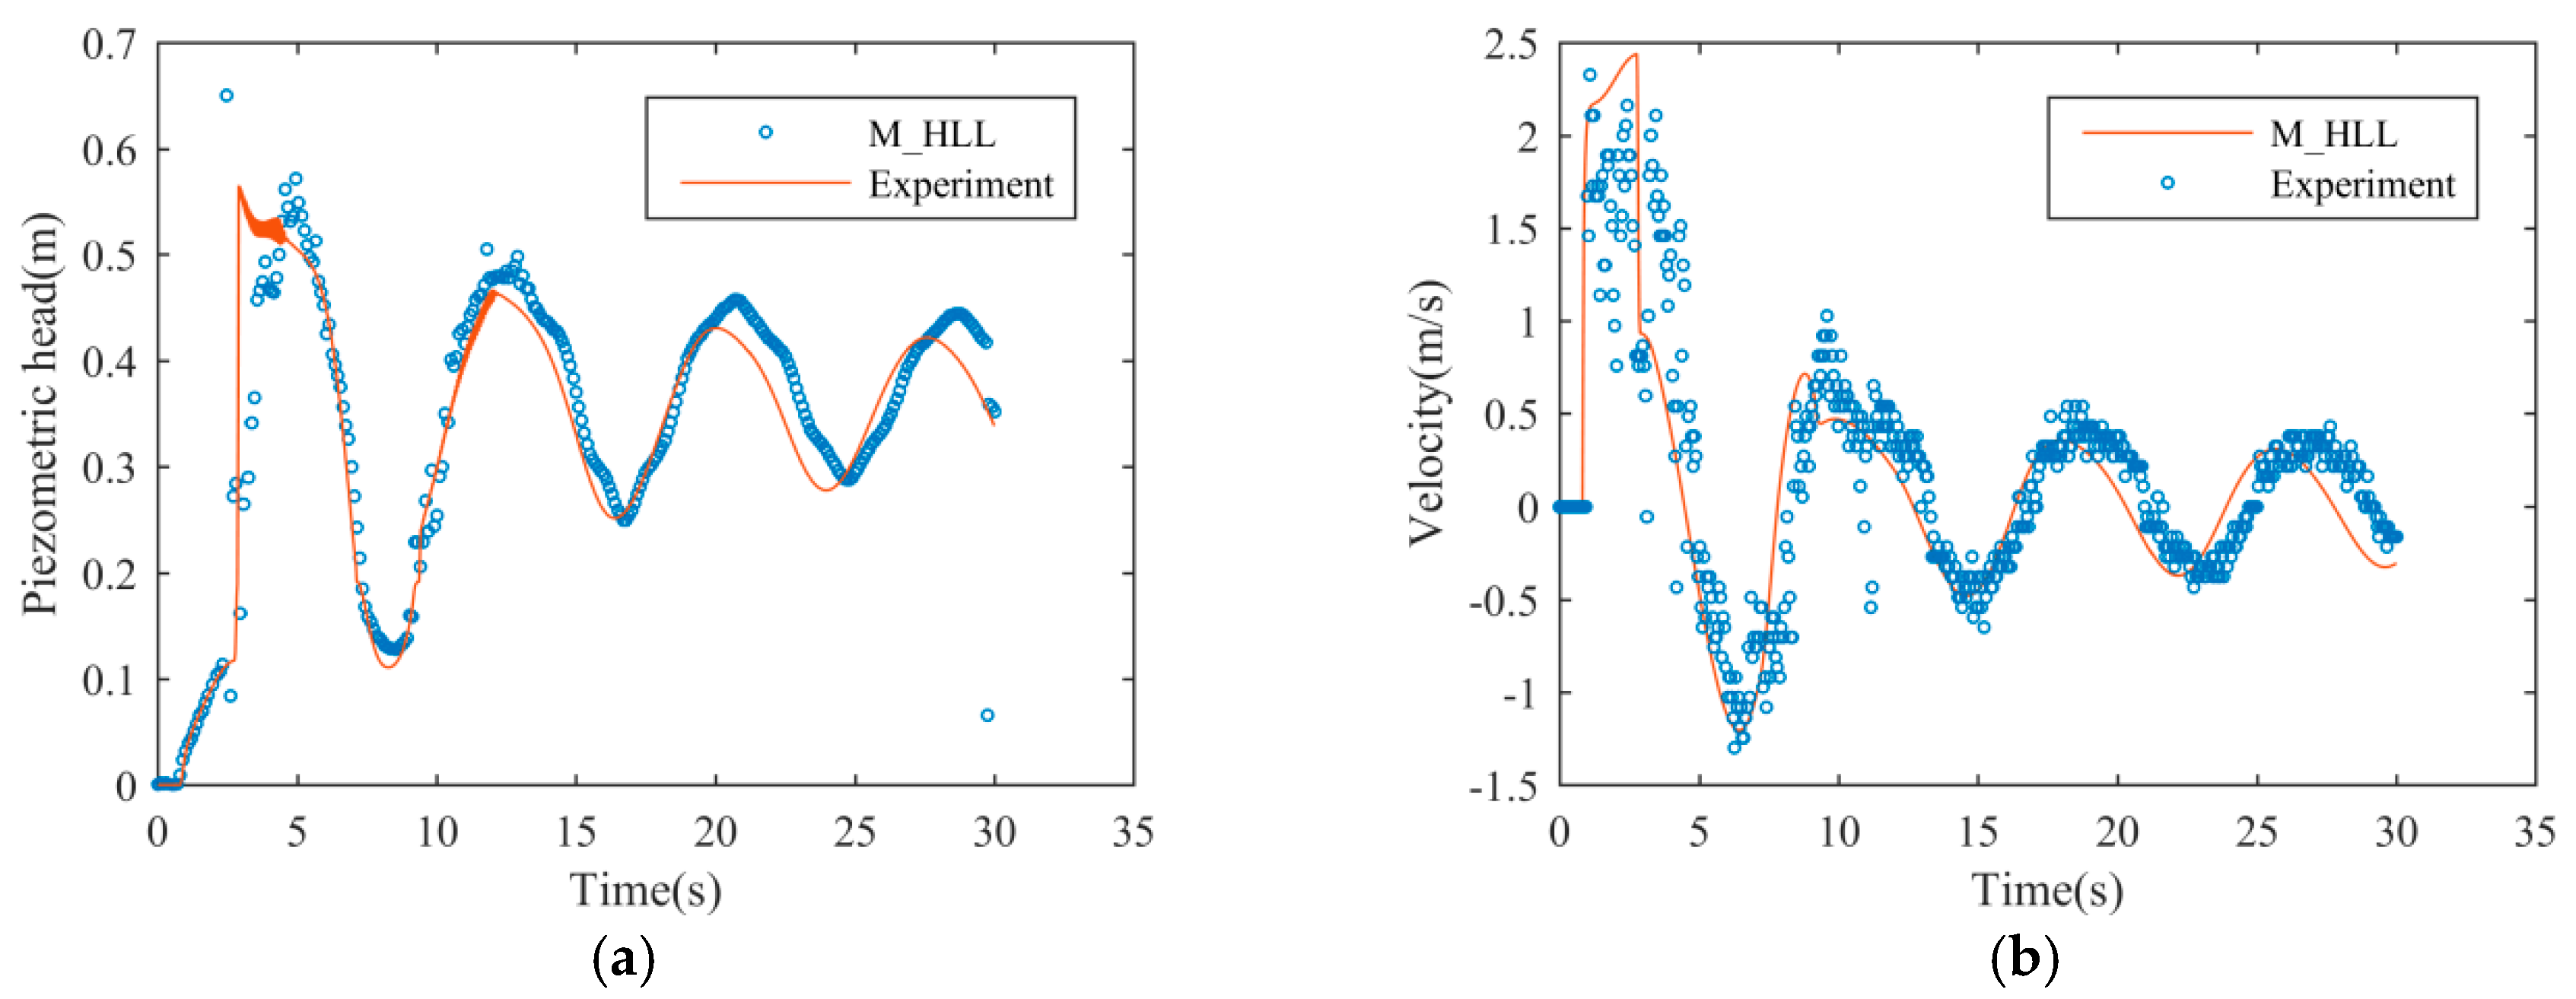
The P_HLL solver is tested in several numerical tests, in which a good agreement between the simulation results and analytical results or experimental data is found. In the test where the wet/dry interface is presented, the P_HLL solver achieves a more accurate result than M_HLL. Meanwhile, P_HLL solver has sufficiently suppressed the numerical oscillations, and accurately captured the propagation of the filling-bore. Compared to the M_HLL solver proposed by Malekpour and Karney, the P_HLL is more convenient to use as the parameters in this solver are easier to determine.
The result in this paper can provide useful information for readers to design an oscillation-suppressing method. It provides an alternative method to the M_HLL solver, which may be used in the parallelization of computation.
This method is proposed under the framework of PSM; it is limited to the simulation of flow regime transition. Besides, since the air pressure is not counted, this method cannot be applied to simulate flow regime transition where air pockets are present, which is out of the scope of this paper.
