Article

Variability of Trends in Precipitation across the Amazon River Basin Determined from the CHIRPS Precipitation Product and from Station Records

1
Geological Survey of Brazil (CPRM), Belém, Pará 66095-110, Brazil
2
Environmental Systems Research Institute (ESRI), Redlands, CA 92374, USA
3
World Bank, Washington, DC 20006, USA
*
Authors to whom correspondence should be addressed.
Water 2020, 12(5), 1244; https://doi.org/10.3390/w12051244
Submission received: 2 April 2020 / Revised: 23 April 2020 / Accepted: 24 April 2020 / Published: 27 April 2020
(This article belongs to the Section Hydrology)

Abstract

:
The Amazon River Basin is the largest rainforest in the world. Long-term changes in precipitation trends in the basin can affect the continental water balance and the world’s climate. The precipitation trends in the basin are not spatially uniform; estimating these trends only at locations where station data are available has an inherent bias. In the present research, the spatially distributed annual precipitation trends were studied in the Amazon River Basin from the year 1981 to 2017 using the Climate Hazards Group InfraRed Precipitation with Station data (CHIRPS) product. The precipitation trends were also cross-validated at locations where station data were available. The research also identifies clusters within the basin where trends showed a larger increase (nine clusters) or decrease in precipitation (10 clusters). The overall precipitation trend in the Amazon River Basin over 37 years showed a 2.8 mm/year increase, with a maximum of 45.1 mm/year and minimum of −37.9 mm/year. The highest positive cluster was in Cuzco in the Ucayali River basin, and the lowest negative was in Santa Cruz de la Sierra, in the upstream Madeira River basin. The total volume of the incoming precipitation was 340,885.1 km3, with a withdrawal of −244,337.1 km3. Cross-validation was performed using 98 in situ stations with more than 20 years of recorded data, obtaining an R2 of 0.981, a slope of 1.027, and a root mean square error (RMSE) of 363.6 mm/year. The homogeneous, standardized, and continuous long-term time series provided by CHIRPS is a valuable product for basins with a low-density network of stations such as the Amazon Basin.

1. Introduction

The increase in available remote sensing products and global datasets are suitable for hydrologic studies, especially of remote and ungauged areas. These products, such as the Climate Hazards Group InfraRed Precipitation with Station data (CHIRPS) precipitation dataset, are extensive temporal records of spatially distributed, homogeneous, and continuously recorded data. These properties make remote sensing products and global datasets useful data sources for obtaining temporal trends where data are either scarce or inconsistent [1].
The Amazon River Basin is a dynamic ecosystem that extends over ~6,000,000 km2. The proper quantification of the annual patterns of precipitation across this basin is challenging due its size; this area also contains large remote and inaccessible areas. In recent decades, local hydrological institutions in South America have been measuring and recording precipitation data. Since the 1970s, national Brazilian organizations such as CPRM (Geological Survey of Brazil), ANA (National Water Agency), DNAEE (National Department of Water and Electricity), ANEEL (Electricity Regulatory Agency), and INMET (Brazilian National Meteorological Institution) have been improving the hydrological monitoring network in the Brazilian part of the Amazon Basin. Other institutions from Amazonian countries have also started to make their data freely available to society in general, and these institutions include SENAMHI-Bolivia (National Service of Meteorology and Hydrology of Bolivia), IDEAM (Institute of Hydrology, Meteorology and Environmental Studies of Colombia), INAMHI (National Institute of Meteorology and Hydrology of Ecuador), and SENAMHI-Peru (National Service of Meteorology and Hydrology of Peru). The quality of the collected data represents an ongoing challenge [2]. A considerable amount of the collected data is questionable due to insufficient maintenance and operational expenses. In addition, the station density of the network is low, which limits the overall characterization of precipitation over the whole Amazon Basin. Moreover, the automatic stations are a small proportion of the total stations in the monitoring networks. The stations should be frequently visited for data collection; missing data values due to lost or malfunctioning equipment are frequently reported. The data collection is conducted by local technicians of the country’s hydrological services, who take notes and introduce additional errors. The hydrological service personnel regularly visit the field and collect hydrological notebooks, each one specific for pluviometers, water levels, evaporimetric records, and meteorological stations, with precipitation notes taken by observers based on daily pluviometer readings. Usually, each hydrology team visits to each station to collect the notebooks, on average, every 2–3 months. For some remote stations, such as the ones located in indigenous tribes in the north of the Amazon [3,4], the interval between visits could be longer (approximately 2–6 months). It can take up to 6 months for the data to become available to users, even for the unprocessed and unchecked data. In addition, there is a lack of qualified professionals able to assure the quality of the collected data. Despite these limitations, estimates of the mean precipitation across the Amazon Basin have been reported as 2215.3 mm/year, on average, with a standard deviation (σ) of 179.6 mm/year [5]. The reported mean annual precipitation values in the Amazon Basin have large variability due to challenges in data collection from rain gauges. These challenges are as follows: (1) only a few stations have complete, long-term time series, (2) it is common for stations to have large gaps in their records, (3) there are observations and writing errors, (4) data integrity issues due to the leakage, bad exposition of pluviometers, and occurrence of vandalism, and (6) low density of stations. Traditional methods for consistency, such as the double-mass curve, linear regression, and regional ponderation are not sufficient to fill and address these gaps and provide reliable information. Furthermore, the area of consideration might be influenced by regional conditions or phenomena such as the (1) diversity of ecosystems, (2) topography of the Andes Mountains and Bolivian Altiplano [6,7], (3) transport of water vapor [8], (4) evapotranspiration recycling [9,10], (5) South Atlantic Convergence Zone (SACZ) [11,12], and (6) El Niño–Southern Oscillation (ENSO) [13,14,15].
The aim of this study was to analyze the trends of precipitation across the Amazon River Basin using remote-sensing-based data from the Climate Hazards Group InfraRed Precipitation with Station data (CHIRPS) [16], and to cross-validate the precipitation trends from CHIRPS with in situ data. Similarly, USGS has published reports from analyzing CHIRPS precipitation trends in Africa in countries such as Mali, Burkina Faso, Chad, Niger, Uganda, Ethiopia, Sudan and South Sudan, and Kenya (http://chg.geog.ucsb.edu/data/trends). Despite the climate differences of these countries (more semi-arid and partially covered by tropical areas) compared with the Amazon Basin, they face a similar problem regarding the lack of extensive and reliable precipitation datasets from in situ stations, which makes global datasets such as CHIRPS the best alternative available for the estimation of spatially distributed long-term precipitation trends.
The estimation of precipitation trends is required for the quantification of changes in water availability and water balance in the basin. The water balance in the Amazon River Basin [17], was determined based on 14 land surface models, and a precipitation (P) average of 6.05 mm/day, or 2000–2340 mm/year and an evapotranspiration (ET) average of 2.83 mm/day were obtained. Lorenz et al. [18] acquired these averages from mixed products such as gridded observations, atmospheric reanalysis models, land surface hydrological models, and remote sensing products. For large basins, the water balance components included those of the Amazon River up to the discharge station in Óbidos (code ANA/CPRM: 17050001). Óbidos is the last station with discharge measurements in the Amazon River, and has an area of ~4,670,000 km2, and has been recording data since 1968 (http://www.snirh.gov.br/). The mean discharge is approximately Q = 165,829.6 m3/s or 1120 mm/year. The P ranged from 100 to 250 mm/month, the ET stabilized at 100–120 mm/month, and the water storage change (ΔS) had an intense decrease between April and November, reaching its peak in August/September. Getirana et al. (2014) performed a proper assessment of the water balance in terms of ΔS and the P and ET fluxes, but they underestimated the discharge. The annual mean precipitation in the Amazon Basin is approximately 2200 mm/year [19]. Paca et al. [20] also determined the water balance, where P = 2460 mm/year, ET = 1316 mm/year, Q = 1080 mm/year, and WB = 64 mm/year. Marengo [5] presented a review of the hydrological cycle and of estimates of the components of the water balance in the Amazon Basin. The mean values in the review are in accordance with more recently obtained values: on average, P = 2215.3 mm/year, ET = 1378.1 mm/year, and Q = 945.3 mm/year, and σ is equal to P = 179.6 mm/year, ET = 230.7 mm/year, and Q = 230.7 mm/year. The approximate water balance closure was determined to be −108.0 mm/year. Vergopolan and Fisher [21] described the relationship and changes between precipitation and evapotranspiration in areas subject to deforestation in the Amazon Basin. Despite deforestation, the study shows that the trends of P (TRMM) and ET (MODIS increased during the period of 2000–2012.
The occurrence of floods and droughts has increased in the Amazon Basin and includes floods in 2009, 2012, and 2015. In particular the highest flood event was recorded in 2012 in the city of Manaus, located in the central part of the Amazon Basin, which is documented in the city’s harbor, where the water levels are registered. In the last 30 years, Barichivich et al. [22] analyzed the intensification of floods in the Amazon based on 113 years of observations. At the other end of the scale, extreme droughts have also become more frequent and intense, with recent examples occurring in 2005 and 2010 [23]. Besides the increased state of emergency incidences in cities within the Basin, the rise of tropical diseases, sanitation, damage to crops, agriculture, and urban areas are largely affected by the changing conditions in increasing or decreasing precipitation [24].
With the regulating role of the basin in regional climatology, changes in precipitation ought to be known. One of the primary drivers of change is the biophysical land surface conditions. Earlier studies on precipitation patterns and trends in the Amazon River Basin have been undertaken by Molion, Marengo et al., Liebmann, Marengo, Nobre, Villar et al., Espinoza et al., and Almeida et al. [25,26,27,28,29,30,31,32] analyzed the temporal trends using the Brazilian INMET stations. The conclusion of their research was an overall slight decrease in precipitation in the Amazon Basin (−0.876 mm/year). However, the slight average decrease in precipitation across the basin is not uniform. The studies also showed clusters with increasing trends in precipitation. Each study had a different dataset and time period.
Casimiro et al. [33] investigated, in detail, the Peruvian Amazon-Andes precipitation trends using rain gauge data from SENAMHI stations in Peru. In the Cuzco region, increasing precipitation trends were identified, in contrast to the simultaneous declining trends in precipitation in the Pucallpa region. The observation of increasing and decreasing trends in precipitation is in accordance with the findings of Vicente-Serrano et al. [34], who examined the spatial–temporal trends of drought in Bolivia using a precipitation gauging station in Bolivia [35]. Likewise, SENAMHI meteorological data from Bolivia showed an increase in extreme events of precipitation and variability occurring in Bolivia, which was indicated by ENSO data. Although interesting, none of these studies describe the situation of the entire international Amazon Basin, since their analysis was restricted to station points using interpolated methods and not remote sensing techniques such as those used by Zubieta et al. [36], who analyzed datasets from TMPA V7, TMPA RT, Climate Prediction Center morphing technique (CMORPH), and Precipitation Estimation from Remotely Sensed Information using Artificial Neural Networks (PERSIANN), and Espinoza et al. [31], who also used CHIRPS to determine the evolution of seasonal precipitation intensity in the Amazon Basin. The remote sensing techniques usually led to products that have uniform spatial and temporal distributions. A spatial characterization of precipitation trends (not overall basin average) was required to properly estimate the overall trend and places with extremely negative or positive trends. This could be done with global datasets constructed from remote sensing techniques. CHIRPS is presented as a consolidated product to overcome these conditions.
There is a need for a more comprehensive analysis of the precipitation trends in the Amazon Basin and a deeper understanding on their spatial distribution. The quality of the precipitation observations and extreme precipitation events do not always meet the requirements for water resource management decision-making. The hydrological network demands minimum requirements, such as water allocation, in the case of flood and drought preparations to minimize the impacts of hazards impacts, water conflicts, agriculture, cattle, forest, national and indigenous reserves, water consumption, disposal of drainage and sewage, and dispersion due to the lack of proper water treatment, and impacts and maximum and minimum discharges for dam planning. Hence, it is necessary to investigate the efficacy of using suitable near-real-time products from satellites.
The objective of this paper was to analyze the changes in precipitation trends across the Amazon using spatially distributed data from the Climate Hazards Group InfraRed Precipitation with Station data (CHIRPS) precipitation product [1], to identify specific regions with anomalies, and to validate the temporal changes detected by remote sensing observations and ground measurements. The estimation of precipitation trend variability and anomalies within the Amazon Basin using novel products from remote sensing sources leverage our understanding of the basin and its impacts on the regional water cycle.

2. Material and Methods

2.1. The CHIRPS Dataset

Satellite-based precipitation products have the advantage of (1) being uniform and continuous in space and time, (2) reporting values in a consistent manner, and (3) covering large areas on a global or continental scale. However, some products include biases and must be corrected at the basin scale for hydrological applications [37]. Karimi and Bastiaanssen [38] showed that satellite-based precipitation products are area-specific, and that errors in absolute values vary between 2% and 19% on water accounting reports.
CHIRPS is one of the most recent and accurate spatially distributed precipitation products. It is often used as an alternative source of precipitation measurements, especially in areas where the measurements are sparse or scarce [39,40,41]. The CHIRPS v.2 product was validated with in situ stations from Colombia and Peru, providing good regional results [16]. In this study, CHIRPS was used to obtain trends for the Amazon River Basin over 37 years using a remote sensing product. Data were continuous and homogeneous, with good spatial resolution for such a large river basin, and there were no gaps in its temporal series. Table 1 describes CHIRPS and the locally based pluviometers.
Bai et al. [42] evaluated the accuracy and seasonality of CHIRPS over mainland in China, comparing it against 2480 gauging stations across the country. The study found that CHIRPS has a lower performance during winter, during the non-rainy season, in snow-covered areas, in mountainous areas, and when semi-arid conditions are present. This is because CHIRPS is derived from Tropical Rainfall Measuring Mission (TRMM), which performs well in humid regions.
Paredes Trejo et al. [43] compared the sparse precipitation gauging network in Venezuela against CHIRPS and validated the product in this region. CHIRPS showed good agreement with the in situ data in the Venezuelan part of the Amazon Basin (1% of the total area of the basin) despite the low density of the hydrometeorological network and the poor distribution of the stations. Furthermore, their study highlighted the limitations of using CHIRPS for drought monitoring in Venezuela, although it has an acceptable performance for hydrological purposes. The main use of CHIRPS is for regions with scarce, ungauged, and sparse precipitation data collection.
Paredes Trejo et al. [44] studied the use of CHIRPS for characterizing precipitation in Northeast Brazil. The results are comparable to the previous study in Venezuela. CHIRPS overestimated low (below 100 mm/month) and underestimated high precipitation values. Moreover, the use of satellite-based products such as CHIRPS was suggested for filling the gap in records due to the absence of stations outside the semi-arid region.
Toté et al. [45] evaluated CHIRPS with two other remote sensing products (TAMSAT African Rainfall Climatology and Time series (TARCAT) v2.0 and Famine Early Warning System Network (FEWS NET) Rainfall Estimate (RFE) v2.0) for Mozambique, concluding that CHIRPS could be used for the whole country, with the exception of certain regions. The precipitation networks of Mozambique and Venezuela are similar to those in the Amazon Basin.

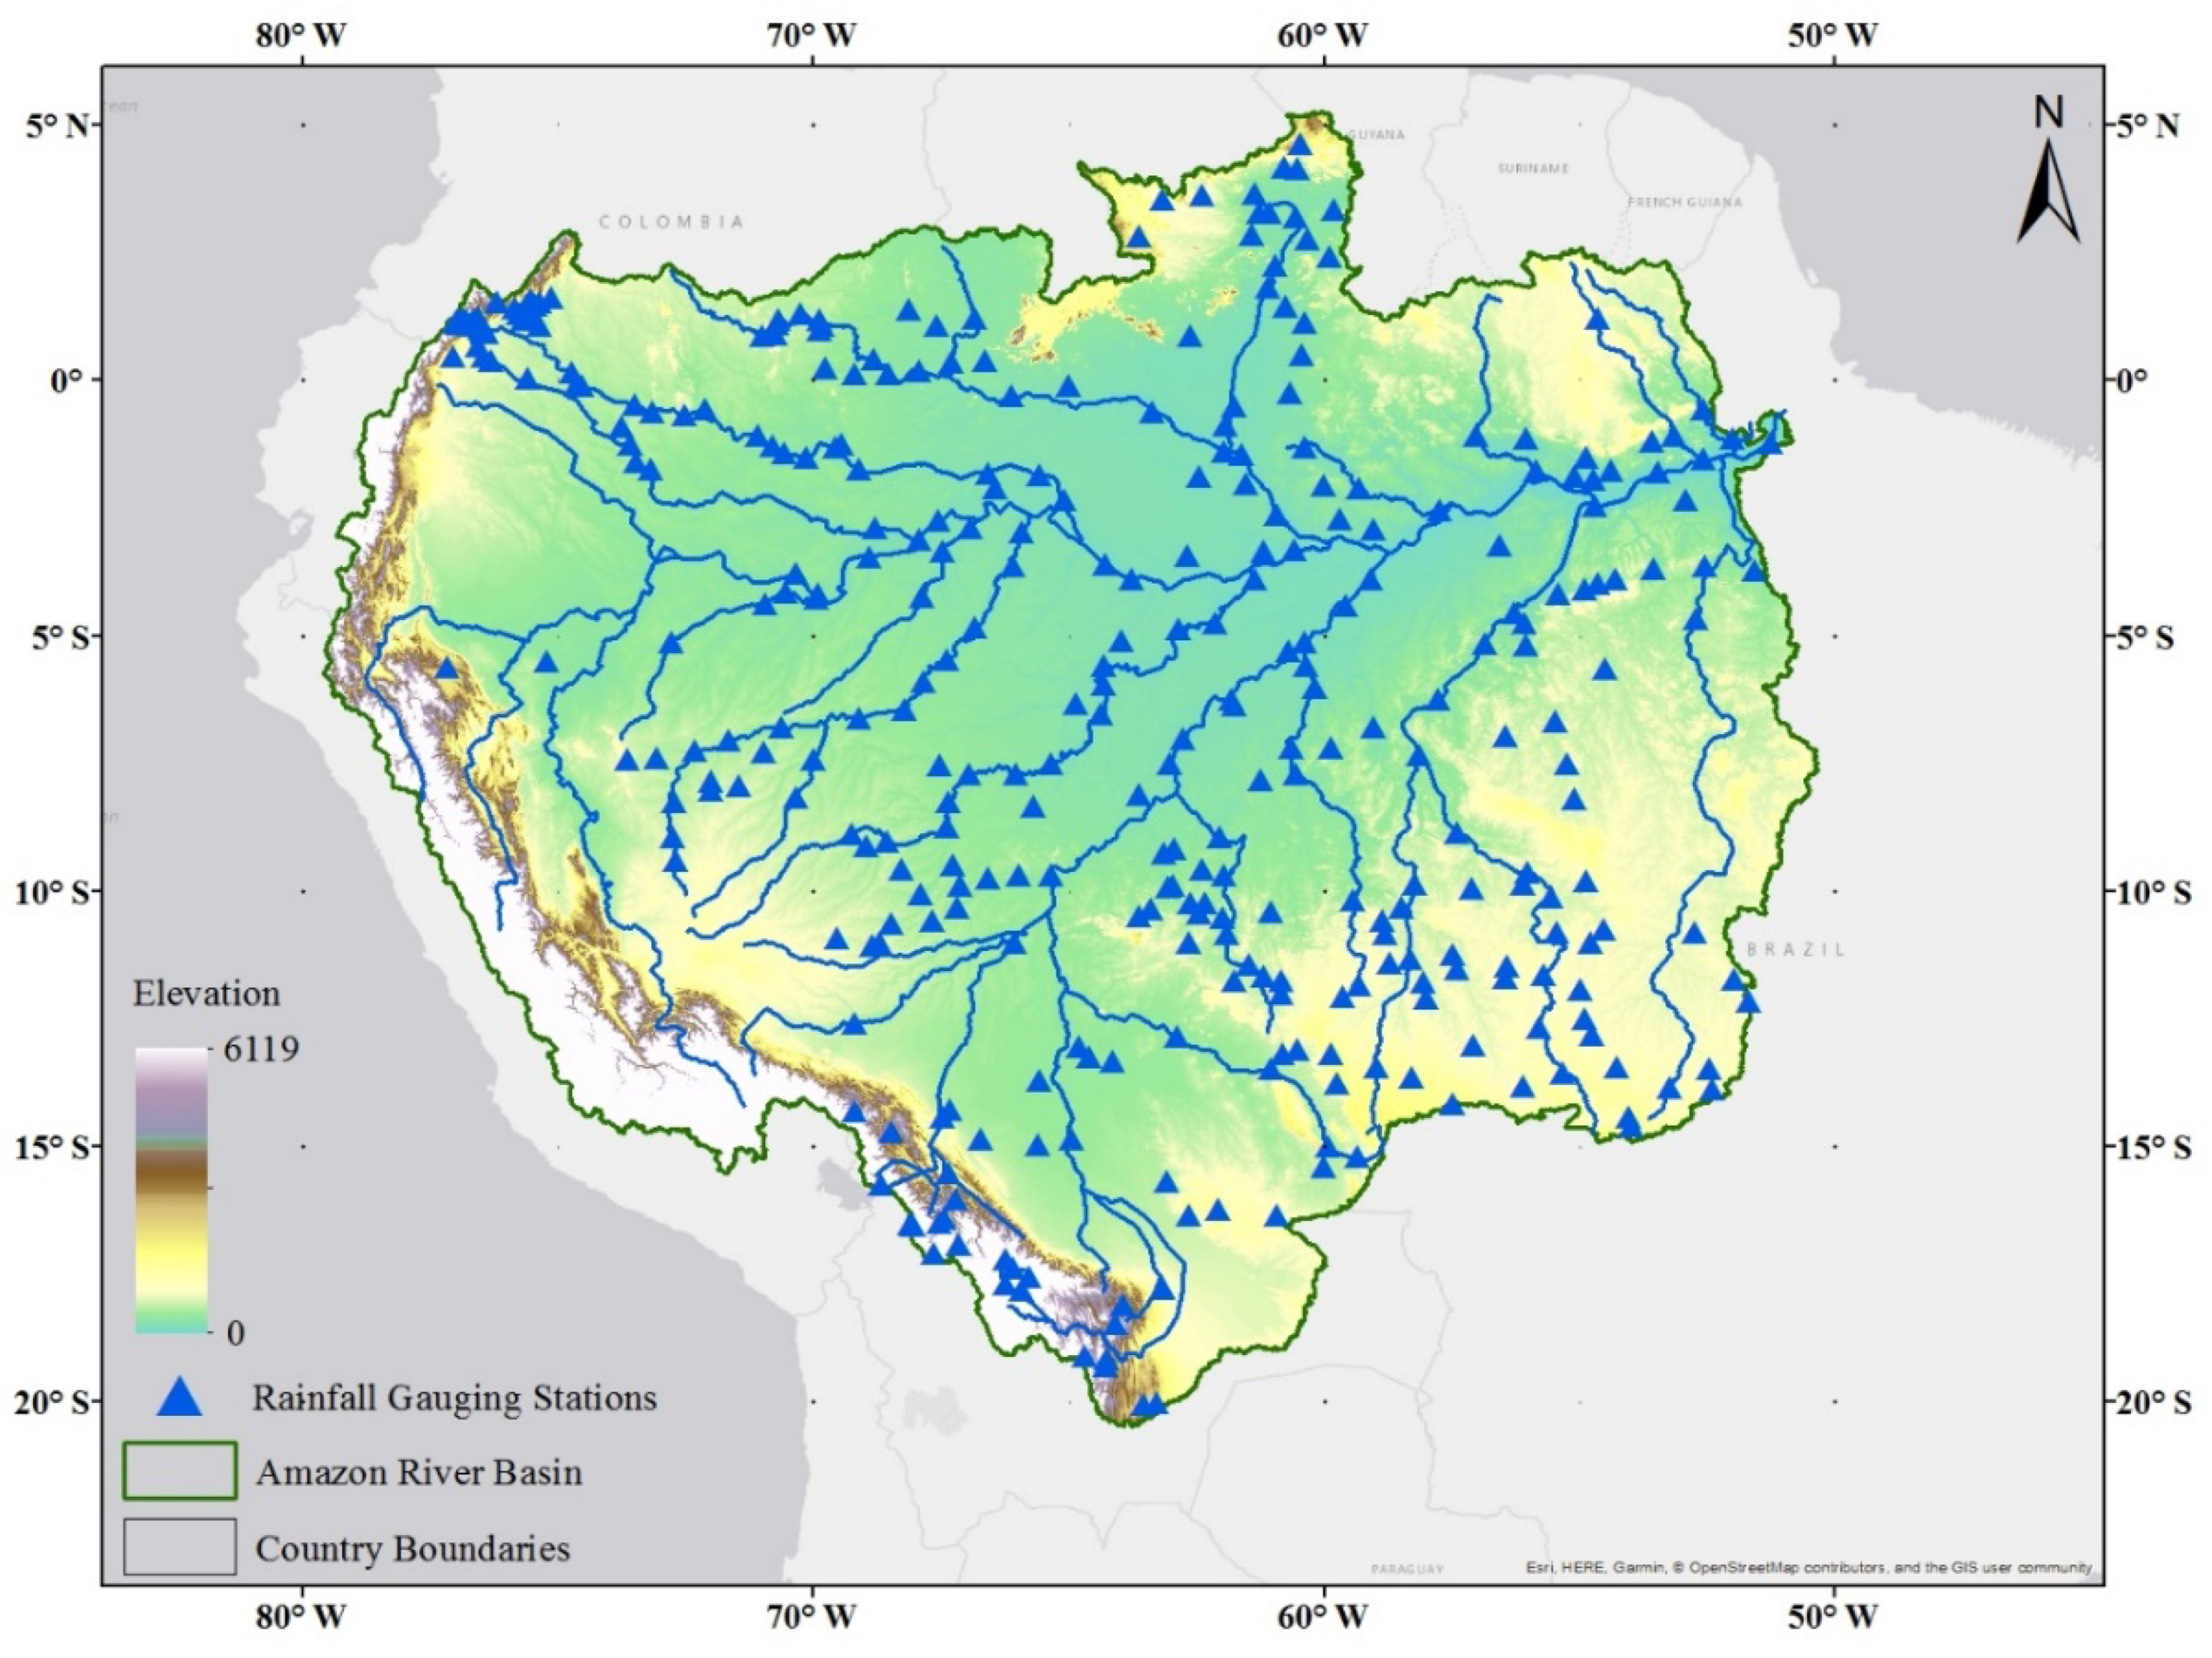
2.2. Precipitation Records in the Amazon Basin

The primary source of data for this study came from the Geological Survey of Brazil (CPRM) [46]. The CPRM administers and operates a network of more than 300 hydrometeorological stations in the Amazon Basin. For this study, the hydrometeorological stations are not automatic and require the deployment of people on the ground to extract data from the pluviometers, and report back bulletins with the recorded data. The ground stations considered as reliable are as complete as possible, and use a pluviometer, pluviograph, and evaporimeters. The shortcomings of precipitation measurements from gauges include accessibility, the fact that most of the stations are located closer to the riverbanks, doubtful observations, detrimental exposure to the rain, inaccurate data recorded by observers, spaced and unevenly distributed forest areas that cannot be measured without a proper flux tower, stations located in places not following the standard rules of the World Meteorological Organization (WMO) [2], poor coverage from too few gauges within the region, automatic stations that are not suitable for the region because they can be easily stolen, solar panels, and weather conditions and maintenance [47]. Time lapses occur due to the time required to reaches each pluviometer at each station and collect the precipitation bulletins. The field work is conducted over a period from 15 to 30 days and involves processing, consolidating, and validating the data. This valuable information is, however, not delivered in a timely manner.
Paiva et al. [48] compared the differences between interpolated surfaces of precipitation derived from the network of stations with Tropical Rainfall Measuring Mission (TRMM) 3B42 data. The study concluded that stations closer to large water bodies register a slight decrease in precipitation. Paiva et al. [48] suggested that river breeze could be a factor for lower precipitation. As shown in Figure 1, the majority of stations are located along the largest streams within the basin near the riverbanks, accessibility to the stations is facilitated mainly by boat and also small aircraft and by car. The site-selection might induce a bias in the estimation of the overall change in precipitation in the Amazon Basin if only the stations data are used.
The present study collected data from 578 in situ precipitation stations Figure 1. The station data was thoroughly checked for erroneous values, consistency, and the length of the time series. Ninety-eight stations were selected for this study. Stations were included if they contained at least 20 years of reliable recorded information consistent with readings. Data corresponding to only a few days in a month were considered incomplete.
Satellite precipitation products were also checked against ground stations data (pluviometers and data loggers). The observations from in situ stations were chosen based on the quality of their recordings and periodic registration. The fact that humans can also introduce mistakes while observing the stations was also considered. A statistical analysis of the station records was used to identify the most reliable data. Those corresponding stations were considered to be the standard stations for the study. Regression and statistical analysis tools were applied to evaluate the relationship between ground stations and remote sensing precipitation products.

2.3. Methodology

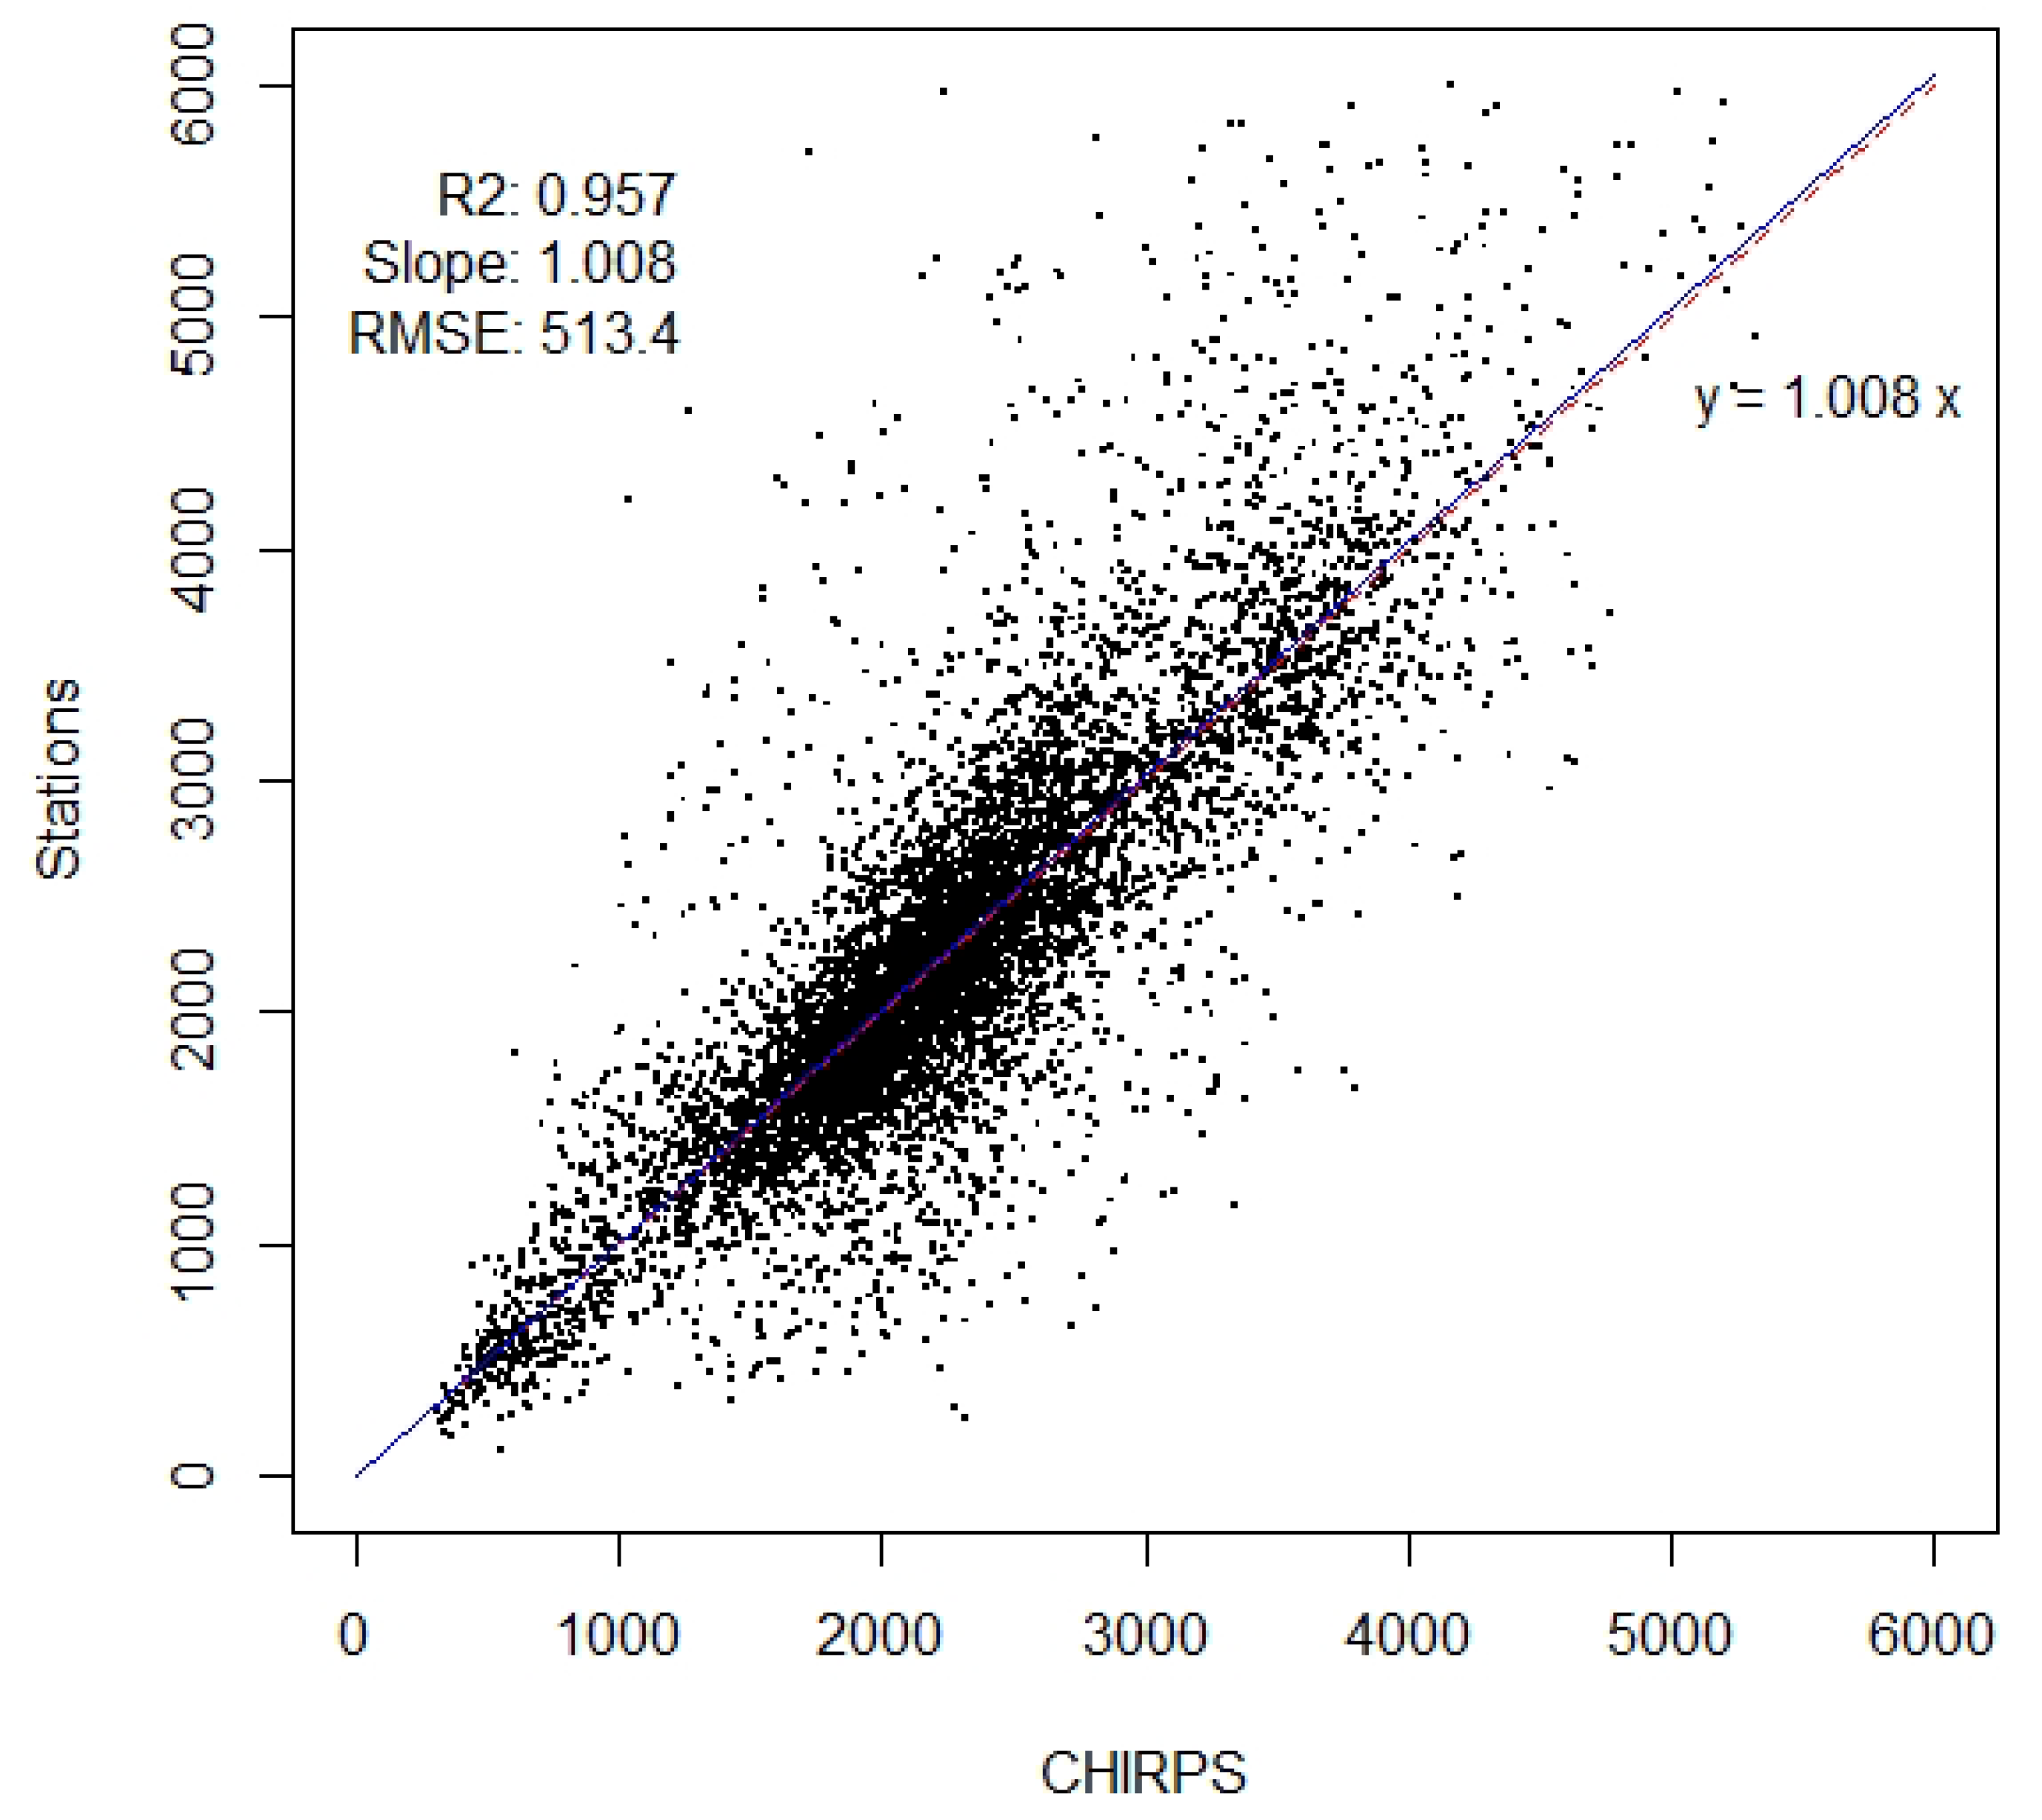
2.3.1. CHIRPS and Ground Station Analysis

The first step was to check the consistency of the data from the stations and to then check that the score of the observation is in accordance with the surrounding stations and landscapes, and that the observers were well graded with their observations. This information was saved in the station’s historical records. The second step was to check the performance of CHIRPS.
The frequency distribution for the whole catchment was compared between the stations and the CHIRPS for the whole basin and between the pixels in which each precipitation station is located (Figure 1).
The analysis of hydrological trends per year for all 580 stations is shown in Figure 2, and in Figure 3 we show 98 stations with a time series spanning more than 20 years. In Figure 2, there is a good correlation and slope, as was also the case in Figure 3. The root mean square error (RMSE) Equation (1) and the coefficient of determination Equation (2) are minimized when the long-term time series stations was inspected against CHIRPS. The monthly and yearly data were considered in stations that had more than 20 years of available data (Figure 3) and fewer than 20 days of gaps (missing data) per year.
R M S E = i = 1 n ( C H I R P S S t a t i o n s ) 2 n
r 2 = i = 1 n ( s t a t i o n s i μ ) 2 i = 1 n ( C H I R P S i μ ) 2
The importance of the in-situ stations is to compare and validate CHIRPS for the region. As shown in Figure 1, the sparse distribution of the precipitation stations requires extrapolation methods where some areas are not covered. The remote sensing product CHIRPS has a better distribution and standardizes the method of precipitation collection, which were useful because each meteorological institution has its own methodology for collecting and providing data end users. However, all the institutions follow the WMO requirements.

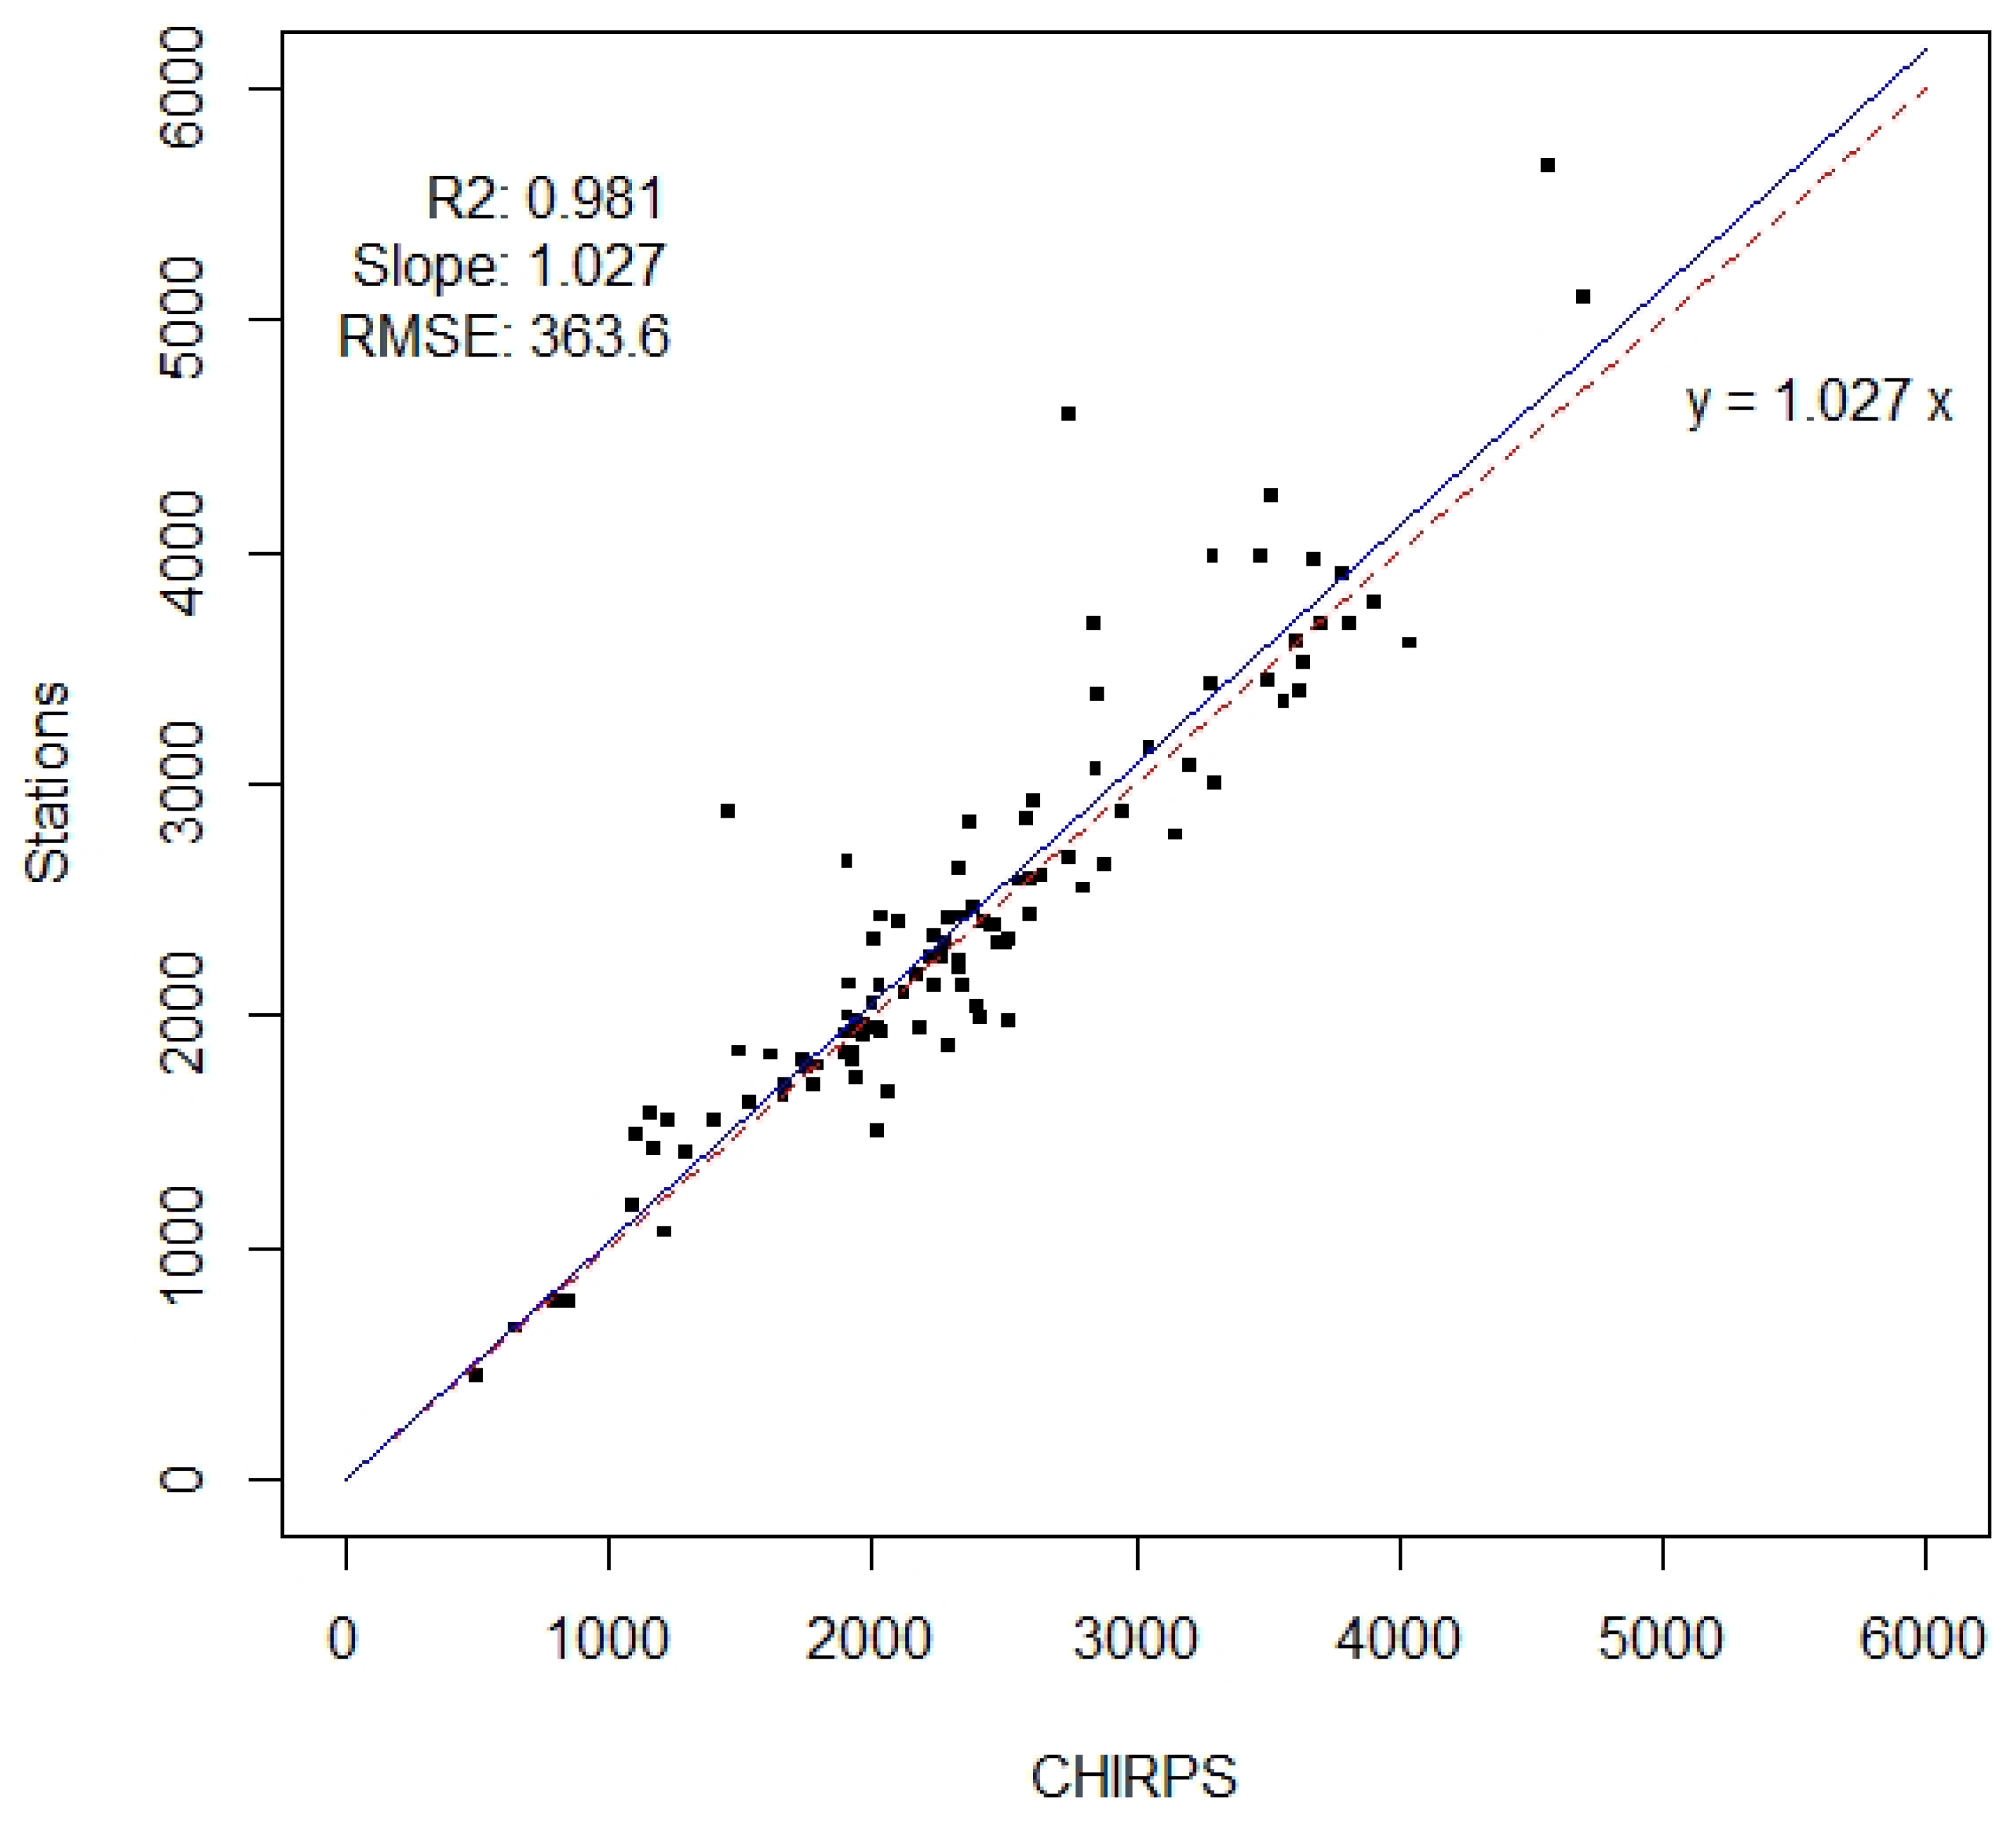
2.3.2. Synchronized Station Analysis

The precipitation stations did not have all the data available for the periods coinciding with the satellite data. In order to have comparable results, CHIRPS data was synchronized with the station records, meaning that a CHIRPS time series was created only for the same time records available in the station data. The minimum recorded period for analysis was 20 years for the in-situ stations to be compared with 37 years of continuous homogenous data provided by CHIRPS. Four main clusters were observed and synchronized.

2.3.3. Standard Analysis of the Trend Extremes

The evaluations of trend extremes were statistically calculated for data below the 15th percentile and data above the 85th percentile. The volume for the total period was obtained among this range, and the mean trend of the area was within these percentages.
μ = i = 1 n ( x i ) n
σ = i = 1 n ( x i μ ) 2 n
The trend extremes were extracted based on the range from the mean Equation (4) plus or minus the standard deviation Equation (3).

2.3.4. Comparison with the Evapotranspiration Component of the Water Balance

The evapotranspiration was compared with trends from 2003 to 2013, and the relationship between them was analyzed. The input of the other components of water balance, such as ET, was incorporated with the trend analysis based on the same temporal resolution and remote sensing technique. ET was used as a product from ET-Amazon and CHIRPS, both remote sensing products.

3. Results

The Climate Hazards Group InfraRed Precipitation with Station data (CHIRPS) [1] is a global precipitation product that estimates a mean annual precipitation of 2179.5 mm/year for the Amazon Basin. The homogeneous spatial–temporal grid of global products and the recent increase in algorithms, after the successful results obtained from the TRMM for the tropical and humid regions [49], indicated an increase in the availability of more precise and accurate precipitation resources.
Figure 2 shows the scattered results from all yearly stations compared to CHIRPS, with good performance of the coefficient of determination (R2) of 0.957 and a good slope performance of 1.008, which is a close match to the one-to-one line. The RMSE of 513.4 mm/year shows the alignment of our analysis. Although the metrics have good results, the scatterplot and RMSE show a large range and disaggregation of above 2600 mm/year.
The distribution of stations with CHIRPS data for below 2000 mm/year was not sparse. The overall values were evenly distributed between 2000 and 2600 mm/year. For high volumes of precipitation, such as 3000 mm/year, the comparison was spread, with CHIRPS underestimating the recorded values. Up to 500 mm, there was good consistency between the sources. It is believed that satellites collect better data during dry periods, when it does not rain, or when it rains little [50]. Between 500 and 2000 mm, CHIRPS overestimated the rain. It must also be understood that many rain gauges do not have good exposure in the Amazon. CHIRPS, as an average per region, based on products of low spatial resolution, also distributes this rain, placing the data where there is both more and less rain. From 2000 to 3000 mm, there is a more normal distribution of errors. At the large annual values of precipitation from 3000 to 5000 mm, CHIRPS underestimated the data, and the rain gauge is a single point. In that sense, more points may be in hotspots. Local precipitation is also difficult to measure by satellite, as it is smoothed into pixels [51].
Figure 3 shows the stations with a time series longer than 20 years, in contrast to Figure 2, which shows all stations. The distribution in Figure 3 is more consistent and less scattered, with few outliers. The analysis of the long-term station data, with consistent data records and more than 20 years of time series data, is less diffuse and more aligned, as shown in Figure 3. The metrics obtained are as follows: an R2 of 0.981, a slope of 1.027, and an RMSE of 363.6 mm/year.

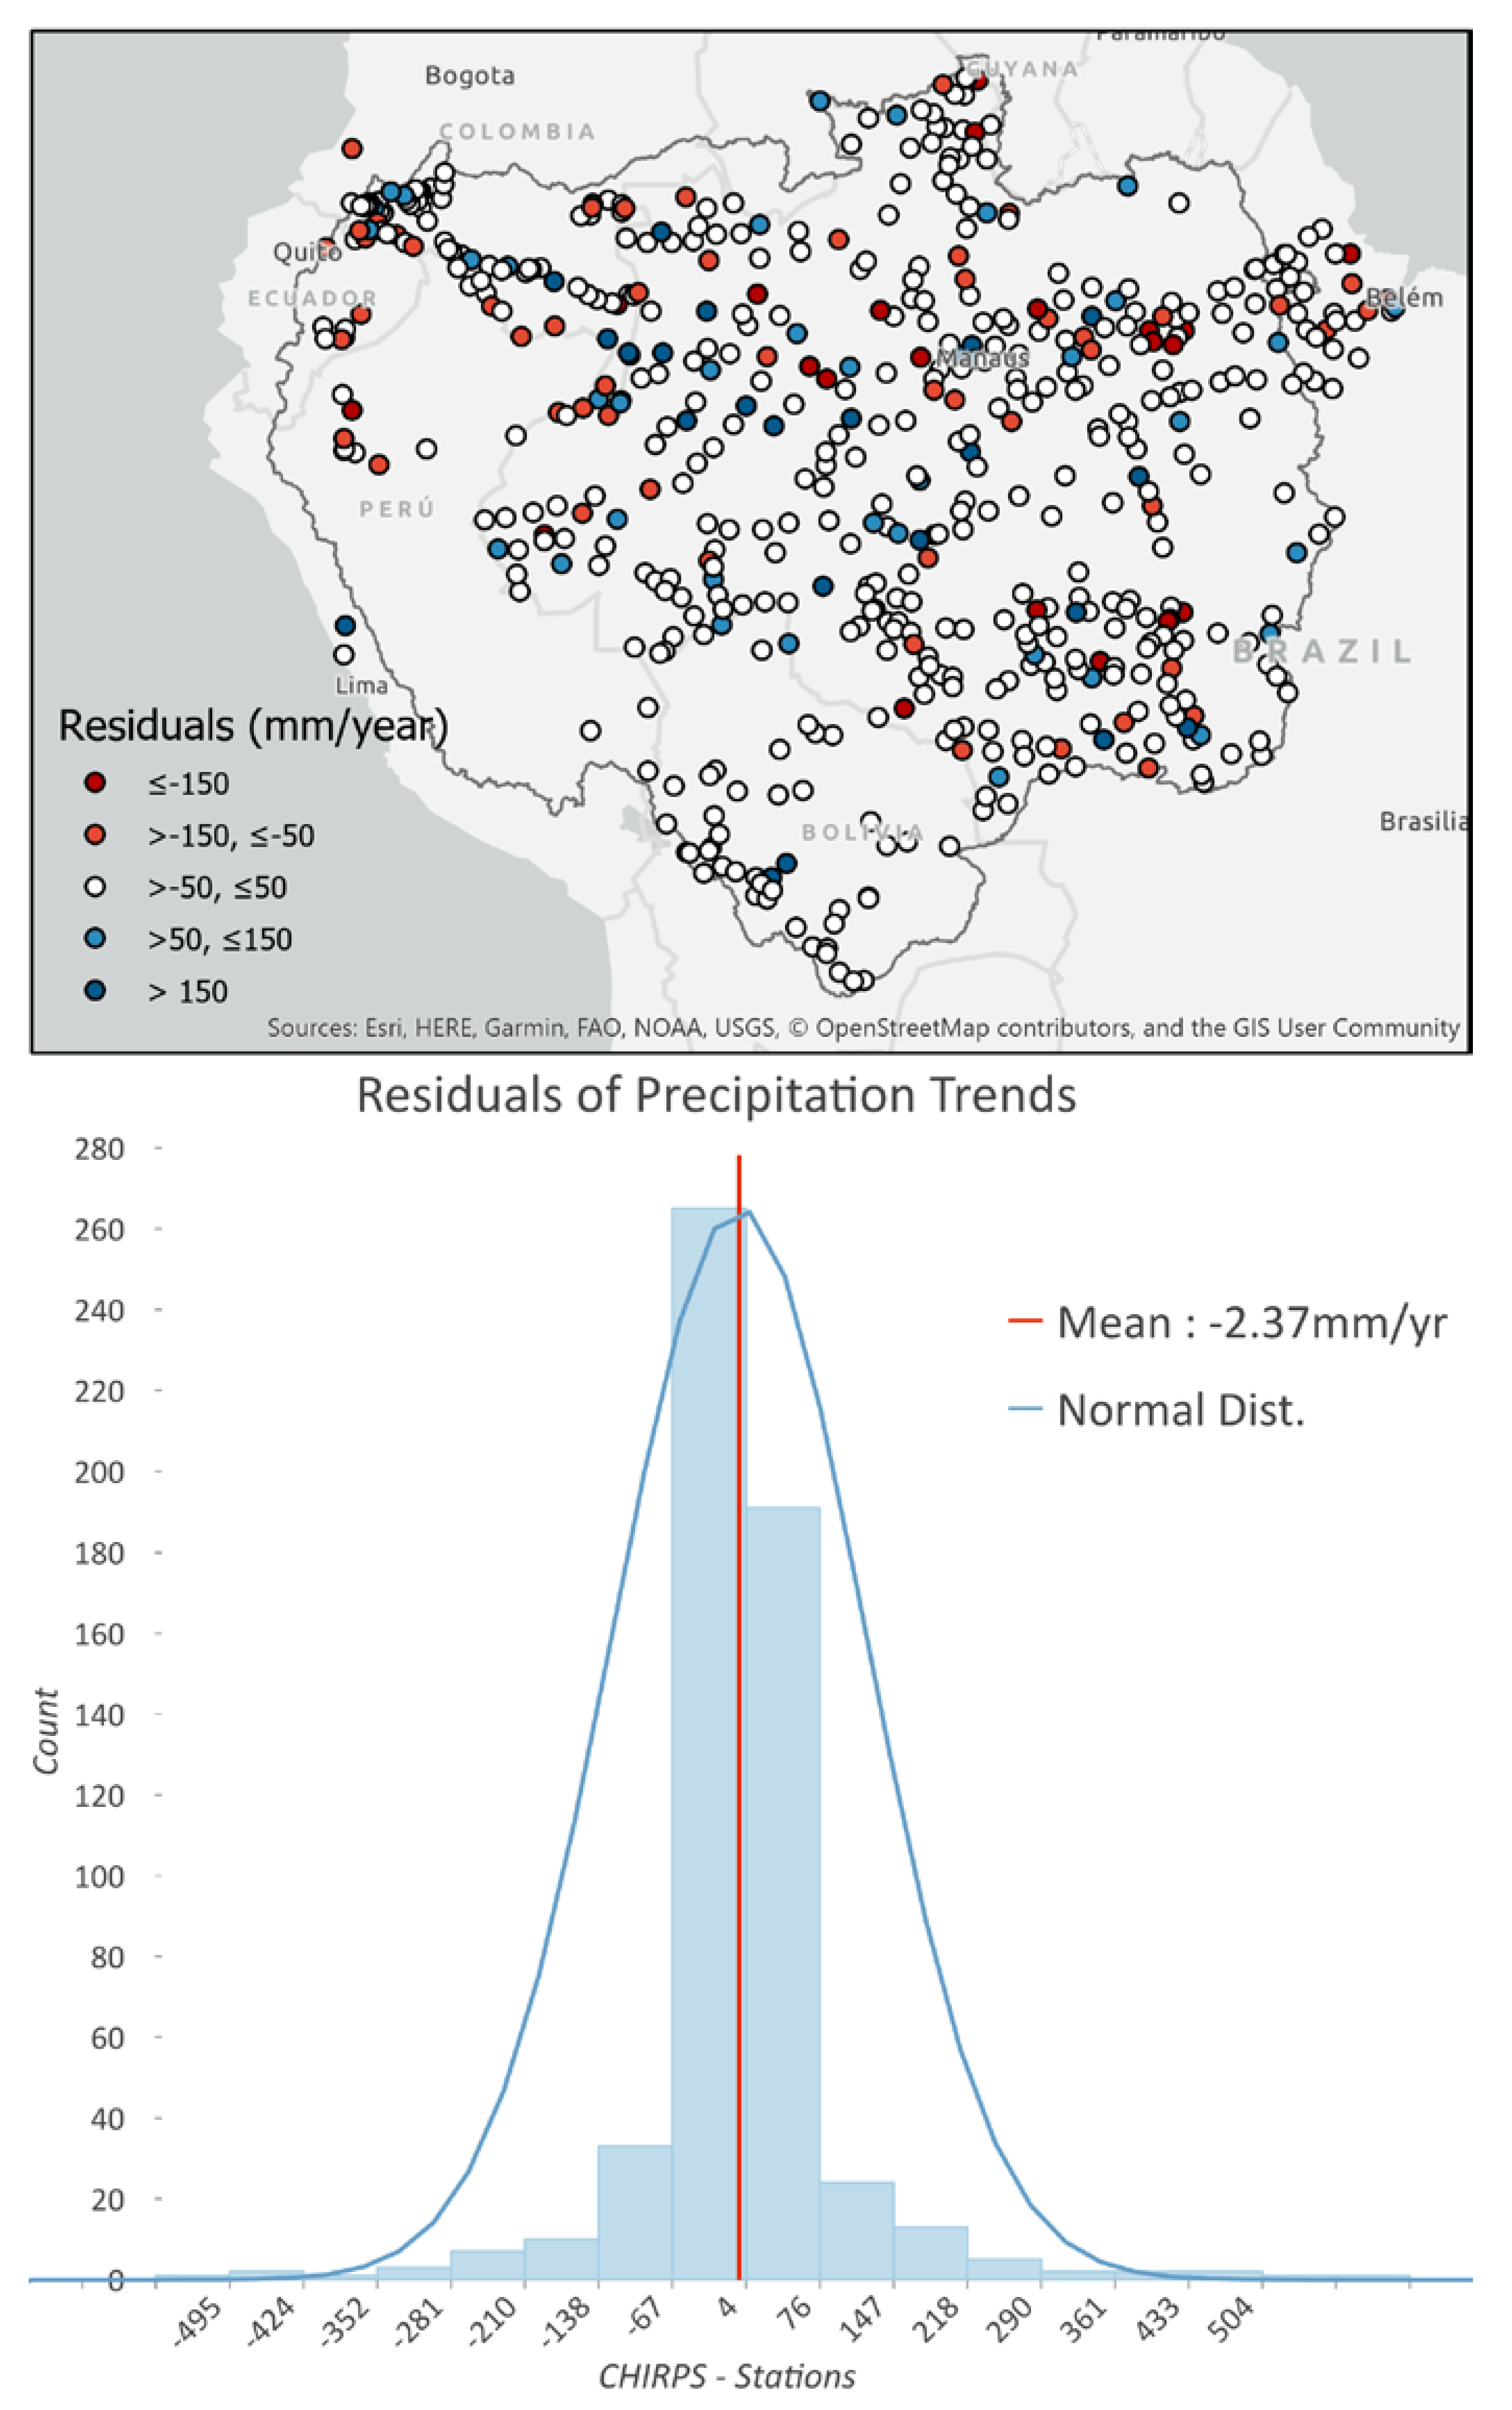
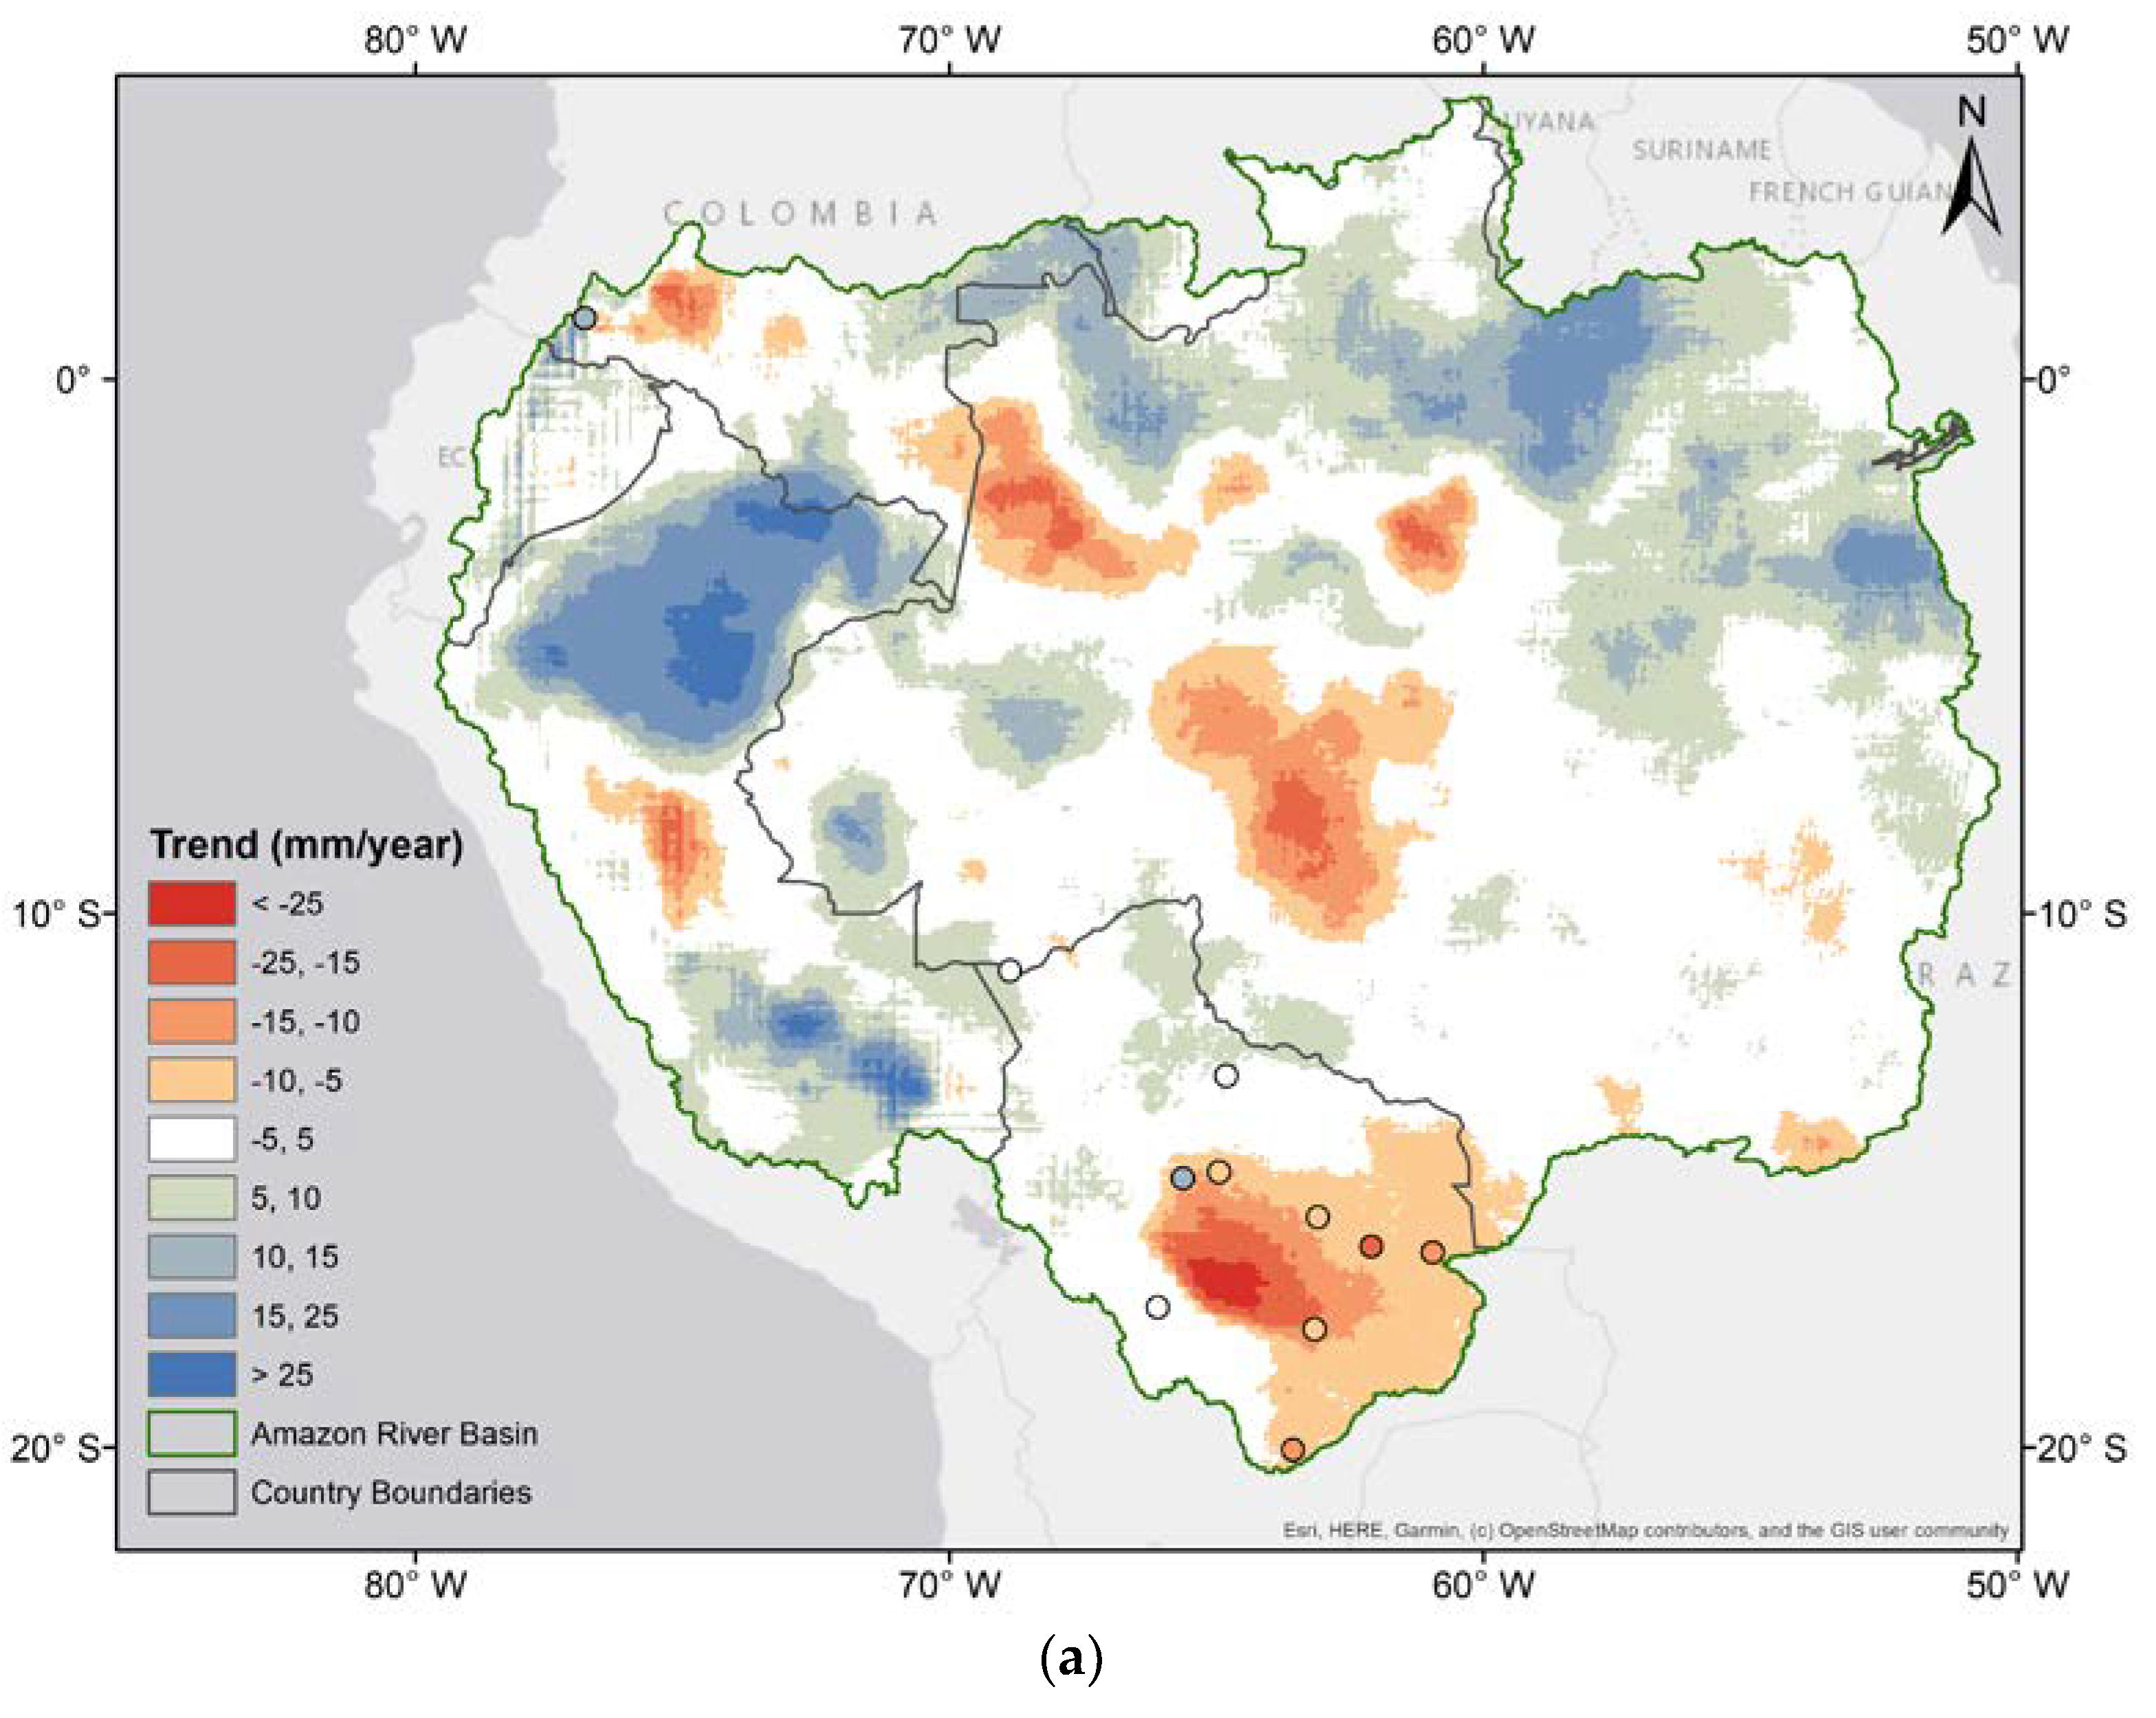
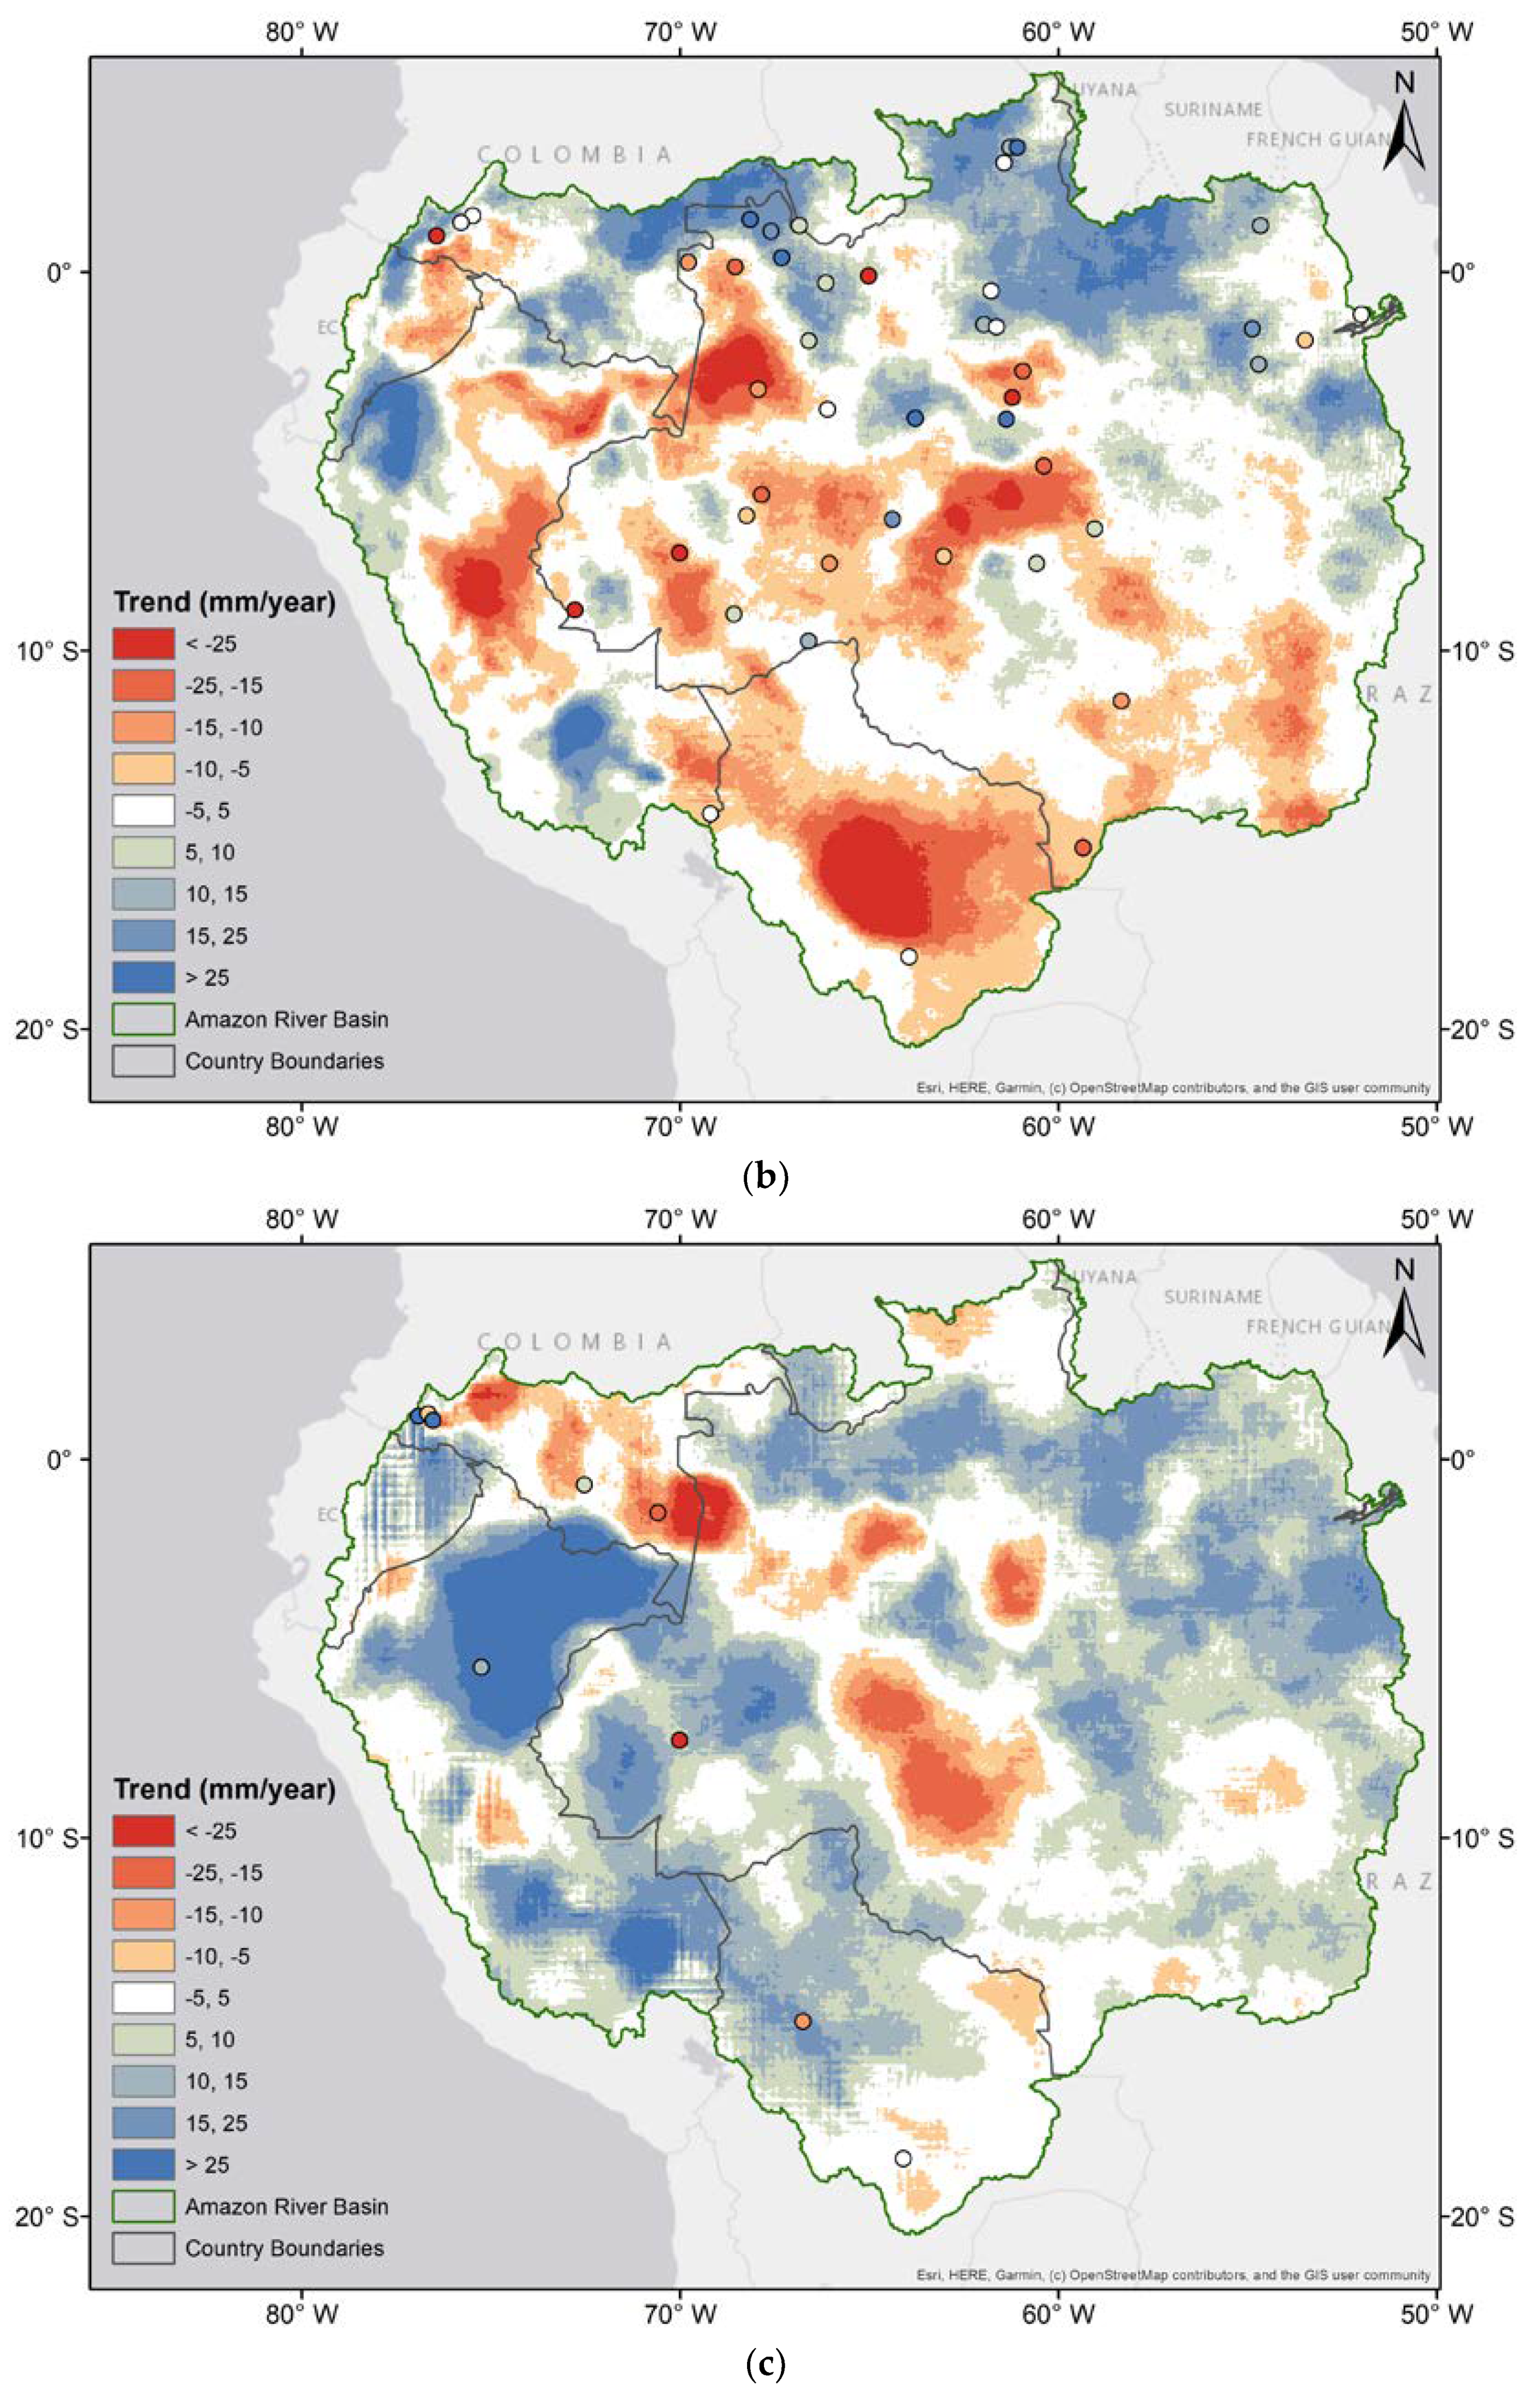
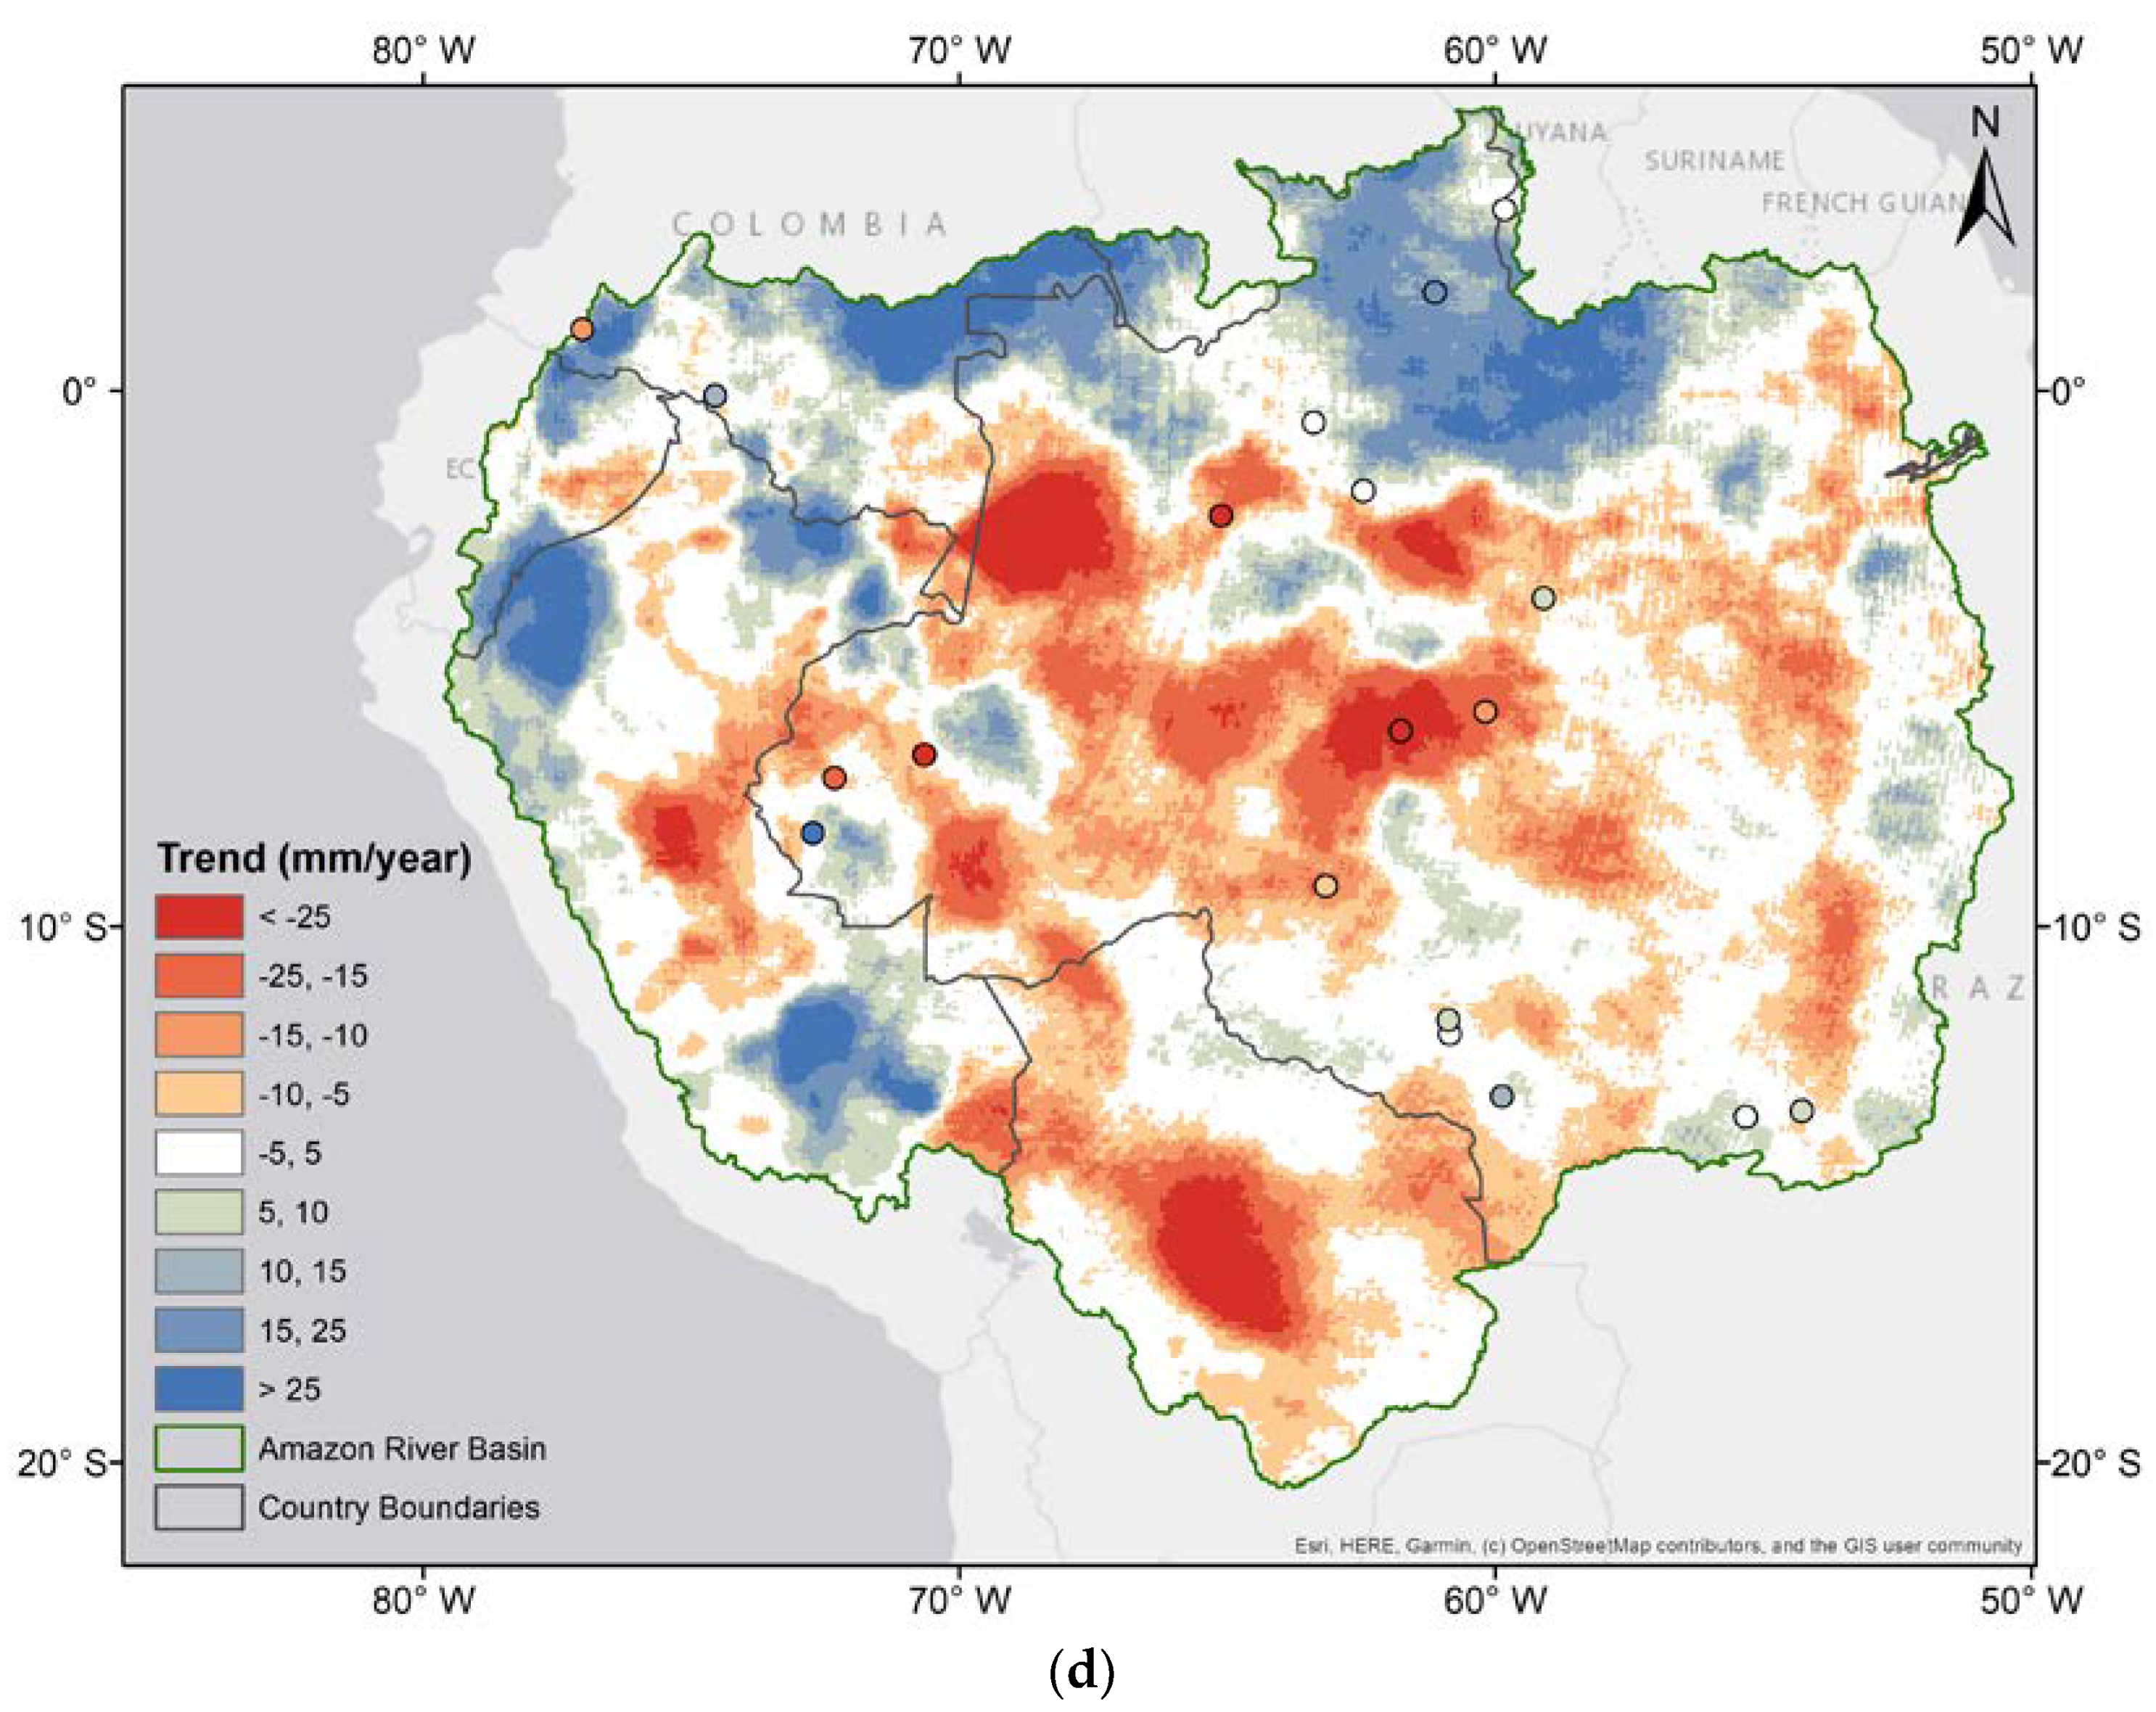
3.1. Spatial Analysis

The visualization of the trends and the extremes provided by CHIRPS, shown in Figure 4, describe the spots where the changes were more pronounced.
The spatial analysis was performed rearranging the comparison between CHIRPS and the stations per period. Each period was selected according to the main length of the time series from the stations, with 20 years or more. The division was made in four cluster trends: 1981–2017, 1981–2006, 1990–2007, and 1984–2006.
The main results for the CHIRPS trends are shown in Figure 4. This map displays the main clusters that were accounted for in Table 2 and Table 3 to provide the quantity of depletion and the addition of water over the 37 years of data recorded. Table 2 and Table 3 also show the P-values of the Welch’s t-test comparing the mean precipitation trend of CHIRPS for each cluster to the mean trend of the stations contained in the clusters. The majority of the clusters pass the test with a confidence interval of 95% with the exception of the negative cluster of (1) Madeira/Solimões, and the positive clusters of (2) Marañon and (3) Negro. The failure of the t-test in these three cases are due (1) a short record on the stations data (13 years on average), (2) a bias on the location of the stations within the cluster (i.e., the station are located in the eastern part closer to the Andes), and (3) incorrect records due the remoteness of the area. The results of the t-test expose the advantages of spatially distributed and temporally continuous precipitation products against sparse, scarce, and bias-located stations data for the estimation of long-term trends.
The average trend for the 37-year period of this study does not show a significant amount of variation either with CHIRPS or for the obtained in situ stations, as shown in Figure 5. The trends for all the stations and the trends for CHIRPS follow the same patterns. In Figure 5, we have taken into account all the stations in the dataset. Scatterplots shown in Figure 2 and Figure 3 are also confirmed by the tendencies displayed in Figure 5 of the stations and the CHIRPS trends.
Eighty percent of the in-situ stations have the same trends as CHIRPS. The clusters within the basin with the highest positive (blue) and lowest negative changes in precipitation trends, should experience larger changes in the regional water balance. The areas covered by these clusters should be the target of extensive adaptive measures in the upcoming years. Moreover, the density of stations in the region was increased in recent years, mainly in locations with easy access which introduces a bias in the dataset. In addition, the new stations are also subject to the same human-prone errors which influence the reliability and consistency of the recorded data. The in-situ stations cannot be considered the ground truth values due to inherent errors in their acquisition, which are also passed to CHIRPS product. However, the evaluation of precipitation trends with a combination of in situ data and remote sensing products are an unquestionable improvement. It enhances the homogeneity of information in remote areas far from the main rivers. The aim of this study was to analyze precipitation trends in the Amazon River Basin using a CHIPRS as a precipitation product.
Figure 6 shows the residuals of the difference between CHIRPS and the station data, and also its histogram. The residuals have a small spread centered at the mean of −2.37 mm/year. A t-test was performed on the residuals with the null hypothesis of a mean value of zero. The p-value was 0.64, meaning that we cannot reject the null hypothesis. The mean value close to zero, the small spread of the residuals, and the result of the t-test indicate that there is an absence of any systematic bias in the analysis.
Figure 7 shows a comparison between the 20-year time series from CHIRPS against the in situ stations. CHIRPS shows a mean precipitation trend increase of 2.14 mm/year. In contrast, the in situ station recorded a mean precipitation trend decrease of −1.73 mm/year. The difference suggest that there might be a bias in the location of the stations while CHIRPS measure the trends for all grid cells in the Amazon Basin in a continuous surface. CHIRPS also records a smaller variation than the in situ stations due the larger number of pixels within the basin against fewer stations.
The plots for the synchronized records between the in situ stations and CHIRPS for the same time period are shown in Figure 8, Figure 9, Figure 10 and Figure 11. In general, the trends from the in situ stations are in agreement with the trends from CHIRPS. However, CHIRPS describe the spatial patterns of areas with increasing or decreasing precipitation trends in the Amazon Basin. In contrast, these patterns cannot be explained by using only in situ stations due the limited number of stations with long records and the sparse network.
Figure 11 also shows that only September has trends below 0 mm/month. All other months have slightly superior values, and the range is higher in the rainy season from November to May.

3.2. Synchronized Stations

In Figure 7 is a comparison between the 20-year time series from the in-situ stations and the CHIRPS of each pixel from which the stations were located. The probability density function (PDF) shows that the distribution of the CHIRPS cells is more concise and homogenous than the stations, and in better agreement with the CHIRPS distribution for the whole basin. The station dispersion has a wider wet and dry bias, with a higher maximum and minimum of considered outliers and a larger standard deviation. However, the mean values are similar, showing a small trend in precipitation for the whole basin. The in-situ stations show a slight decrease, and the CHIRPS per pixel shows a small increment in trends, similar to that obtained with CHIRPS across the whole basin.
The trends were also analyzed in synchronicity compared with the length of the station time series. Four clusters were obtained, and the same trends from CHIRPS were compared to the same station trends. The clusters were prepared according to date with the stations with 20 years or more of recorded data: Cluster 1 (1981–2017), Figure 8a; Cluster 2 (1981–2006), Figure 8b; Cluster 3 (1990–2007), Figure 8c; and Cluster 4 (1984–2006), Figure 8d.
In Figure 8, the stations and CHIRPS have the same adjustment in temporal resolution. Two stations shown in the figure were not in agreement with the presented trends. There was one in Upper Colombia with a positive trend and one in a negative trend cluster, and this was also found in the middle of Bolivia.
Figure 8b shows a more homogenous trend variation with fewer negative clusters and more positive trends, mainly in the north part of the basin. Two stations did not represent the overall trend in this cluster: one in Southeast Brazil, with a large positive trend in an average value region, and one in the north of Brazil, with a negative trend within a positive cluster.
In Figure 8d, the trends are similar to the main analysis from 1981 to 2017, shown in Figure 4 and Figure 7a. In the extreme west and north, the positive clusters increase, and there are more negative clusters in the central and south part of the basin.

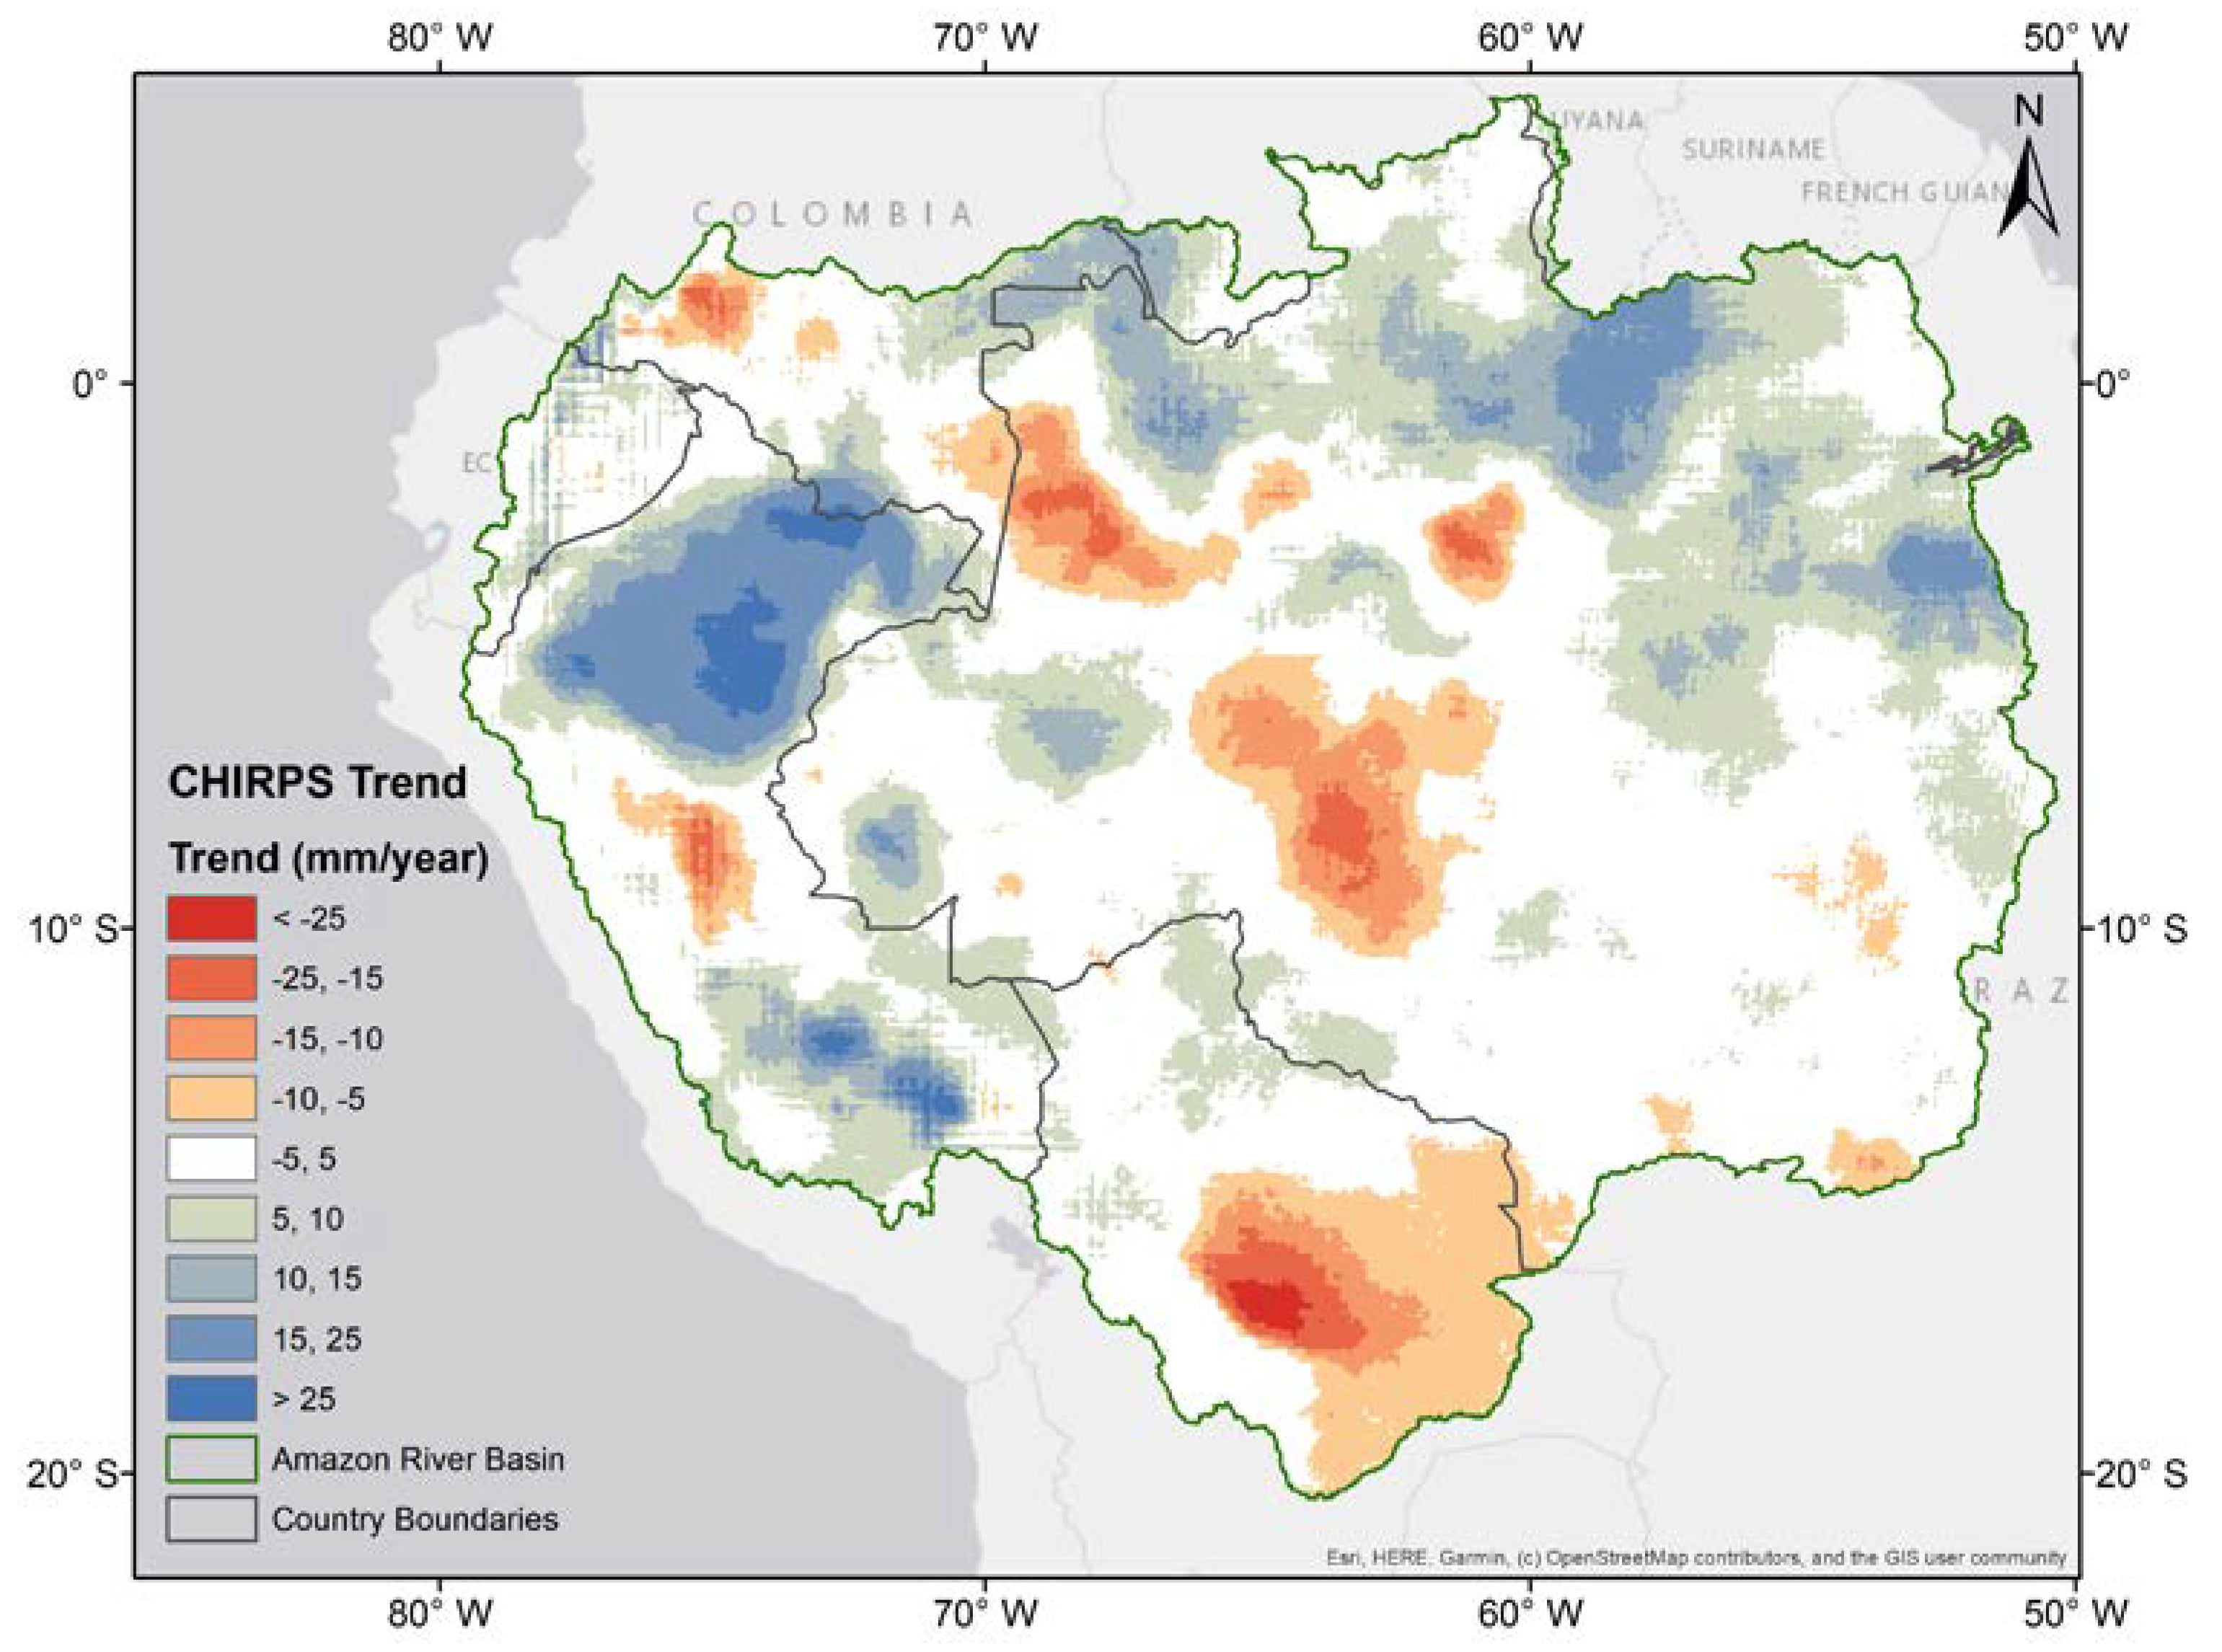
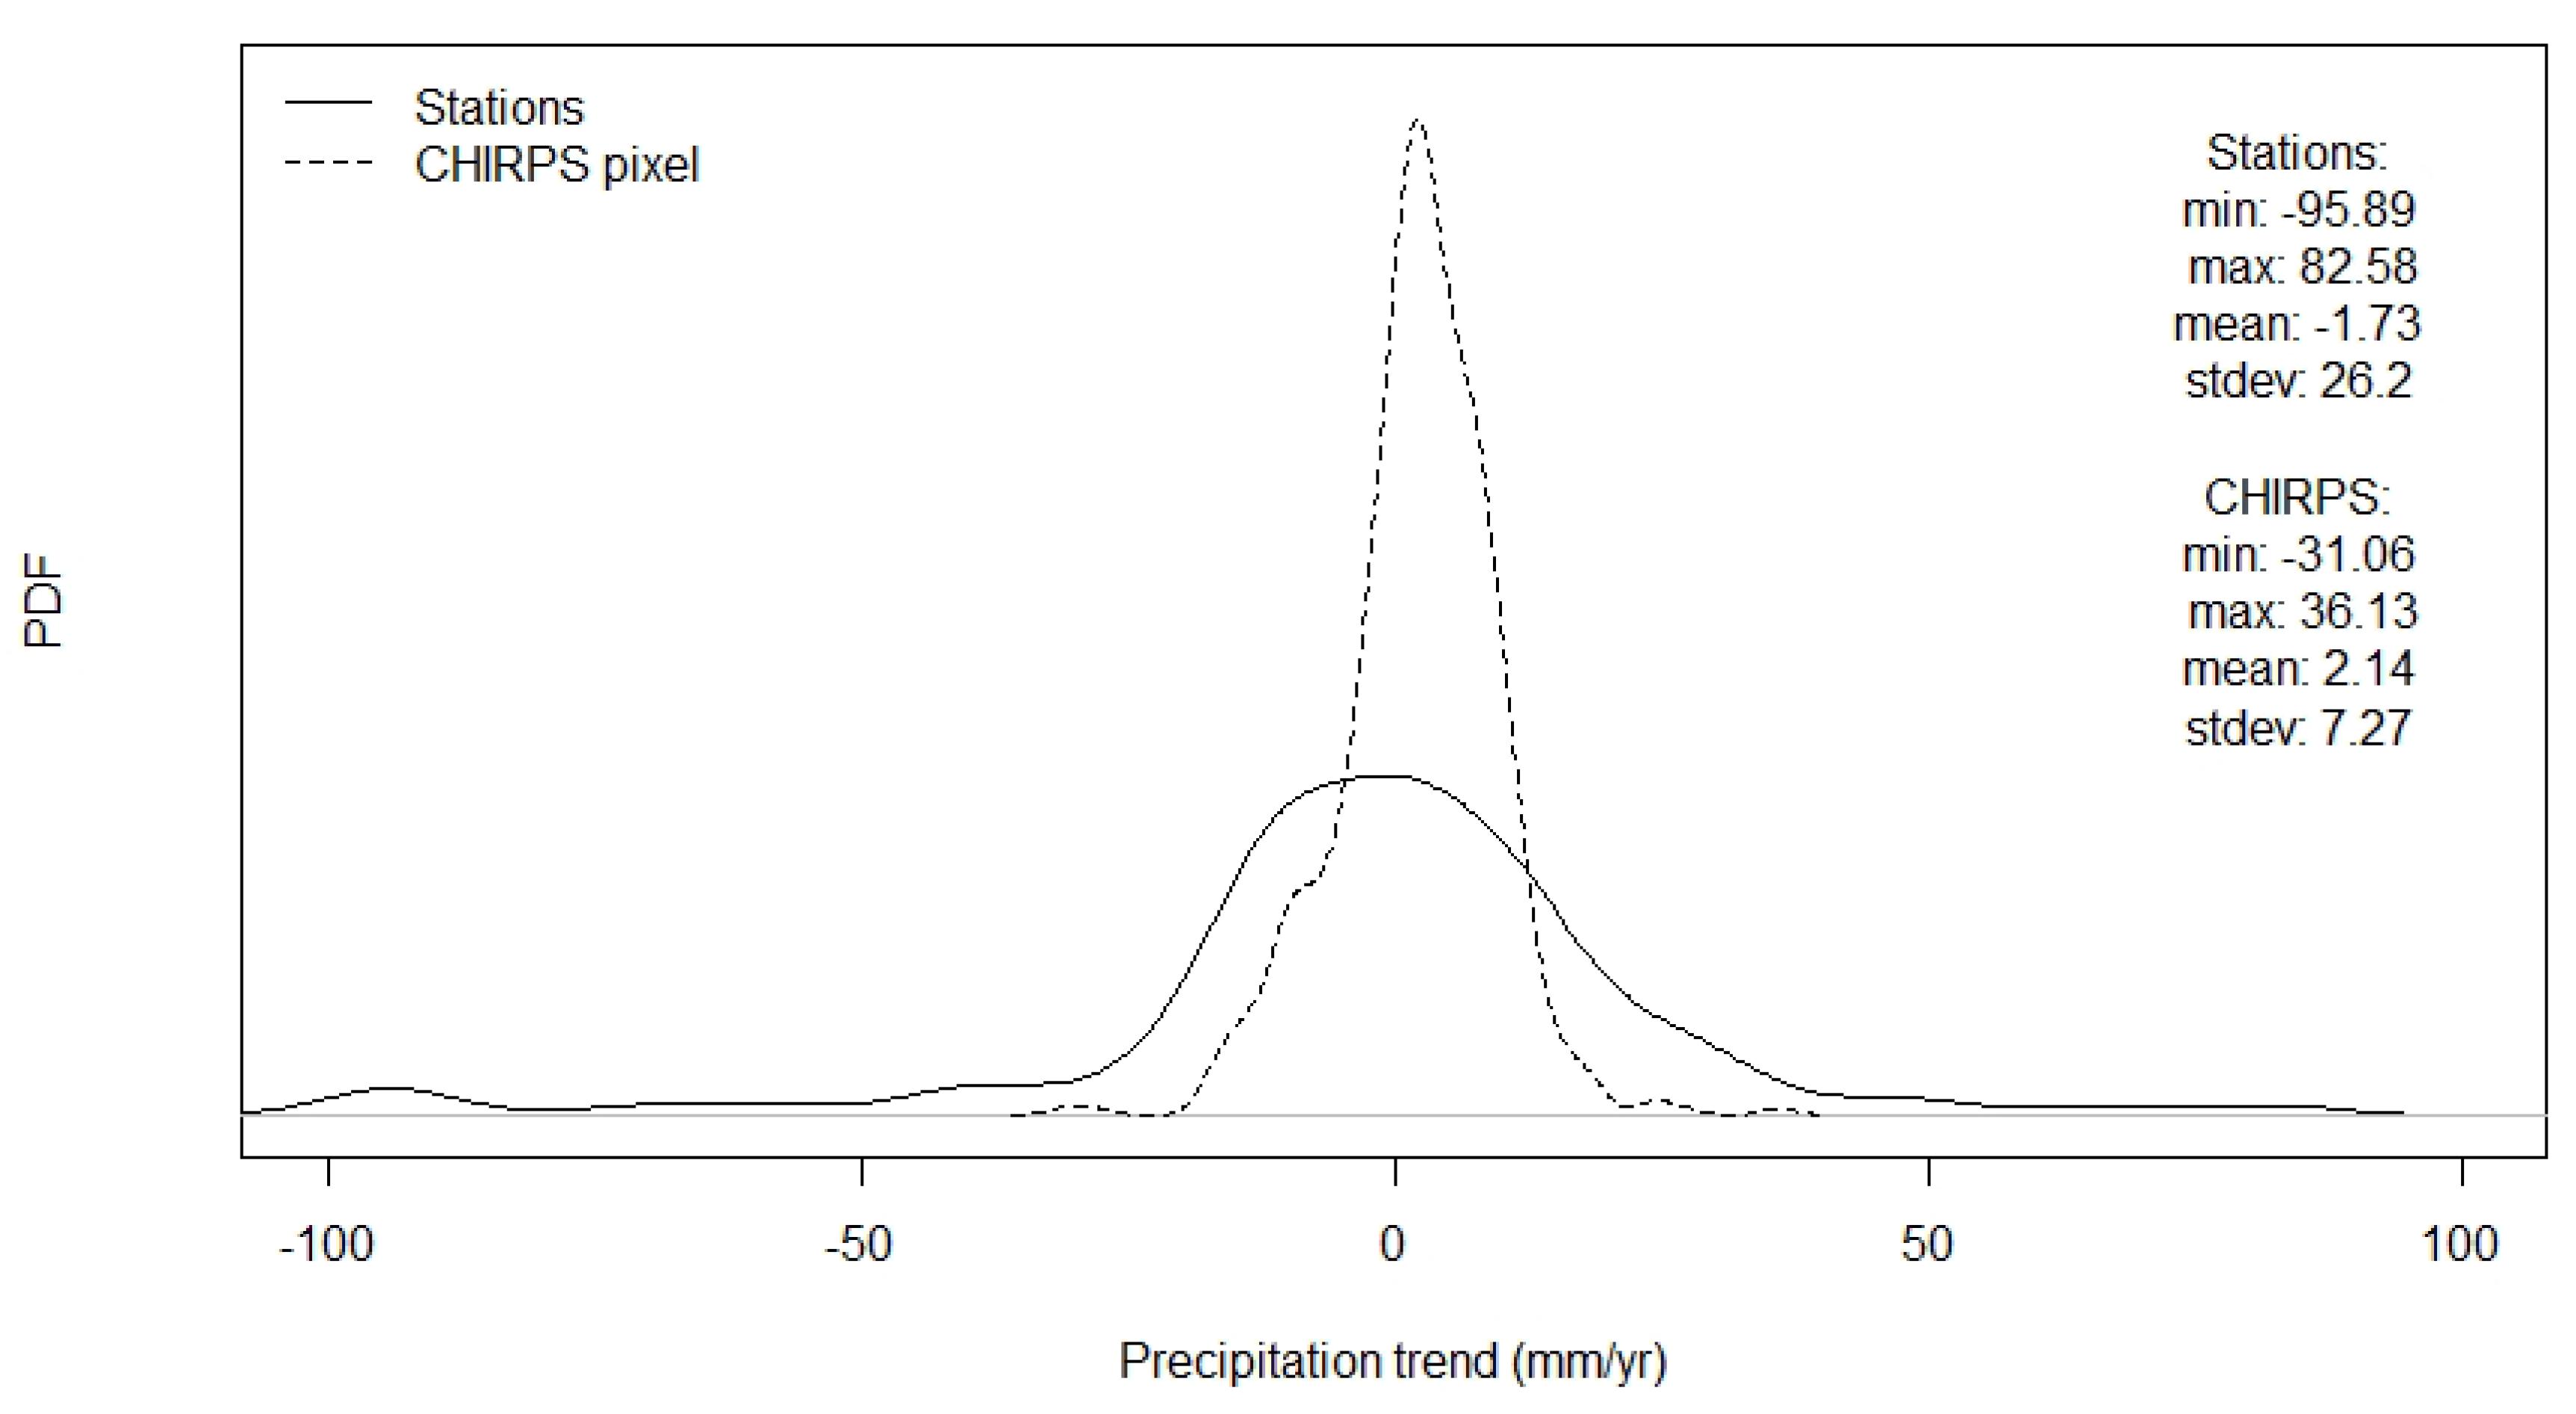
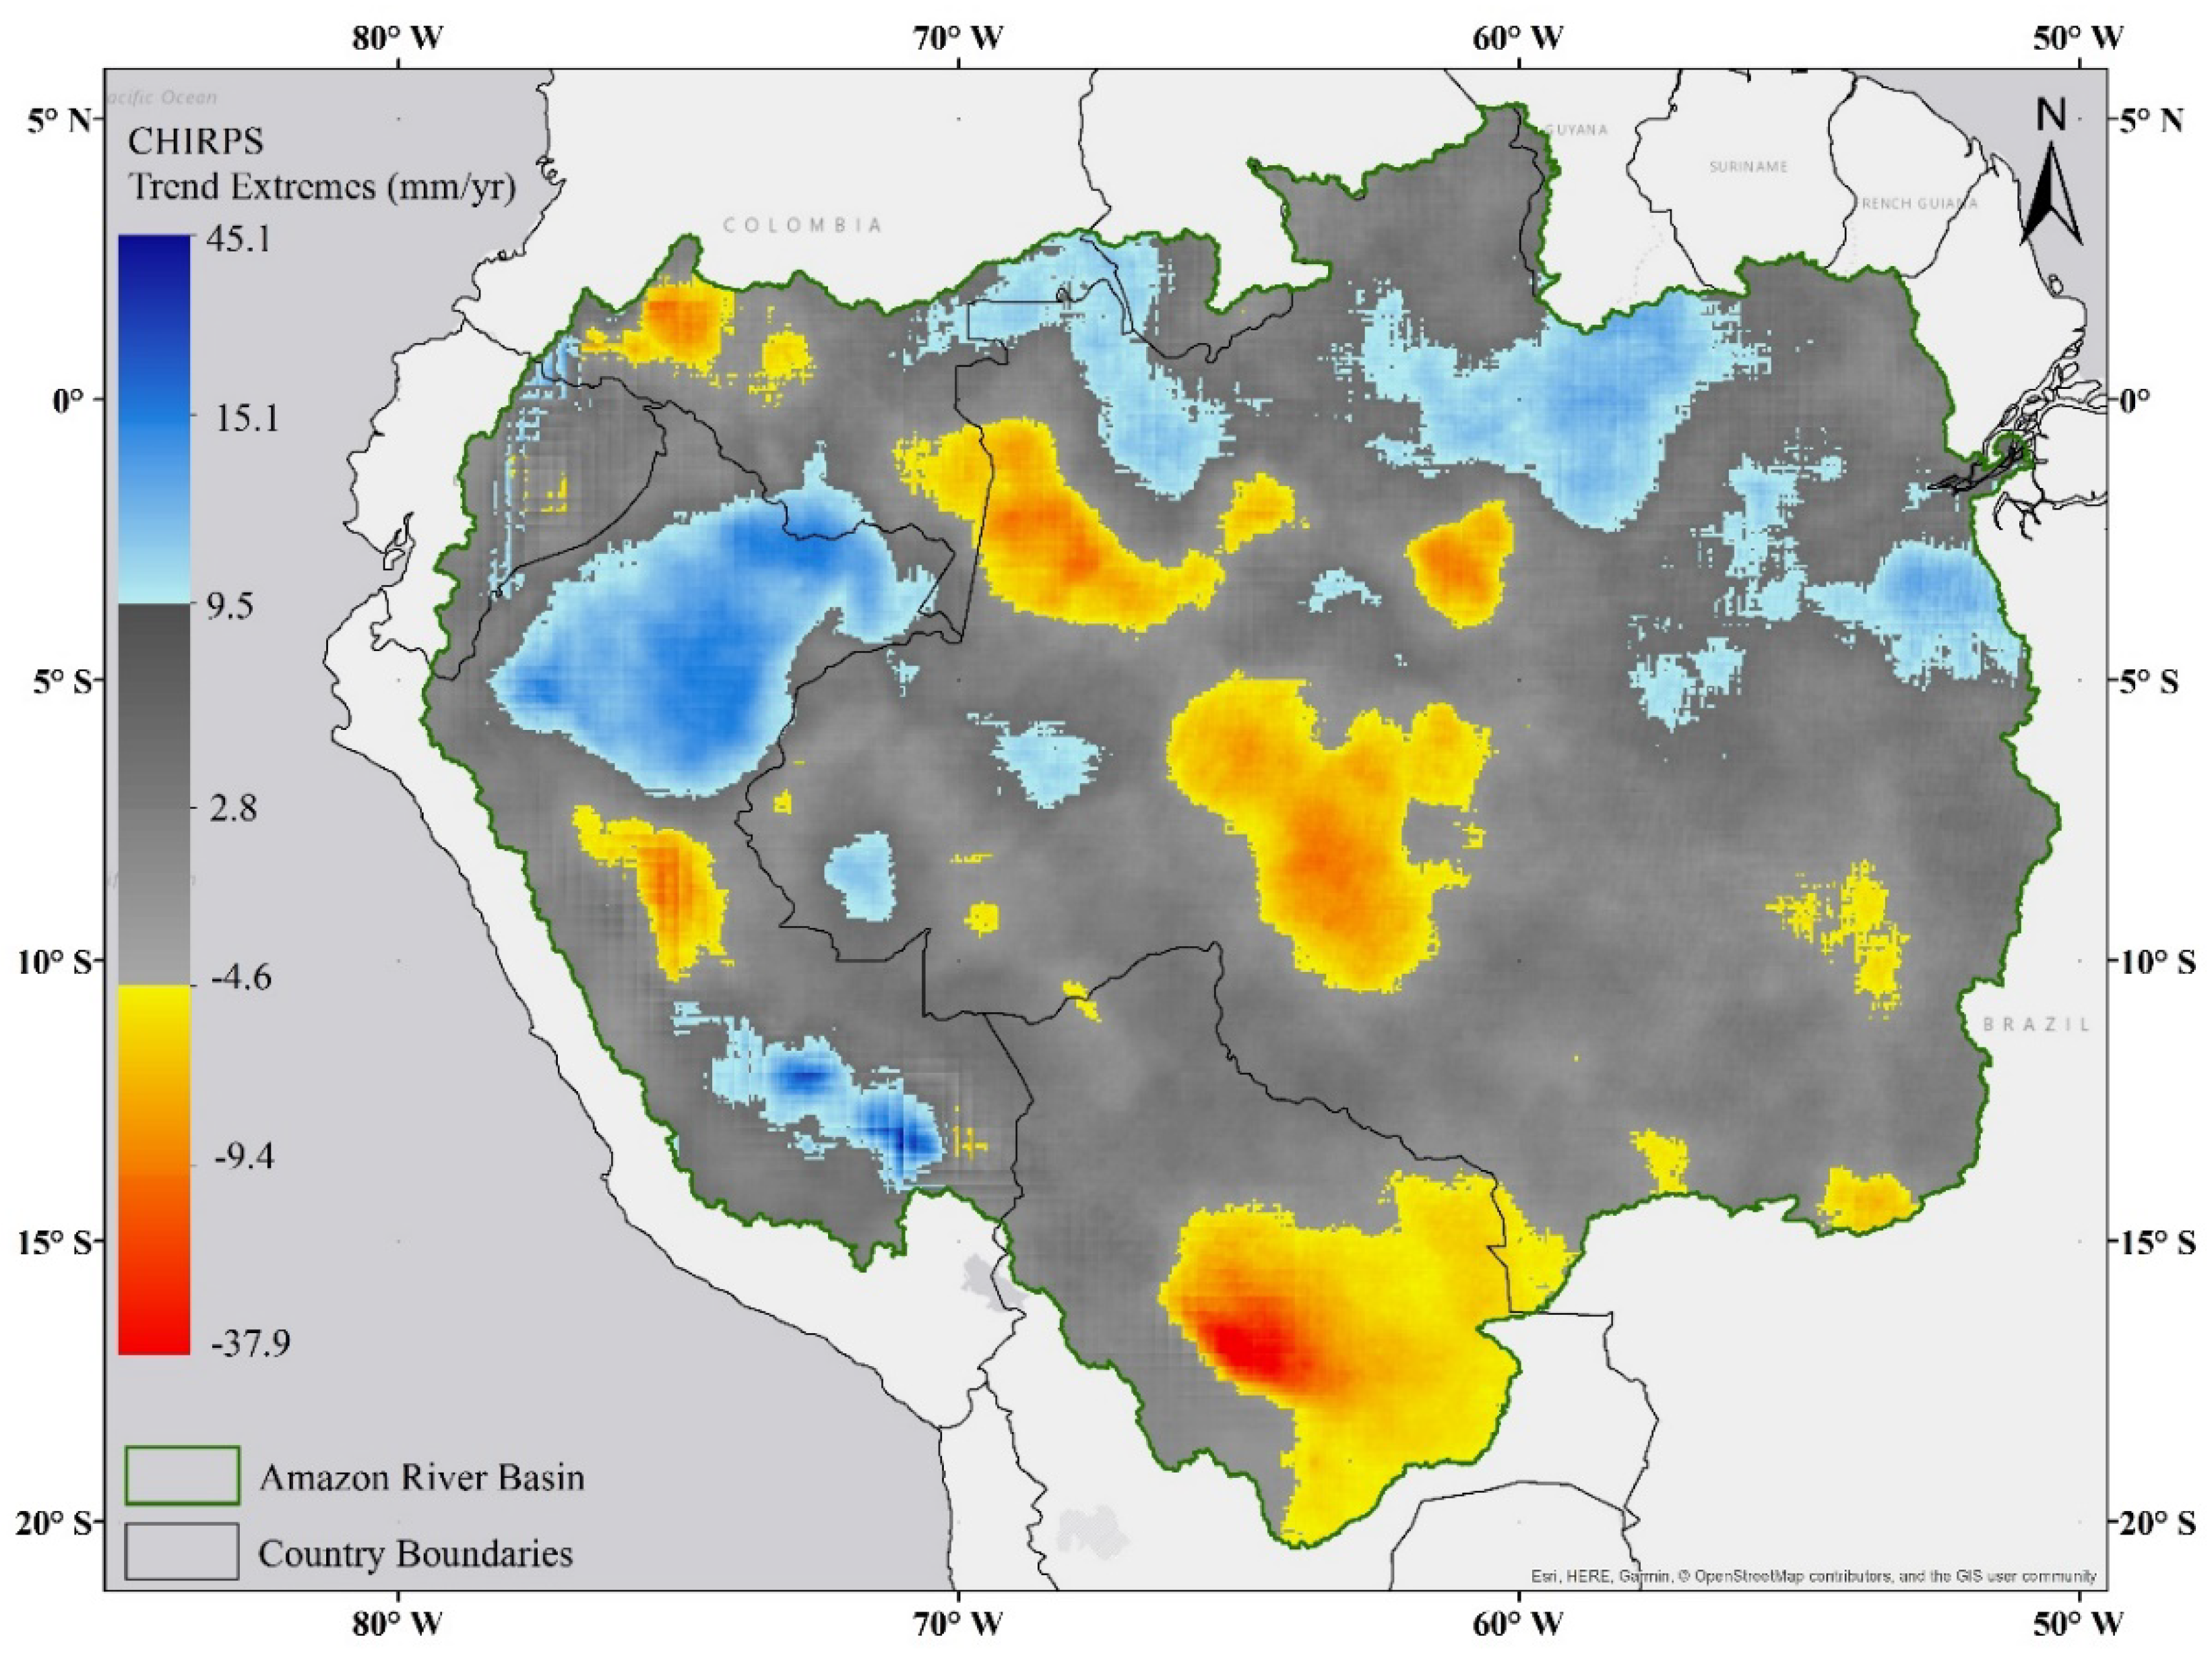
3.3. Trend Variability

There are 19 clusters of decreasing or increasing trends in the basin. The mean variation above or below 1 mm was used as a threshold to define these regions over the 37 years of the CHIRPS time series. These clusters were chosen based on the mean value, 2.8 mm/year, shown in Figure 11, and the standard deviation (σ) of 7.7 mm/year. This study obtained the trend values below 15th and above 85th percentiles of the overall trends for the basin, since the mean value is 2.8 mm/year, the standard deviation is 7.7 mm/year, and the total trend does not vary that much over the 37 years of the study. However, the variation in volume of water in the 19 clusters identified, loss or gain, are higher than the threshold, mean, and standard deviation, with values higher than 9.5 mm/year and lower than −4.6 mm/year.
The clusters with the most intense trend variations represent 26.1% of the basin, with an area of 1,564,034 km2. In Cuzco, Peru is where the highest trend of 45.1 mm is found, with an increase of 1713.8 mm in the total amount of variation over 37 years. The Santa Cruz de la Sierra is where the largest negative trend of −37.9 mm is located, with the total decrease being −1440.2 mm.
The threshold value for the minimum trend, below 15th percentile of the range value, was −4.6 mm/year. The total area with negative trends described in the table shows 874,114.8 km2, with a total loss volume of −244,337.1 km3 from the 37 years of the study.
The threshold value for the maximum trend, above 85th percentile of the range value, was 9.5 mm/year. The total area with positive trends described in the table shows 889,437.9 km2, with a total volume loss of 340,885.1 km3 over the 37 years of the study.
Overall, the mean monthly trend shows a slight increase, although the median ranges between 0 and 2 mm/month. The interquartile also shows, in general, an increasing precipitation trend. The interquartile patterns also follow the interannual precipitation distribution in the basin, with the rainy season staring in November–December, and the wet season followed by May–June, shown in Figure 11.

3.4. Evapotranspiration and CHIRPS Comparison

The ET was compared with precipitation for the years 2003–2013, as shown in Figure 12 and Figure 13. The ET product was obtained by the Water Accounting Group using ET-Amazon [20]. The ET-Amazon (Figure 12) is an ensemble product validated with the flux-towers in the Amazon Basin of the LBA-Project (http://lba2.inpa.gov.br), which merged 6 remote sensing products (GLEAM, SEBS, ALEXI, CMRSET, MOD16, and SSEBop), downscaled using the normalized difference vegetation index (NDVI). These two important parts of the water balance, with precipitation as input and evapotranspiration as approximately 50% of the output, were identified as the main influencers in the basin.
The precipitation trends over these 10 years (Figure 13) has a similar increasing pattern in the Marañon/Putumayo, Xingu/Tapajós, Negro, and Marañon/Madeira regions, and a decreasing range in Madeira, Tapajós, Xingu upstream, and Xingu/Tapajós. The overall slight precipitation trend increase from CHIRPS in the Amazon Basin agrees with the study presented by Vergopolan and Fisher [21], although the absolute magnitude of the precipitation trend increase varies due (1) the different time period of the studies and (2) the distinction in the former study of the trend calculation for deforested and intact forest areas.
Based on the comparison of the ET and precipitation patterns, there is a slight decrease in both Figure 12 and Figure 13 over 10 years in the quadrant 10° S, 70° W; 5° S, 60° W. However, the ET trends have a lower σ of 5.54, and a mean of 4.36 mm/year, and the precipitation is more distributed with an σ of 27.16, and a mean of 18.08 mm/year.
The ET has low variation, with an income increment of 9.9 mm/year and a decrease of −1.18 mm/year. The maximum and minimum values are considered outliers from the Andean regions of Colombia, Ecuador, and Peru, with the natural fields being located along the border of Brazil and Surinam, as well as the Bolivian Altiplano.
The variability in ET values recorded during the year is smoother than what was found with the precipitation values. On a monthly scale, evapotranspiration has lower variability, and there is a variation in precipitation between seasons, and this has a greater impact on such factors as ENSO and ITCZ.

4. Summary and Conclusions

The magnitude of the trends in the Amazon River Basin was determined by the composite analysis of 19 clusters. The trends obtained over 37 years show that the variability during these years did exceed much more than 2.8 mm/year. However, 10 negative clusters and 9 positive clusters were clearly identified, the mean volume of water loss was 244,337.1 km3, and the gain was 340,885.1 km3. There was an approximately 100,000 km3 increment in water volume over the 37-year study period.
The positive trends tended to be located towards the north and northwest regions of the basin. The negative trends tended to localize to the center and south of the basin.
There were three main clusters: one in Brazil in the Trombetas River basin, a larger cluster in Peru in the Marañon/Putumayo River basin, and a cluster with a higher trend with two centers in the Ucayali River basin.
There were three negative clusters: one in the Solimões River basin, one in Madeira/Solimões in Brazil, and the major one in the Madeira River basin in Bolivia.
There were no clearly observed trends between precipitation and ET. The period of analysis of only 10 years was not sufficient for drawing a conclusion between the two parameters. However, in the Andes and in the natural fields of Brazil and Surinam, where the respective negative and positive trends were higher, the precipitation shows a strong decrease, and the ET shows slight variations.
The relationship with ET trends has few impacts on precipitation trends for the same period. These trends in ET and precipitation provided by CHIRPS have an impact on accountability over the years and a huge impact on the period studied.
The data quality provided by CHIRPS is suitable for a basin as large as the Amazon River Basin, where a major river, large floodplains, and small streams affect societies. The advantage of this remote sensing product consists of a dataset that is constantly provided and standardized, with no influence from the boundaries between countries or any elaborated legal frontiers. Under these circumstances, a constant and continuous analysis of precipitation trends and consistency can be performed.

Author Contributions

Conceptualization V.H.d.M.P. and G.E.E.-D.; methodology V.H.d.M.P.; software development G.E.E.-D.; formal analysis and investigation V.H.d.M.P., D.M.M. and G.E.E.-D.; writing-original draft preparation V.H.d.M.P.; review and editing G.C. and G.E.E.-D. All authors have read and agreed to the published version of the manuscript.

Funding

V.H.d.M.P. was funded by CPRM—Geological Survey of Brazil to conduct this research in IHE-Delft facilities.

Acknowledgments

The authors acknowledge the Climate Hazards Center at UC Santa Barbara for providing the CHIRPS product and the availability of the time series, CPRM, ANA, INMET, SENAMHI-Bolivia, IDEAM, INAMHI, and SENAMHI-Peru. We also acknowledge Wim Bastiaanssen for initial support and IHE-Delft for providing the facilities for part of this study.

Conflicts of Interest

The authors declare no conflict of interest.

References

  1. Funk, C.; Verdin, A.; Michaelsen, J.; Peterson, P.; Pedreros, D.; Husak, G. A global satellite-assisted precipitation climatology. Earth Syst. Sci. Data 2015, 7, 275–287. [Google Scholar] [CrossRef] [Green Version]
  2. WMO. Guide to Meterological Instruments and Methods of Observation; WMO: Geneva, Switzerland, 2008. [Google Scholar]
  3. Victor Hugo da Motta, P.; de Aline Maria Meiguins, L.; de Andressa Macêdo Silva, A.; Julio Domingos Nunes, F.; de Johelder Eduardo Fornari, S. Condições de operação e implantação de estaçòes da rede hidrométrica da Amazônia Oriental, Estado do Pará. XIX Simpósio Bras. Recur. Hídricos 2011, 1–14. Available online: http://rigeo.cprm.gov.br/jspui/bitstream/doc/1119/1/Evento_Consid_Paca.pdf (accessed on 27 April 2020).
  4. Victor Hugo da Motta, P. Sobrevoo Para Verificar as Condições da Pista dos Ayaramã Perimetral Norte. YouTube (2012). Available online: https://www.youtube.com/watch?v=cAREsoWmPoc (accessed on 16 November 2015).
  5. Marengo, J.A. On the hydrological cycle of the Amazon basin; a historical review and current state-of-the-art. Rev. Bras. Meteorol. 2006, 21, 1–19. [Google Scholar]
  6. Insel, N.; Poulsen, C.J.; Ehlers, T.A.; Poulsen, C.J. Influence of the Andes Mountains on South American moisture transport, convection, and precipitation. Clim. Dyn. 2009, 35, 1477–1492. [Google Scholar] [CrossRef]
  7. Satge, F.; Bonnet, M.-P.; Gosset, M.; Carpio, J.M.; Lima, W.H.Y.; Zolá, R.P.; Timouk, F.; Garnier, J. Assessment of satellite rainfall products over the Andean plateau. Atmos. Res. 2016, 167, 1–14. [Google Scholar] [CrossRef]
  8. Val, A.L.; De Almeida-Val, V.M.F.; Fearnside, P.M.; Dos Santos, G.M.; Piedade, M.T.F.; Junk, W.; Nozawa, S.R.; Da Silva, S.T.; Dantas, F.A.D.C. Amazonia: Water Resources and Sustainability. In Waters of Brazil: Strategic Analysi; de Mattos Bicudo, C.E., Galizia Tundisi, J., Cortesão Barnsley Scheuenstuhl, M., Eds.; Springer International Publishing: Basel, Switzerland, 2017; pp. 73–88. [Google Scholar]
  9. Costa, M.H.; Foley, J.A. Trends in the hydrologic cycle of the Amazon Basin. J. Geophys. Res. Space Phys. 1999, 104, 14189–14198. [Google Scholar] [CrossRef]
  10. Rocha, V.M.; Da Silva, P.R.T.; Gomes, W.B.; Vergasta, L.A.; Jardine, A. Precipitation Recycling in the Amazon Basin: A Study Using the ECMWF Era-Interim Reanalysis Dataset. Geogr. Dep. Univ. Sao Paulo 2018, 35, 71–82. [Google Scholar] [CrossRef]
  11. Carvalho, L.M.V.; Jones, C.; Liebmann, B. The South Atlantic Convergence Zone: Intensity, Form, Persistence, and Relationships with Intraseasonal to Interannual Activity and Extreme Rainfall. J. Clim. 2004, 17, 88–108. [Google Scholar] [CrossRef] [Green Version]
  12. Espinoza, J.-C.; Marengo, J.A.; Ronchail, J.; Carpio, J.M.; Flores, L.N.; Guyot, J.L. The extreme 2014 flood in south-western Amazon basin: The role of tropical-subtropical South Atlantic SST gradient. Environ. Res. Lett. 2014, 9, 124007. [Google Scholar] [CrossRef]
  13. Foley, J.A.; Botta, A.; Coe, M.T.; Costa, M.H. El Niño-Southern oscillation and the climate, ecosystems and rivers of Amazonia. Glob. Biogeochem. Cycles 2002, 16, 1–20. [Google Scholar] [CrossRef]
  14. Ronchail, J.; Cochonneau, G.; Molinier, M.; Guyot, J.L.; Chaves, A.G.D.M.; Guimarães, V.; De Oliveira, E. Interannual rainfall variability in the Amazon basin and sea-surface temperatures in the equatorial Pacific and the tropical Atlantic Oceans. Int. J. Clim. 2002, 22, 1663–1686. [Google Scholar] [CrossRef]
  15. Bookhagen, B.; Strecker, M.R. Modern Andean Rainfall Variation during ENSO Cycles and its Impact on the Amazon Drainage Basin. In Neogene History of Western Amazonia and Its Significance for Modern Diversity; Hoorn, C., Vonhof, H., Wesselingh, F., Eds.; Blackwell Publishing: Oxford, UK, 2010. [Google Scholar]
  16. Funk, C.; Peterson, P.; Landsfeld, M.; Pedreros, D.; Verdin, J.; Shukla, S.; Husak, G.; Rowland, J.; Harrison, L.; Hoell, A.; et al. The climate hazards infrared precipitation with stations—A new environmental record for monitoring extremes. Sci. Data 2015, 2, 1–21. [Google Scholar] [CrossRef] [Green Version]
  17. Getirana, A.C.V.; Dutra, E.; Guimberteau, M.; Kam, J.; Li, H.; Decharme, B.; Zhang, Z.; Ducharne, A.; Boone, A.A.; Balsamo, G.; et al. Water Balance in the Amazon Basin from a Land Surface Model Ensemble. J. Hydrometeorol. 2014, 15, 2586–2614. [Google Scholar] [CrossRef] [Green Version]
  18. Lorenz, C.; Kunstmann, H.; Devaraju, B.; Tourian, M.J.; Sneeuw, N.; Riegger, J. Large-Scale Runoff from Landmasses: A Global Assessment of the Closure of the Hydrological and Atmospheric Water Balances. J. Hydrometeorol. 2014, 15, 2111–2139. [Google Scholar] [CrossRef]
  19. Coe, M.; Macedo, M.N.; Brando, P.; Lefebvre, P.; Panday, P.; Silvério, D.V. The Hydrology and Energy Balance of the Amazon Basin. Ecol. Stud. 2016, 227, 35–53. [Google Scholar]
  20. Paca, V.H.D.M.; Espinoza-Dávalos, G.E.; Hessels, T.M.; Moreira, D.M.; Comair, G.F.; Bastiaanssen, W.G.M. The spatial variability of actual evapotranspiration across the Amazon River Basin based on remote sensing products validated with flux towers. Ecol. Process. 2019, 8, 6. [Google Scholar] [CrossRef] [Green Version]
  21. Vergopolan, N.; Fisher, J.B. The impact of deforestation on the hydrological cycle in Amazonia as observed from remote sensing. Int. J. Remote. Sens. 2016, 37, 5412–5430. [Google Scholar] [CrossRef]
  22. Barichivich, J.; Gloor, E.; Peylin, P.; Brienen, R.J.W.; Schöngart, J.; Espinoza, J.-C.; Pattnayak, K. Recent intensification of Amazon flooding extremes driven by strengthened Walker circulation. Sci. Adv. 2018, 4. [Google Scholar] [CrossRef] [Green Version]
  23. Marengo, J.A.; Espinoza, J.-C. Extreme seasonal droughts and floods in Amazonia: Causes, trends and impacts. Int. J. Clim. 2015, 36, 1033–1050. [Google Scholar] [CrossRef]
  24. Marengo, J.; Tomasella, J.; Soares, W.R.; Alves, L.M.; Nobre, C.A. Extreme climatic events in the Amazon basin. Theor. Appl. Clim. 2011, 107, 73–85. [Google Scholar] [CrossRef]
  25. Molion, L.C.B. A climatologia dinâmica da regiao amazonica: Mecanismos de precipitação. Rev. Bras. Meteorol. 1987, 2, 107–117. [Google Scholar]
  26. Marengo, J.A.; Liebmann, B.; Kousky, V.E.; Filizola, N.P.; Wainer, I.E.K.C. Onset and End of the Rainy Season in the Brazilian Amazon Basin. J. Clim. 2001, 14, 833–852. [Google Scholar] [CrossRef] [Green Version]
  27. Liebmann, B.; Marengo, J. Interannual Variability of the Rainy Season and Rainfall in the Brazilian Amazon Basin. J. Clim. 2001, 14, 4308–4318. [Google Scholar] [CrossRef] [Green Version]
  28. Marengo, J.A. Interdecadal variability and trends of rainfall across the Amazon basin. Theor. Appl. Clim. 2004, 78, 79–96. [Google Scholar] [CrossRef]
  29. Nobre, C.A.; Obregón, G.O.; Marengo, J.A. Características do Clima Amazônico: Aspectos Principais. Amaz. Glob. Chang. 2009, 149–162. [Google Scholar] [CrossRef]
  30. Villar, J.C.E.; Ronchail, J.; Guyot, J.L.; Cochonneau, G.; Naziano, F.; Lavado, W.; De Oliveira, E.; Pombosa, R.; Vauchel, P.; Lavado, W. Spatio-temporal rainfall variability in the Amazon basin countries (Brazil, Peru, Bolivia, Colombia, and Ecuador). Int. J. Clim. 2009, 29, 1574–1594. [Google Scholar] [CrossRef] [Green Version]
  31. Espinoza, J.-C.; Ronchail, J.; Marengo, J.A.; Segura, H. Contrasting North–South changes in Amazon wet-day and dry-day frequency and related atmospheric features (1981–2017). Clim. Dyn. 2018, 52, 5413–5430. [Google Scholar] [CrossRef]
  32. Almeida, C.T.; Oliveira-Júnior, J.F.; Delgado, R.C.; Cubo, P.; Ramos, M.C. Spatiotemporal rainfall and temperature trends throughout the Brazilian Legal Amazon, 1973–2013. Int. J. Clim. 2016, 37, 2013–2026. [Google Scholar] [CrossRef]
  33. Lavado, W.; Labat, D.; Ronchail, J.; Espinoza, J.-C.; Guyot, J.L. Trends in rainfall and temperature in the Peruvian Amazon-Andes basin over the last 40 years (1965–2007). Hydrol. Process. 2012, 27, 2944–2957. [Google Scholar] [CrossRef]
  34. Vicente-Serrano, S.; Chura, O.; López-Moreno, J.I.; Azorin-Molina, C.; Sanchez-Lorenzo, A.; Aguilar, E.; Morán-Tejeda, E.; Trujillo, F.; Martinez, R.; Nieto, J.J. Spatio-temporal variability of droughts in Bolivia: 1955–2012. Int. J. Clim. 2014, 35, 3024–3040. [Google Scholar] [CrossRef] [Green Version]
  35. Seiler, C.; Hutjes, R.W.A.; Kabat, P. Climate Variability and Trends in Bolivia. J. Appl. Meteorol. Clim. 2013, 52, 130–146. [Google Scholar] [CrossRef] [Green Version]
  36. Zubieta, R.; Saavedra, M.; Espinoza, J.-C.; Ronchail, J.; Sulca, J.; Drapeau, G.; Martin-Vide, J. Assessing precipitation concentration in the Amazon basin from different satellite-based data sets. Int. J. Clim. 2019, 39, 3171–3187. [Google Scholar] [CrossRef]
  37. Mastrantonas, N.; Bhattacharya, B.; Shibuo, Y.; Rasmy, M.; Espinoza-Dávalos, G.; Solomatine, D. Evaluating the Benefits of Merging Near-Real-Time Satellite Precipitation Products: A Case Study in the Kinu Basin Region, Japan. J. Hydrometeorol. 2019, 20, 1213–1233. [Google Scholar] [CrossRef]
  38. Karimi, P.; Bastiaanssen, W.G.M. Spatial evapotranspiration, rainfall and land use data in water accounting—Part 1: Review of the accuracy of the remote sensing data. Hydrol. Earth Syst. Sci. 2015, 19, 507–532. [Google Scholar] [CrossRef] [Green Version]
  39. Le, A.M.; Pricope, N.G. Increasing the accuracy of runoffand streamflow simulation in the Nzoia Basin, Western Kenya, through the incorporation of satellite-derived CHIRPS data. Water 2017, 9, 114. [Google Scholar] [CrossRef]
  40. Bai, P.; Liu, X. Evaluation of Five Satellite-Based Precipitation Products in Two Gauge-Scarce Basins on the Tibetan Plateau. Remote. Sens. 2018, 10, 1316. [Google Scholar] [CrossRef] [Green Version]
  41. Luo, X.; Wu, W.; He, D.-M.; Li, Y.; Ji, X. Hydrological Simulation Using TRMM and CHIRPS Precipitation Estimates in the Lower Lancang-Mekong River Basin. Chin. Geogr. Sci. 2019, 29, 13–25. [Google Scholar] [CrossRef] [Green Version]
  42. Bai, L.; Shi, C.; Li, L.; Yang, Y.; Wu, J. Accuracy of CHIRPS Satellite-Rainfall Products over Mainland China. Remote. Sens. 2018, 10, 362. [Google Scholar] [CrossRef] [Green Version]
  43. Trejo, F.J.P.; Barbosa, H.A.; Peñaloza-Murillo, M.A.; Moreno, M.A.; Farías, A. Intercomparison of improved satellite rainfall estimation with CHIRPS gridded product and rain gauge data over Venezuela. Atmósfera 2016, 29, 323–342. [Google Scholar] [CrossRef] [Green Version]
  44. Paredes-Trejo, F.J.; Barbosa, H.A.; Kumar, T.L. Validating CHIRPS-based satellite precipitation estimates in Northeast Brazil. J. Arid. Environ. 2017, 139, 26–40. [Google Scholar] [CrossRef]
  45. Toté, C.; Patricio, D.; Boogaard, H.; Van Der Wijngaart, R.; Tarnavsky, E.; Funk, C. Evaluation of Satellite Rainfall Estimates for Drought and Flood Monitoring in Mozambique. Remote. Sens. 2015, 7, 1758–1776. [Google Scholar] [CrossRef] [Green Version]
  46. CPRM. Relatório Anual Serviço Geológico do Brasil; Ministério de Minas e Energia: Brasília, Brazil, 2013.
  47. Delahaye, F.; Kirstetter, P.-E.; Dubreuil, V.; Machado, L.A.T.; Vila, D.; Clark, R. A consistent gauge database for daily rainfall analysis over the Legal Brazilian Amazon. J. Hydrol. 2015, 527, 292–304. [Google Scholar] [CrossRef]
  48. De Paiva, R.C.D.; Buarque, D.; Clarke, R.T.; Collischonn, W.; Allasia, D.G. Reduced precipitation over large water bodies in the Brazilian Amazon shown from TRMM data. Geophys. Res. Lett. 2011, 38, 2–6. [Google Scholar] [CrossRef]
  49. Huffman, G.J.; Bolvin, D.T.; Nelkin, E.J.; Wolff, D.B.; Adler, R.F.; Gu, G.; Hong, Y.; Bowman, K.P.; Stocker, E.F. The TRMM Multisatellite Precipitation Analysis (TMPA): Quasi-Global, Multiyear, Combined-Sensor Precipitation Estimates at Fine Scales. J. Hydrometeorol. 2007, 8, 38–55. [Google Scholar] [CrossRef]
  50. Serrat-Capdevila, A.; Valdés, J.B.; Stakhiv, E.Z. Water Management Applications for Satellite Precipitation Products: Synthesis and Recommendations. J. Am. Water Resour. Assoc. 2013, 50, 509–525. [Google Scholar] [CrossRef]
  51. Beck, H.; Vergopolan, N.; Pan, M.; Levizzani, V.; Van Dijk, A.; Weedon, G.P.; Brocca, L.; Pappenberger, F.; Huffman, G.J.; Wood, E.F. Global-scale evaluation of 22 precipitation datasets using gauge observations and hydrological modeling. Hydrol. Earth Syst. Sci. 2017, 21, 6201–6217. [Google Scholar] [CrossRef] [Green Version]
Figure 1. Location of precipitation gauging stations and major streams in the Amazon River Basin.
Water 12 01244 g001
Figure 2. Absolute annual mean values from CHIRPS and the in-situ precipitation (P) stations (black points), with one-to-one (blue) and trend (red) lines.
Water 12 01244 g002
Figure 3. Absolute annual mean values from CHIRPS and the in-situ P stations with more than 20 years of data (black points), with one-to-one (blue) and regression (red) lines.
Water 12 01244 g003
Figure 4. CHIRPS trends from 1981 to 2017.
Water 12 01244 g004
Figure 5. CHIRPS variation and trends from the in-situ precipitation stations.
Water 12 01244 g005
Figure 6. Residuals of the difference between precipitation trends estimated using CHIRPS and station data (mm/year) from 1981 to 2017 (top) and its histogram (bottom) centered at a mean value of −2.37 mm/year.
Water 12 01244 g006
Figure 7. Probability density function (PDF) comparison between the 20-year time series from the in situ stations and the CHIRPS per single pixel with stations.
Water 12 01244 g007
Figure 8. Synchronized patterns of stations from (a) Cluster 1, years 1981–2017, (b) Cluster 2, years 1981–2006, (c) Cluster 3, years 1990–2007, and (d) Cluster 4, years 1984–2006.
Water 12 01244 g008aWater 12 01244 g008bWater 12 01244 g008c
Figure 9. Clusters of increasing precipitation trends above the 85th percentile (blue) from 9.5 to 45.1 mm/year and clusters of decreasing precipitation below the 15th percentile between −4.6 to −31.9 mm/year using 37 years of the CHIRPS precipitation product.
Water 12 01244 g009
Figure 10. Main rivers and sub-basins.
Water 12 01244 g010
Figure 11. CHIRPS precipitation trend per month average.
Water 12 01244 g011
Figure 12. Evapotranspiration trends from 2003 to 2013 in the Amazon Basin.
Water 12 01244 g012
Figure 13. CHIRPS precipitation trends from 2003 to 2013 in the Amazon Basin.
Water 12 01244 g013
Table 1. Climate Hazards Group InfraRed Precipitation with Station data (CHIRPS) and ground station descriptions.
ProductMain Principle ProductsResolutionSpatial CoverageMinimum Time Steps IntervalProducer
CHIRPSTMPA, TRMM 3B42-RT/3B42/2B31, CMORPH, ground stations0.05°50° N–SdailyClimate Hazards Group (CHG)
Ground stationsDirect ObservationsLocally basedIn situ measurementsdailyLocal Institutions
Table 2. Clusters with negative trends.
Sub-BasinCountryArea (km2)Max Trend (mm/year) Mean Trend (mm/year)p-ValueVolume (km3/year)Volume (km3) (1981–2017)
Xingu Brazil24,290.6−8.2 −5.30.46−119.1−4409.5
SolimõesBrazil35,366.3−17.5−7.4-−264.9−9801.4
Madeira/SolimõesBrazil231,532.9−19.3−5.40.04−1190.4−44045.6
Tapajós Brazil8096.8−7.1−5.0-−40.5−1501.2
NegroBrazil/Colombia139,569.6−19.7−7.50.94−745.0−27,565.6
Marañon/UcayaliPeru 48,364.6−19.5−5.5-−266.3−1365.4
Madeira/PurusBrazil 6824.1−10.1−5.4-−36.9−82,720.9
MadeiraBolivia 322,710.8−37.9−5.10.20−1662.4−61,510.3
Caquetá/Japurá Colombia41,269.7−19.8−5.20.42−217.3−8041.9
Xingu/TapajósBrazil 16,085.4−12.0−5.6-−91.2−3375.3
Total-874,110.8−37.9−5.7 −4634.0−244,337.1
Table 3. Clusters with positive trends.
Sub-BasinCountryArea (km2)Max Trend (mm/year) Mean Trend (mm/year)p-ValueVolume (km3/year)Volume (km3) (1981–2017)
Abacaxis Brazil 5361.813.09.80.3852.71951.4
Juruá DownstreamBrazil21,799.215.29.9-217.08031.1
Juruá/Purus Brazil17,304.016.712.40.64215.17960.8
UcayaliPeru 71,490.845.110.7-771.328,539.5
Marañon Peru 308,927.129.410.60.013290.3121,744.6
NapoEcuador12,917.023.7 10.90.14140.85212.0
NegroBrazil/Colombia122,698.917.610.00.041236.945,768.5
TrombetasBrazil203,640.622.810.00.242039.575,464.1
Xingu downstream Brazil125,298.521.9 9.90.271249.046,213.1
Total-889,437.945.110.4-9212.6340,885.1

