Article

High-Resolution Mapping of Japanese Microplastic and Macroplastic Emissions from the Land into the Sea

1
Department of Civil Engineering, Faculty of Science and Technology, Tokyo University of Science, Chiba 278-8510, Japan
2
Business Planning and Development Division, Yachiyo Engineering Co., Ltd., Tokyo 111-8648, Japan
*
Author to whom correspondence should be addressed.
Water 2020, 12(4), 951; https://doi.org/10.3390/w12040951
Submission received: 22 February 2020 / Revised: 24 March 2020 / Accepted: 25 March 2020 / Published: 27 March 2020
(This article belongs to the Section Water Quality and Contamination)

Abstract

:
Plastic debris presents a serious hazard to marine ecosystems worldwide. In this study, we developed a method to evaluate high-resolution maps of plastic emissions from the land into the sea offshore of Japan without using mismanaged plastic waste. Plastics were divided into microplastics (MicPs) and macroplastics (MacPs), and correlations between the observed MicP concentrations in rivers and basin characteristics, such as the urban area ratio and population density, were used to evaluate nationwide MicP concentration maps. A simple water balance analysis was used to calculate the annual outflow for each 1 km mesh to obtain the final MicP emissions, and the MacP input was evaluated based on the MicP emissions and the ratio of MacP/MicP obtained according to previous studies. Concentration data revealed that the MicP concentrations and basin characteristics were significantly and positively correlated. Water balance analyses demonstrated that our methods performed well for evaluating the annual flow rate, while reducing the computational load. The total plastic input (MicP + MacP) was widely distributed from 210–4776 t/yr and a map showed that plastic emissions were high for densely populated and highly urbanized areas in the Tokyo metropolitan area, as well as other large urban areas, especially Nagoya and Osaka. These results provide important insights that may be used to develop countermeasures against plastic pollution and the methods employed herein can also be used to evaluate plastic emissions in other regions.

1. Introduction

The use of plastic has spread worldwide since the 1950s, with plastic production reaching 322 million tons by 2015 [1]. Plastic has become an indispensable part of our lives owing to its many advantages, including its light weight, robustness, and relative insolubility in water [2,3]. However, these advantages become disadvantageous when plastic is released into the environment, where it can be transported over large distances, does not decompose naturally, and is likely to persist [2,4]. Consequently, plastic is a very environmentally troublesome substance. For many years, plastic pollution in the ocean has been regarded as a global environmental issue [4,5,6,7,8,9]. Derrack [7] summarized previous studies and noted that plastics account for the majority of marine litter. Marine waste was originally thought to be derived from fishing and recreational activities [10]; however, studies have determined that much of the marine debris comes from land-based waste, primarily waste transported via rivers [4,5,11,12].
Plastic waste is roughly classified as either microplastic (MicP) that is <5 mm in size or macroplastic (MacP) that is ≥5 mm in size [13]. MicP is further divided into two classes: (1) primary microplastics that were ≤ 5 mm in size at their time of production (e.g., resin pellets,) and (2) secondary microplastics that were originally MacP and have been decomposed and/or fragmented (e.g., by ultraviolet rays, heat from sunlight, physical and biological fragmentation). In recent years, extensive attention has been paid to contamination by MicP. Microplastic contamination in the oceans was already being measured in the 1960s and 1970s [14,15]. Considering the increases in plastic production since the 1950s, plastic pollution in the ocean has also increased overall. According to Eriksen et al. [16], it has recently been estimated that at least 5.25 trillion plastic particles (0.27 million tons) are floating in the world’s oceans. Meanwhile, MicP can absorb harmful chemical substances, such as polychlorinated biphenyls (PCBs) and dichlorodiphenyltrichloroethane (DDT) [17,18,19], and when the particles do not sink in the water column, they may act as carriers for dispersing these chemicals over a wide area. Due to the small size of MicP, it can also be ingested by organisms of various sizes, thus raising concerns about its serious impact on ecosystems worldwide [20,21,22,23].
When MicP flows into the ocean, it is difficult to recover. It is therefore necessary to take measures to prevent the occurrence of MicP in rivers and on land before it can enter the ocean. To that end, it is necessary to understand the reality of MicP pollution in rivers and on land, as well as to evaluate the MicP and MacP inputs from the land to the ocean. Since plastic pollution has become a problem in the oceans, many surveys of marine MicP have been conducted [24,25,26,27,28,29]. Following the studies on MicP in the oceans, the number of studies on MicP in rivers and lakes has also increased [30,31,32,33,34,35,36,37,38,39,40]. For example, Yonkos et al. [34] measured the MicP concentrations in four rivers that flow into the Chesapeake Bay in Virginia, USA, and showed that MicP contamination in rivers was related to population density and urbanization. Similar trends have been confirmed by other studies [32,33]. In a previous study [40], we found a significant correlation between the MicP contamination in rivers and basin characteristics (here, the population density and the urban area ratio, i.e., the ratio of urbanized to all areas), based on survey results from 29 rivers and 35 locations in Japan. A significant correlation between the MicP contamination in rivers and water quality (biochemical oxygen demand, BOD) was also indicated.
Several evaluations of plastic inflow from land to the ocean on a global scale have been conducted [12,41,42,43]. Jambeck et al. [12] calculated the inflow of terrestrial plastics from 192 countries worldwide within 50 km of a coastline and found a global annual input of 4.8 × 10⁶ to 12.7 × 10⁶ t/yr. They assumed that plastic waste flowing into the ocean was proportional to the amount of mismanaged plastic waste (MMPW). However, sources of plastic waste are not limited to areas near the coast; the waste from inland areas should also be considered. Other problems in their studies are that plastic waste is not generally evaluated by its size class, and verifying the input of plastics into the ocean based on measured data is insufficient.
Lebreton et al. [41] created an empirical formula linking MMPW, hydrological (rainfall), and plastic inflow observations. Based on this relationship, the global plastic input was found to range from 1.15 × 10⁶ to 2.41 × 10⁶ t/yr. This calculation also involved dividing plastics by size into MicP and MacP fractions. Schmidt et al. [42] also used this concept, but increased the amount of observational plastic inflow data used. They calculated a global plastic input of 0.47 × 10⁶ to 2.75 × 10⁶ t/yr. As all of these results included MMPW, their accuracies depend on how well the calculated MMPW matches the actual amount. In general, MMPW is evaluated at a country level, but since it differs depending upon the waste management in each country, it has been challenging to evaluate precisely the amount of MMPW for each country. Additionally, both Lebreton et al. [41] and Schmidt et al. [42] evaluated plastic emissions from large river basins only, without including medium-sized or smaller basins. An evaluation using gridding of the entire land area is desirable.
In this study, we propose a new method of evaluating high-resolution maps of plastic emissions without using MMPW and attempt to evaluate the Japanese plastic input from the land to the sea. Here, as in the studies of Lebreton et al. [41] and Schmidt et al. [42], plastics were divided into MicP and MacP fractions. Using this approach, we examined the relationships between the observed MicP concentrations in 70 Japanese rivers and land area data, such as the urban area ratio and population density. Numerical concentrations (particles/m3) and mass concentrations (mg/m3) of the MicP fraction were analyzed as the target MicP concentrations in this study. We then prepared a countrywide MicP concentration map using a 1 km mesh-size based on the land area data. In accordance with a simple water balance analysis model, we calculated the annual flow rate across each 1 km mesh to obtain the final MicP emissions from the product of the MicP concentrations and flow rate, and calculated the annual MicP number and mass inputs from the land to the sea. We also estimated the MacP mass concentrations from the MicP mass concentrations and the ratio of MacP/MicP determined by previous studies [41,42] that collected the observed MacP and MicP concentrations. We then calculated the MacP mass emissions from the product of the MacP concentrations and the flow rate and then calculated plastic input, which was taken as the sum of MicP and MacP. From these results, we were able to estimate not only the total mass of plastic inputs, but also their regional properties (by river basin or administrative district). Our goals in this research were to generate new insights that may be used to draft countermeasures against plastic emissions, thereby reducing marine pollution outflow from Japan, and to introduce methods that may also be applied to evaluate plastic inputs in other regions of the world.

2. Materials and Methods

2.1. Conceptual Foundation for Evaluating Plastic input

The conceptual framework used in this study to evaluate plastic input from land to the sea is shown schematically in Figure 1. Step 1 involves evaluating the MicP and MacP concentrations in a land area and Step 2 includes calculating the outflow, Q, in a simple water balance analysis. In Step 1, we analyzed the correlation between the observed MicP concentrations and the basin characteristics from rivers. The MicP data were obtained from 70 rivers and 90 sites across Japan, thus representing a much larger survey than those used by Lebreton et al. [41] and Schmidt et al. [42]. The population density and urban area ratio in the upstream basin area of each measurement site were evaluated as the basin characteristics. Geographic information system (GIS) software was used to analyze the basin information across Japan with a 1 km grid. We substituted this information into the aforementioned correlation and calculated the MicP concentration of each 1 km grid for all of Japan. Previous studies [41,42] have shown a linear relationship between the mass concentrations of MicP and MacP based on measured data. Using this relationship, the MacP concentrations in this study were calculated according to the obtained MicP concentrations.
In Step 2, a simple water balance analysis was performed on each 1 km grid. The measured precipitation used as input data was distributed into evapotranspiration, surface runoff, and underground infiltration. In calculating these migration pathways, land use and meteorological data were also utilized. Our goal in this stage was to obtain the annual amount of Japanese plastic emissions. As underground infiltration is thought to be expelled from the ground annually, the outflow, Q, from each grid was considered to be equal to the sum of the surface runoff and underground infiltration.
The product of the MicP and MacP concentrations and outflow, Q, obtained in Steps 1 and 2 yielded grid-based MicP and MacP emissions. By summing these emissions, we could evaluate the overall plastic input from the land to the sea offshore of Japan (Step 3). Furthermore, the sum of all plastic inputs could be calculated by river basin and administrative district (e.g., prefectures, cities, towns). Employing this method, since MMPW was not used, more detailed spatial distributions of plastic emissions could be calculated. Accordingly, we were able to identify the critical areas where countermeasures should be focused. Since the gridded plastic emissions were calculated, it was also possible to obtain an overview of the entire range of plastic emissions nationwide.
The foundation of our method is the correlation between the observed MicP data and land area data in Step 1. The coefficient for Japan in this correlation is likely to be different from that of other countries. If a large amount of observational MicP concentration data can be collected and a highly reliable correlation is obtained, the same method should be applicable to other countries, thereby allowing plastic inputs to be readily calculated. Thus, our method offers both high applicability and versatility.

2.2. Evaluating Riverine MicP and MacP Concentrations

2.2.1. Field Sites

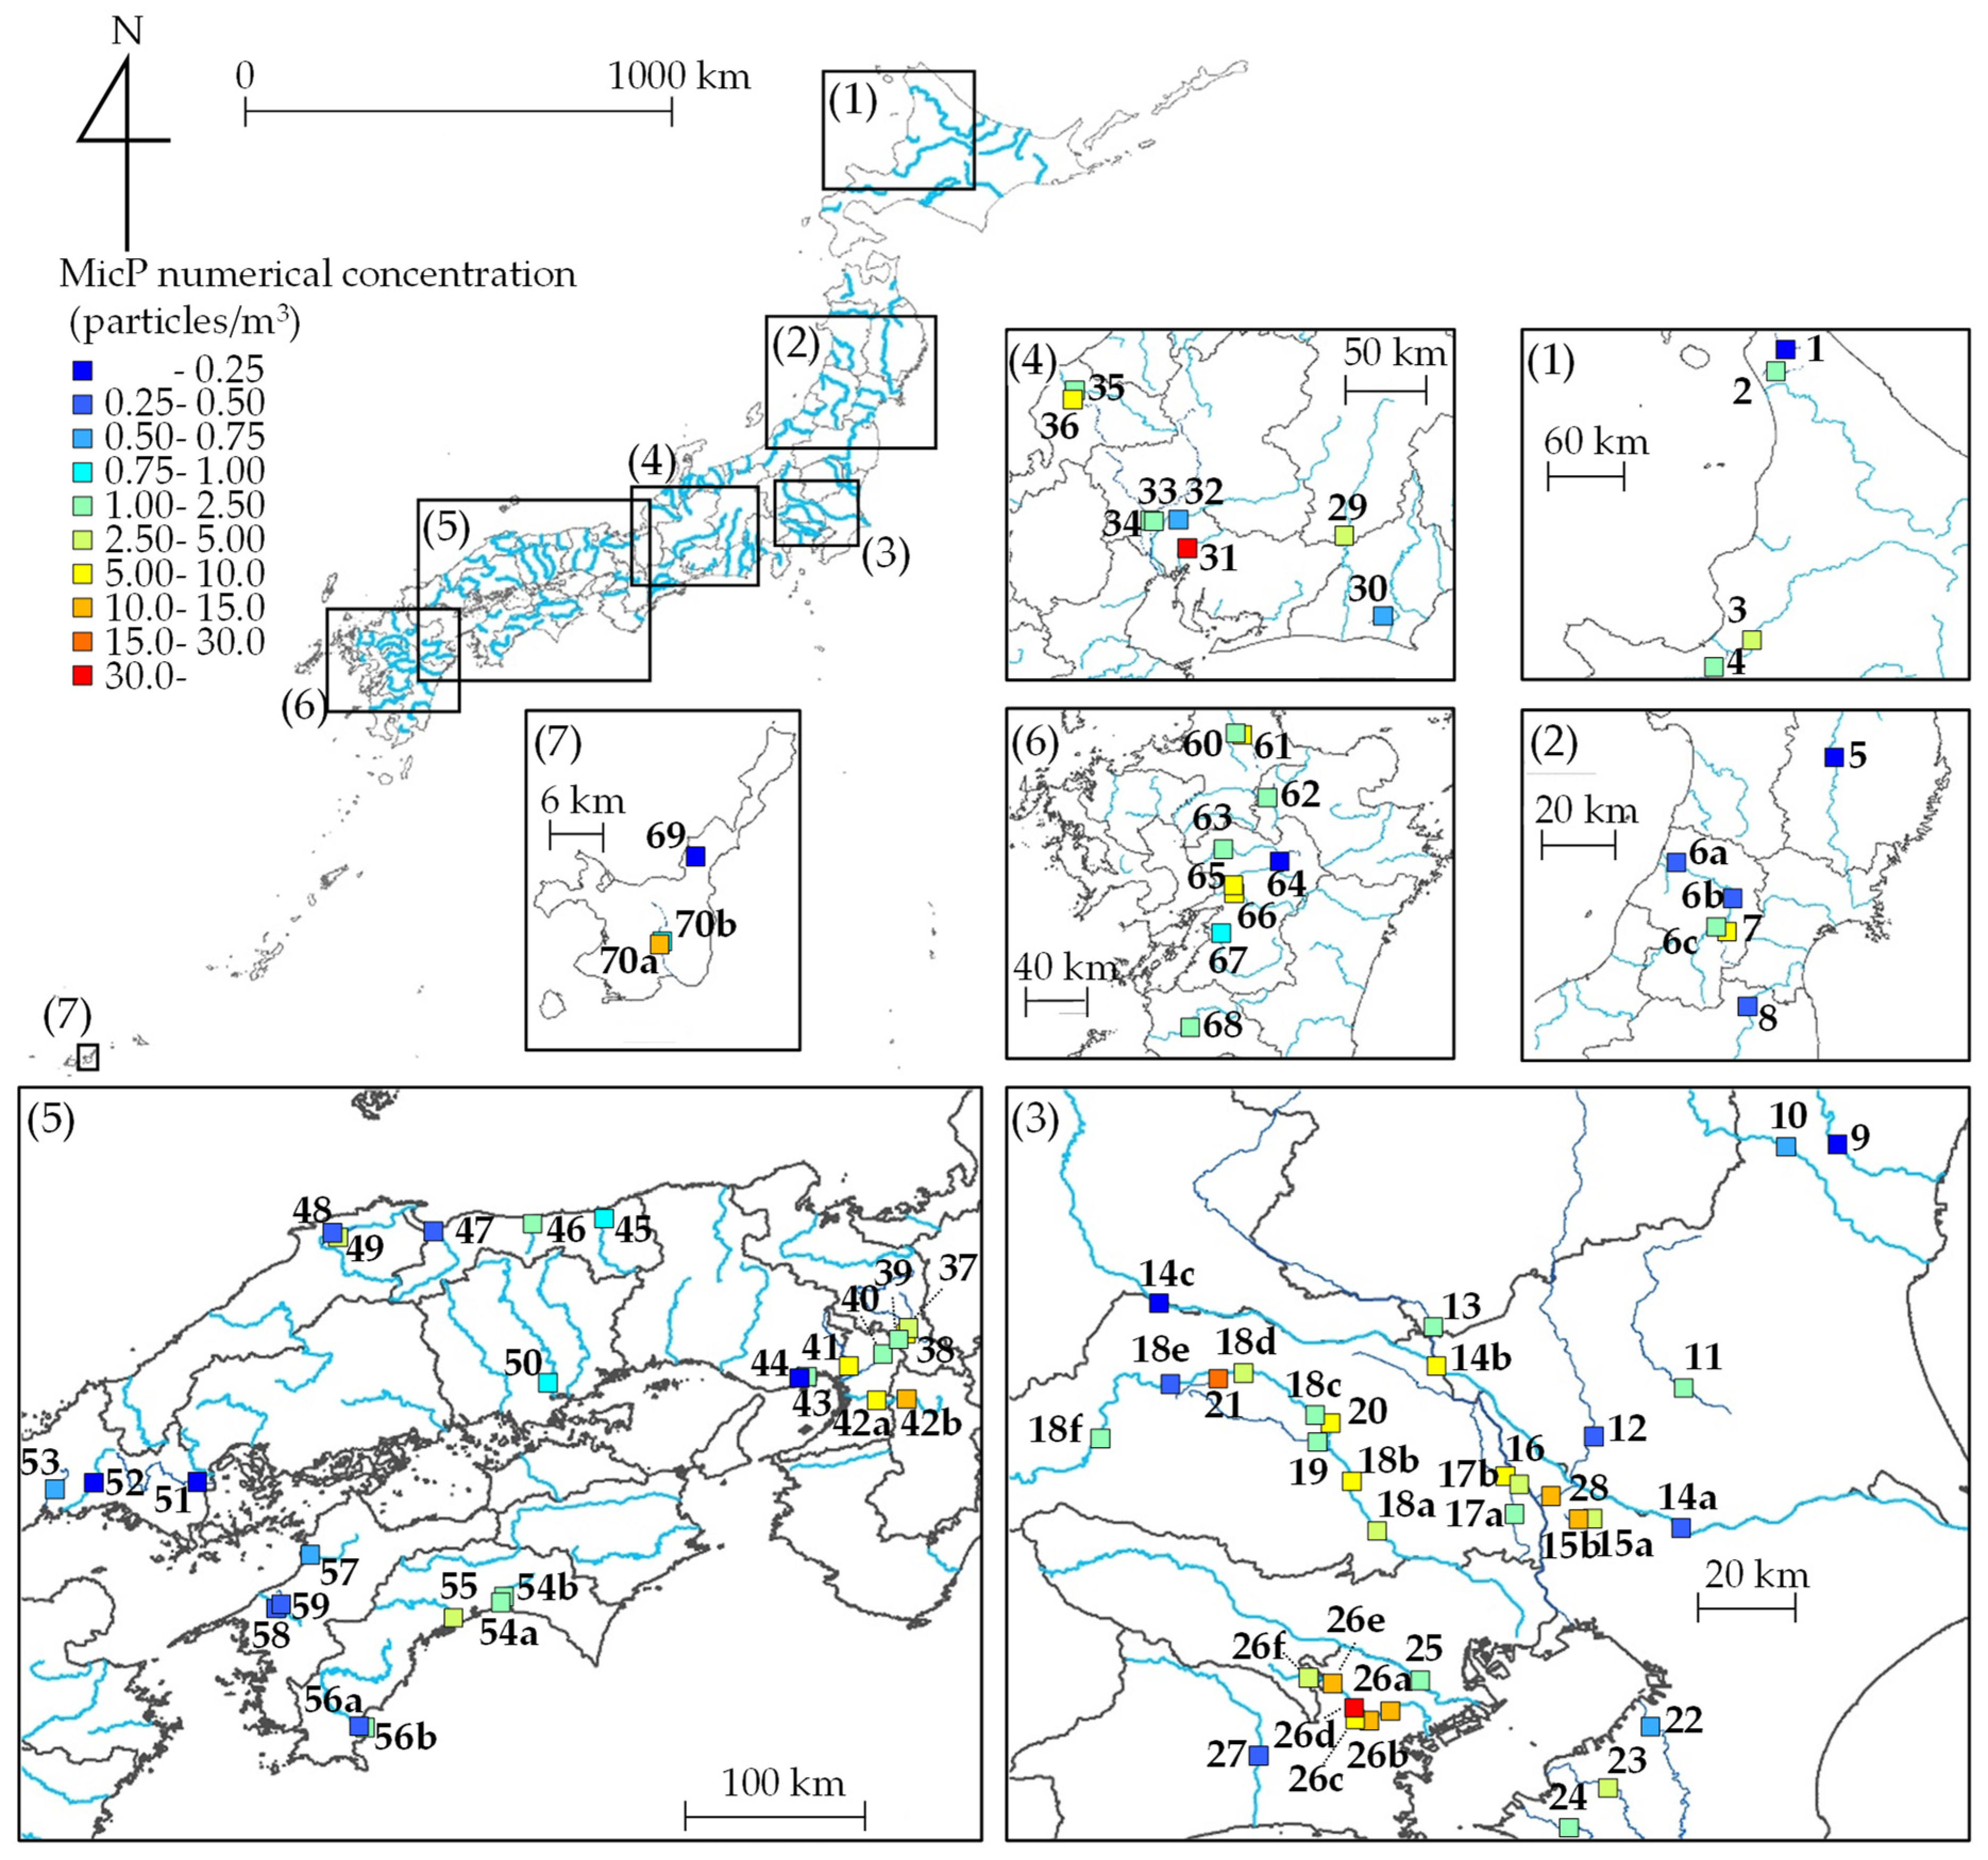
Here, we describe the observational and analytical methods used to measure MicP concentrations in rivers in order to derive correlations with land area data (Step 1). Our methods related to determining MicP concentrations were essentially the same as those of Kataoka et al. [40]. As shown in Figure 2, the observation sites included 70 rivers and 90 sites across Japan. In contrast, the survey sites used by Kataoka et al. [40] included only 29 rivers and 35 sites, while subsequent observational and analytical results have been added to our study.
Table A1 summarizes the river and site names, as well as the basin characteristics at each observation site. Our observational results from each point are also included in this table. At many locations, only one observation was made. However, at 19 out of 90 sites, observations were made two or more times on different days. The observed values shown in Table A1 are the mean values. For the basin characteristics, the population density and land use (urban area ratio) were recorded in the area upstream of each observation site. Land use was classified as mountain forest, urban area, farmland, or others (water area, etc.). The surveyed sites included basins of various sizes (minimum: 1.1 km2, maximum: 1.3 × 10⁴ km2, mean: 1.5 × 10³ km2) including the Tone River, which has the largest basin area in Japan. The population density at our observation sites ranged from 0 to 7.1 × 10³ persons/km2 (mean: 9.7 × 10² persons/km2), and the urbanization rate ranged from 0 to 100% (mean: 17.7%). The overall composition varied widely, from urban areas to regions where people do not live. The field surveys in the rivers were conducted for both the unidirectional flow area, where the flow direction is only downstream, and for the tidal area, where both downstream and upstream flow occur. However, we have excluded data from the tidal area from our analyses. Because MicPs in the tidal reach are transported by upstream flow from the sea to upstream areas due to tides, these observational results were therefore affected by the seas. This work aims to show the MicP transport from land to the sea; thus, the data in tidal reach were beyond the scope of this study.
Field observations were performed for nearly five years, from July 2015 to May 2019, over different seasons. For each observation day, normal water levels at each site were observed, showing that each observation day was under low-flow conditions with little influence of flood conditions. It has been noted that MicP concentrations fluctuate over time, even at the same location, and change with the water flow rate [31,44]. The same observation has also been confirmed for MacP [45]. Consequently, MicP and MacP are transported in large quantities to the sea during periods of flooding; however, these observations are very difficult to make and will be an important issue to address in future research.

2.2.2. Measuring MicP in Rivers

A plankton net (No. 5512-C; RIGO Co. Ltd., Saitama, Japan), which is commonly used in marine surveys, was employed to collect MicP in rivers. The net was 30 cm in diameter and 75 cm in length. The size of the netting was 0.335 mm and the flow rate was measured by attaching a low-flow-rate drainage meter (5571B, RIGO Co. Ltd., Saitama, Japan) to the opening of the net.
The field observation procedures to collect MicP from the river were as follows:
  • From the top of a bridge, the plankton net was deployed onto the surface of the river using a rope. The net position was located at the center of each stream in cross-section;
  • The length of the rope was adjusted so that the net was generally fixed near the water surface and set for 5–10 min;
  • After a predetermined installation time, the plankton net was raised to the bridge.
When the flow rate was low, the plankton net was placed in the river again and the same operation was repeated with the same plankton net. If the plankton net was used many times, it became easily bent and there was the possibility of contact with the drainage blades during observation. Therefore, the plankton net was fixed to inner and outer stainless-steel frames to prevent it from bending. Microplastics were expected to flow well near the water surface. In order to capture MicP at the surface, we set the height of the plankton net to where the top of the opening protruded from the water’s surface by several centimeters. When this was converted into an area, 5–10% of the opening area was above the surface. Therefore, the amount of water filtered was underestimated [40]. Since it was not easy to completely control the installation height from the bridge, these errors were ignored in our calculations. Further details of the other observational methods are provided in Kataoka et al. [40].

2.2.3. Laboratory Analyses of MicP Concentrations

We covered the opening of the plankton net used during field sampling with a cloth and transported it to a laboratory. The suspended matter caught in the net was washed with tap water, the cap at the tip of the net was opened, and the suspended matter was transferred into a stainless-steel bottle. At this time, to avoid a reagent blank, tap water was filtered through a 0.1 mm net. It is notable that MicP was not found from the tap water in the analyses. The method used to analyze MicP from the bottled samples was essentially the same as that used by Kataoka et al. [40], and proceeded as follows:
  • The sample was filtered using a 0.1 mm net and the sample remaining on the filter was dried;
  • The dried sample was immersed in a 30% hydrogen peroxide solution for approximately one week to decompose any organic matter, such as plant debris;
  • The sample was filtered again through a 0.1 mm net and the residue was dried for 24 h in a 60 °C incubator;
  • The dried sample was spread in a petri dish containing the tap water, and MicP candidate particles were extracted manually one-by-one;
  • The masses of the MicP candidate particles were measured using an ultra-micro balance (XPR2UV, Mettler Toledo, Columbus, OH, USA);
  • The sizes of the candidate particles > ~0.1 mm were measured. Here, MicP was photographed using an electron microscope (SZX7, Olympus Corp., Tokyo, Japan) with a charge-coupled device (CCD) camera (HDCE-20C, AS ONE Corp., Osaka, Japan). The ImageJ v.1.52t software package (https://imagej.nih.gov/ij/notes.html) was then used to calculate the MicP sizes (maximum length, etc.) from the captured images;
  • A Fourier transform infrared spectrophotometer (FTIR, IRAffinity-1S, Shimadzu Corp., Kyoto, Japan) was used to identify the material compositions of the MicP candidate particles to determine whether or not they were indeed plastic.
The 0.1-mm net used in the laboratory analyses was the same as the plankton net used to collect the MicP from the rivers. The measurement resolution of the ultra-micro balance was 0.1 μg. If there were many suspended particles, in the interest of streamlining, the dried sample was put into an aqueous solution of sodium iodide (specific gravity: 1.6, 500 mL) and specific gravity separation was performed before Step 4. For specific gravity separation, we stirred the sample for ~15 min and let it stand for 3 h to collect 100 mL of supernatant. This was repeated three times to collect a total of 300 mL.
During laboratory analyses, blank tests were performed in parallel with each sample analysis. An empty petri dish was used to assess whether or not MicP was present in the petri dish. We confirmed that there was no MicP contamination during our analyses. We obtained the total numbers and masses of the MicP fractions identified via FTIR. The numerical and mass concentrations of MicP were calculated by dividing the total number and mass of the MicP by the drainage from the plankton net.

2.2.4. Evaluating Basin Characteristics

To examine the correlation between the MicP numerical (mass) concentration and basin characteristics, we evaluated the basin area, population density, and land use characteristics in the upstream area of each observation site. For the basin area, we obtained elevation and tertiary gradient mesh data from the Ministry of Land, Infrastructure, Transport and Tourism’s “National Land Numerical Information Download Service” (http://nlftp.mlit.go.jp/ksj/). The spatial resolution of these data was 100 m as of 2011. From this, the boundaries of each basin and their upstream areas were calculated for each observation site. For land use, we obtained mesh data from the same site. The spatial resolution of these data was 100 m as of 2014. In this dataset, land use characteristics were classified into 12 categories. Of these, buildings, roads, railways, and other land types were all considered to be “urban areas,” paddy fields and other agricultural lands were considered “farmlands,” forests and bushes were considered “mountain forests,” and rivers, lakes, beaches, and golf courses were reclassified as “other.” We obtained population data (from 2015) at a 250 m resolution from the governmental “Japan in Statistics” site, E-Stat (https://www.e-stat.go.jp/).
When the boundary of a basin divided a population density grid (or land use situation grid), we assumed that population density or land use was uniform and the portion of the area after being divided was added as basin data. In order to calculate the plastic input in Japan, we recalculated these land use, population density, and elevation data using a 1 km mesh. The data were also used for the nationwide water balance analysis detailed in Section 2.3 with the same 1 km resolution.
We applied this land information to the relationship between the MicP numerical (mass) concentration and basin characteristics and calculated the MicP numerical (mass) concentration for a 1 km grid. We selected the population density and urban area ratio as land information indices to evaluate the MicP emissions here because the other indices such as basin area and agricultural area ratio do not have a good correlation with the MicP concentration [40]. The MacP mass concentration was calculated from the product of the obtained MicP mass concentration and the ratio of the MacP concentration to the MicP concentration. To calculate MacP/MicP, we used the observational data for MacP and MicP concentrations at the same sites used by Lebreton et al. [41] and Schmidt et al. [42]. The detailed data are shown in Section 3.4.

2.3. Water Balance Analysis at a 1 km Mesh Resolution

2.3.1. Outline of Water Balance Analysis

We divided the entire area of Japan into a 1 km mesh and performed water balance analyses, in which it was assumed that the annual precipitation was equal to the sum of the annual evapotranspiration, surface runoff, and underground infiltration, and that the water volume was balanced within each grid. For this reason, surface runoff between grids and advection of underground seepage were not considered. It is conceivable to use a runoff analysis model with high temporal and spatial resolutions and high accuracy, based on an elaborate, distributed hydrological model (e.g., [46,47]). However, the computational load for such a model is too large for performing analyses over a very large area, such as Japan. For this reason, it was unrealistic to perform annual wide-area calculations to determine the annual values of plastic inputs in this study. Instead, only a water balance analysis, in which each grid was considered closed, was performed; thus, the calculation load was remarkably light and the surface runoff and underground infiltration required for material transport could be calculated. Moreover, as the spatial resolution could be set to a relatively fine scale of 1 km, it could be applied to calculate plastic inputs over a wide area and could also be applied at an administrative level that could effectively introduce countermeasures against plastic waste.

2.3.2. Precipitation

In Japan, meteorological data are released as mesh-normal climate data (https://www.data.jma.go.jp/obd/stats/etrn/view/atlas.html), which are interpolated with the measured values from meteorological stations (Amedas, etc.) by the Japan Meteorological Agency (JMA). From this dataset, we also used the temperature and humidity values necessary for calculating evapotranspiration. Spatial changes in precipitation were large and easily affected by the measurement altitude of the observation site. The mesh-normal climate data were therefore unsuitable for our purposes, as they were affected by the spatial density of the observation site. Instead of the mesh-normal climate data, we used rainfall data generated by the JMA (https://www.jma.go.jp/jma/kishou/know/kurashi/kaiseki.html). This analytical rainfall is a precipitation distribution output with a resolution of 1 km produced by combining data from radar rain gauges and ground rain gauges. Here, the annual normal value of each grid was calculated from a monthly analysis of rainfall data from 2011 to 2015. In this analysis, rainfall and snowfall were judged using temperature [48]. The amount of monthly snowmelt for each grid was then evaluated using the degree-day method [49], which can account for snow accumulation and snowmelt.

2.3.3. Evapotranspiration

There are no national observational data for evapotranspiration available; thus, empirical formulae proposed in previous studies were used to estimate evapotranspiration. Since evapotranspiration depends strongly on land use, an evaluation was conducted for each land use type classified in Table 1. Equations (1–4) express the evapotranspiration, E (mm/month), based on the modified equations of Priestley and Taylor [48], Suzuki and Fukushima [50], an evapotranspiration research group [51], and Kondo [52], respectively:
Forest   E :   E = E t + E i = α Δ Δ + γ R n G λ + β P
Paddy   field   in   non - irrigated   period   E :   E = 0.54 Δ Δ + γ S λ
Paddy   field   during   irrigation   E :   E = 0.82 S * M d
Water   area   E :   E = ( 0.9888 l 2 + 41.629 l + 561.97 ) M d 365
where α is the Priestley–Taylor constant, Δ is the slope of the saturated water vapor curve, γ is the moisture meter constant (hPa/°C), Rn is the net radiation (=0.8S, MJ/m2), G is the ground heat flow (MJ/m2), λ is the latent heat of vaporization (J/g), β is the canopy interception rate, P is precipitation (mm/month), S is the total solar radiation (MJ/m2), S* = 10Rn/λ, Md is days of month, and l is the latitude of the center of gravity of the mesh.

2.3.4. Surface Runoff and Underground Infiltration

For the surface runoff, Qs, a rational expression [53] that is a centralized conceptual model was used for each grid, such that:
Q s = f × P
where f is the runoff coefficient and P is precipitation. The general rational formula includes the basin area and numerical values converted into units (=1/3.6). In this model, the evapotranspiration, surface runoff, and underground infiltration are calculated as quantities per unit area, and the mesh area (=1 km2) is then multiplied. The coefficient of the surface runoff, f, is given according to the land use, as shown in Table 1. The difference between the precipitation, P, and the sum of the evapotranspiration, E, and the surface runoff, Qs, was obtained, and the underground infiltration, Qi, was calculated as:
Q i = P E Q s
The sum of the surface runoff, Qs, and underground infiltration, Qi, was used as the outflow, Q, from each grid (Qs + Qi), and the product of Q and the MicP (MacP) concentration were calculated as the MicP (MacP) emissions from each grid.

2.3.5. Validating the Water Balance Model

In order to validate the numerical accuracy of the outflow, Q, determined in our water balance model, validation data were collected. The annual flow rate at the most downstream discharge observation point in 109 first-class water systems were obtained from the Hydrological Water Quality Database of the Ministry of Land, Infrastructure, Transport and Tourism (http://www1.river.go.jp/). The total of the relevant basin areas covered 64% of Japan. Flow data from 2011–2015 were collected in the same manner as the rainfall, and the mean value for these five years (hereafter, the “observed flow rate”) was calculated. For the outflow, Q, the total value of the outflows of all grids included in the upstream area of the target observation site (hereafter, the “calculated flow rate”) was determined. If the grid included a basin boundary, the area included in the basin was used.

3. Results

3.1. Characteristics of MicP Concentrations in Japanese Rivers

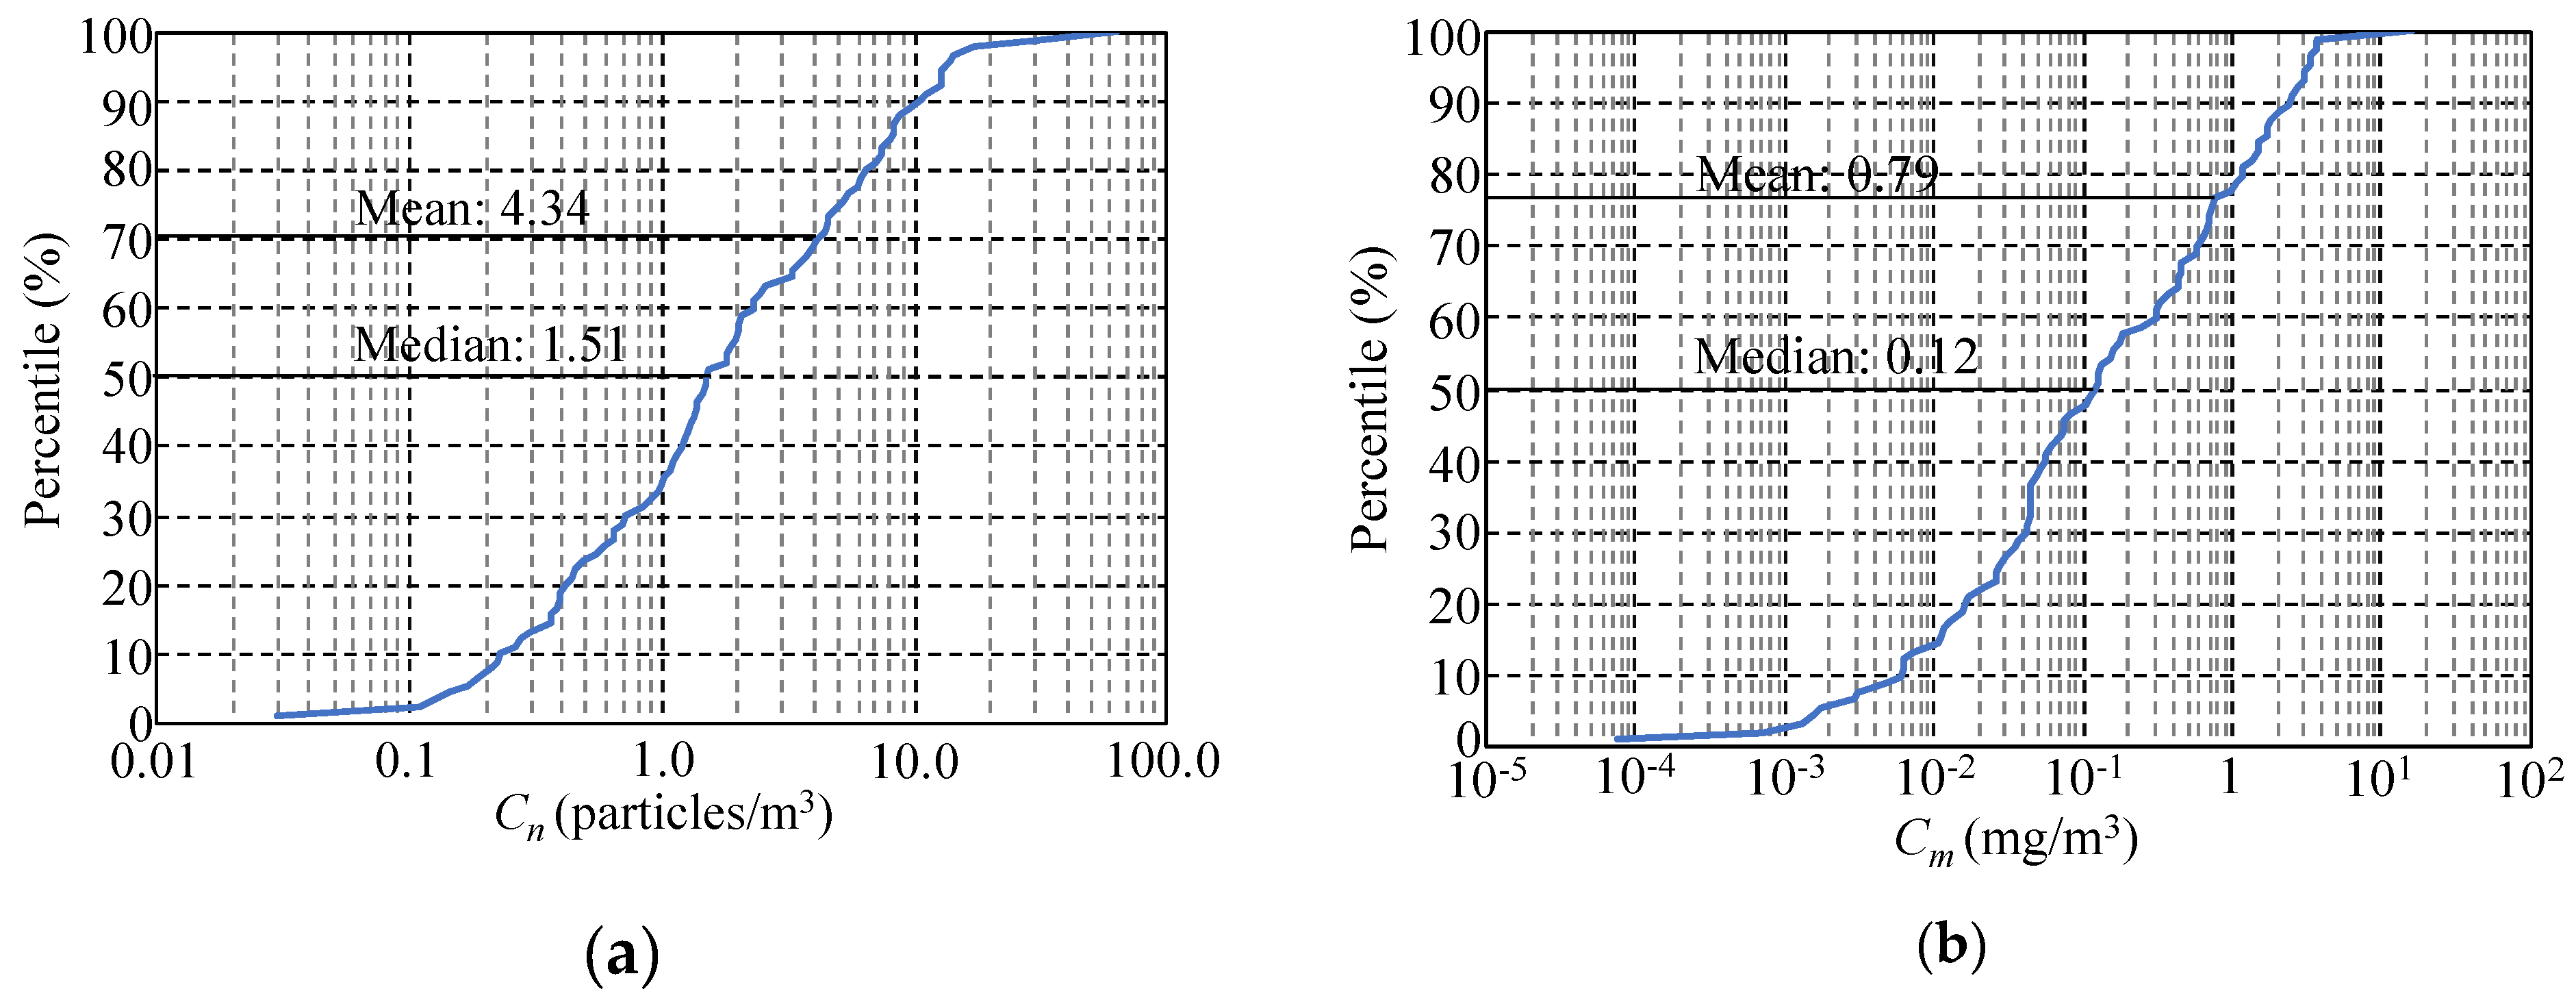
Figure 2 and Table A1 show the MicP numerical and mass concentration data from 70 rivers and 90 sites across Japan. Although Kataoka et al. [40] focused on only three types of MicP materials (PE, polyethylene; PP, polypropylene; PS, polystyrene), all plastic types were included in this study. As a result, the MicP numerical concentration was widely distributed over four orders of magnitude, from 0.03 to 63.89 (particles/m3), with mean and median values of 4.34 and 1.51 (particles/m3), respectively. The MicP mass concentration changed over a wide range, from 0.00008 to 16.15 (mg/m3), with mean and median values of 0.79 and 0.12 (mg/m3), respectively. The coefficient of variation was 1.85 for the MicP numerical concentration and 2.40 for the MicP mass concentration, indicating that variation of the mass concentration was larger than that of the numerical concentration. The mean MicP size obtained in this study was 1–2 mm. PE, PP, and PS were the dominant plastic types in the MicPs collected.
Figure 3 shows the percentiles of the numerical concentration of MicP, Cn, and mass concentration, Cm. The mean values of both Cn and Cm are larger than their respective median values. The percentage of sites above the mean value was 30% for Cn and 23% for Cm. Moreover, a number of sites with values less than 1/10 of the mean value were also observed, as much as 21% and 46% for Cn and Cm, respectively. From these values, it is apparent that high MicP concentrations at relatively few sites skewed the means.
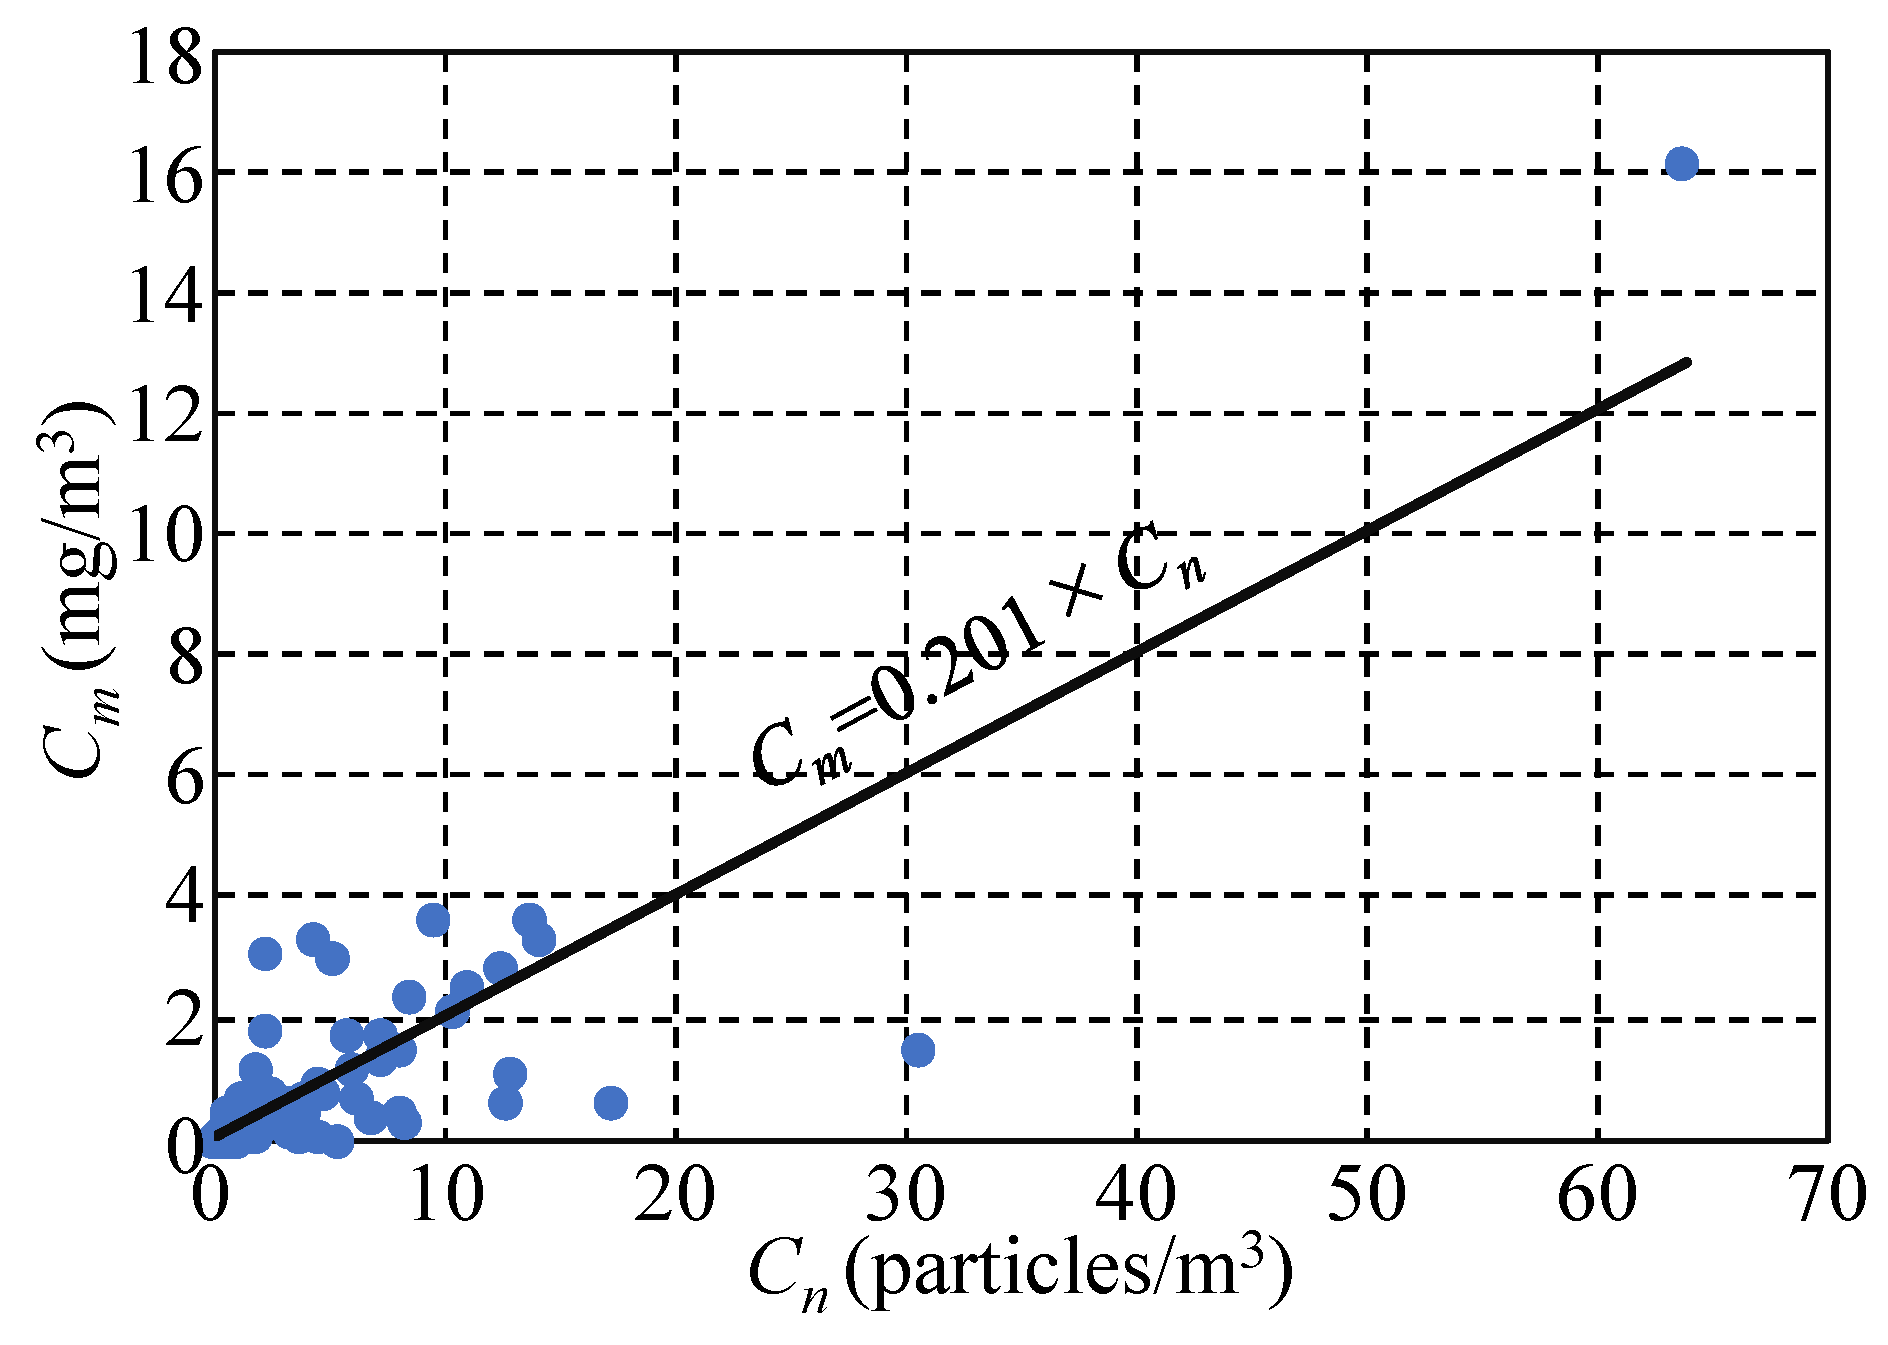
The correlation between Cn and Cm are shown in Figure 4. The results from all 90 sites are displayed. Although some variation was observed between the behaviors of Cn and Cm, the approximately straight line that fits the data has a positive slope. The Pearson’s correlation coefficient, R2, of this line was 0.748, with a p-value < 0.05, indicating a significant correlation between these two concentrations.

3.2. Relationship between MicP Concentrations and Basin Characteristics

We examined the relationship between the MicP concentrations and basin characteristics utilizing extensive MicP concentration data. The mean values of the urban area ratio at sites above and below the mean MicP mass concentration were 40% and 10%, respectively. However, the mean value of the farmland fraction was 17% both above and below the mean value. A similar trend was observed for the MicP numerical concentration. The MicP concentrations tended to be higher in rivers with larger urban area ratios. Reflecting this, and similar to Kataoka et al. [40], we plotted the correlation between the MicP concentrations and basin characteristics (population density and urban area ratio, Figure 5). This figure indicates that the relationship between these concentrations and basin characteristics may be linearly approximated at a 95% confidence interval. The y-axis at a certain value of x (Figure 5a, left) is given by the following equations [54]:
Δ y = 2 t 0.05 s 1 n + ( x x ¯ ) 2 S x x
s = S y y a S x y n 2
where n is the number of samples (90), t0.05 is the t-value (1.987) corresponding to a probability of 5% on both sides of n = 90 (degrees of freedom: 89), s is the expected value of the regression residual, Sxx and Syy are the sums of squares of the deviations from the mean values ( x ¯ and y ¯ ) for x and y, respectively, and Sxy is the sum of the product of the deviations from x ¯ and y ¯ .When these values are divided by n − 1, Sxx and Syy become the variances of x and y, respectively, and Sxy becomes the covariance of x and y.
By inspecting the relationship between Cn and Cm, as well as the population density, Wp, and urban area ratio, Wu, we confirmed that all four values were positively correlated. The following linear approximations were obtained for the respective values:
C n = 0.0016 W p + 2.7648 ( R 2 = 0.135 , P = 3.65 × 10 4 )
C m = 0.0003 W p + 0.4686 ( R 2 = 0.102 , P = 2.20 × 10 3 )
C n = 0.181 W u + 1.235 ( R 2 = 0.217 , P = 3.65 × 10 6 )
C m = 0.0396 W u + 0.1144 ( R 2 = 0.184 , P = 2.46 × 10 5 )
The correlation coefficient and p-value for each approximation formula are provided above. From these results, it is clear that p < 0.05 for all equations, demonstrating that there was a significant positive correlation between the MicP concentrations and basin characteristics at a 5% confidence interval. The correlation coefficients were greater with Wu than with Wp.
It is important to note that, as shown in Figure 5, the observed raw data exhibited some variations, mainly due to the uncertainties in field sampling of the MicPs and the behavior of MicP in rivers (i.e., settling on the riverbed). To reduce some of the variation in MicP, moving average values for the observed raw data are also displayed in Figure 5. Here, the data were rearranged in order of population density (or urban area ratio), and the 20 adjacent data points were averaged to determine the moving average. The raw population density and urban area ratio data were non-uniform. In other words, the raw data were concentrated within a relatively small population density and urban area ratio, thereby affecting the linear approximation. In order to avoid the problems associated with such a skewed distribution, a moving average was used. As a result of this operation, the moving average of Cn and Cm revealed an increasing trend with both population density and urban area ratio. However, the trend was not linear, instead forming a convex curve. This relationship was observed more distinctly with population density.
We tested several functions to find the approximate curve for the moving average. As a result, the following two piecewise equations were obtained for the population density:
C n = 0.0004 W p + 1.7192 , W p < W p t h C n = 2.8239 ln ( W p ) 12.577 , W p W p t h
C m = 0.0022 W p + 0.0026 , W p < W p t h C m = 0.5651 ln ( W p ) 2.5082 , W p W p t h
Although a logarithmic function was the most suitable for predicting the moving average of the MicP concentration shown in Figure 5a, it became negative as the x-axis approached zero. Thus, it was not appropriate to use this function for the entire range. For this reason, a logarithmic function was used here for the range above a certain threshold value, Wpth, and a linear function was used for the range below Wpth. We selected 181 (persons/km2) as Wpth so that the intercept of the linear function was non-negative and the difference between the two functions at the threshold value was minimized. The correlation coefficients (R2) for Equations (13–14) were 0.004, 0.912, 0.652, and 0.849 (from top to bottom). Only one low coefficient was observed, but the other approximate curves had favorable R2 values, thus indicating their goodness of fit.
The y-intercept of the approximate curve for the moving average was smaller than that of the approximately straight line for the raw data, suggesting that the approximate curve represents more appropriate values. We selected a quadratic function as an approximate curve for the moving average values for the urban area ratio and obtained the following equations:
C n = 0.00109 W u 2 + 0.26382 W u + 0.5116
C m = 0.000217 W u 2 + 0.056424 W u
In the expression of the MicP mass concentration obtained using the least-squares method, the intercept became negative; thus, we manually set the intercept to 0. Meanwhile, the correlation coefficients for Equations (15) and (16) had values of 0.966 and 0.980, respectively, indicating a better correlation than that of the population density. This improvement over the population density was similar to the results of the linear approximation shown in Equations (9)–(12).

3.3. Calculated Results for Water Balance Analysis

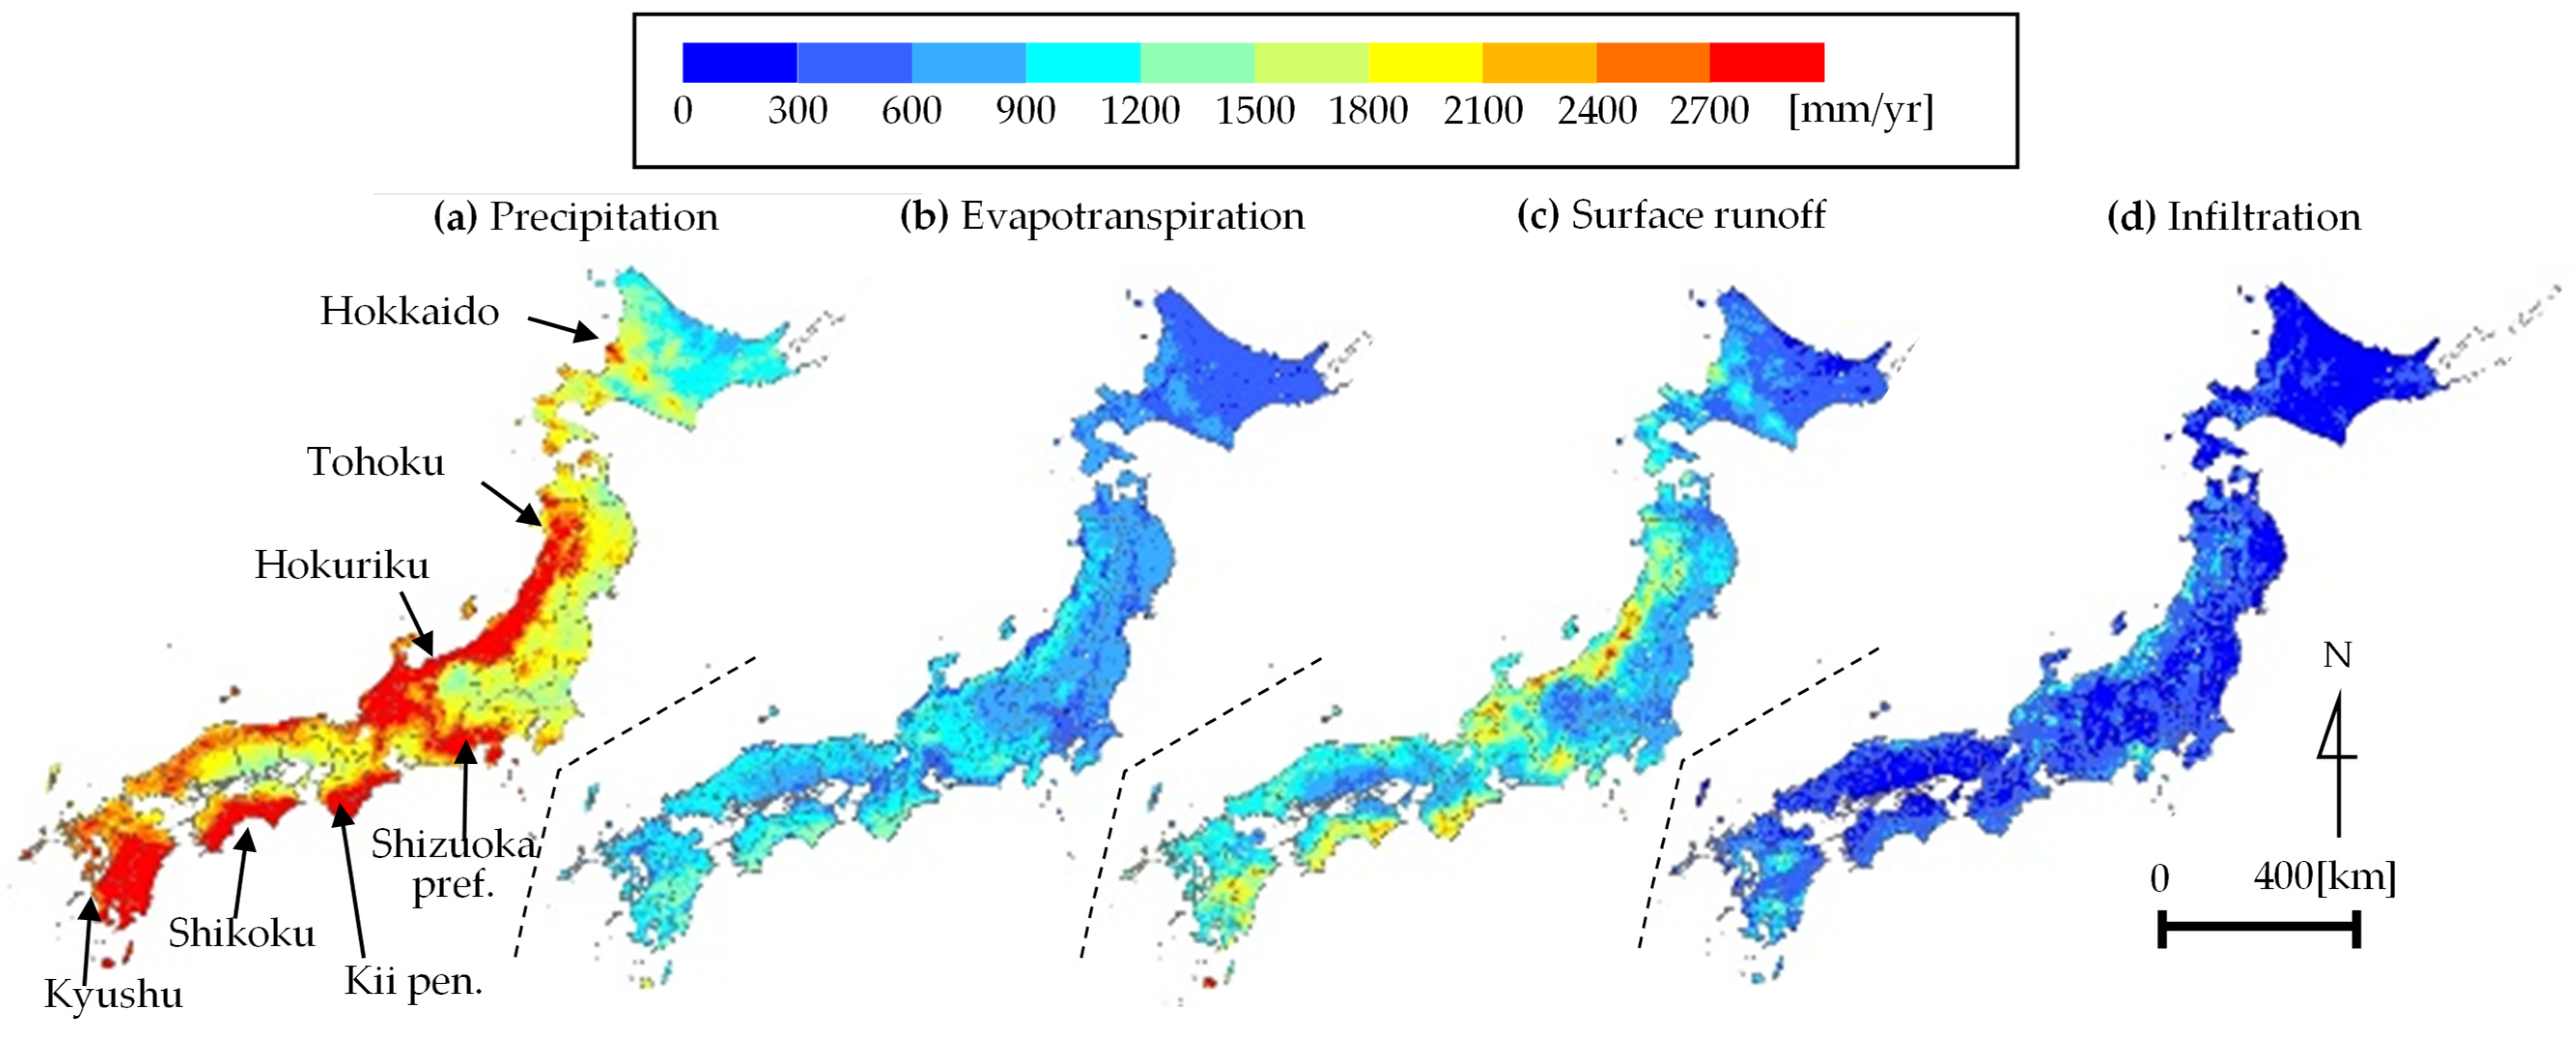
Our water balance model allowed us to determine Japanese plastic emissions, as well as the MicP concentration. Appendix A Figure A1 shows a nationwide map of the annual values of precipitation, P, evapotranspiration, E, surface runoff, Qs, and underground infiltration, Qi, obtained via the water balance analysis. Here, the quantity in each grid was divided by the area (1 km2) and converted to the quantity per year. Figure A1 shows that precipitation was high in southern Kyushu, Shikoku, the Kii Peninsula, and the Shizuoka prefecture on the Pacific coast. This is because rainfall due to typhoons or similar weather patterns during spring, summer, and autumn is quite abundant in these areas. Meanwhile, on the coast of the Sea of Japan, precipitation was high from Hokuriku to the southern part of the Tohoku region due to snowfall in winter. Precipitation in Hokkaido was generally low, especially in the northeast, which receives less than 1000 mm/yr. Evapotranspiration also changes in conjunction with the magnitude of precipitation. However, evapotranspiration is lower in the north and higher in the south, indicating that it is also affected by latitudinal temperature gradients. The surface runoff map also shows a pattern that is generally similar to that of the precipitation map, but sometimes shows clear differences (for example, between the Hokuriku and Tohoku regions on the coast of the Sea of Japan and southern Kyushu). This reflects the fact that surface runoff and infiltration differ with land use type, suggesting that underground infiltration increases in the areas where surface runoff is low. The annual means of each quantity were: 2161 mm/yr for precipitation, 753 mm/yr for evapotranspiration, 1031 mm/yr for surface runoff, and 377 mm/yr for underground infiltration.
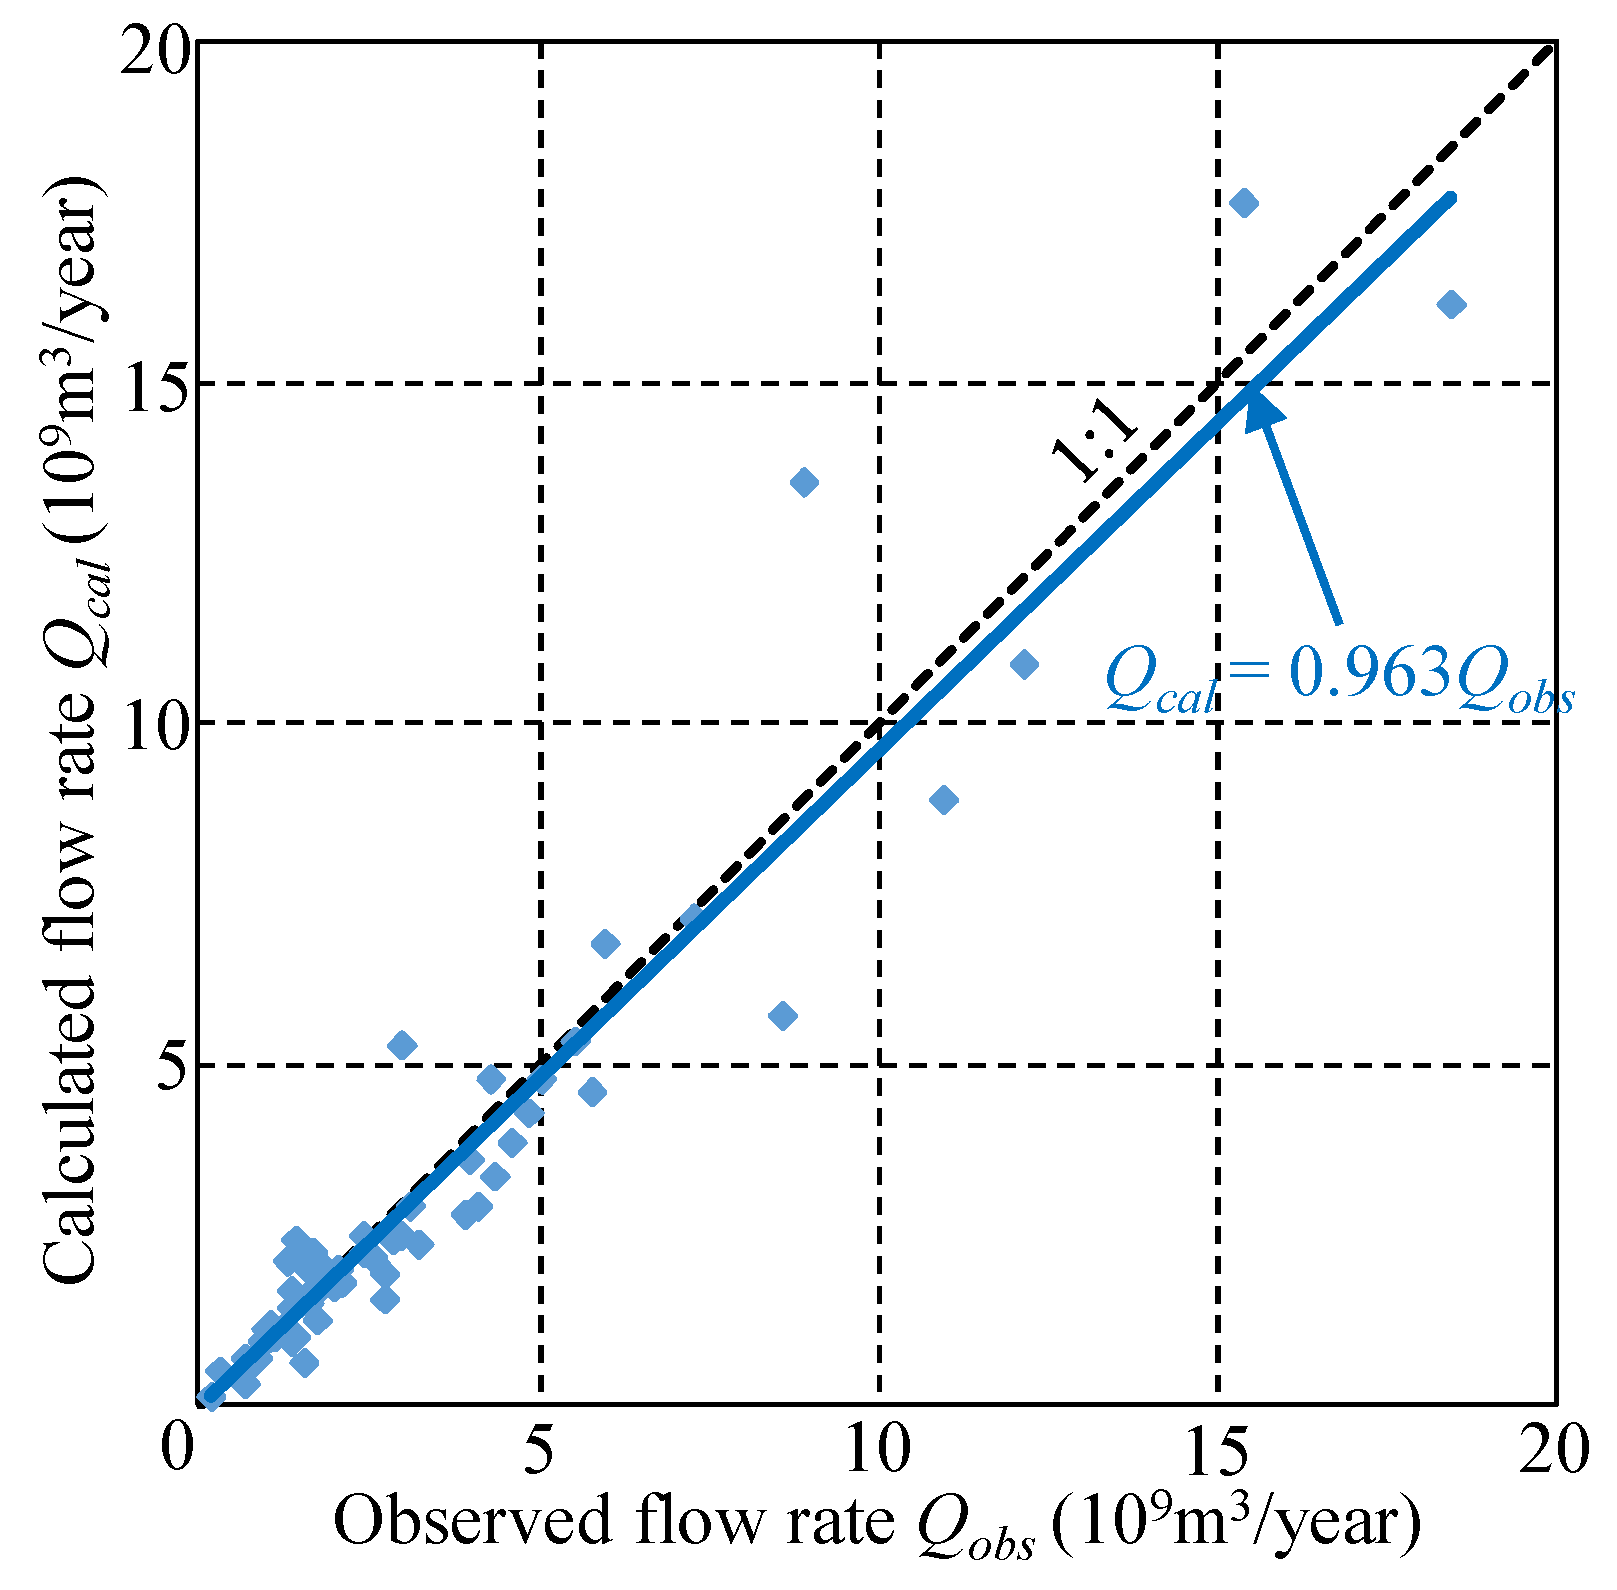
In order to validate the results of the water balance analysis, Figure 6 shows a correlation between the calculated flow rate, Qcal, which is the sum of surface runoff and underground infiltration, and the observed flow rate, Qobs. Here, we focused on the results from flow rate observation sites across all 109 primary water systems in Japan. Figure 6 also shows that Qcal and Qobs are positively correlated; the slope of the linear approximation between Qcal and Qobs is 0.963, the correlation coefficient, R2, is 0.925, and the p-value is < 0.05. These results demonstrate that the calculated flow rate, Qcal, obtained from this model is almost coincident with the observed flow rate, Qobs. It was thereby confirmed that the total outflow of the sum of surface runoff and underground infiltration in a watershed very closely approximates the annual river discharge. Therefore, this method of performing a simple water balance analysis without considering the advection between grids had a high numerical accuracy and also greatly reduced the computational load, thus proving to be a useful technique that is capable of analyzing high-resolution (1 km) grids.

3.4. Calculating Japanese Plastic Emissions from Land to the Sea

We calculated the MicP numerical and mass concentrations using the population densities and urban area ratios across Japan and their approximations given in Equations (9–16). We then multiplied these values by the outflow, Q, to estimate the numerical and mass MicP emissions for each 1 km grid cell. By summing these results nationwide, we obtained the total number and mass of the MicP particles released from the land to the sea, as shown in Table 2. Table 2 shows the eight calculations using approximate curves for the moving average of the observed values in addition to the approximately straight line (y) and the maximum (y + Δy/2) and minimum (y – Δy/2) values at a 95% confidence interval (CI) for Cn and Cm. Table 2 also defines the approximate equations used. From our results, the annual number of MicP particles emitted ranged from 0.55 to 2.54 trillion, with a median of 1.40 trillion particles. The minimum, median, and maximum values of the annual MicP emissions by mass were 65, 223, and 503 t/yr, respectively. The maximum and minimum values of both the number and mass MicP emissions corresponded to the maximum and minimum values from the linear approximation at a CI = 95%. Concerning this approximation from the raw data and from the curve of the moving average values, the number and mass MicP emissions were 1.27–1.67 trillion particles or 204–294 t/yr, respectively. The differences between these values are low, suggesting that the differences among the various approximations were also minimal.
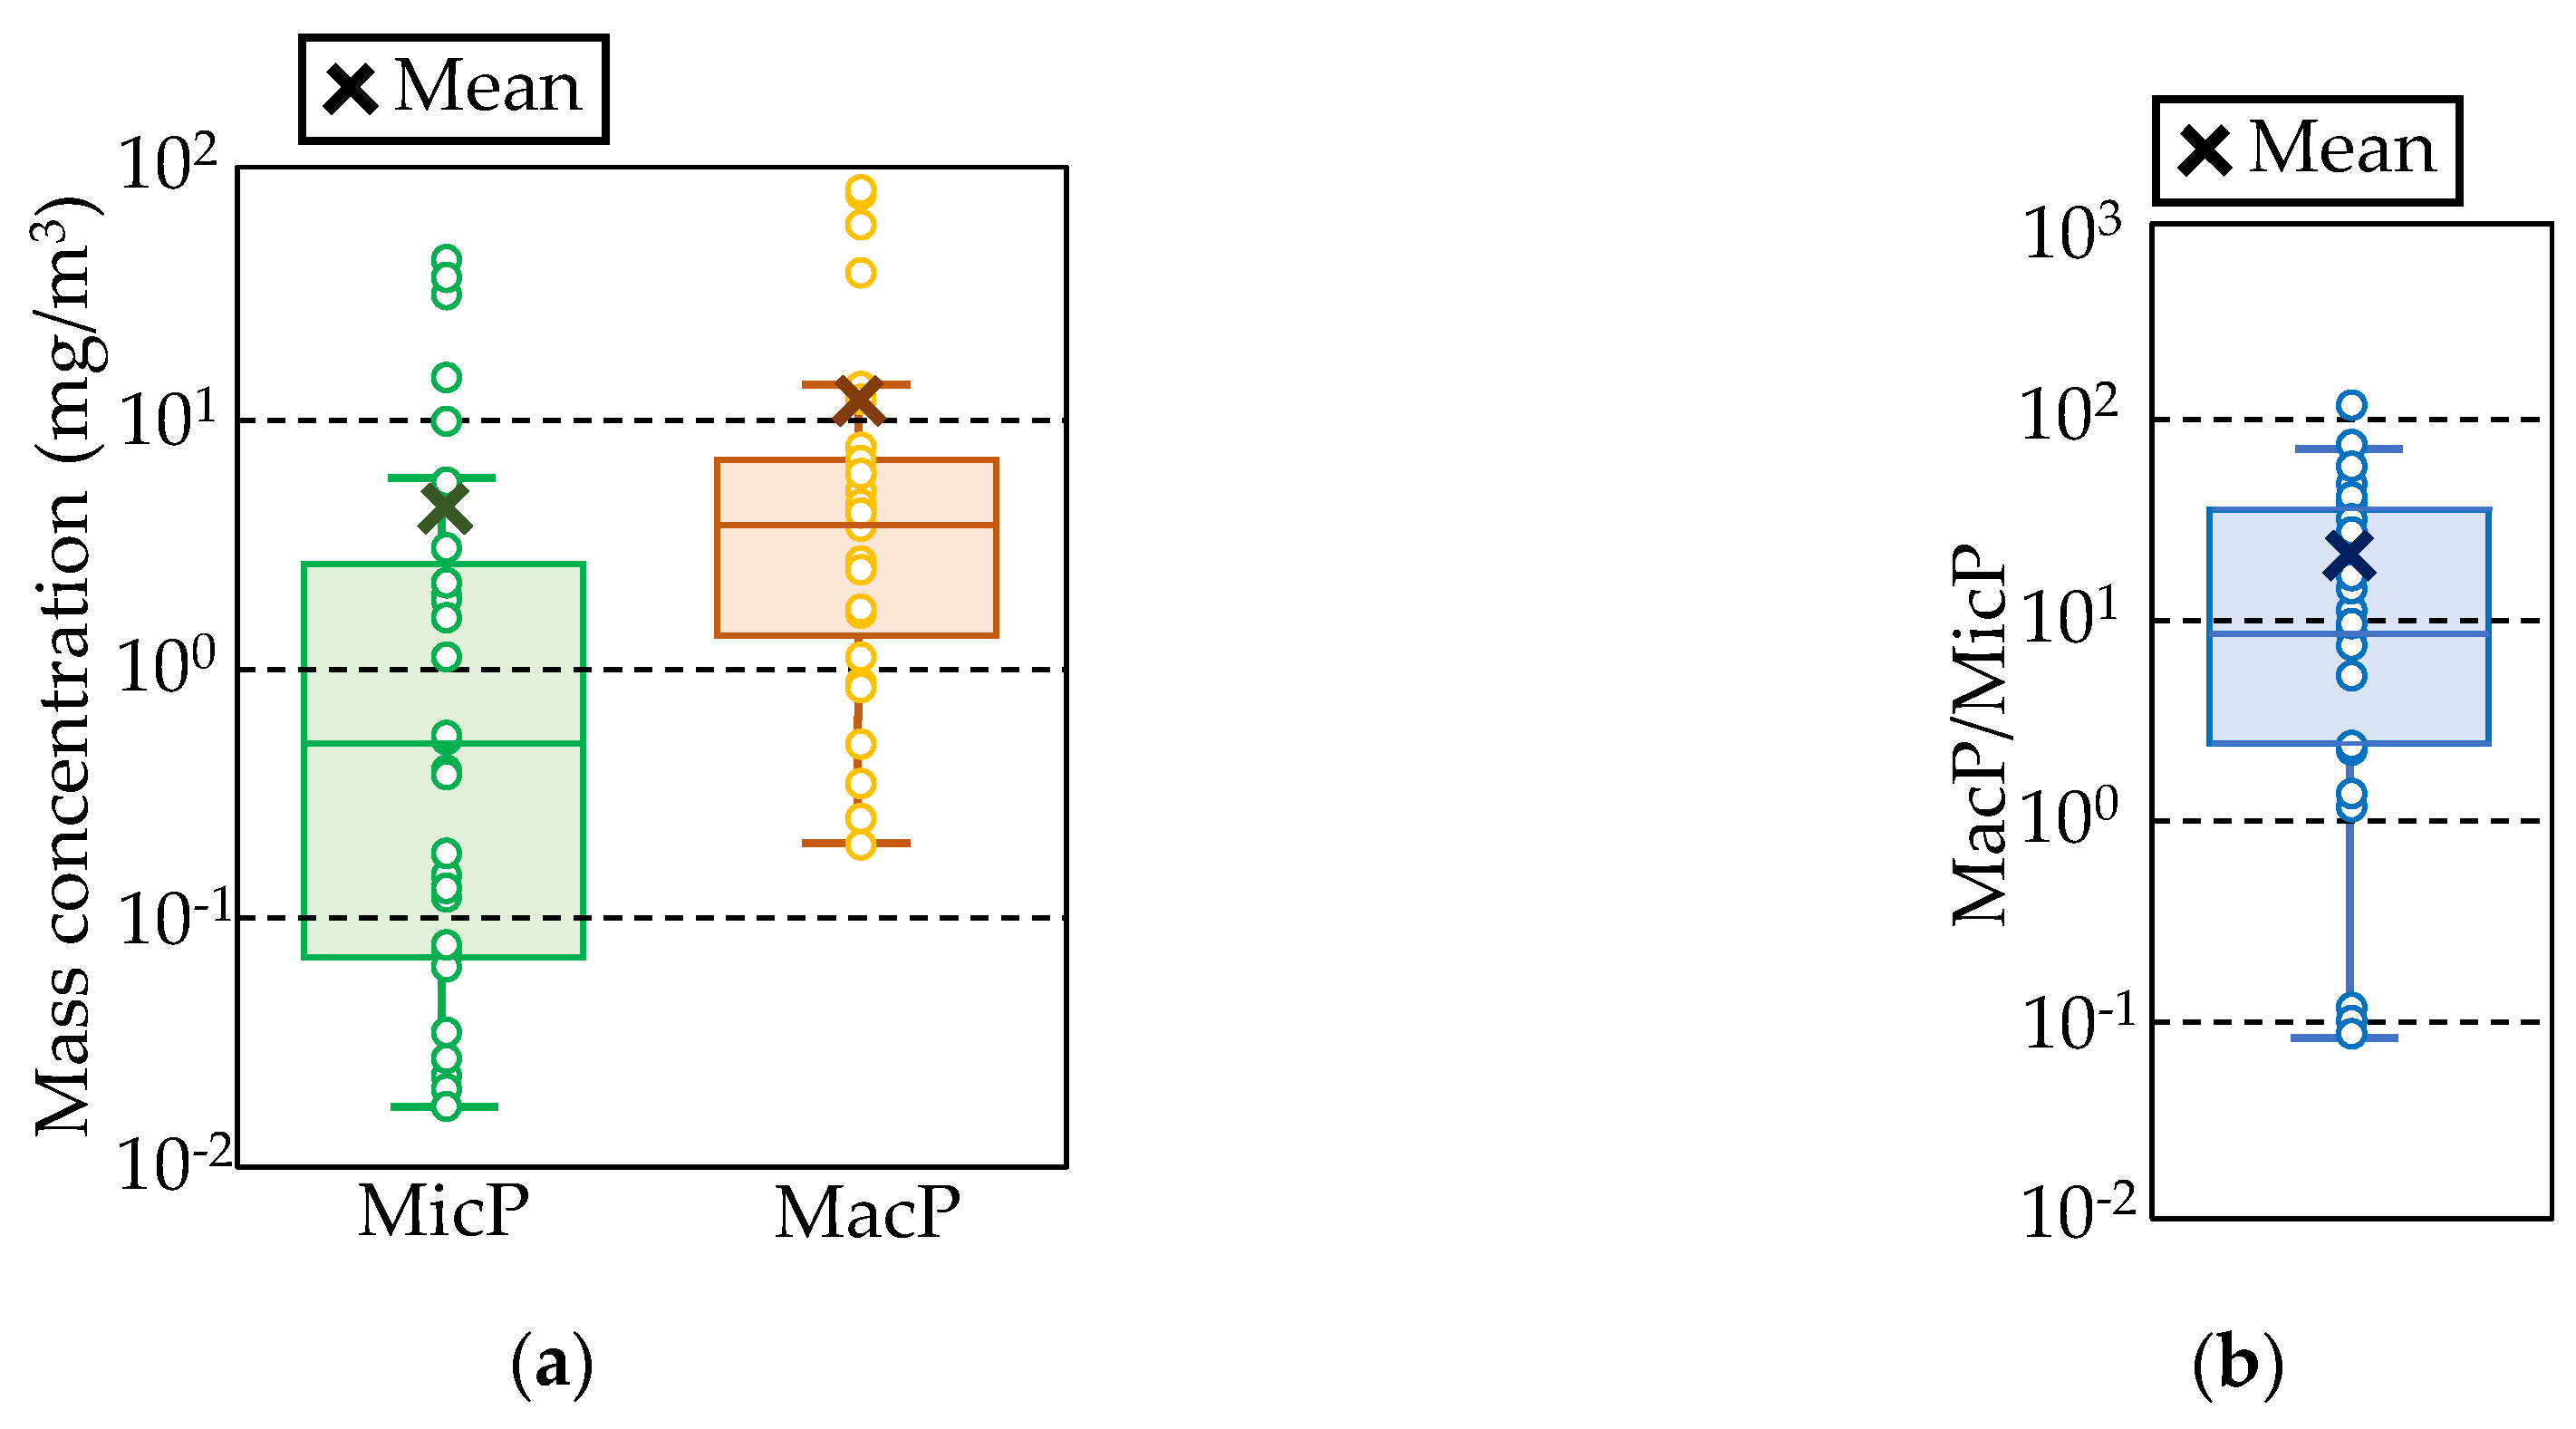
We examined the value of MacP/MicP, a, which is required to obtain the amount of MacP mass concentration emitted from the MicP mass concentration. Figure 7 shows a boxplot of MicP and MacP mass concentrations and their ratio, a, with partially corrected and organized results from Lebreton et al. [41]. Since there were few measured data of mass concentrations of both MicP and MacP in the data of Lebreton et al. [41], we also included data estimated from the MicP numerical concentrations. Additionally, the results for the Yangtze River in China, whose MicP and MacP concentrations were very large, as presented by Lebreton et al. [41], were excluded, bringing n to 29 for each case in Figure 7. As a result, the MicP mass concentration was distributed over four orders of magnitude, from 10−2 to 101. The median and mean values were 0.53 and 5.50 mg/m3, respectively, which are generally higher than the data for rivers in Japan shown in this study (Figure 3b). The median and mean values were 4.4 and 7.0 times larger than those in this study, respectively. However, the MacP mass concentration was greater than the MicP mass concentration and was distributed from 10−1 to 101 and the median and mean MacP mass concentrations were 4.02 and 12.3 mg/m3, respectively. By considering the mass concentration ratios of MacP and MicP shown in Figure 7b, we also found that the order of magnitude varied widely, from 10−2 to 102. In Figure 7b, the 25%, 50% (median), and 75% quartiles were 2.28, 8.50, and 35.2, respectively, with a mean value of 20.7.
Table 3 summarizes the mass concentration ratio, a, based on the results obtained from the study of Lebreton et al. [41], as well as the data of Schmidt et al. [42]. The median and mean values of the MacP and MicP mass concentrations were calculated (Figure 7a) and their ratios are shown in Table 3; the median and mean values of a, shown in Figure 7b, are also shown. It is worth noting that Schmidt et al. [42] did not provide a list of MacP and MicP mass concentrations, but only showed their means and medians. Consequently, the mean and median MacP/MicP values are not displayed here. The range of MacP/MicP values was as wide as 0.77–20.66. The maximum value represents the mean MacP/MicP, as this value is affected by large values of 100 or more, as shown in Figure 7b, making the MacP/MicP conceivably inappropriate as a representation of the data. Additionally, it is generally unlikely that MacP/MicP < 1, considering that most MicPs are secondary microplastics formed by the fragmentation of MacPs. Therefore, we selected four cases (2.24, 3.13, 7.66, and 8.50), excluding the minimum and maximum values in Table 3, as the mass concentration ratios, a, for obtaining the MacP mass concentration from that of MicP. From these four cases, we obtained eight cases for MicP, 32 cases for MacP, and their sums.
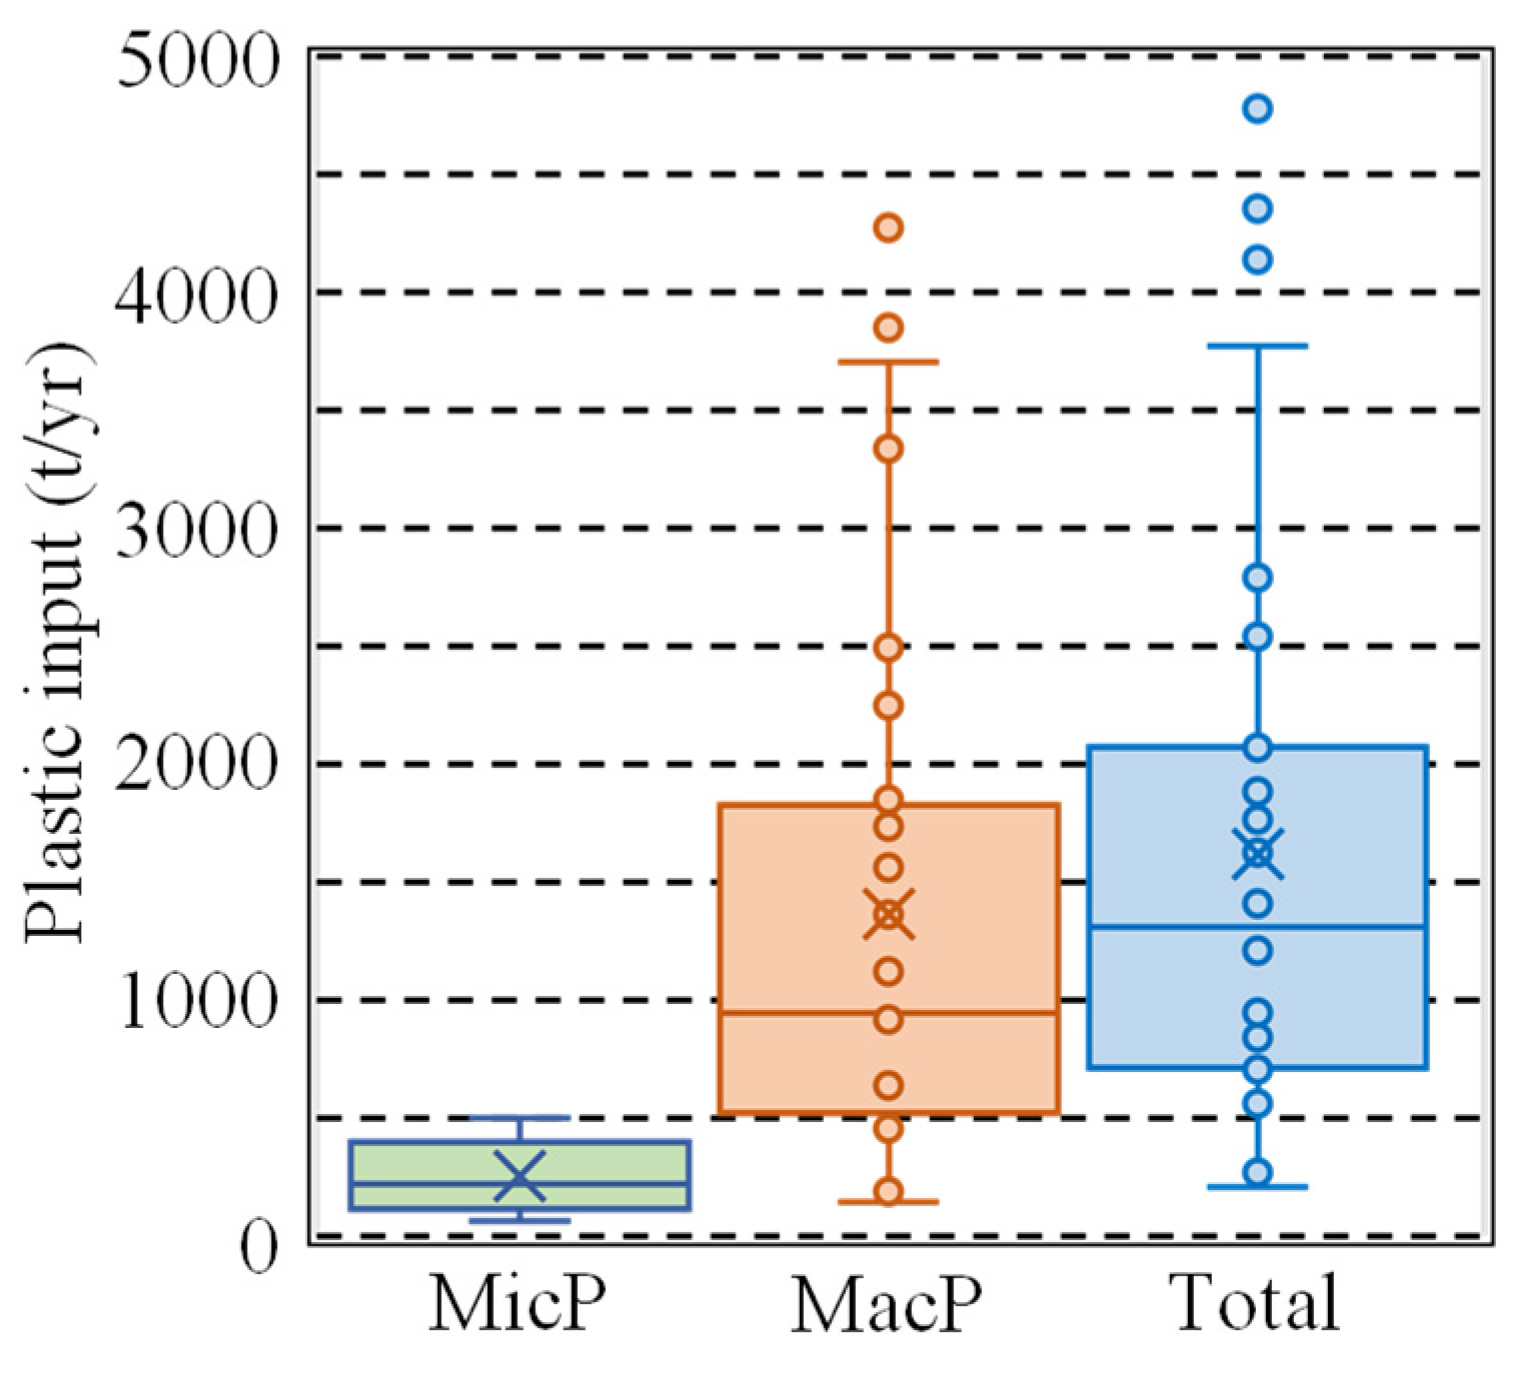
Figure 8 shows the annual values of plastic input from the land to the sea in Japan. Here, the results for MicP, MacP, and their sums are displayed as boxplots, as in Figure 7. It should be noted that the results for MicP inputs were the same as in Table 2. From Figure 8, the minimum, median, and maximum values of MacP inputs are 146, 946, and 4273 t/yr, respectively. These values are larger than the MicP inputs corresponding to the MacP/MicP. Additionally, the total plastic input (MicP + MacP) was also widely distributed, in the range of 210–4776 t/yr, but the 25%, 50% (median), and 75% quartile values were 712, 1310, and 2074 t/yr, respectively. From this, it is conceivable that 1000–2000 tons of plastic are flowing out of Japan into the surrounding waters in a single year.
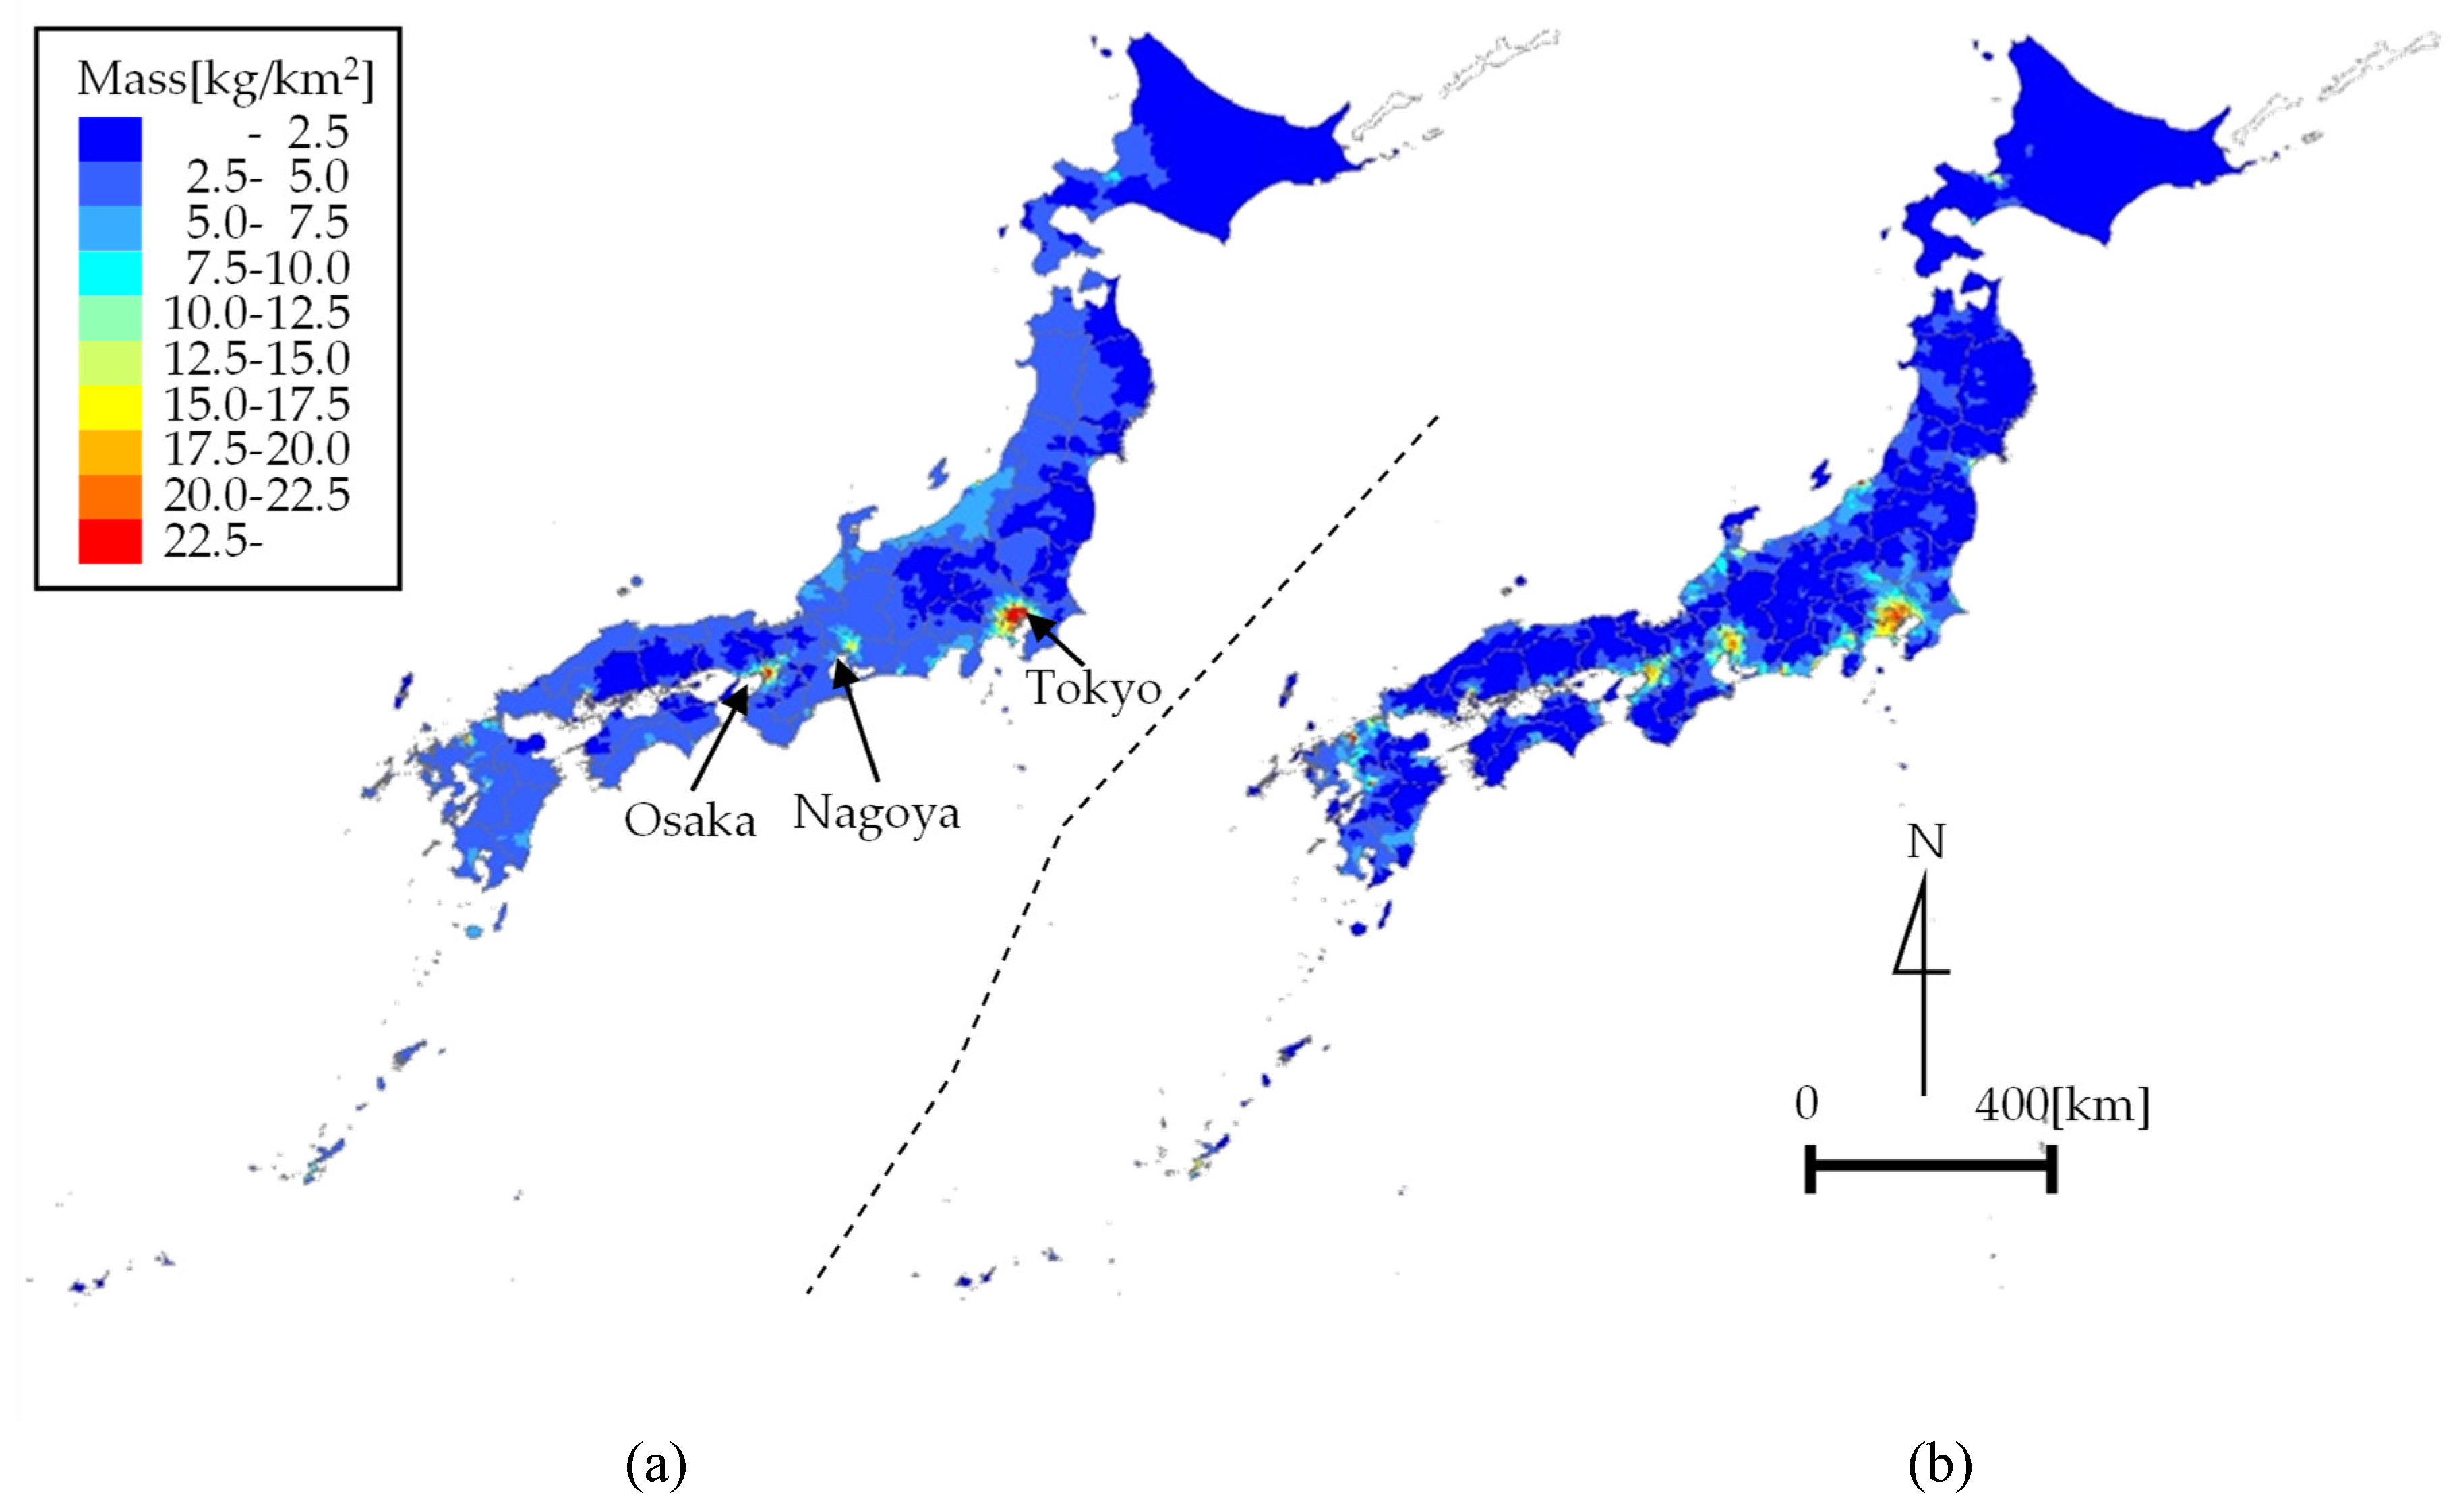
Plastic emissions maps of Japan are shown in Figure 9 and show the regional emissions characteristics. A linear approximation was used for calculating the MicP mass concentrations using Equations (10) and (12), and a value of 3.13 was used as the mass concentration ratio, a. The result in this case represents the median of 32 cases of total plastic input. From the results shown in Figure 9, it is clear that plastic emissions were larger with higher population densities and more urbanized areas in both the Tokyo metropolitan area and in other large cities, especially Nagoya and Osaka. Moreover, the results for population density and urban area ratio exhibit similar patterns because they have similar distributions. It is noteworthy that our method allows for the mapping of plastic emissions at a very high-resolution (1 km grid). Therefore, using this method, it is also possible to calculate the plastic emissions for each river basin and each administrative district individually. As an example, Table A2 shows the minimum, median, and maximum values of plastic emissions by prefecture across Japan.

4. Discussion

4.1. Total Plastic Input from the Land to the Sea

As mentioned in Section 3.4, we estimated the plastic input from the land to the sea as 210–4776 t/yr in Japan. In previous studies, the plastic inputs estimated for Japan ranged from 21,000 to 57,000 t/yr [12] and from 190 to 1050 t/yr [41]. Therefore, the value estimated in this study is at least one order of magnitude lower than that of Jambeck et al. [12] and is close to the results of Lebreton et al. [41]. Lebreton et al. [41] estimated plastic input in accordance with extensive MicP and MacP data measured in rivers, while Jambeck et al. [12] did not compare all of these metrics. Thus, we determined that the values estimated by Lebreton et al. [41] can be used to calculate the actual plastic input more accurately, which would suggest that the plastic input calculated in this study was fundamentally accurate.
The plastic input estimated in this study largely depended upon the measurement of MicP and the subsequent evaluation of MacP concentrations. The amount of MicP data was very large, including 70 rivers and 90 sites across Japan, representing a sufficient dataset for the current scope of research. However, the measured MicP values were mainly obtained under low-flow conditions, wherein the influence of flooding was minor. We have also previously investigated MicP concentrations during a period of flooding in the Edo River, which flows into Tokyo Bay, Japan, and showed that the concentrations under flood conditions were one order of magnitude higher than under low-flow conditions [44]. The annual MicP transport in the Edo River was calculated using the LQ relation, in which L is MicP transport and Q is discharge. This relationship is generally used for material transport analyses. As a result, the contributions of number and mass MicP transports at the time of flooding to the overall totals were quite high, at 73.5% and 84.1%, respectively. From this, we considered that the MicP input in this study, which was based on data collected only under low-flow conditions, corresponded to a minimum value. Therefore, it will be necessary to collect MicP concentration data during flood periods in the future.
It is important to note that the MicP concentrations in rivers are generally affected by wastewater treatment plants (WWTP) [38]. In this study, we did not directly incorporate the effect of WWTP in the evaluation of MicP emissions at a 1 km grid. It is therefore necessary to calculate the MicP input from land to sea including the influences of the WWTPs. The evaluation of plastic emission from land to sea in this study was based on the MicP concentrations measured in rivers. Our model does not, therefore, incorporate the plastic sources located on the shorelines, which can directly outflow plastics to the sea, not via rivers. Sources near the shorelines such as public beaches, resort areas, and industrial sites are important for accurately evaluating plastic input from land to sea.
Since the amount of MacP concentration data was much smaller than that of MicP, we examined the MacP/MicP value using data from previous studies [41,42]. As a result, four values (2.24, 3.13, 7.66, and 8.50) were used as MacP/MicP. It is known that MacP concentrations increase during flooding, as do MicP concentrations [45], and it is essential to estimate the MacP input considering data at the time of flooding. However, the methods of observing MacPs has not yet been sufficiently studied, even when compared with those of MicPs. In particular, a method of measuring MacP during flooding, when various types of suspended matter flow downstream, has not been established. In order to solve such problems, Kataoka and Nihei [55] have proposed a MacP survey method that combines video image captures and image analyses of the river water surfaces, along with safety considerations. In the future, it will be essential to collect MacP concentration data using these methods to improve the accuracy of plastic emissions evaluations.

4.2. Map of Plastic Emissions

An important result obtained in this study is the creation of a high-resolution map of plastic emissions across Japan, as shown in Figure 9. Since this map was based on the correlation between the MicP mass concentration and land area data, such as urban area ratio and population density, it was possible to create high-resolution maps. This technique is expected to be useful for planning plastic waste countermeasures and selecting priority areas for such activities more precisely, unlike conventional plastic emissions maps organized by country. If the same correlation can be obtained by collecting MicP data in other countries, it may be possible to create similar high-resolution maps of plastic emissions worldwide. Therefore, the method of estimating plastic emissions introduced in this study is highly versatile.
As the same formula was used for the MicP concentrations and land area data across Japan, the calculated plastic emissions depend only on the land area data. Even with the same urban area ratio (or population density), it is possible that regional differences will occur. Specifically, the status of sewerage development in a basin has a large effect on the emission of MicPs, as plastic emissions vary with the sewerage area for the same urban area ratio. Additionally, it is expected that the amount of littering will change depending on the consciousness of the residents in the basin. In that case, even at the same population density, there may be a large difference in MacP emissions (and thus, secondary MicP emissions). To consider such regional differences in estimating plastic emissions, it is necessary to collect more observational data on MicP and MacP concentrations and refine our calculations for each region. In addition, it is necessary to determine the sources of MicP and MacP in each land area. To this end, the accumulation of measured MicP and MacP concentrations in rivers will be indispensable in the future.

Author Contributions

Conceptualization; Y.N. and T.Y., Data curation; all, Funding acquisition; Y.N. and T.K., Methodology; all, Supervision; Y.N., Visualization; T.K. and R.O., Writing—original draft; Y.N. and T.K., Writing—review and editing; Y.N., T.K., and T.K. All authors have read and agreed to the published version of the manuscript.

Funding

This work was supported by the Japan Society for the Promotion of Science KAKENHI program (grant number: 17H04937), the River Fund of the River Foundation (grant number: 2019-5211-050), and the Tokyo University of Science Grant for President’s Research Promotion.

Acknowledgments

We wish to express our appreciation to Yoriko Murakami and the many students at the hydraulics laboratory at the Tokyo University of Science for their assistance in collecting and analyzing the microplastics. We would like to thank Editage (www.editage.com) for English language editing.

Conflicts of Interest

The authors declare no conflict of interest.

Appendix A

Figure A1. Annual precipitation (a), evapotranspiration (b), surface runoff (c), and underground infiltration (d) obtained from the water-balance analysis.
Water 12 00951 g0a1
Table A1. MicP numerical concentration Cn (particles/m3) and mass concentration Cm (mg/m3), and basin characteristics for the 70 rivers and 90 sites used in this study. For the basin characteristics, population density Wp (persons/km2) and urban area ratio Wu (%) in the upstream area of each observation site are shown.
No.RiverSurvey SiteCnCmWpWu
1Koetoi R.Komatsu0.19 0.00 41
2Shimoebekorobetsu R.Toyotomi1.81 0.19 61
3Ishikari R.Tachihu-oohashi4.11 0.69 382
4Toyohira R.Nijunijo-oohashi1.24 0.06 1263
5Kitakami R.Meiji0.14 0.00 1415
6aMogami R.Shonai-oohashi0.36 0.08 1306
6bMogami R.Kurotaki0.49 0.12 1828
6dMogami R.Konoki1.48 0.02 946
7Su R.Ochiai8.12 1.52 36215
8Abukuma R.Tenjin0.39 0.01 21610
9Kuji R.Tomioka0.03 0.00 593
10Naka R.Nakagawa0.70 0.03 1458
11Sakura R.Sakaeri2.46 0.74 26517
12Kinu R.Toyomizu0.40 0.01 5411
13Watarase R.Nowatari1.53 0.07 42915
14aTone R.Sakae0.37 0.07 47517
14bTone R.Tonegawa8.68 2.36 32914
14cTone R.Bando0.17 0.03 41414
15aOhori R.Kisaki4.40 3.31 716185
15bOhori R.Kachi12.88 1.08 606682
16Edo R.Noda3.32 0.58 236657
17aNaka R.Yoshikoshi2.31 1.78 178445
17bNaka R.Shinkai5.98 1.74 100037
18aAra R.Hanekura4.57 0.97 63617
18bAra R.Kaihei7.40 1.37 40312
18cAra R.Onari8.35 0.32 2198
18dAra R.Kumagaya4.59 0.05 1577
18eAra R.Tamayodo0.44 0.02 1285
18fAra R.Kyu-titibu1.15 0.16 783
19Ichino R.Matsunaga2.09 0.43 100242
20Musashi ChannelGese1.31 0.04 33012
21Yoshino R.Mannen17.27 0.59 44526
22Yoro R.Kasumi0.71 0.00 20810
23Obitsu R.Nakagawa3.29 0.15 1106
24Koito R.Rokusan1.43 0.12 1165
25Tama R.Maruko1.11 0.24 293131
26aTsurumi R.Shinyokohama14.24 3.33 661972
26bTsurumi R.Kamoike13.81 3.62 687773
26cTsurumi R.Kawawakitahassaku30.67 1.52 575967
26dTsurumi R.Ochiai6.15 1.16 675272
26eTsurumi R.Onmawari10.52 2.11 523066
26fTsurumi R.Sumiyoshi2.59 0.32 576823
27Sagami R.Sagami-oohashi0.30 0.04 44612
28Toneunga R.Fureai12.66 2.81 133350
29Hayakido R.Shibasawa3.51 0.13 352
30Saka R. Midori0.60 0.46 60026
31Shonai R.Shin-meisei63.89 16.15 204544
32Kiso R.Kawashima-oohashi0.55 0.04 792
33Nagara R.Nagara-oohashi1.79 0.04 1106
34Ibi R.Ibi-oohashi1.01 0.01 723
35Kuzuryu R.Nakakado2.01 0.06 724
36Asuwa R.Kujuku7.35 1.70 1445
37Kamo R.Kyoukawa4.93 0.77 237830
38Katsura R.Miyamae9.57 3.61 92414
39Uji R.Gokou1.83 1.20 33311
40Yodo R.Hijikata2.01 0.11 49112
41Ina R.Minamizono6.39 0.68 126122
42aYamato R.Taisho6.94 0.37 126630
42bYamato R.Gokou-oohashi11.09 2.52 119231
43Toga R.Shimokawara1.38 0.03 427628
44Ikuta R.Nunohiki0.220.013033
45Sendai R.Sendai-oohashi0.990.01834
46Tenjin R.Tenjin1.950.04864
47Hino R.Shin-hino0.450.04252
48Hii R.Mizuho-oohashi0.280.01534
49Goemon R.Hinode3.980.4564329
50Asahi R.Okakita-oohashi0.900.04704
51Nishiki R.Gosho-oohashi0.110.00212
52Saba R.Okinohara0.120.00191
53Fushino R.Takada0.650.0233913
54aMononobe R.Mononobe1.070.12261
54bMononobe R.Matchida1.480.18211
55Niyodo R.Niyodo-oohashi3.760.03432
56aShimanto R.Rivermouth1.350.04372
56bShimanto R.Downstream0.390.00372
57Shigenobu R.Deai0.640.0665812
58Yaoshi.RSeisei0.260.002188
59Hiji R.Hatanomae0.420.03938
60Onga R.Kanroku1.270.0750819
61Hikosan R.Okamori5.243.0440617
62Kagetsu R.Kagetsugawa1.370.051004
63Kikuchi R.Yamagaseibu-oohashi2.283.1118111
64Kuro R.Kurumagaeri0.210.011259
65Shira R.Yotsugi5.510.0133412
66Midori R.Medomachi8.250.43675
67Kuma R.Seibu-oohashi0.840.11503
68Sendai R.Miyanojo1.210.68686
69Fukido R.South side0.230.0200
70aMiyara R.Kainan12.770.62122
70bMiyara R.Kawara0.970.31112
Table A2. Minimum, median, and maximum values of plastic emissions by prefecture (Unit: t/yr).
PrefectureLowMiddleHighPrefectureLowMiddleHigh
Hokkaido5.2 91.6 594.1 Shiga2.1 14.1 47.2
Aomori1.5 26.3 101.5 Kyoto2.6 16.3 59.3
Iwate0.5 33.6 158.1 Osaka7.8 24.0 60.5
Miyagi3.8 21.8 74.0 Hyogo6.3 28.8 100.7
Akita0.8 38.1 175.3 Nara2.2 12.8 49.2
Yamagata1.2 32.7 137.9 Wakayama1.4 18.7 73.9
Fukushima2.2 35.3 136.4 Tottori1.1 13.3 49.7
Ibaraki3.7 23.5 76.9 Shimane0.6 18.9 80.2
Tochigi3.9 21.6 73.2 Okayama2.7 17.2 61.3
Gunma3.5 18.4 62.7 Hiroshima3.2 24.0 87.9
Saitama7.0 28.5 81.9 Yamaguchi2.0 20.8 74.6
Chiba6.7 31.2 94.9 Tokushima1.3 14.0 56.6
Tokyo12.7 36.0 103.4 Kagawa1.1 5.9 20.0
Kanagawa10.0 31.6 83.0 Ehime1.6 18.0 67.5
Yamanashi1.5 12.9 47.6 Kochi1.2 23.1 121.6
Nagano2.0 36.2 138.7 Fukuoka7.6 35.1 107.2
Niigata7.2 70.6 257.8 Saga2.1 12.1 38.5
Toyama3.9 24.1 82.7 Nagasaki2.2 16.0 55.3
Ishikawa3.3 22.2 77.5 Kumamoto4.0 33.9 122.8
Fukui2.4 19.8 72.0 Oita1.7 21.2 78.9
Gifu5.5 43.2 162.9 Miyazaki2.5 35.5 136.0
Shizuoka9.0 45.0 146.1 Kagoshima3.2 40.4 149.3
Aichi8.7 40.4 117.3 Okinawa2.6 11.2 36.7
Mie5.0 26.5 91.2

References

  1. Plastics Europe. Association of Plastic Manufacturers; Plastics Europe: Brussles, Belgium, 2016. [Google Scholar]
  2. Laist, D.W. Overview of the biological effects of lost and discarded plastic debris in the marine environment. Mar. Pollut. Bull. 1987, 18, 319–326. [Google Scholar] [CrossRef]
  3. Hansen, J. Draft position statement on plastic debris in marine environments. Fisheries 1990, 15, 16–17. [Google Scholar]
  4. Pruter, A.T. Sources, quantities and distribution of persistent plastics in the marine environment. Mar. Pollut. Bull. 1987, 18, 305–310. [Google Scholar] [CrossRef]
  5. Gregory, M.R. The hazards of persistent marine pollution: Drift plastics and conservation islands. J. R. Soc. N. Z. 1991, 21, 83–100. [Google Scholar] [CrossRef]
  6. Gregory, M.R.; Ryan, P.G. Pelagic plastics and other seaborne persistent synthetic debris: A review of Southern Hemisphere perspectives. In Marine Debris—Sources, Impacts and Solutions; Coe, J.M., Rogers, D.B., Eds.; Springer: New York, NY, USA, 1997; pp. 49–66. [Google Scholar]
  7. Derraik, J.G. The pollution of the marine environment by plastic debris: A review. Mar. Pollut. Bull. 2002, 44, 842–852. [Google Scholar] [CrossRef]
  8. Law, K.L.; Thompson, R.C. Microplastics in the seas. Science 2014, 345, 144–145. [Google Scholar] [CrossRef]
  9. Cózar, A.; Echevarría, F.; González-Gordillo, J.I.; Irigoien, X.; Úbeda, B.; Hernández-León, S.; Palma, A.T.; Navarro, S.; García-de-Lomas, J.; Ruiz, A.; et al. Plastic debris in the open ocean. Proc. Natl. Acad. Sci. USA 2014, 111, 10239–10244. [Google Scholar] [CrossRef] [PubMed] [Green Version]
  10. Shaw, D.G. Pelagic tar and plastic in the Gulf of Alaska and BeringSea: 1975. Sci. Total Environ. 1977, 8, 13–20. [Google Scholar] [CrossRef]
  11. Williams, A.T.; Simmons, S.L. Estuarine litter at the river/beach interface in the Bristol Channel, United Kingdom. J. Coast. Res. 1997, 13, 1159–1165. [Google Scholar]
  12. Jambeck, J.R.; Geyer, R.; Wilcox, C.; Siegler, T.R.; Perryman, M.; Andrady, A.; Narayan, R.; Law, K.L. Plastic waste inputs from land into the ocean. Science 2015, 347, 768–771. [Google Scholar] [CrossRef]
  13. Thompson, R.C.; Olsen, Y.; Mitchell, R.P.; Davis, A.; Rowland, S.J.; John, A.W.G.; McGonigle, D.; Russell, A.E. Lost at sea: Where is all the plastic? Science 2004, 34, 838. [Google Scholar] [CrossRef] [PubMed]
  14. Carpenter, E.J.; Smith, K.L. Plastics on the Sargasso Sea surface. Science 1972, 175, 1240–1241. [Google Scholar] [CrossRef] [PubMed]
  15. Rothstein, S.I. Plastic particle pollution of the surface of the Atlantic Ocean: Evidence from a seabird. Condor 1973, 75, 344–345. [Google Scholar] [CrossRef]
  16. Eriksen, M.; Lebreton, L.C.M.; Carson, H.S.; Thiel, M.; Moore, C.J.; Borerro, J.C.; Galgani, F.; Ryan, P.G.; Reisser, J. Plastic pollution in the world’s oceans: More than 5 trillion plastic pieces weighing over 250,000 tons afloat at sea. PLoS ONE 2014, 9, e111913. [Google Scholar] [CrossRef] [Green Version]
  17. Mato, Y.; Isobe, T.; Takada, H.; Kanehiro, H.; Ohtake, C.; Kaminuma, T. Plastic resin pellets as a transport medium for toxic chemicals in the marine environment. Environ. Sci. Technol. 2001, 35, 318–324. [Google Scholar] [CrossRef]
  18. Tanaka, K.; Takada, H.; Yamashita, R.; Mizukawa, K.; Fukuwaka, M.A.; Watanuki, Y. Accumulation of plastic-derived chemicals in tissues of seabirds ingesting marine plastics. Mar. Pollut. Bull. 2013, 69, 219–222. [Google Scholar] [CrossRef]
  19. Koelmans, A.A.; Besseling, E.; Wegner, A.; Foekema, E.M. Plastic as a carrier of POPs to aquatic organisms: A model analysis. Environ. Sci. Technol. 2013, 47, 7812–7820. [Google Scholar] [CrossRef]
  20. Browne, M.A.; Dissanayake, A.; Galloway, T.S.; Lowe, D.M.; Thompson, R.C. Ingested microscopic plastic translocates to the circulatory system of the mussel, Mytilus edulis (L). Environ. Sci. Technol. 2008, 42, 5026–5031. [Google Scholar] [CrossRef]
  21. Boerger, C.M.; Lattin, G.L.; Moore, S.L.; Moore, C.J. Plastic ingestion by planktivorous fishes in the North Pacific Central Gyre. Mar. Pollut. Bull. 2010, 60, 2275–2278. [Google Scholar] [CrossRef]
  22. Cole, M.; Lindeque, P.; Halsband, C.; Galloway, T.S. Microplastics as contaminants in the marine environment: A review. Mar. Pollut. Bull. 2011, 62, 2588–2597. [Google Scholar] [CrossRef]
  23. Tanaka, K.; Takada, H. Microplastic fragments and microbeads in digestive tracts of planktivorous fish from urban coastal waters. Sci. Rep. 2016, 6, 34351. [Google Scholar] [CrossRef] [PubMed]
  24. Andrady, A.L. Microplastics in the marine environment. Mar. Pollut. Bull. 2011, 62, 1596–1605. [Google Scholar] [CrossRef]
  25. Hidalgo-Ruz, V.; Gutow, L.; Thompson, R.C.; Thiel, M. Microplastics in the marine environment: A review of the methods used for identification and quantification. Environ. Sci. Technol. 2012, 46, 3060–3075. [Google Scholar] [CrossRef]
  26. Law, K.L.; Moret-Ferguson, S.; Goodwin, D.S.; Zettler, E.R.; DeForce, E.; Kukulka, T.; Proskurowski, G. Distribution of surface plastic debris in the eastern Pacific Ocean from an 11-year. Environ. Sci. Technol. 2014, 48, 4732–4738. [Google Scholar] [CrossRef] [PubMed]
  27. Law, K.L.; Moret-Ferguson, S.; Maximenko, N.A.; Proskurowski, G.; Peacock, E.E.; Hafner, J.; Reddy, C.M. Plastic accumulation in the North Atlantic subtropical gyre. Science 2015, 329, 1185–1188. [Google Scholar] [CrossRef] [PubMed] [Green Version]
  28. Isobe, A.; Uchida, K.; Tokai, T.; Iwasaki, S. East Asian seas: A hot spot of pelagic microplastics. Mar. Pollut. Bull. 2015, 101, 618–623. [Google Scholar] [CrossRef]
  29. Kershaw, P.J.; Rochman, C.M. Sources, fate and effects of microplastics in the marine environment: Part 2 of a global assessment. Rep. Stud. 2016, 93, 216. [Google Scholar]
  30. Wagner, M.; Scherer, C.; Alvarez-Muñoz, D.; Brennholt, N.; Bourrain, X.; Buchinger, S.; Fries, E.; Grosbois, C.; Klasmeier, J.; Marti, T.; et al. Microplastics in freshwater ecosystems: What we know and what we need to know. Environ. Sci. Eur. 2014, 26, 12. [Google Scholar] [CrossRef] [Green Version]
  31. Moore, C.J.; Lattin, G.L.; Zellers, A.F. Quantity and type of plastic debris flowing from two urban rivers to coastal waters and beaches of Southern California. Rev. Gest. Costeira Integr. J. Integr. Coast. Zone Manag. 2011, 11, 65–73. [Google Scholar] [CrossRef]
  32. Eriksen, M.; Mason, S.; Wilson, S.; Box, C.; Zellers, A.; Edwards, W.; Farley, H.; Amato, S. Microplastic pollution in the surface waters of the Laurentian Great Lakes. Mar. Pollut. Bull. 2013, 77, 177–182. [Google Scholar] [CrossRef]
  33. Mani, T.; Hauk, A.; Walter, U.; Burkhardt-Holm, P. Microplastics profile along the Rhine river. Sci. Rep. 2014, 5, 17988. [Google Scholar] [CrossRef] [PubMed]
  34. Yonkos, L.T.; Friedel, E.A.; Perez-Reyes, A.C.; Ghosal, S.; Arthur, C.D. Microplastics in four estuarine rivers in the Chesapeake Bay, U.S.A. Environ. Sci. Technol. 2014, 48, 14195–14202. [Google Scholar] [CrossRef] [PubMed]
  35. Eerkes-Medrano, D.; Thompson, R.C.; Aldridge, D.C. Microplastics in freshwater systems: A review of the emerging threats, identification of knowledge gaps and prioritisation of research needs. Water Res. 2015, 75, 63–82. [Google Scholar] [CrossRef] [PubMed]
  36. Dris, R.; Gasperi, J.; Rocher, V.; Saad, M.; Renault, N.; Tassin, B. Microplastic contamination in an urban area: A case study in Greater Paris. Environ. Chem. 2015, 12, 592–599. [Google Scholar] [CrossRef]
  37. McCormick, A.R.; Hoellein, T.J.; London, M.G.; Hittie, J.; Scott, J.W.; Kelly, J.J. Microplastic in surface waters of urban rivers: Concentration, sources, and associated bacterial assemblages. Ecosphere 2016, 7, e01556. [Google Scholar] [CrossRef]
  38. Murphy, F.; Ewins, C.; Carbonnier, F.; Quinn, B. Wastewater treatment works (WwTW) as a Source of microplastics in the aquatic environment. Environ. Sci. Technol. 2016, 50, 5800–5808. [Google Scholar] [CrossRef] [Green Version]
  39. Verster, C.; Minnaar, K.; Bouwman, H. Marine and freshwater microplastic research in South Africa. Integr. Environ. Assess. Manag. 2017, 13, 533–535. [Google Scholar] [CrossRef]
  40. Kataoka, T.; Nihei, Y.; Kudou, K.; Hinata, H. Assessment of the sources and inflow processes of microplastics in the river environments of Japan. Environ. Pollut. 2019, 244, 958–965. [Google Scholar] [CrossRef]
  41. Lebreton, L.C.M.; van der Zwet, J.; Damsteeg, J.-W.; Slat, B.; Andrady, A.; Reisser, J. River plastic emissions to the world’s oceans. Nat. Commun. 2017, 8, 15611. [Google Scholar] [CrossRef]
  42. Schmidt, C.; Krauth, T.; Wagner, S. Export of plastic debris by rivers into the sea. Environ. Sci. Technol. 2017, 51, 12246–12253. [Google Scholar] [CrossRef]
  43. Siegfred, M.; Koelmans, A.A.; Besseling, E.; Kroeze, C. Export of microplastics from land to sea. A modelling approach. Water Res. 2017, 127, 249–257. [Google Scholar] [CrossRef] [PubMed]
  44. Kudo, K.; Kataoka, T.; Nihei, Y.; Kitaura, F. Estimation of temporal variations and annual flux of microplastics in rivers under low- and high-flow conditions. J. Jpn. Soc. Civ. Eng. Ser. B1 (Hydraul. Eng.) 2018, 74, 529–534. (In Japanese) [Google Scholar] [CrossRef]
  45. Kataoka, T.; Hinata, H.; Nihei, Y. Numerical estimation of inflow flux of floating natural macro-debris into Tokyo Bay. Estuar. Coast. Shelf Sci. 2013, 134, 69–79. [Google Scholar] [CrossRef]
  46. Motovilov, Y.G.; Gottschalk, L.; Engeland, K.; Rodhe, A. Validation of a distributed hydrological model against spatial observations. Agric. For. Meteorol. 1999, 98, 257–277. [Google Scholar] [CrossRef]
  47. Sayama, T.; Ozawa, G.; Kawakami, T.; Nabesaka, S.; Fukami, K. Rainfall–runoff–inundation analysis of the 2010 Pakistan flood in the Kabul River basin. Hydrol. Sci. J. 2012, 57, 298–312. [Google Scholar] [CrossRef]
  48. Sawano, S.; Hotta, N.; Tanaka, N.; Suboyama, Y.; Suzuki, M. Development of a simple forest evapotranspiration model using a process-oriented model as a reference to parameterize data from a wide range of environmental conditions. Ecol. Model. 2015, 309–310, 93–109. [Google Scholar] [CrossRef]
  49. Motoyama, H. Simulation of seasonal snowcover based on air temperature and precipitation. J. Appl. Meteorol. 1990, 29, 1104–1110. [Google Scholar] [CrossRef] [Green Version]
  50. Suzuki, M.; Fukusima, Y. Estimates of evapotranspiration from land surface in Shiga Prefecture using digitalized square-grid map database. Lake Biwa Study Monogr. 1995, 2, 1–55. [Google Scholar]
  51. Research Group of Evapotranspiration. Evapotranspiration from paddy field. J. Agric. Meteorol. 1967, 22, 13–21. (In Japanese) [Google Scholar]
  52. Kondo, J Evaporation from lake or sea surface. Weather 2012, 59, 75–78. (In Japanese)
  53. Chow, V.T.; Maidment, D.R.; Mays, L.W. Applied Hydrology; McGraw Hill: New York, NY, USA, 1988. [Google Scholar]
  54. Montgomery, D.C.; Peck, E.A.; Vining, G.G. Introduction to Linear Regression Analysis; John Wiley & Sons: Hoboken, NJ, USA, 2012; p. 821. [Google Scholar]
  55. Kataoka, T.; Nihei, Y. Quantification of floating riverine macro-debris transport using an image processing approach. Sci. Rep. 2020, 10, 1–11. [Google Scholar] [CrossRef] [PubMed] [Green Version]
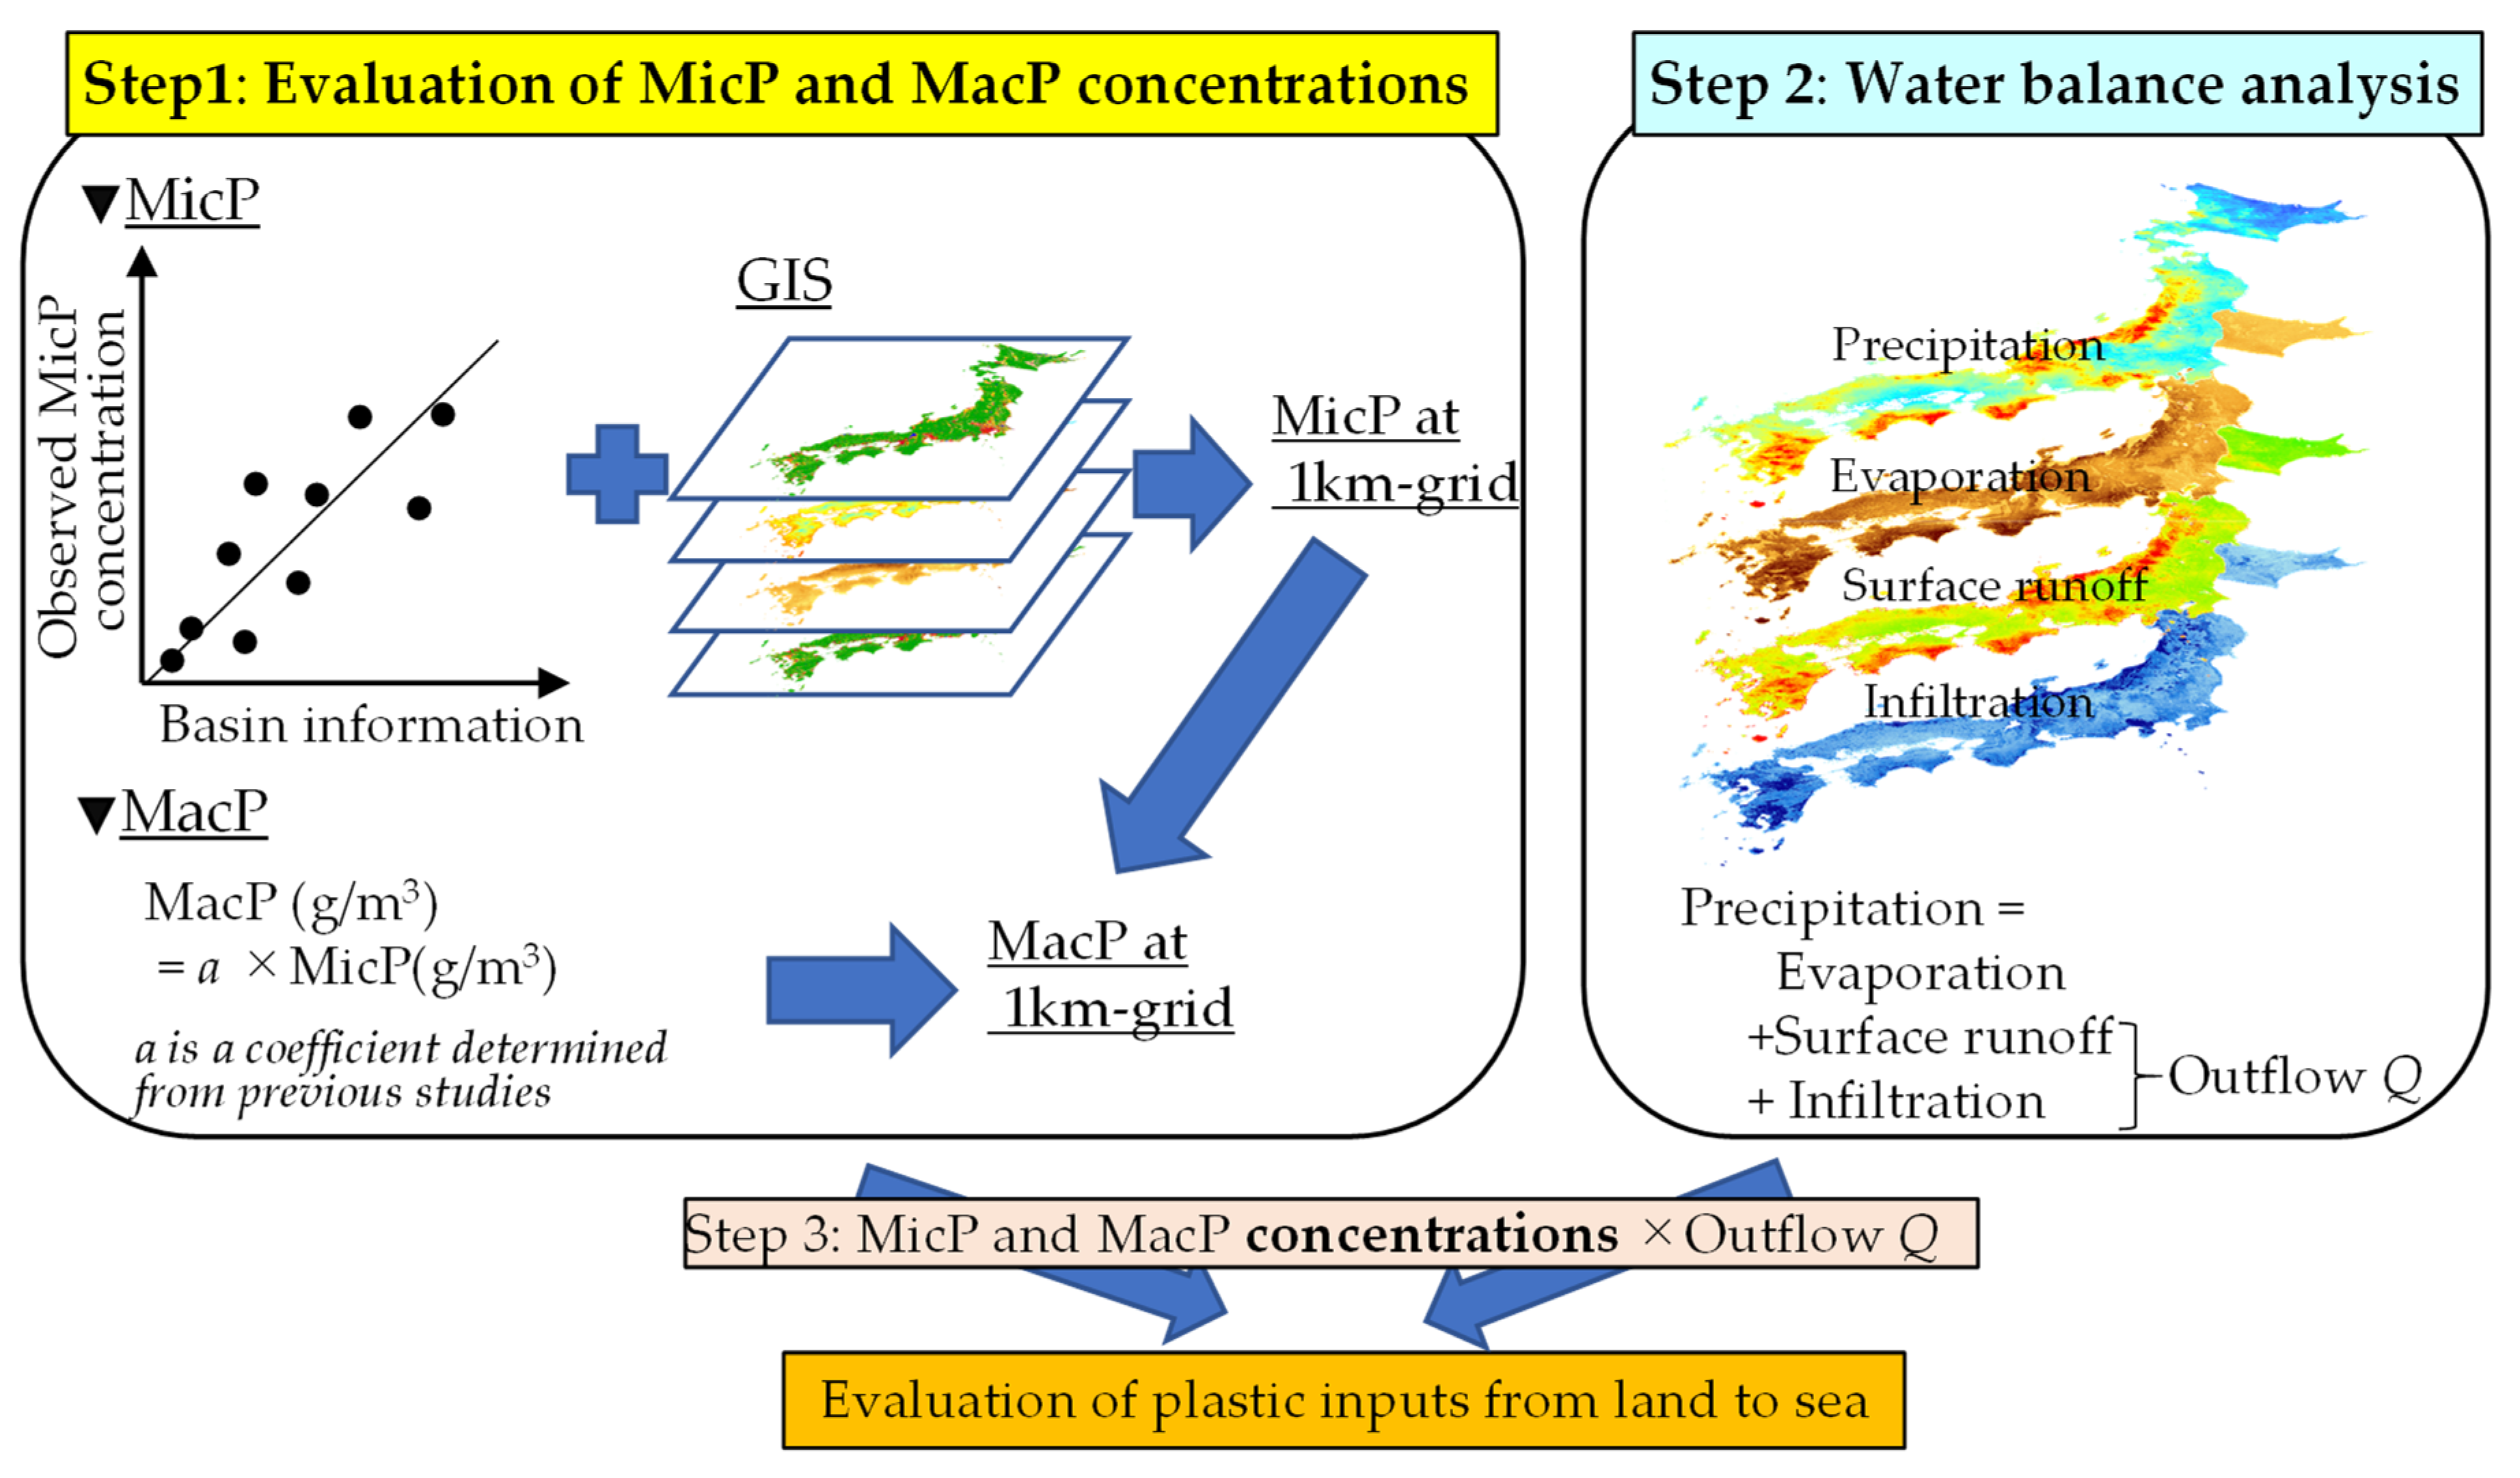
Figure 1. Schematic of the conceptual framework used to evaluate plastic inputs from the land to the sea in this study.
Water 12 00951 g001
Figure 2. Measurement sites and measured MicP numerical concentrations in rivers.
Water 12 00951 g002
Figure 3. Percentiles of MicP numerical concentration (a) and mass concentration (b) for all data. The x-axis is displayed on a logarithmic scale.
Water 12 00951 g003
Figure 4. Relationship between the MicP numerical concentration Cn and mass concentrations Cm for all data. The solid line represents a linear approximation of the data and the regression coefficient (=0.201 (mg/particle)) corresponds to the mean mass (mg) per MicP particle.
Water 12 00951 g004
Figure 5. Correlation between MicP concentrations and population density, Wp, (a) and urban ratio, Wu, (b) for raw and moving average data. The stippled line represents the 95% confidence interval around the linear approximation.
Water 12 00951 g005
Figure 6. Correlation between annually observed discharge, Qobs, and calculated river discharge, Qcal, at the mouths of 109 class-A river systems. The dashed line represents a 1:1 correspondence.
Water 12 00951 g006
Figure 7. Box plots for the mass concentrations of MicP and MacP (a) and the value of MacP/MicP mass concentrations at each measurement site (b). These figures were based on the measurement data of Lebreton et al. [41]. The solid line represents the mean values; the tops and bottoms of the boxes denote the 75% and 25% quartiles, respectively, and the top and bottom of the error bars show the maximum and minimum values, excluding outliers. Crosses denote the mean data.
Water 12 00951 g007
Figure 8. Box plots for annual inputs of MicP, MacP, and total plastics from the land to the sea in Japan.
Water 12 00951 g008
Figure 9. Total plastic emissions over 1 km grids in Japan. The MicP mass concentrations were evaluated via linear approximation for population density (a) and urban area ratio (b) with the same ratio of MacP/MicP = 3.13. Warmer colors indicate higher emissions, while cooler colors indicate lower emissions.
Water 12 00951 g009
Table 1. Evaluation for evapotranspiration, E, surface runoff, Qs, and underground infiltration, Qi, in the present study.
Land UseEQsQi
MajorDetailsCoefficient f
ForestForestsEquation (1)0.5 (Quaternary volcanic rock) 0.8(Other)Equation (6)
BushesEquation (2)0.3Equation (6)
Mountainous bushesPQs0.950
Agriculture areaPaddy fieldsIrrigationEquation (3)0.8Equation (6)
No irrigation Equation (2)0.3Equation (6)
OtherEquation (2)0.3Equation (6)
Urban areaBuilding sitesInfiltration areaEquation (2)0.3Equation (6)
No-infiltration areaPQs0.950
Road, railways, and othersPQs0.950
OtherGolf coursesEquation (2)0.3Equation (6)
Rivers and lakesEquation (4)PE0
Table 2. Annual inputs of MicP numbers and masses from land to the sea in Japan, obtained using linear approximations of y ± Δ y / 2 (confidence interval: 95%) obtained from raw data, and curves approximated for moving average data.
VariablesApproximationNumberMass
Equation1012 ParticlesEquationTons
Population density, WpLinear y91.6710293.6
Linear y + Δy/27,8,92.547,8,10502.8
Linear y − Δy/27,8,90.817,8,1084.5
Curve131.3914204.1
Urban ratio, WuLinear y111.4112228.1
Linear y + Δy/27,8,112.267,8,12435.7
Linear y − Δy/27,8,110.557,8,1265.1
Curve151.2716217.9
Low0.5565.1
Middle1.40223.0
High2.54502.8
Table 3. Summary of the coefficient, a, which is the ratio of the MacP and MicP mass concentrations.
Evaluation of MacP/MicPLebreton et al. [41]Schmidt et al. [42]
Median (MacP)/Median (MicP)7.660.77
Mean (MacP)/Mean (MicP)2.243.13
Median (MacP/MicP)8.50-
Mean (MacP/MicP)20.66-