3.1. The Flow Velocity Distribution of The Upstream Section of the Capsule
Taking Z = 0.1 m and Z = 3 m away from the upstream sections of the capsule as examples, the flow velocity distribution of the upstream sections of the capsule during material transportation was analyzed.
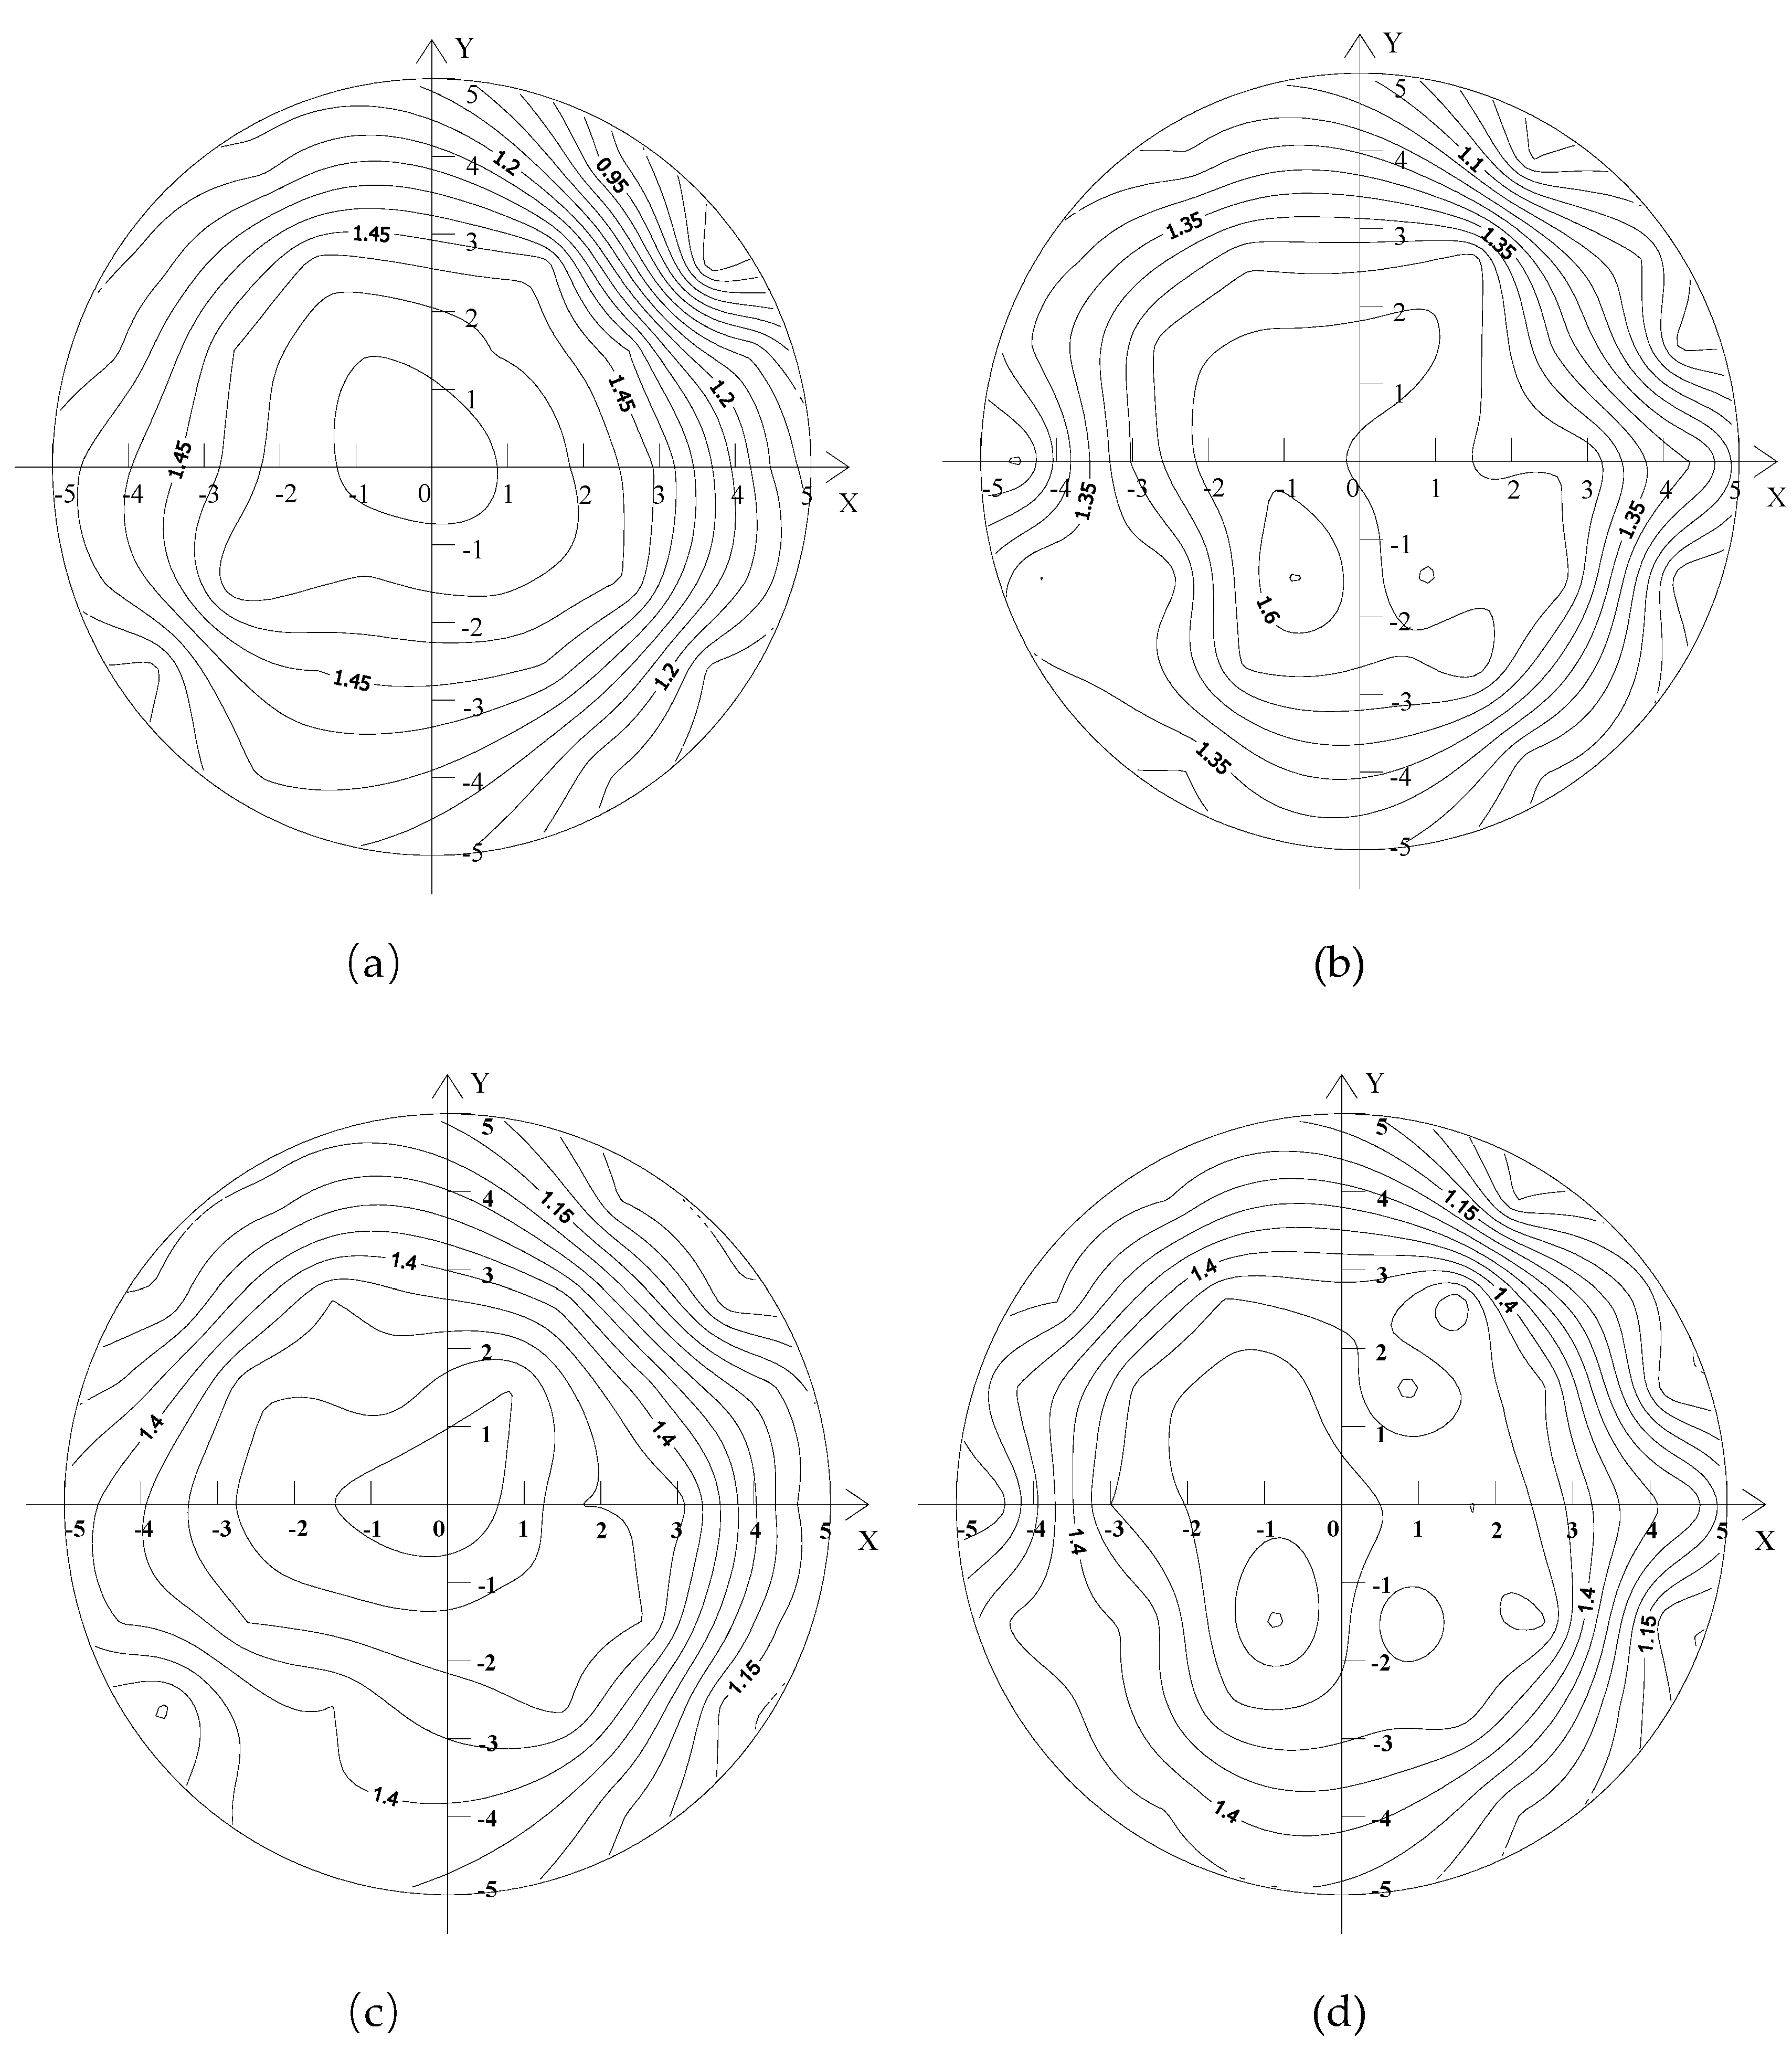
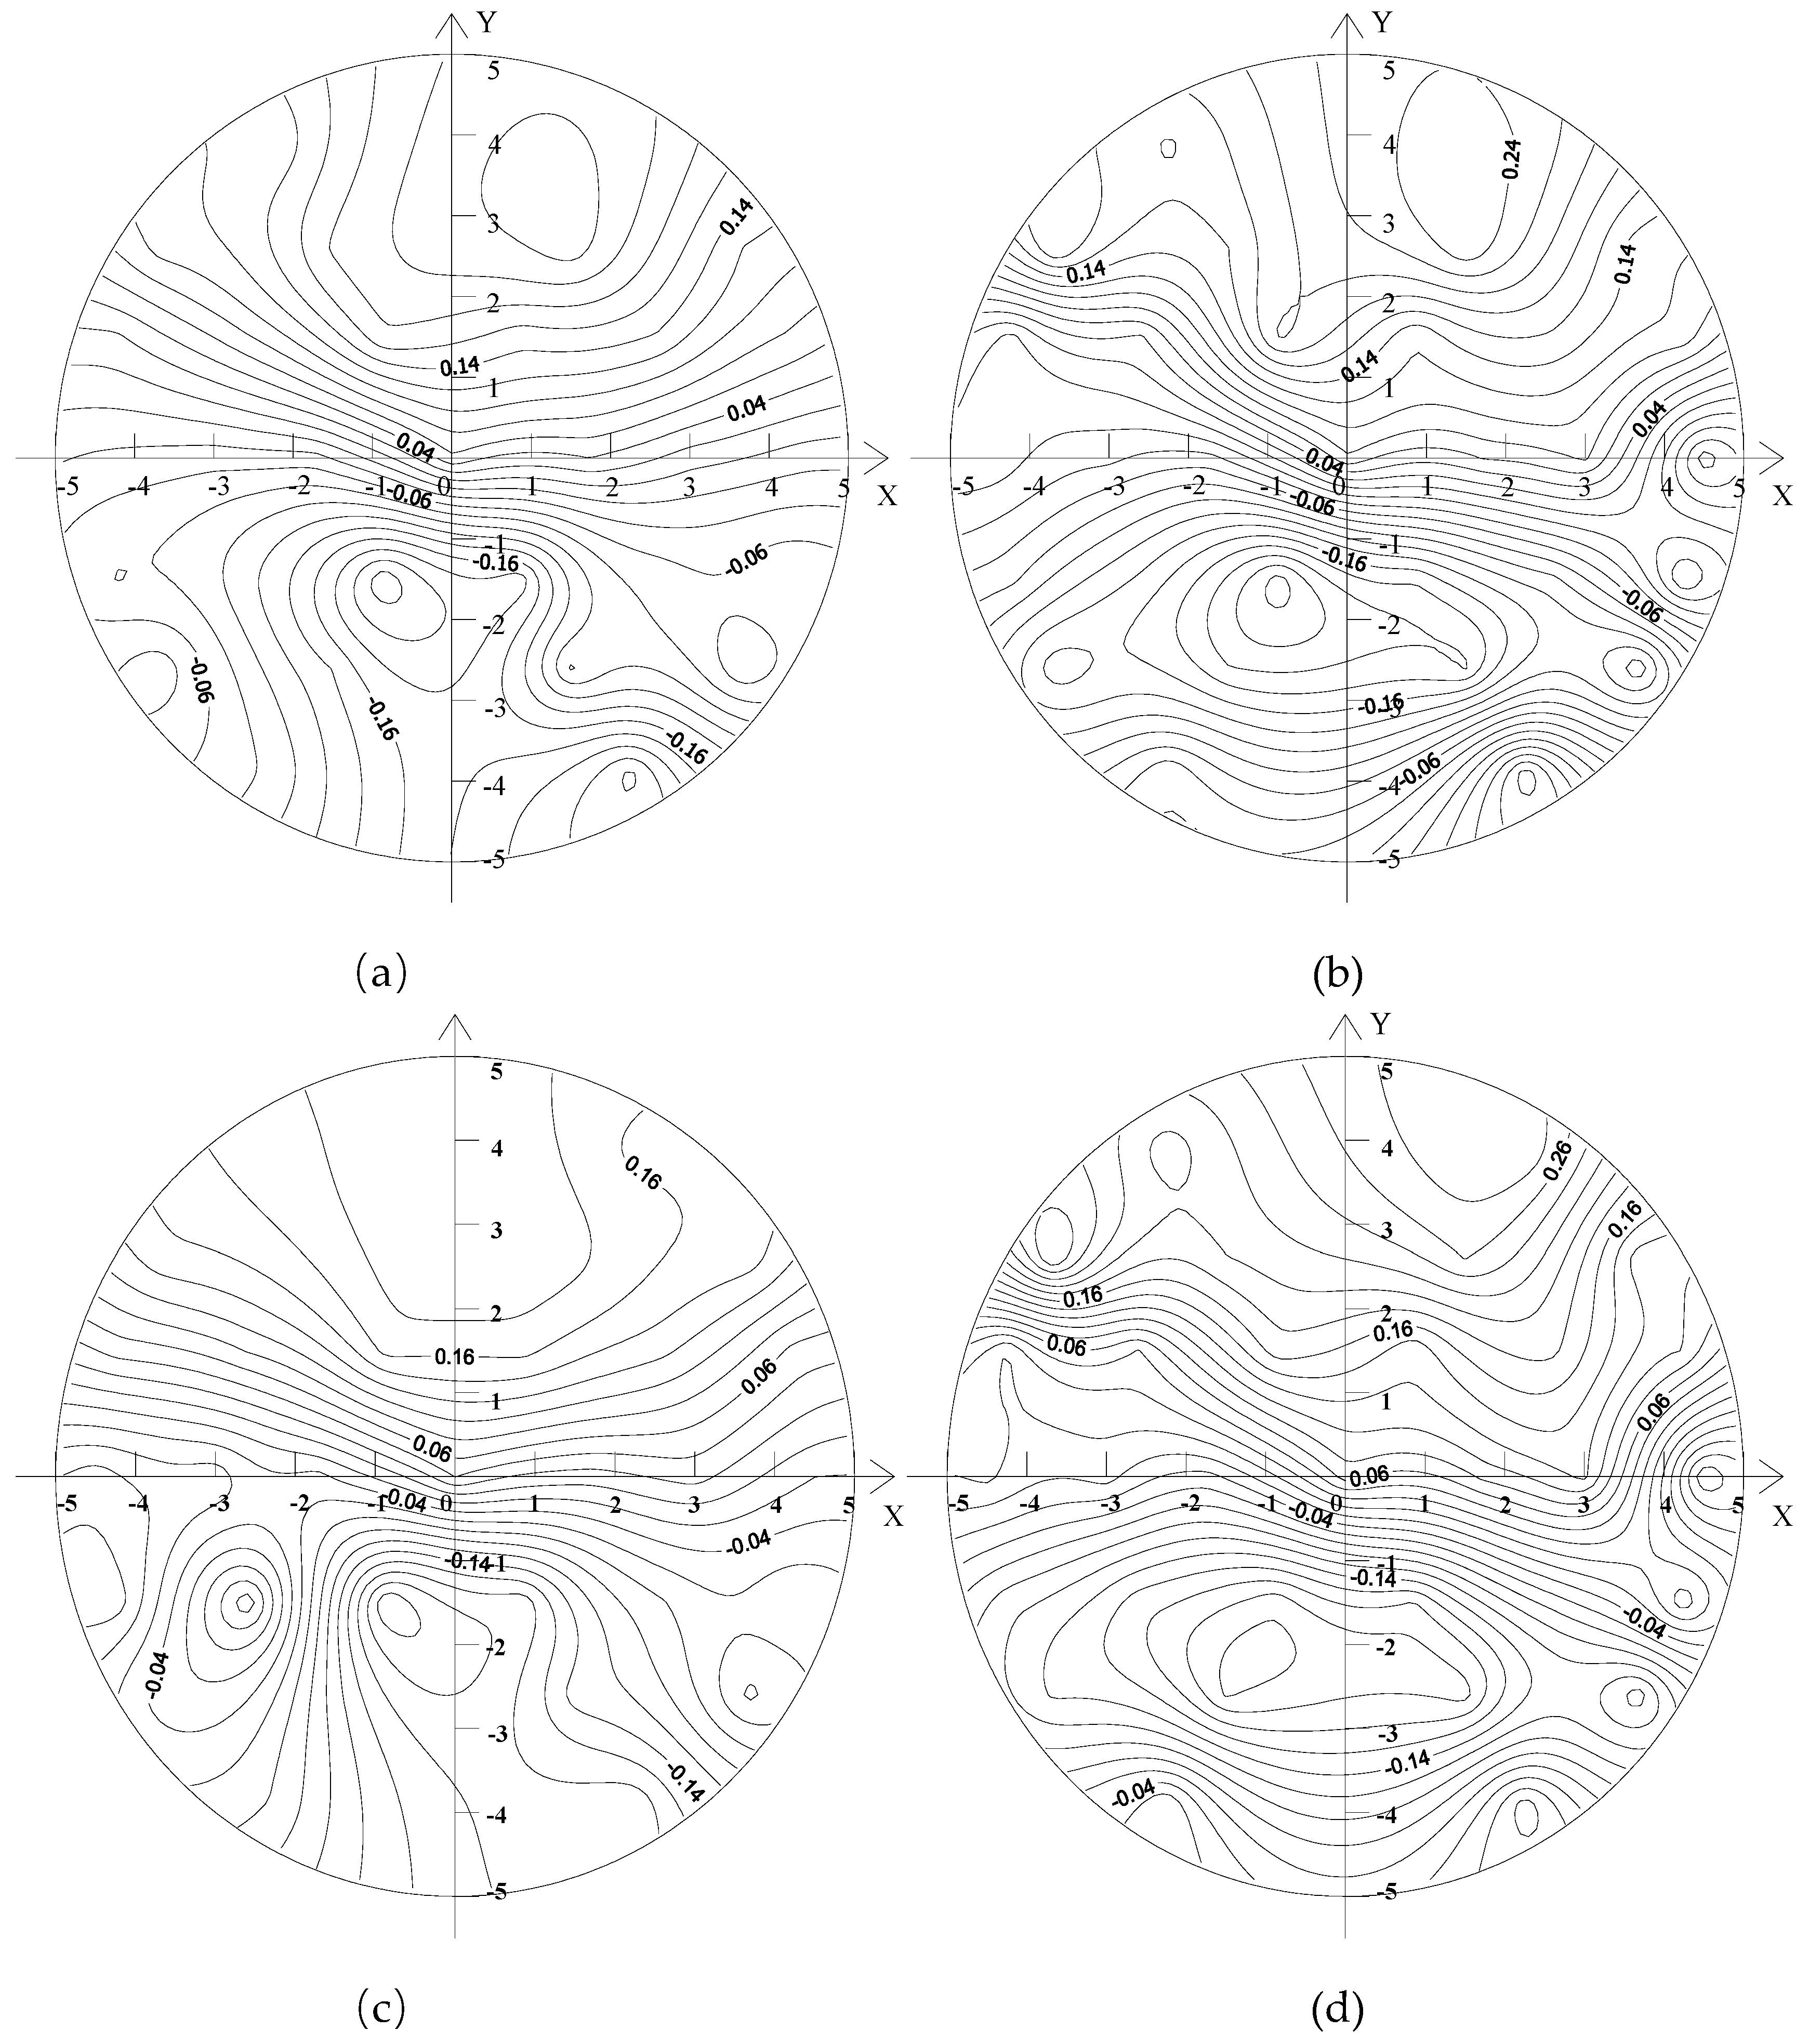
Figure 5 shows the distributions of axial flow velocity of the upstream sections of the capsules, as follows:
The axial velocity distribution of the upstream section of the capsule was basically similar, and there were several rings with the center of the pipe section as the center. The axial velocity of the upstream section of the capsule was smaller in the middle area of the pipeline and larger near the inner wall of the pipeline. The farther it was away from the center of the pipeline, the greater the change of the axial velocity gradient was. The distribution of axial velocity in the figure was analyzed according to four coordinate quadrants. It can be seen that the distribution of axial velocity was basically symmetric along the direction of the Y-axis, but along the direction of the X-axis, the distribution of axial velocity was different. The axial velocity of the lower section of the X-axis was larger than that of the upper section. For the capsule with different length–diameter ratios, the axial velocity of their upstream sections was evenly distributed in the range of the Y-axis coordinate (3,5), and the velocity gradient changed less. Meanwhile, the smaller the pole radius of the measuring ring was, the greater the corresponding axial velocity was.
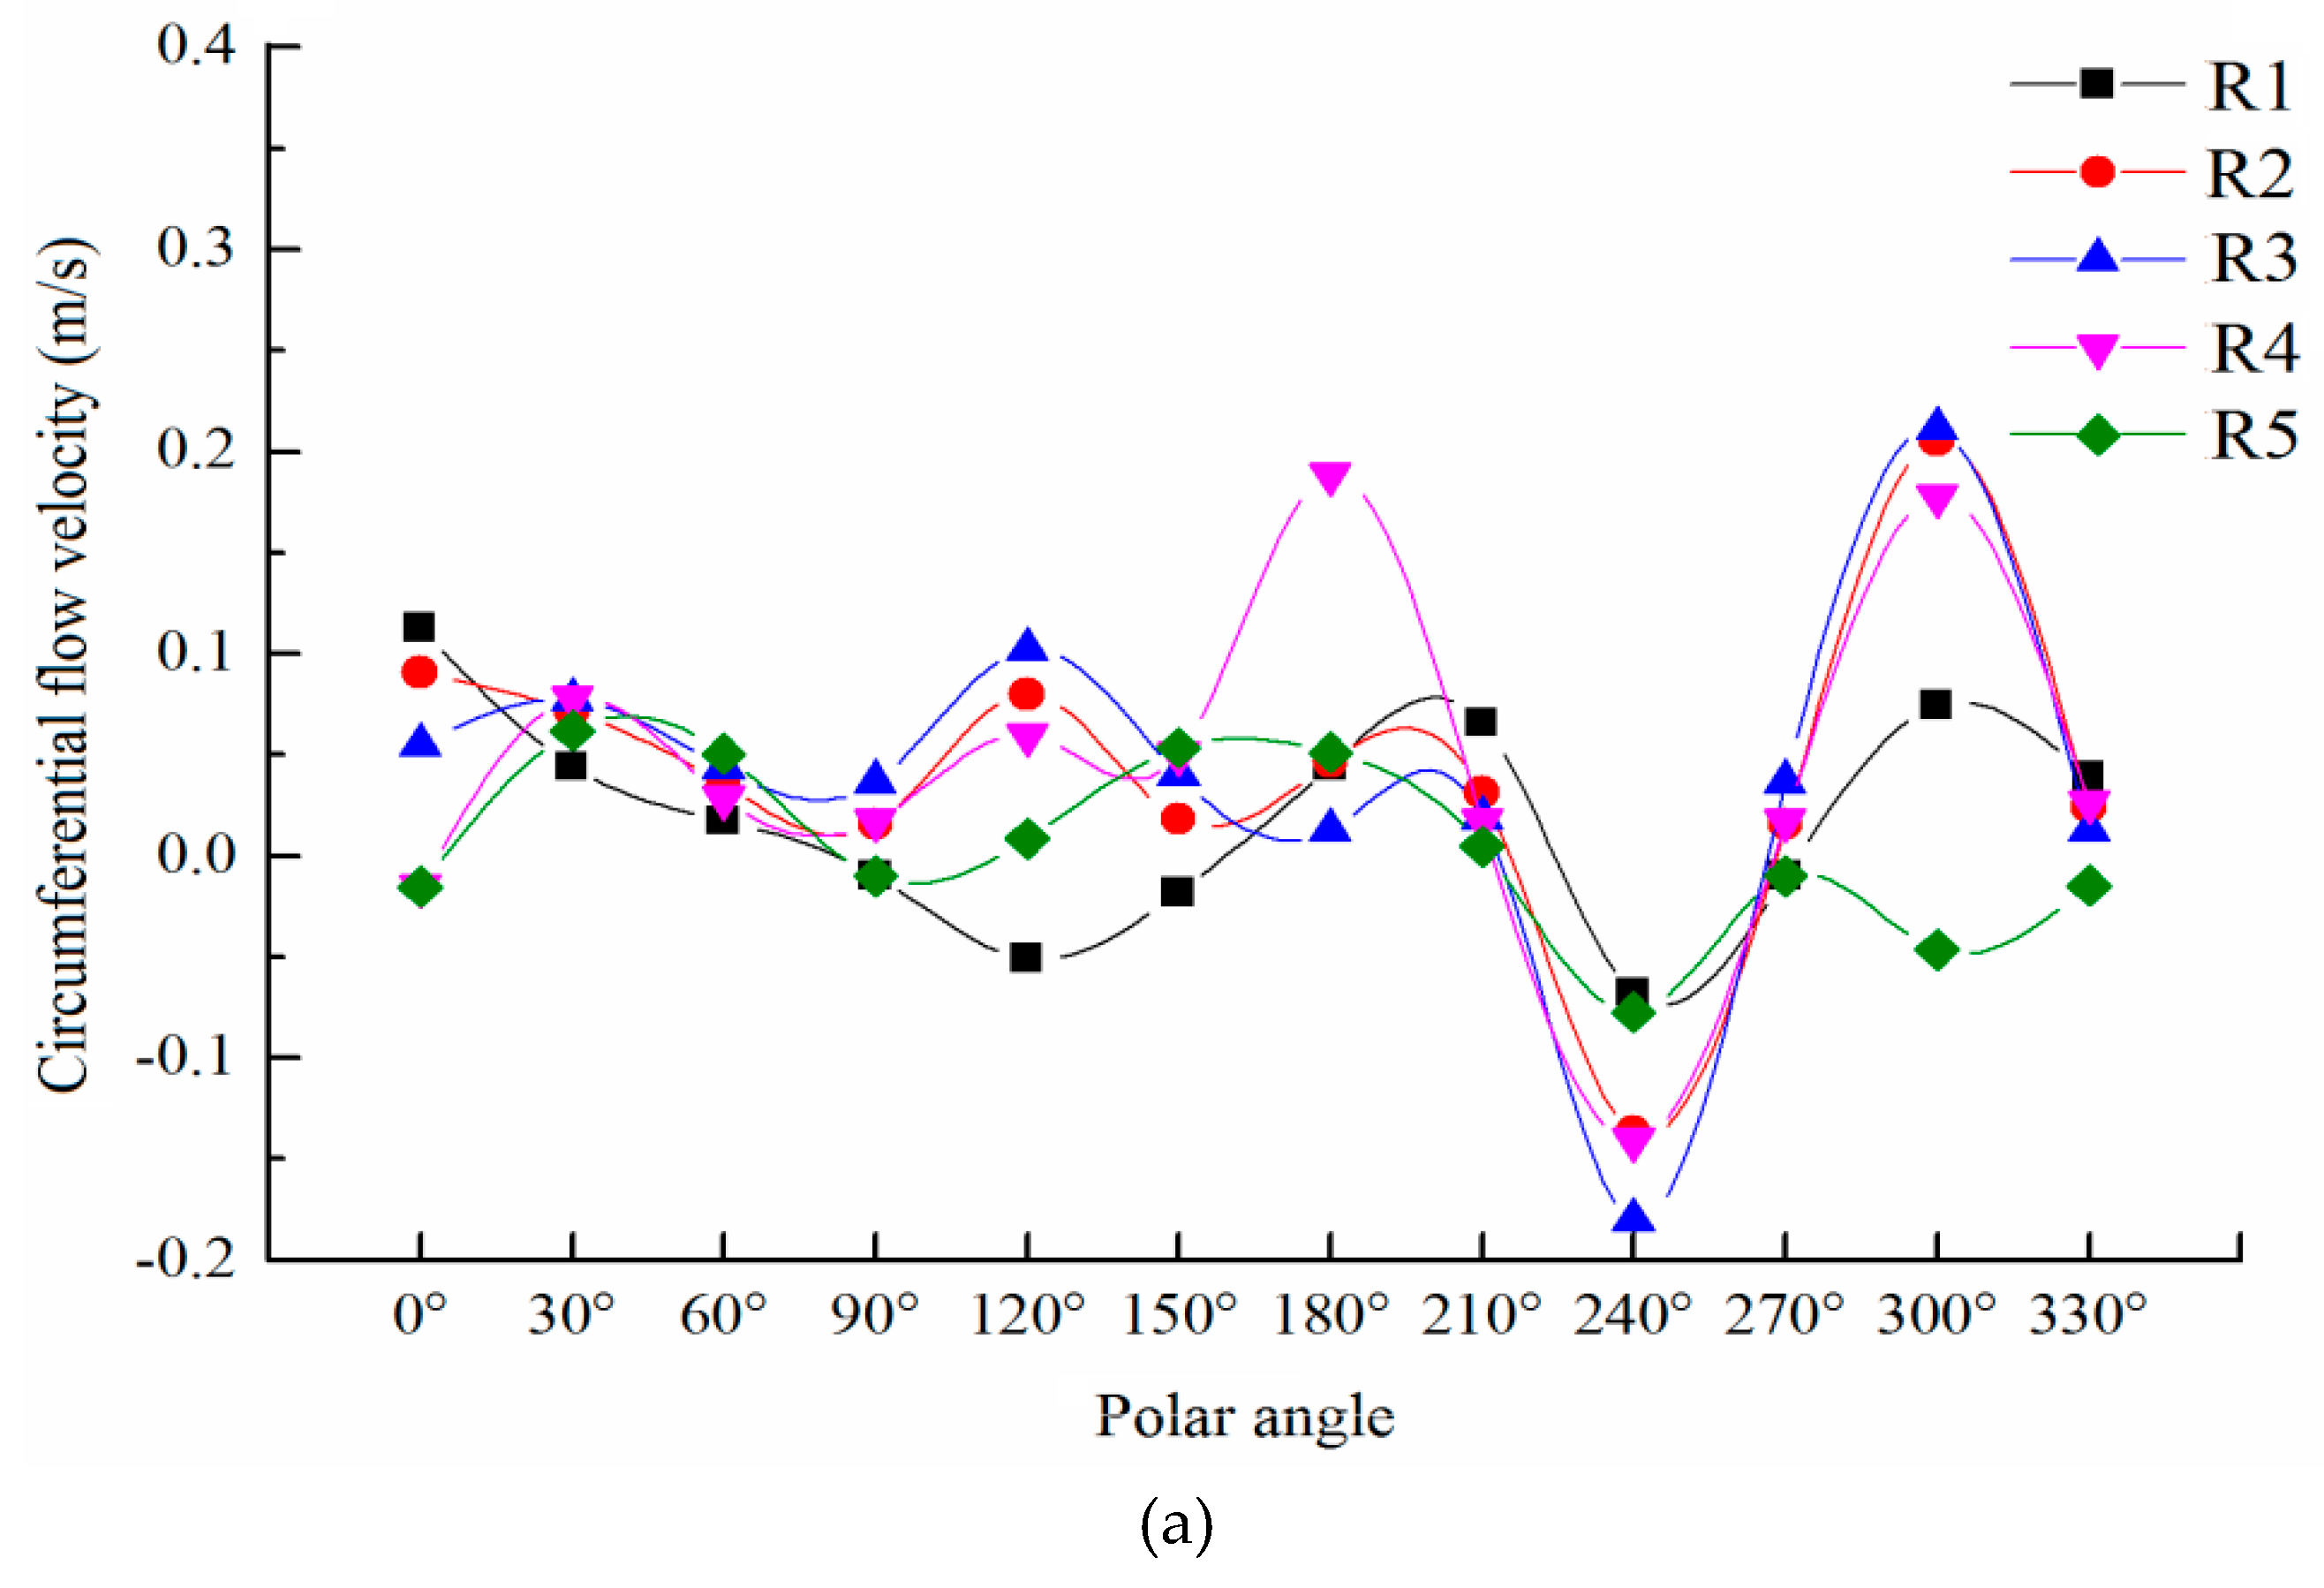
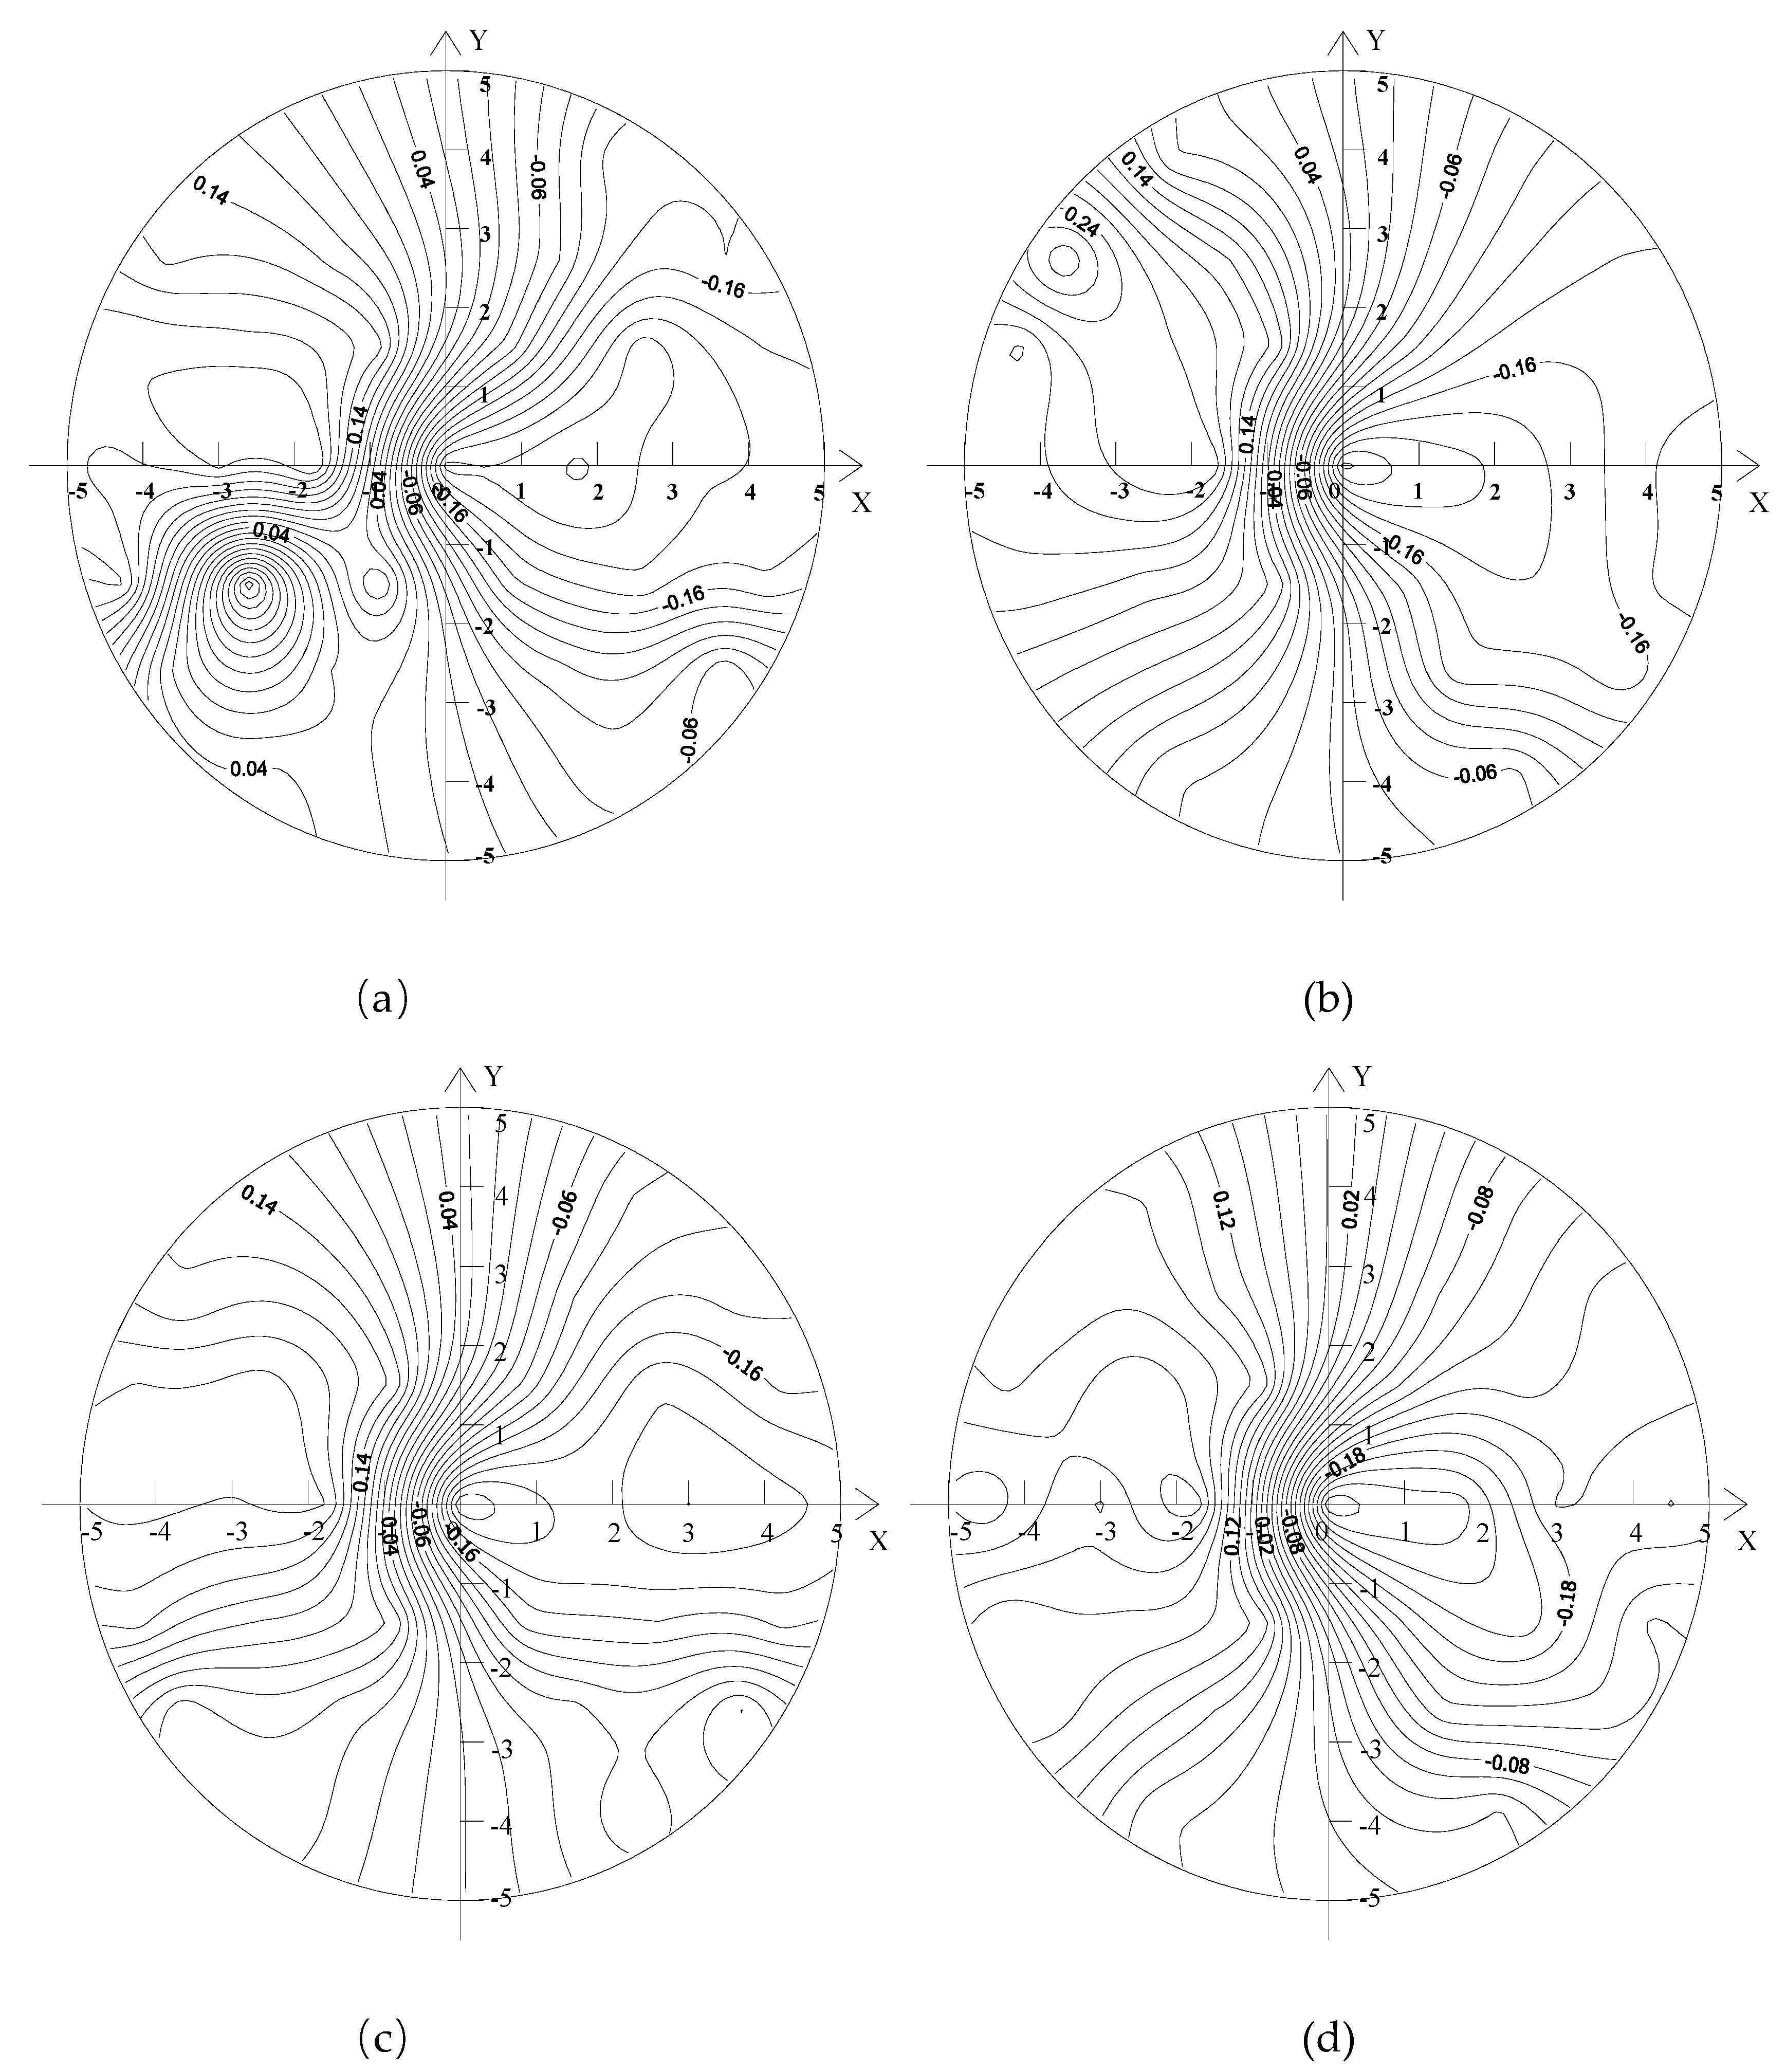
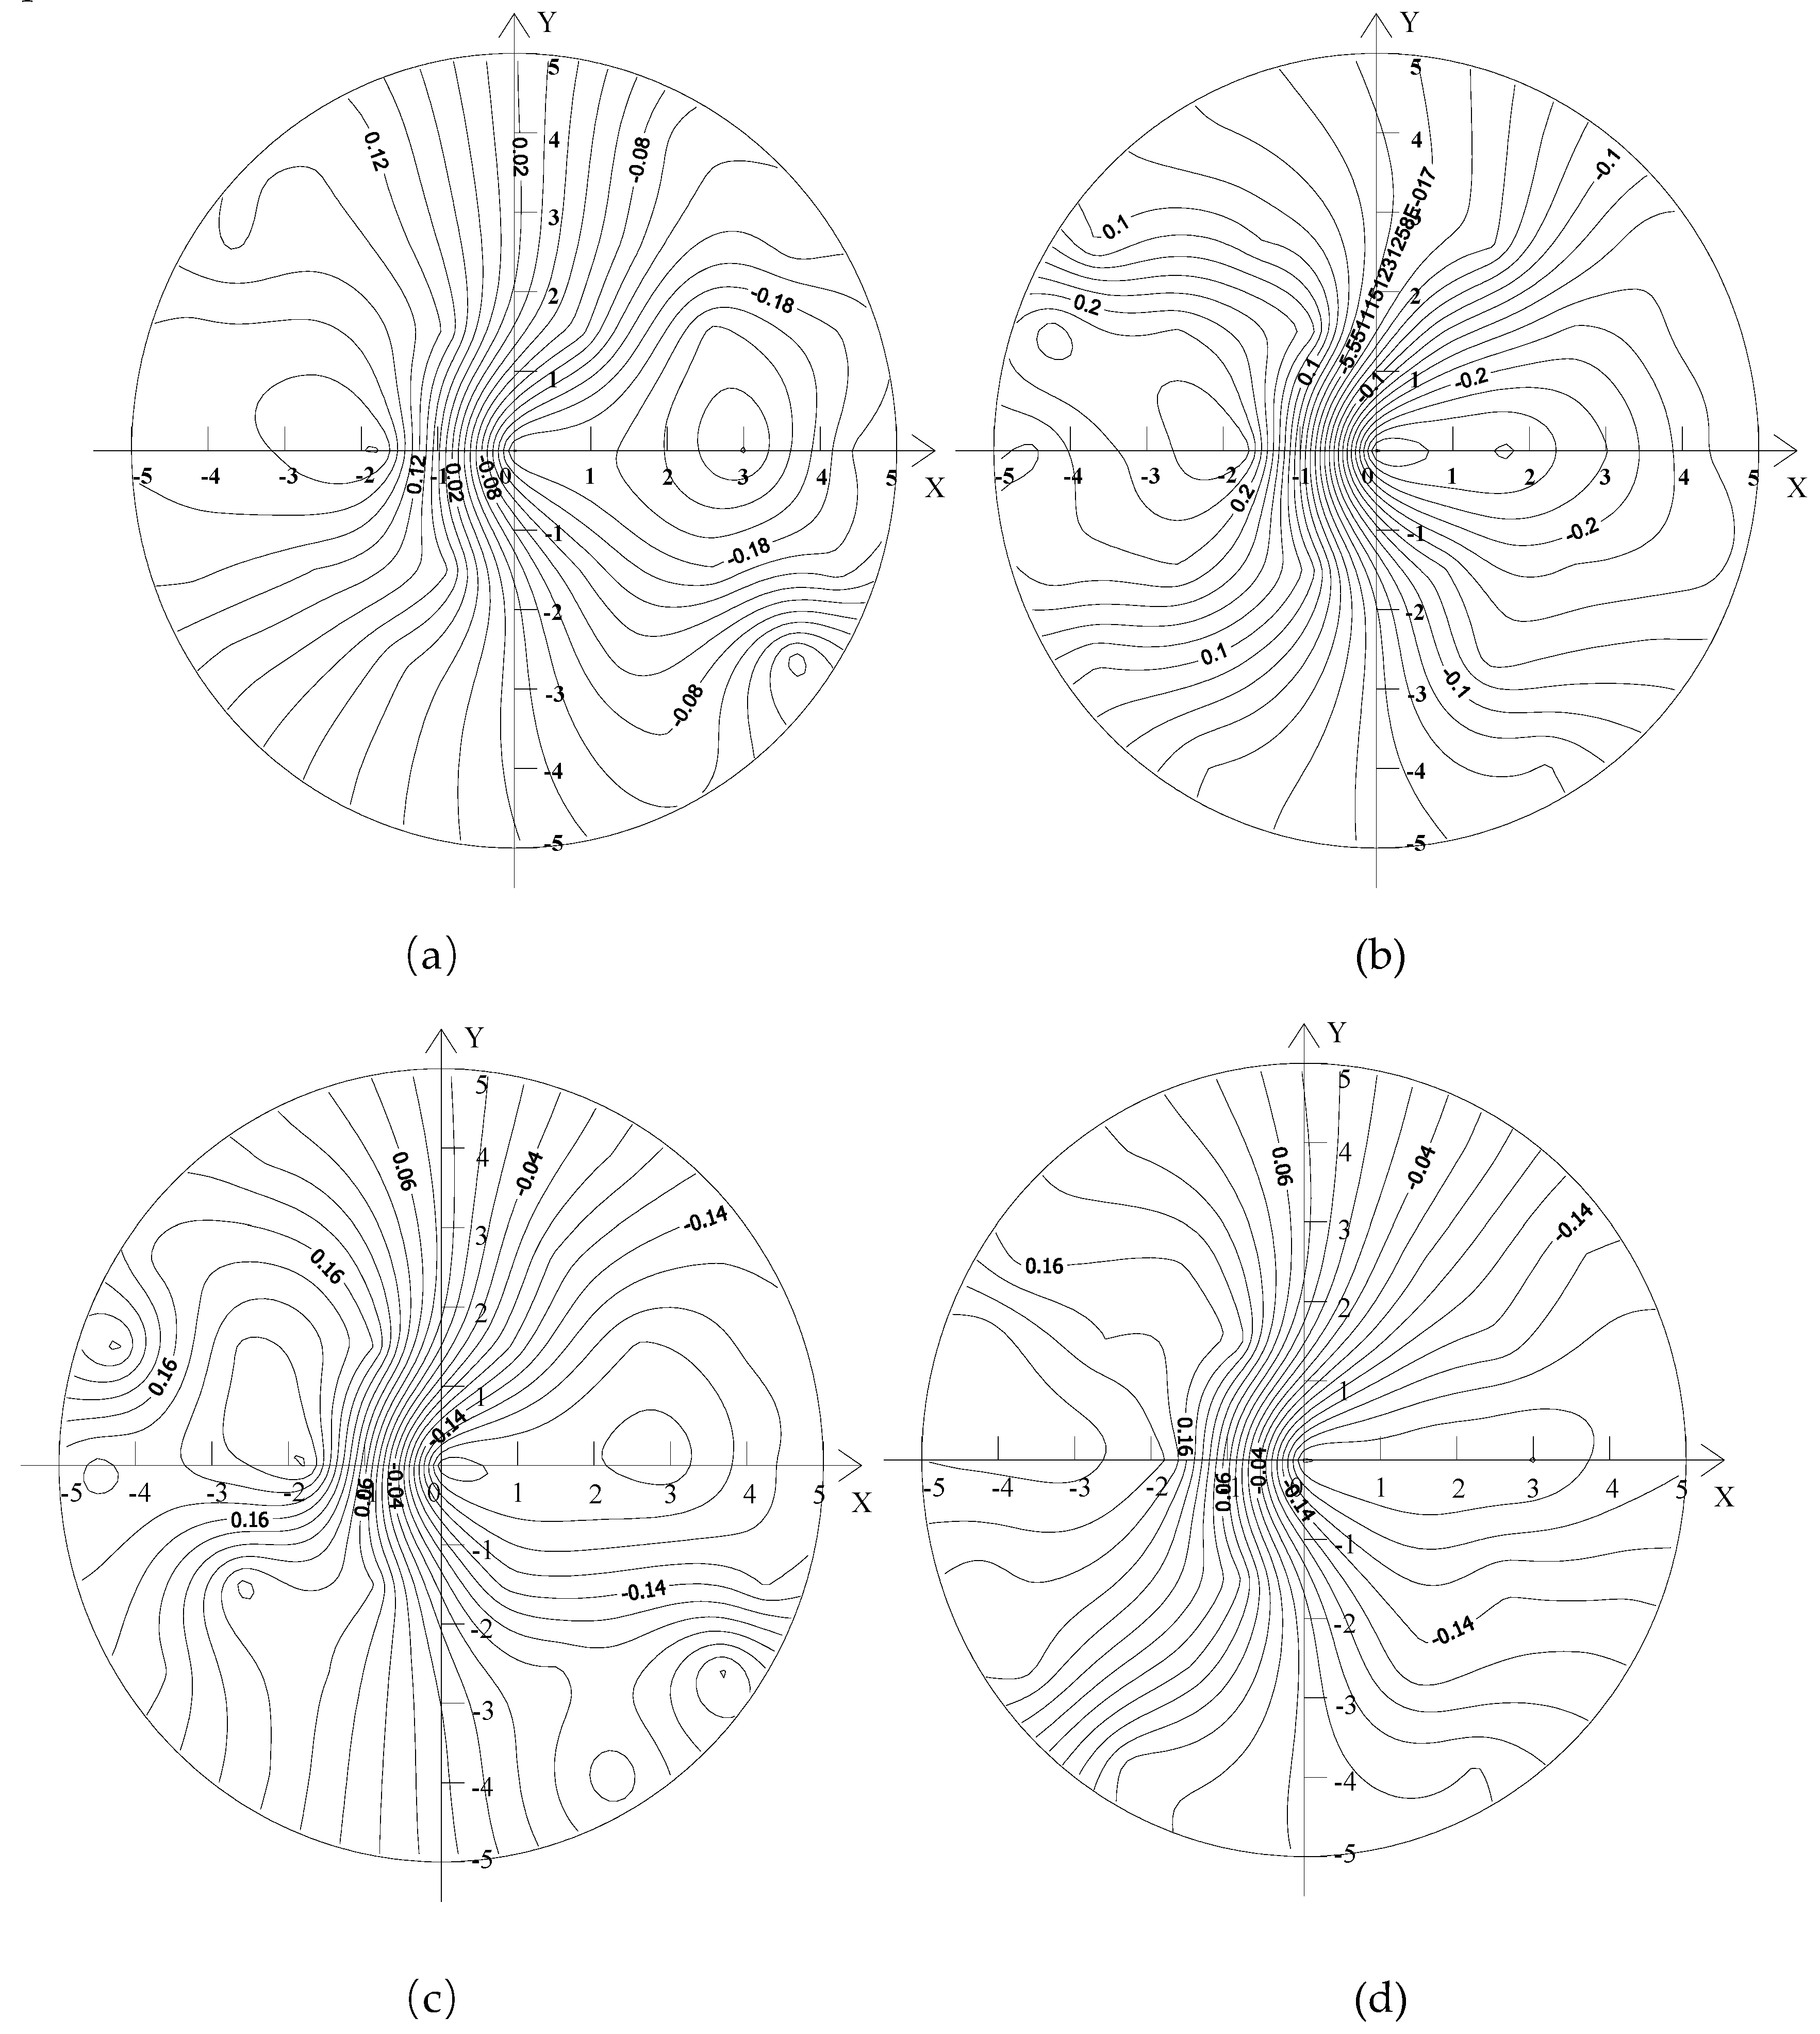
Figure 6 shows the distributions of circumferential flow velocity of the upstream sections of the capsules, as follows:
Regardless of the transport condition, the circumferential flow velocity of the upstream section of the capsule changed within the range of (−0.02, 0.2), and the distribution law was basically the same. Above the X-axis, the circumferential velocity was positive, indicating that the direction of circumferential velocity is counterclockwise along the tangent line of the concentric circle, while it was opposite below the X-axis. The circumferential velocity on the X-axis was the smallest and fluctuated up and down the X-axis with the X-axis as the axis of symmetry. The circumferential velocity of each measuring point in the upstream section of the capsule with the length–diameter ratio of 2.5 changed little, while the circumferential velocity of each measuring point in the upstream section of the capsule with the length–diameter ratio of 2.14 changed obviously, indicating that the length–diameter ratio of the capsule has a certain influence on the circumferential velocity of the upstream section of the capsule. However, regardless of the transport condition, the fluctuation of the circumferential velocity at the measuring point (0, 0°) located in the center of the test section was the least, which was less affected by the length–diameter ratio of the capsule.
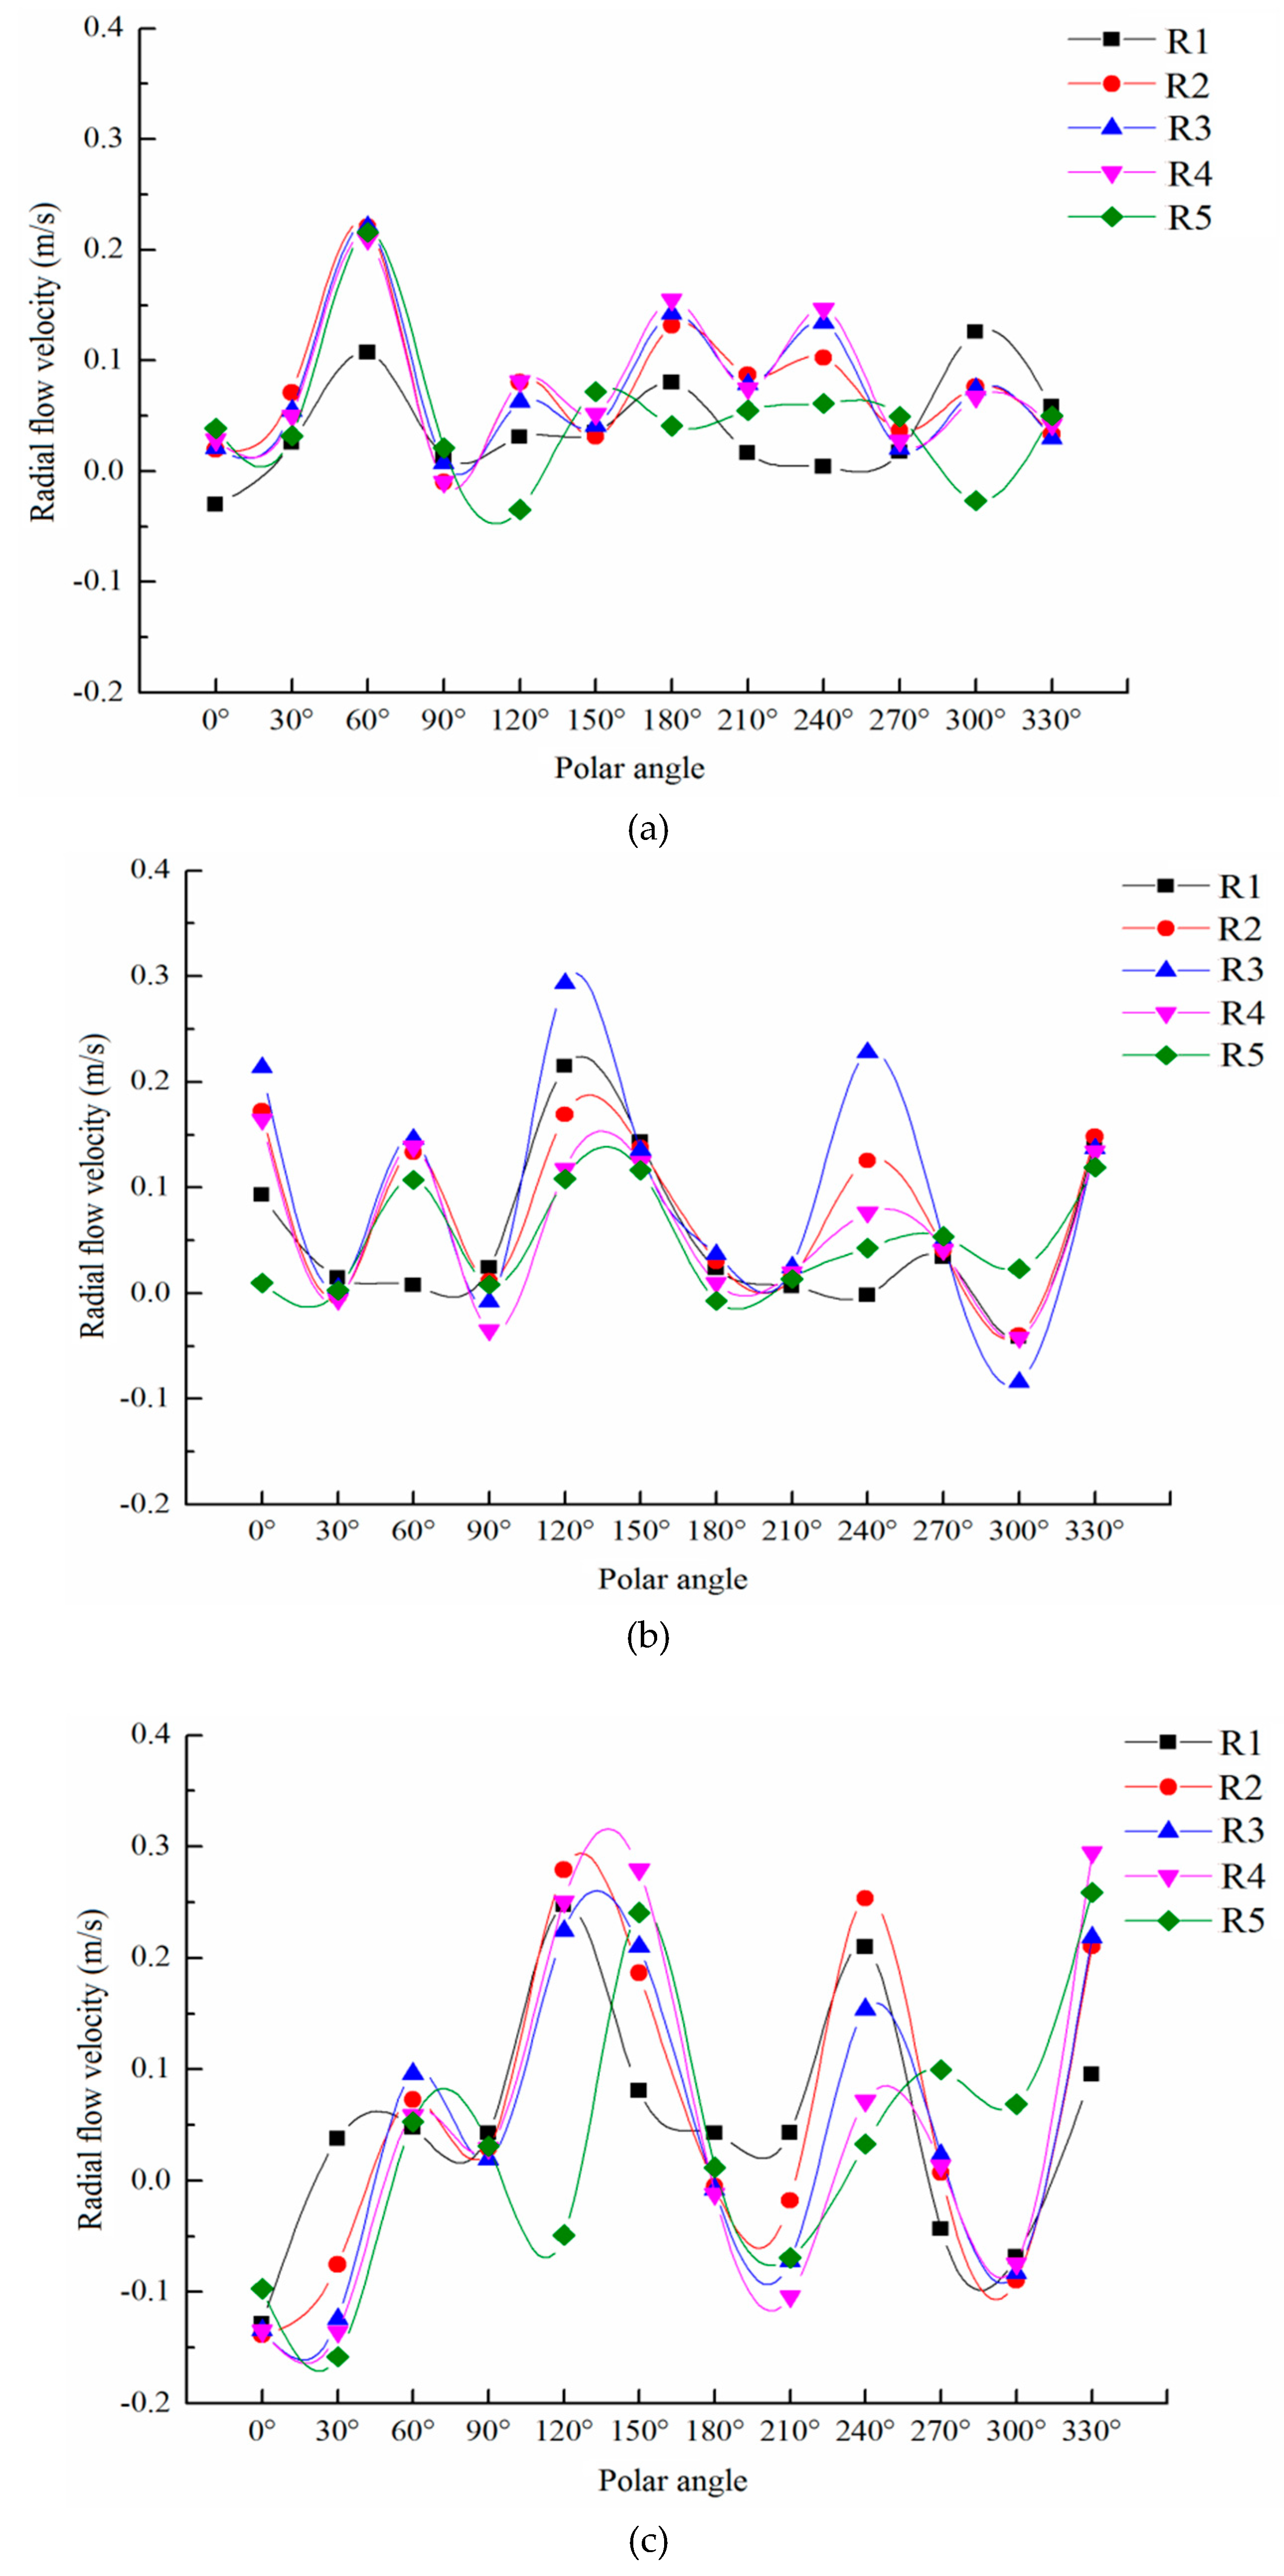
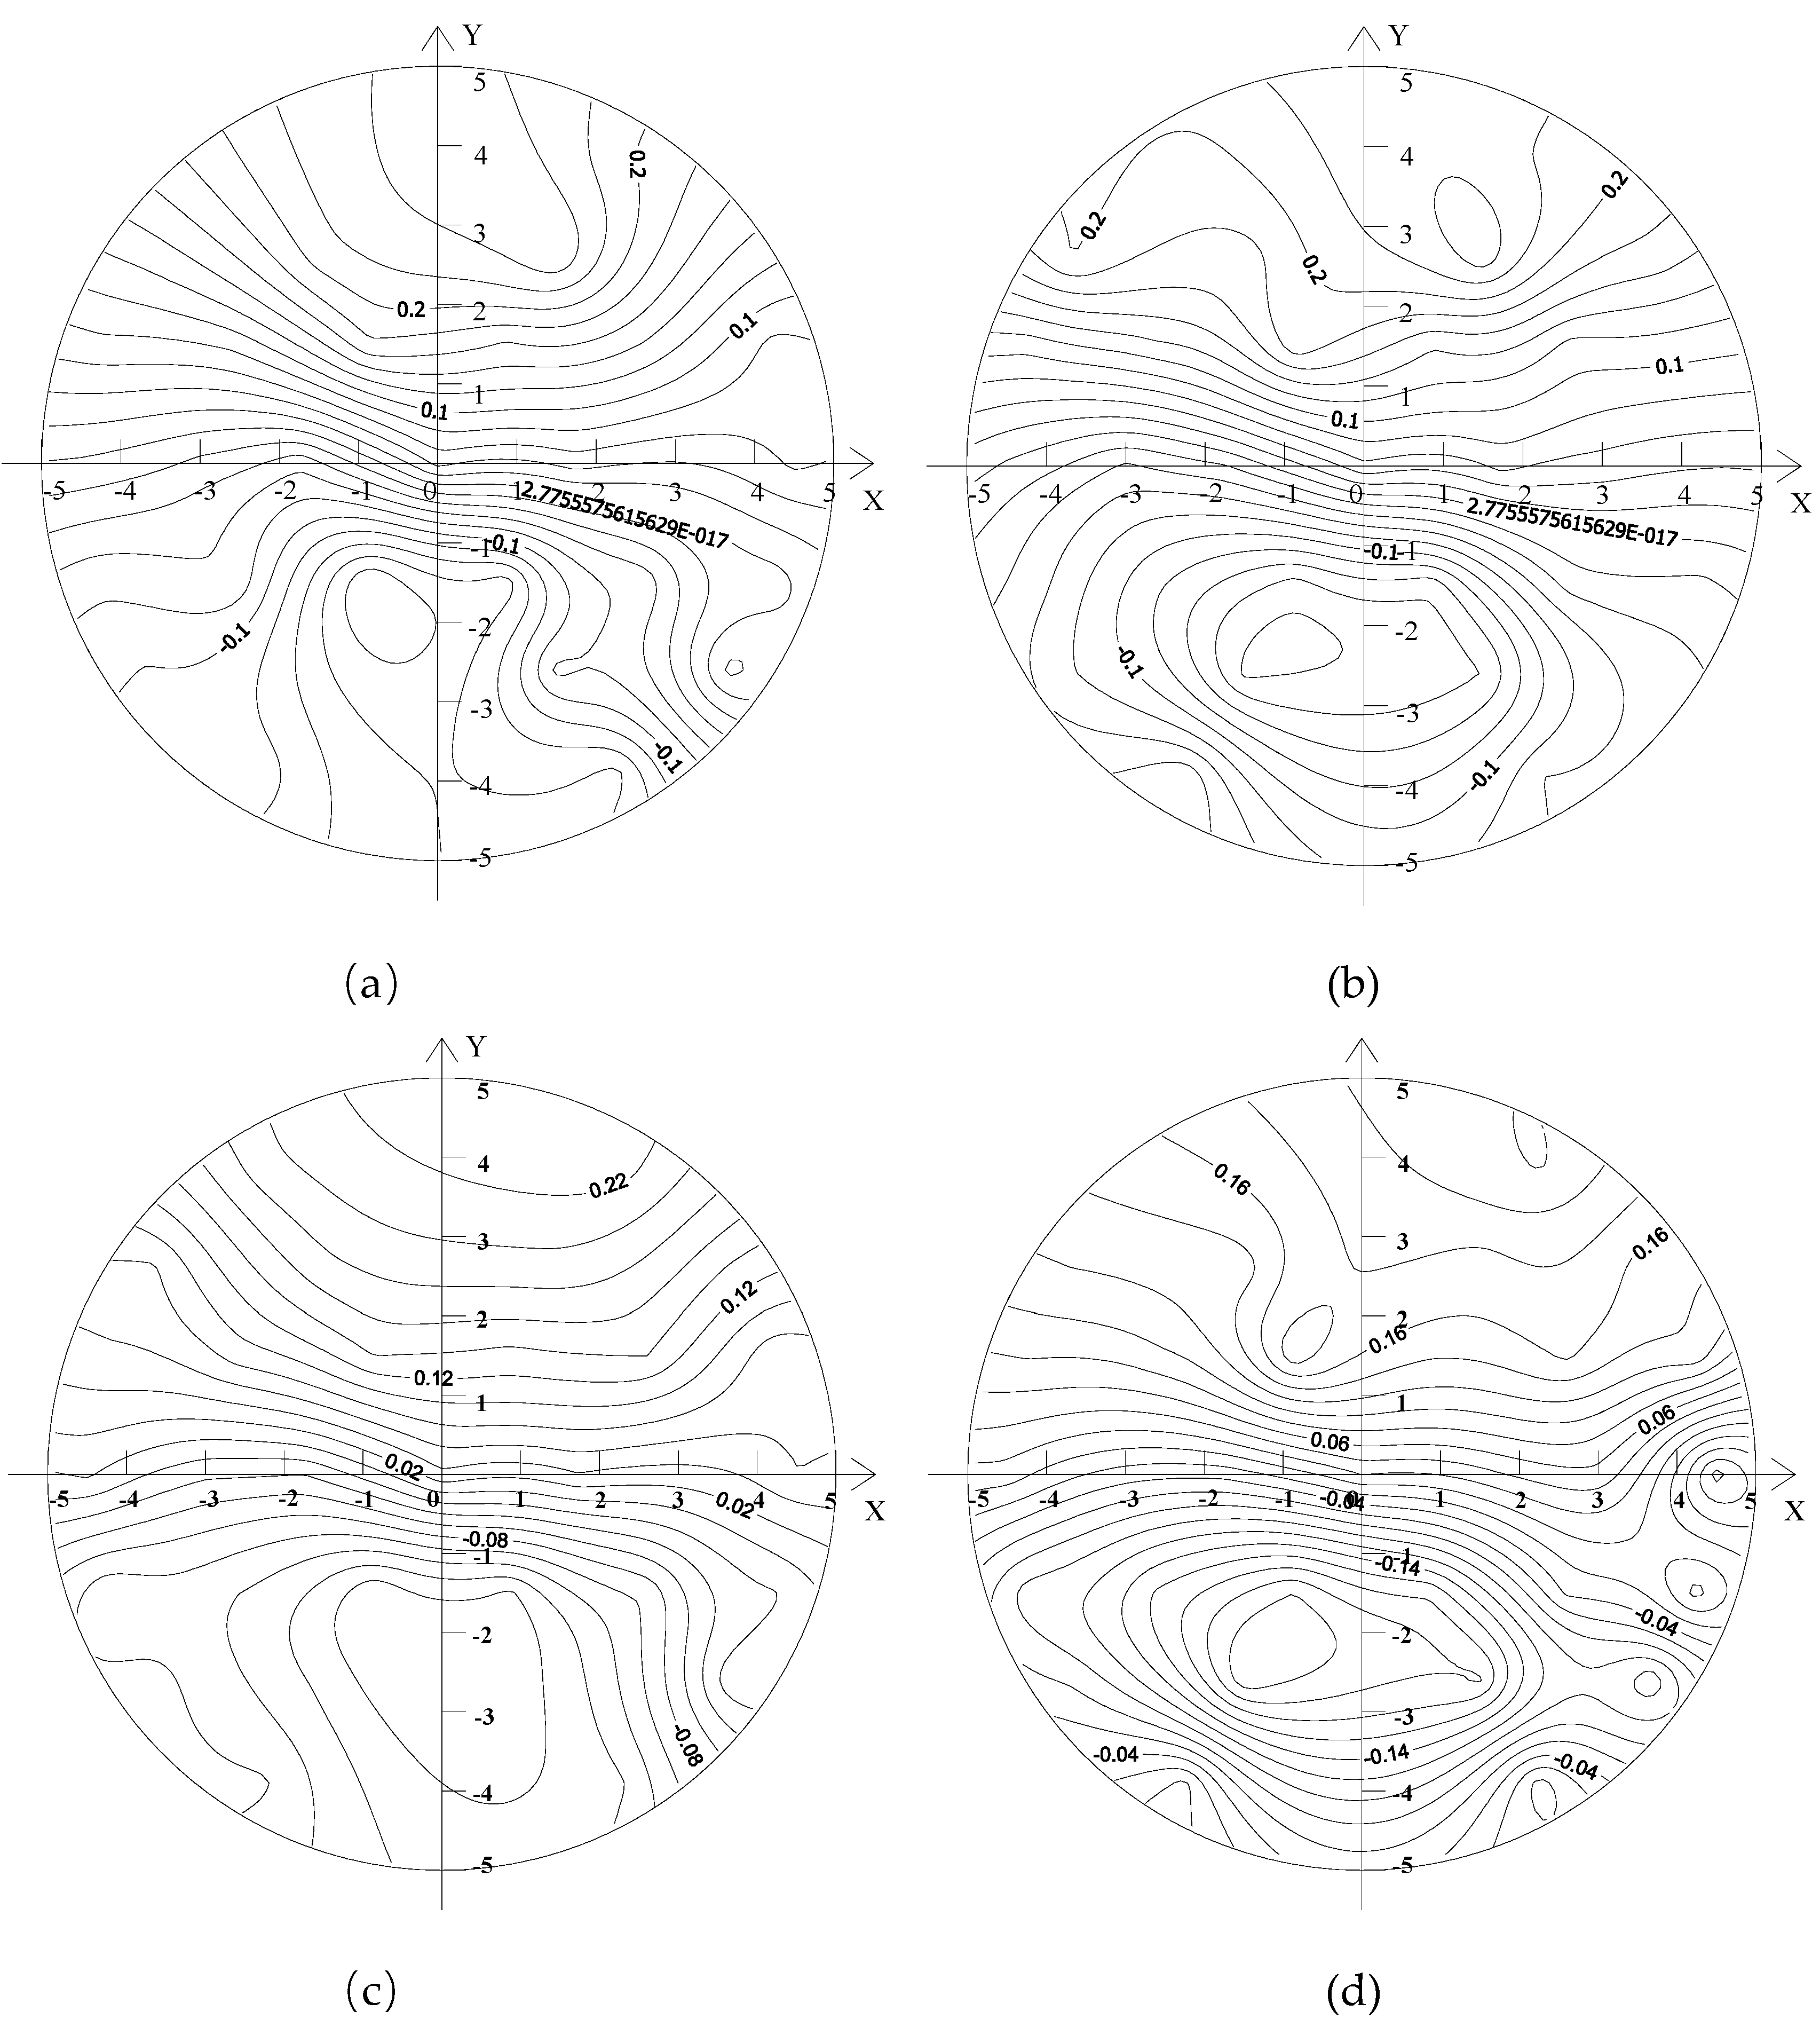
Figure 7 shows the distributions of radial flow velocity of the upstream sections of the capsules, as follows:
Regardless of the transport condition, the radial velocity distribution of the upstream section of the capsule was more thinly spread near the pipe wall and denser near the center of the pipe. The radial velocity changed in the range of (−0.02, 0.2). The radial velocity on the left side of the Y-axis was positive, while the radial velocity on the right side of the Y-axis was negative. The radial velocity on the Y-axis was the smallest and fluctuated around the Y-axis with the Y-axis as the axis of symmetry. The distribution of radial velocity in the figure was analyzed according to four coordinate quadrants, and it was found that due to the influence of the support body of the capsule, the locations with large disturbance of radial velocity appeared in the third quadrant.
3.2. The Flow Velocity Distribution of the Downstream Section of the Capsule
Taking Z = 0.2 m and Z = 3 m away from the downstream sections of the capsule as examples, the flow velocity distribution of the downstream sections of the capsule during material transportation was analyzed.
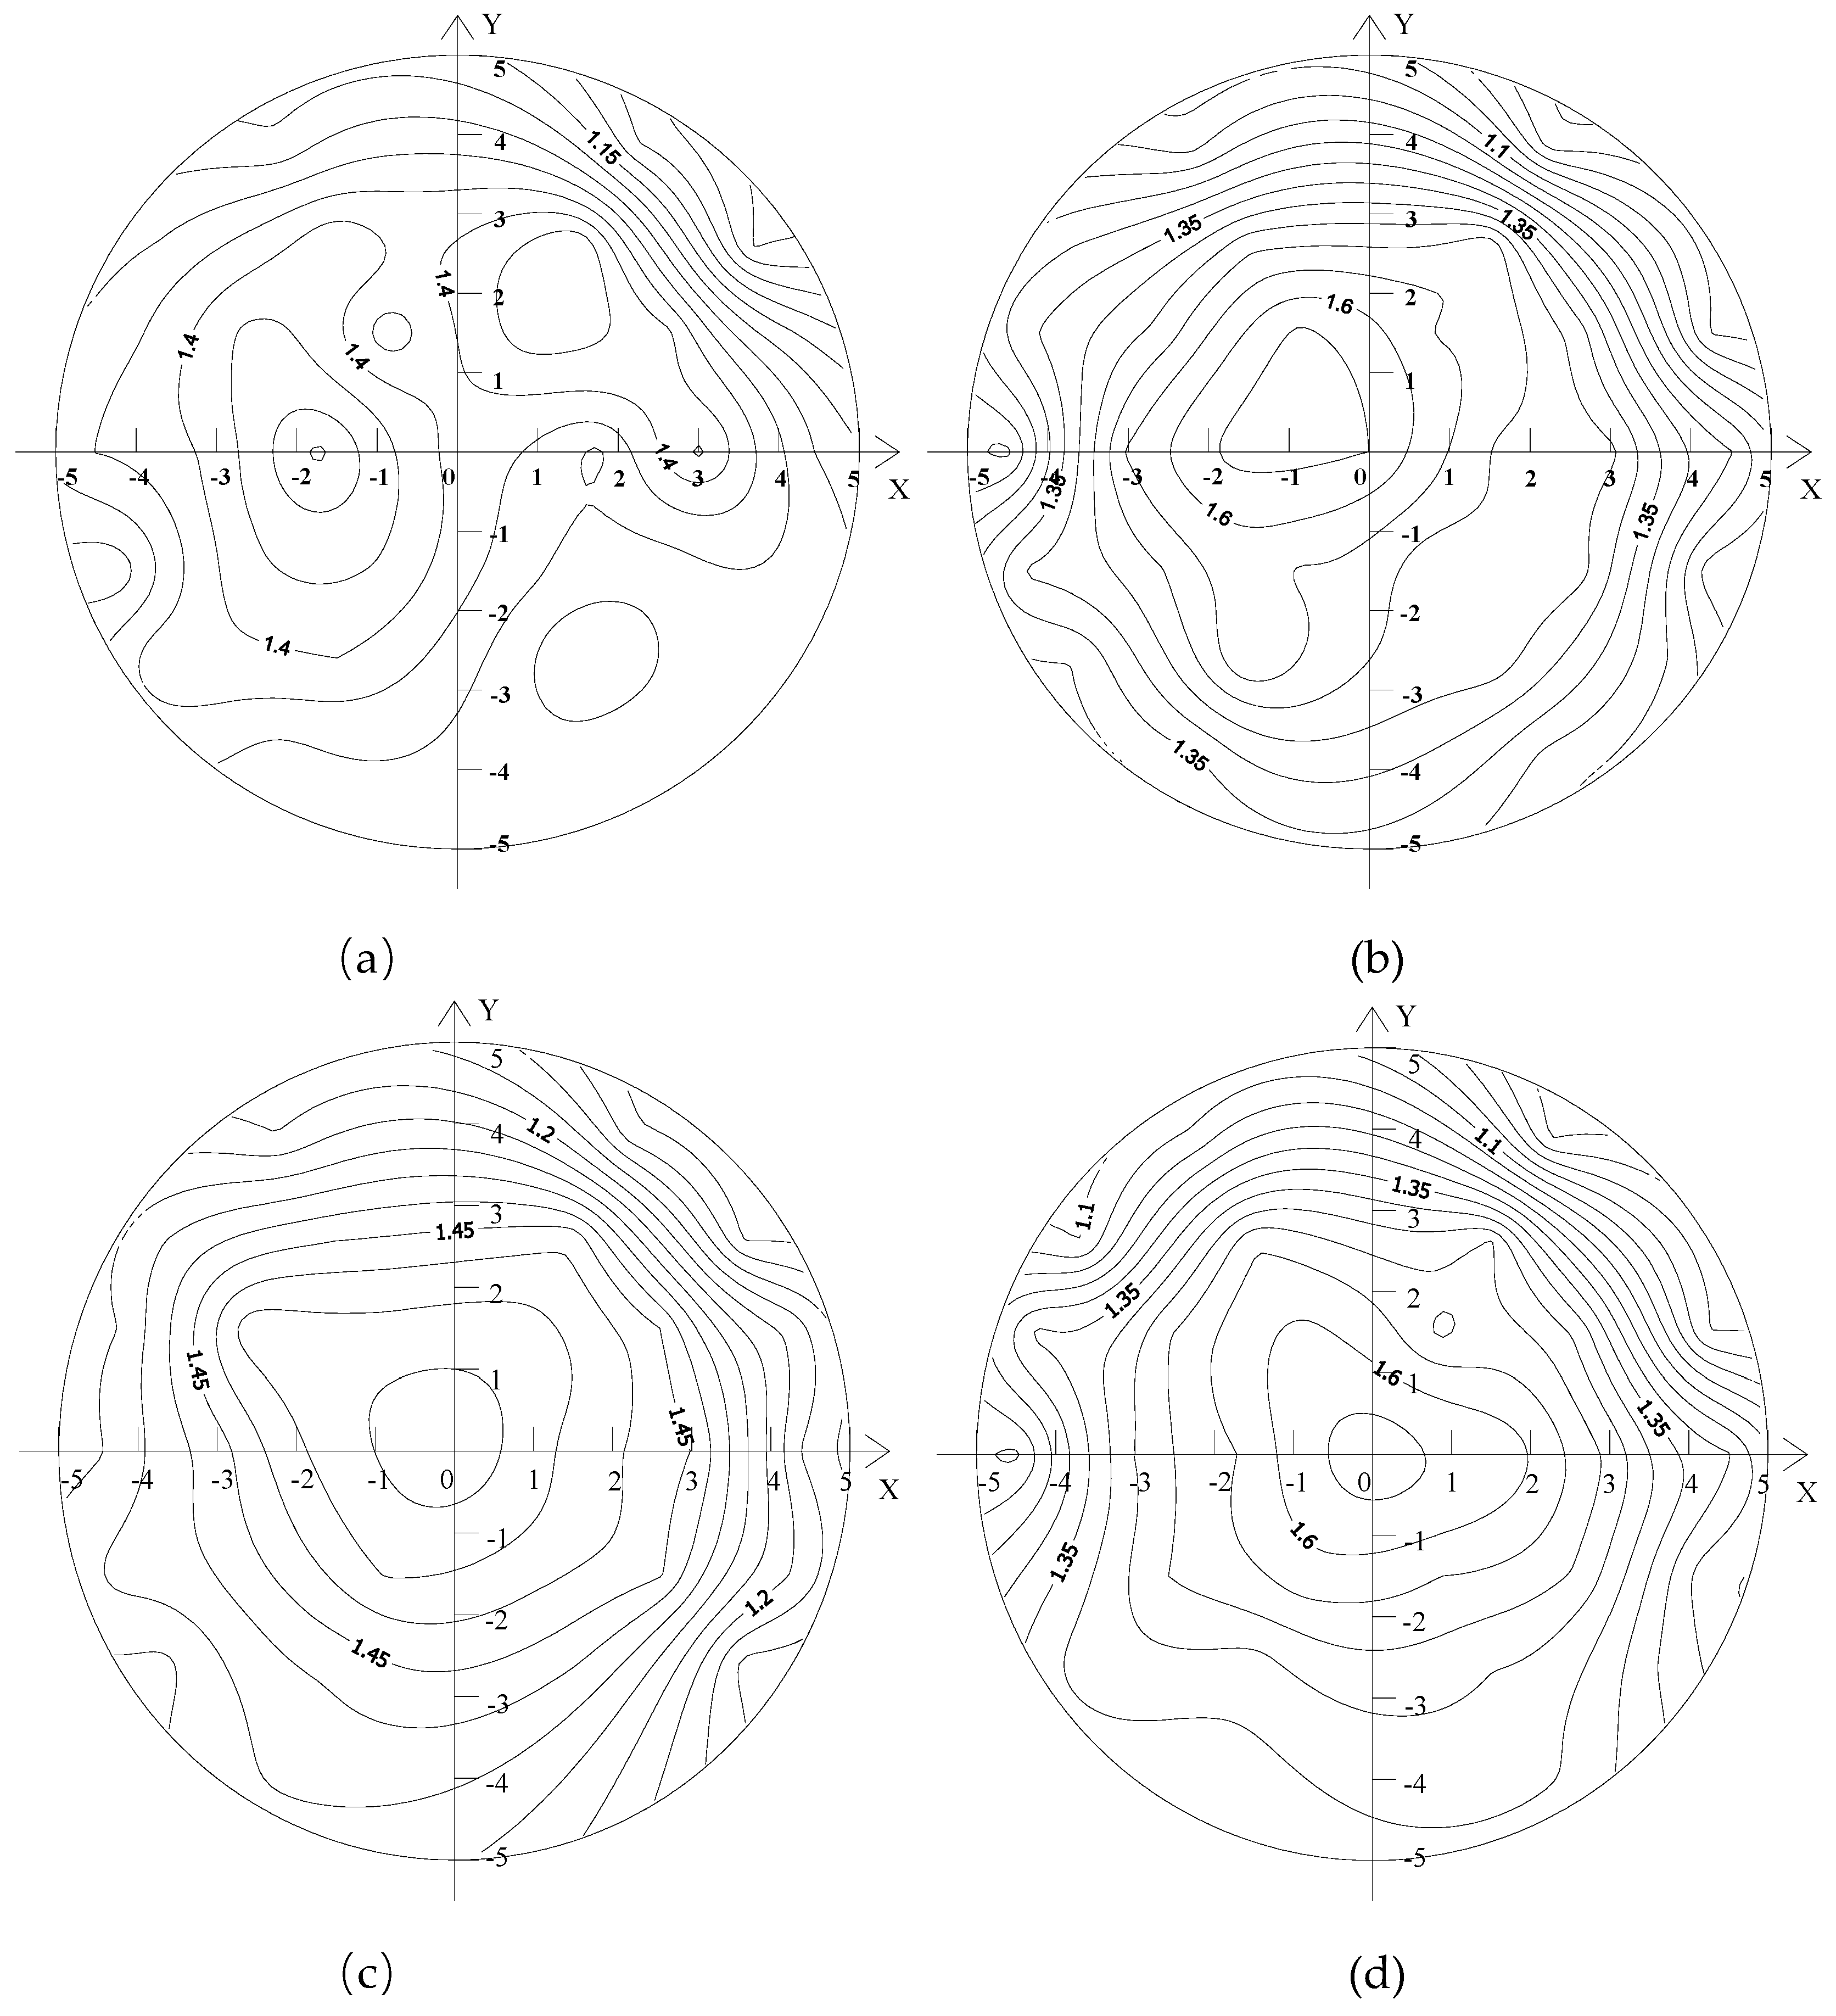
Figure 8 shows the distributions of axial flow velocity of the downstream sections of the capsules, as follows:
As a whole, the axial velocity of the downstream section of the capsule fluctuated within the range of (0.8,1.6). For the same capsule, the distribution of the axial velocity contour in the sections Z = 0.2 m and Z = 3 m away from the downstream of the capsule was denser than that in the upstream of the capsule, and the axial velocity distribution no longer presented concentric circle distribution but appeared as many small rings. The axial velocity at the measuring point (0, 0°) was the most obvious at the section Z = 0.2 m away from the downstream of the capsule. When L/d = 2.5, the axial velocity at the measuring point decreased the most.
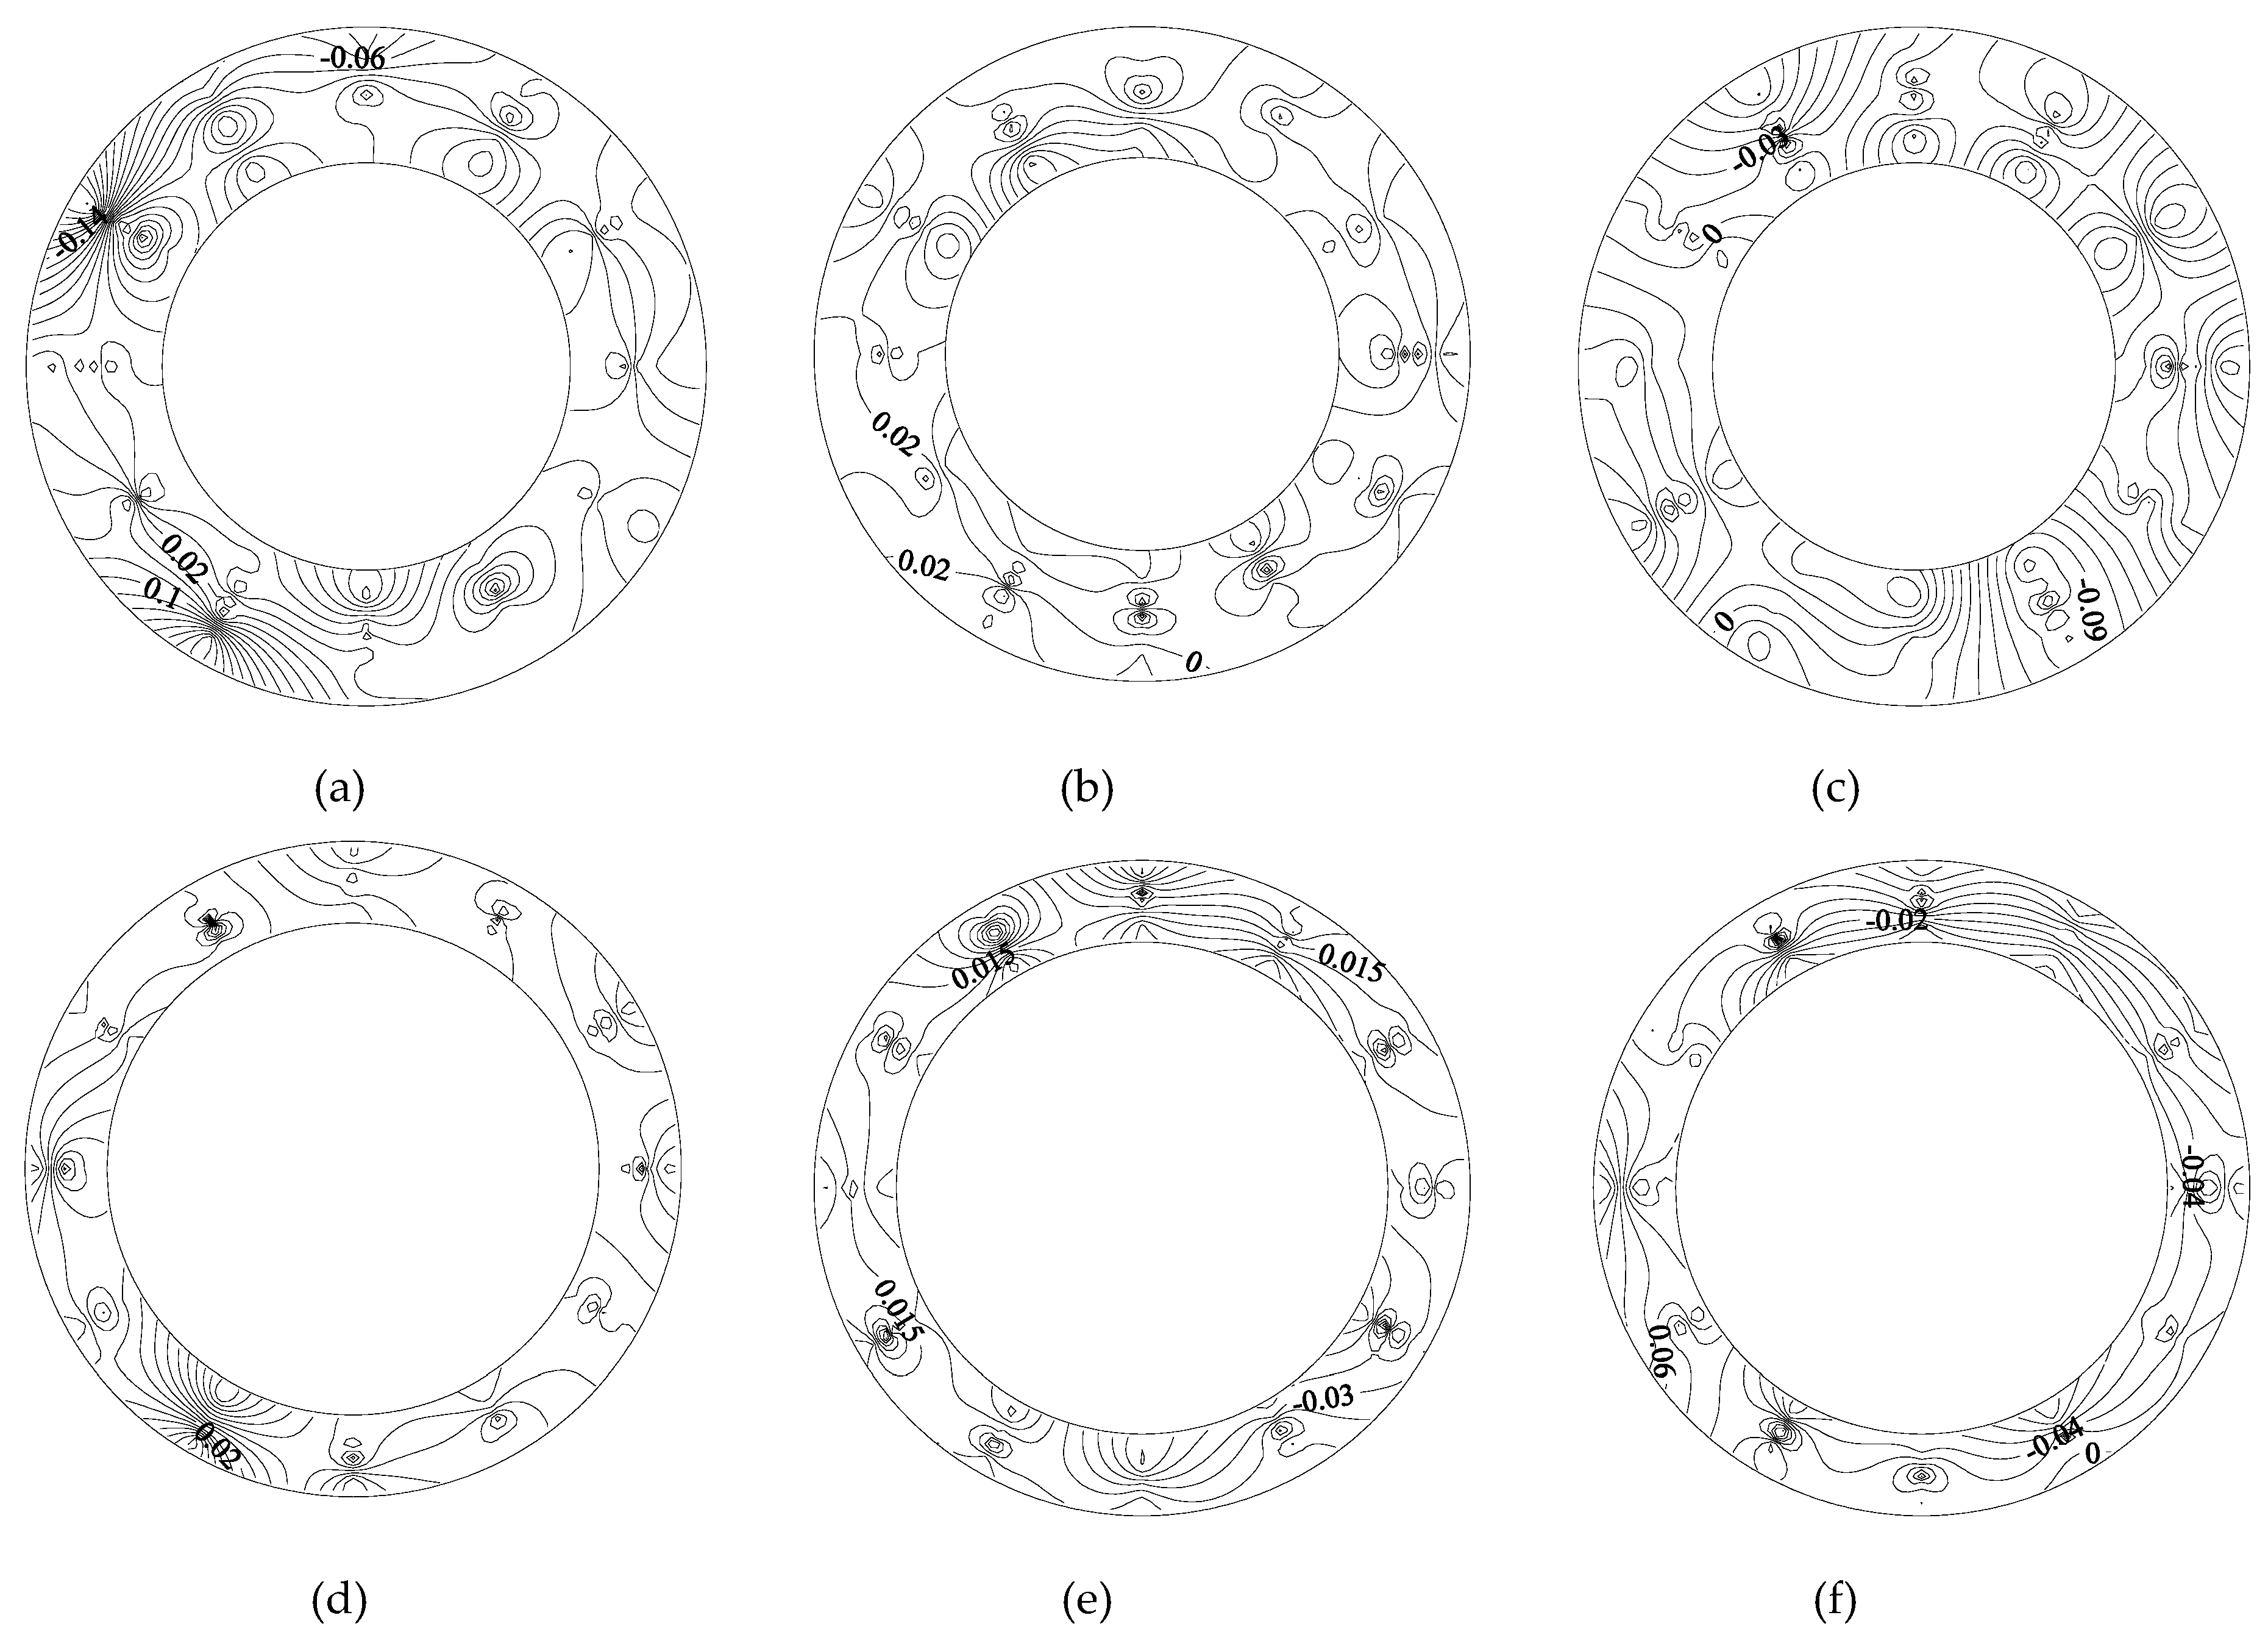
Figure 9 shows the distributions of circumferential flow velocity of the downstream sections of the capsules, as follows:
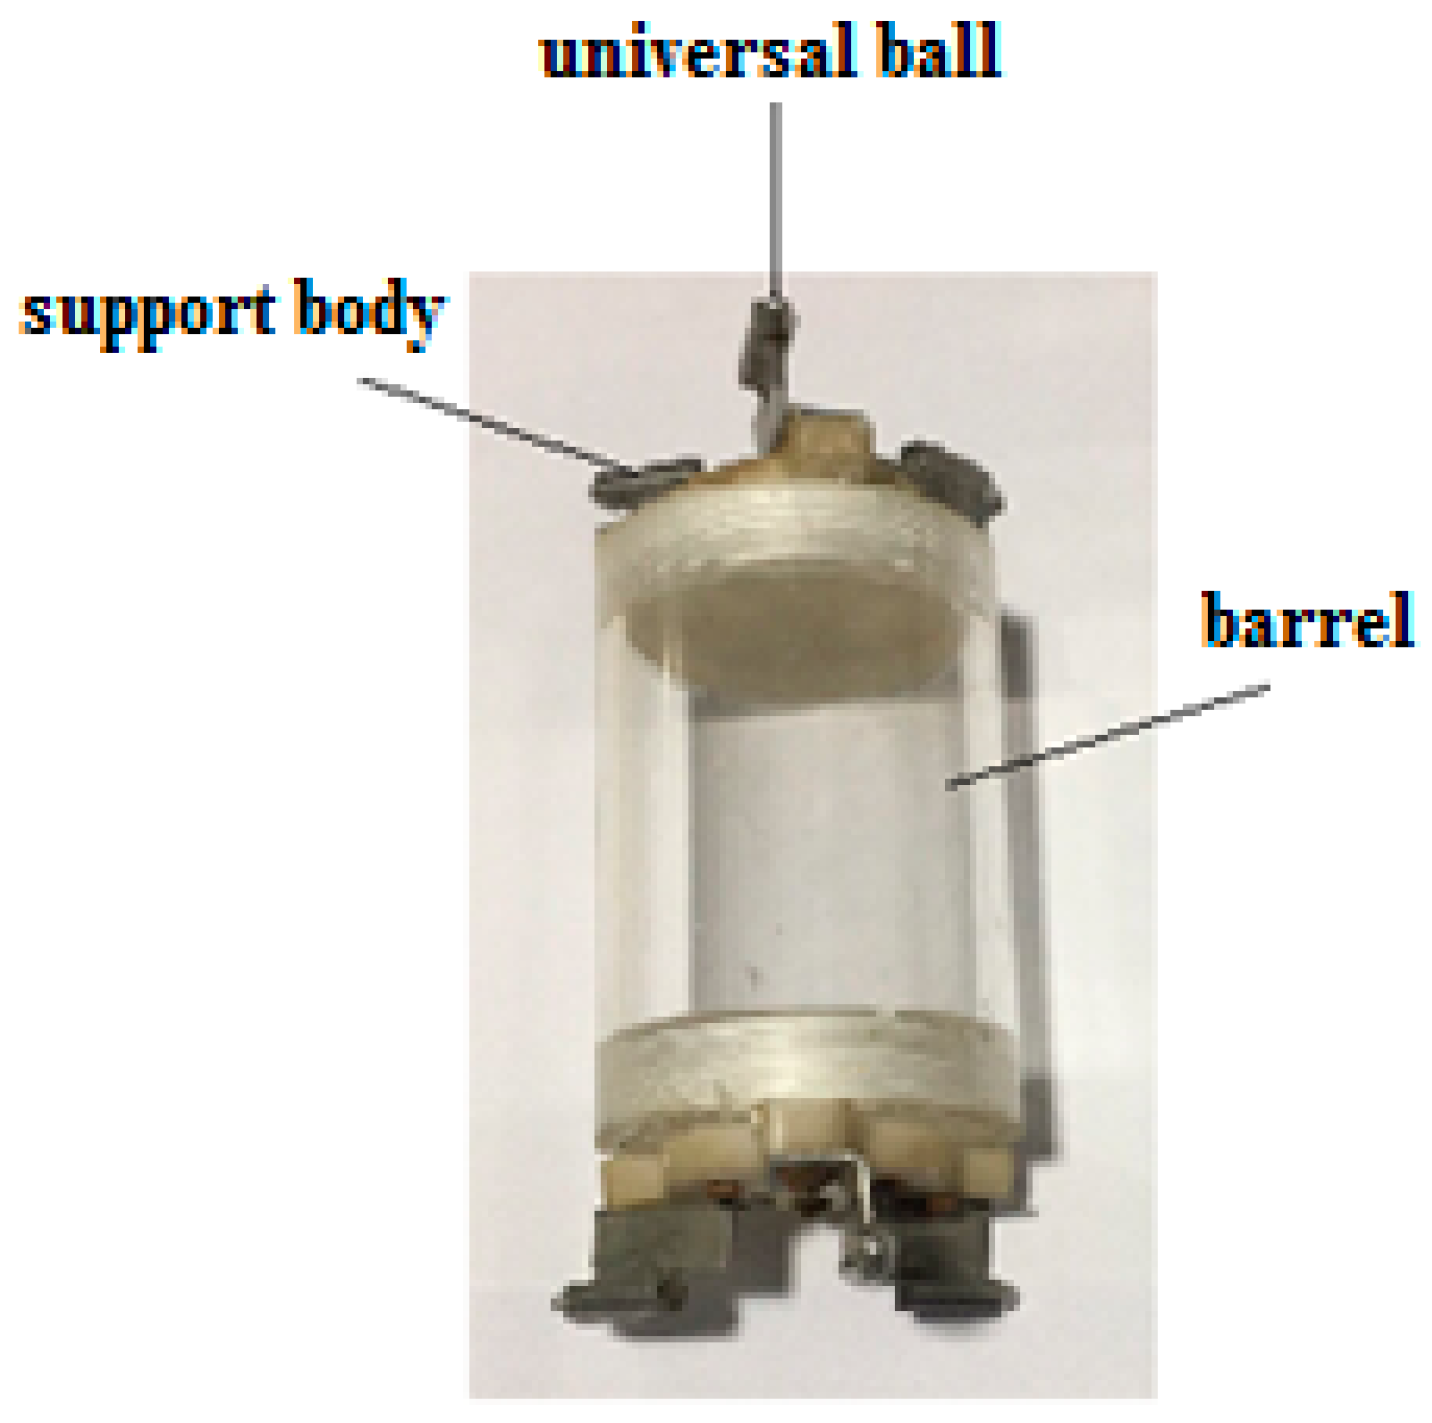
Regardless of the transport condition, the circumferential velocity of the downstream section of the capsule was smaller and the distribution of velocity was relatively stable. Moreover, the farther the downstream section was from the capsule, the smaller the circumferential velocity was. Under the condition of the same flow discharge and transporting loading, the distribution of the circumferential velocity for the same section downstream of the capsule was mainly influenced by the size of the capsule structure. It can be seen from
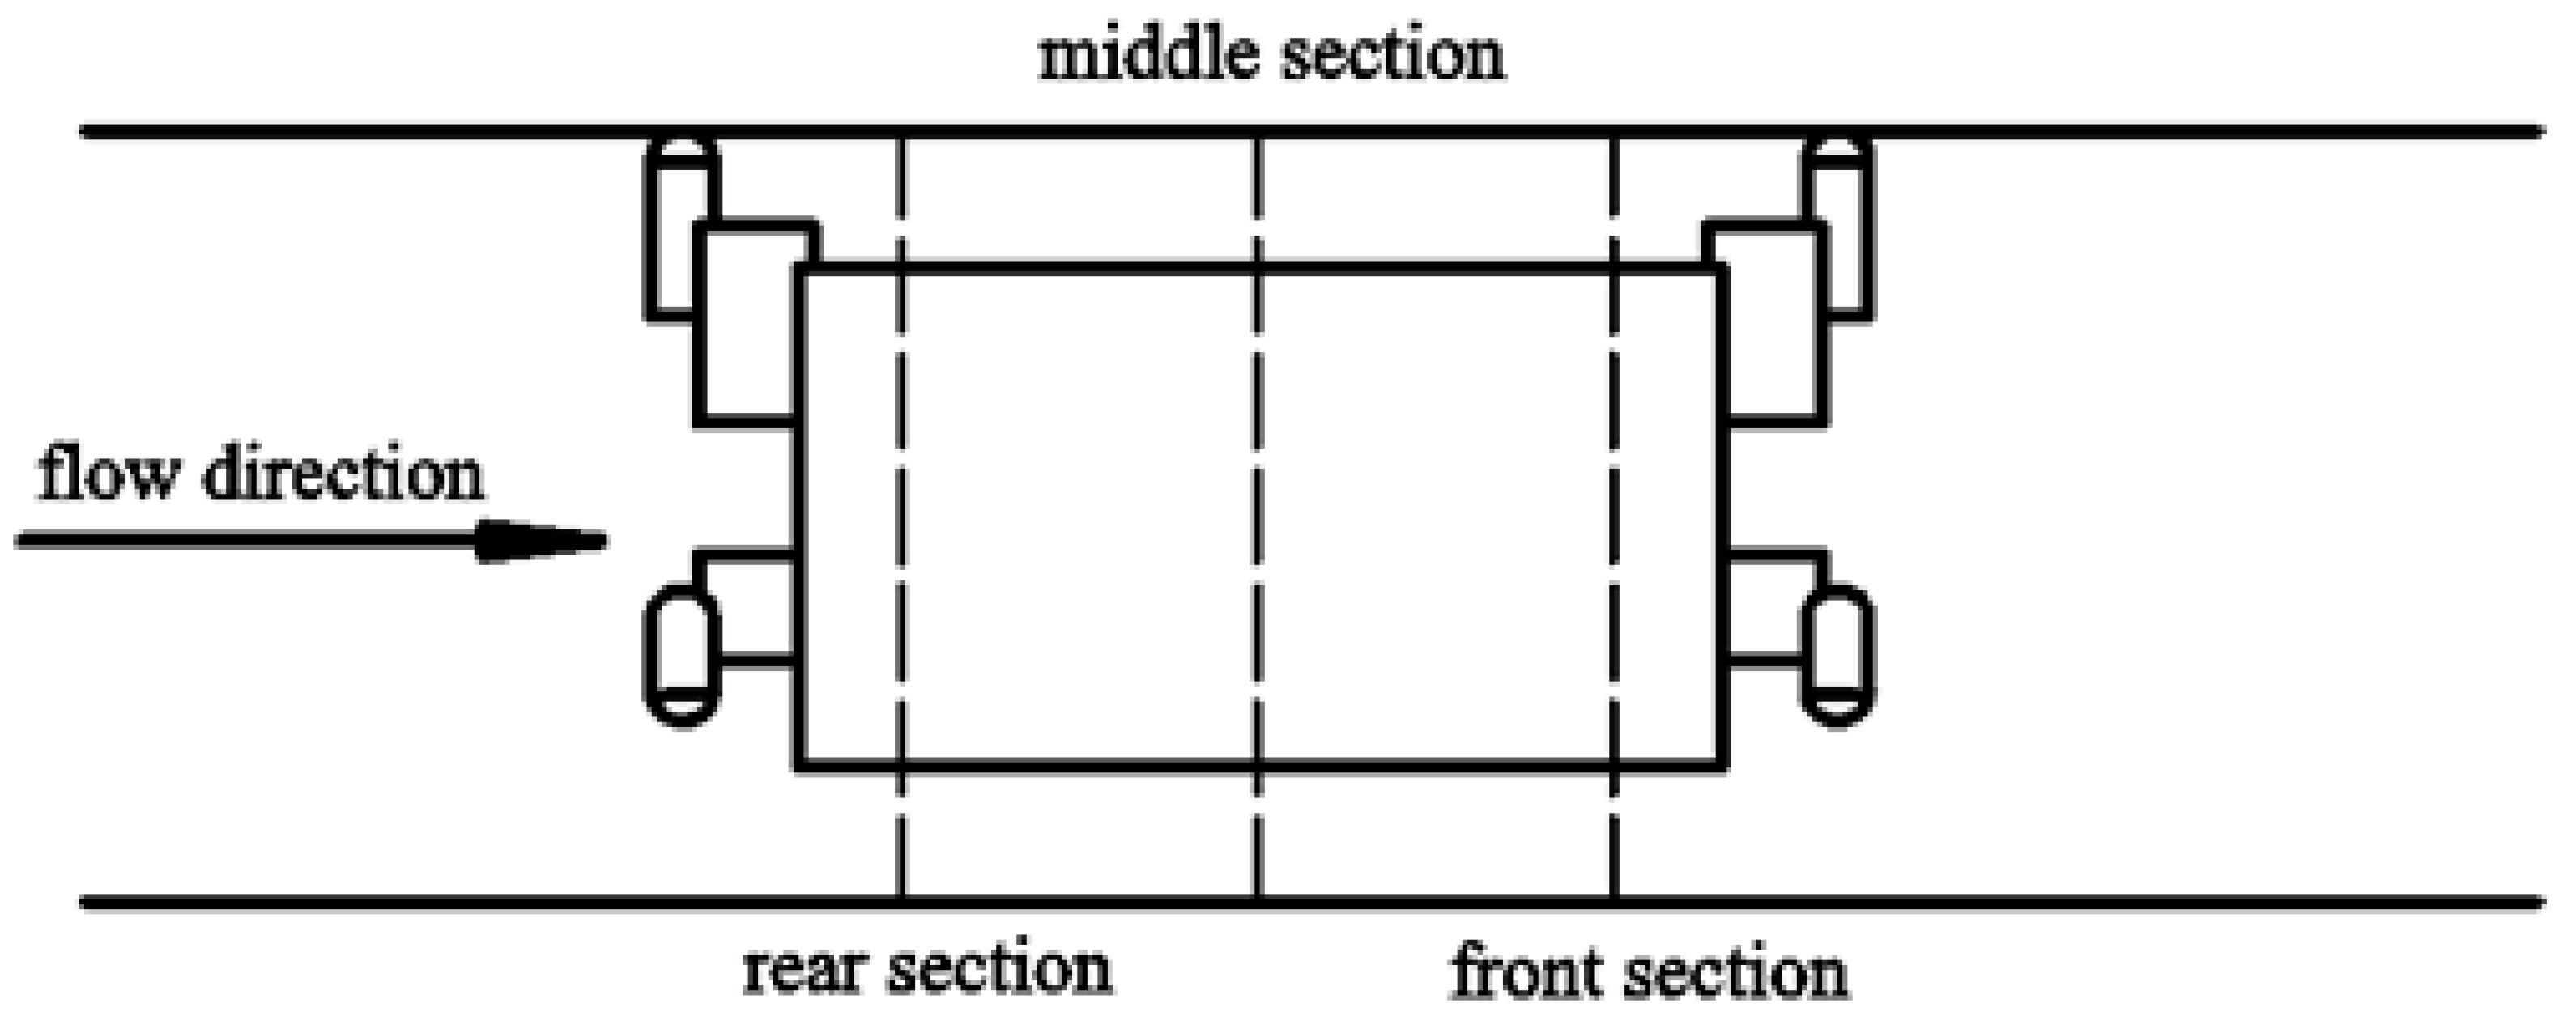
Figure 1 that the capsule is mainly composed of the barrel, the support body, and the universal ball, in which the universal balls were embedded in the support body. It can be seen that the size of the barrel and the support body affected directly the circumferential velocity distribution of the downstream section of the capsule, in which the support body had a greater impact on the circumferential velocity. However, the size of the support body of the capsule studied in this paper is the same. Therefore, for the two capsules of the length–diameter ratio selected in this paper, the proportion of the volume of support body in the volume of capsule with
L/
d = 2.5 was the largest and the smallest in the capsule with
L/
d = 2.14. It can be seen that the capsule with
L/
d = 2.5 had a greater impact on the circumferential velocity of the downstream section, while the capsule with
L/
d = 2.14 had a smaller impact on the circumferential velocity of the downstream section.
Figure 10 shows the distributions of radial flow velocity of the downstream sections of the capsules, as follows:
Regardless of the transport condition, the radial velocity distribution of the downstream section of the capsule was basically the same. The radial velocity distribution of the downstream section of the capsule is more thinly spread near the pipe wall and denser near the center of the pipe, but its value was always small. The farther the downstream section was from the capsule, the smaller the radial velocity was. When the length or the diameter of the capsule was the same, the radial velocity of the same measuring point increased with the increase of the length–diameter ratio of the capsule, but the increase was not significant.
3.3. Flow Velocity Characteristics of Annular Gap Section Between Capsule and Pipe
When the capsule was running in the pipeline, the annular gap flow with a certain length was formed along the length direction of the capsule. The flow velocity distribution of the annular gap section of the capsule in the process of transporting materials was analyzed. The front, middle, and rear sections of the capsule were selected for study. The division of the front, middle, and rear section of the capsule was shown in
Figure 4.
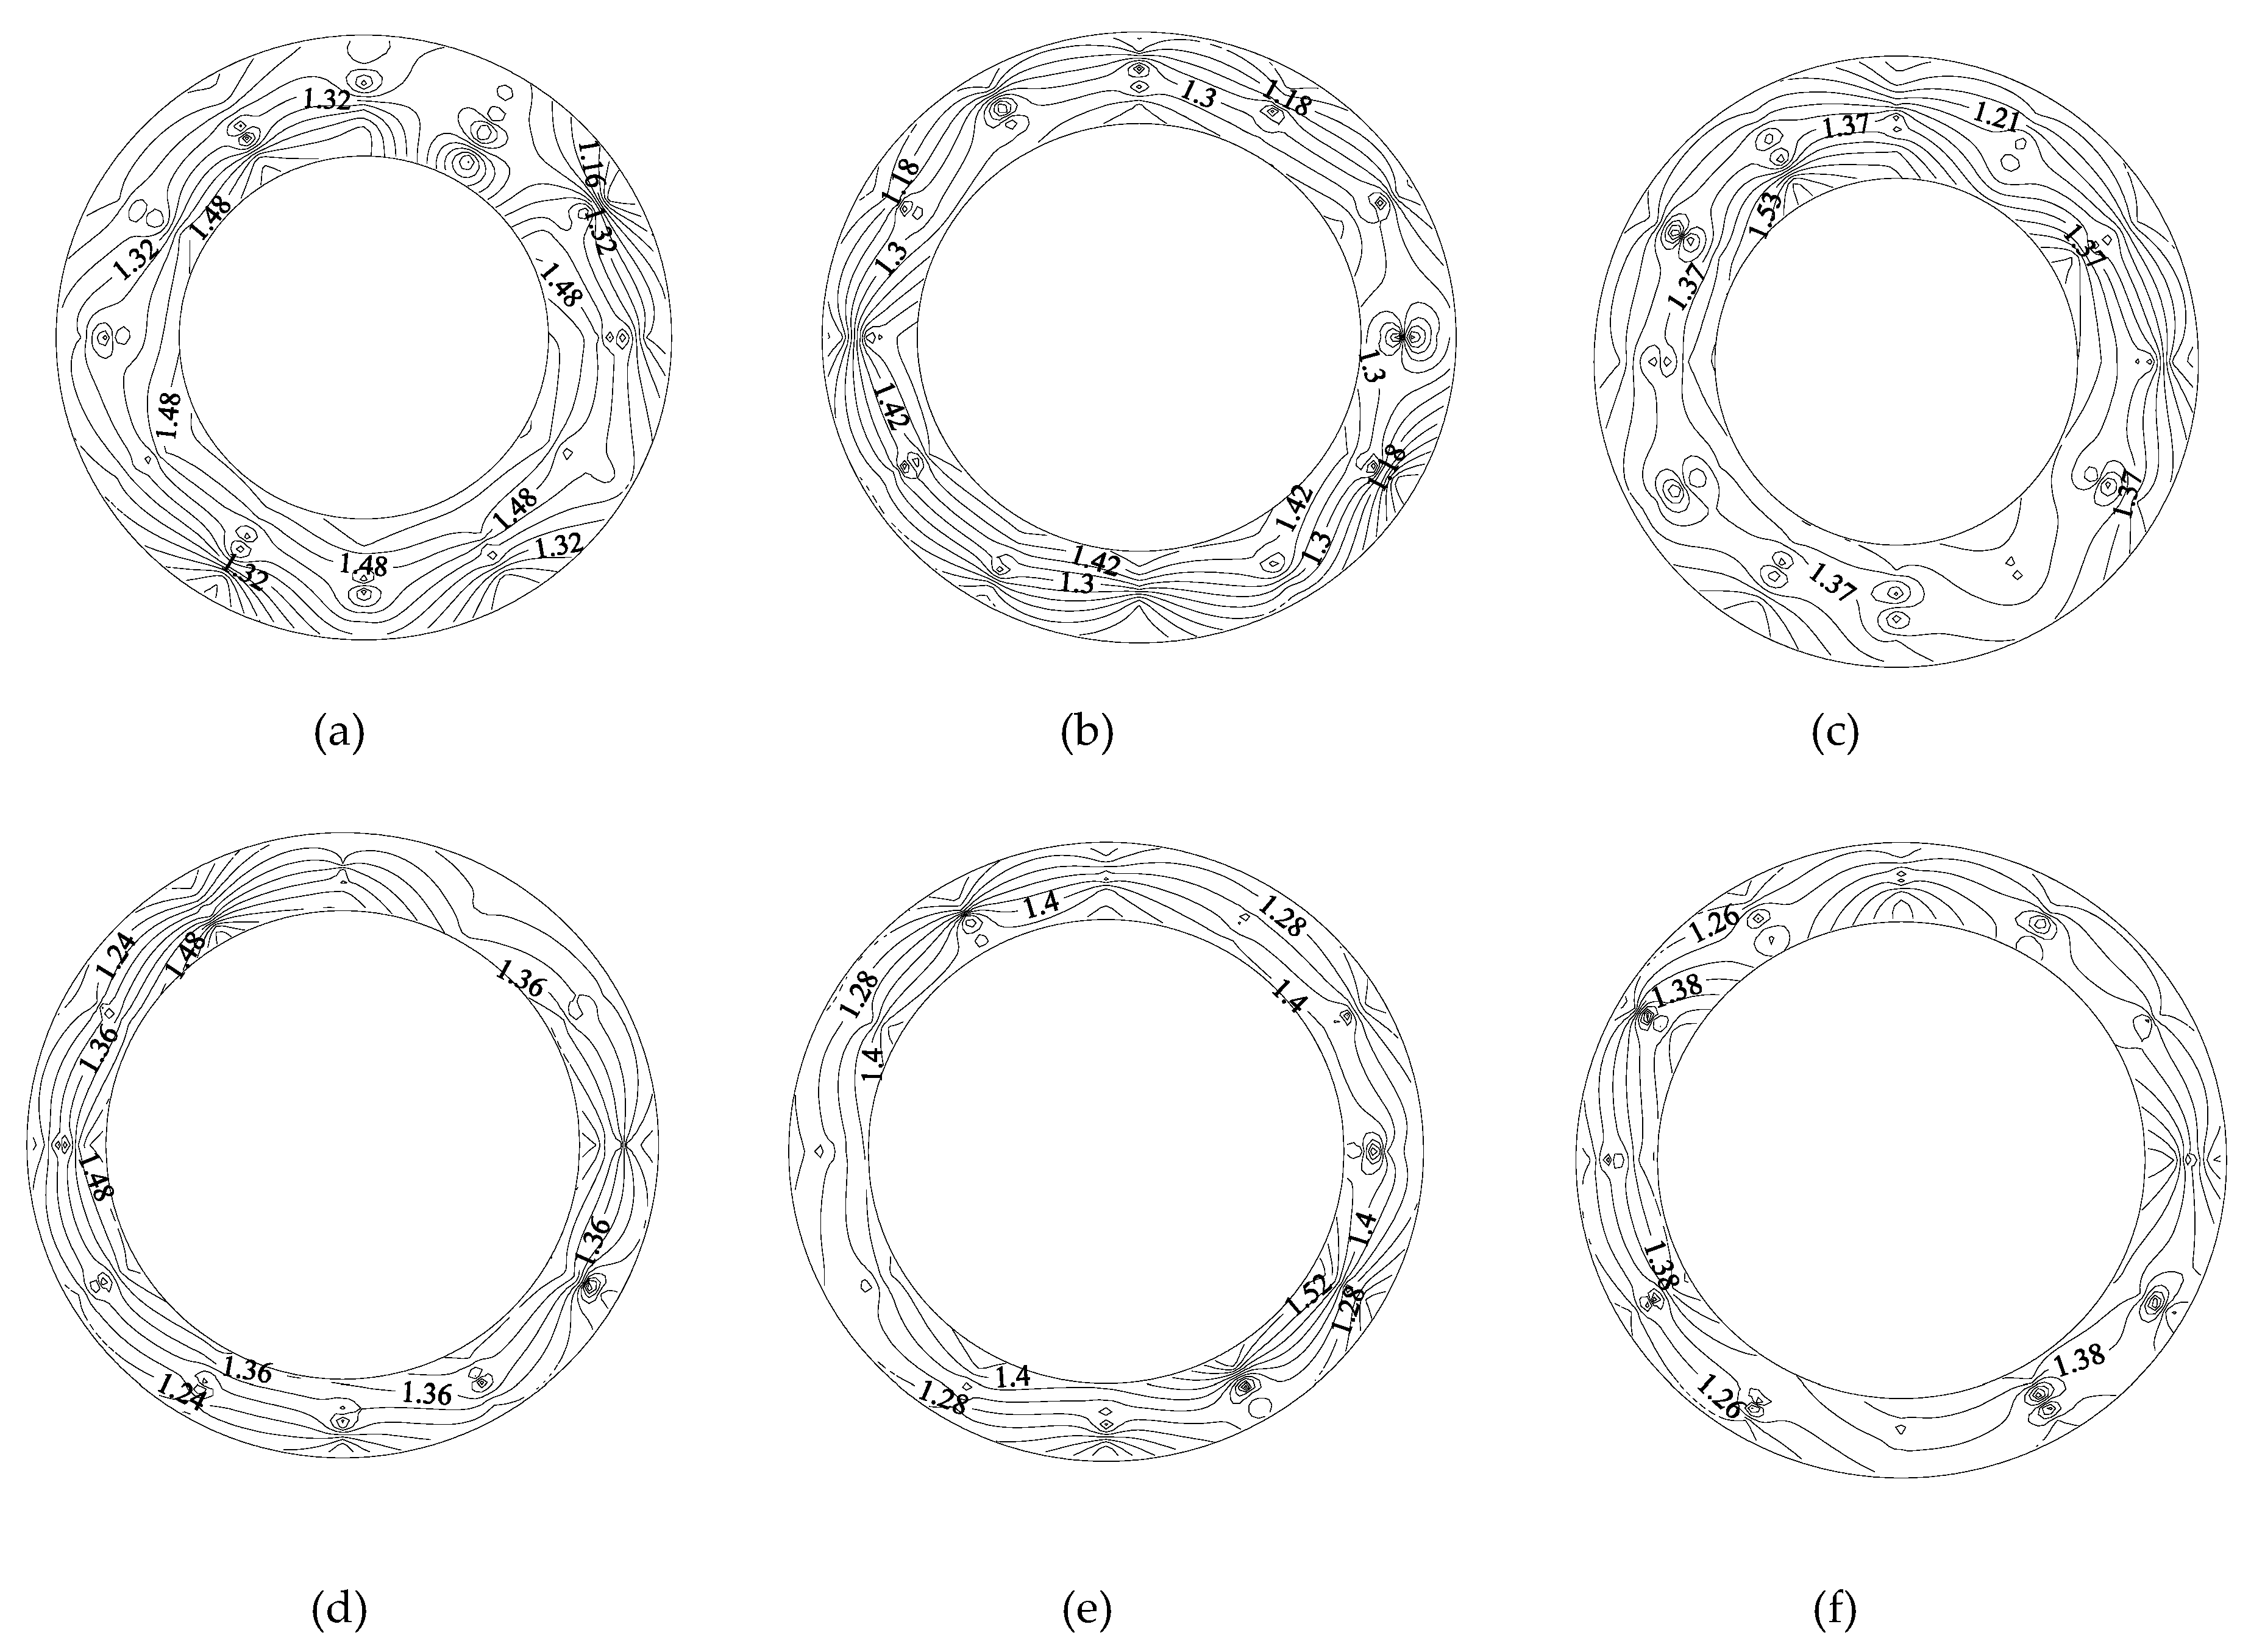
Figure 11 shows the axial flow velocity distribution of the front, middle, and rear annular gap sections of the capsule, as follows:
1) Along the movement direction of the capsule, the axial velocity contour line of annular gap flow changed from dense to sparse, indicating that the axial velocity gradient of annular gap flow decreased along the length direction of the capsule, and its distribution gradually became uniform.
2) When the water flowed around the rear section of the capsule, the axial velocity distribution of the rear section of the capsule was more disordered, and the contour line was denser for the double influence of the support body and the barrel. Its axial velocity was larger than that of the middle section and the front section. When the water continued to flow to the middle section of the capsule, the axial velocity distribution was flatter than that of the rear section of the capsule, and the density of contour line was also lower than that of the rear section of the capsule. Its axial velocity distribution began to appear in the high speed and low speed regions gradually. When the flow continued to the front section of the capsule, the axial velocity distribution was flatter and the contour lines were sparser than that of the rear section and the middle section. Moreover, because of the influence of the cylindrical support body, six distribution regions of axial velocity appeared, including 0°, 120°, and 240° for the high speed distribution and 60°, 180°, and 300° for the low speed distribution.
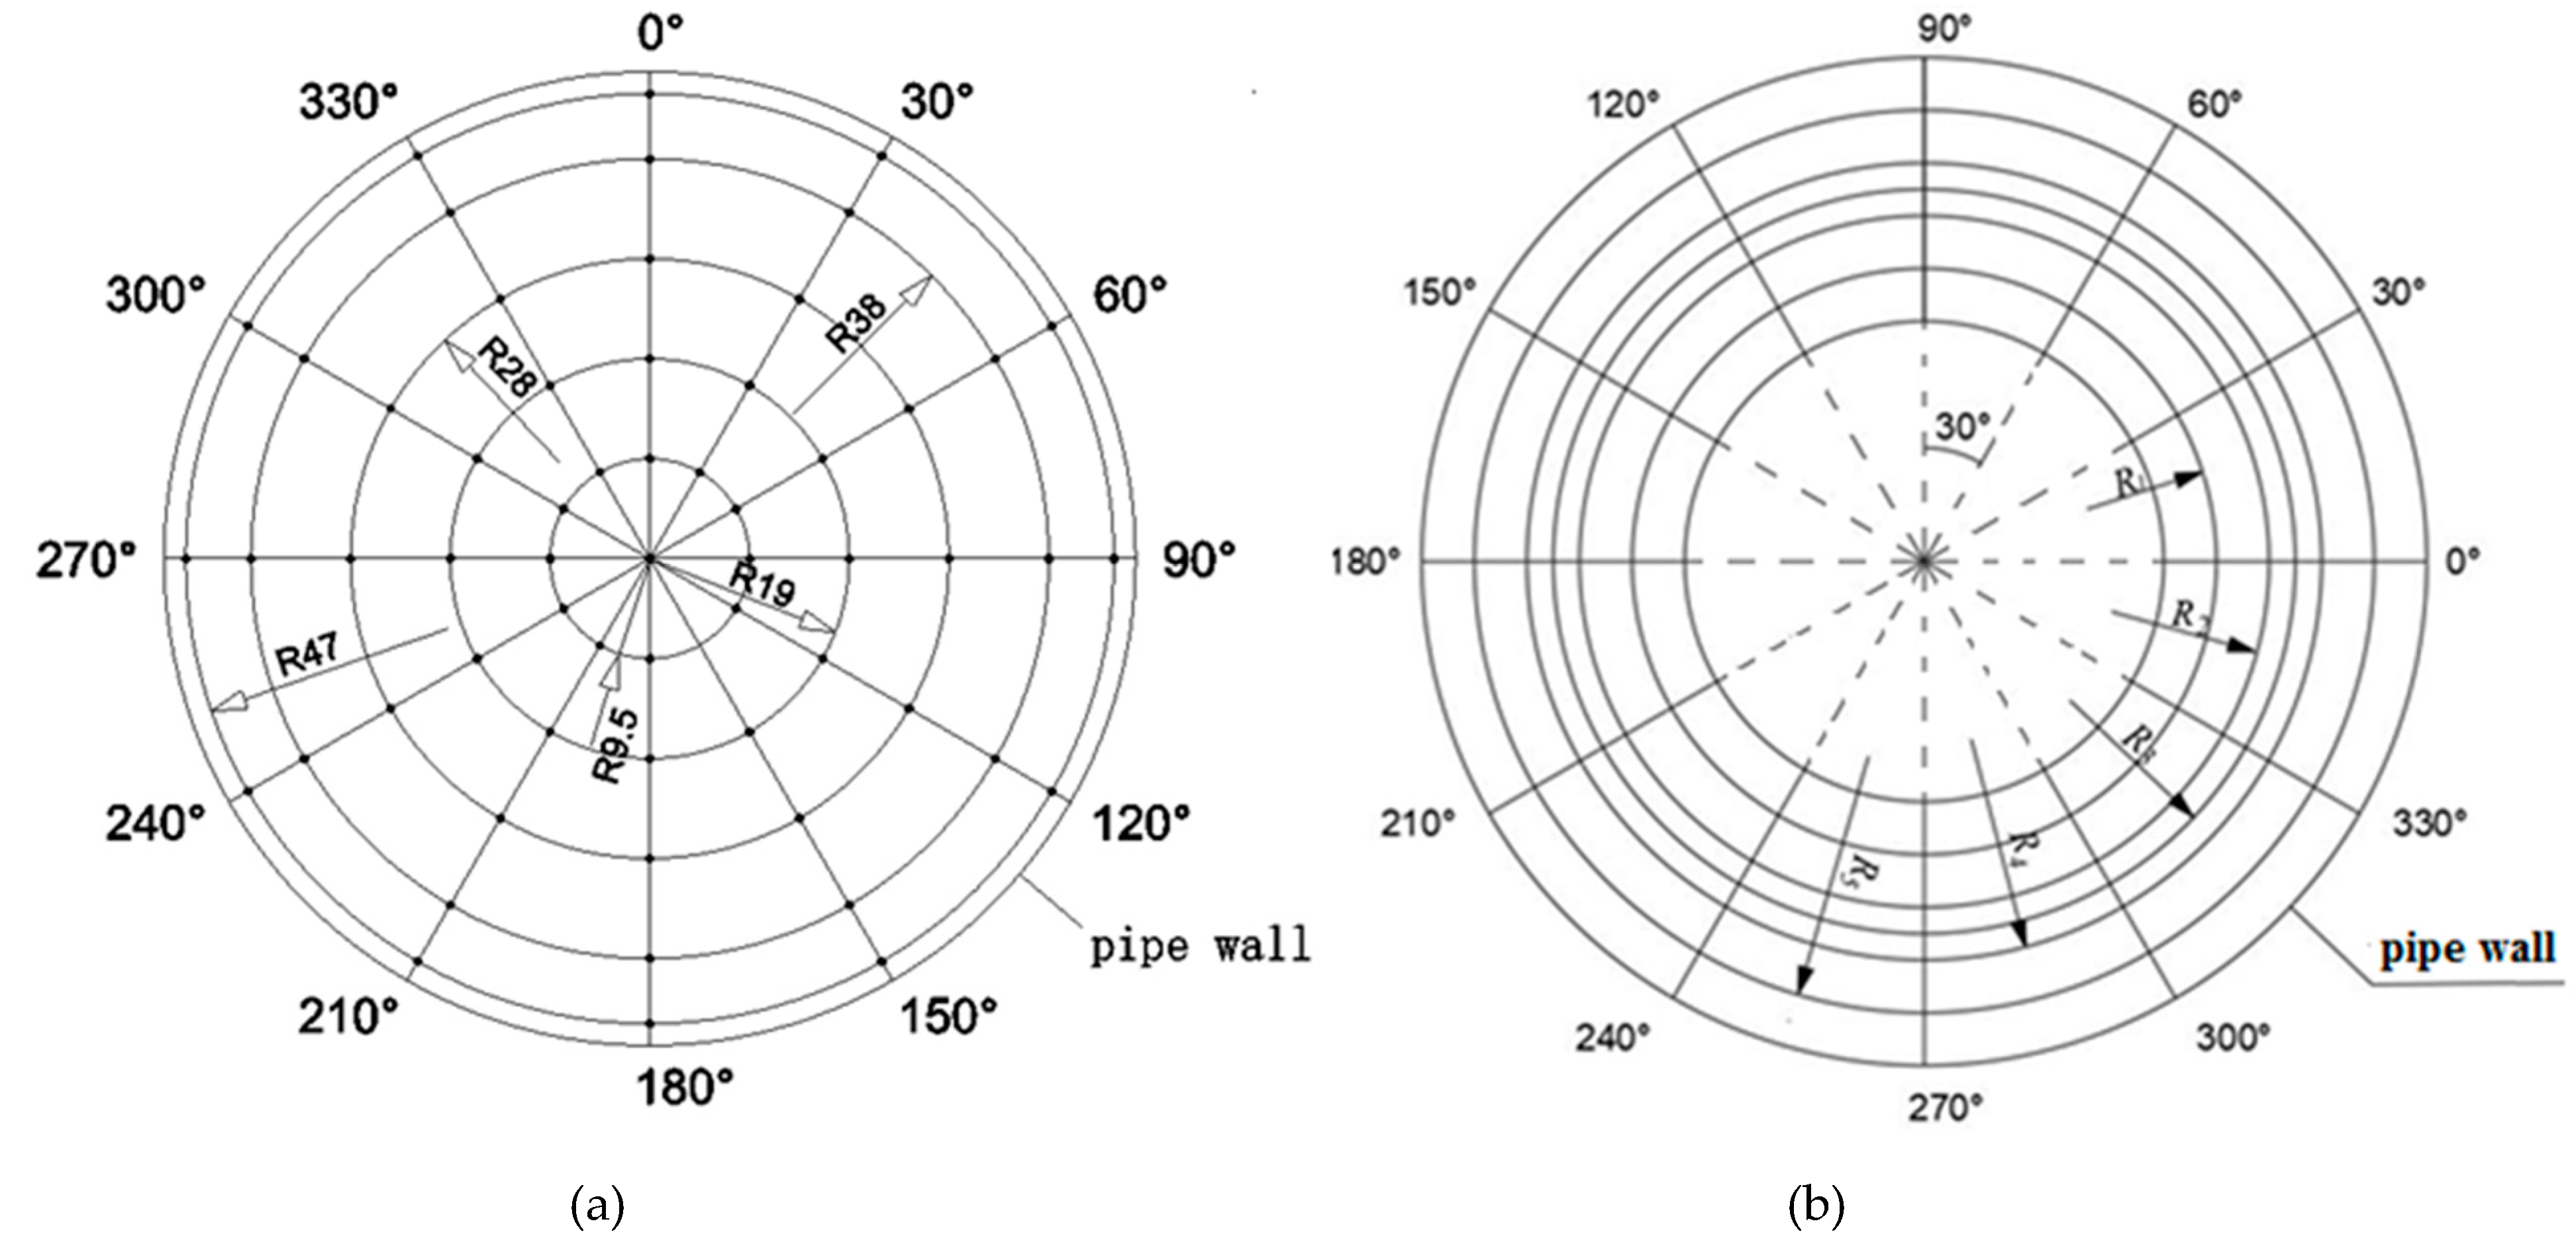
In order to further analyze the axial velocity change of annular gap flow during the movement of the capsule, the capsule with
L/
d = 2.14 as an example was analyzed from the same polar axis and the same measuring ring. The arrangement of the polar axis and the measuring ring was shown in
Figure 3.
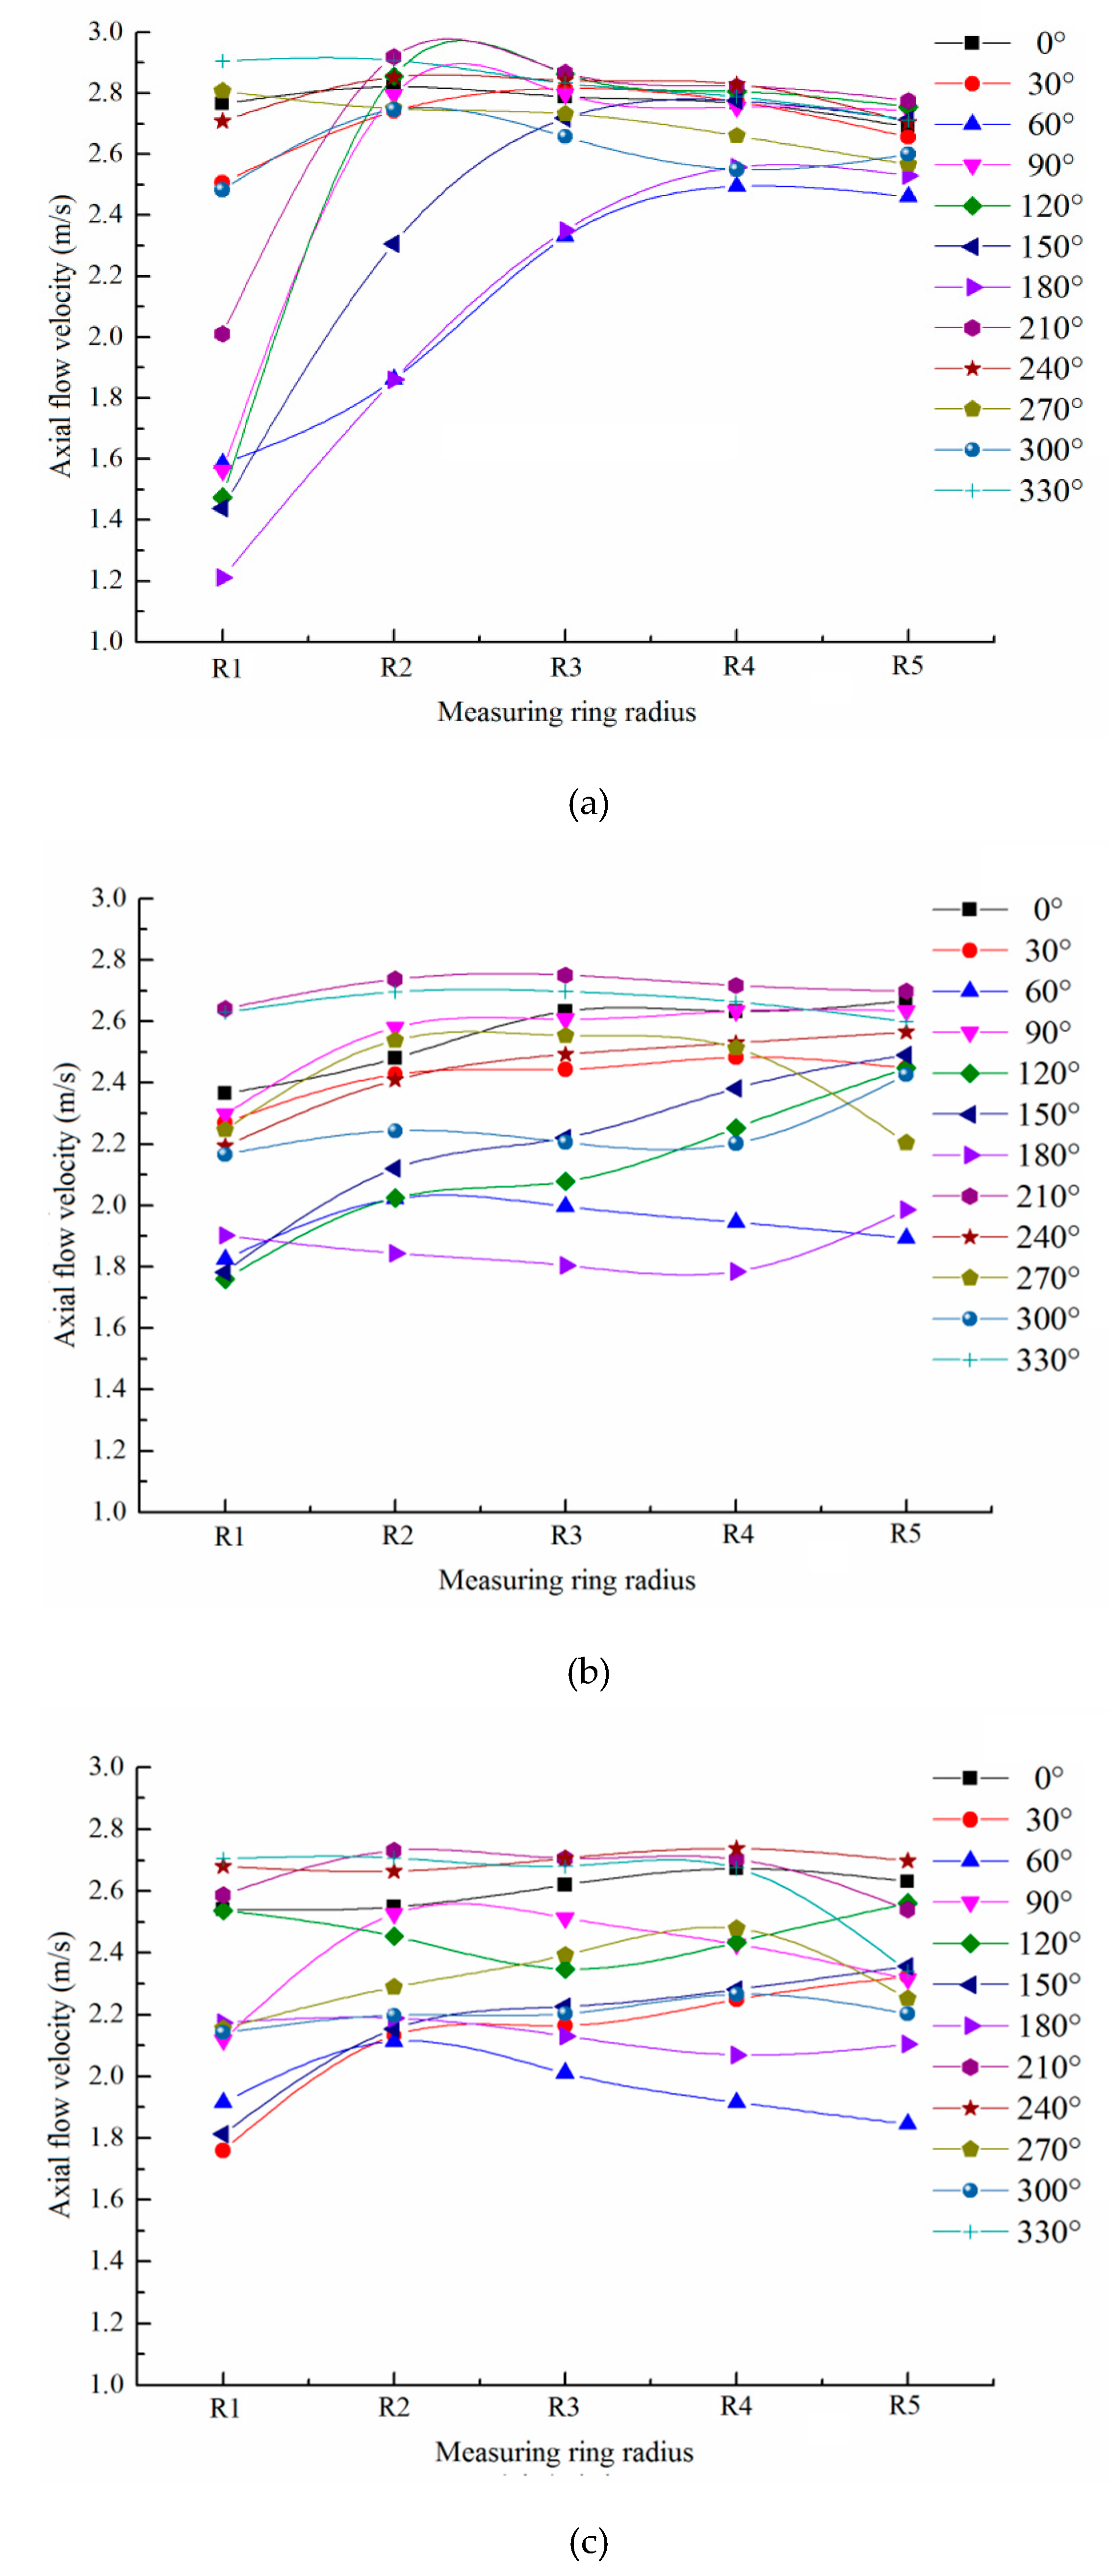
Figure 12 shows the local variation of axial velocity on the same polar axis.
For the rear section, the axial velocity on each pole axis increased first, then decreases, and then tended to be uniform with the increase of the ring radius. The axial velocity distribution on the maximum radius ring R5 was in the range (2.4 m/s, 2.8 m/s), and the axial velocity distribution on the minimum radius ring R1 was in the range (1.2 m/s, 2.9 m/s). When the flow around the tail section of the capsule flowed forward along the annular gap area, the flow velocity would be redistributed. The axial velocity distribution interval on the R1 measuring ring in the central section of the capsule had been reduced to (1.6 m/s, 2.6 m/s), while the axial velocity distribution interval on the R1 measuring ring had also been reduced to basically the same as that on the R1 measuring ring. When the water continued to flow through the front section of the capsule, the variation range of the axial velocity between the poles was (1.8 m/s, 2.8 m/s). Compared with the rear section and middle section of the capsule, the axial velocity on the R1, R2, and R3 measuring rings was basically unchanged, while the axial velocity on the R4 and R5 measuring rings increased.
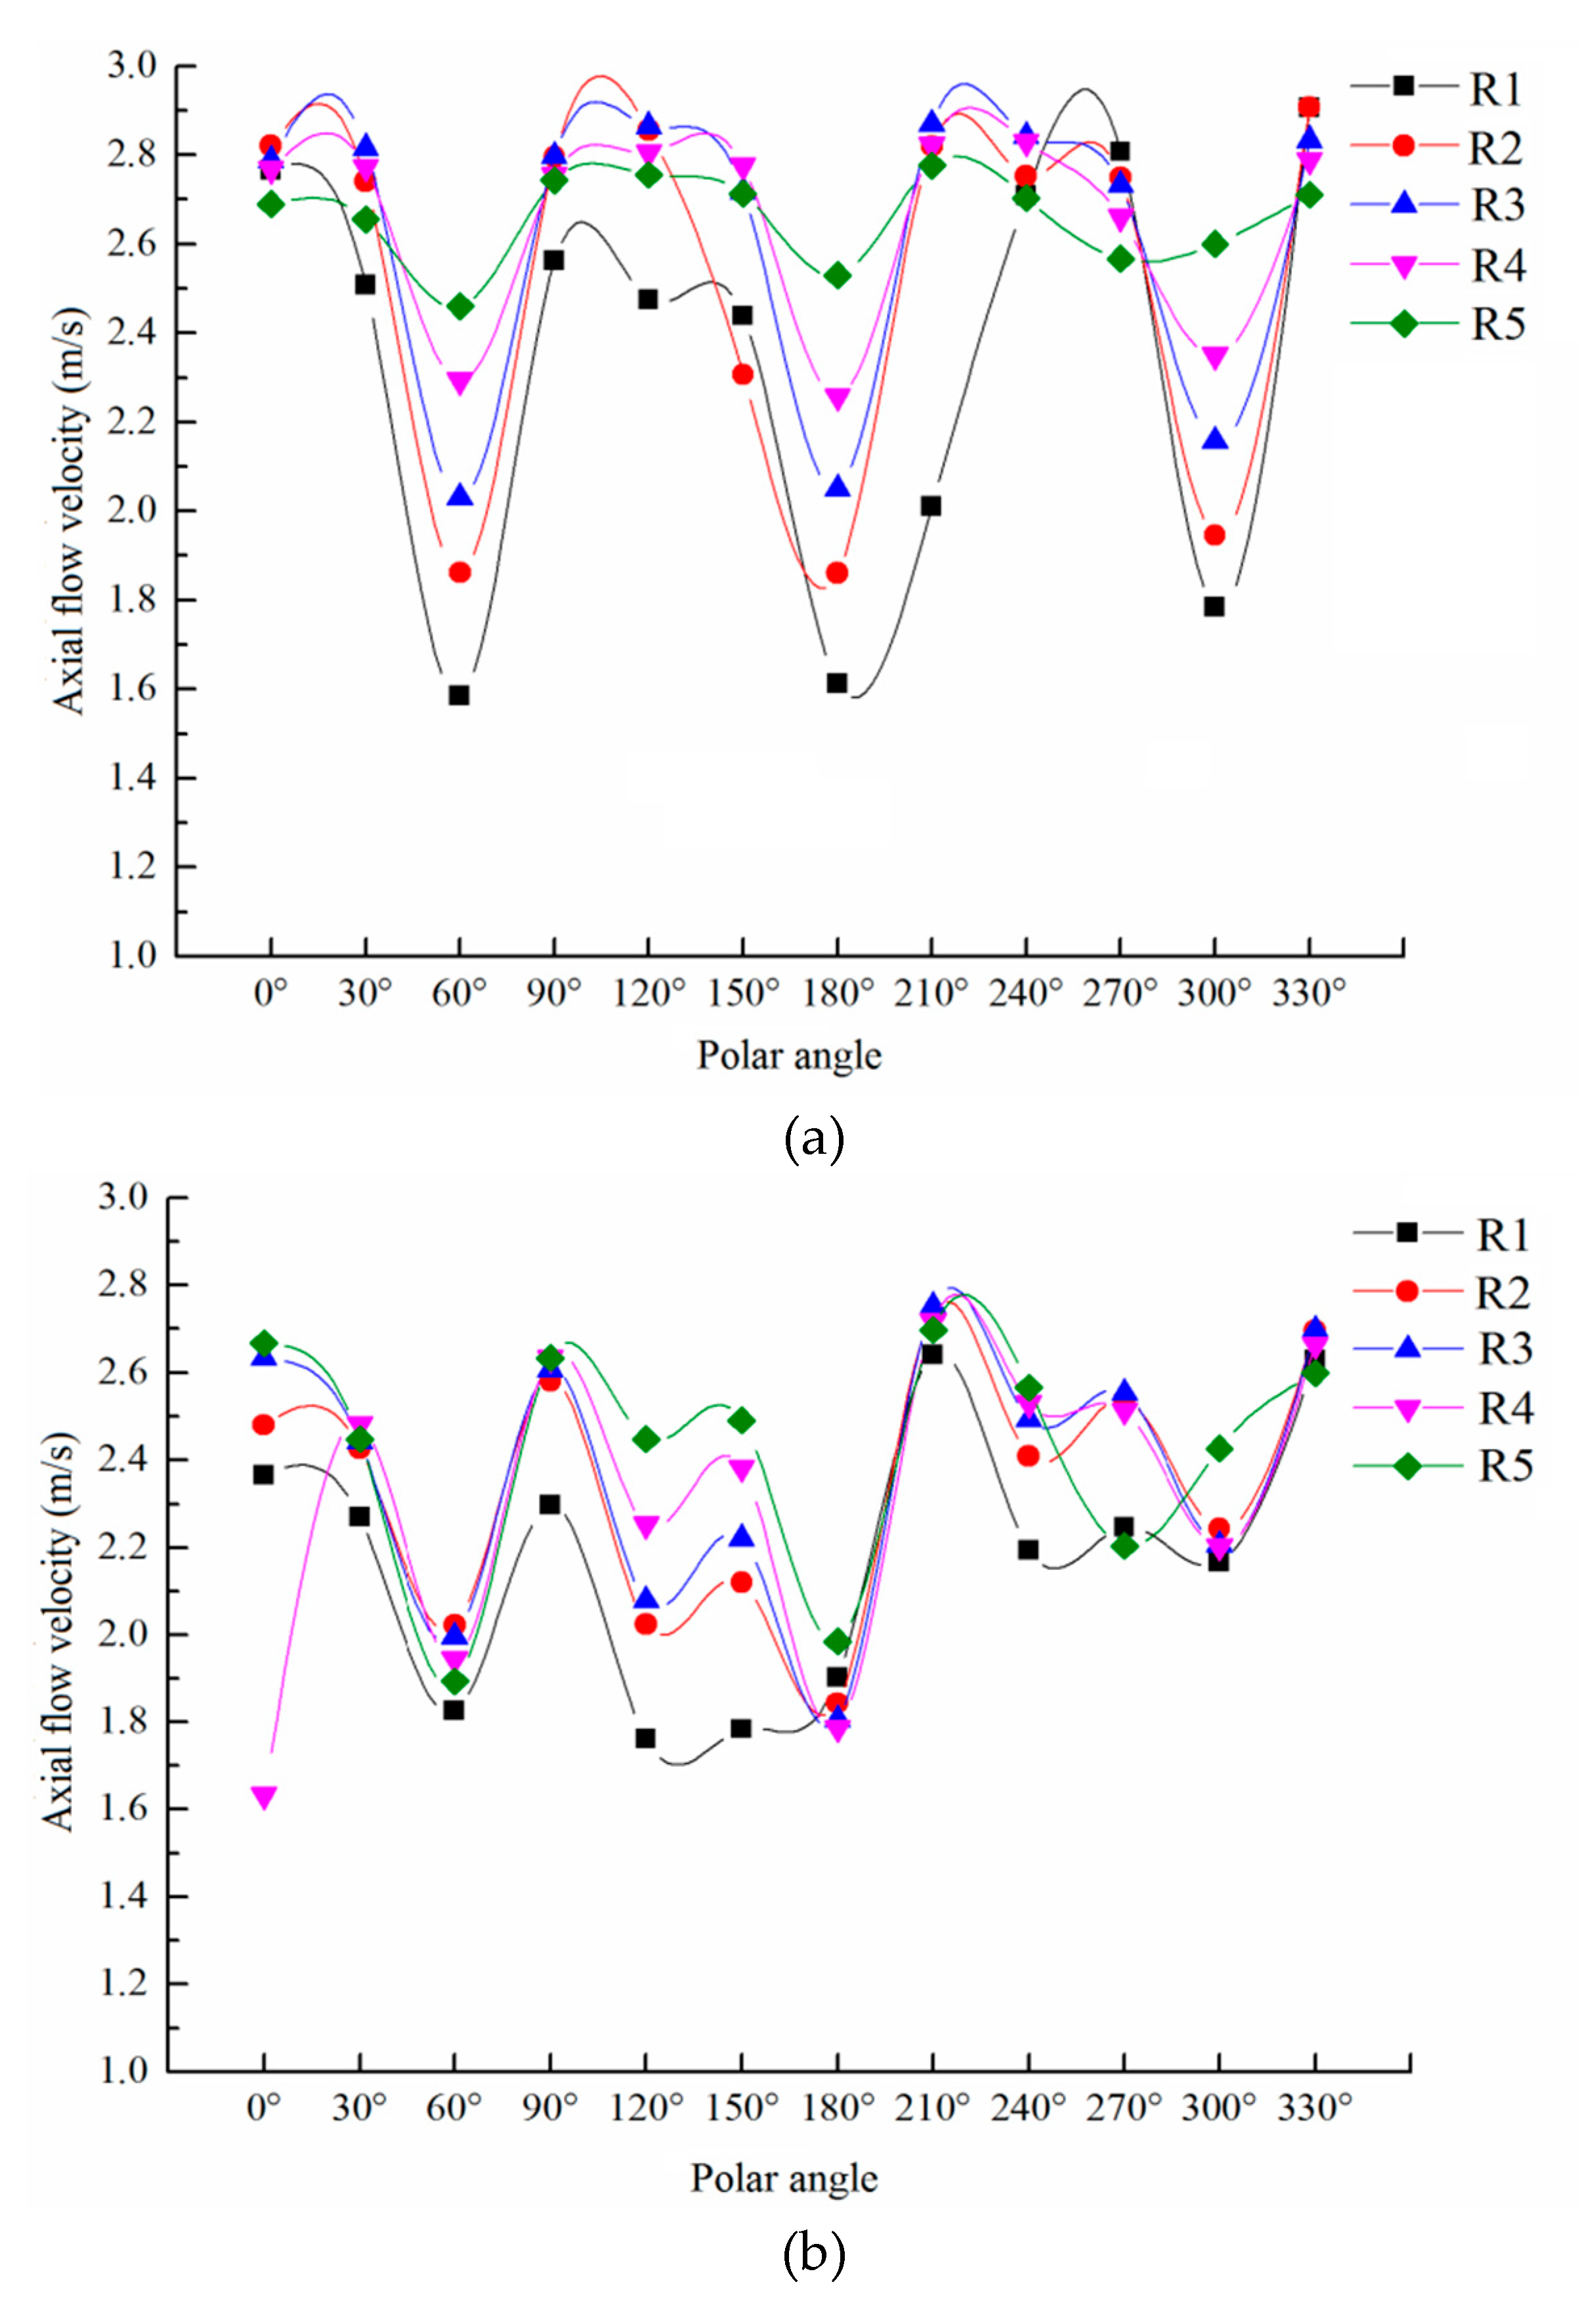
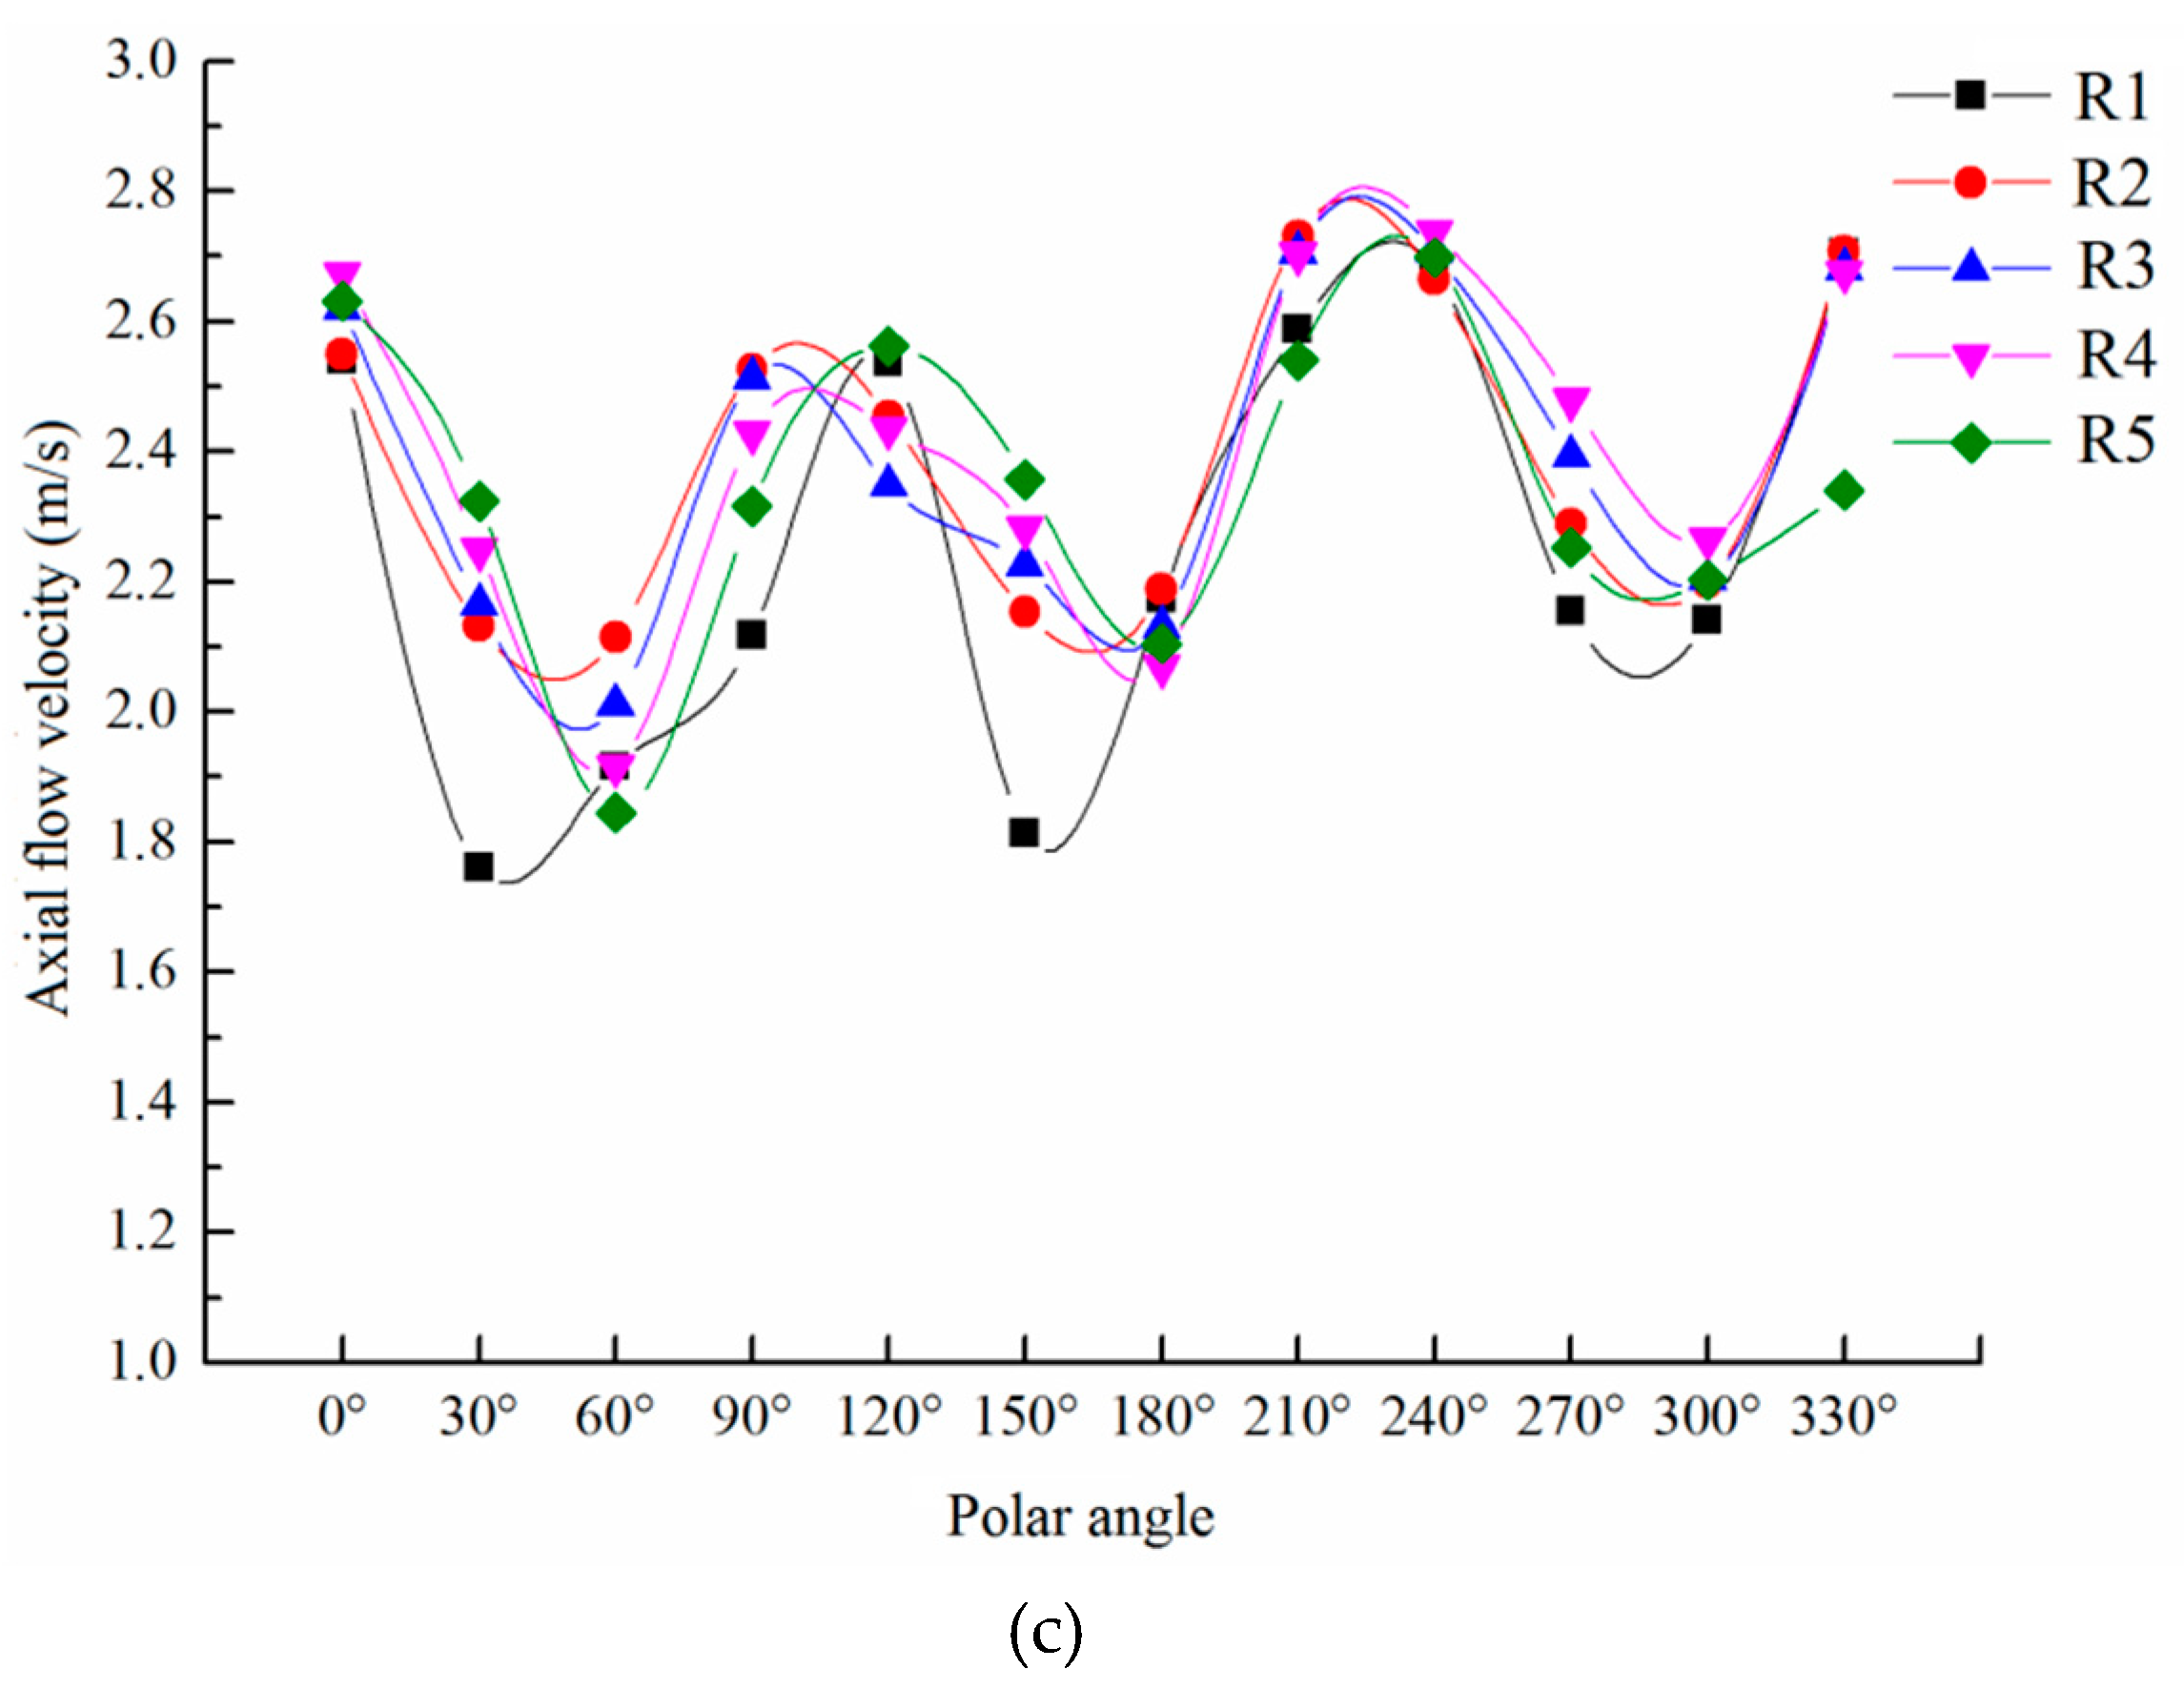
Figure 13 shows the local variation of axial velocity on the same measuring ring.
The distribution of axial velocity on the same measuring ring was basically the same, showing a wave-like variation trend of alternating crest and trough with the change of polar axis, and the axial velocity fluctuated greatly. The change of the axial velocity between the measuring rings decreased gradually with the increase of the radius of the measuring ring, which indicated that the axial velocity tended to be stable along the path. Three troughs and three peaks appeared in the distribution of axial velocity on the same measuring ring, and the location of the alternate change of troughs and peaks also showed certain regularity. Among them, the wave crest was located at the polar position of 0°, 120°, and 240°, while the wave trough was located at the polar position of 60°, 180°, and 300°, and the position where the wave trough occurred coincides with the arrangement position of the three cylindrical support bodies.
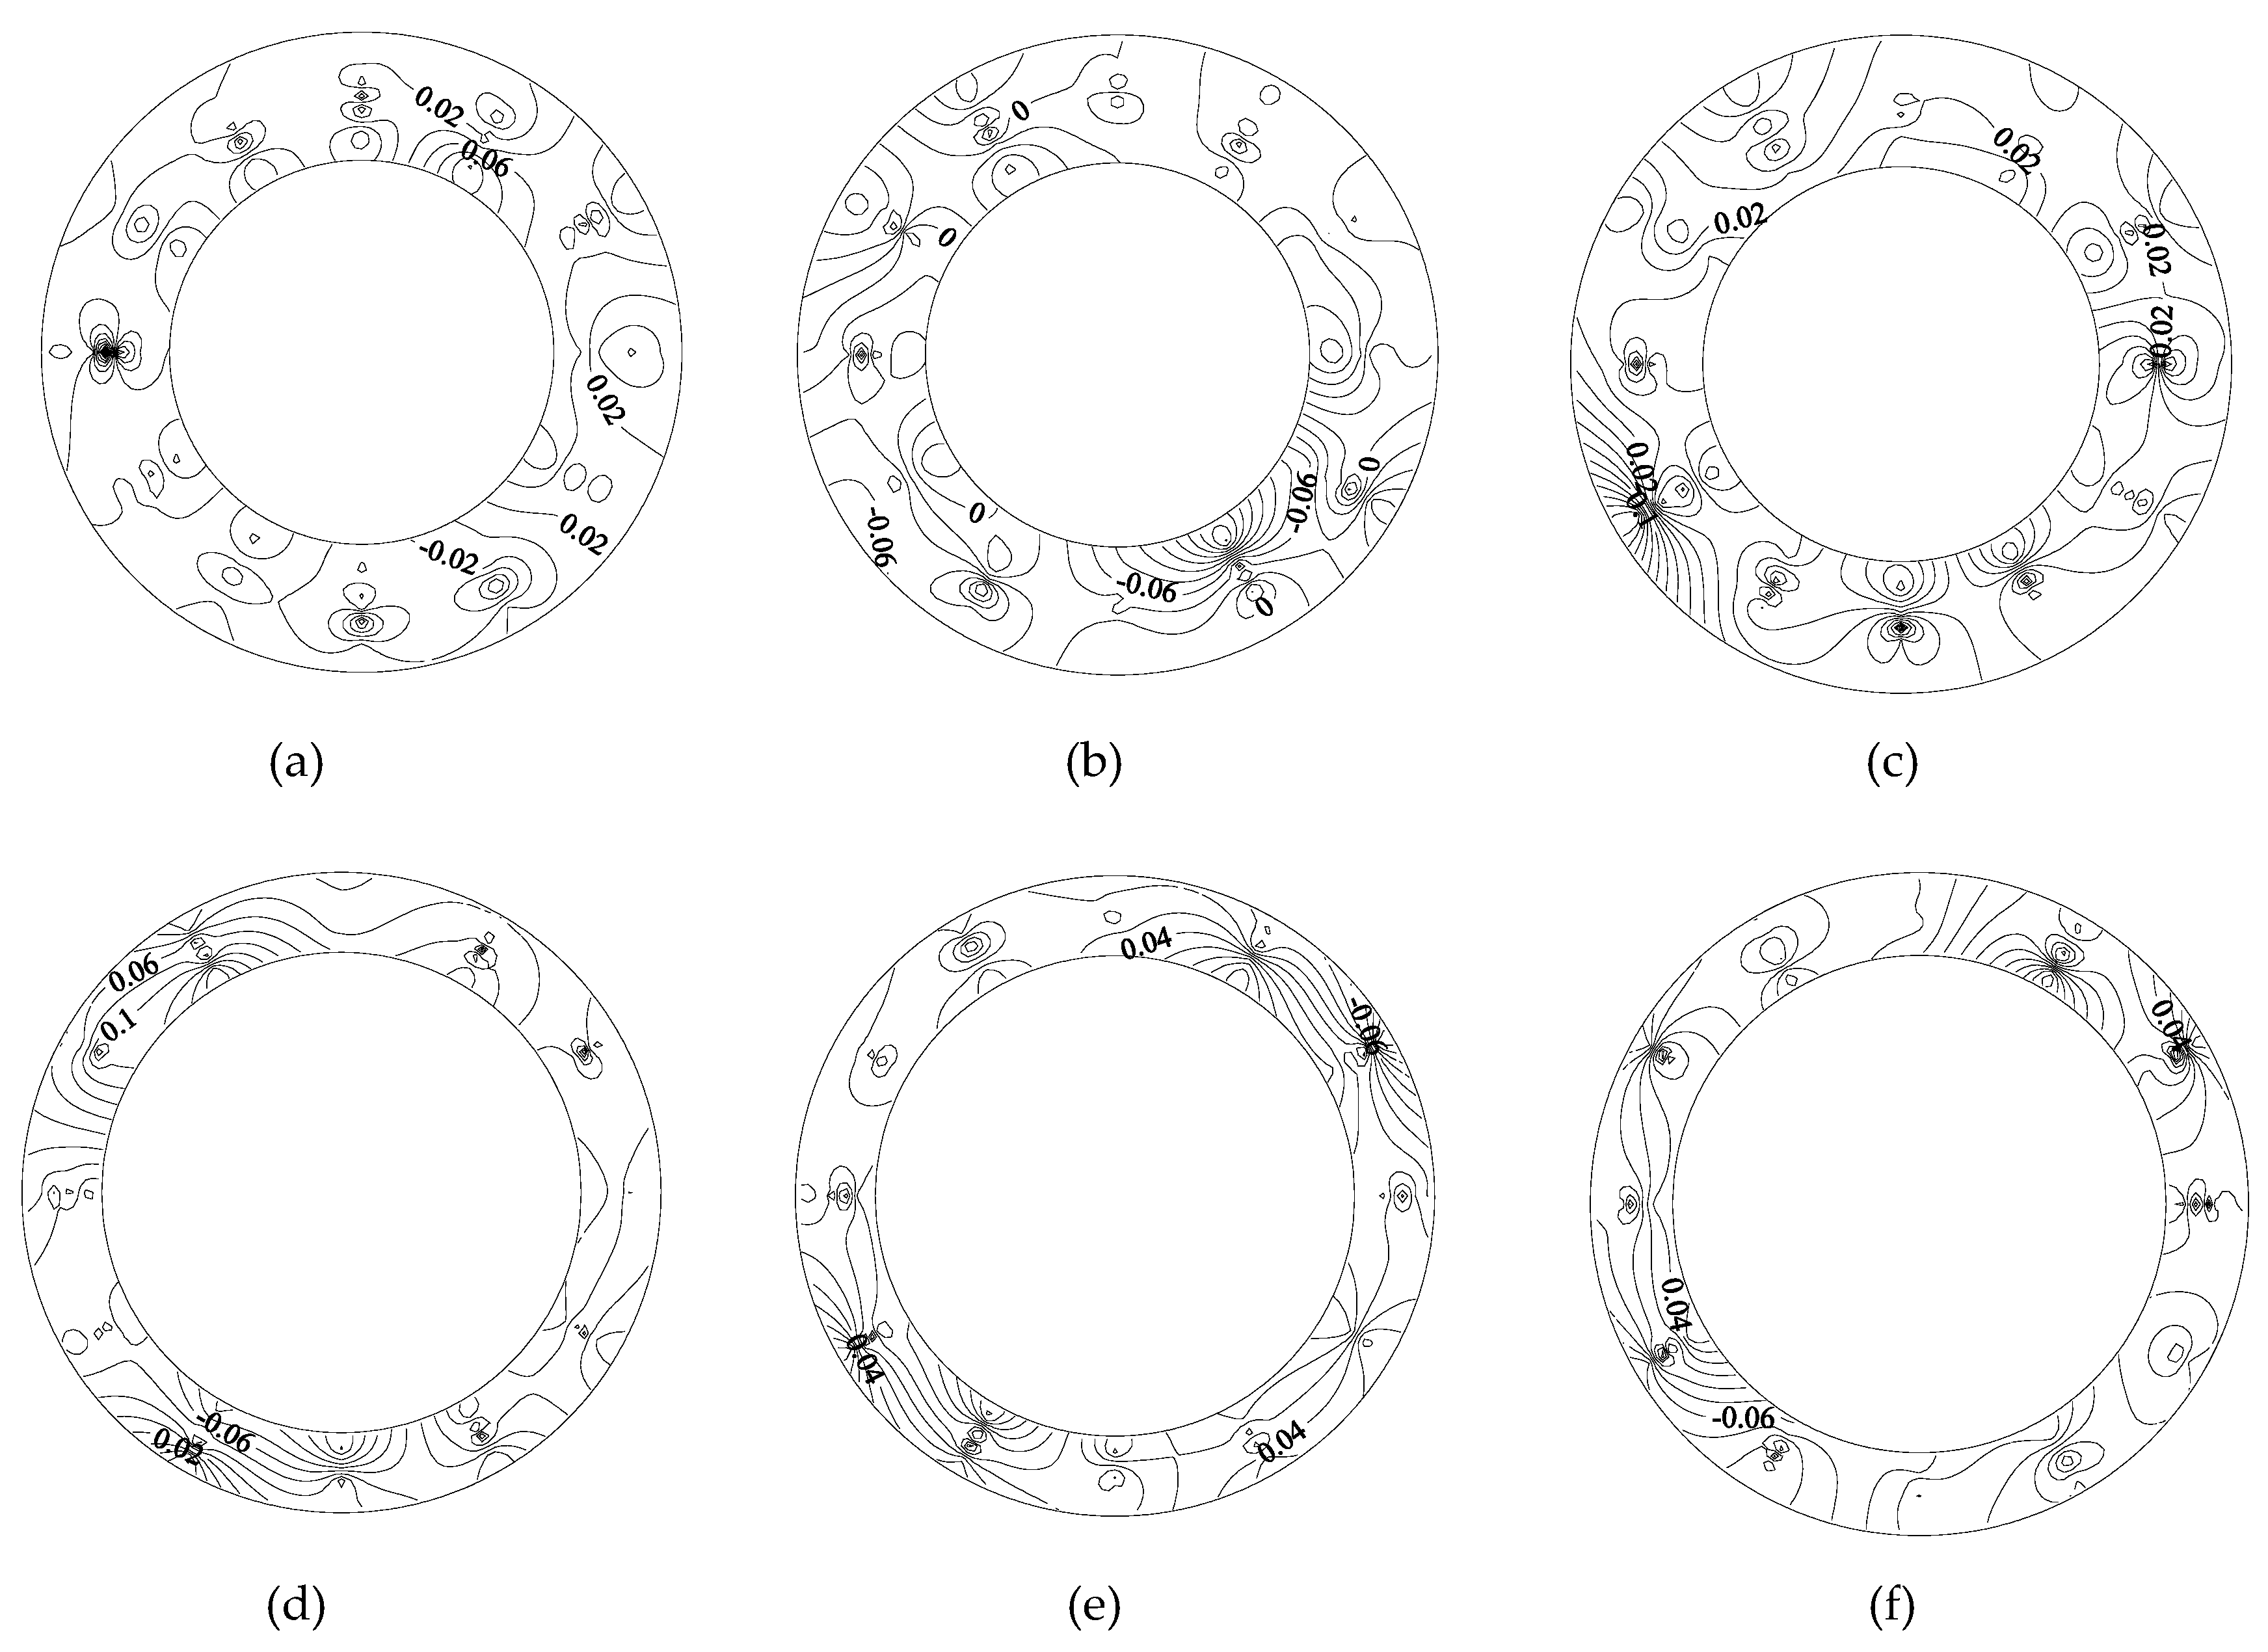
Figure 14 shows the circumferential flow velocity distribution of the front, middle and rear annular gap sections of the capsule, as follows:
Along the movement direction of the capsule, the circumferential velocity contour line of annular gap flow changed from dense to sparse to dense, indicating that the circumferential velocity gradient of annular gap flow decreased first and then increased along the length direction of the capsule. When the flow moved through the rear section of the capsule, the circumferential velocity of the annular gap flow in the rear section of the capsule was generally small; about 0.07 m/s. When the water continued to flow to the middle section of the capsule, the circumferential velocity of the annular gap flow in the middle section of the capsule was significantly higher than that in the rear section of the capsule; about 0.1 m/s. The distribution of circumferential velocity was also flatter than that of the rear section of the capsule, and the density of the contour line of circumferential velocity was also lower than that of the rear section of the capsule. When the flow continued to move to the front section of the capsule, due to the influence of the cylindrical support, the density of the circumferential velocity contour in the anterior section of the capsule increased compared with that in the middle section of the capsule, and the circumferential velocity gradient of the anterior section of the capsule increased gradually.
In order to further analyze the circumferential velocity change of annular gap flow during the movement of the capsule, the capsule with L/d = 2.14 as an example was analyzed from the same polar axis and the same measuring ring.
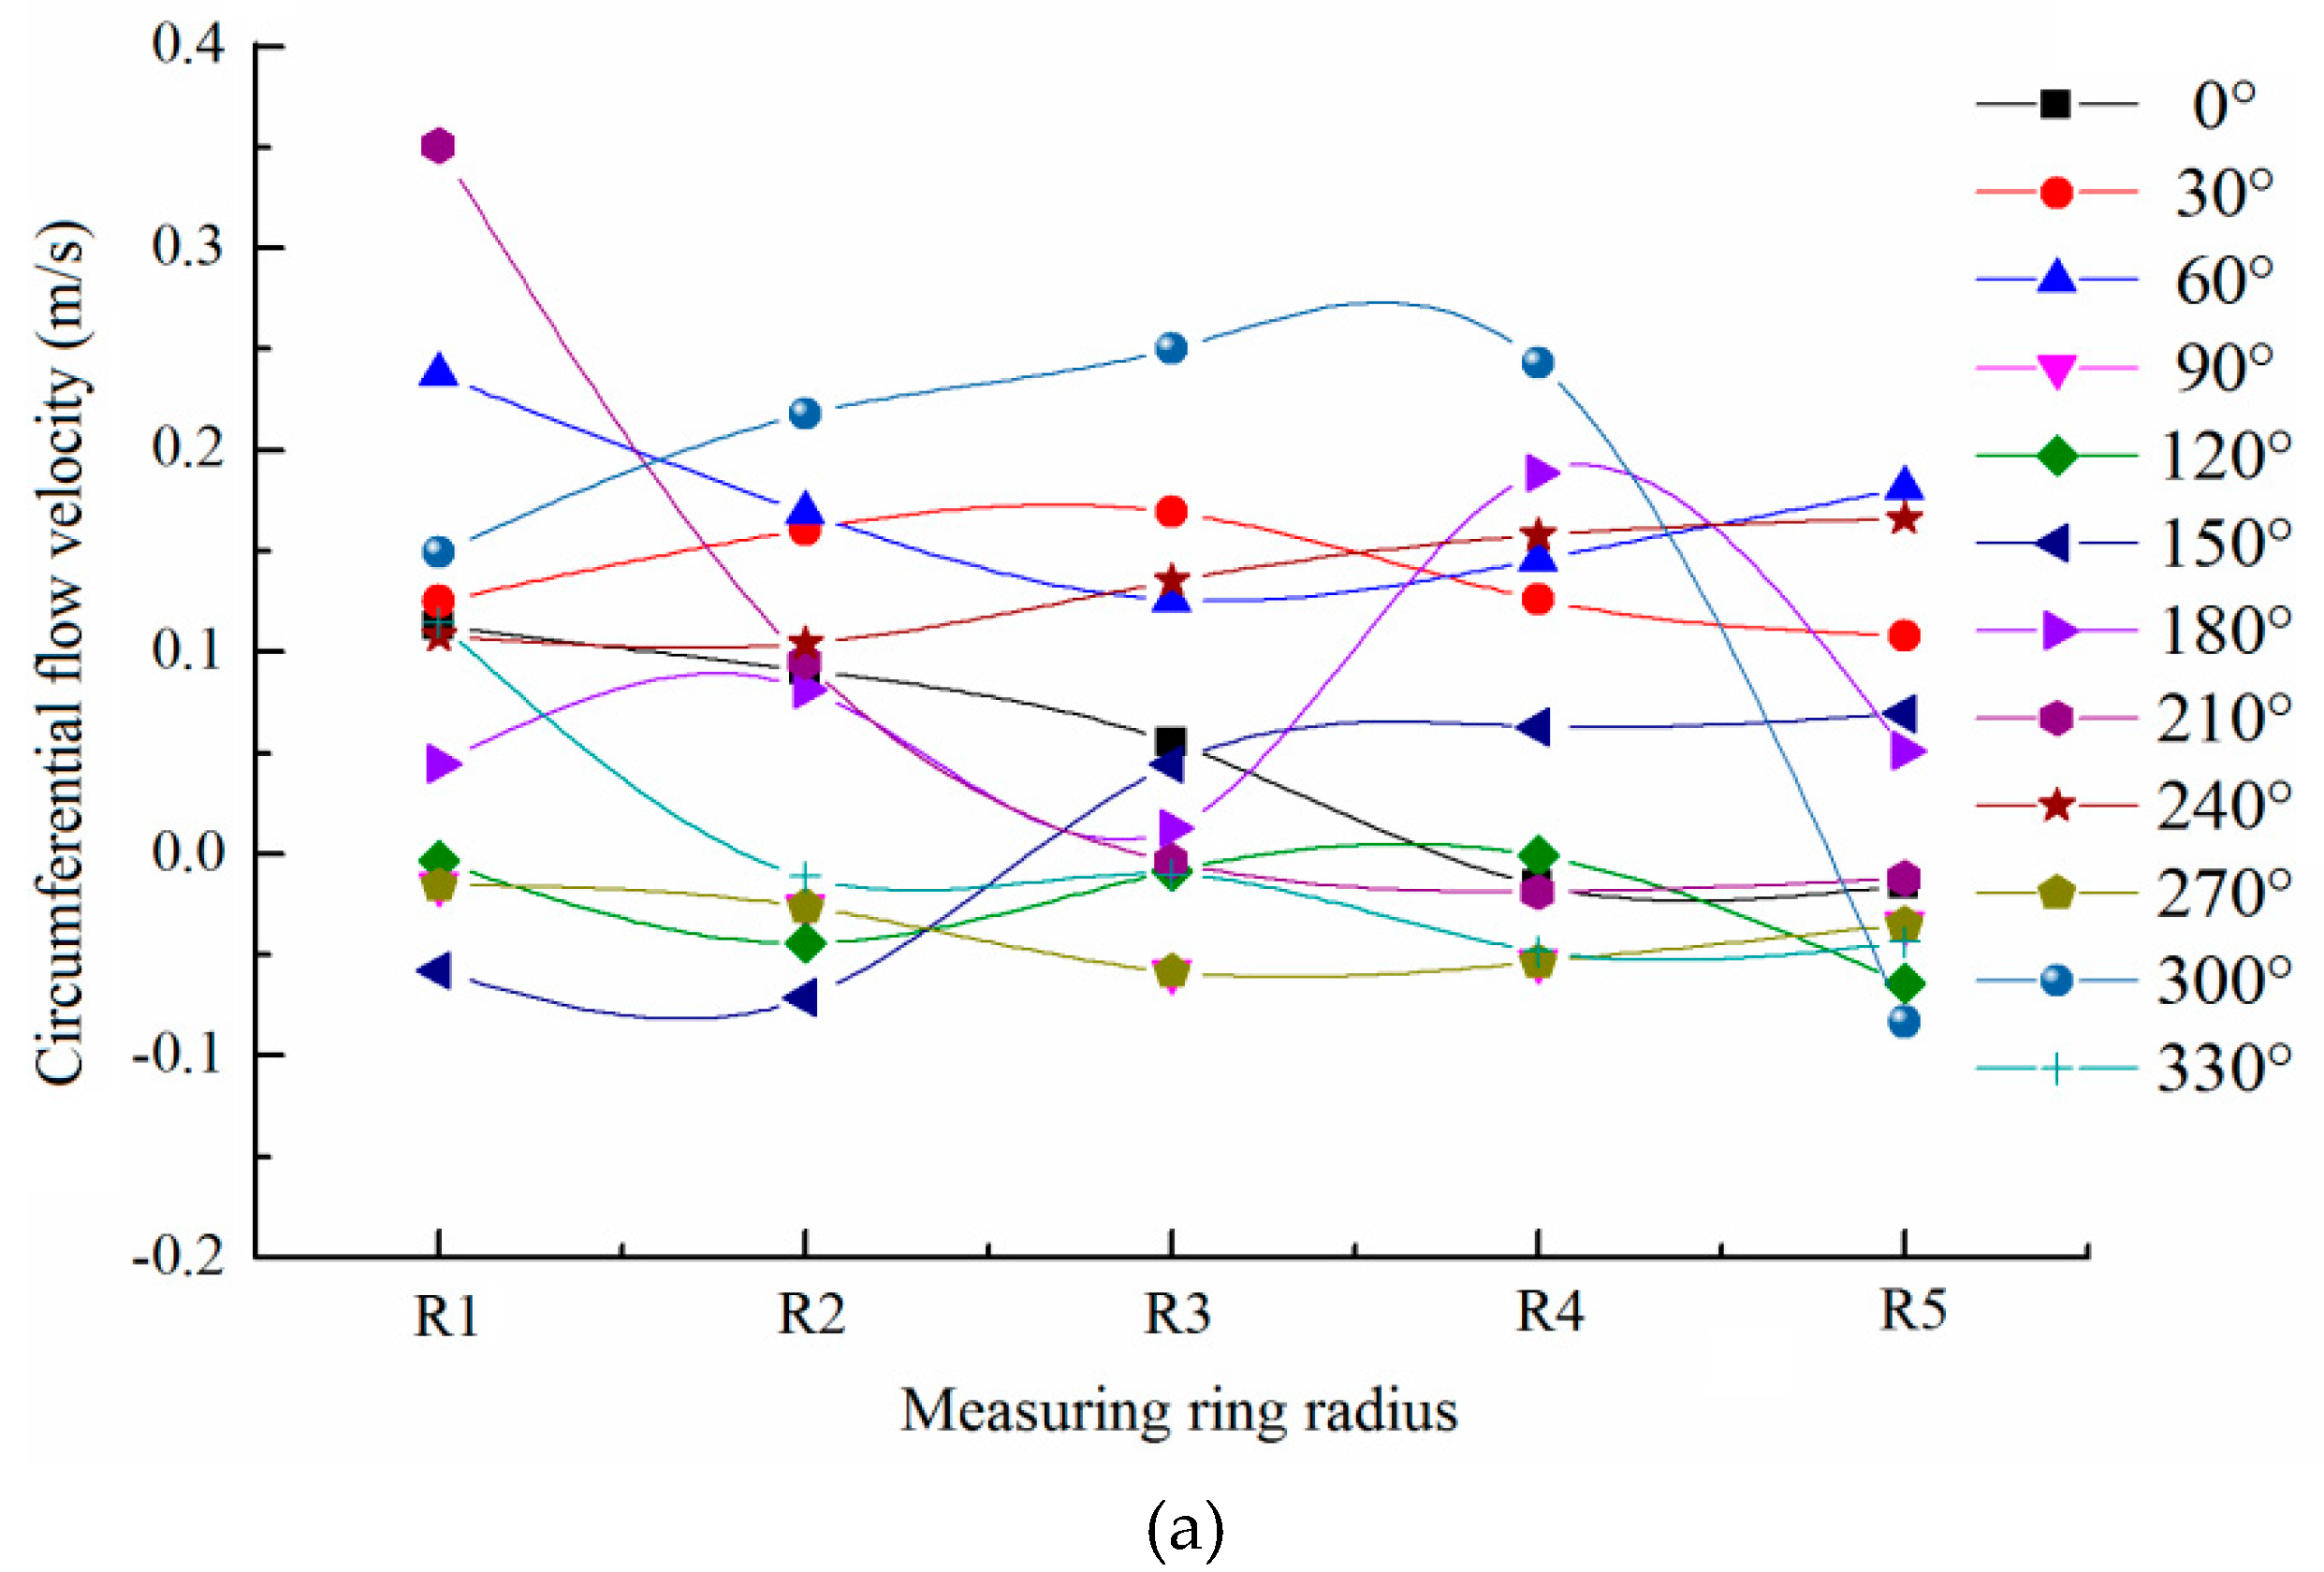
Figure 15 shows the local variation of circumferential velocity on the same polar axis.
During the movement of the capsule, the circumferential velocity on each polar axis of the annular gap section did not change much, and the distribution of circumferential velocity was relatively stable. However, the circumferential velocity in different annular gap sections was different, and the circumferential velocity in the rear section of the capsule was smaller than that in the front section. Along the movement direction of the capsule, the circumferential velocity of the annular gap section gradually increased along the length direction of the capsule, and its variation range and fluctuation amplitude also gradually increased. The main reason was that the existence of the support body of the capsule can promote the circumferential velocity of the flow, which made the circumferential velocity of the annular gap flow and its variation range increase along the path.
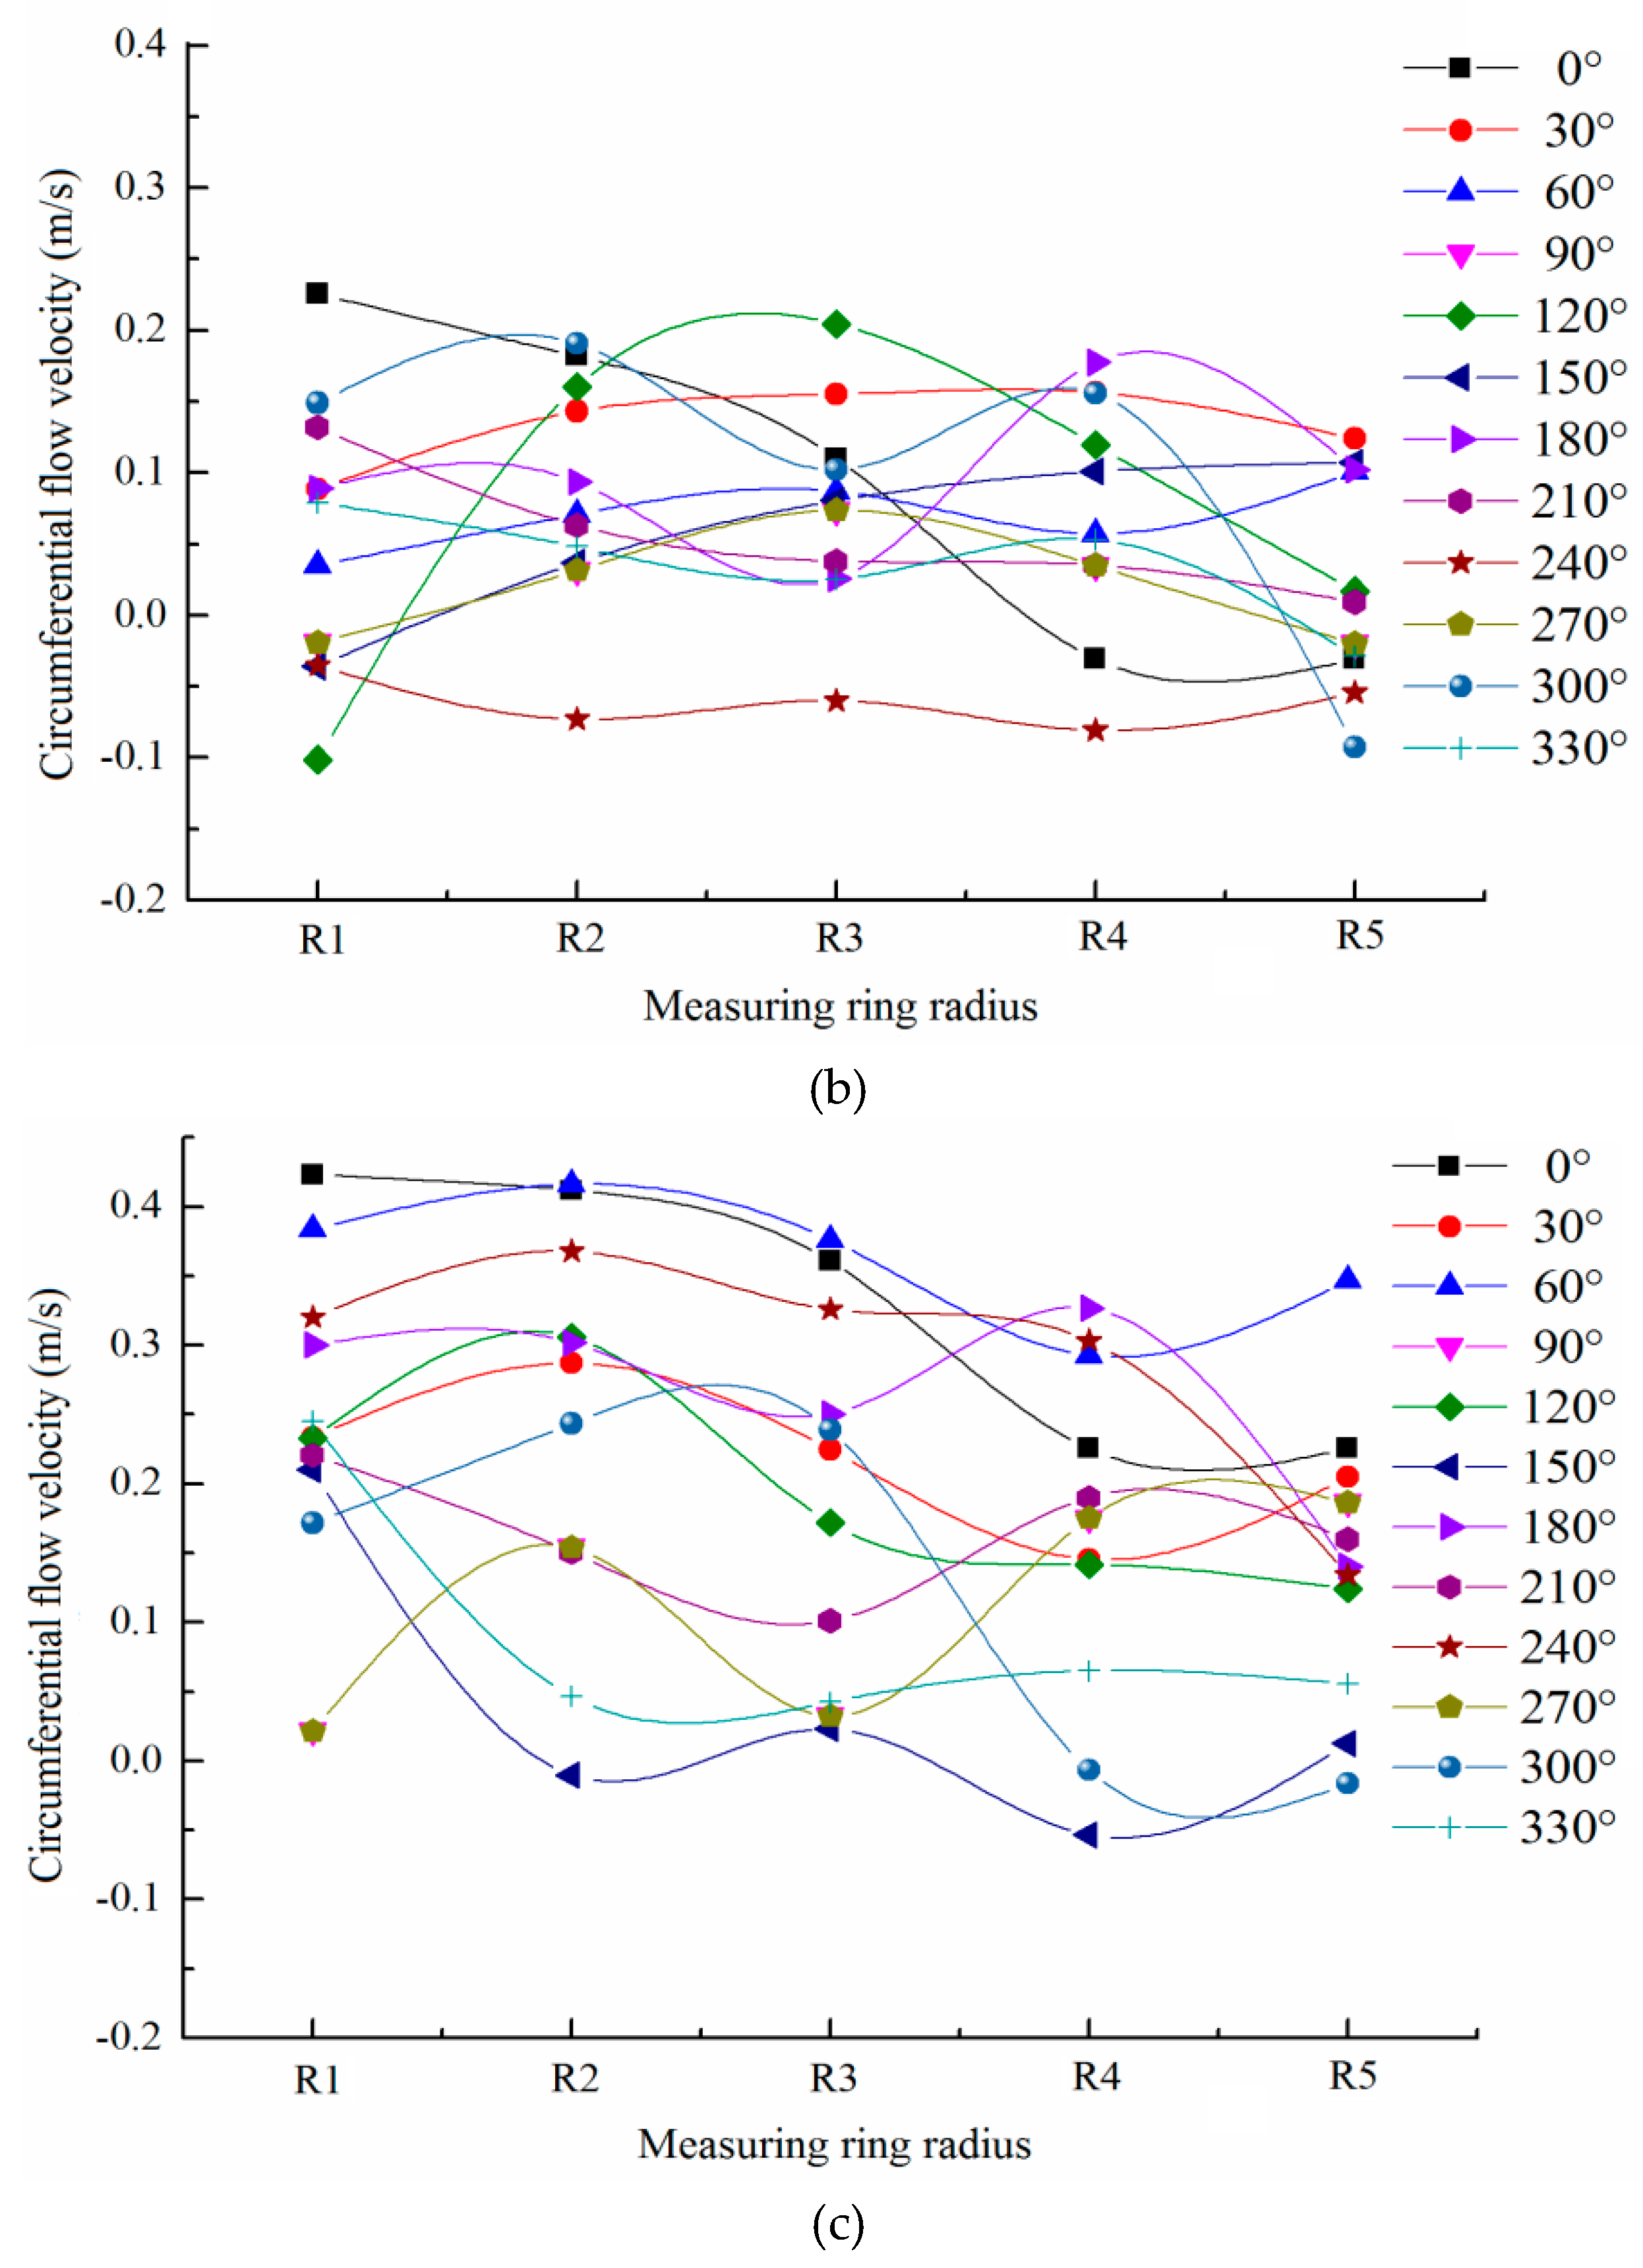
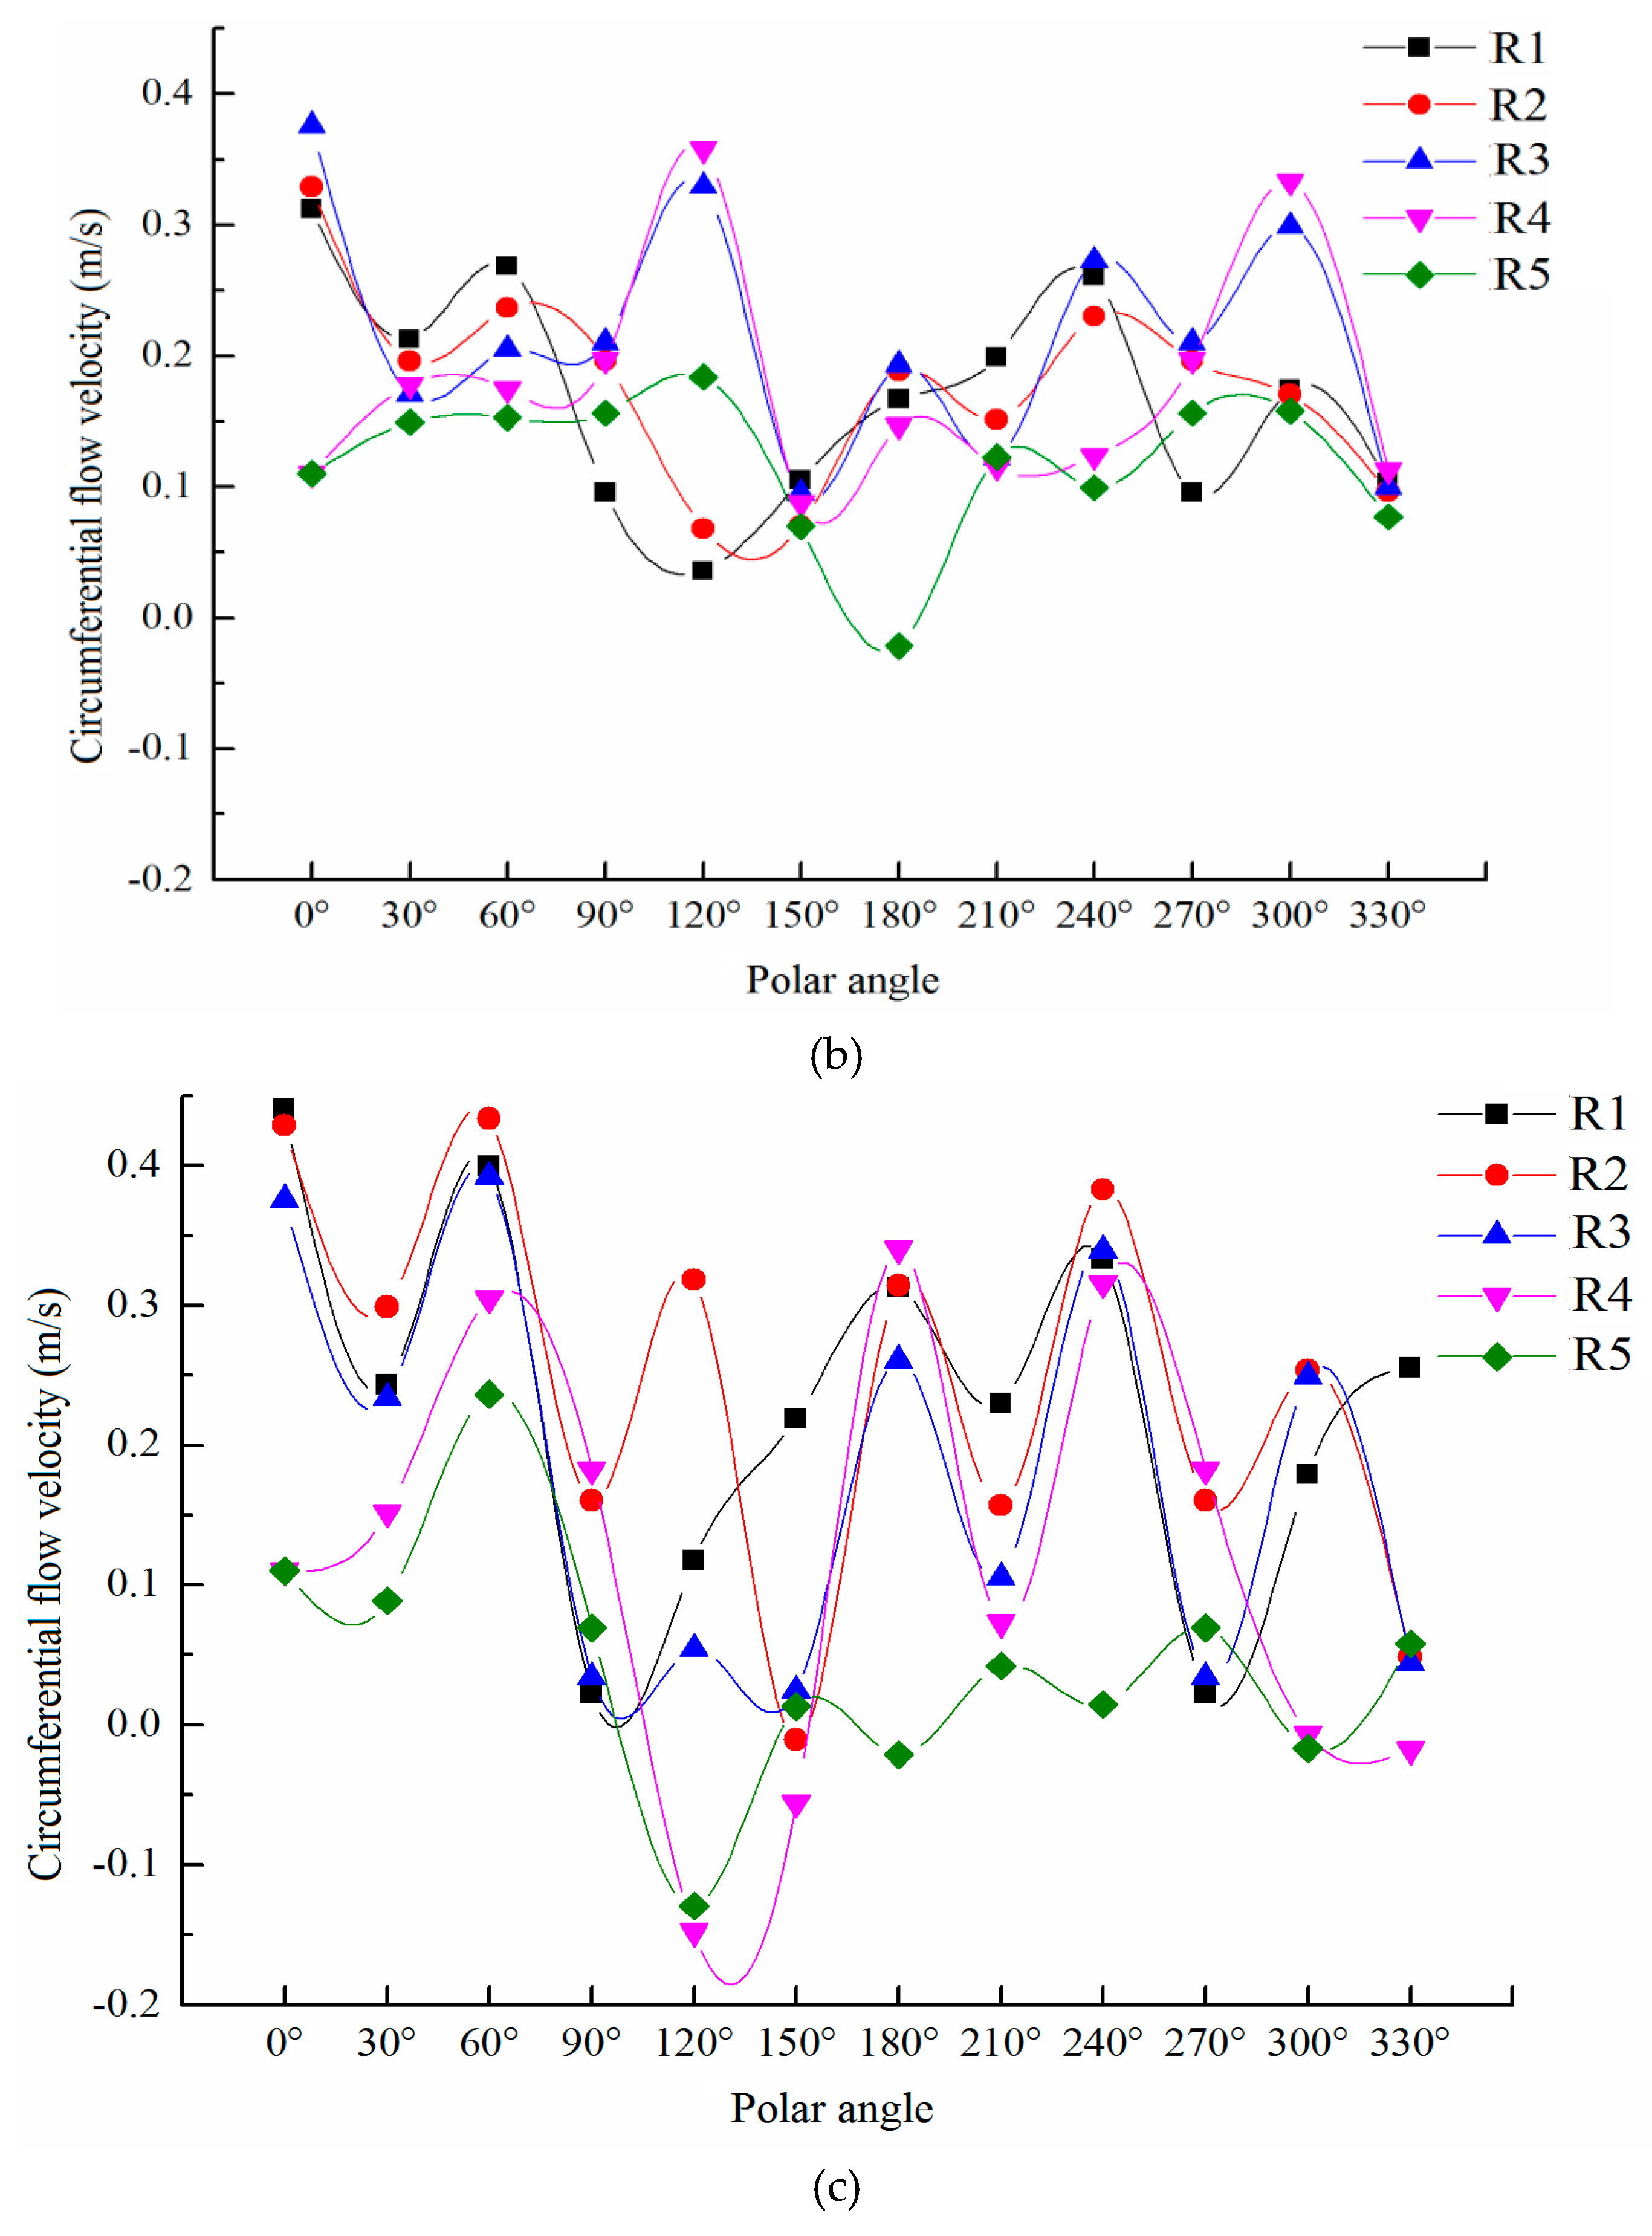
Figure 16 shows the local variation of circumferential velocity on the same measuring ring.
Compared with the circumferential velocity distribution of the annular gap flow on the same polar axis, the circumferential velocity distribution of the annular gap flow on the same measuring ring fluctuated greatly, but the fluctuation decreased gradually with the increase of the transport distance. The range width of circumferential velocity of annular gap flow along the length direction of the capsule also decreased from 0.6 to 0.4, indicating that the circumferential velocity of annular gap flow had a gradually concentrated trend along the path. Compared with the axial velocity in the same measuring ring, the alternation of the peak and trough of the circumferential velocity in the same measuring ring was not obvious.
Figure 17 shows the radial flow velocity distribution of the front, middle, and rear annular gap sections of the capsule.
Similar to the circumferential velocity of annular gap flow, the radial velocity contour line of annular gap flow changed from dense to sparse to dense along the moving direction of the capsule, indicating that the radial velocity gradient of annular gap flow decreased first and then increased, and its direction is basically away from the center of the circle. For any annular gap section, the radial velocity of annular gap flow was very small, and its variation range was (−0.16 m/s, 0.38 m/s). Among them, the radial velocity was mostly distributed in the interval (0 m/s, 0.05 m/s) and (0.1 m/s, 0.2 m/s), and the interval (0.05 m/s, 0.1 m/s) was less. The average radial velocity of annular gap flow was about 0.06 m/s, which was only 1/30 of the average axial velocity of annular gap flow and about 0.7 of the average circumferential velocity of annular gap flow.
In order to further analyze the radial velocity change of annular gap flow during the movement of the capsule, the capsule with L/d = 2.14 as an example was analyzed from the same polar axis and the same measuring ring.
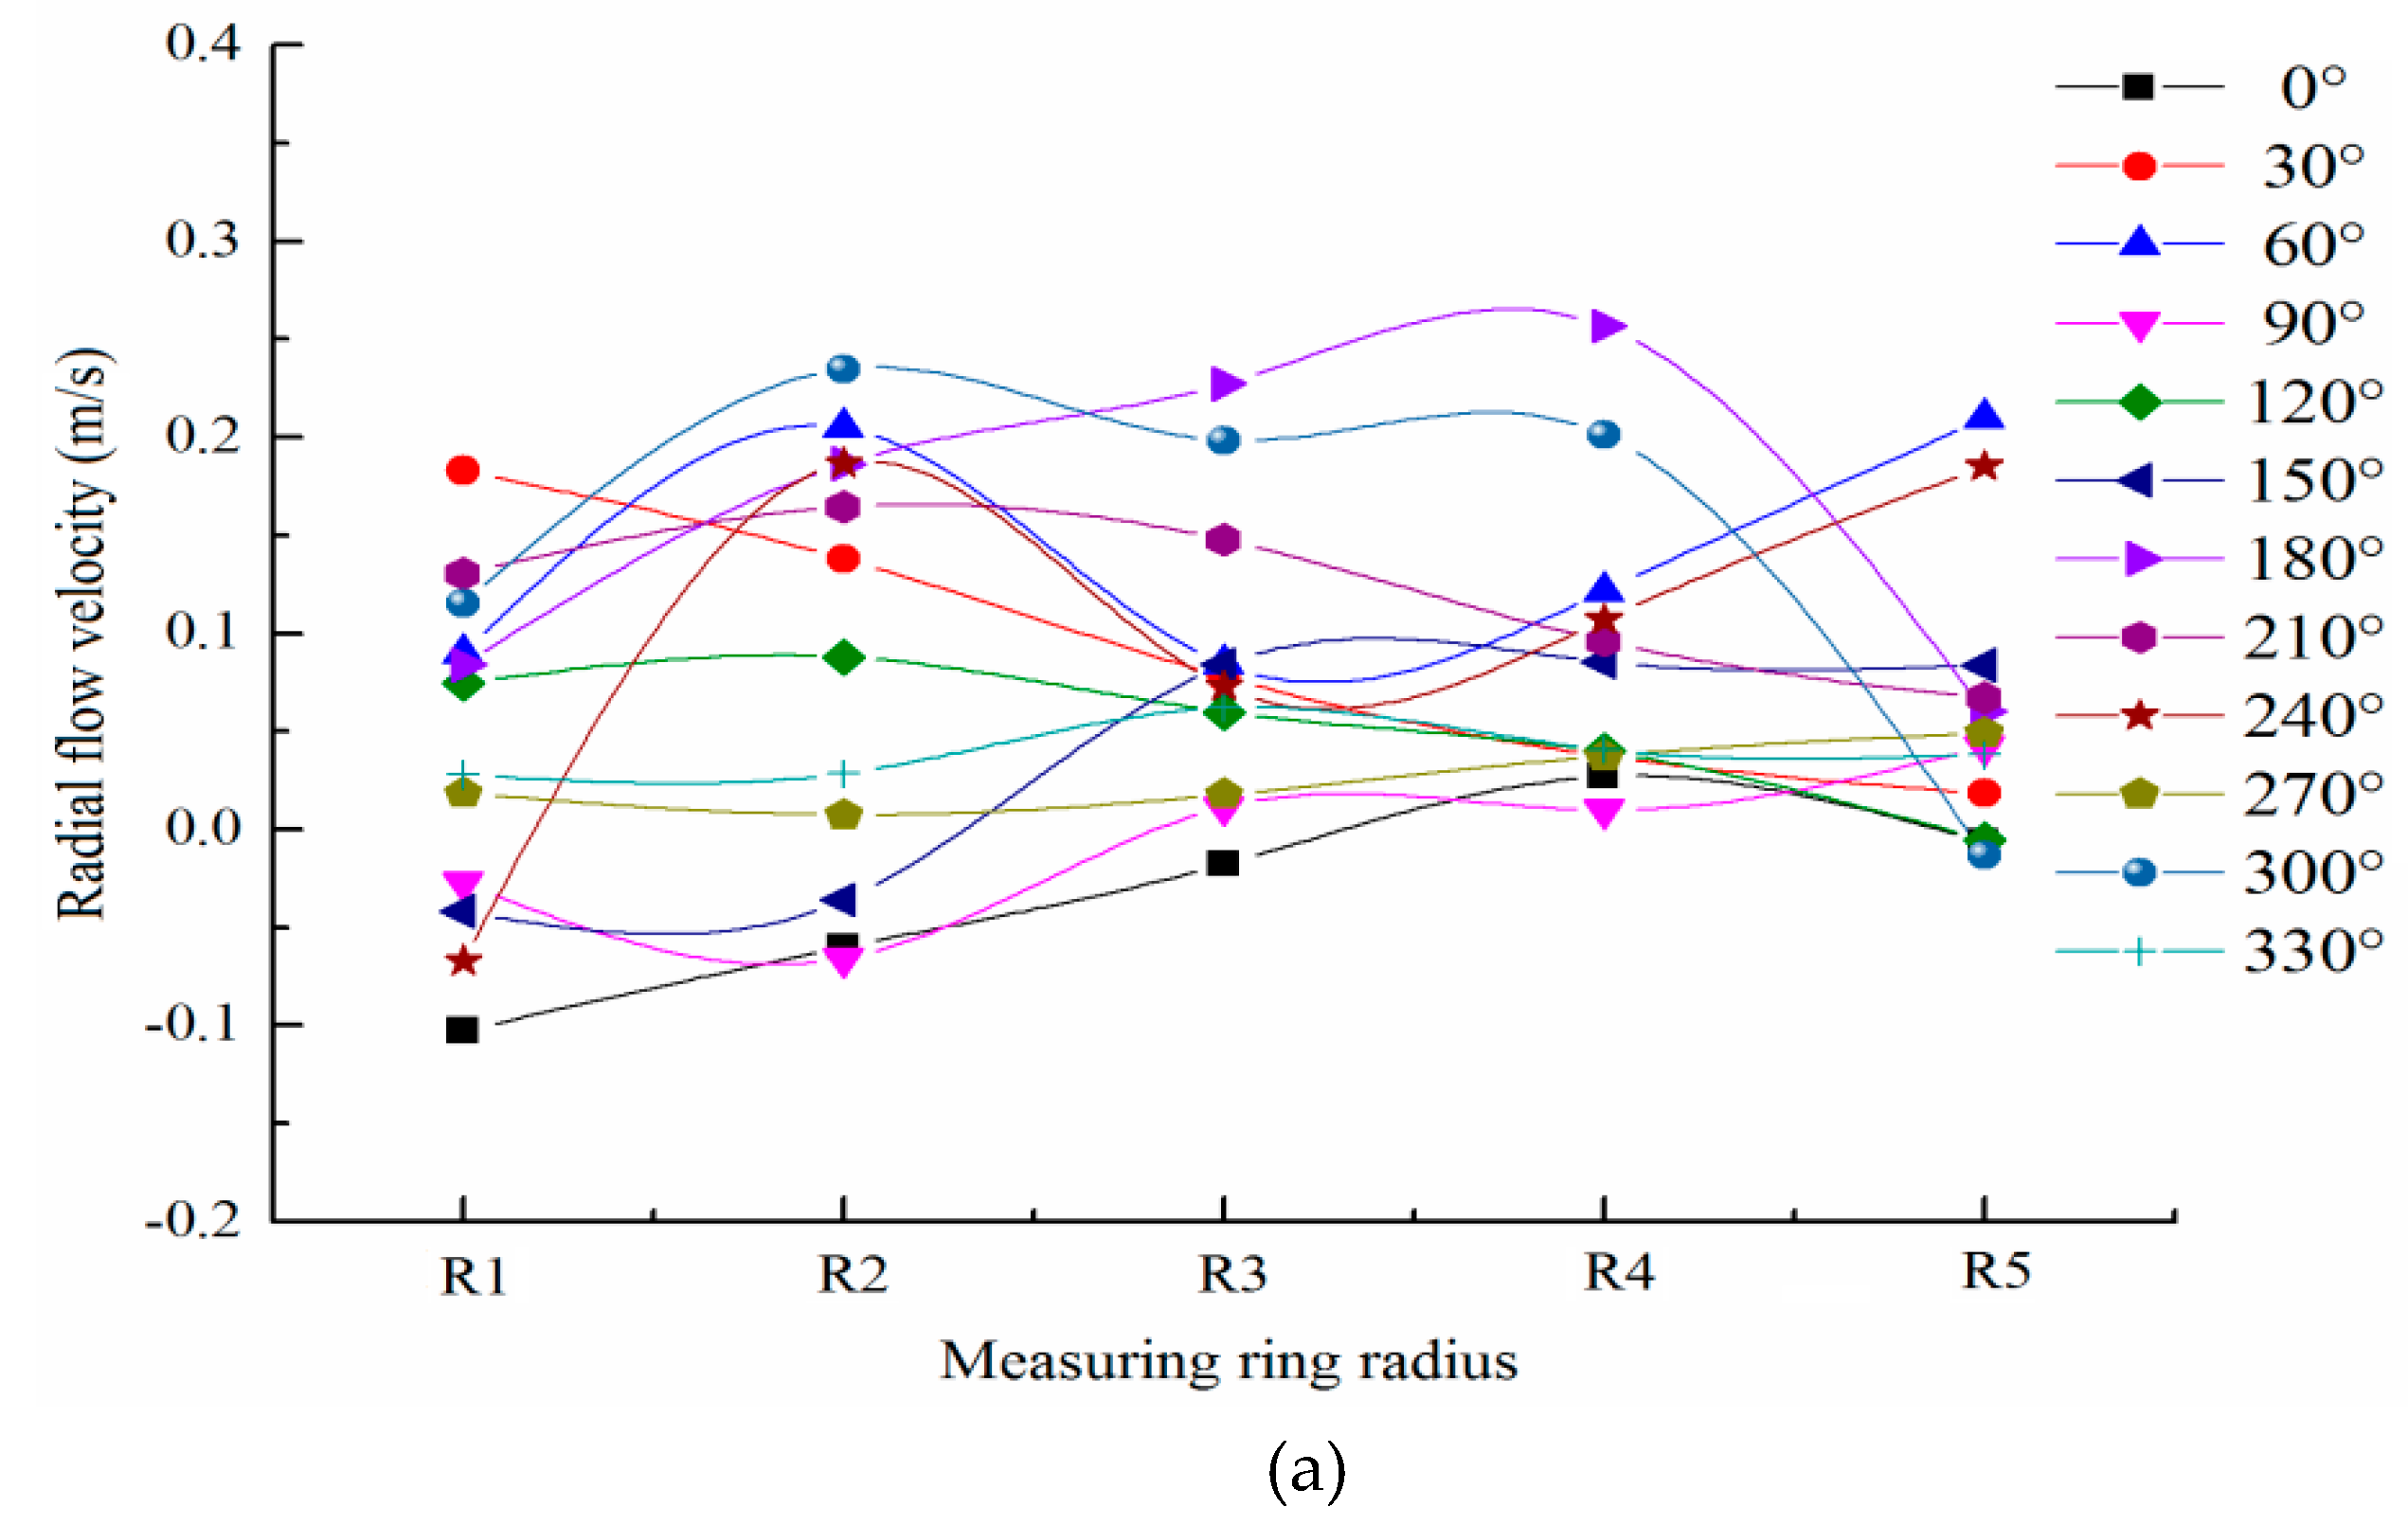
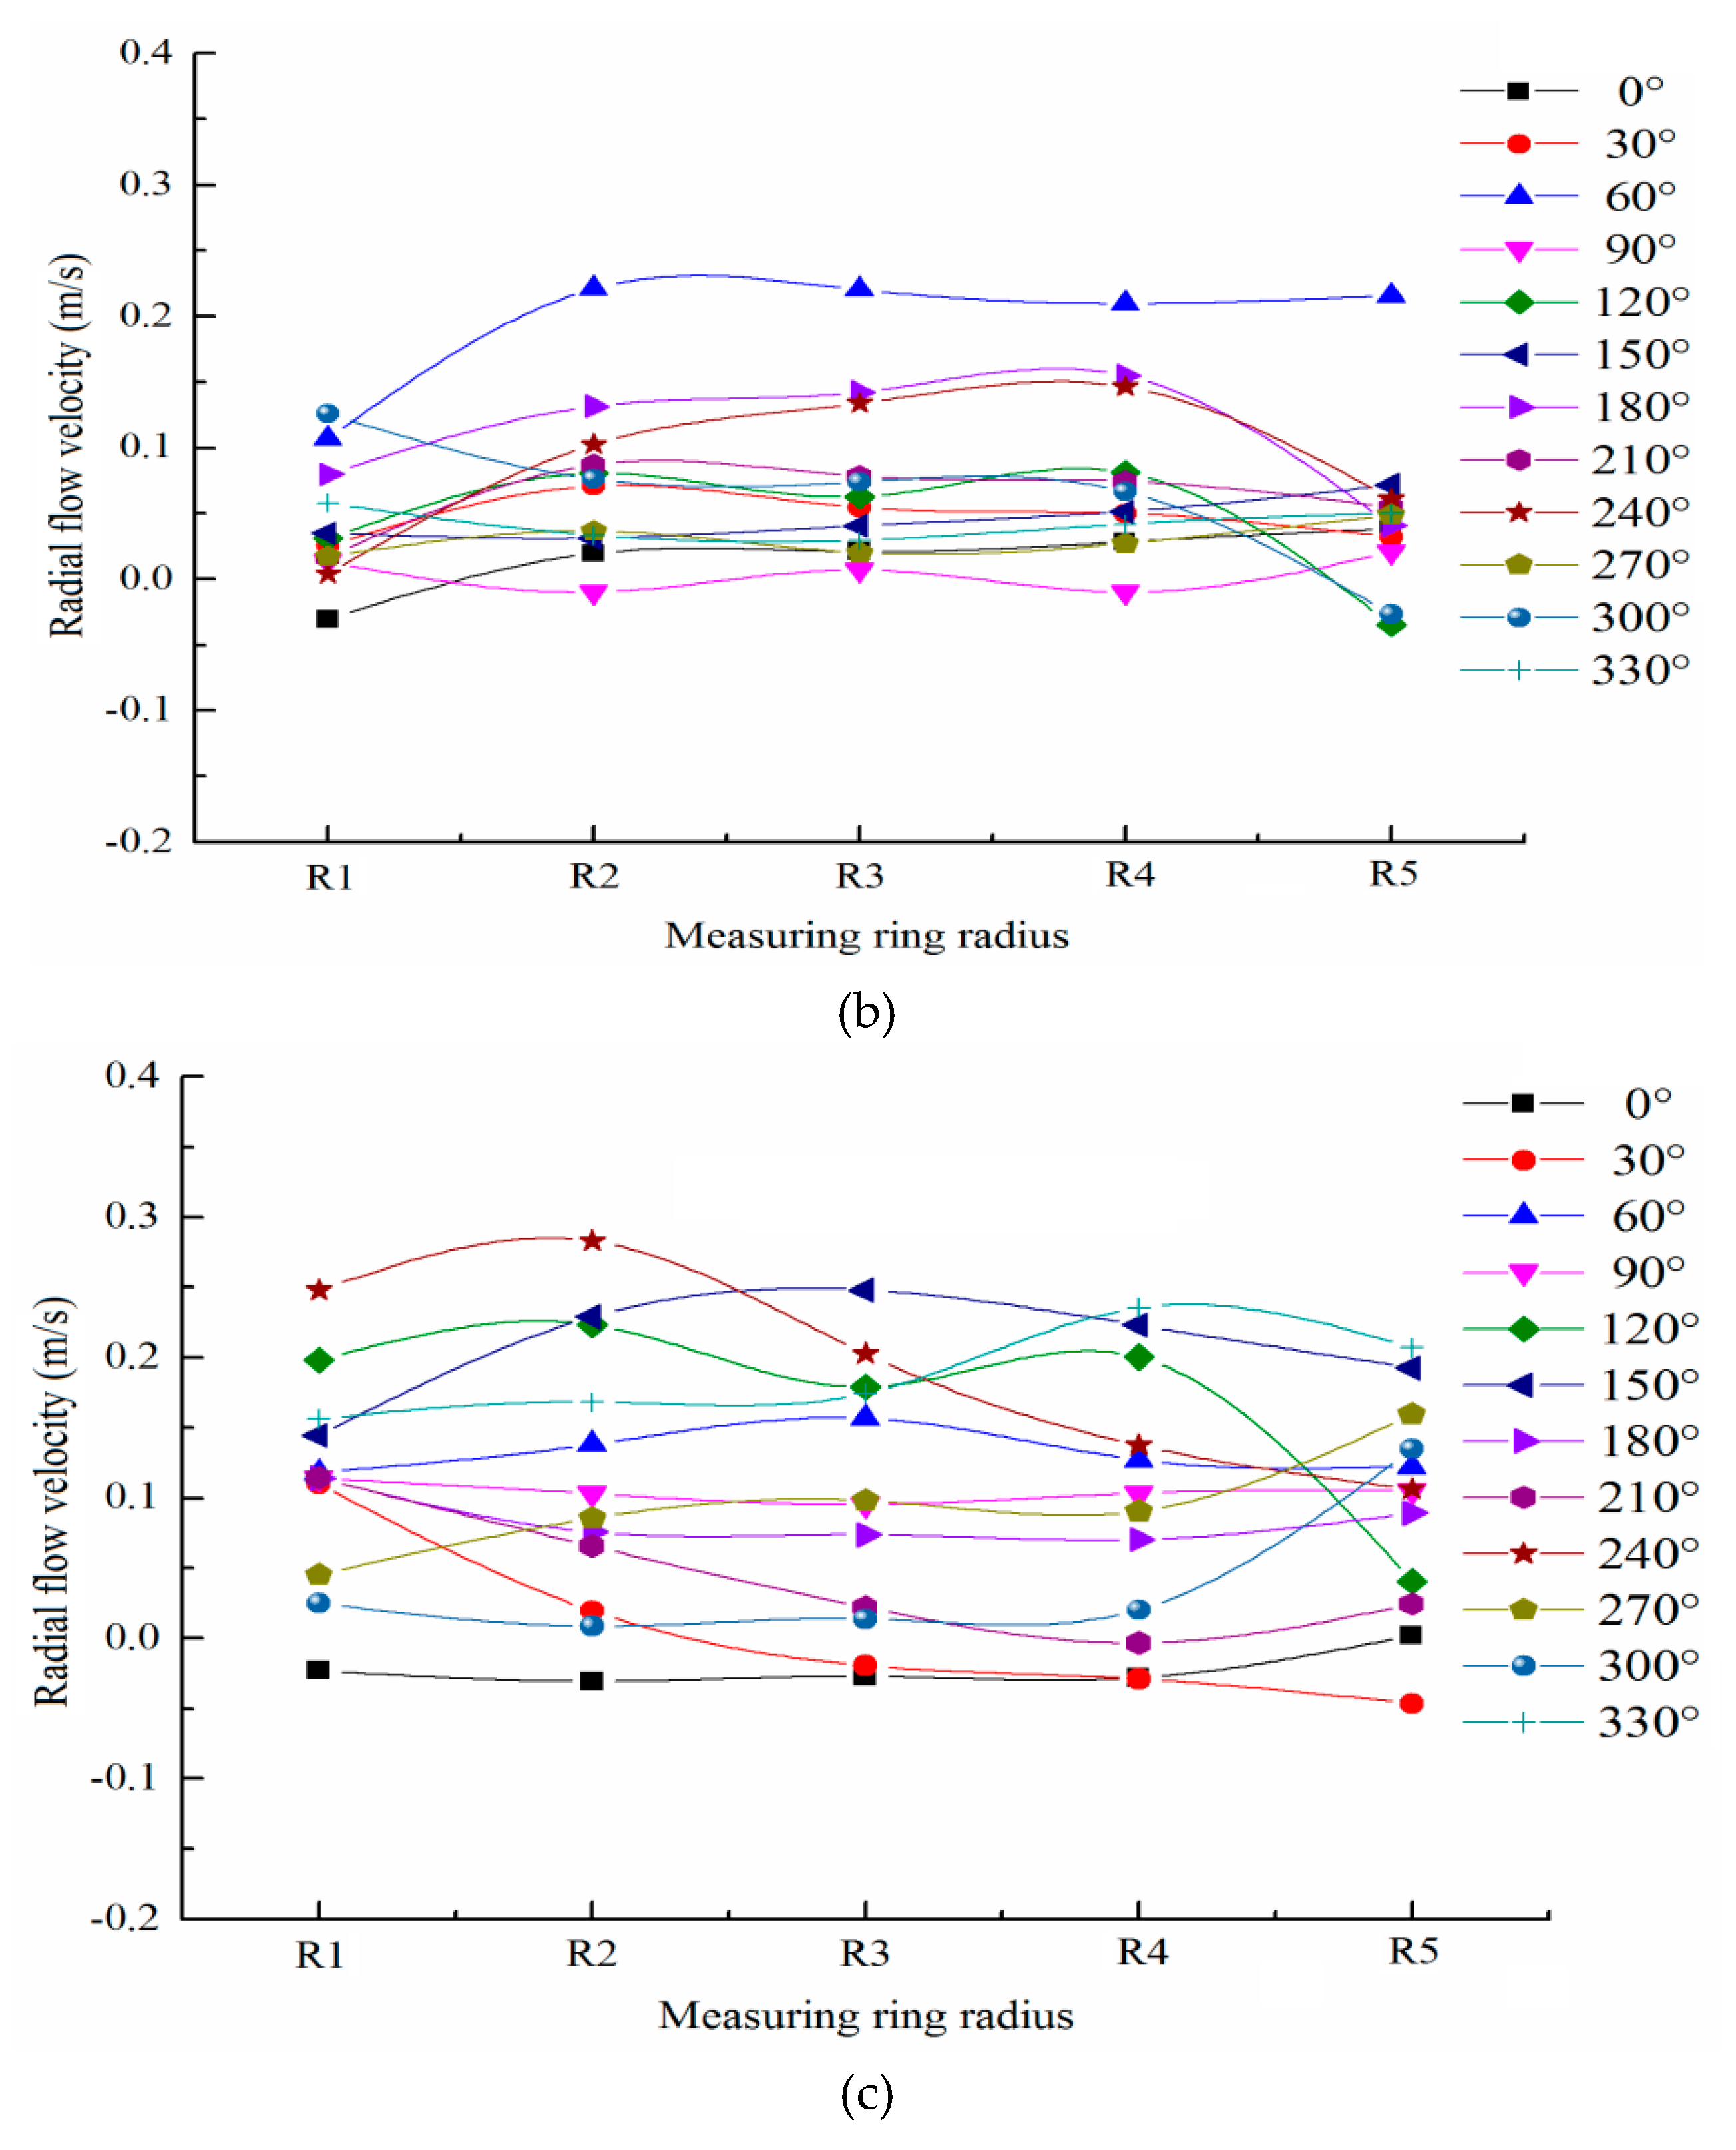
Figure 18 shows the local variation of radial velocity on the same polar axis.
Similar to the change of the circumferential velocity on the same polar axis, the radial velocity on each polar axis of the annular gap section changes little and its distribution is relatively stable during the movement of the capsule. When the water flowed around the rear section of the capsule, the radial velocity distribution of the rear section of the capsule was more disordered, and the radial velocity fluctuated greatly for the double influence of the support body and the barrel. When the water continued to flow to the middle section of the capsule, the radial velocity distribution was flatter than that of the rear section of the capsule, and the radial velocity fluctuated less. When the water continued to flow to the front section of the capsule, the radial velocity distribution in the front section of the capsule was more disordered than that in the middle section and its distribution interval was larger than that in the middle section for the influence of the support body of the capsule.
Figure 19 shows the local variation of radial velocity on the same measuring ring.
Compared with the radial velocity distribution of the annular gap flow on the same polar axis, the radial velocity distribution of the annular gap flow on the same measuring ring fluctuated greatly, and its fluctuation gradually increased along the length direction of the capsule. Similar to the axial velocity distribution on the same measuring ring, the radial velocity distribution on the same measuring ring also showed a wave-like variation trend of alternating crest and trough with the change of the polar axis.
