1. Introduction
In many applications, pipes with multiple outlets are used to distribute and collect fluids for various applications. In water supply, manifolds are used to distribute water to residential areas and also to supply farms with irrigation water. The design of a pipe with multiple outlets is more complicated than the design of simple pipe without outlets.
As given by Alawee [
1], the distribution of fluids laterally from a pipe along its centerline from outlets is widely used for the following engineering applications: distribution of water from municipal water network, modern irrigation systems, chemicals to production units of industrial processes and sewage disposal. In addition, pipes with multiple outlets are installed for fire extinguishing purposes [
2].
The above applications highlight the importance of studying head loss along a pipe with multiple outlets. Major and minor head losses occur along the length of a pipe with multiple outlets when water flow through it. In standard practice, minor losses occurring due to velocity change in each outlet are neglected while only major losses (friction losses) are considered. The uniformity of water flowing laterally from a pipe with multiple outlets is affected by friction head losses. The friction head loss (major loss) along a pipe with multiple outlets can be related to the friction head loss along a pipe without outlets provided that these pipes have similar properties (material, flow rate, diameter, and length), the ratio between the head loss along a pipe with multiple outlets to that without multiple outlets is called the G factor.
The Hazen-Williams formula is used widely in hydraulic analysis and design of water distribution systems, the water systems are composed of loops that include pipes with a number of outlets. In the hydraulic analysis and design of a pipe with multiple outlets, the quantity of flow from each outlet is taken as fix amount while the value of Hazen-Williams coefficient is taken as constant. The temperature and viscosity of the water are not taken into account in the Hazen-Williams coefficient as it is not a function of the Reynolds number, while the coefficient of friction in the Darcy-Weisbach formula does take them into account as at is a function of the Reynolds number. The Darcy-Weisbach formula takes into account the variation in discharge and coefficient of friction along a pipe with multiple outlets. The flow of water in a pipe with multiple outlets is not uniformly distributed due to head losses. In order to improve and enhance the quality of the hydraulic design of a pipe with multiple outlets, it is necessary to consider the variations in flow pattern and friction head losses along the pipe. The phenomenon of water flow in a pipe with multiple outlets has been investigated by various researchers, using either analytical or experimental method in the determination of G factor.
Howland [
3] discussed the design of a perforated pipe in order to obtain a uniform discharge and established an equation that takes into account the variation of pressure head along a pipe with multiple outlets, the variation of pressure head was calculated using Bernoulli’s equation. Ramirez-Guzman and Manges [
4] and Bezdek and Solomon [
5] studied the variation of pressure head based on Hazen-Williams equation, Bezdek and Solomon [
5] also highlighted the limitations of using Hazen-Williams formula to calculate friction head loss. Mohammed et al. [
6] recommended calculating the friction head loss using Darcy-Weisbach formula. Bezdek and Solomon [
5], Anwar [
7] and Valiantzas [
8] estimated the friction head loss along the length of a pipe with multiple outlets using various methods.
A factor has been introduced by various researchers to calculate the friction head loss along a pipe with multiple outlets. Christiansen [
9] was one of the first researchers to work on the hydraulics of a pipe with multiple outlets. Christiansen [
9] proposed the below formula for calculating the
G factor of such pipes.
where N is number of outlets along the pipe and m is the exponent of discharge in the friction head loss formula as shown below:
where hf is friction head loss, K is constant depends on the equation used in the calculation of the friction head loss (Darcy-Weisbach or Hazen-Williams) and m = 2 in Darcy-Weisbach equation and m = 1.852 in Hazen-Williams equation.
Anwar [
10] derived an expression for the adjusted factor based on Christiansen [
9] formula.
where k is the index representing the successive section of pipeline length between outlets, and r is the ratio of outflow discharge to the total outlet discharge.
Mohammed et al. [
11] proposed the following formula based on the concept used by Christiansen [
9]:
Keller and Bliesner [
12] used two dimensionless ratios to define the flow in a pipe with multiple outlets. Dow [
13] pointed out the failure of Keller and Bliesner [
12] in recognizing the variation of the Reynolds number along a pipe with multiple outlets. Albertson et al. [
14] discussed the mechanism of water flow in a pipe with multiple outlets, they proposed the following formula to relate between head losses in a pipe with outlets
(hf)m and that without outlets
(hf)p:
Oron and Walker [
15], Scaloppi [
16], Valiantzas [
8], Mostafa [
17], Alazba [
18] and Alazba et al. [
19] respectively proposed the following
G factor formulae:
The above proposed formulae revealed that the G factor is either a function of the number of outlets in a pipe, N or both the number of outlets and the exponent, m of the discharge in the head loss equation (Equation (2)).
Yildirim [
20] used a series of steps to calculate the friction head loss at each pipe segment and then added them to determine the total friction head loss. Sadeghi and Peters [
21] discouraged the use of constant coefficient of friction along a lateral pipe in deriving the
G factor, where r is the ratio of outflow discharge to the total outlet discharge.
Keller [
22] used two dimensionless ratios to define the flow in a pipe with multiple outlets. Dow [
13] highlighted the failure of Keller [
22] in recognizing the variation of Reynolds number along a pipe with multiple outlets. In a pipe with multiple outlets, the distribution of flow is affected by the area ratio, header diameter, lateral diameter, number of laterals, angle of water departure from lateral pipes and space between each two consecutive laterals (Hassan et al., [
23,
24,
25]). Mokhtari et al. [
26] concluded that the flow distribution in a pipe with multiple outlets is closely related to the Reynolds number and discharge. Hassan et al. [
27] studied the distribution of fluid flow from manifolds using experimental and numerical methods while Alawee et al. [
28] conducted experimental work to optimize the header design to provide significant relief from maldistribution.
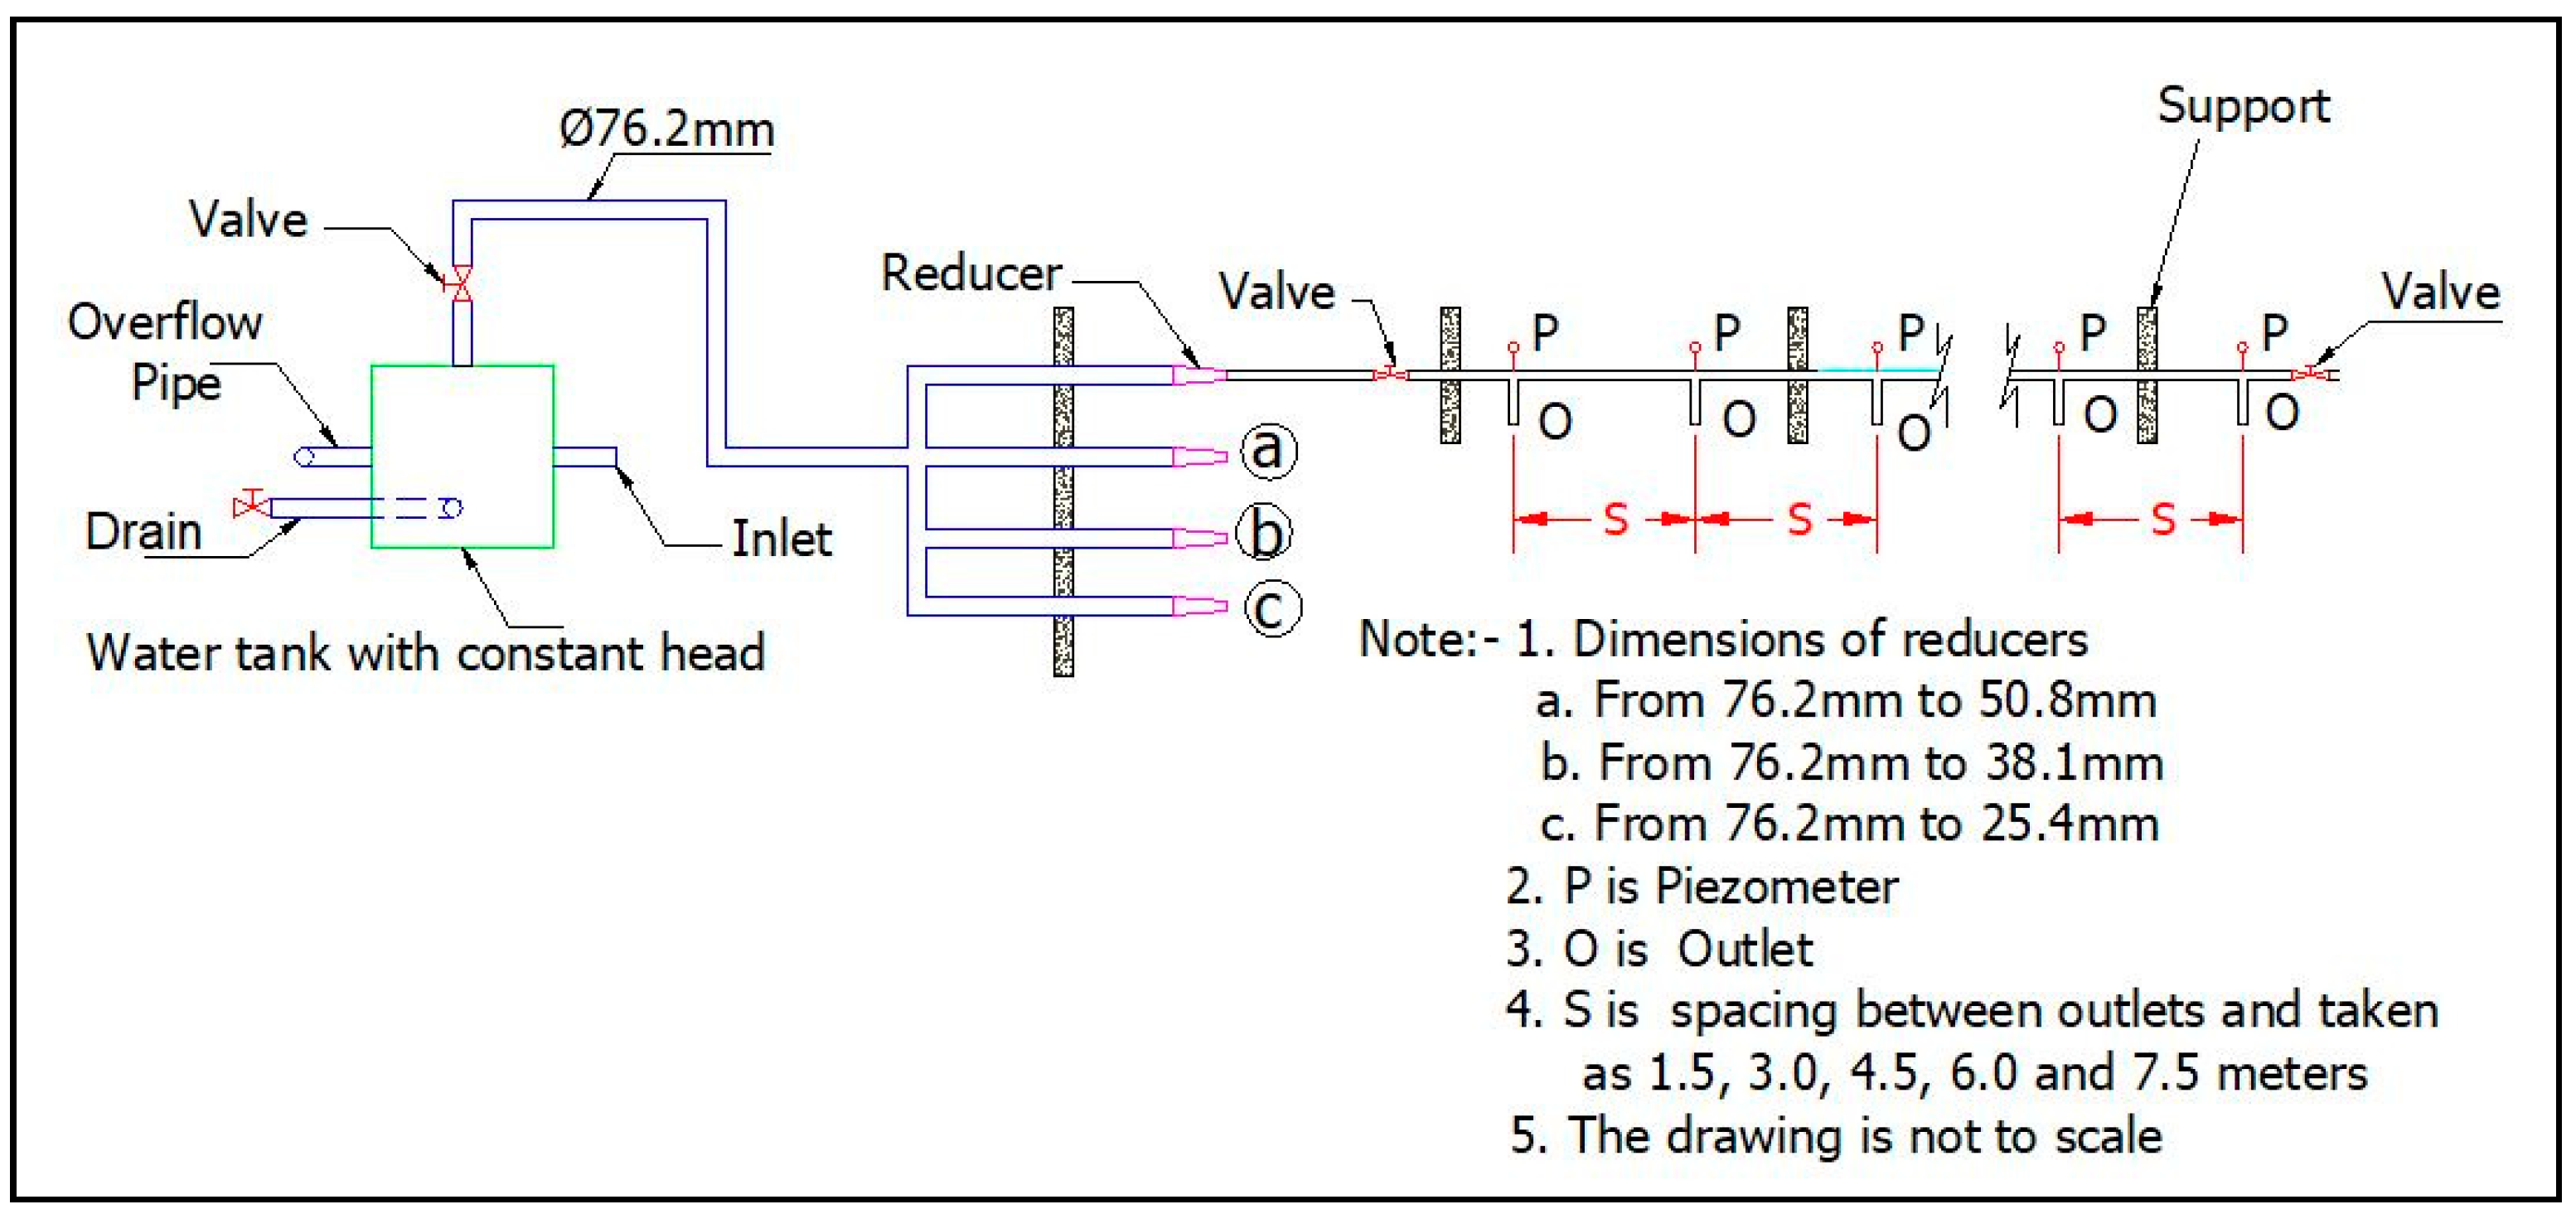
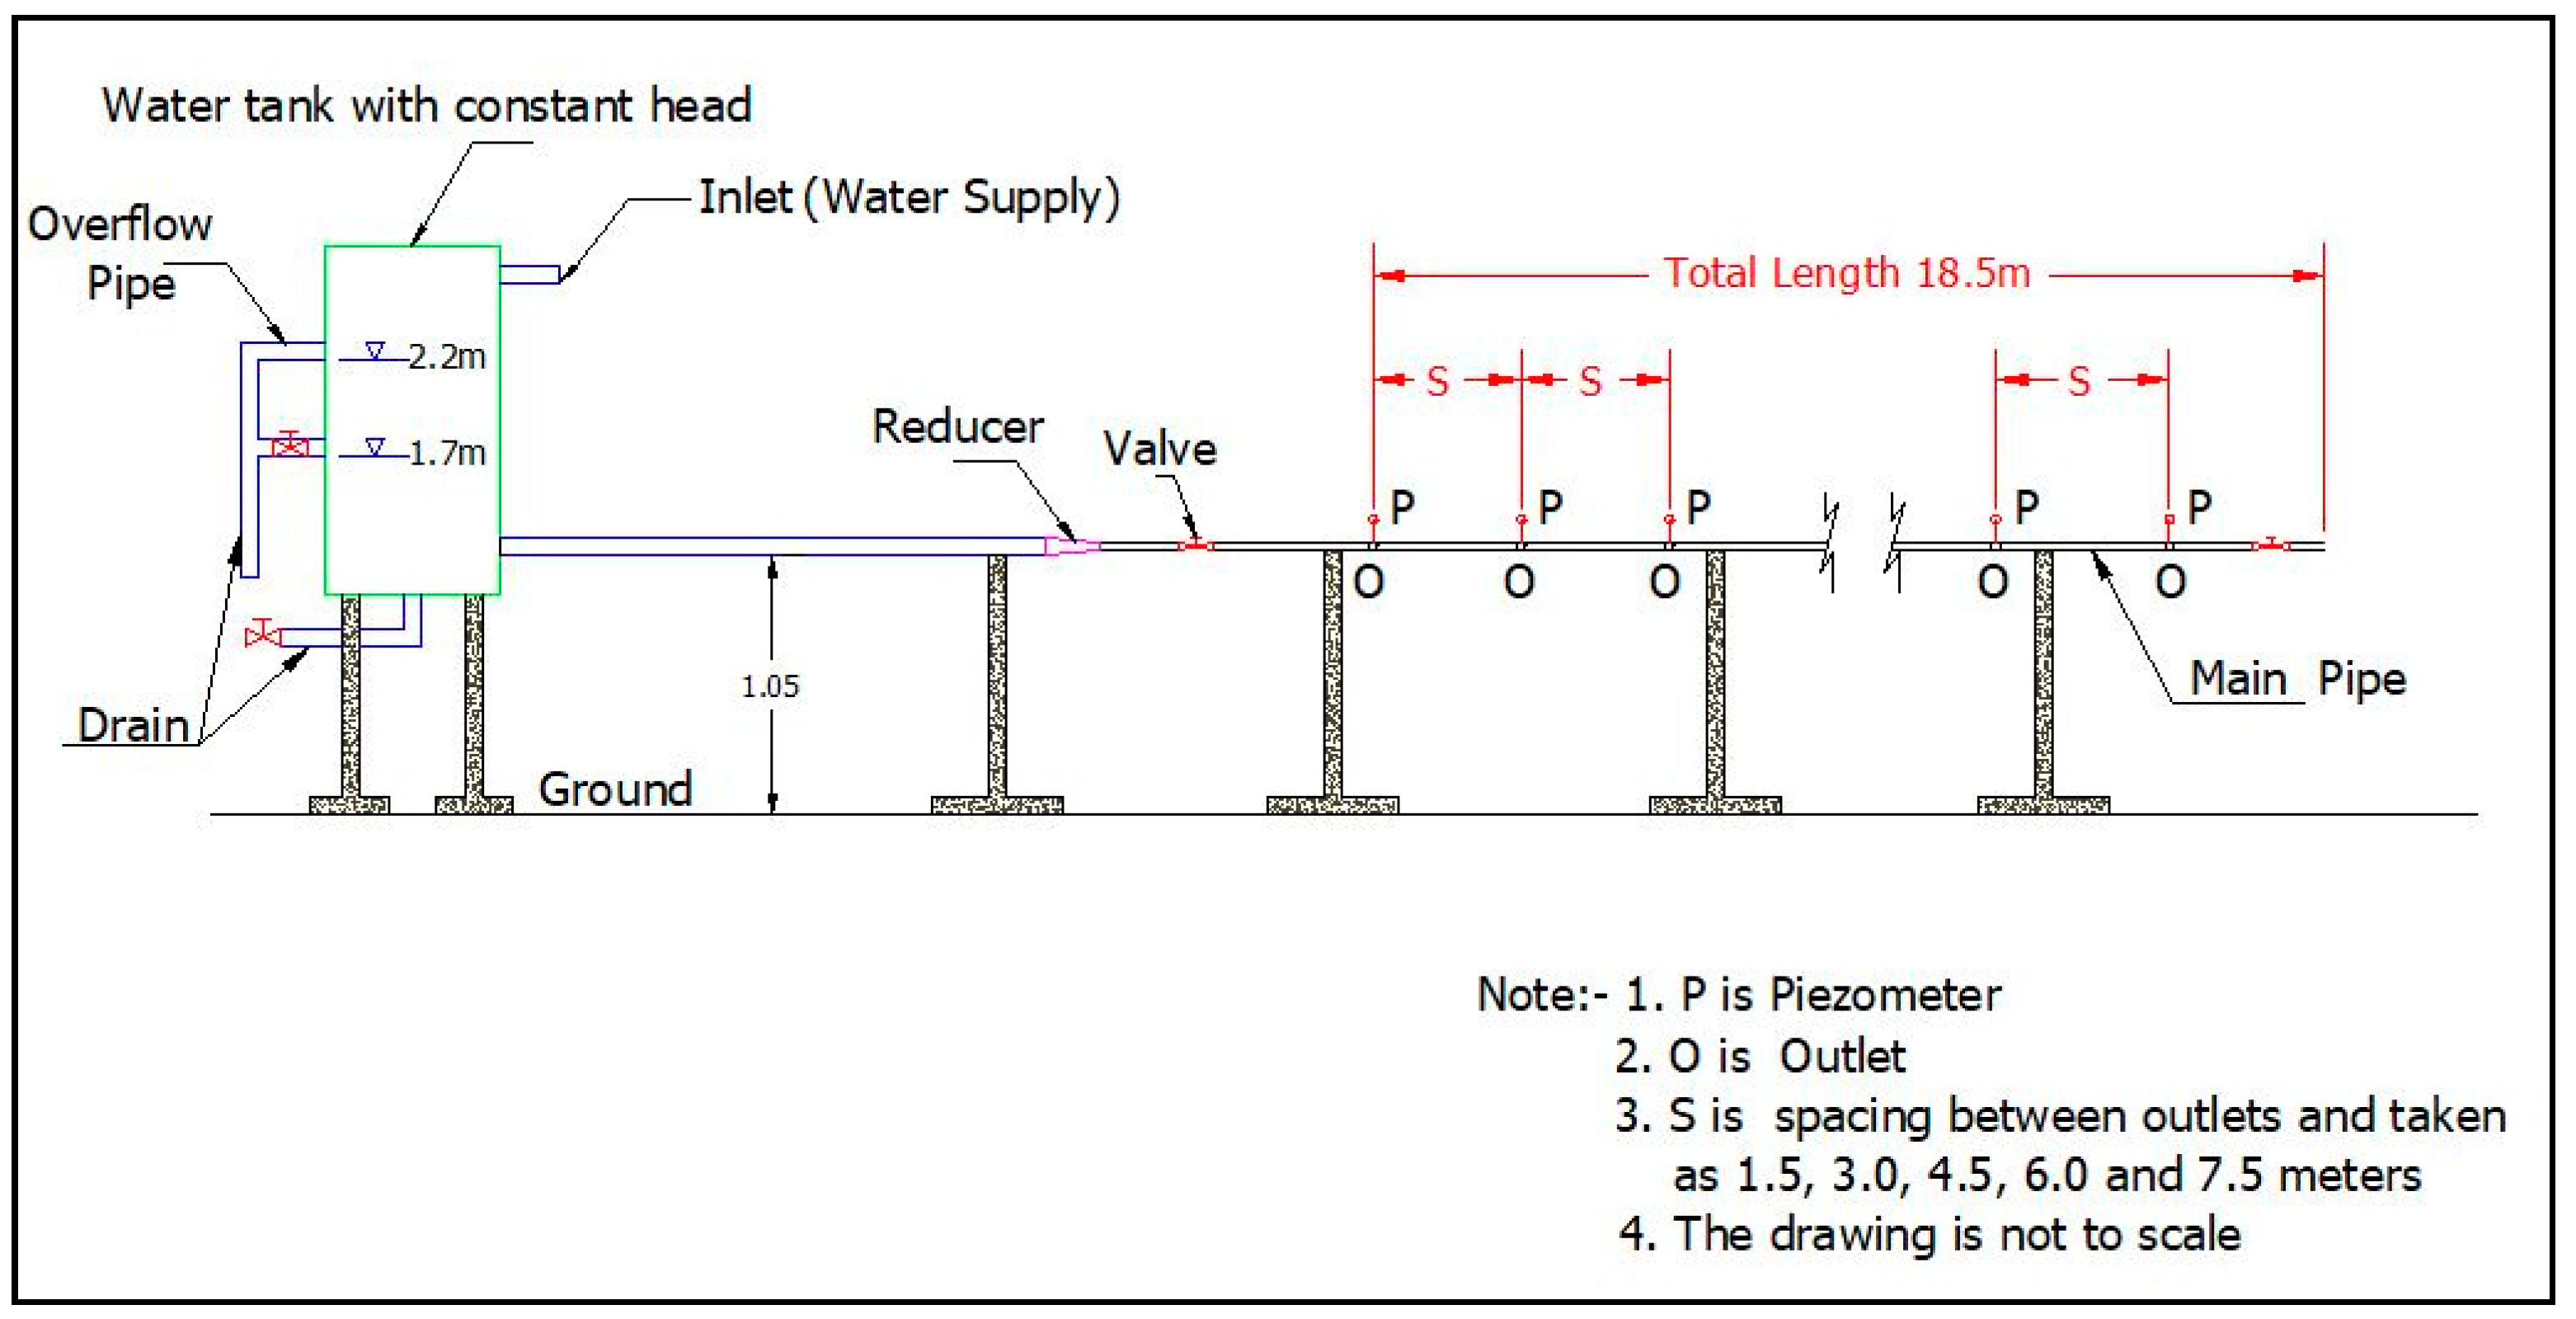
In this study, a physical model representing a pipe with multiple outlets was designed, fabricated and installed in order to assess the head losses along its length. The pipe diameter, spacing between outlets and inlet head were varied during the experiments in order to study the friction head losses. The main objective of this study is to propose a more accurate method for estimation of friction head losses along a pipe with multiple outlets. In addition, the data obtained from experiments carried out during this study were used to validate selected formulae for estimation of friction head loss in a pipe with multiple outlets using the G factor.
3. Results and Discussion
The objective of this study was to investigate the variation of friction head losses and coefficient of friction along a pipe with multiple outlets using a physical model. The impact of varying the pipe diameter (25.4, 38.1, 50.8 and 76.2 mm) and outlet spacing (1.5, 3.0, 4.5, 6.0 and 7.5 m) on the friction head loss were also studied.
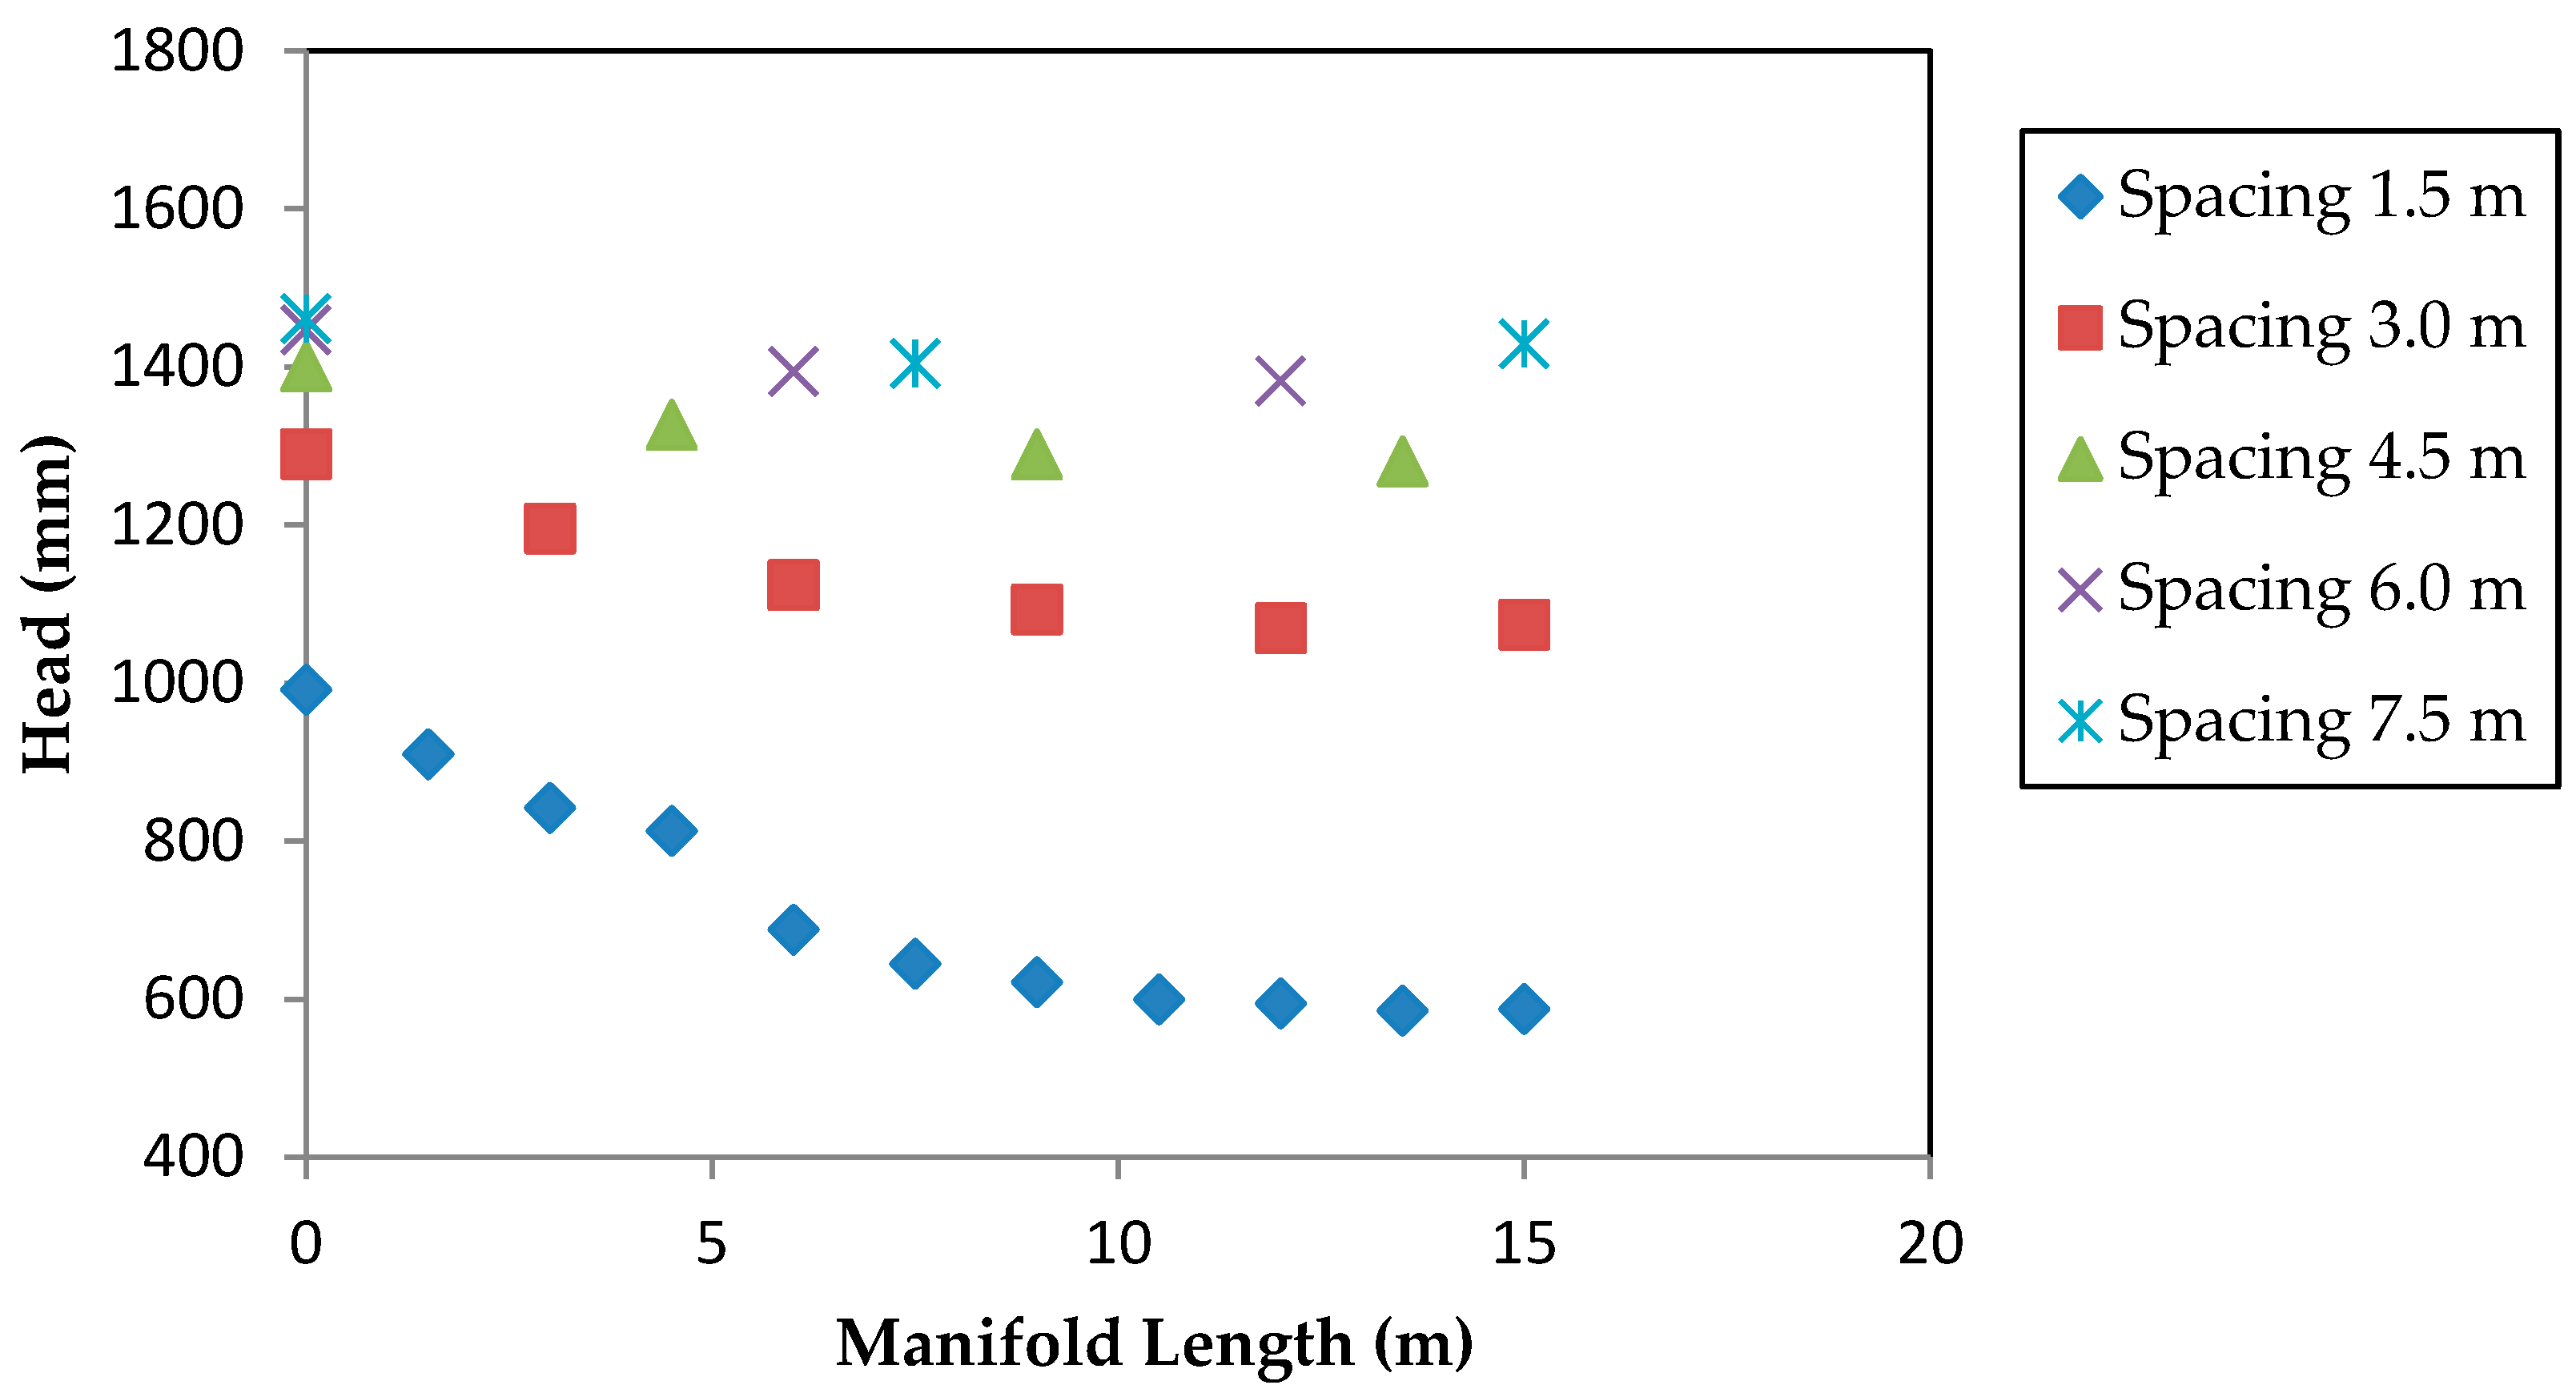
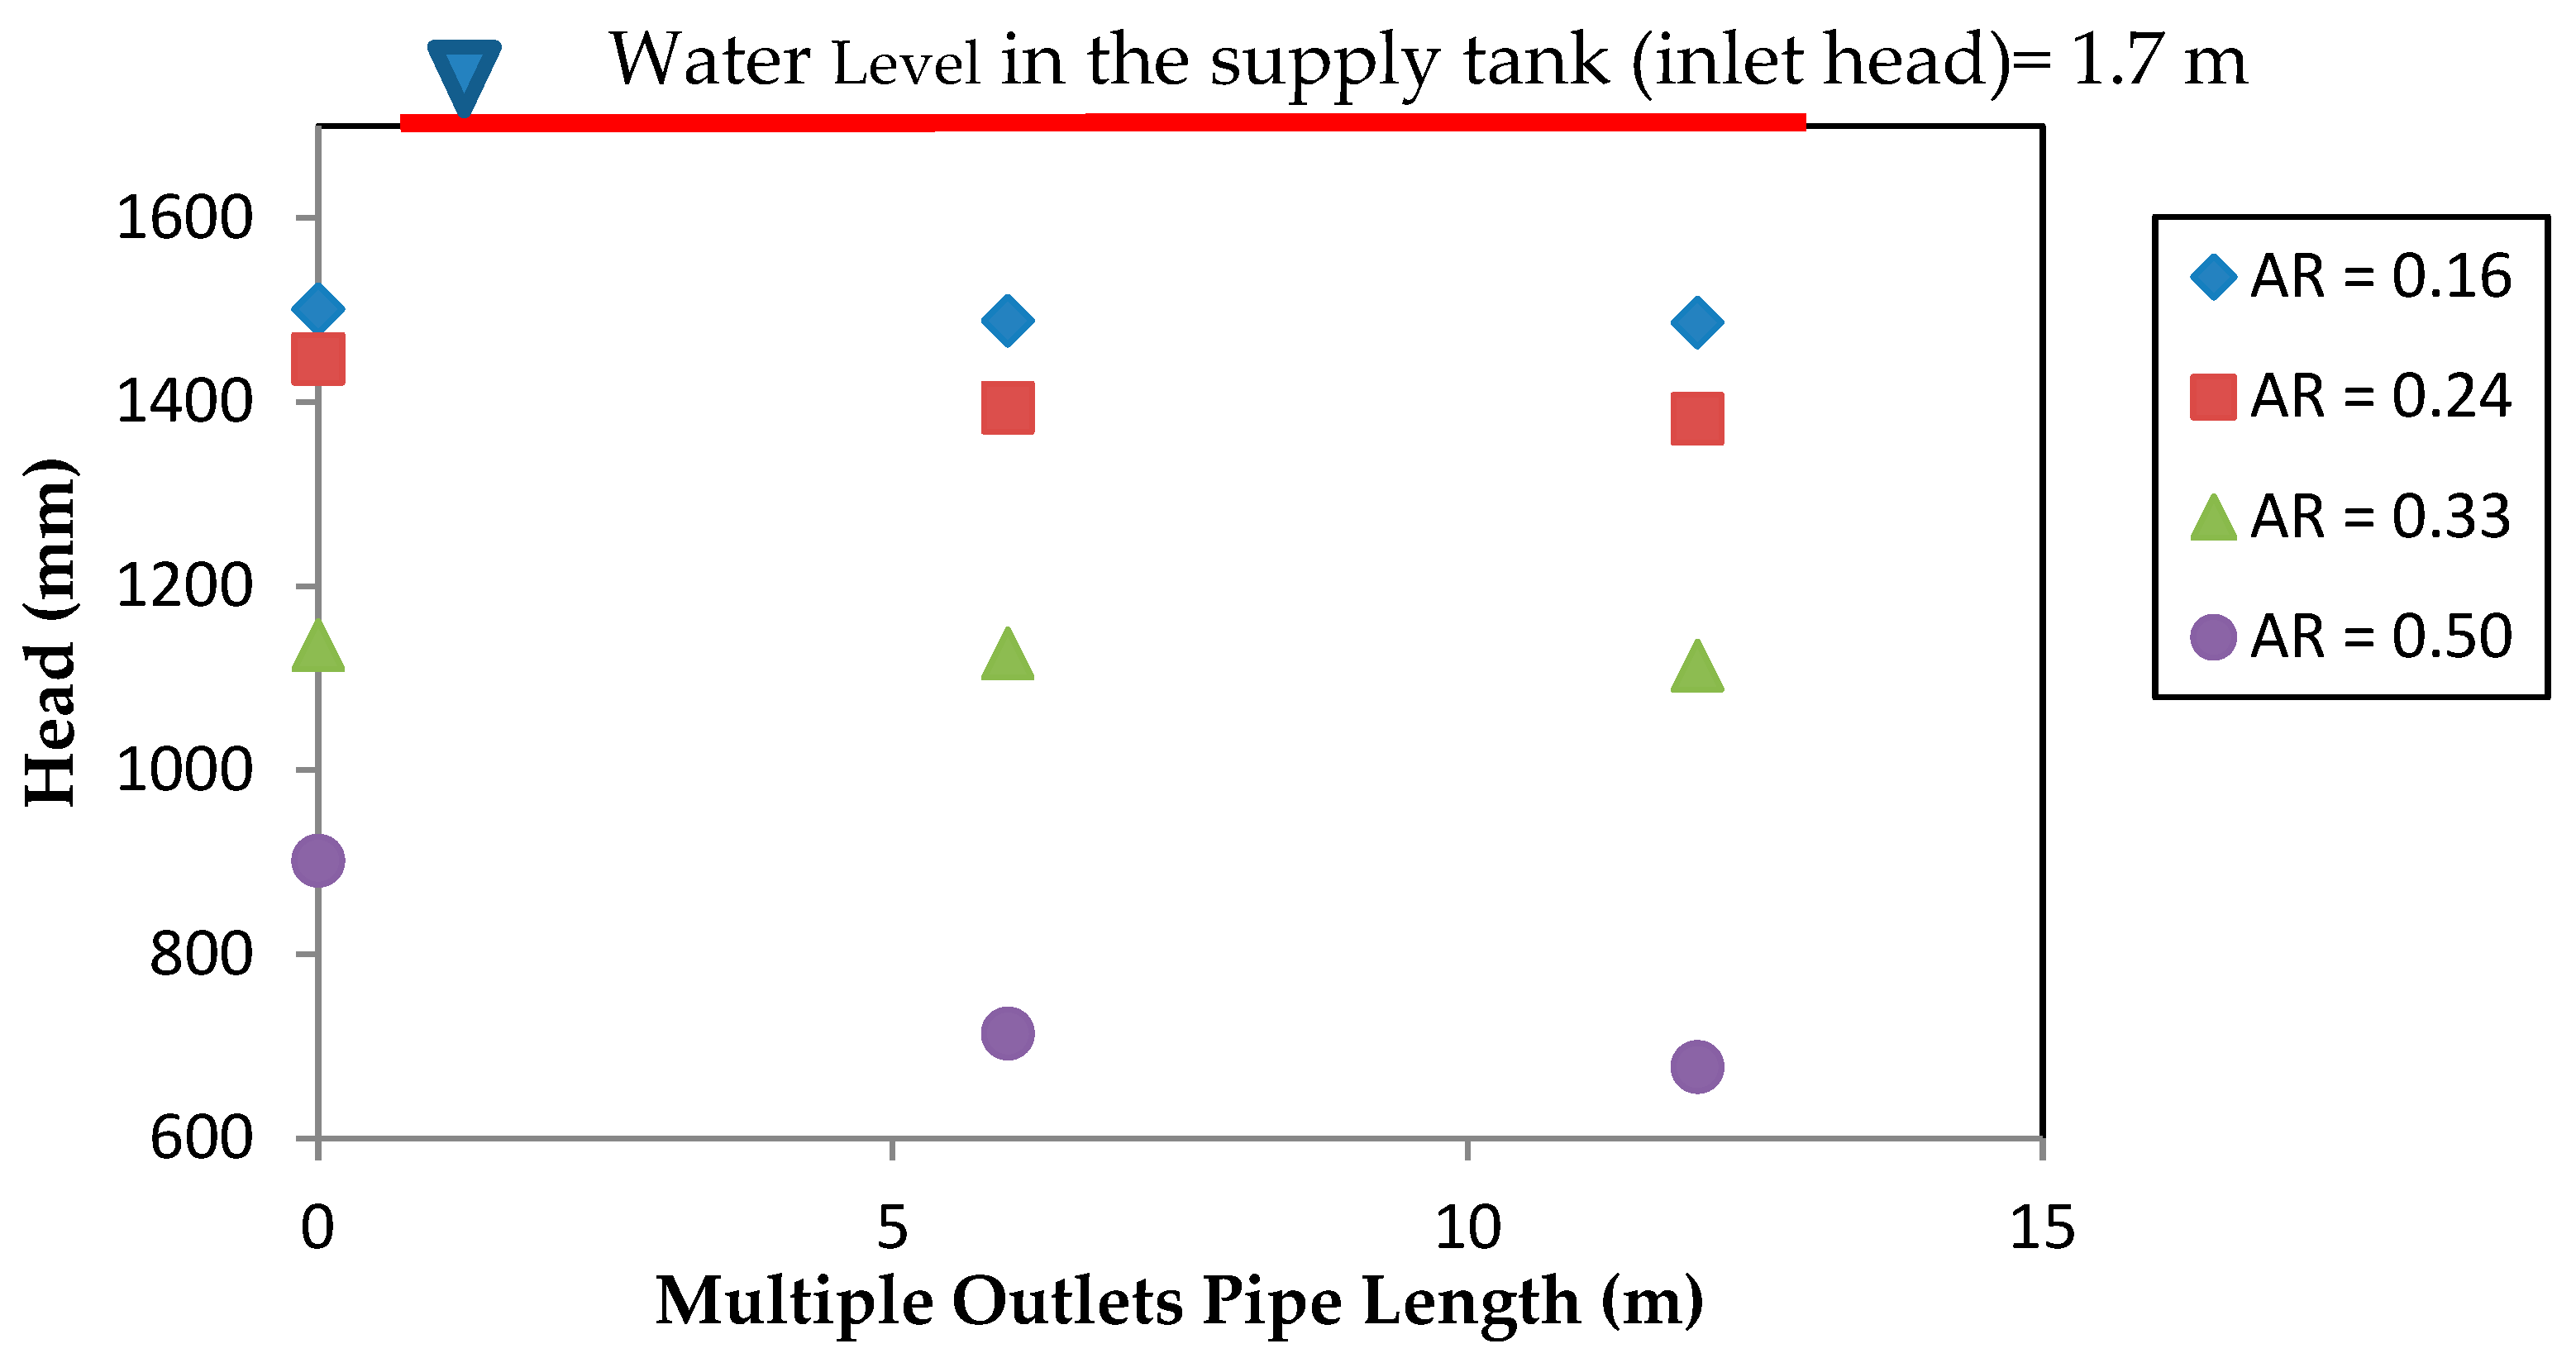
Figure 3 presents the effect of different outlet spacing on friction head loss along a pipe with area ratio of 0.24. The results show that the friction head loss along a pipe with multiple outlets is affected mainly by the spacing (S) between the outlets and area ratio (AR) of the pipe (AR = Area of outlet/Area of the main pipe).
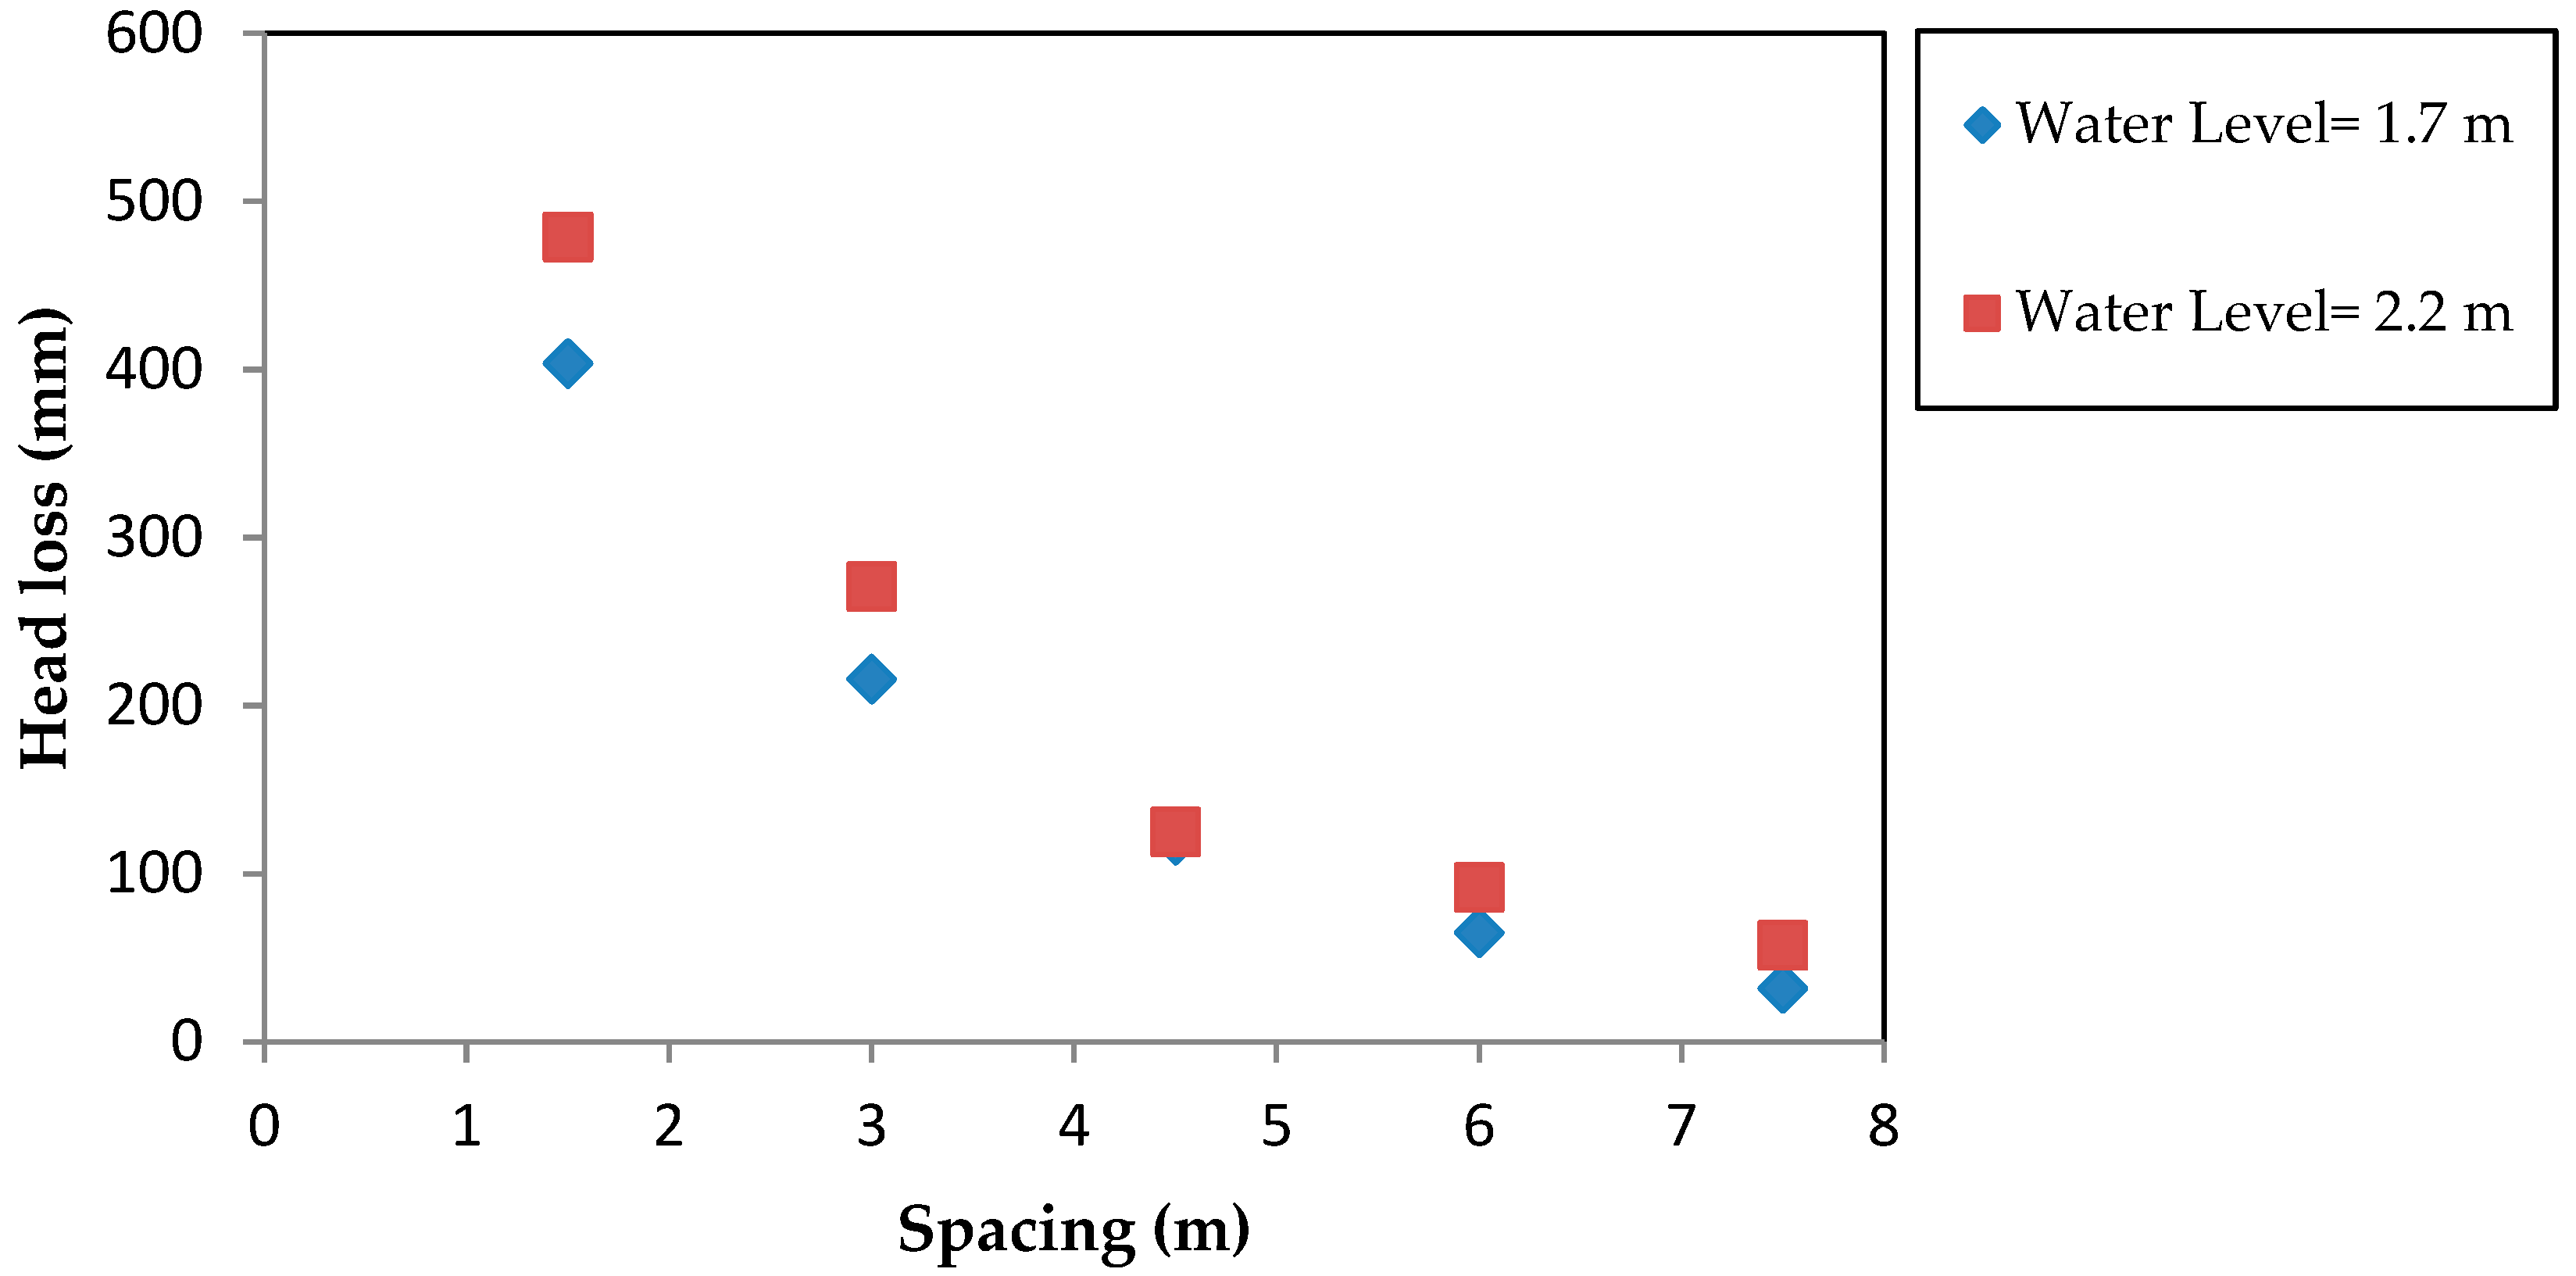
For a given pipe diameter and inlet head, the smallest outlet spacing (1.5 m) resulted in the highest number of outlets, highest discharge and highest total head loss. From
Figure 3 and
Figure 4 below, it can be seen that the head loss was maximum (479 mm) when the outlet spacing was 1.5 m, while it was minimum (57.5 mm) when the spacing was 7.5 m. For a given pipe diameter and spacing between outlets, a higher area ratio led to a higher discharge and a higher head loss. As shown in
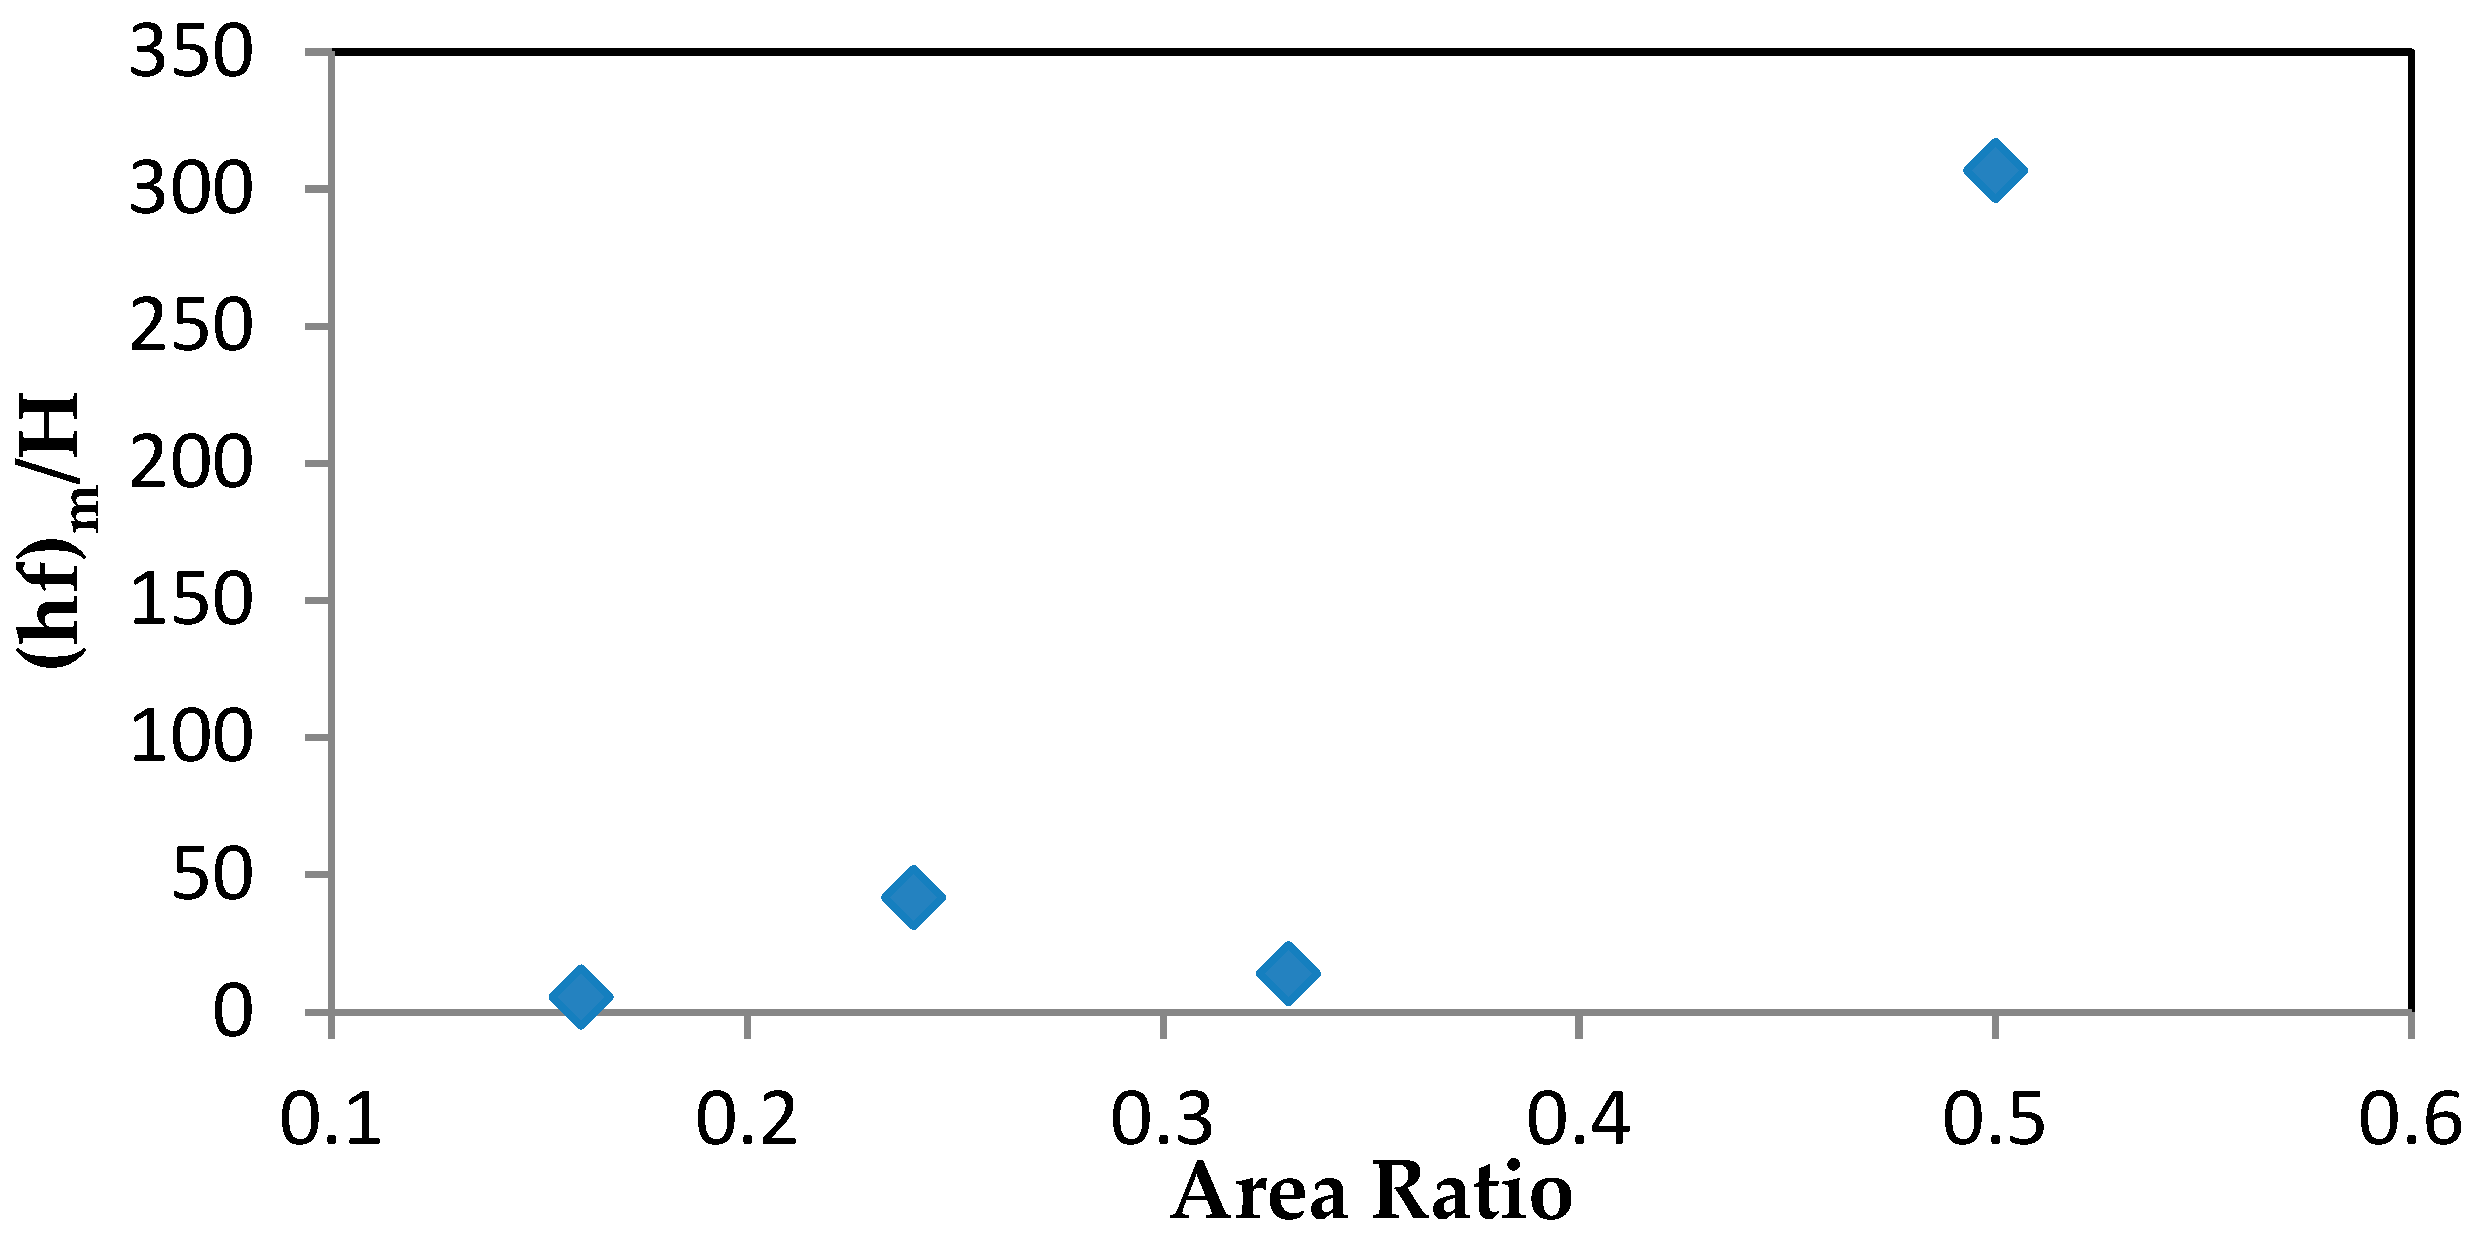
Figure 5, a maximum head loss of 228 mm was recorded when the area ratio is maximum (AR = 0.5).
The measured piezometric head was used to determine the friction head loss along a pipe with multiple outlets. The friction head loss was measured and compared between pipes (having multiple outlets and without outlets) with the same properties (same length and discharge). The ratio of the friction head loss in a pipe with multiple outlets to that without outlets is called the
G factor and is described by the following formula:
where (
hf)
m is the friction head loss in the multiple outlet pipe and (
hf)
p is the friction head loss in the pipe without outlets. For a pipe with multiple outlets, the discharge is decreasing towards the end of the pipe and this leads to a smaller head loss compared to a pipe without outlets carrying the same discharge.
Figure 6 shows the variation between the normalized head loss ((
hf)
m/H) with the area ratio. The normalized head loss is the ratio between total head loss along a pipe with multiple outlets and the inlet head while area ratio is the ratio between the area of outlet and the area of the main pipe.
Table 1 summarizes the head losses for both cases (pipes having multiple outlets and without outlets). The piezometric head at each pipe outlet was measured, and the difference between the measurements yields the head loss along a certain pipe segment while the difference between the piezometric head at the first and last outlets yields the total head loss, (
hf)
m. The same principal was utilized in determining the head losses in a pipe without an outlet, (
hf)
p, in this case, the piezometers head was read at pipe inlet and outlet. The
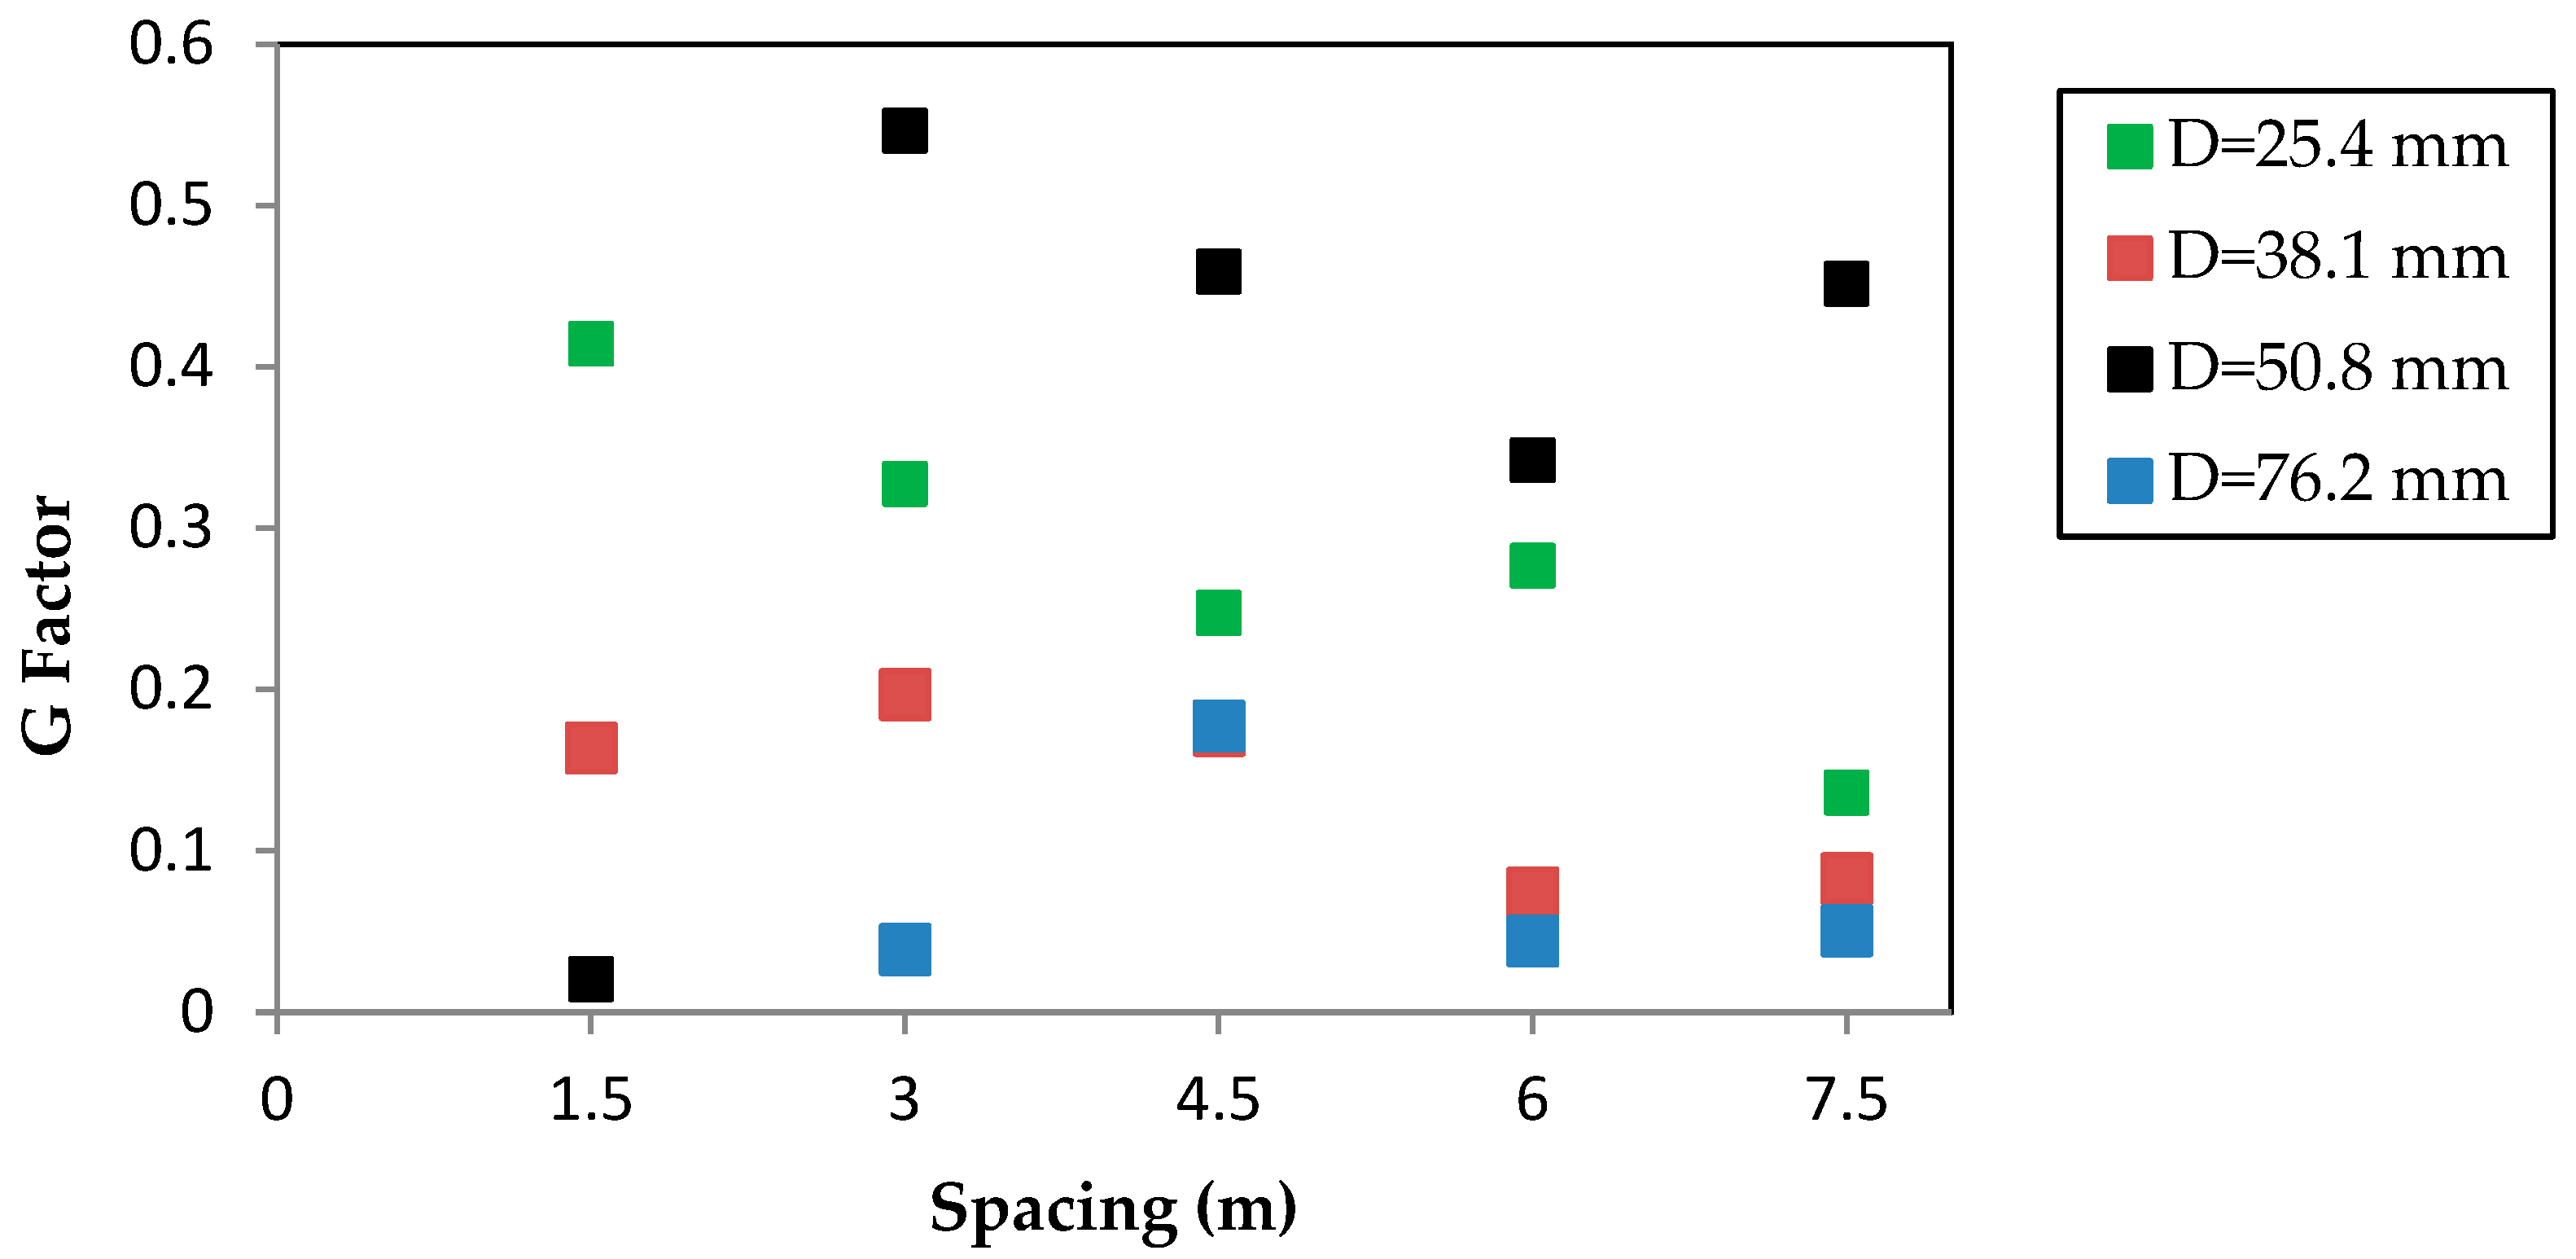
G factor for different flow conditions cases was calculated using Equation (13) which shows that there is no definitive relationship between the
G factor for differing pipe diameter, area ratio, outlet spacing and inlet pressure as illustrated in
Figure 7 and
Figure 8.
Figure 9 illustrates the variation of the Reynolds number (Re) and the coefficient of friction (f) along a PVC pipe with multiple outlets. Throughout the experiments, the Reynolds number ranged between 4946 to 261,897 which indicates turbulent flow conditions. The Reynolds number ranged widely due to the decreasing discharge towards the dead end of the pipe. From the experimental data, the Reynolds number and the coefficient of friction for a known pipe diameter were calculated based on the velocity in each pipe segment, with the discharge measured at each outlet. The values of the coefficient of friction in this study ranged between 0.0144 and 0.0377. As shown in
Figure 9, there was an inversely promotional relationship between coefficient of friction and Reynolds number. The experimental data sets were found within the smooth pipe region (Moody’s diagram) as shown in
Figure 9.
In
Figure 10, the vertical axis (f
n/f
1) is a dimensionless ratio between the coefficients of friction at the first and last segments of the pipe while the horizontal axis (S/d) is dimensionless ratio between outlet spacing and the main pipe diameter. For an inlet head of 2.2 m, the friction ratio (f
n/f
1) varied between 1.18 and 1.82, the friction ratio (f
n/f
1) decreased when S/d ratio increased. The values of the coefficient of friction in each segment of the multiple outlet pipe (f
1, f
2, f
3, …, f
n) is affected by the decreasing discharge towards the dead end (q
1, q
2, q
3, …, q
n) and the ratio (q
n/q
1) which is called uniformity of flow.
Table 2 shows the effect of various q
1 and q
n values on discharge. For Spacing of 1.5 m, outlet diameter of 6 mm, area ratio of 0.24, pipe diameter of 25.4 mm and inlet head of 2.2 m, the values of q
1, q
n and total discharge were found to be 0.154, 0.1 and 1.4 L/s respectively.
Selected formulae for calculating the
G factor were validated by using the formulae proposed by Christianson [
9], Albertson et al. [
14], Oron and Walker [
15], Scaloppi [
16], Valiantzas [
8], Mostafa [
17], Alazba [
18] and Alazba et al. [
19]. In addition to the laboratory data obtained from this study, field data published by Alazba et al. [
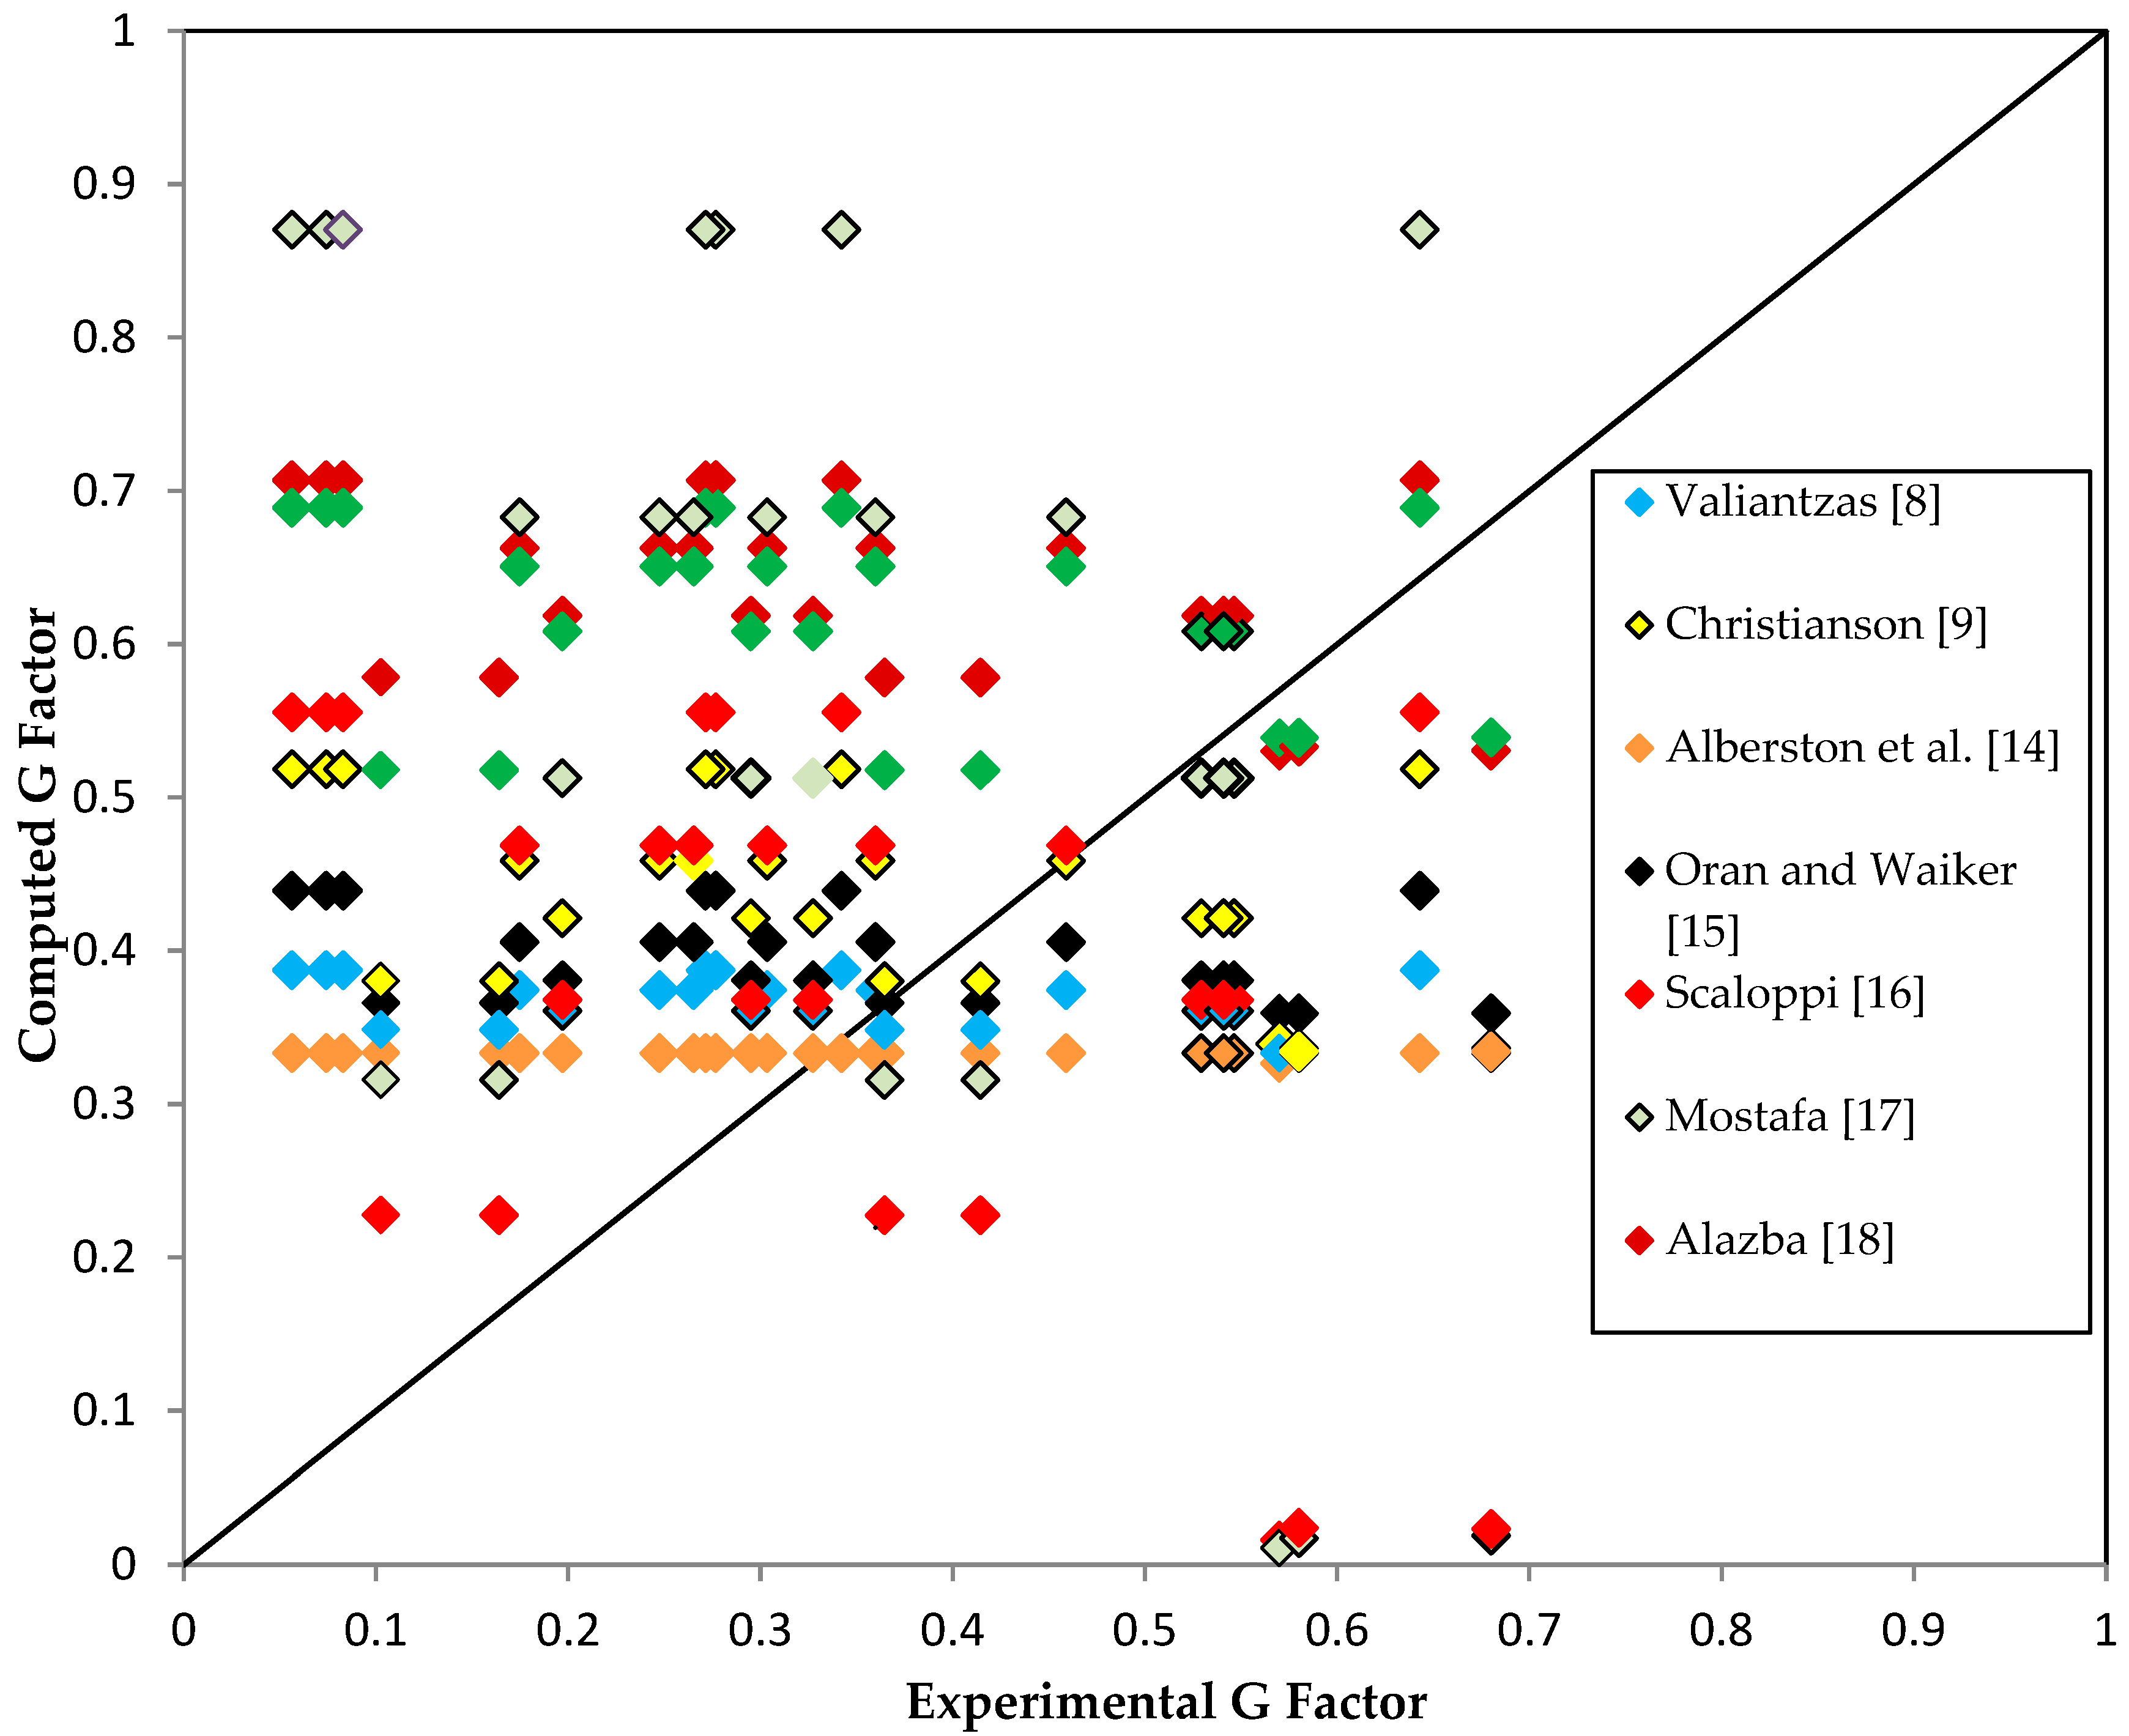
19] were also used in the validation process. The validation process show that the majority of the formulae were overestimated the value of the
G factor as shown in
Figure 11. Comparison between the
G factor obtained from the experimental data with that estimated using the selected formulae, it was found that the
G factor was overestimated and underestimated, 71% and 26% respectively in this data sets. However, only 3% was accurately estimated.
By using Equations (1), (3), and (11), Alazba et al. [
19] calculated the
G factor by assuming m = 1.9 (power of velocity in Scobey formula); they also compared it with the
G factor calculated from sprinkler irrigation field data. Alazba et al. [
19] concluded that the
G factor obtained from the used equations was much higher than that obtained from the field irrigation data; this is in agreement with the finding of this study.
In the selected formulae, the G factor is either a function of the number of outlets in the pipe, N (Equations (6) and (9)) or a function of both number of outlets and the exponent, m of the velocity in the head loss equation (Equations (7), (8), (10) and (11)).
Darcy-Weisbach was the only equation used in this study to calculate the head loss, the velocity exponent was taken equal to 2 in all calculations. On the other hand, the spacing between outlets was taken as a variable and this made the number of outlets, N a variable too.
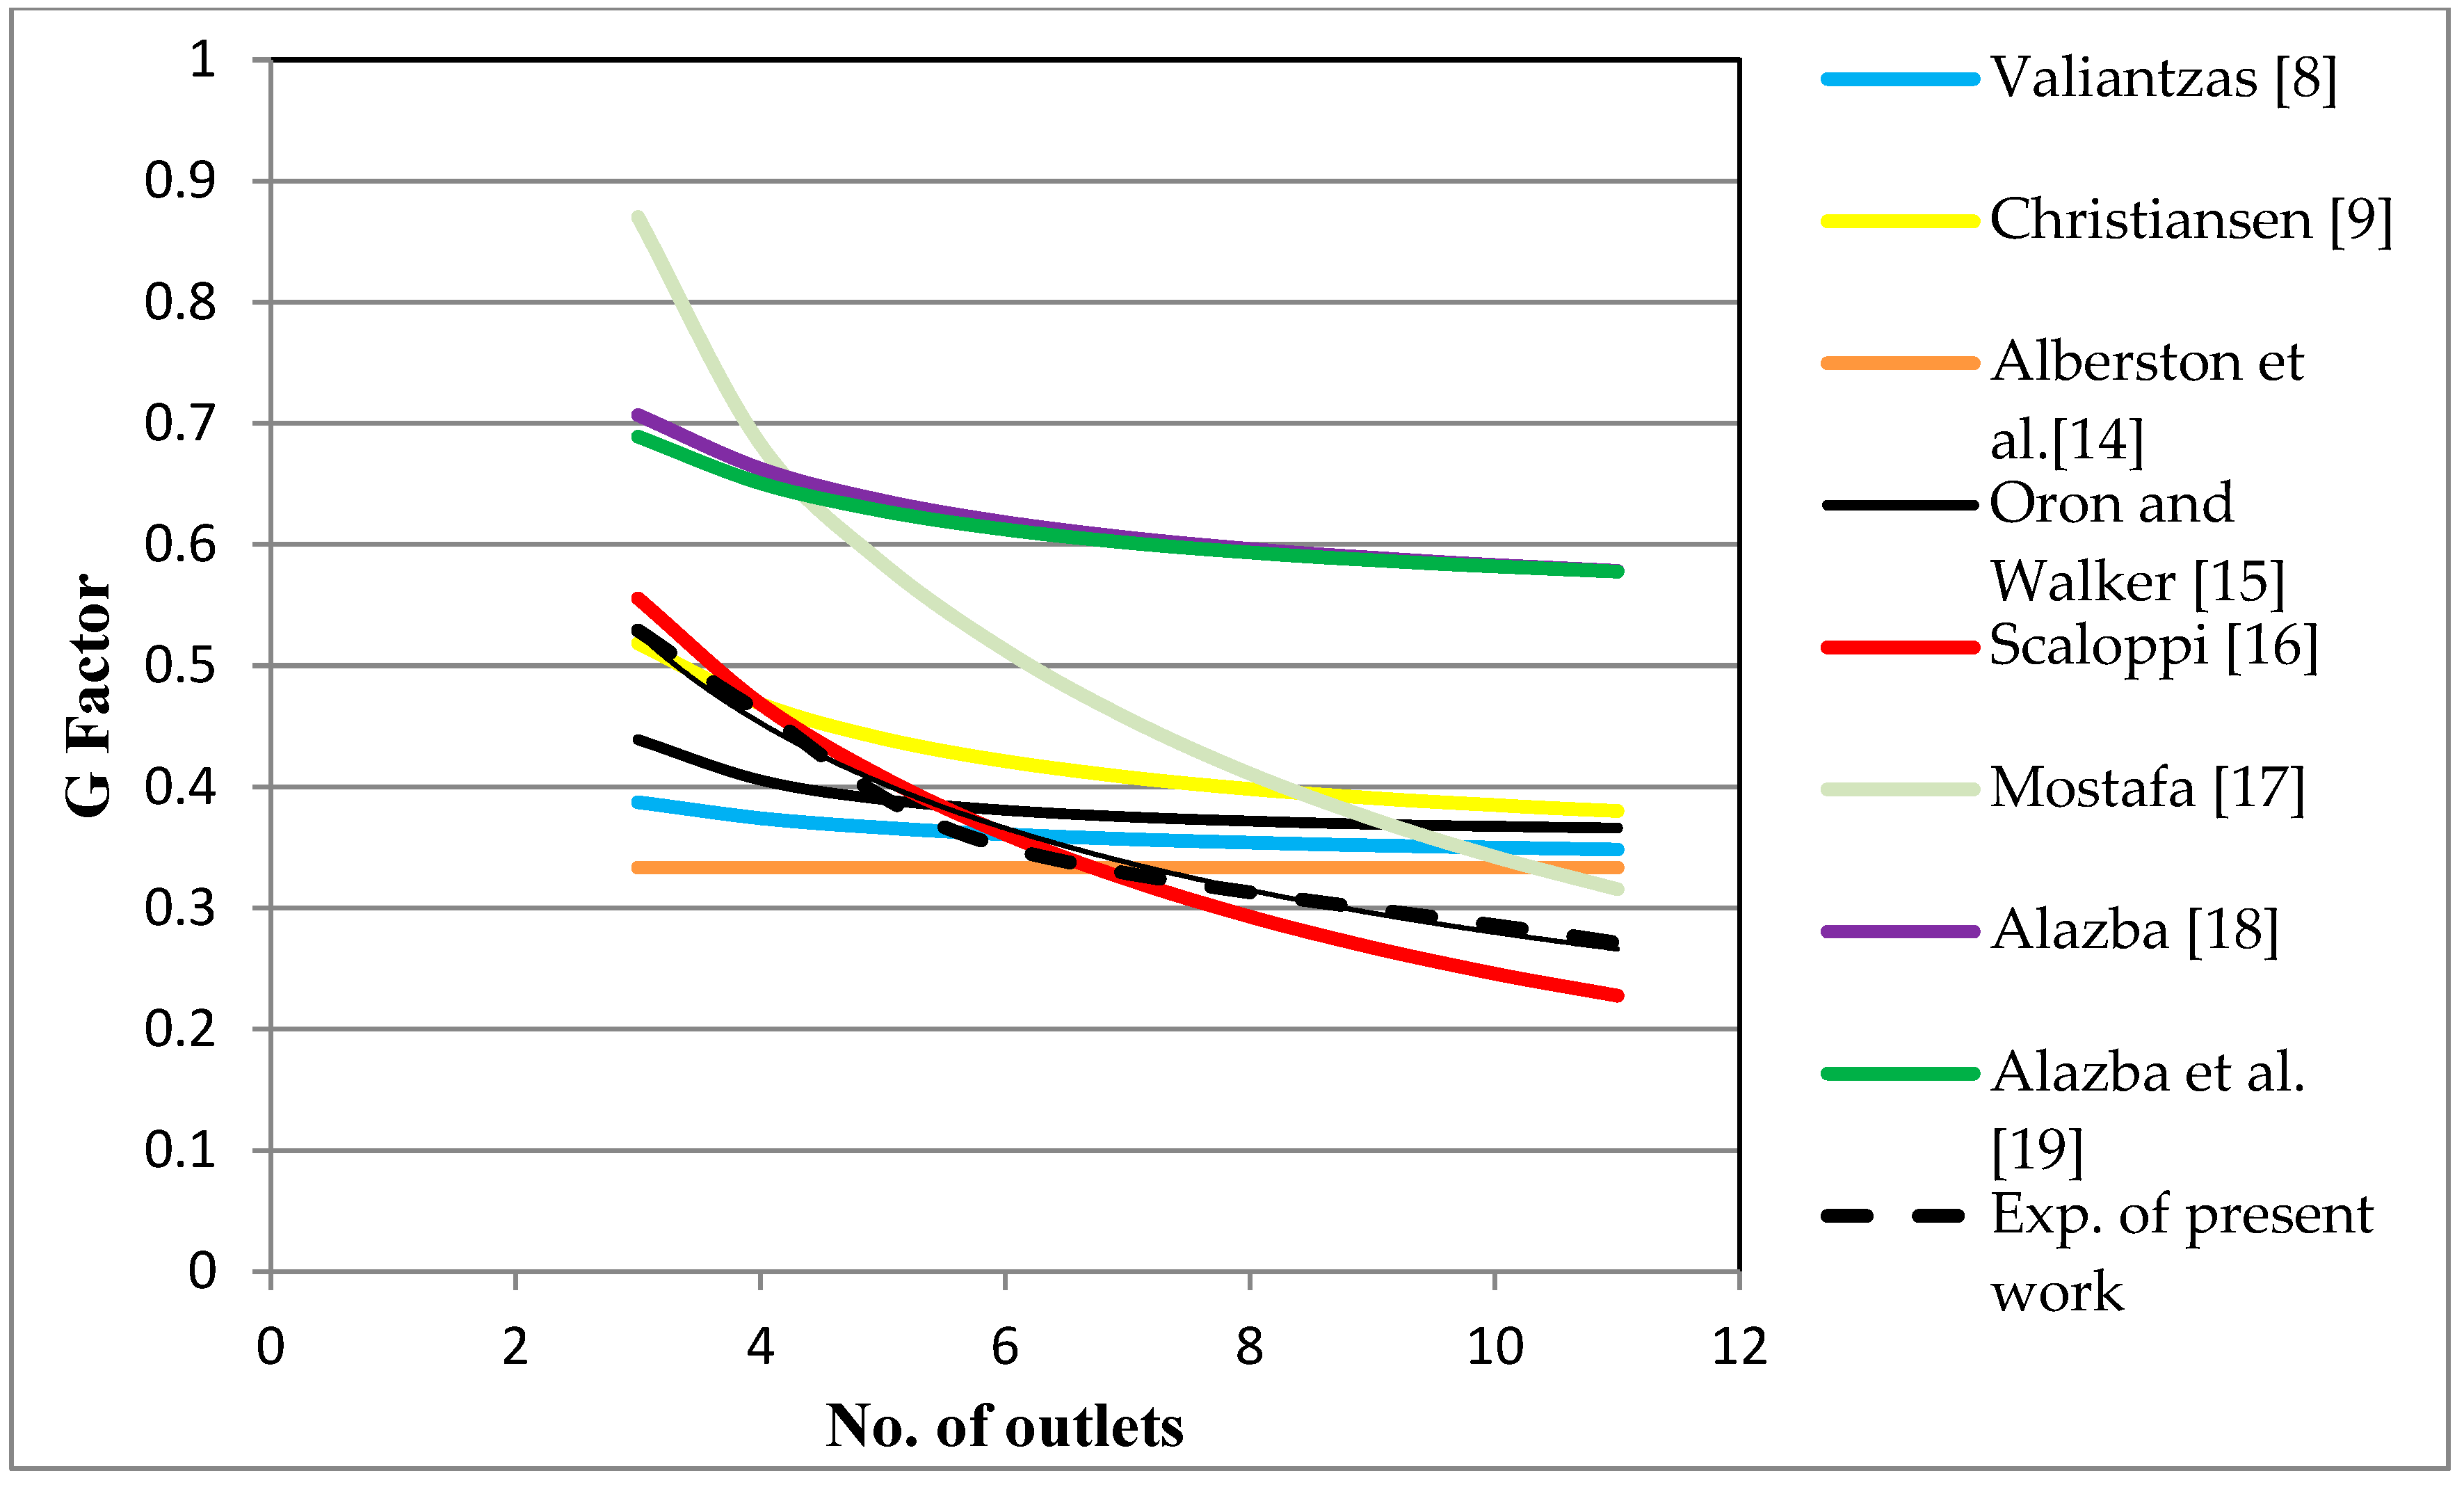
Figure 12 below presents the relationship between the number of outlets in a pipe and the calculated
G factor from using selected formulae. The performance of the formulae used is affected by the reliability of the data used in the derivation. For example, Equation (7) which was proposed by Scaloppi [
16] yielded reasonable value of the
G factor as shown in
Figure 12. In Equation (7), The
G factor is a function of the number of outlets, N and the power of velocity in the head loss equation, m. Mostafa [
17], Alazba et al. [
19], and Sadeghi and Peters [
21] studied the impact of m value on the
G factor and they demonstrated that the G
factor was affected when different head loss equations used (different head loss equations uses different values for m). The relationship between the
G factor and the number of outlets in a pipe was also investigated by Mostafa [
17] and Sadeghi and Peters [
21], their findings were found in agreement with result presented in
Figure 12.
By using the experimental data, the performance of selected formulae for the
G factor determination was assessed by comparison of the
G factors values obtained from Equation (13) with that obtained from the selected formulae. The agreement between the values of the
G factor calculated from the experiments with that calculated using the selected formulae was quantified by various statistical indices such as the root mean square deviation (RMSD) (Equation (14)), the normalized root mean squared deviation (NRMSD) (Equation (15)), the model efficiency (ME) (Equation (16)), the overall index of model performance (OIMP) (Equation (17)) and the coefficient of residual mass (CRM) (Equation (18)). The indices are described as follows:
where
represents the value of the experimental
G factor; represents the values of computed
G factor determined by any of the tested formulae; n = number of experimental data; G
max is the value of the maximum experimental
G factor; G
min is the value of the minimum experimental
G factor; and G
a = is the mean experimental
G factor. In statistics, RMSD is used to compare a calculated value with a measured value (Arbat et al. [
29]) and also it give an indication about the accuracy of the model prediction or model efficiency (Legates and McCabe [
30]). A low RMSD or NRMSD indicate an accurate prediction. A value of 1.0 for the model efficiency (ME) indicates a perfect agreement between the experimental and calculated
G factors, however, ME can be a positive or negative value. The OIMP combines the NRMSD and ME indicators to verify the performance of a selected formula, an OIMP value of 1.0 indicates a perfect agreement between the experimental and calculated
G factors. The CRM parameter represents the difference between experimental and calculated
G factors in relation to the experimental
G factor value. For any tested formula, a zero value for CRM indicates a perfect agreement while a positive and a negative value indicate overestimation and underestimation respectively.
Table 3 summarizes the values of the statistical indices for all the tested formulae.
Table 3 shows that Equation (7) yielded the lowest value for RMSD and NRMSD which were 0.026 and 0.102 respectively. However, Equation (7) gave highest values for ME and IOMP which were 0.93 and 0.91 respectively. Equation (7) gave the lowest value for which was zero. Based on the above results, it can be concluded that Equation (7) gave the most satisfactory estimation for the
G factor. 4. Conclusions
A physical model was used to simulate the variations in friction head loss, (hf)m along a PVC pipe with multiple outlets. The findings of this study show that the friction loss in a pipe with multiple outlets was affected mainly by the outlet spacing (S), inlet head (H) and area ratio (AR). For a given pipe diameter and an inlet head, the smaller outlet spacing led to a greater number of outlets, greater discharge and hence a greater head loss. In addition, there was a proportional relationship between friction head loss and area ratio.
It can be noted from the results that the
G factor varied depending on outlet spacing and inlet head, the pipe diameter have no effect on the
G factor. Throughout the experiments, the Reynolds number changed (within the smooth region of the Moody’s diagram) as the discharge varied along the pipes, and so did the coefficient of friction. There was an inversely proportional relationship between the friction ratio (friction in the last pipe segment, f
n to the friction in the first pipe segment, f
1) and S/d. Equation (7) which was proposed by Scaloppi [
16] yielded the most satisfactory estimation for the
G factor among the eight tested formulae in this study. The performance of the tested formulae was assessed by using statistical indices which were RMSD, NRMSD, ME, OIMP and CRM. The vales of these indices for Equation (7) were found to be 0.026, 0.102, 0.93, 0.91 and 0.00 respectively.
The hydraulics of the flow in a pipe with multiple outlets is a complex issue and the findings of this study will be useful to researchers and engineers practicing in the field of hydraulics. However, more research on the hydraulics of multi-outlet pipelines is needed.
