Abstract
Water collection from piped water distribution systems (PWSs) in rural communities in sub-Saharan Africa is not understood in much detail. Here, distances travelled to distribution points (DPs), volumes collected, times of day of collection, and the relationship between location of DP and volume dispensed are investigated in a rural community in Tanzania using a combination of novel smart pre-payment meters and results from surveys and interviews. Continuous availability of water through pre-payment smart meters is shown to eliminate queue time, freeing time for farming or schooling, and enhance revenue collection for service provision. 97% of users use DPs as a main source of drinking water as opposed to unimproved alternative sources, and 42% live further than 400 m from a DP. Collection occurs across daylight with greater volumes dispensed in the afternoon–evening due to free time from economic activities and children returning from school. A low mean daily collection of 47 L per household from DPs is approximated. Volume dispensed across different DPs over time shows no clear pattern. However, the volume dispensed is indicated by the number of households that use each DP. Increasing PWS capacity can accommodate for variable collection patterns, and help improve sustainability of rural water supply.
1. Introduction
The need to “achieve universal and equitable access to safe and affordable drinking water for all” by 2030 (Sustainable Development Goal 6.1) requires better understanding of water supply at the village level. Specifically, complex patterns around rural user collection behaviours are not well understood [1,2]. When in the day do users collect water? How does location of water point impact collection? How much water do users and households collect from different sources, and why? Answering these questions will bring evidence to planning and policy decisions, and help reduce the risk of marginalised people being left behind [3,4,5].
The objective of this study is to examine how these questions apply to water collection from a piped water distribution system (PWS) in rural Tanzania. Specifically, the influence of time of day, distance, and location of PWS communal distribution points (DPs) are investigated with a novel approach of combining remotely collected data from water meters with interviews and surveys. Factors influencing water collection, supply, and subsequent use of water from PWSs are thereby identified.
Research on household water demand in developing countries has previously focused on urban contexts [6], and exceptions in rural settings have relied on household surveys due to lack of piped connections [7].
Households typically use more than one water source for the range of domestic uses, and determinants such as price, distance, quality, and specific use are complex and have been explored in focused literature [6,8,9]. Evidence suggests that improved water sources are commonly used for drinking and cooking, with unimproved surface water or wells being used for non-consumptive uses [2]. Seasonal rainfall impacts the quality and availability of different water sources, thereby influencing choice of source [10]. While information on different sources are gathered from the surveys here, the novel contribution of this study comes from the high-resolution smart meter data, only available from PWS DPs. The emphasis is therefore narrowed to collection patterns from PWSs, but findings are no less valuable, especially considering information on PWS planning can find more direct use than information on other alternative sources.
PWSs extend water service in rural communities, even when not connected to individual households, and bring certain economic and developmental benefits compared to handpumps [11]. Novel Internet-of-Things connected technologies [12] on water points allow for better monitoring. Sensor-based remote monitoring has seen potential benefits to rural water supply management (investigated elsewhere, e.g., [13,14,15]). With the predicted increase in deployment of such technologies across rural sub-Saharan Africa, harnessing their longer-term monitoring capacity as done here has growing importance [16].
Here, eWaterpay meters (smart meters) are used to investigate collection patterns from a PWS in a rural community in Northern Tanzania. This represents a new opportunity for long-term monitoring of PWS use at fine temporal and spatial resolutions, such as hourly volumes dispensed. Traditional meters are limited by time, cost, and accuracy of manual monitoring [17], and the reporting of data.
The infrastructure of rural water supply is often treated as a separate issue to socio-economic context [18]. Here, high accuracy volumetric, time, and location data from smart meters are combined with quantitative and qualitative information from surveys and interviews with both community members and service providers, with a focus on times, travel, and volumes of collection. This combination allows limitations of each method to be addressed and can provide more contextualized insight [19,20,21]. Findings are supported by further analysis of a rural community in The Gambia where smart meters are also installed.
2. Materials and Methods
2.1. Main Study Setting
Data was gathered in a rural community in northern Tanzania, ‘Community A’, between November 2018 and August 2019. Smart meters have been installed on the PWS DPs for approximately two years prior to the study. It is an agrarian community spread across ~15 km2, at elevation 1370 m with varied topography. It relies on seasonal rainfall for irrigation. There is sufficient shallow groundwater in this region, where 15 km north approximately 80% of wells are less than 30 m deep [22], and there is seasonal surface water in riverbeds and dams. The population is young and rapidly expanding. No census is available, and estimates of population range widely between different stakeholders interviewed. A household count from satellite imagery of approximately 300 households, multiplied by mean household size of 5.9 (see results below), gives approximately 1700 people. The DPs are available to all households (discussed below). Across rural Tanzania, the population without basic drinking water service stands at 57% [23], and even communities with recorded water points are not guaranteed year-round service [24].
The PWS investigated in Community A consists of: a 78 m deep borehole with one solar-powered motorised pump (6 m3 hr−1 capacity with 32 solar panels); 50 m3 water tank elevated on a hillside; 13 gravity-fed DPs; and pipework. The farthest DP from the tank is 2.6 km. This is a relatively new PWS installed in 2015–16 and is managed by a 10-person COWSO (Community Owned Water Supply Organisation). Alternative water sources are two working handpumps with vendors, seasonal rain and surface water, and lined wells; these are not the focus of this study as presented above.
2.2. Remote Collection of DP Usage Data
Smart meters are well suited for this investigation. They are installed on each DP in the community. Users touch tags onto the smart meters to open the DP tap valves. Users load credit onto their tags, i.e., pre-paying for water. The smart meters accurately measure flow and volume with every use, and report this in real time to a cloud-based data management system. Previous studies on PWS water distribution in sub-Saharan Africa have had to rely on conventional meters of uncertain accuracy, unreliability, with low temporal resolution manual readings that are laborious and costly (e.g., [17]), and are therefore restricted in detail. Here, data is now available from each smart meter in real time on: time of use, the water volume dispensed per use (therefore the flow rate), the availability of each meter—i.e., functionality of the DP or meter—and the ID number of each tag being used to operate the smart meter. The accuracy and precision of these automated measurements is high, with time measurements in real-time and the impeller flow meter within ±5% error. The exact GPS location of each DP is also known to within approximately 2 m. Data is accessed via an online dashboard where geographic and temporal scales can be selected. Matching user ID number to individual uses is not possible here due to sharing of tags (among households) and anonymity of surveys and interviews. Other novel technologies share some of these data categories to varying degrees, and current research with these is more focused on handpumps and borehole pumping rather than PWSs.
Here, the data from each of Community A’s 13 smart meters is used. This is supplemented with the 10 smart meters in a rural community 40 km to the west of Community A, Community A2, and 28 smart meters in a rural community in The Gambia, Community B.
2.3. Interview and Survey Protocols
Most research that attempts to estimate household water demand across developing countries has relied on data from household surveys [6]. Here, combining survey and interview methodologies with the remote data collection from smart meters allows for a better representation of the reality of rural water collection in Community A. Primarily, it minimizes the risk of missing information from only using the remotely collected data. Inversely, the availability of high-accuracy and high-resolution data on water usage adds detail and accuracy to findings beyond conventional survey approaches.
This approach engages with the ascendant understanding of rural water supply as ‘systems’ [25,26,27,28] and aims to progress beyond technocratic approaches [29]. Demonstrating the benefits of a combined approach at this stage is important, considering such innovations and availability of data in general will be more common in the future across rural water supply systems.
A similar triangulated approach has shown success with other research problems, without remote data collection. For instance, in indigenous communities in Australia, researchers have combined water use data loggers and supplementary qualitative surveys [30]. Others have combined structured questionnaires, direct observation, and water quality testing in large-scale surveys [31]. Outside of water supply research, sensor data has been successfully combined with interviews to impartially evaluate an improved cook stove intervention in Uganda [32], and toilet use frequency in India [33].
Semi-structured interviews, survey questionnaires and observation were conducted in Community A between February and April 2019. Attempts were made to limit the research’s extractive nature [34,35], to limit imbalance of perceived power between the researcher and respondents, and adhere to the Lean research principles or ‘rigour’, ‘respect’, ‘relevance’, and ‘right-sized’ [36]. The influence of social desirability bias was recognised regarding the smart meters, and care was put into ensuring questions and choices were objective and non-leading. Objectivity of the researchers was explained to each respondent beforehand. Other stakeholders who have less reason to give biased responses gave similar responses to users.
In order to capture a wide range of household types and minimise risk of representation bias in this study, sampling of respondents was split into two groups, which were sampled consecutively with different interview protocols (as suggested in [31]). Different random selection methods were used for each group, and there are no different household characteristics between groups.
- The first group are ‘key-informant’ respondents, given a longer semi-structured interview protocol. These featured both: (a) quantitative closed-ended or multiple choice questions (e.g., ‘What time does your household collect water?’, ‘How long does the travel and the collection take from this water point, including queuing?’, ‘What is your household’s main water source for drinking/cooking/washing/bathing/domestic animals?’); and (b) qualitative, open-ended questions, designed to provide experiential information [37] from varied experiences (e.g., ‘why do you collect water at this time?’, ‘How is it using the smart meter?’). Mean interview length 42 min; n = 32; male:female = 3:5. The protocol’s 49 questions were categorized into background information (including household characteristics and disaggregated source choice), demand from DPs (including experience of using smart meters, affordability, and satisfaction), and accessibility of collection (including travel, time taken of collection, time in the day, and ease of use). More specific questions on alternative sources were not included for the reasons given above.
- The second group was asked only the 36 quantitative, closed-ended questions from the first interview protocol to reduce the length and for more accurate statistical analysis. Mean interview length 20 min; n = 30; male:female = 1:2.
In both groups, one respondent from each household was asked to respond and the GPS location was taken. Sampling for the first group was based on selecting households from satellite imagery as randomly as possible while ensuring that each sub-village was represented. This avoided any visual bias on type of household (e.g., wealth, household size), while generating qualitative information from across the relatively diverse sub-villages in the community. For the second group, randomness of household selection was prioritised for the purposes of purely statistical analysis and a transect walk was selected to eliminate bias. This was done after the first group interviews, and incorporates potentially marginalised respondents and ensures a diversity of households hilltop, village ‘centre’, agricultural plain, and lakeside locations. Two transects (5.3 and 5.4 km length) were drawn using randomised coordinates.
Analysis of quantitative data involved simple descriptive statistical and mapping techniques, including measures of central tendency and dispersion, frequency distribution, time-series analysis, and uni- and multivariate regression, with presentation in graphs and maps. Qualitative data analysis included manual transcription, categorization, and identification of similarities across responses, as in similar qualitative analyses [38], and drawing out of key findings for cross-reference against quantitative findings. This draws enough richness from the data to address the research objective, and the multivariate nature and size of the dataset make more involved statistical analysis inappropriate. The sample size was selected for the analysis to give the best representation of the community’s water collection patterns from the PWS, while suitably balancing precision and the capacity of the fieldwork to provide the required information. Estimating the number of households in Community A at 300, descriptive analysis to a precision of ±12.5% (d ≤ 1/8) and a confidence level of 95% (α = 0.05) requires a sample size of n = 60 [39]. This is deemed a reasonable balance between precision and fieldwork capacity for providing the required information, and n = 62 was achieved.
Distances from respondent households to DPs were measured for analysis. In order to accurately measure distances that best represent the reality of users’ collection journeys, satellite imagery was used. This is less susceptible to subjective inaccuracies from estimation by respondents or researcher. Measurements can be taken as both Euclidian, i.e., straight lines, as in [40], or along path routes. Circular (i.e., Euclidian) buffer zones within 500 m of a water source in small town settings in Mali overestimated catchment of households by 14%, as they do not describe true travel distance [41]. Likewise in Community A, distance measured along paths is longer than Euclidian measurements by an average of 22.5%. Both types are included in results below, however distances measured along paths are used for analysis as they give a truer representation of the journeys users take.
These interviews and surveys were part of a broader evaluation of the smart meters, overviewed below in Section 3.2. This was conducted using a rigorously designed Evaluation Framework that draws on existing frameworks for evaluating technologies for development (i.e., [42,43]). This evaluation includes a range of criteria, and is based on demand from managerial stakeholders, user experiences and demand, and accessibility (technical robustness was separately included). This evaluation used the same protocols and analysis outlined above, and also featured additional semi-structured interviews with all available members of the COWSO (mean interview length 57 min; n = 8; male:female = 5:3), based on a separate protocol of 27 open and closed-ended questions. These included background, demand from users, use of smart meters, and management of the PWS, and were conducted first to allow for refinement of the sample group protocols if needed. It was recognised that, due to the new nature of the technology, and unique setting and PWS, a perfectly representative control study was not possible; however, a control study using the same interview protocols in a neighbouring village to Community A (<4 km, to minimise extraneous differences) gave good contextual comparisons of water collection and a ‘reality check’ (mean interview length 24 min; n = 10; male:female = 6:4). Furthermore, questions were designed to elicit objective comparisons to water supply before smart meter installation. Considering that it does not address the key research questions above, only a summarised overview of net benefits from smart meters is included in Section 3.2; the evaluation methodology is relatively established and a more detailed description is deemed inappropriate.
Using a case study community allows for collection of information in an in-depth and ordered way from an appropriate range of voices and sources, and enables deeper insights for broader application across sub-Saharan Africa. Detailed research and ethical considerations received approval from the University of Exeter ethics review board (eEMPS000026v2.1). Permissions were received from all respondents and participants, with explanation of anonymity, encryption, and permission for publication.
3. Results and Analysis
3.1. User Characteristics of Community A
The mean number of residents per household is 5.9; std. dev. = 2.3; range = 1–11. Women and/or children participate in water collection in 100% of households sampled. Only four users out of 53 interviewed answered that they do not use a DP as their main source of drinking water, instead using lined wells or riverbeds that are closer more often. Of this sample, only ~77% of users (41) include DPs as their main water source for cooking; ~64% (34) as their main source for clothes washing; ~36% (19) as their main source for bathing; and ~26% (14) as their main source for their domestic animals. Non-users (n ≈ 9) either think the DPs are too far from their households, have stopped using DPs because of irregular water supply, cannot afford to replace a lost tag, or have preferable free alternative surface water or well sources. Overall, while alternative sources account for collection of more non-consumptive domestic water as expected, DPs are the most significant, and the focus on the PWS here is justified. The price of credit is the same per litre before smart meter installation (25 Tanzanian shillings per 20 L). Approximately 17% of users answered that this is too high.
3.2. Summary of Broader Evaluation of Smart Meters
Overall, the smart meters are shown to be a beneficial intervention to the managerial stakeholders, the users, and to the overall effectiveness and sustainability of the water supply system in Community A. This finding is based on data collected using the same protocols and analysis outlined above, and is overviewed in Table 1 against the evaluation framework. Technical performance has been evaluated elsewhere and shown to be suitably robust and accurate.

Table 1.
Major findings of the broader evaluation of smart meters in Community A
3.3. Distances Users Travel to DPs
‘Distance’ is used more than ‘time taken for collection’ as an indicator in definitions of rural water access [41,48]. Tanzanian national policy has a threshold of water access based on one water point serving 250 people within a 400 m radius [49,50]. In Community A, 58% of respondents are within 400 m, indicated in Figure 1. The mean distance of travel for respondents is 446 m (std. dev. = 338 m). A large number of households have marginalised access by living far away from DPs. 91% of users use the DP that is closest to their household most often. The remainders use DPs only marginally further away, and cite reasons of personal preference of paths, choosing not to collect near a school, or no particular reason beyond habit. Water quality is uniform across the PWS. This is a similar value to the 89% found in Mali [41], where taste, affordability or other personal preferences influence this decision. In the community that neighbours Community A, where there is no PWS, the mean distance to a handpump is 626 m (std. dev. = 236).
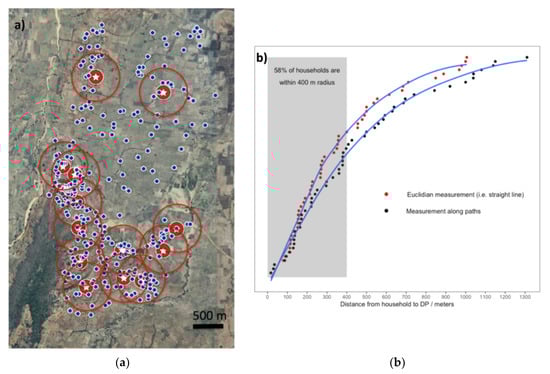
Figure 1.
(a) DPs in Community A with 400 m radius (red) and all household locations (blue); (b) Distribution of distances between households and DPs for sampled user households.
Five of the nine respondents who do not use DPs cite long distance as a reason (mean distance for these respondents is 885 m, and eight users still live further away). This behaviour is seen in rural Madagascar where some households are less likely to choose an improved water source if it is further away than unimproved alternatives (86% use the option that is the closest available, which have a mean of 193 m distance) [51]. Some users in Community A also expressed a desire for closer DPs.
Answers of time taken for water collection from users (as multiple choice of different time categories) were combined with the recorded location data to verify a positive relationship in Community A between distance and time taken for collection (shown in Figure S1, Supplementary Materials). Different modes of collection (e.g., using bicycles, young children) reduce the significance of this relationship. Queue time elsewhere negates this relationship [51]; however, in rural Kenya the time taken for collection has been shown to influence the choice of water source [7]. Here, the elimination of queue time in Community A described in Table 1 (87% of respondents say that now there is never a queue) has made distance the major factor for time of travel. On average in rural Tanzania, people spend an estimated 42 min per trip to collect water [52].
3.4. Times Users Collect Water in the Day
As far as evident, understanding of time of collection of water in the day in rural sub-Saharan Africa from any source remains largely based on anecdote or assumption.
Answers on time of use from the first interview group were recorded and plotted as a cumulative frequency distribution in Figure 2a. This suggests two collection peaks in the morning and afternoon. Average hourly combined usage data (litres) from all 13 DPs over November 2018–April 2019 are plotted alongside this frequency distribution for comparison on the same axis (Figure 2b). This timespan corresponds to the fieldwork while reducing seasonal effects and is disaggregated monthly.
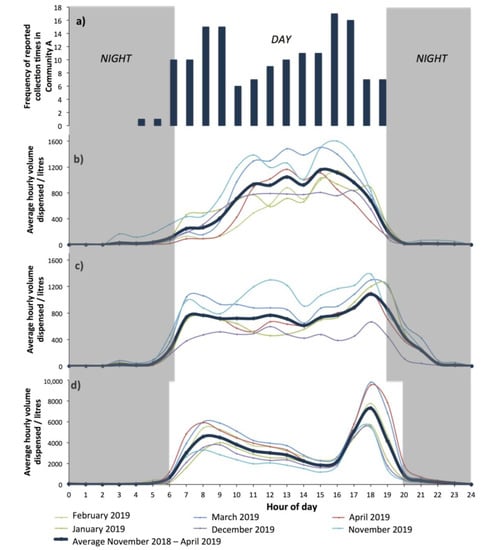
Figure 2.
(a) Cumulative frequency distribution of reported collection times of households in Community A; (b) Usage data of combined average hourly use from all DPs in Community A for the period November 2018–April 2019; (c) Community A2; and (d) Community B.
The variance in times of collection reported by different users shows the differences in collection schedules between households in Community A. There appears to be no period in daylight when collection is not done, with a general preference for either morning or afternoon, or both. Qualitative explanations given by users for these quantified times vary. Times are limited by, for example:
- when water supply is available from the PWS, specifically in the morning when solar pumping has not filled the tank, or in the evening when the tank has become empty
- when users have time free from other activities
- when it is less hot
- farm work in the morning and rest time in the evening
- when the children return from school to do the collection (approximately 16:30)
No users interviewed collect at night either because of schedules and security, but more commonly because of lack of water availability.
The DP usage data from the smart meters maps to the reported times of collection for the time period (Figure 2a,b) within a reasonable margin of error considering variability of daily schedules, aggregate DP usage data, and imprecision of time recall. The afternoon peak is mirrored in both data sets. The weaker match in the morning is likely attributable to households collecting lower volumes at these times. A slight increase in volume dispensed over the afternoon compared to the morning likely demonstrates the time spent on farming activities in the morning mentioned by users. The sharp reduction in usage between 17:00 and 19:00 (Figure 2b) demonstrates supply running out by evening. Users outline that supply often abruptly runs out later in the day, and especially attribute this to days of reduced sunlight when solar pumping capacity is limited. The COWSO secretary explained that water supply from the tank and the rest of the water distribution system cannot always match demand. Research in urban Sri Lanka has shown that if service from a piped connection is available for longer throughout the day, volume collected increases [53]. However, this is by a negligible amount of 2% for every extra hour of availability, and in a setting not worth comparing to here.
Community A2 (Figure 2c) shows a greater variation of times of collection throughout the day compared to Community A. This is perhaps due to the more dispersed nature of the community and longer collection distances. The mean distance between DPs is 1.0 km, compared to 0.48 km in Community A. It also suggests that water is more available in the PWS as supply lasts longer into the evening and remains until the morning. The storage tank of the piped water distribution system in Community A2 is larger (70 m3) than in Community A with a population of a similar size that is more dispersed.
More consistent usage times across all months is shown in the average hourly usage data in Community B in The Gambia with 28 DPs (Figure 2d). Here, the start and end of collection with sunrise and sunset are relatively precise. Comparing this community (and Community A2) reveals that Community A exhibits relatively inconsistent patterns. Attempts to explain the differences here are inappropriate without socio-behavioural understanding of Community B in a very different context. However, the larger number of DPs, larger population, greater volumes dispensed, and close and nucleated distribution may have a levelling effect on the data (mean distance between DPs is only 93 m).
Seasonality of collection from DPs is evident across the different months. Reduced collection from piped supply due to free rain and surface water in rainy seasons is a common feature of rural water supply in sub-Saharan Africa [54,55,56]. This is observed here, however it does not drastically influence time of collection and further analysis is not included in this publication.
3.5. Volumes Collected by Users
Users in Community A were asked the volume they collect from DPs in the interviews, giving a mean volume of 133 L per household per day (std. dev. 72 L). 12 respondents’ answers are unquantifiable because of the imprecision of the user’s response, and one represented the school teacher’s collection combined with school collection and was therefore not representative. 133 L is equivalent to approximately 6.5 20-litre containers per day. Division of household collection volumes by household resident number gives an approximate mean of 25 L per person per day from DPs. Volume is not influenced by the household member responsible for collection, suggesting that children collect approximately the same volume of water per day (within one std. dev.) as adults, which has been shown to be particularly damaging to child health [57].
Larger household sizes decrease the volume of water per resident. Figure 3 shows this in Community A, with estimates calculated from the surveys. The mean values of the daily volume collected per person show a strong overall univariate relationship against household size (R2 = 0.78, p < 0.002). Multiple determinants that influence volumes collected, such as household volume requirements, distance (as above), different water sources, and other socio-economic factors, weaken this relationship. No influence of household size was observed in Mali [41], where this trend was fully obscured by other variables. However, the phenomenon is generally seen in the developed world because of shared water use activities in households (e.g., [58,59]), and also in some developing world urban settings (e.g., [60]). In Community A, the most likely explanation is that larger households have more children who do not use domestic water for the full range of uses. Further relationships between volume per capita and: (a) distance to DPs and (b) time taken for collection, were also investigated using uni- and multivariate regression models, and while no significant univariate relationships were found for these data, co-variants of household size and distance to DP increased the strength of the relationship (R2 = 0.85, p < 0.004, with no significant interaction).
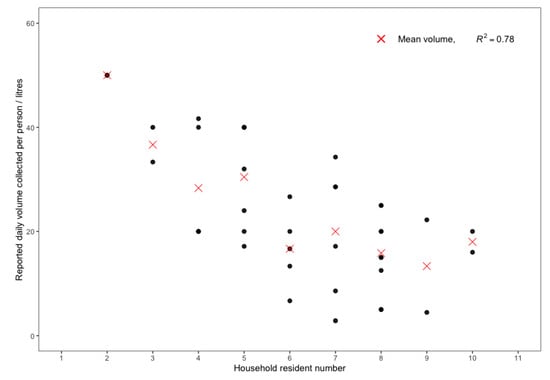
Figure 3.
Average volume collected per day per person from DP against number of residents per household (not including n = 12 unquantifiable volumes and one outlier of 80 lpd for the teacher’s collection).
Individual water collection events can be identified from the DP usage data using the time of use and tag ID number. A commonly observed pattern is users first collecting small amounts of water by briefly applying their tag before collecting lager volumes to fill up containers. This was observed in Community A for washing out of containers. Long gaps are evident between collections, adding evidence to users’ answers that there are no queues at DPs (as shown in the evaluation above). The majority of collections shown in Community A have maximums of 18–20 L. The most commonly used container is 20 L. Users tend not to collect more than three buckets (~60 L) at a time. This remote analysis supported by the fieldwork observation made in this study.
There is a mismatch between the mean volume users answered they collected daily from DPs per household (133 L), and the remotely collected data. If the number of households in Community A that use DPs is underestimated at 250 (non-user households not included), then dividing the mean daily total volume dispensed between November 2018–August 2019 (11,736 L; std. dev. = 3070 L) gives approximately 47 L per household. The discrepancy is more likely to originate from overestimation by users of the volumes they collect from DPs. Additionally, water from alternative sources like lined wells may have been included in users’ totals, despite specification of DPs in the protocols, because of daily variability of collection and water use behaviours [2]. Smart meters measure accurately and are not subject to subjective estimations. Low collection volumes are consistent with expectations from rural water points away from households across the developing world [6].
3.6. Relationship between Water Volume Dispensed and the Location of DP
It is understood that households in rural sub-Saharan Africa tend to collect less water when distances to water points are greater [40,61], and in some cases distances provide robust forecasts for volume (R2 > 0.93) [41]. It is theorised that when a water point is over 100 meters away the volume of water collected tends to significantly decrease, plateauing between 100 and 1000 meters, after which volume decreases again [62]. In Community A, distance of household to DP shows only a minor negative relationship with volume collected (as reported by households). Here, the influence of distance is weakened by multiple factors, e.g., some users transporting more water further by cart, bicycles and donkeys, and the relative proximity of DPs compared to communities without PWSs.
Smart meters allow location of DP and volume dispensed to be further examined using data from the individual DPs, along with household location. The variable volume dispensed from each DP over November 2018–August 2019 is visualised in a moving image (Figure 4). Monthly aggregations are used as they are not disrupted by brief non-functionality events. These dynamic maps give geospatial context to DP location [50,63,64].
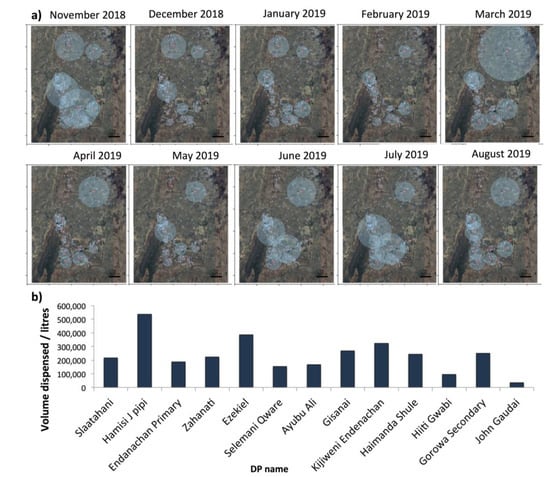
Figure 4.
(a) Frames of a moving image showing volume (radius of blue disc) dispensed from each DP in Community A (November 2018–August 2019), mapped for each location. Blue dots represent all households. Each frame represents one month. These can be watched for November 2018–August 2019 for Community A and Community B for the same time period at: https://streamable.com/2h1jt; streamable.com/z4jvl; (b) Total volume dispensed for each named DP over the same time period.
These visualisations present a clear way to show that use of individual DPs in Community A does not have uniformity or predictability across time or DP location. For example, monthly volumes dispensed from DP ‘Ezekiel’ vary by a factor of 11, and ‘Kijiweni Endanachan’ by 30. The range of coefficients of variance across each DPs is wide (0.28–1.1; mean = 0.60). Months that exhibit an overall high volume across all DPs are partially skewed by specific DPs. This variation of usage over time originates from unpredictable and dynamic collection behaviours and the impacts of seasonality. The complexity and lack of any discernible trend limits further analysis here beyond visualising the unpredictability of volume dispensed. However, Figure 4b does reveal some differences of volume dispensed between DPs:
- ‘Hamisi J pipi’ is shown to dispense the highest volume overall (but not every month)
- ‘Selemani Qware’, ‘Ayubu Ali’, ‘Hiiti Gwabi’, and ‘John Gaudai’ show low volumes dispensed every month
- Water volumes dispensed from the remaining eight DPs do not show very high or low volumes dispensed (staying within one std. dev).
The reasons for these observations are explored in relation to how many households are nearest to each DP. Higher numbers of households that use each water point in small towns in Ghana results in greater volumes being dispensed [17]. A Voronoi-type mapping shows the number of households that are nearest to each DP, which are then plotted against total volume dispensed from each DP over November 2018–August 2019 (Figure 5).
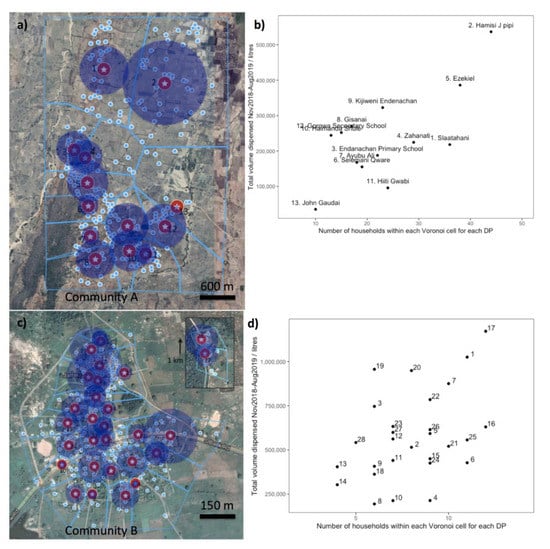
Figure 5.
(a) DPs (red) and location of all households in Community A (blue dots) with total volumes dispensed over November 2018–August 2019 as radius of disc (blue) showing Voronoi cells for each DP. (b) Number of households in Community A that are nearest to each DP against total volume dispensed over November 2018–August 2019. (c,d). Community B, as above.
The general positive relationships shown in Figure 5 confirm that DPs that have more households that are nearest to them tend to dispense more water, due to greater total usage. Furthermore, comparison against the location of DPs in the community and the density of households in Community A shows that the total number of households appears to be a more important factor than household density. For instance, households in Community A around ‘Hamisi J pipi’ households are more dispersed with users having further distances to travel (mean ≈ 630 m). DPs in central locations in the community do not dispense more water. This finding is supported by the 28 DPs in Community B (in The Gambia) over the same time period. These DPs also show significant variation and unpredictability of volume dispensed.
4. Discussion
4.1. Collection Patterns from Smart Meter DPs
Many rural households in sub-Saharan Africa collect water from more than one source, which can improve resilience of water supply. Different sources are commonly used for different purposes, and respondents report this is also the case in Community A. Specifically, alternative unimproved sources are reported to be used more for non-consumptive uses where quality and payment are less critical factors, indicating some preference for cleaner DP water for consumption. Alternative sources may influence DP use, however here this is considered less significant and the focus in this study on collection from PWS DPs is justified: 97% of users report DPs as their main source for domestic water and only a small minority of the community do not use DPs.
In general, installation of smart meters on DPs has brought net benefits to service provision, user experience, and accessibility, as described in Table 1. Significantly, users explain that the elimination of queuing has given them more time for other socio-economic activities (e.g., farming, schooling, rest), and women and children benefit from this the most. Managerial stakeholders explain that improved revenue collection and monitoring, along with reduced non-revenue water and economic efficiencies, enhance the sustainability of the PWS. While such technologies are not ‘silver bullets’, these benefits contribute towards a stronger rural water supply system.
The surveys have shown that approximately 58% of households are within 400 m of a DP, the nationally mandated distance for water service. Unsurprisingly, users who live further away generally report longer time for overall water collection trips. This is a relatively clear trend because it is not influenced by time spent queuing, as it is elsewhere without smart meters. On one hand, therefore, the elimination of queuing has made access to water from public DPs unavoidably unequal, with some households remaining marginalised because they are further from DPs. On the other hand, the reduced overall collection time from the DPs means users who live further away have improved access, making it more worthwhile for them to travel to the DPs rather than other unimproved water sources. The smart meters therefore do not amplify existing inequalities, nor uniformly benefit the community.
Households in Community A are shown to collect water from the DPs at different times of the day. Preferences are influenced by when children return from school, time free from farming and other activities, and temperature, as explained by users. Collection is seen to stop in the smart meter data, and managerial stakeholders confirm that this is when availability of water in the PWS runs out. This hydraulic limit constrains users’ collection schedules. Community A2 (and Community B) use their DPs later into the evening. This suggests that preferred collection behaviours depend on supply being greater than demand at all times. Managerial stakeholders highlighted that demand for water is outstripping supply, due in large part to population growth. This limitation of the PWS negates the anytime-access of DPs, which is one of the significant benefits of the smart meters.
The mean volume collected recorded from smart meters of ~47 L per household per day falls below recommended water requirements for human activities and consumption [65,66], especially considering larger households are shown to have less volume per-capita. Any additional water from alternative sources is more likely to be contaminated. Despite the improvement in service from the PWS with smart meters, it remains far from the ‘end-goal’ of improved household connections and acceptable level of supply of clean water.
The smart meters reveal high unpredictability of volumes dispensed from different DPs across time (days, months), and location, which is unexpected. It was hypothesized that more centrally located DPs would record greater volumes dispensed. While the slight positive relationship between household number closest to each DP and total volume dispensed explains some of the variation, the significance of other factors beyond distance, such as how much volume each household collects, is shown in the wide data spread for these relationships. Detailed explanations of this are not possible without distinct research questions. However, visualising the unpredictability of volumes dispensed is useful itself in showing that assumptions of more regular water collection patterns from installation of ‘formalised’ PWSs in rural communities are not necessary correct. This is in contrast with urban piped systems with household connections, where the large scale levels the regularity of patterns.
If evenness of water distribution across DPs (and therefore revenue collection) is a planning aim for PWSs, the positioning of DPs in PWS across sub-Saharan Africa could be better based on Voronoi-type mapping of nearest households rather than density of households or community centres. This may be more objective and less influenced by social pressures, and could also increase access of more marginalised households. This general relationship could also guide operation and maintenance of existing PWSs.
The variance in household collection from DPs across times of day, volume collected, and time taken for collection, seen in the data from smart meters and users, emphasise that understanding of collection patterns cannot be based on linear assumptions. This reflects the wider rural water supply system. Nonetheless, without an optimally functioning PWS with water available whenever required, i.e., with a tank size, pump, and borehole yield of sufficient capacity, users will have to adjust their water collection and use practices. This could involve relying more on unimproved alternative sources.
4.2. Benefits of Remote Data Collection and Combination with Interviews
Smart meters provide high resolution, accurate, and objective data on volumes and times of water dispensed from DPs, across long time periods relatively easily, cheaply, and at the required scale, without the need for inaccurate modelling or estimations. Aggregated or individual responses to interviews and surveys provide qualitative information and explanations not available from smart meter data. A more rounded understanding of water collection patterns from PWSs has been possible beyond a reductionist one based only on DP data. For example, simply viewing times of collection remotely provides accurate information on total volumes dispensed at different times. However, collecting additional responses on when users collect water from DPs has revealed a wide variance between households. It also explains why some users preferred to go at certain times, in particular when children return from school, or when they have free time from farming. This aligns to the increase in volume dispensed over the afternoon measured by smart meters. There is a reasonable match in times between the two sources of information for the timescale studied. Additionally, this combined approach allows discrepancies to be revealed between remotely measured and self-reported information. Measured total volume dispensed is estimated at 47 L per household per day (based on 250 user households), while the mean self-reported volume collected is 133 L per household per day. This is evidence that self-reported volumes are less accurate with different sources of water not distinguished. This demonstrates the value in objectively establishing reality.
Matching specific users with tags for detailed investigation of household patterns and payments is not accurate enough here due to lending of tags, registration inaccuracies, and the logistics of matching households to tags.
While this study is limited to a snapshot of one community in Tanzania using one monitoring technology, data from an increasing number of DPs are continually being collected across sub-Saharan Africa using similar technologies. After installation of smart meters, economic costs of the remote data collection are negligible compared to manual meter reading, which requires individual readings that are typically infrequent and subject to human error. This represents an opportunity to benefit from even ‘longer-term’ use of these data.
5. Relevance to Practice and Policy
Better information is needed on the effectiveness of rural water supply projects and how communities use them if they are to be sustainable and resilient to future challenges. The World Bank has called for more resources to go towards data collection for decision-making regarding water management in Tanzania [67]. Remotely collected data from PWSs using smart meters or similar Internet-of-Things technologies can contribute to this data collection. Combining remote collection of data with ‘on the ground’ knowledge generation is generally applicable across anywhere such technologies are deployed. The uses of such technologies for daily rural water supply management have been documented elsewhere (e.g., [16,20]), and include reducing non-functionality time from real-time alerts, better interactions with users via mobile-money payments and mobile communication, and increased accountability.
Community A holds general similarities with many other rural communities across sub-Saharan Africa, such as domestic water use, livelihoods, demographics, and other socio-economic characteristics. Findings of user water collection from PWSs here can help practitioners and service providers plan and manage new and existing PWSs elsewhere more sustainably.
PWSs are of increasing popularity across rural sub-Saharan Africa. They often provide better and more sustainable service, higher water quality, and are more economically favourable compared to handpumps, and they can also facilitate better revenue collection [11]. Of the schemes implemented in the first phase of the Water Sector Support Project in Tanzania, 80% were pumped PWSs, rather than handpumps (5%) or gravity schemes (15%), based on community preferences [68]. Understanding water collection patterns specifically from PWSs, within the context of alternative sources, is of increasing relevance, and can form part of the move away from handpump-scale community management models.
General unpredictability in demand across different DPs and different times is likely to be a common attribute across other rural communities’ PWSs. A rural water supply system that is resilient to shocks and changes must accommodate for wider variability in demand. This is pertinent considering the hydrological, economic, and social impacts of climate change. For example, potential interventions on a PWS could be focused on ensuring supply across a whole community rather than at specific DPs, which could reduce use of unimproved alternative sources.
Solar pumping is increasingly seen as the best option for PWSs [69]. Understanding the continual demand across mornings and afternoon–evenings in small rural communities can inform pump installation and solar panel requirements. In Community A, the mean daily total volume dispensed between November 2018–August 2019 was 11,736 L (std. dev. = 3070 L). The tank size is 50 m3 (50,000 L). Therefore, this remotely collected data shows that the limiting factor to supply is not the tank size. Solar pumping appears insufficient over the morning. Combined with a low productivity borehole, supply lags behind demand, and the tank runs empty over the evening.
6. Conclusions
Patterns of water collection from a PWS in a rural Tanzanian community are provided to a new level of detail, using a combination of remote data collection from smart meters with survey and interview methods. By combining novel remote data from DPs with the experiences of users themselves, collection patterns, and trends can be explained.
Smart meters provide net benefits to service provision (largely from better revenue collection), and user experience and access (largely from elimination of queues and liberation of time for other activities). 97% of users use DPs as their main source for domestic water. Distance from households to DPs is one constraining factor of access to water. Users collect water at different times of the day depending on when water is available at the DPs, and other factors explained in interviews such as when children return from school or there is free time from farming. Water supply running out over the day is another constraining factor. Volumes collected show wide variability between households. Remotely collected data shows mean volume collected per household per day is approximately 47 L, contrasting against mean volume of 133 L given by respondents. Different DPs distribute unpredictable and variable volumes over time. DPs at locations in community centres or higher household densities do not consistently distribute more water. Instead, a higher number of households that use each DP is a better indicator of greater volumes dispensed, and this can contribute better to DP location planning than, for example, location within a community. However, there are multiple unpredictable factors that influence volume dispensed. Fundamentally, while collection patterns result from socio-economic factors and behaviours, the functionality and good operation of the PWS—including supply of water that meets demand—is the most fundamental factor.
Supplementary Materials
The following are available online at https://www.mdpi.com/2073-4441/12/4/1164/s1, Figure S1. Distances from user households to DPs with reported times taken for collection (excluding non-quantifiable responses, outliers represented as dots). The following are available online at: https://streamable.com/2h1jt; streamable.com/z4jvl, Video: Volume dispensed from each DP in Community A and Community B (November 2018–August 2019), mapped for each location.
Author Contributions
Conceptualization, W.I.; Methodology, W.I.; Formal analysis, W.I.; Investigation, W.I.; Data curation, W.I.; Writing—original draft preparation, W.I.; Writing—review and editing, W.I. and F.A.M.; Supervision, F.A.M.; Project administration, W.I. and F.A.M.; Funding acquisition, W.I. and F.A.M. All authors have read and agreed to the published version of the manuscript.
Funding
This research was funded by Engineering and Physical Sciences Research Council Doctoral Training Partnership (award reference: 2160737).
Acknowledgments
The authors would like to thank the community residents. Thanks also to Rob Hygate, Alex Burton and Roger Goodwin from eWaterpay, and Douglas Coates, for their assistance. We would like to thank the three anonymous reviewers for their invaluable contributions. Relevant data collected from interviews and surveys is available at: https://doi.org/10.24378/exe.2283. Data collected with eWaterpay smart meters on the online dashboard is held by eWaterpay and for commercial reasons not publicly available, at the discretion of eWaterpay (www.ewaterpay.com).
Conflicts of Interest
The authors declare no conflict of interest. The funders had no role in the design of the study; in the collection, analyses, or interpretation of data; in the writing of the manuscript, or in the decision to publish the results.
References
- Thomas, E.A.; Needoba, J.; Kaberia, D.; Butterworth, J.; Adams, E.C.; Oduor, P.; Macharia, D.; Mitheu, F.; Mugo, R.; Nagel, C. Quantifying increased groundwater demand from prolonged drought in the East African Rift Valley. Sci. Total Environ. 2019, 666, 1265–1272. [Google Scholar] [CrossRef]
- Elliott, M.; Foster, T.; MacDonald, M.C.; Harris, A.R.; Schwab, K.J.; Hadwen, W.L. Addressing how multiple household water sources and uses build water resilience and support sustainable development. NPJ Clean Water 2019, 2, 1–5. [Google Scholar] [CrossRef]
- UN-Water. The United Nations World Water Development Report 2019: Leaving No One Behind. 2019. Available online: https://www.unwater.org/publications/world-water-development-report-2019/ (accessed on 21 January 2020).
- Ezbakhe, F.; Giné-Garriga, R.; Pérez-Foguet, A. Leaving no one behind: Evaluating access to water, sanitation and hygiene for vulnerable and marginalized groups. Sci. Total Environ. 2019, 683, 537–546. [Google Scholar] [CrossRef]
- Graham, J.P.; Hirai, M.; Kim, S.S. An analysis of water collection labor among women and children in 24 sub-Saharan African countries. PLoS ONE 2016, 11, e0155981. [Google Scholar] [CrossRef]
- Nauges, C.; Whittington, D. Estimation of water demand in developing countries: An overview. World Bank Res. Obs. 2010, 25, 263–294. [Google Scholar] [CrossRef]
- Mu, X.; Whittington, D.; Briscoe, J. Modeling village water demand behavior: A discrete choice approach. Water Resour. Res. 1990, 26, 521–529. [Google Scholar] [CrossRef]
- Hope, R.; Thomson, P.; Koehler, J.; Foster, T. Rethinking the economics of rural water in Africa. Oxf. Rev. Econ. Policy 2020, 36, 171–190. [Google Scholar] [CrossRef]
- Coulibaly, L.; Jakus, P.M.; Keith, J.E. Modeling water demand when households have multiple sources of water. Water Resour. Res. 2014, 50, 6002–6014. [Google Scholar] [CrossRef]
- Pearson, A.L.; Zwickle, A.; Namanya, J.; Rzotkiewicz, A.; Mwita, E. Seasonal shifts in primary water source type: A comparison of largely pastoral communities in Uganda and Tanzania. Int. J. Environ. Res. Public Health 2016, 13, 169. [Google Scholar] [CrossRef] [PubMed]
- Pezon, C. Providing water services at scale: How to move from unsustainable assistance to sustainable development? Water Policy 2015, 17, 1127–1142. [Google Scholar] [CrossRef]
- Thomas, E.A. Sensing WASH—In Situ and Remote Sensing Technologies, Chapter 5. In Innovations in WASH Impact Measures: Water and Sanitation Measurement Technologies and Practices to Inform the Sustainable Development Goals. Directions in Development; Evan, T., Andrés, L.A., Borja-Vega, C., Sturzenegger, G., Eds.; World Bank: Washington, DC, USA, 2018; p. 64. [Google Scholar] [CrossRef]
- Nagel, C.; Beach, J.; Iribagiza, C.; Thomas, E.A. Evaluating Cellular Instrumentation on Rural Handpumps to Improve Service Delivery: A Longitudinal Study in Rural Rwanda. Environ. Sci. Technol. 2015, 49, 14292–14300. [Google Scholar] [CrossRef] [PubMed]
- Oxford/RFL. From Rights to Results in Rural Water Services–Evidence from Kyuso, Kenya. In Smith School of Enterprise and the Environment, Water Programme, Working Paper 1; Oxford University: Oxford, UK, 2014. [Google Scholar]
- Deal, P.; Sabatini, D. Evaluating the Level of the Household Water Service Provided by a Private Water Enterprise in Ghana. Water 2020, 12, 693. [Google Scholar] [CrossRef]
- Ingram, W.; Memon, F.A. Internet of Things innovation in rural water supply in sub-Saharan Africa: A critical assessment of emerging ICT. Waterlines 2019, 38, 71–93. [Google Scholar] [CrossRef]
- Kulinkina, A.V.; Kosinski, K.C.; Liss, A.; Adjei, M.N.; Ayamgah, G.A.; Webb, P.; Gute, D.M.; Plummer, J.D.; Naumova, E.N. Piped water consumption in Ghana: A case study of temporal and spatial patterns of clean water demand relative to alternative water sources in rural small towns. Sci. Total Environ. 2016, 559, 291–301. [Google Scholar] [CrossRef]
- Whaley, L.; Cleaver, F. Can ‘functionality’ save the community management model of rural water supply? Water Resour. Rural Dev. 2017, 9, 56–66. [Google Scholar] [CrossRef]
- Turman-Bryant, N.; Clasen, T.F.; Fankhauser, K.; Thomas, E.A. Measuring progress towards sanitation and hygiene targets: A critical review of monitoring methodologies and technologies. Waterlines 2018, 37, 229–247. [Google Scholar] [CrossRef]
- Andres, L.; Boateng, K.; Borja-Vega, C.; Thomas, E. A review of in-situ and remote sensing technologies to monitor water and sanitation interventions. Water 2018, 10, 756. [Google Scholar] [CrossRef]
- Anthonj, C.; Fleming, L.; Cronk, R.; Godfrey, S.; Ambelu, A.; Bevan, J.; Sozzi, E.; Bartram, J. Improving monitoring and water point functionality in rural Ethiopia. Water 2018, 10, 1591. [Google Scholar] [CrossRef]
- Pantaleo, P.A.; Komakech, H.C.; Mtei, K.M.; Njau, K.N. Contamination of groundwater sources in emerging African towns: The case of Babati town, Tanzania. Water Pract. Technol. 2018, 13, 980–990. [Google Scholar] [CrossRef]
- JMP. Progress on Household Drinking Water, Sanitation and Hygiene 2000–2017; World Health Organisation and UNICEF: Geneva, Switzerland, 2019. [Google Scholar]
- Twisa, S.; Buchroithner, M.F. Seasonal and Annual Rainfall Variability and Their Impact on Rural Water Supply Services in the Wami River Basin, Tanzania. Water 2019, 11, 2055. [Google Scholar] [CrossRef]
- Casella, D.; van Tongeren, S.; Nikolic, I. Change in Complex Adaptive Systems: A Review of Concepts, Theory and Approaches for Tackling ‘Wicked’ Problems in Achieving Sustainable Rural Water Services (IRC Working Paper); IRC Water and Sanitation Centre: Geneva, Switzerland, 2015. [Google Scholar]
- Valcourt, N.; Walters, J.; Javernick-Will, A.; Linden, K.; Hailegiorgis, B. Understanding Rural Water Services as a Complex System: An Assessment of Key Factors as Potential Leverage Points for Improved Service Sustainability. Sustainability 2020, 12, 1243. [Google Scholar] [CrossRef]
- Huston, A.; Moriarty, P. Building Strong WASH Systems for the SDGs: Understanding the WASH System and Its Building Blocks; IRC Working Paper; IRC: The Hague, The Netherlands, 2018. [Google Scholar]
- Liddle, E.S.; Fenner, R. Water point failure in sub-Saharan Africa: The value of a systems thinking approach. Waterlines 2017, 36, 140–166. [Google Scholar] [CrossRef]
- Di Baldassarre, G.; Sivapalan, M.; Rusca, M.; Cudennec, C.; Garcia, M.; Kreibich, H.; Konar, M.; Mondino, E.; Mård, J.; Pande, S.; et al. Sociohydrology: Scientific challenges in addressing the sustainable development goals. Water Resour. Res. 2019, 55, 6327–6355. [Google Scholar] [CrossRef]
- Beal, C.D.; Jackson, M.; Stewart, R.A.; Rayment, C.; Miller, A. Identifying and understanding the drivers of high water consumption in remote Australian Aboriginal and Torres Strait Island communities. J. Clean. Prod. 2018, 172, 2425–2434. [Google Scholar] [CrossRef]
- Giné-Garriga, R.; de Palencia, A.J.F.; Pérez-Foguet, A. Water–sanitation–hygiene mapping: An improved approach for data collection at local level. Sci. Total Environ. 2013, 463, 700–711. [Google Scholar] [CrossRef]
- Sundararaman, P.; Gandhi, A.; Frey, D.; Ekolu, A.H.; Ikalany, B.; Hegde, M.; Leith, K.; Sweeney, D. Measuring usage and adoption of improved cookstoves in Ugandan households using quantitative and qualitative methods. Presented at the 2016 IEEE Global Humanitarian Technology Conference (GHTC), Seattle, WA, USA, 13–16 October 2016; pp. 136–142. [Google Scholar]
- O’Reilly, K.; Louis, E.; Thomas, E.; Sinha, A. Combining sensor monitoring and ethnography to evaluate household latrine usage in rural India. J. Water Sanit. Hyg. Dev. 2015, 5, 426–438. [Google Scholar] [CrossRef]
- Chambers, R. Participatory Rural Appraisal. In Working with Farmers for Better Land Husbandry; Hudson, N., Cheatle, R., Eds.; Intermediate Technology Publications and World Association of Soil and Water Conservation: London, UK, 1993; pp. 87–101. [Google Scholar]
- Chambers, R. The origins and practice of participatory rural appraisal. World Dev. 1994, 22, 953–969. [Google Scholar] [CrossRef]
- D-Lab. The Lean Research Framework: Principles for Human-Centered Field Research; Feinstein International Centre and The Fletcher School Tufts University: Medford, MA, USA, 2015. [Google Scholar]
- Young, S.L.; Collins, S.M.; Boateng, G.O.; Neilands, T.B.; Jamaluddine, Z.; Miller, J.D.; Brewis, A.A.; Frongillo, E.A.; Jepson, W.E.; Melgar-Quiñonez, H.; et al. Development and validation protocol for an instrument to measure household water insecurity across cultures and ecologies: The Household Water InSecurity Experiences (HWISE) Scale. BMJ Open 2019, 9, e023558. [Google Scholar] [CrossRef]
- Rieger, K.; Holm, R.H.; Sheridan, H. Access to groundwater and link to the impact on quality of life: A look at the past, present and future public health needs in Mzimba District, Malawi. Groundw. Sustain. Dev. 2016, 2, 117–129. [Google Scholar] [CrossRef][Green Version]
- Pérez-Foguet, A.; Giné-Garriga, R. Sampling in surveys with reduced populations: A simplified method for the water, sanitation, and hygiene sector. Waterlines 2018, 37, 177–189. [Google Scholar] [CrossRef]
- Cook, J.; Kimuyu, P.; Whittington, D. The costs of coping with poor water supply in rural Kenya. Water Resour. Res. 2016, 52, 841–859. [Google Scholar] [CrossRef]
- Martínez-Santos, P. Determinants for water consumption from improved sources in rural villages of southern Mali. Appl. Geogr. 2017, 85, 113–125. [Google Scholar] [CrossRef]
- Olschewski, A.; Casey, V. The Technology Applicability Framework. A Participatory Tool to Validate Water, Sanitation, and Hygiene Technologies for Low-Income Urban Areas. In Technologies for Development; Hostettler, S., Hazboun, E., Bolay, J.C., Eds.; Springer: Cham, Switzerland, 2015. [Google Scholar]
- CITE. A Practitioners Guide for Technology Evaluation in Global Development; Comprehensive Initiative on Technology Evaluation and Technology Exchange Lab, Massachusetts Institute of Technology: Cambridge, MA, USA, 2017. [Google Scholar]
- Chowns, E. Is community management an efficient and effective model of public service delivery? Lessons from the rural water supply sector in Malawi. Public Adm. Dev. 2015, 35, 263–276. [Google Scholar] [CrossRef]
- Mandara, C.G.; Butijn, C.; Niehof, A. Community management and sustainability of rural water facilities in Tanzania. Water Policy 2013, 15, 79–100. [Google Scholar] [CrossRef]
- Whaley, L.; MacAllister, D.J.; Bonsor, H.; Mwathunga, E.; Banda, S.; Katusiime, F.; Tadesse, Y.; Cleaver, F.; MacDonald, A. Evidence, ideology, and the policy of community management in Africa. Environ. Res. Lett. 2019, 14, 085013. [Google Scholar] [CrossRef]
- Hernandez, K.; Roberts, T. Leaving No One Behind in a Digital World. In K4D Emerging Issues Report; Institute of Development Studies: Brighton, UK, 2018. [Google Scholar]
- Kayaga, S.; Fisher, J.; Franceys, R. Improved access to urban water services in Uganda. Proc. ICE Munic. Eng. 2009, 162, 165–170. [Google Scholar] [CrossRef]
- Mandara, C.G.; van Lemmeren, R.; Niehof, A. Assessing water service coverage by placeholders: A social media simulation. Presented at the 7th RWSN Forum “Water for Everyone”, Abidjan, Côte d’Ivoire, 29 November–2 December 2016. [Google Scholar]
- Mwamaso, A.A. Measuring and Mapping citizens’ access to rural water supply in Tanzania. Master’s Thesis, University of Twente, Enschede, The Netherlands, 2015. [Google Scholar]
- Boone, C.; Glick, P.; Sahn, D.E. Household water supply choice and time allocated to water collection: Evidence from Madagascar. J. Dev. Stud. 2011, 47, 1826–1850. [Google Scholar] [CrossRef]
- World Bank. Solar Pumping: The Basics; World Bank: Washington, DC, USA, 2018. [Google Scholar]
- Nauges, C.; Van Den Berg, C. Demand for piped and non-piped water supply services: Evidence from Southwest Sri Lanka. Environ. Resour. Econ. 2009, 42, 535–549. [Google Scholar] [CrossRef]
- Behnke, N.L.; Klug, T.; Cronk, R.; Shields, K.F.; Lee, K.; Kelly, E.R.; Allgood, G.; Bartram, J. Resource mobilization for community-managed rural water systems: Evidence from Ghana, Kenya, and Zambia. J. Clean. Prod. 2017, 156, 437–444. [Google Scholar] [CrossRef]
- Kelly, E.; Shields, K.F.; Cronk, R.; Lee, K.; Behnke, N.; Klug, T.; Bartram, J. Seasonality, water use and community management of water systems in rural settings: Qualitative evidence from Ghana, Kenya and Zambia. Sci. Total Environ. 2018, 628, 715–721. [Google Scholar] [CrossRef]
- Thomson, P.; Bradley, D.; Katilu, A.; Katuva, J.; Lanzoni, M.; Koehler, J.; Hope, R. Rainfall and groundwater use in rural Kenya. Sci. Total Environ. 2019, 649, 722–730. [Google Scholar] [CrossRef] [PubMed]
- Geere, J.-A.; Bartram, J.; Bates, L.; Danquah, L.; Evans, B.; Fisher, M.B.; Groce, N.; Majuru, B.; Mokoena, M.M.; Mukhola, M.S.; et al. Carrying water may be a major contributor to disability from musculoskeletal disorders in low income countries: A cross-sectional survey in South Africa, Ghana and Vietnam. J. Glob. Health 2018, 8, 010406. [Google Scholar] [CrossRef] [PubMed]
- Schleich, J.; Hillenbrand, T. Determinants of residential water demand in Germany. Ecol. Econ. 2009, 68, 1756–1769. [Google Scholar] [CrossRef]
- Arbues, F.; Villanúa, I.; Barberán, R. Household size and residential water demand: An empirical approach. Aust. J. Agric. Resour. Econ. 2010, 54, 61–80. [Google Scholar] [CrossRef]
- Cheesman, J.; Bennett, J.; Son, T.V.H. Estimating household water demand using revealed and contingent behaviors: Evidence from Vietnam. Water Resour. Res. 2008, 44. [Google Scholar] [CrossRef]
- MacDonald, A.M.; Bell, R.A.; Kebede, S.; Azagegn, T.; Yehualaeshet, T.; Pichon, F.; Young, M.; McKenzie, A.A.; Lapworth, D.J.; Black, E.; et al. Groundwater and resilience to drought in the Ethiopian Highlands. Environ. Res. Lett. 2019, 14, 095003. [Google Scholar] [CrossRef]
- WELL. Guidance manual on water supply and sanitation programmes, WEDC, 1998. Loughborough, UK. In Domestic Water Quantity, Service Level and Health (No. WHO/SDE/WSH/03.02); World Health Organization: Geneva, Switzerland, 2003. [Google Scholar]
- Mannschatz, T.; Buchroithner, M.F.; Hülsmann, S. Visualization of Water Services in Africa: Data Applications for Nexus Governance. In Governing the Nexus; Kurian, M., Ardakanian, R., Eds.; Springer: Cham, Switzerland, 2015. [Google Scholar]
- Kwakkel, J.H.; Carley, S.; Chase, J.; Cunningham, S.W. Visualizing geo-spatial data in science, technology and innovation. Technol. For. Soc. Chang. 2014, 81, 67–81. [Google Scholar] [CrossRef]
- Howard, G.; Bartram, J. Domestic Water Quantity, Service, Level and Health; Technical Report; World Health Organization: Geneva, Switzerland, 2003. [Google Scholar]
- Gleick, P.H. Basic water requirements for human activities: Meeting basic needs. Water Int. 1996, 21, 83–92. [Google Scholar] [CrossRef]
- World Bank. Tanzania Economic Update, Managing Water Wisely. In The Urgent Need to Improve Water Resources Management in Tanzania; World Bank Group: Washington, DC, USA, 2017. [Google Scholar]
- World Bank. Implementation Completion and Results Report (IDA-42590, IDA-54960); Report No. ICR00003737; World Bank: Washington, DC, USA, 2016. [Google Scholar]
- World Bank. Reaching for the SDGs: The Untapped Potential of Tanzania’s Water Supply, Sanitation, and Hygiene Sector. In WASH Poverty Diagnostic; World Bank: Washington, DC, USA, 2018. [Google Scholar]
© 2020 by the authors. Licensee MDPI, Basel, Switzerland. This article is an open access article distributed under the terms and conditions of the Creative Commons Attribution (CC BY) license (http://creativecommons.org/licenses/by/4.0/).